Article

The Influence of Helium Addition on the Combustion Process in a Hydrogen-Fueled Turbulent Jet Ignition Engine

by
Dawid Mielcarzewicz
and
Ireneusz Pielecha
*
Faculty of Civil and Transport Engineering, Poznan University of Technology, 60-965 Poznan, Poland
*
Author to whom correspondence should be addressed.
Appl. Sci. 2024, 14(19), 8996; https://doi.org/10.3390/app14198996 (registering DOI)
Submission received: 28 August 2024 / Revised: 29 September 2024 / Accepted: 3 October 2024 / Published: 6 October 2024
(This article belongs to the Special Issue Sustainable Alternative Fuels and Advanced Combustion Techniques)

Abstract

:
There are considerably fewer requirements for the quality of hydrogen combusted in an engine than its quality for fuel cells. Therefore, the analysis was carried out on the combustion of hydrogen–helium mixtures in an engine with a two-stage combustion system (TJI—Turbulent Jet Ignition). A single-cylinder research engine with a passive and active prechamber was used. A hydrogen–helium mixture was supplied to the main chamber in proportions of 100:0, 90:10, 80:20, 30:70, and 60:40 volume fractions. The prechamber was fueled only with pure hydrogen. Combustion was carried out in the lean charge range (λ = 1.5–3) and at a constant value of the Center of Combustion (CoC = 8–10 deg aTDC). It was found that the helium concentration in the mixture affected the changes in combustion pressure, heat release rate and the amount of heat release. It was observed that increasing the proportion of helium in the mixture by 10% also reduces the IMEP by approximately 10% and reduces the rate of heat release by approximately 20%. In addition, helium influences knock combustion. Limits of MAPO = 1 bar mean assumed that knock combustion occurs in the main chamber at values of λ < 1.9. Increasing the excess air ratio results in a gradual reduction in the temperature of the exhaust gas, which has a very rapid effect on changes in the concentration of nitrogen oxides. Studies carried out on the helium addition in hydrogen fuel indicate that it is possible to use such blends with a partial deterioration of the thermodynamic properties of the two-stage combustion process.

1. Introduction

The modern trend in the development of internal combustion engines is to find and use low-emission alternative fuels. These changes are due to the growing climate crisis, which is linked to an increase in the planet’s average temperature. According to statistics, the average temperature on Earth is 14 °C, estimated to have risen by 0.9–1.5 °C since before the industrial revolution [1,2]. The most visible effects of climate change are the increased risk of extreme weather events, such as category 4–5 hurricanes, the incidence of which has increased by 25–30% per 1 °C of global warming [3]. Rising temperatures on earth are caused by large greenhouse gas emissions, which exacerbate the greenhouse effect. These gases include carbon dioxide, which is a non-toxic but harmful product of the combustion of conventional fuels in internal combustion engines. On the basis of statistics [4], transport is responsible for 17% of carbon dioxide emissions into the atmosphere. Given these facts, a desirable solution to the climate problem could be hydrogen as a fuel for internal combustion engines. Hydrogen is a fuel for which combustion produces no carbon monoxide or carbon dioxide emissions. The only toxic compound produced by this fuel is nitrogen oxides. Air consists of 78% nitrogen, and under conditions of high pressure and temperature in the combustion chamber, nitrogen reacts with oxygen to form nitrogen oxides. The solution to this problem may be the use of dual fuel: hydrogen and helium. Helium is a non-flammable gas under the conditions found in the engine chamber during operation. It impedes the spread of the flame front, thus reducing the formation of nitrogen oxides.

2. Combustion of Hydrogen in an Internal Combustion Engine

2.1. Combustion of Pure Hydrogen in an Internal Combustion Engine

Hydrogen is the most common element on earth. The small and light hydrogen molecule is very mobile (high mass diffusivity) and leads to a very low atmospheric density. Hydrogen as an engine fuel has a wide flammability range falling within the excess air ratio of 0.14 to 10 [5]. The advantage of the hydrogen–air mixture is the low minimum energy required to ignite it under atmospheric conditions, as low as 0.017 mJ at λ = 1.2–1.5 [5]. This value is an order of magnitude less than the energy required to ignite a mixture of air and iso-octane or methane. An important property of hydrogen in a stoichiometric fuel–air mixture is that it has a large volume fraction of 29.5%. This value is greater than the volume fraction of methane in the mixture with air, which is only 9.5%. An important aspect of determining the safe use of all fuels is their auto-ignition temperature. Hydrogen has an auto-ignition limit located in the temperature range from about 773 K (500 °C) to about 858 K (585 °C) [6]. The mass density of hydrogen is much lower than that of gasoline and methane; at a pressure of 1 atm and at a temperature of 0 °C, it is 0.09 kg/Nm3. This relation means that hydrogen accumulates 2.6 times more energy per unit mass than petrol. It is important to note that the flame propagation velocity during the combustion of a hydrogen–air mixture is an order of magnitude greater than the flame propagation velocity occurring due to the combustion of petrol–air [7].
The properties of hydrogen make it beneficial for use in modern internal combustion engines with two-stage turbulent combustion of the fuel–air mixture. A comparison of the single and split injection of pure hydrogen into a TJI engine with a passive prechamber was undertaken by Yanfei et al. [8]. During the study, it was observed that, as the start of hydrogen injection was delayed, both the average useful pressure and the thermal efficiency of the engine gradually increased. The maximum values for BMEP and brake thermal efficiency were 3.2 bar and 33.4%. According to CFD simulations carried out by Aljabri et al. [9], high thermal efficiency of the engine can be achieved while burning an ultra-lean hydrogen–air mixture. This is due to the high rate of flame propagation that occurs during hydrogen combustion.
Optimum thermodynamic parameters are possible to achieve during the combustion of lean hydrogen–air mixtures, but the formation of nitrogen oxides is an obstacle to the use of this fuel. The solution to this problem was undertaken by Özyalcin et al. [10] by investigating the effect of using two selective catalytic reactors to reduce NOx emissions in a hydrogen-fueled engine. Two catalyst reactors were used in the study, copper-zeolite and VWT (V2O5—WO3—TiO3). The results show that the use of a VWT-based catalyst reactor in the first position and a Cu-based catalyst reactor in the second position effectively reduces N2O emissions, at a similar NOx conversion rate. An alternative solution to this problem may be to use hydrogen with helium as a dual-component fuel.

2.2. Combustion of Hydrogen with Additives in an Internal Combustion Engine

Noble gases are inert gases that can be composed of up to six different elements: helium (He), neon (Ne), argon (Ar), xenon (Xe), krypton (Kr), and radon (Ra). Noble gases as non-reactive are suitable for solving the problem of nitrogen oxide emissions of a hydrogen-fueled engine. Noble gases can be used to replace 79% of the nitrogen in the air [11]. According to Taib et al. [12] fueling the engine with hydrogen in an atmosphere of noble gas and oxygen has a positive effect on the thermal efficiency. The combustion of fuel in an atmosphere of lighter noble gases has a positive effect on fuel dispersion and penetration, resulting in adequate heat distribution in the engine. Helium is the lightest noble element, so burning hydrogen in a helium–oxygen atmosphere results in the best heat distribution compared to other noble gases [13]. According to a study conducted by Taib et al. [13], the combustion of hydrogen in a helium–oxygen atmosphere generates a higher pressure, heat release rate, and temperature than the combustion of hydrogen in an argon–oxygen atmosphere. Helium as a noble gas can be used to dilute hydrogen and diesel dual fuel. In this case, it was found that helium can control knock combustion [14]. The use of a gaseous dual fuel of hydrogen and helium in the TJI engine is expected to reduce NOx emissions and the occurrence of knock combustion. It is important to analyze the thermodynamic parameters occurring during the use of hydrogen–helium fuel with air in an engine with a two-stage combustion system.

2.3. Purpose of the Work

The aim of this study is to analyze the effect of helium addition in a hydrogen fuel on the operation indicators of an engine with a TJI ignition system. In addition, the range of occurrence and intensity of the knock combustion was defined. Fuels with increasing volume proportions of helium in the chemical composition were tested. The following parameters were evaluated in the prechamber and main chamber: cylinder pressure, indicated mean effective pressure (IMEP) and its variation, rate and amount of heat release. The effect of the exhaust gas temperature on the concentration of nitrogen oxides in the exhaust gas was also analyzed. An additional objective of the study was to assess the intensity and range of occurrence of knock during the combustion of hydrogen–helium fuels.

3. Materials and Methods
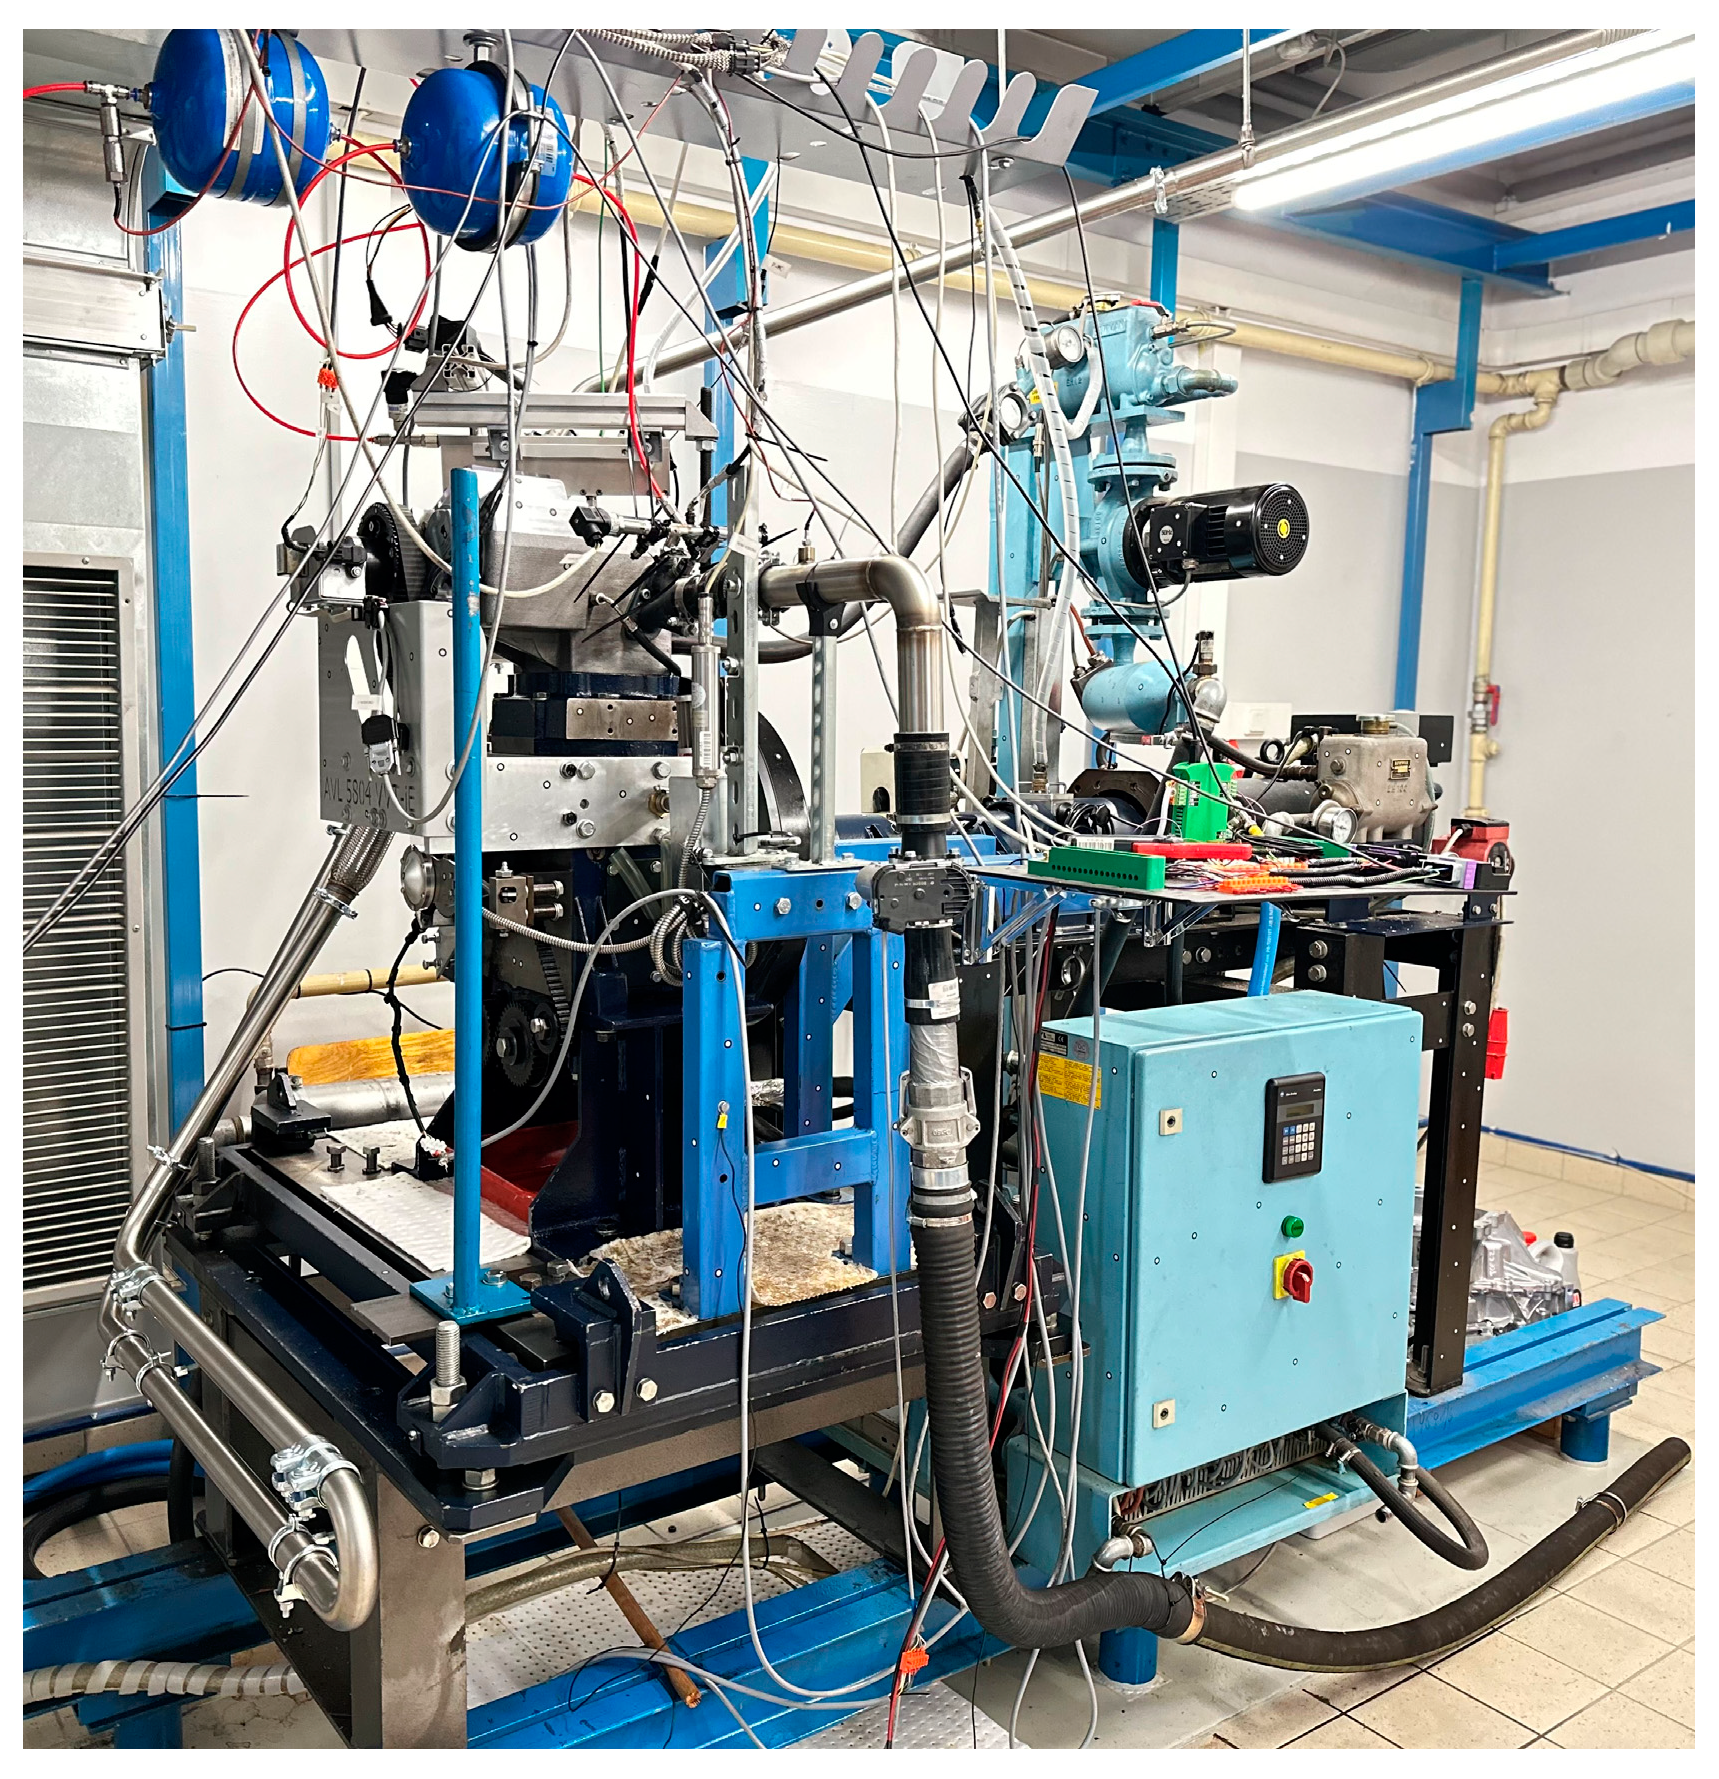
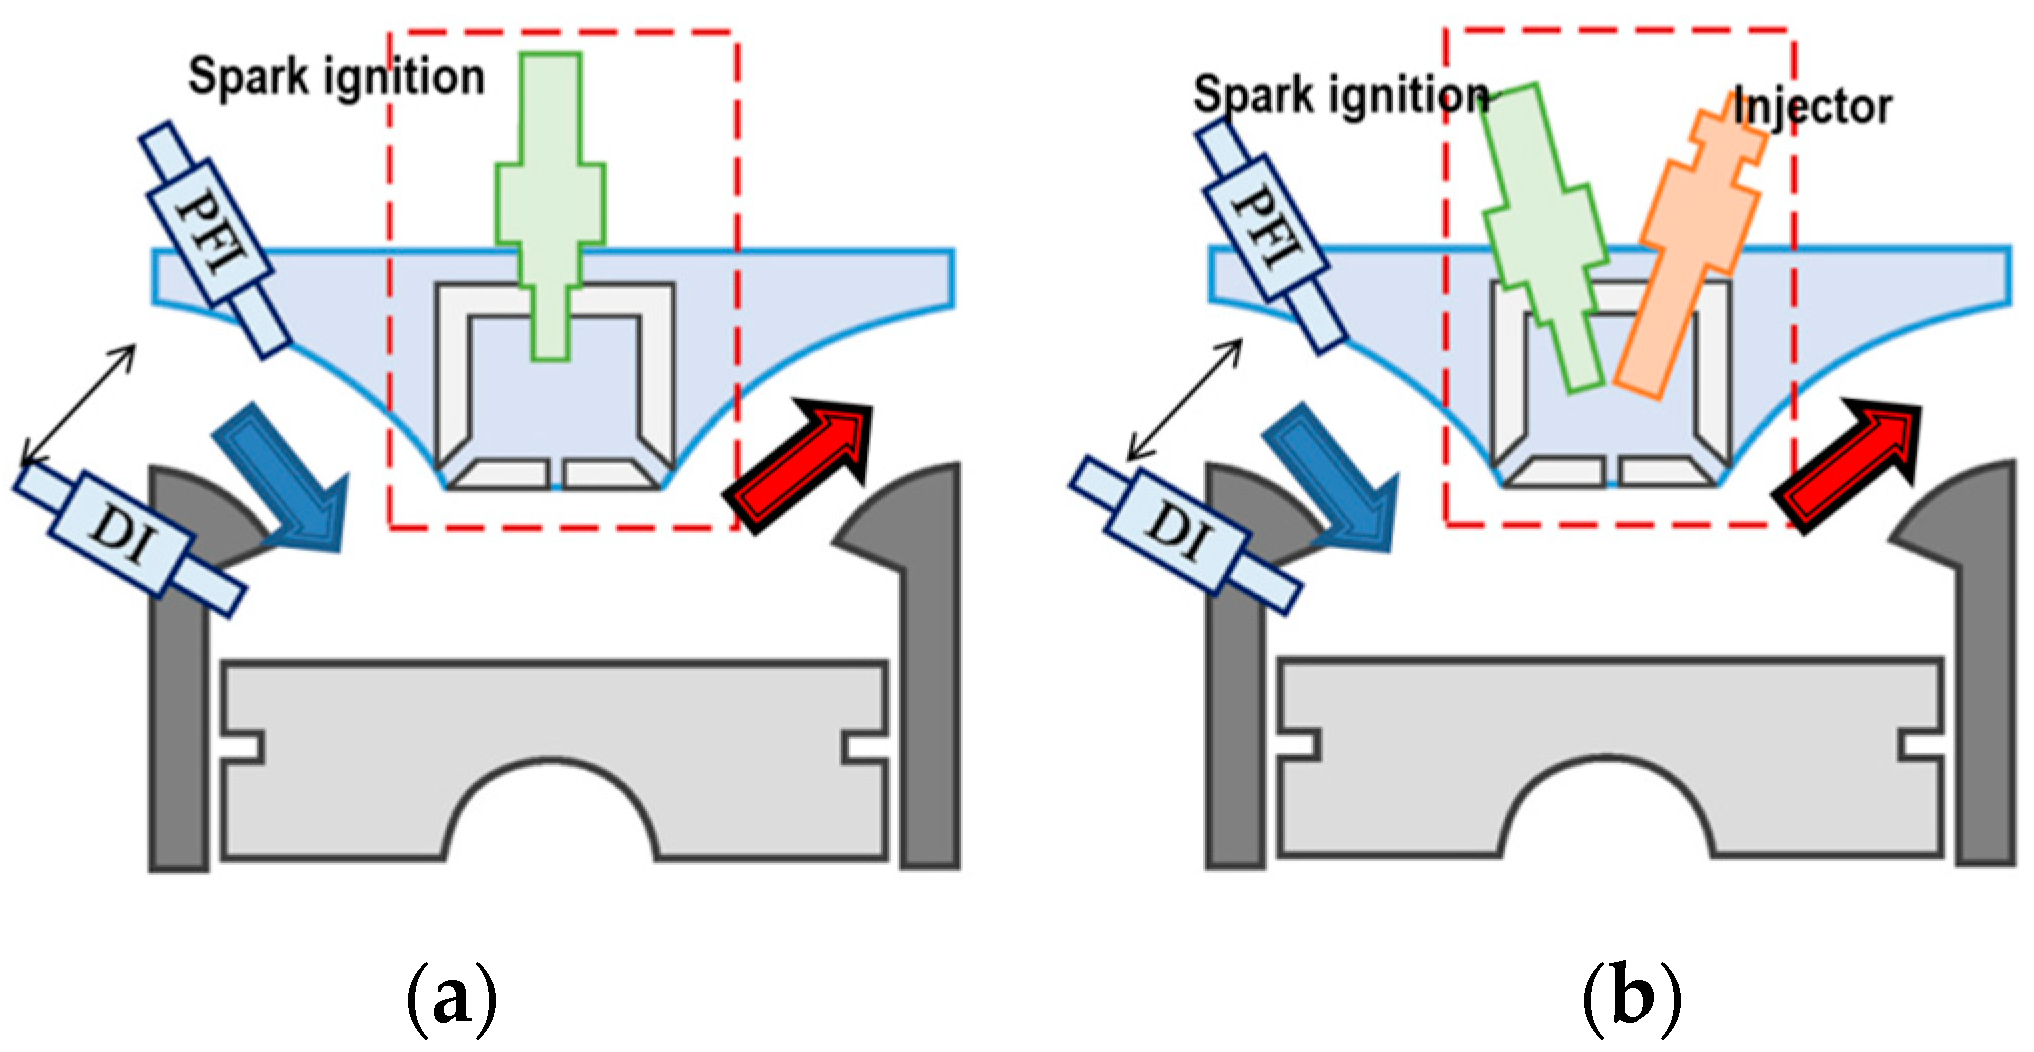
3.1. Test Bench

The combustion analysis was carried out on a dynamometer equipped with a single-cylinder AVL 5804 engine (Figure 1). The engine uses a two-stage combustion system—TJI. During the tests, an active and a passive prechamber were used (i.e., without fuel or with a fuel supply to the chamber—Figure 2). The prechamber had a volume of 2.29 cm3, a cylindrical shape, and 6 holes with a diameter of 1.5 mm. The engine (4-valve) had a displacement of 510 cm3, a piston diameter of 85 mm, and a stroke of 90 mm. The geometric compression ratio of the engine is 15.5. The main chamber was fueled with hydrogen with additions of helium through a low-pressure PFI fuel injector located in the intake manifold. The prechamber was supplied only with hydrogen. The load on the engine is provided by the electric asynchronous brake AMKASYN.

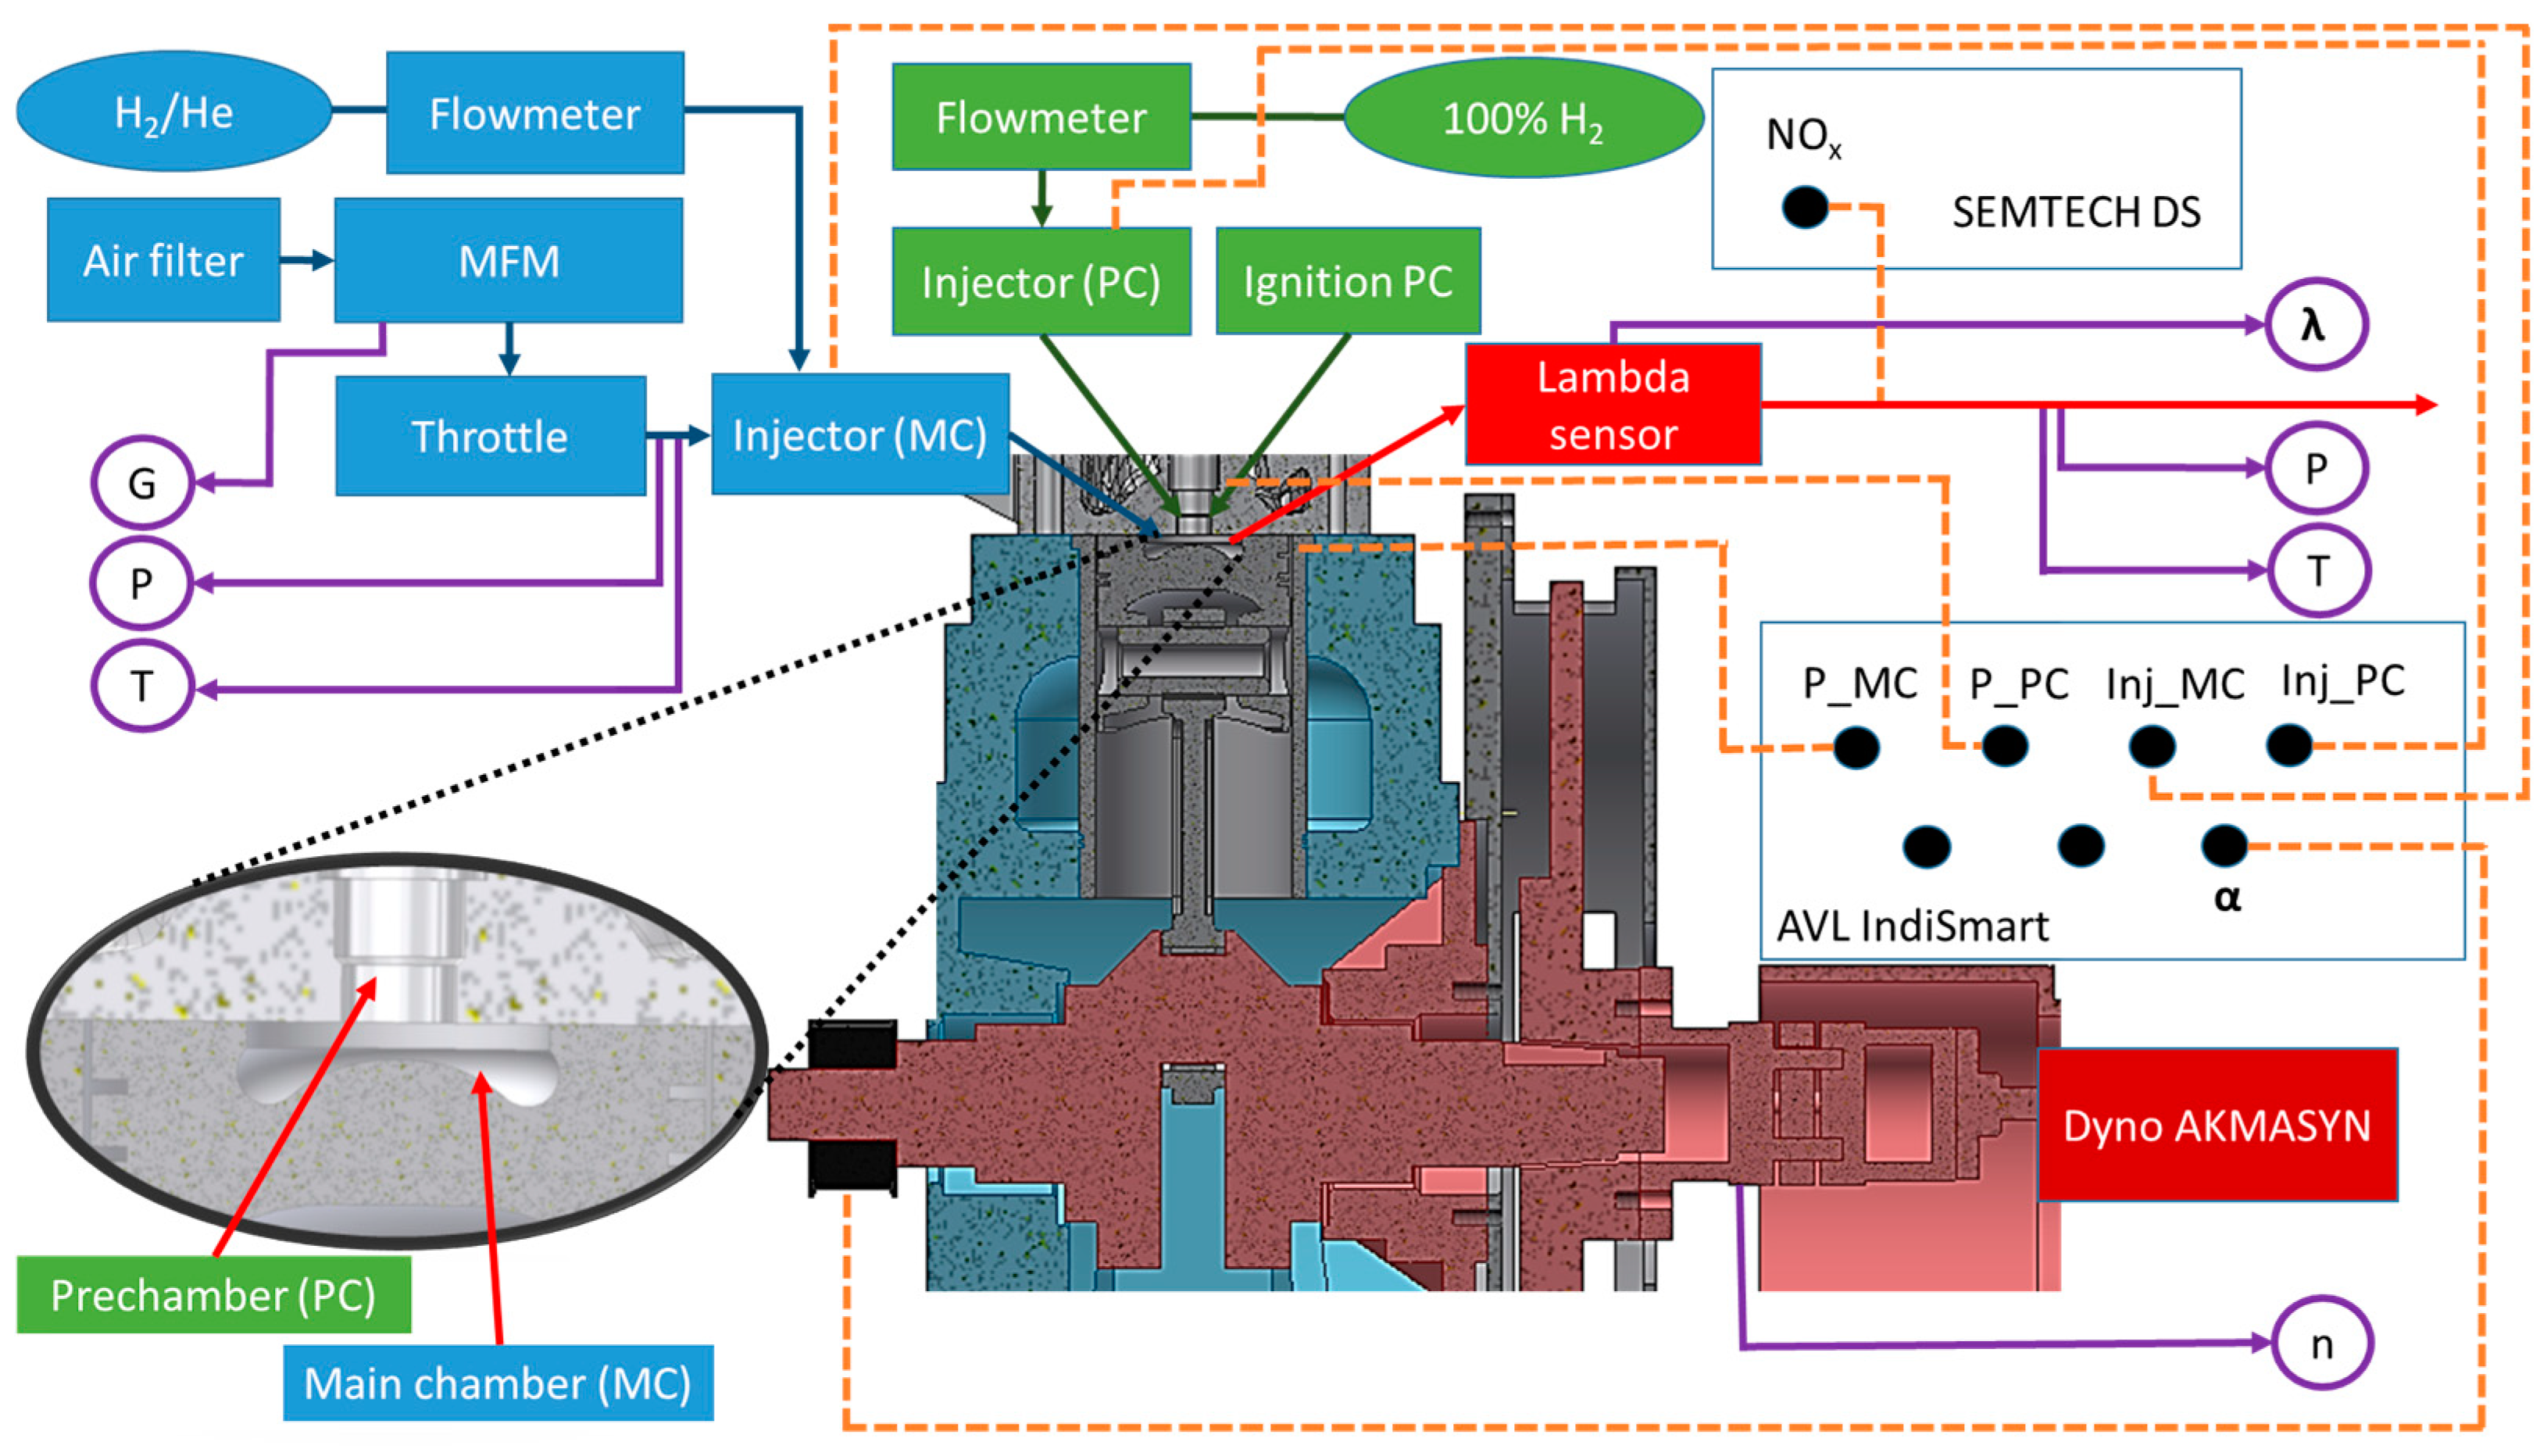
3.2. Measurement Equipment

A summarized overview of the measurement equipment is given in Table 1 and Figure 3. The mass flow rate of the fuel was measured using a Micro Motion ELITE CMFS010M flowmeter, which operates on the Coriolis principle. This type of flowmeter allows the flow rate of various gases to be measured, without the need for calibration each time, unlike thermal flow meters. The airflow rate through the intake manifold was measured with a Sensycon Sensyflow thermal flowmeter. The throttle angle and ignition were controlled by an external EMU Black controller from EcuMaster (Modlnica, Poland). An LSU 4.9 broadband oxygen sensor and LCP80 controller were used to measure the excess air ratio at the engine exhaust. Fast-variable engine parameters, such as the main and prechamber pressure, crankshaft angle, prechamber, and main-chamber injection times, were registered using the 8-channel AVL IndiSmart system. In addition, the NOx content of the exhaust gas was recorded using a Semtech DS analiser (Sensors, USA). The main objective of the present study was to investigate the combustion process of helium–hydrogen fuel, so the analysis of the collected data was carried out over an angular range of −10 to 30 degrees of the crankshaft.

3.3. Research Methods

During the study, the engine was supplied with gaseous hydrogen with helium addition. Fuel was injected into the prechamber and main chamber at a pressure of 7 bar. Pure hydrogen was always injected into the prechamber. Into the main chamber, the hydrogen-helium fuel was injected. Four measurement series were carried out during the study (Table 2). In each measurement series, fuel with different percentages of hydrogen content was injected into the main chamber. In the first measurement series, pure hydrogen was injected into the main chamber. On the second measurement series, the fuel contained 90% hydrogen and 10% helium. In the following series, the proportion of helium was increased while the proportion of hydrogen was reduced. Appropriate He/H2 compositions were ordered from a specialist supplier of industrial gases. Helium, as a noble gas, dilutes the hydrogen fuel, the properties of which are altered (Table 3).
The injection time into the prechamber was adjusted so that the center of combustion was at 10 CA after TDC, then, by increasing the fuel dose, it occurred earlier after TDC. During each measurement series, the opening angle of the throttle was increased five times to raise the excess air ratio. Throttle opening angles were 8%, 14%, 19%, 27%, and 36%, respectively. During each throttle opening step, the injection time into the prechamber was increased by 2 ms, starting at 0 ms and ending at 8 ms. The injection time into the main chamber was constant at 9.5 ms. The experiments were carried out at an engine speed of 1500 rpm. The oil and coolant temperature was 90 °C (Table 4). The way the study was carried out ensured that the measured parameters varied depending on the excess air ratio.

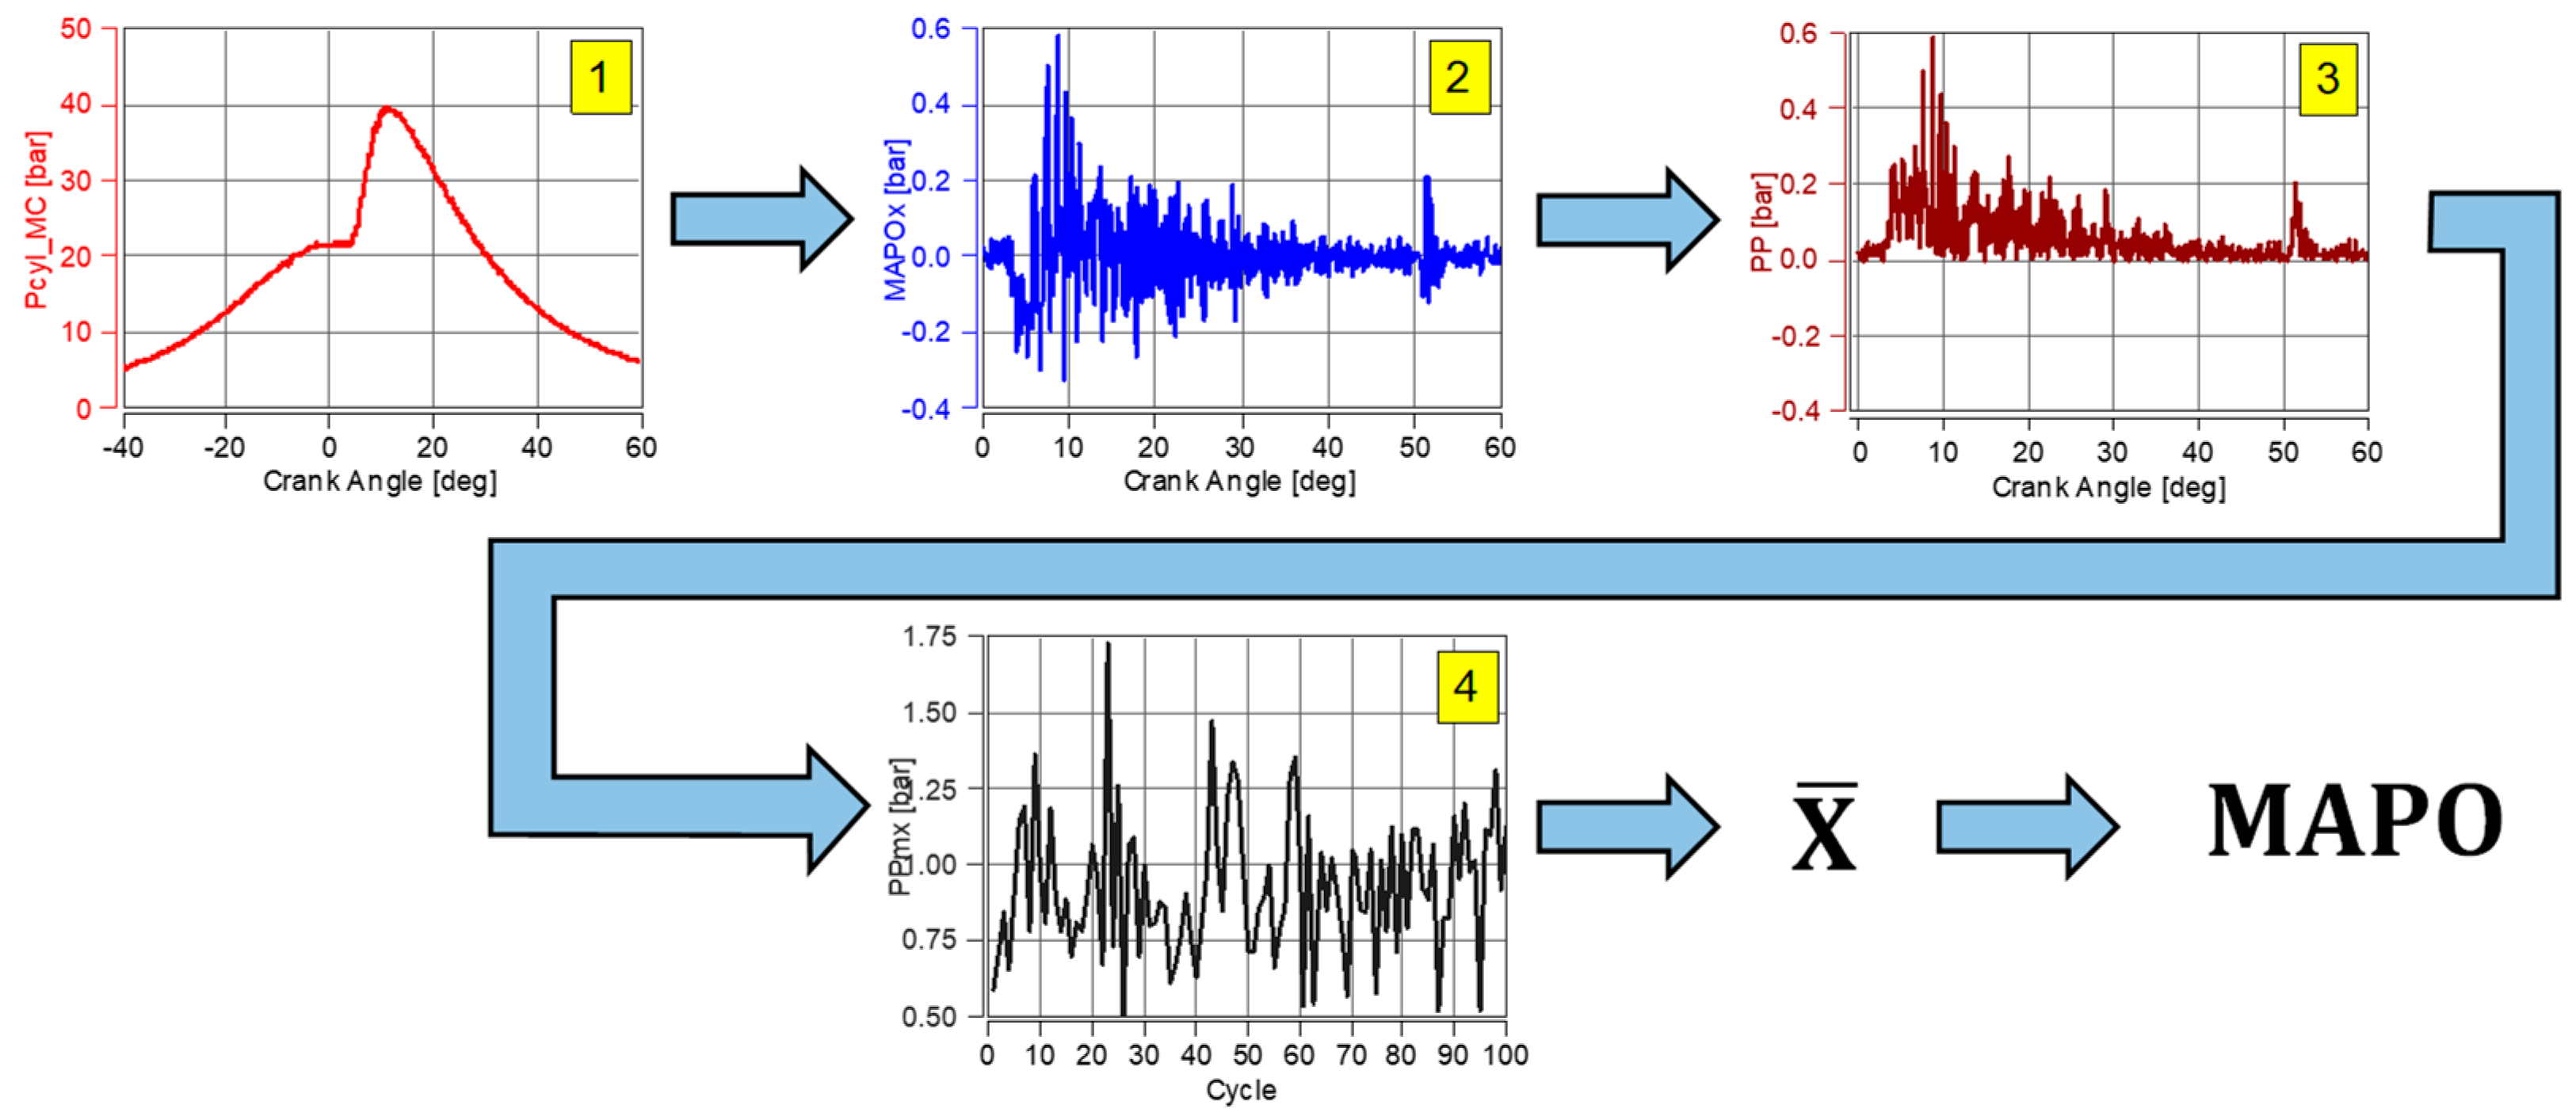
3.4. Data Processing

The MAPO (Maximum Amplitude Pressure Oscillation) value were determined in order to characterize knock combustion. It is a quantity widely used to determine the intensity of knock combustion [16,17,18]. An analysis of the results was carried out using AVL Concerto 5 software.
The first step of determining the MAPO was to record the pressure waveform for 100 work cycles of the engine (Figure 4). The second step of the MAPO calculation was to filter the recorded pressure waveform using a high-pass digital filter with a frequency range of f = 4–20 kHz, in the angular range of 0–70° with a pressure signal resolution of 0.1. The chosen frequency range is the most common for knock combustion. The third step of the MAPO calculation was to determine the absolute value of the filtered pressure waveform in the main chamber (brown function in Figure 4); this is necessary to find the maximum pressure during the combustion process. The fourth step of calculating MAPO was to determine the maximum pressure in each of the 100 recorded engine cycles. The fifth and final step of determining the MAPO was to calculate the average maximum pressure for 100 recorded engine cycles.

4. Evaluation of Hydrogen Combustion with the Addition of Helium

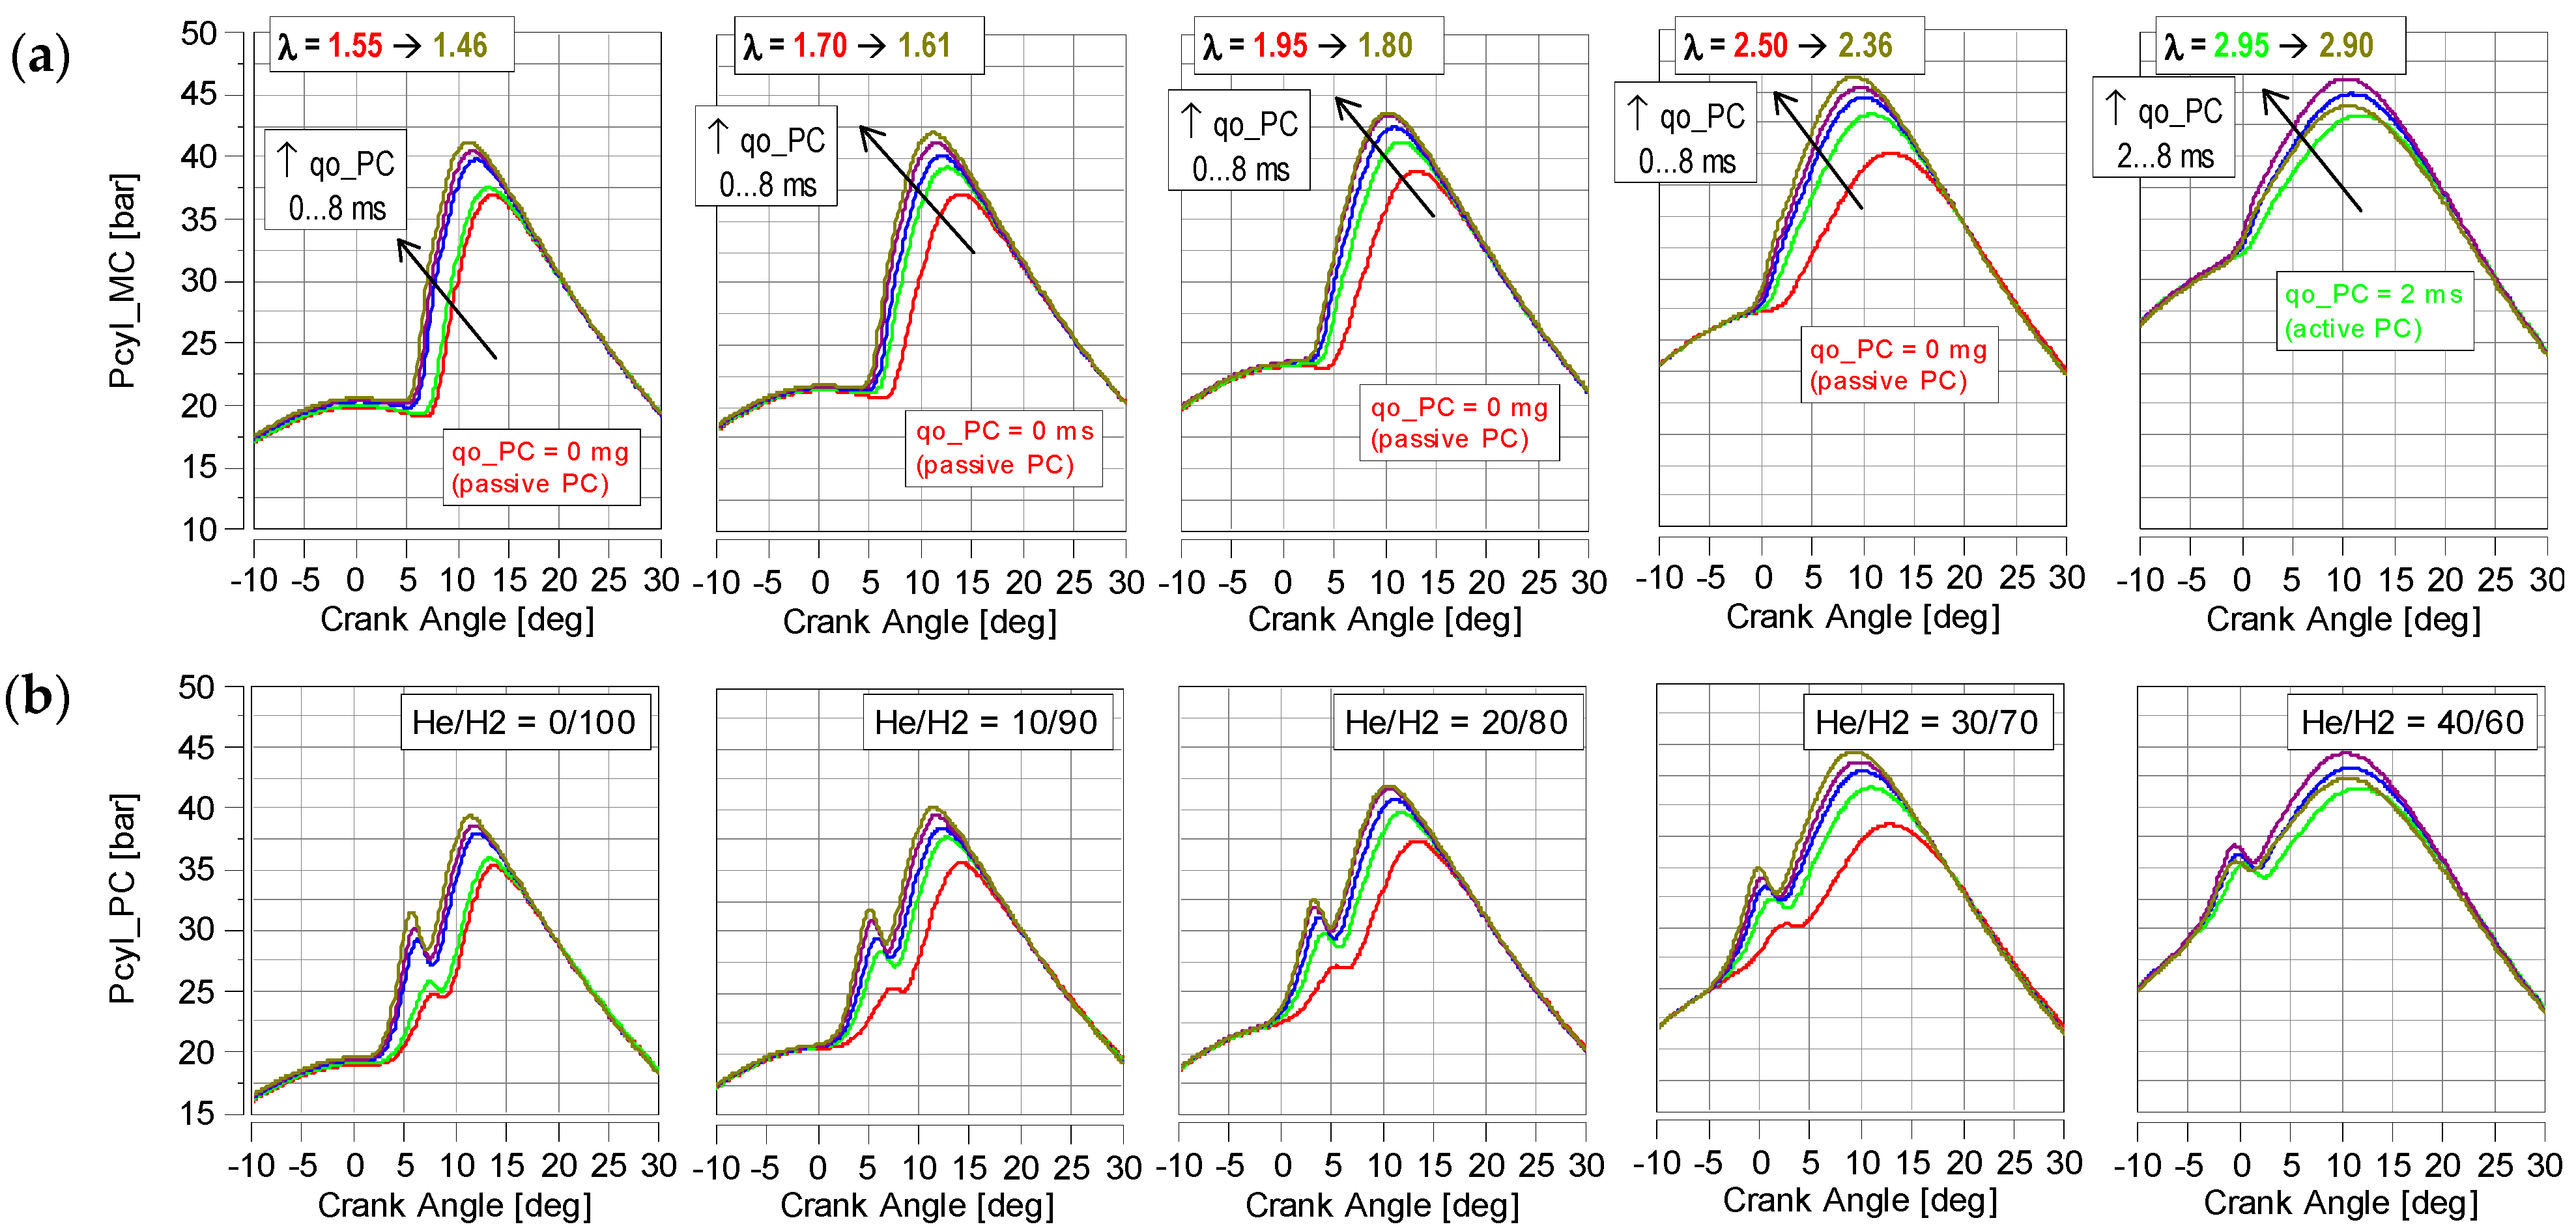
4.1. Cylinder Pressure

Research on helium addition in hydrogen fuel was carried out in the aspect of analyzing pressure changes in the cylinder. On its basis, most indicated and thermodynamic parameters were determined. The primary combustion process was carried out using pure hydrogen (Figure 5). The combustion pressure is shown as a red function. This refers to the use of the passive prechamber. It is described with the value of the excess air ratio (red color). The value of λ is the largest in this case (each successive supply of fuel to the PC resulted in a decrease in the global value of λ). The curves contained in Figure 5 are for pressure functions with increasing fuel delivery to the PC (∆t = 2 ms). As presented earlier, the effect of helium addition in the He/H2 mixture and varying the hydrogen dose in the prechamber was analyzed at different values of λ. Figure 5 shows the changes in the fuel dose to the prechamber, which result in small increases in combustion chamber pressure (an increase in the total fuel dose results in a parallel decrease in the λ). Increasing the fuel injection into the PC results in faster combustion, due to a change in the λ. A lower value of this coefficient provides better ignition of such mixtures (despite the wide ignition limits of hydrogen). The highest acceleration of the combustion process occurs after switching from the passive to the active prechamber (increasing fuel injection to the PC above zero). The following extension of the fuel injection time to the PC does not bring such a large change in the start of the combustion. The increase in cylinder pressure caused by the change in the injection mode (from passive to active) is significant. The rise in maximum combustion pressure (Pmx) is quite notable, especially after λ is higher than 1.5. The passive combustion chamber system could not be realized at a high excess air ratio (around λ = 3.00), due to the lack of a combustion process. Similar conclusions regarding the lack of combustion of a mixture of hydrogen and methane (HCH4) and CH4 at high values of λ were noted by Soltic and Hilfiker [19]. The combustion of HCH4 was stopped at λ = 1.9, while with the active chamber, it was carried out to λ = 2.2 (it should be noted that pure hydrogen was not used). Similar conclusions during hydrogen combustion in a Constant Volume Chamber (CVC) were obtained by Liu et al. [20].
On the basis of 100 engine work cycles, the variation in the indicated mean effective pressure was determined (IMEP). The change in IMEP was caused by increasing the throttle angle (TH) (which increased the excess air ratio λ)—Figure 6a. At the same time, increasing the addition of helium in the fuel reduced λ. More helium and less hydrogen results in less energy contained in the fuel dose (constant mass of the fuel but change in its composition of He/H2).
IMEP is given by [21,22] the following:
I M E P = Δ α V s α = 1 720 p α d V α d α ,
where Vs, p( α ), dV( α )/d α , and Δ α  are the mean cylinder swept volume, cylinder pressure at crank angle position  α , derivation of cylinder volume at crank angle position  α , and indicated crank angle resolution, respectively.
Increasing He addition at a low λ results in an IMEP decrease of approximately 10%. At higher values of λ, an increase in the percentage of He in the fuel results in a slightly greater reduction in IMEP (up to 14%). Each further increase in He in the mixture results in an average reduction of IMEP by approximately 10%. With He/H2 = 30/70, IMEP was reduced by 35%. Increasing λ up to 2.95 and the He/H2 ratio up to 30/70 causes a reduction in IMEP by almost 40%. This means that the average decrease in IMEP is around 10% for every 10% He increase, while λ has no impact on these changes.
An analysis of the combustion process (Figure 6b) leads to the conclusion that increasing λ reduces CoV(IMEP). This is due, among other things, to a reduction in the probability of knock combustion. As λ increases, CoV(IMEP) decreases. This happens whenever the He content of a mixture increases. When the engine is fueled with pure hydrogen, the CoV(IMEP) is a maximum of 1.9% (at low λ). An increase in λ leads to a decrease in CoV(IMEP). The lowest CoV(IMEP) is less than 1 at λ = 2.9. Similar conclusions were presented in the work of Szwajca et al. [23]. The analysis of lean mixture combustion with the use of a passive prechamber leads to different conclusions. Bucherer et al. [24] found that due to the lack of effective ignition, CoV(IMEP) is increased from 2 (at λ = 1.25) to 4 (at λ = 3.0).
A relationship among the hydrogen content in the mixture, throttle position, and the excess air ratio shows that there is a linear relationship (Figure 7). Only small changes in throttle opening during the combustion of high-hydrogen fuel indicate that IMEP changes are non-linear (this is the lowest part of the graph—blue color). Increasing the percentage of hydrogen in the fuel mixture supplied to the prechamber results in a 2% increase in the full fuel dose.

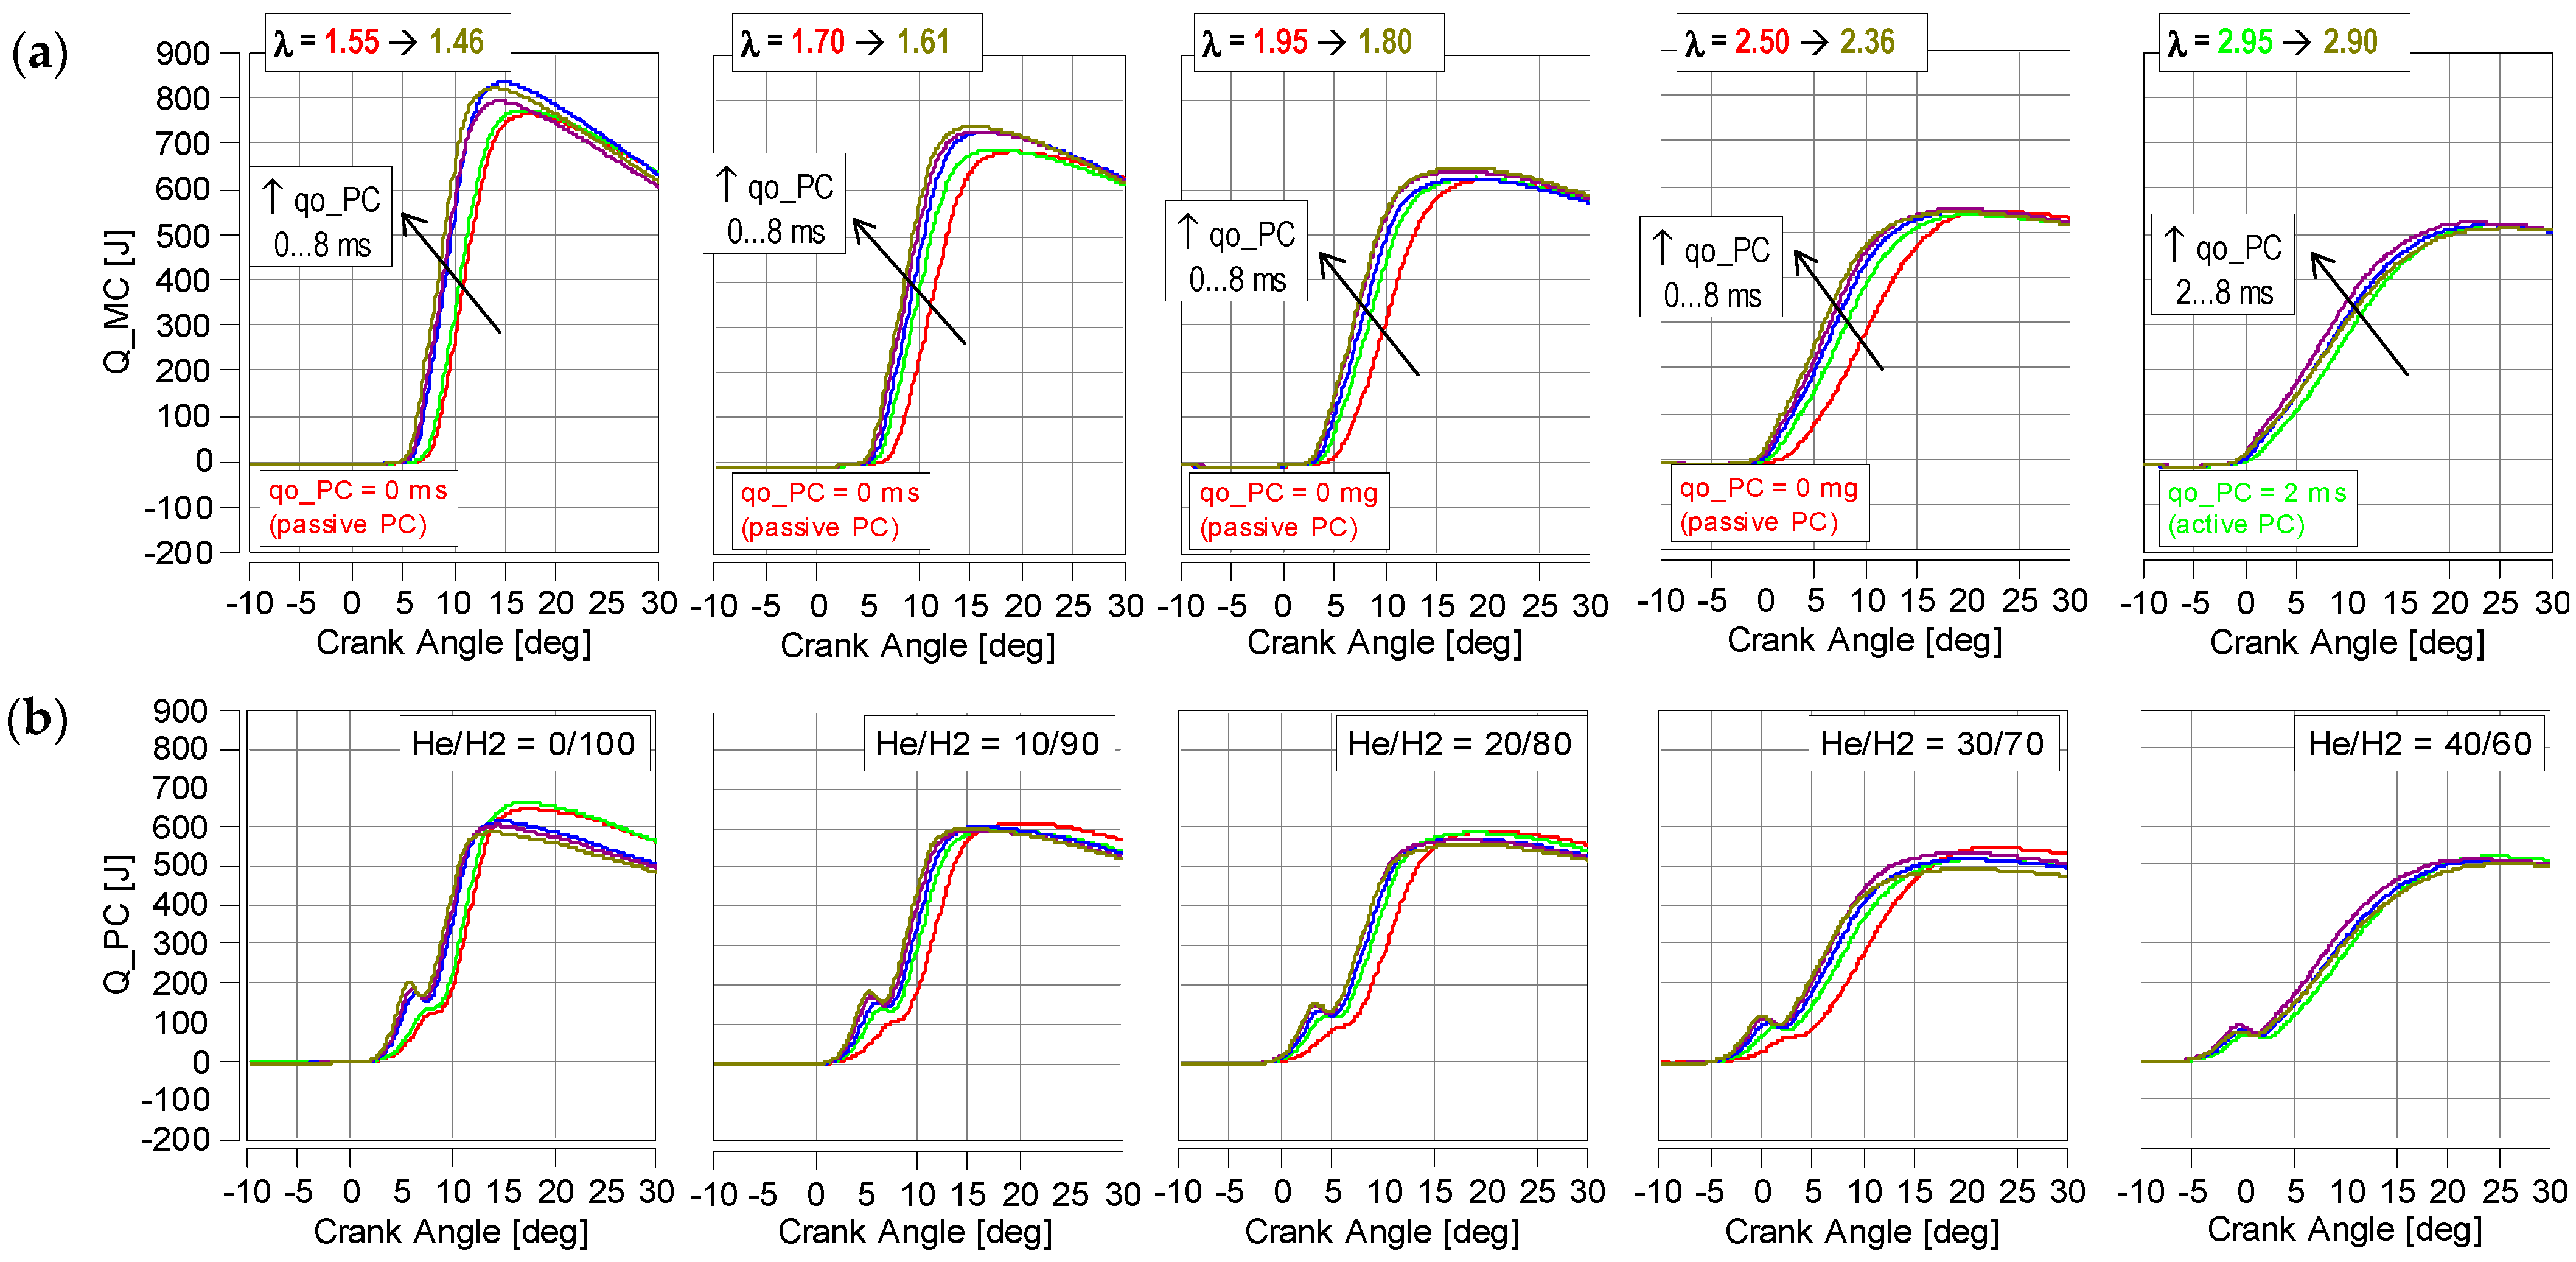
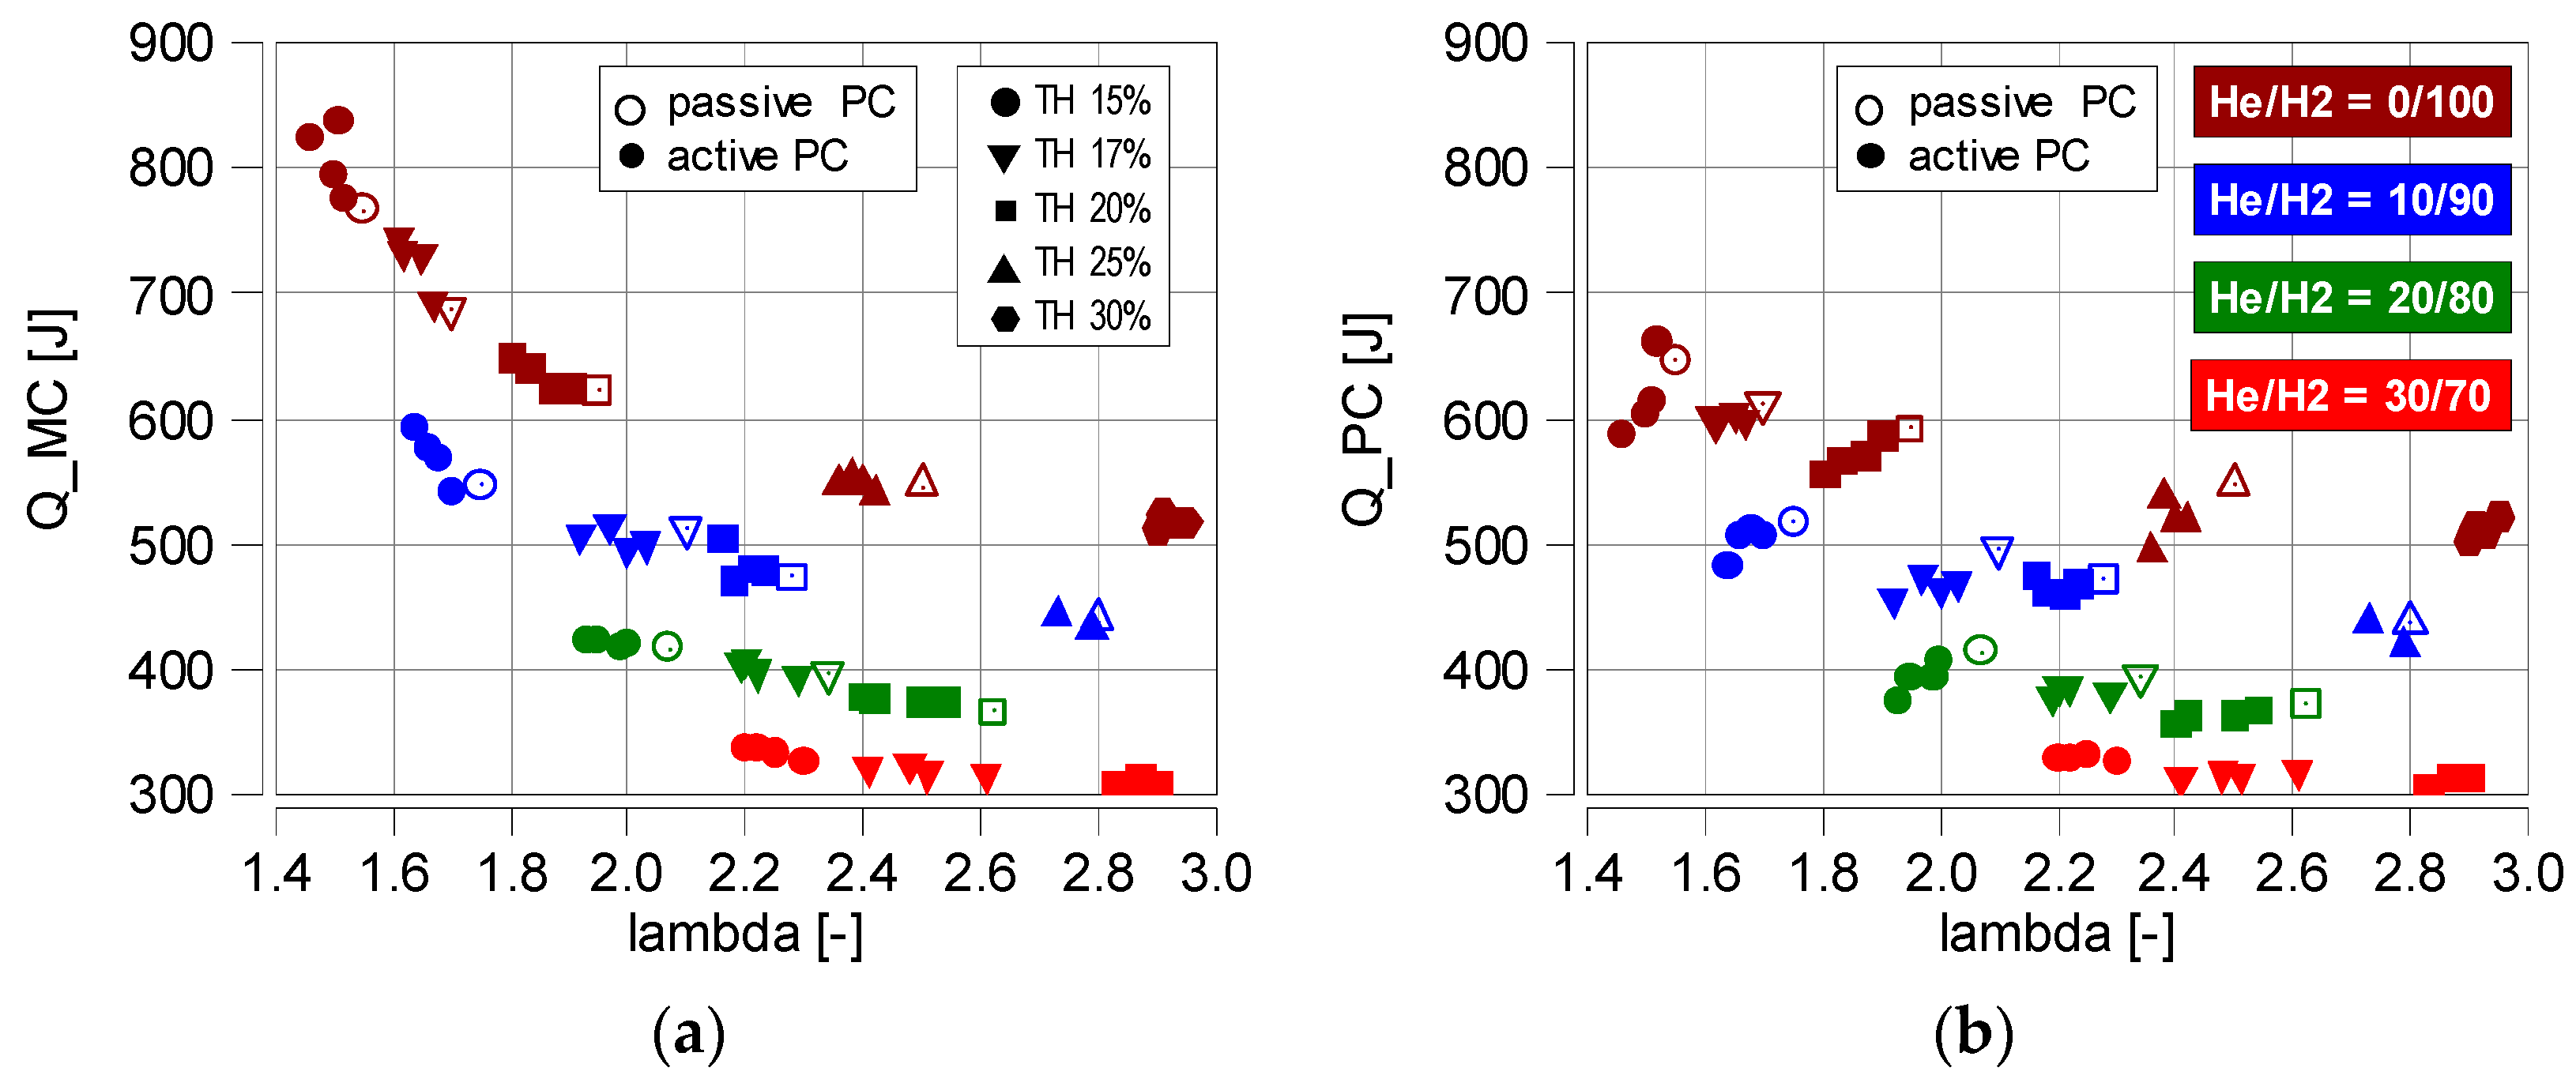
4.2. Thermodynamic Parameters

The analysis of the net heat rate dQ was carried out according to the equation [25,26]:
d Q ( α ) = d Q n e t d α = γ γ 1 P ( α ) d V d α + 1 γ 1 V ( α ) d P d α ,
and the Q is given by the following:
Q ( α ) = α = 30 α = 90 d Q n e t d α d α ,
where P is the instantaneous cylinder pressure,  α  is the crank angle, γ is the ratio of the specific heats (cp/cv), and V is the instantaneous cylinder volume. This last parameter was calculated from the engine geometry and crank angle values. Hence, a constant value of γ = 1.35 is considered in this study for analyzing the Q in fuel operation.
The lowest cylinder pressures were obtained at low excess air ratio values (Figure 5), while the heat release rate was the highest (Figure 8). This is because the increase in compression pressure as a result of changing λ is greater than the increase in maximum combustion pressure in the cylinder. When λ = 1.55–1.46, a high heat release rate and short combustion time in the main chamber are observed. In the prechamber, the two-stage combustion process is clearly outlined. The first peak of the heat release rate (in the PC) occurs much earlier than in the main chamber. The next peak is synchronized with the main chamber. Each further increase in λ causes a reduction in the heat release rate, a prolongation of the combustion process (in the main chamber), and a limitation of the first and second phases of combustion (in the prechamber). Increasing the proportion of He in the fuel significantly reduces the heat release rate. At He proportions in the mixture of 10%/20%/30%/40%, a decrease in dQ_MC was obtained, respectively: 18%/43%/68% and 75%. This is significantly more than during the IMEP analysis.
The maximum value of the heat release rate in the prechamber was also reduced. The dQ_PC values were as follows: 12%/33%/54% and 66%.
This means that a 20% addition of He results in a 50% reduction in the heat release rate in MC (in the PC up to 33%).
The above results must be reflected in the heat release (derived from Equation (3))—Figure 9. As before, the greatest heat release was obtained at low values of λ. An analysis of combustion with a passive prechamber shows a delay in combustion and a reduction in the total amount of heat release. Increasing the fuel dose in the PC raises the overall heat release and accelerates the combustion process (assuming that the CoC in the passive combustion chamber is between 8 and 10 deg aTDC).
The analysis shows that increasing the proportion of helium in the fuel mixture reduces the maximum heat release. With the following increase in the proportion of He in the fuel, 10/20/30/40%, the decrease in heat release (in MC) was, respectively, 12/22/34/39%. This means that increasing the percentage of helium in the fuel reduces the maximum heat release by an average of 10% for every 10% of increased helium content.
The analysis of heat release in the PC includes the start of combustion, but information on the fluid flows between the main chamber and the primary chamber. Therefore, the released heat is greater with a passive prechamber (qo_PC = 0 mg)—Figure 9 (variable Q_PC). Despite the higher maximum values of heat release, a delay and slowing down of the initial combustion process are observed. Considering the maximum values of fuel injected into the prechamber (qo_PC = 8 ms), it can be concluded that the addition of helium to hydrogen slightly reduces the heat release in the prechamber. It should be remembered that during the tests, 1) there were fluid flows between PC and MC and 2) pure hydrogen was injected into the prechamber. Therefore, the maximum decrease in heat release in the prechamber is approximately 20% (at He/H2 = 40/60). This shows that, on average, for every 10% of helium addition, the decrease in the maximum amount of heat released in the PC is about 5%.
An analysis of the effect of helium on engine operation is presented in relation to the cylinder pressure (at a constant TH throttle opening and at a constant amount of fuel injected into the prechamber)—Figure 10.
An analysis of the data for the same fuel doses to the main chamber (qo_MC = 9.5 ms) and the prechamber (qo_PC = 2 ms) at different helium percentages shows that the excess air ratio varied (Figure 10a). The study shows that a 10% change in the ratio of hydrogen to helium in the fuel does not always result in a constant change in the λ. On average, the change is about ∆λ = 0.3. At higher throttle openings, these changes are more variable. An analysis of the combustion process at a constant throttle position and changing He/H2 ratio shows changes in CoC. Despite the acceleration of the start of combustion, about 6–7% lower maximum combustion pressures were obtained (with TH = 15% and qo_PC = 2 ms, λ = 1.52). Greater throttle opening (and directly higher λ) results in greater variations in maximum pressure. Increasing the helium content by 10% at a high throttle opening (TH = 20% and λ = 1.90), the changes in maximum pressure are about 8%. At the highest values (TH = 25%; λ = 2.42), the change in maximum pressure reaches more than 13%.
Similar changes were observed during analysis of the combustion pressure in the prechamber (Figure 10b). Again, as the helium content increased by 10%, there was a decrease in maximum pressure of around 6%.
Relating the changes in Pmx to the corresponding changes in IMEP in Figure 6, it can be seen that the changes in IMEP at 10% helium addition are 11–13% (larger changes were observed at higher throttle openings).
Increasing the proportion of helium in the fuel also reduces the maximum heat release (Figure 11a). With a 10% increase in the amount of helium in the fuel, heat release decreases by 28%. Further increases in the proportion of He result in smaller decreases compared to the reference (pure hydrogen injection). At 20% He addition, a 50% reduction in Qmx was achieved. It is worth mentioning that there was a 30% decrease in heat release from the maximum at He/H2 = 10/90 to heat release at He/H2 = 20/80. It is noteworthy that the decreases in heat release caused by increasing the throttle opening (at the same He/H2 ratio value) are proportional during the combustion of fuels with different helium contents.
When analyzing the Qmx values in the prechamber (Figure 11b), lower maximum values are observed (which is due to the flows between the main chamber and the prechamber). With regard to PC, the change in heat release is linear and depends on the proportion of helium in the fuel. With an increased He/H2 ratio, Qmx in both chambers is similar.
In the main chamber, the rate of heat release is non-linear with respect to the degree of throttle opening (Figure 12a). Figure 8 shows the significant changes in dQmx. Figure 12a shows that when He/H2 = 10/90 fuel is injected into the main chamber for 9.5 ms and He/H2 = 0/100 is injected into prechamber for 8 ms, there is a 40% decrease in the heat release rate. When He/H2 = 20/80 fuel is used, the further relative decrease in heat release rate is 50%. Similar changes are observed in the prechamber (Figure 12b). A 10% addition of helium in the fuel results in a 30% decrease in dQmx, and a further increase in helium addition results in a relative decrease in dQmx of 50% compared to the previous value.

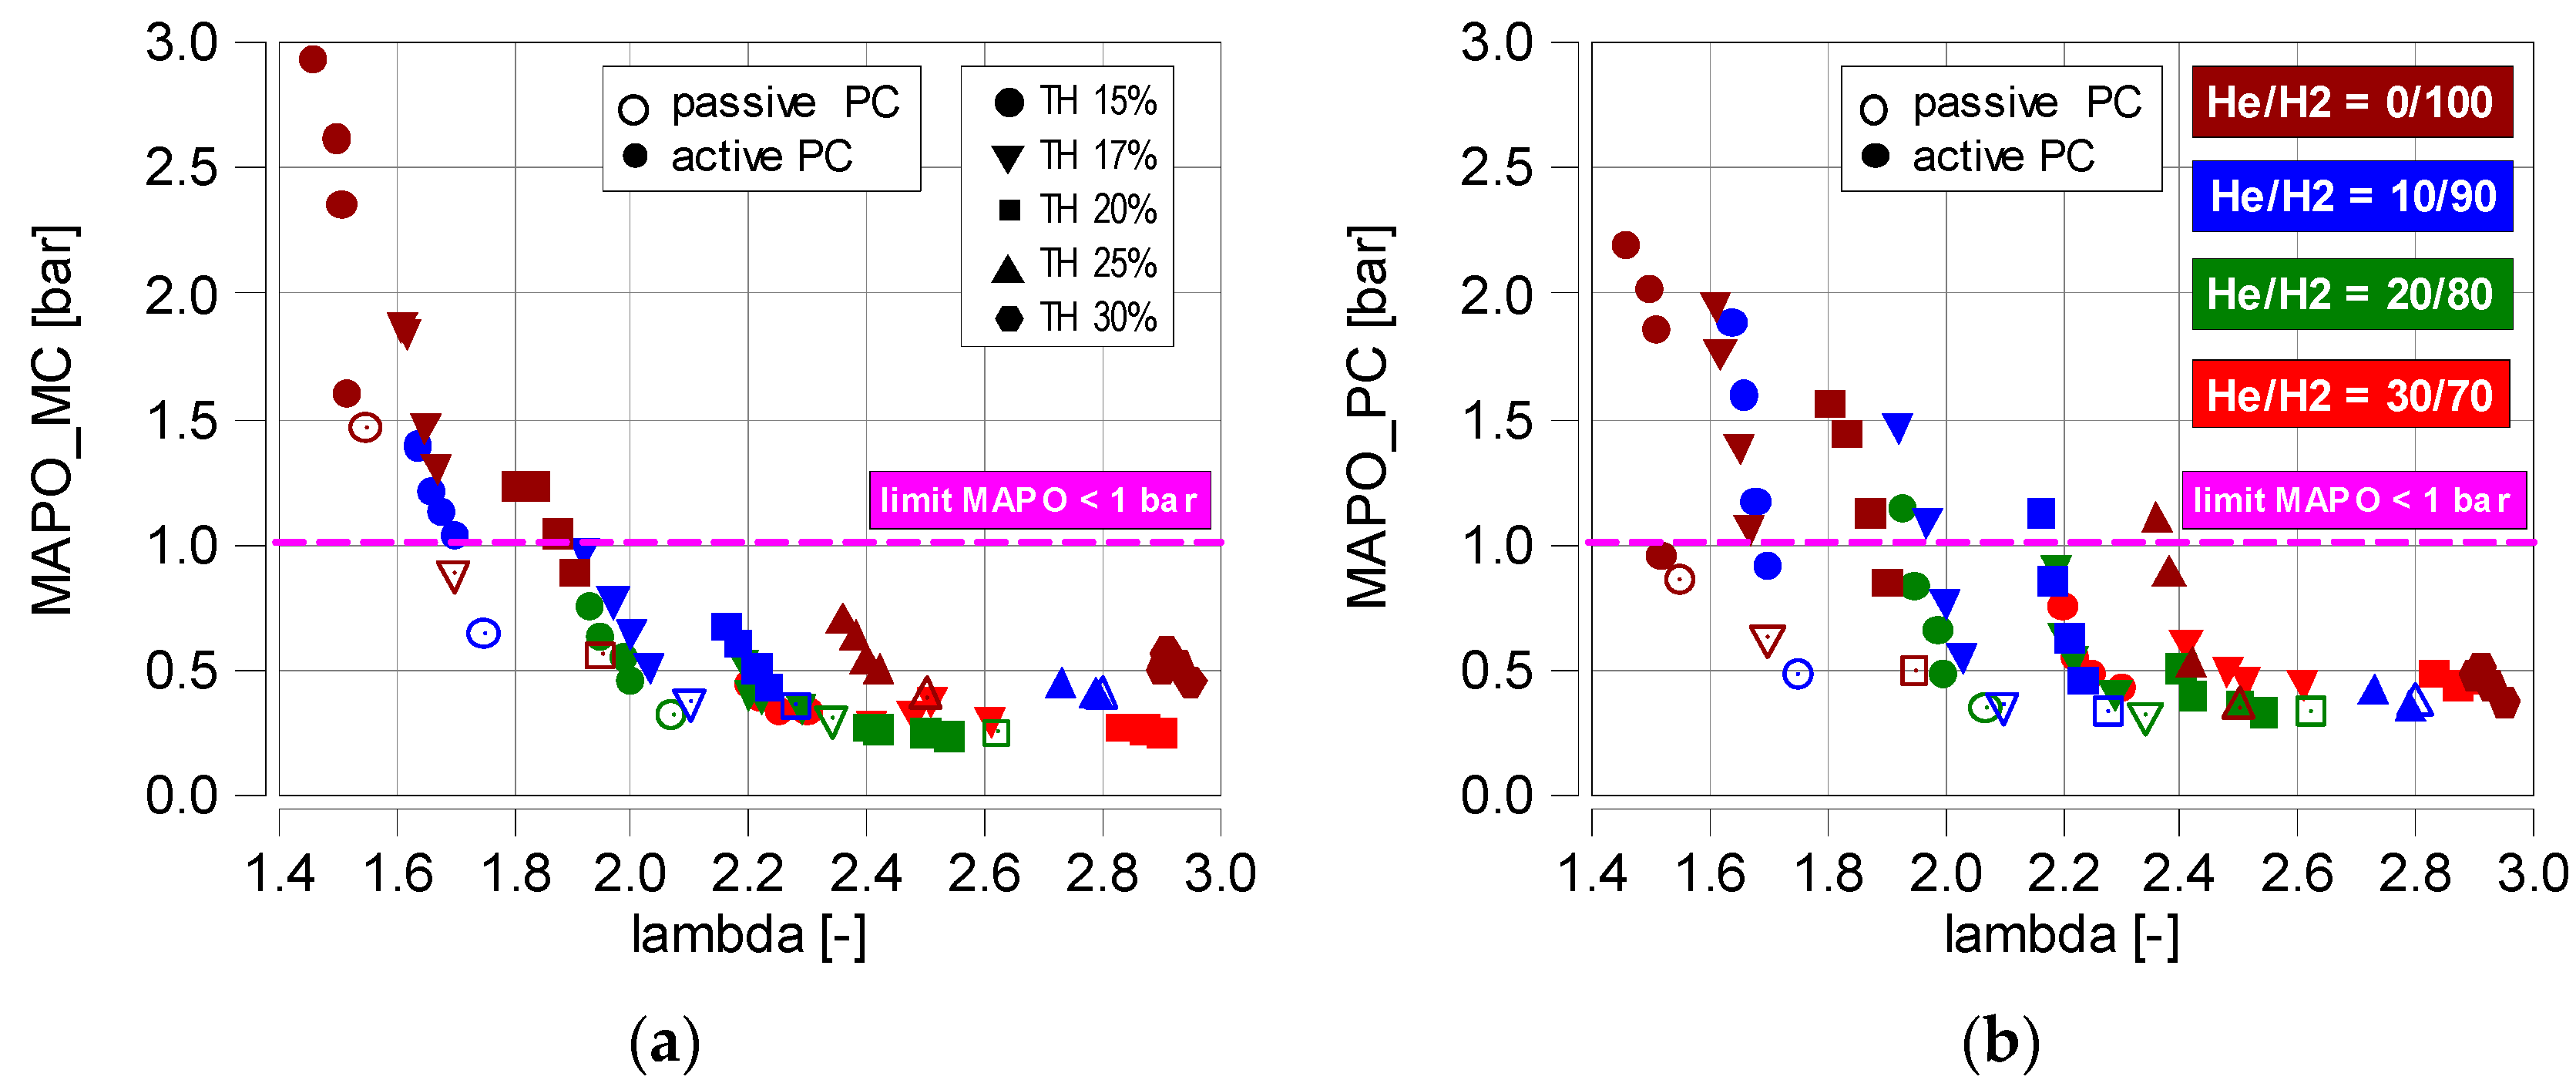
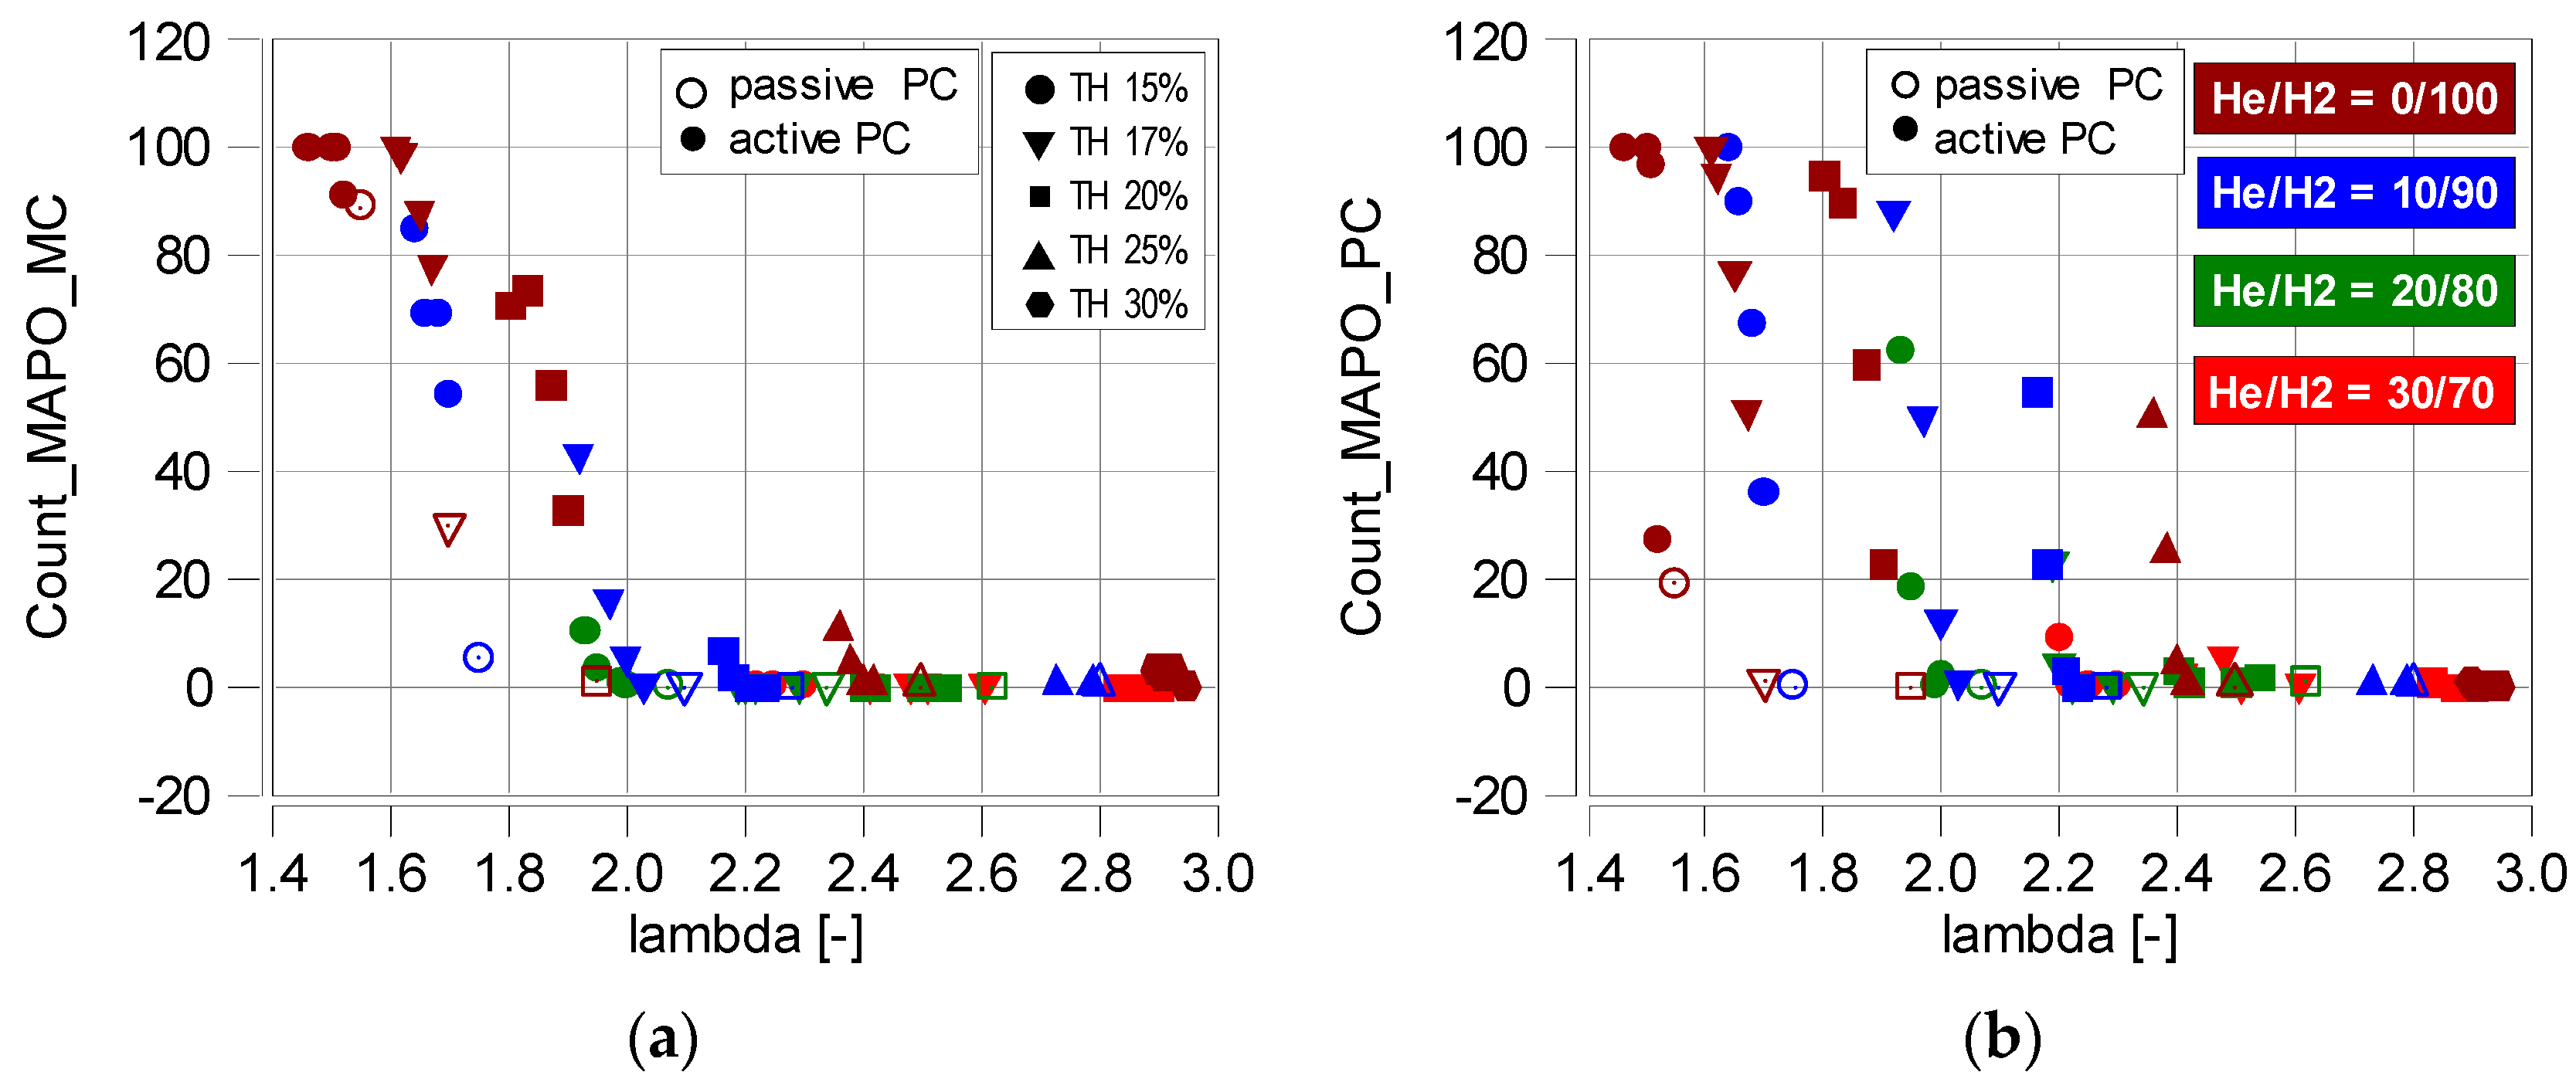
4.3. Knock Combustion

Knock combustion must be considered during hydrogen combustion, especially for stoichiometric fuel–air mixtures. In the current research, the minimum value of the excess air factor is λ ≥ 1.45; however, as found in many publications [27,28], even such values cause knock combustion in both (or one) combustion chambers.
Knock combustion is determined using the MAPO method (Section 3.4) and is graphically represented in Figure 13. From the presented results, it is possible to identify the areas of the highest intensity of knock combustion. It occurs during the combustion of pure hydrogen at low throttle opening (up to 20%) and an excess air ratio. The MAPO limit, above which knock combustion occurs, is 1 bar. This limit was determined on the basis of research work [16,28,29]. This is a subjective value, which depends on the engine’s displacement or load. The assumption of a limit value of 1 bar indicates the existence of knock combustion also for a 10% helium content in the fuel. This occurs only at the lowest throttle opening (TH = 15%). In general, knock combustion occurs when the engine is running up to λ < 1.9 (based on Figure 13a). Similar conclusions were obtained by other researchers determining the limit of knock combustion in this range of an excess air ratio [27].
A characteristic feature is the occurrence of knock combustion in the prechamber (Figure 13b). The range of its occurrence is much larger. In this range, knock combustion was recorded not only for 10% helium but also at much higher contents—20% (for qo_PC = 8 ms). Such a relationship is due to the fact that pure hydrogen was injected into the prechamber. Its high concentration in the prechamber, with a low excess air ratio, leads to knock combustion.
It is worth mentioning that in both chambers, when using a passive prechamber (qo_PC = 0 ms), knock combustion did not occur (MAPO < 1 bar).
Based on Figure 13 and knowing that 100 engine cycles were recorded at each test point, the probability of knock combustion was determined. It was defined as the number of knock combustion cycles in relation to 100 engine cycles analyzed.
The results are shown in Figure 14. An analysis of the data in Figure 13 shows that knock combustion is more probable in the prechamber than in the main chamber. The results in Figure 14 relate to the number of knock combustion cycles, while the results in Figure 13 relate to the intensity of knock combustion. Therefore, these figures cannot be directly compared. The data in Figure 14a show that during pure hydrogen combustion at the lowest throttle opening (TH = 15%), the probability of knock combustion in the main chamber is above 80%. This means that the knock occurred in more than 80 out of 100 cycles. The addition of helium reduces this probability to an average value of about 70%. This means that although the intensity of knock combustion does not exceed 1 bar, the possibility of it occurring is not zero. In the range of λ = 2.0, the probability of the knock combustion is up to 20%, and the data in Figure 13a show that MAPO << 1 bar.
An analysis of the probability of the knock combustion in the prechamber (Figure 14b) shows much larger ranges of its occurrence. Even when λ = 1.9, the knock combustion can occur in the prechamber in half of the engine cycles. When λ > 2.4, the unfavorable combustion is practically non-existent.

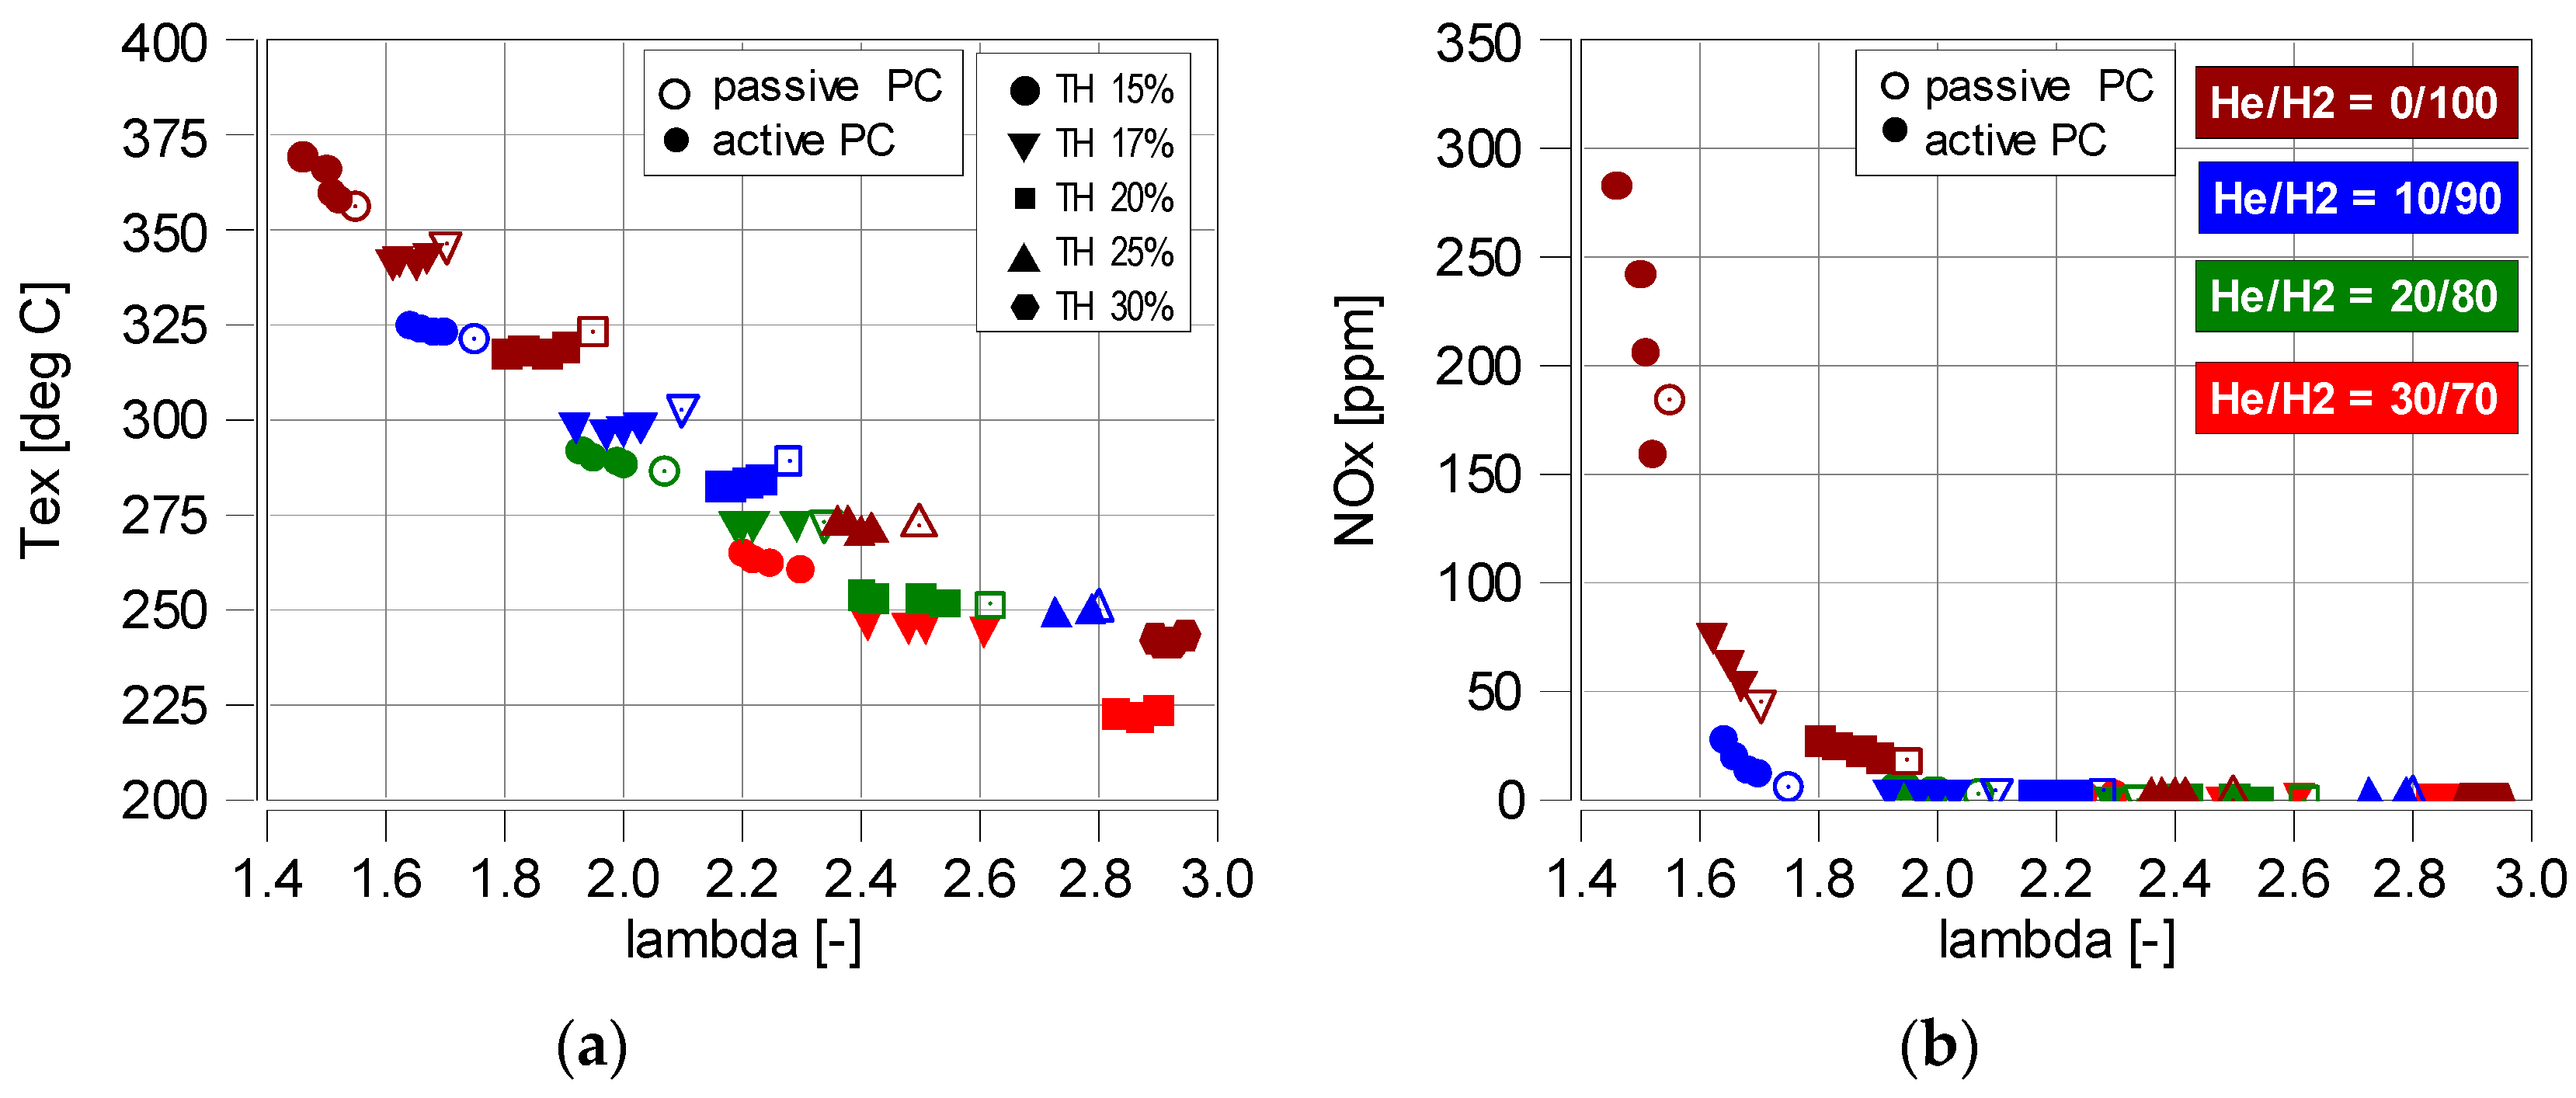
4.4. Exhaust Gas Emission

The combustion temperature (and indirectly the exhaust temperature—Figure 15a) has a very strong effect on the concentration of nitrogen oxides in the exhaust gas (Figure 15b). When this temperature is 350 °C, the concentration of nitrogen oxides in the exhaust gas drops dramatically. According to the study, when the temperature reaches this level (with the simultaneous rise of λ to a value of 1.6), the concentration of nitrogen oxides decreases from around 250 ppm to 80 ppm. If the exhaust gas temperature falls under 325 °C, the NOx concentration will be less than 30 ppm. This means that the excess air ratio, in combination with the combustion temperature, influences the concentration of nitrogen oxides. Similar NOx emission reductions were also obtained by Sementa et al. [30], Molina et al. [31], and Pan et al. [32].

5. Conclusions

Hydrogen–helium mixtures were created by increasing the volume fraction of helium in hydrogen fuel. Combustion experiments were carried out at a constant initial CoC value. Changes in the excess air ratio were realized by increasing the throttle opening (with a constant fuel injection time into the main chamber). The TJI system allowed an He/H2 mixture to be injected into the main chamber and pure hydrogen into prechamber.
Based on the research, conclusions were drawn about the engine’s performance and the possibility of using hydrogen and helium as a dual fuel:
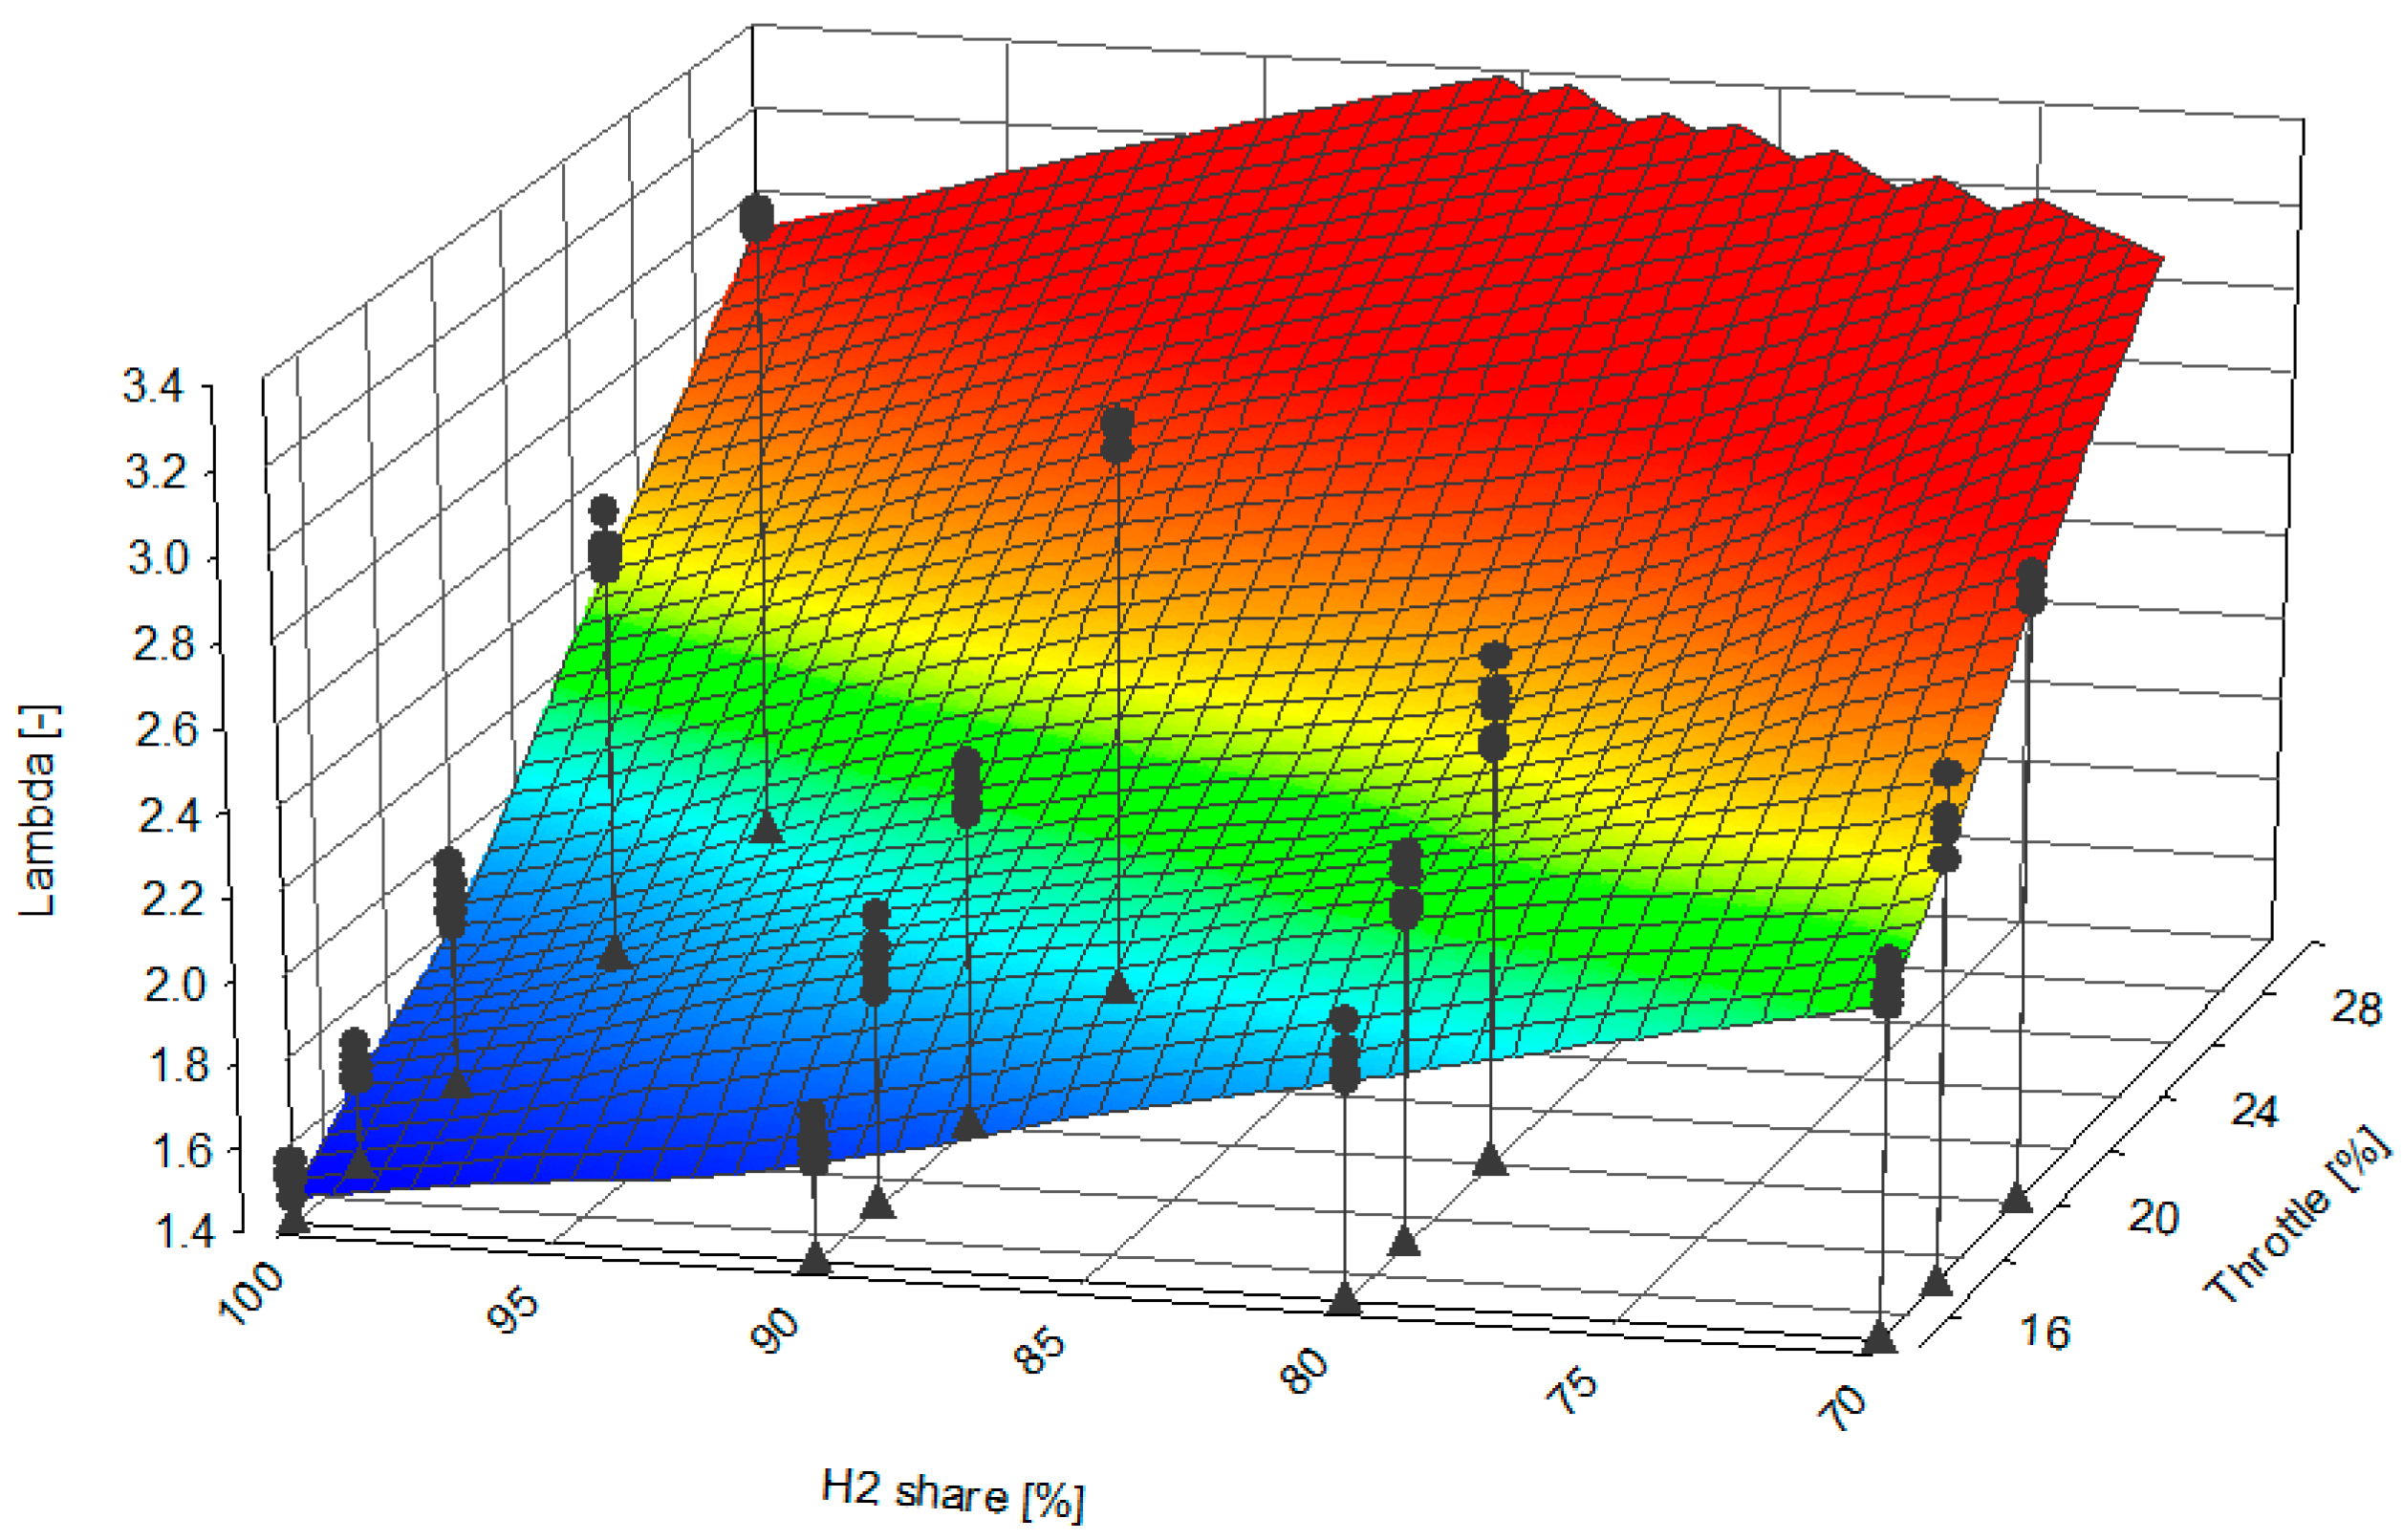
  • The increase in the proportion of helium in the hydrogen fuel (at the same throttle opening) resulted in a higher excess air ratio. Therefore, the maximum combustion pressure Pmx decreased (due to a reduction in the energy content of the fuel)—Figure 10;
  • The average decrease in IMEP is about 10% for every 10% increase in He. It is worth mentioning that λ does not affect the changes in this value—Figure 6a;
  • Increasing the proportion of helium in the hydrogen fuel reduces the unevenness of the engine’s CoV(IMEP) from 2% to less than 1%;
  • Increasing the proportion of He in the fuel significantly reduces the rate of heat release. Raising the percentage of He by 10% reduces dQmx by an average of 20%—Figure 8. This is significantly more than during the IMEP analysis;
  • Increasing the proportion of helium by 10% in the hydrogen fuel reduces the maximum heat release in the main chamber by an average of 10% for every 10% increase in the helium content—Figure 9a; for the prechamber, the maximum heat release decreases by an average of 5%—Figure 9b;
  • The analysis shows that with a fixed throttle position and high He/H2 ratio, the combustion process has to be accelerated (ignition time) to reach CoC = 8–10 deg aTDC;
  • Knock combustion only occurs at low helium values in the fuel. In the main chamber, knock combustion does not occur when λ > 1.9 (MAPO < 1 bar). In the prechamber (into which pure hydrogen was injected), the absence of knock combustion was only noted at λ > 2.4;
  • A temperature of 325 °C is the limit below which the concentration of NOx in the exhaust gas decreases rapidly. This temperature reduces the NOx concentration by more than 80% to a level of 30 ppm. At lower exhaust gas temperatures (with higher λ), the proportion of NOx in the exhaust gas was below 10 ppm.

Author Contributions

Conceptualization, D.M. and I.P.; methodology, D.M. and I.P.; software, D.M. and I.P.; validation, D.M. and I.P.; formal analysis D.M. and I.P.; investigation, D.M. and I.P.; resources, D.M. and I.P.; data curation, D.M. and I.P.; writing—original draft preparation, D.M. and I.P.; writing—review and editing, D.M. and I.P.; visualization, D.M. and I.P.; supervision, D.M. and I.P.; project administration, D.M. and I.P.; funding acquisition, D.M. and I.P. All authors have read and agreed to the published version of the manuscript.

Funding

This research was funded by the Poznan University of Technology, interdisciplinary grant number 0415/SIGR/7286.

Institutional Review Board Statement

Not applicable.

Informed Consent Statement

Not applicable.

Data Availability Statement

The original contributions presented in the study are included in the article; further inquiries can be directed to the corresponding author/s.

Conflicts of Interest

The authors declare no conflicts of interest.

Abbreviations

aTDCafter TDC
BMEPBreak Mean Effective Pressure
CH4Methane
CoCCenter of combustion
CoV(IMEP)Coefficient of Variation of IMEP
CVCConstant Volume Chamber
dQRate of Heat Release
H2Hydrogen
HeHelium
IMEPIndicating Mean Effective Pressure
MAPOMaximum Amplitude Pressure Oscillation
MCMain Chamber
MFMMass Flow Meter
nEngine Speed
NOxNitrogen Oxides
PCPrechamber
PFIPort Fuel Injection
PmxMaximum Cylinder Pressure
SISpark Ignition
TDCTop Dead Center
THThrottle
TJITurbulent Jet Ignition
QHeat Release
QmxMaximum of Heat Release
λAir Access Ratio
γRatio of the Specific Heats (cp/cv)

References

  1. Kweku, D.W.; Bismark, O.; Maxwell, A.; Desmond, K.A.; Danso, K.B.; Oti-Mensah, E.A.; Quachie, A.T.; Adormaa, B.B. Greenhouse effect: Greenhouse gases and their impact on global warming. J. Sci. Res. Rep. 2018, 17, 1–9. [Google Scholar] [CrossRef]
  2. Ruddiman, W.; Vavrus, S.; Kutzbach, J.; He, F. Does pre-industrial warming double the anthropogenic total? Anthr. Rev. 2014, 1, 147–153. [Google Scholar] [CrossRef]
  3. Holland, G.; Bruyère, C.L. Recent intense hurricane response to global climate change. Clim. Dynam. 2014, 42, 617–627. [Google Scholar] [CrossRef]
  4. Onorati, A.; Payri, R.; Vaglieco, B.M.; Agarwal, A.K.; Bae, C.; Bruneaux, G.; Canakci, M.; Gavaises, M.; Günthner, M.; Hasse, C.; et al. The role of hydrogen for future internal combustion engines. Int. J. Engine Res. 2022, 23, 529–540. [Google Scholar] [CrossRef]
  5. Fayaz, H.; Saidur, R.; Razali, N.; Anuar, F.S.; Saleman, A.R.; Islam, M.R. An overview of hydrogen as a vehicle fuel. Renew. Sust. Energy Rev. 2012, 16, 5511–5528. [Google Scholar] [CrossRef]
  6. Verhelst, S.; Wallner, T. Hydrogen-fueled internal combustion engines. Prog. Energy Combust. 2009, 35, 490–527. [Google Scholar] [CrossRef]
  7. Singh, S.; Jain, S.; Ps, V.; Tiwari, A.K.; Nouni, M.R.; Pandey, J.K.; Goel, S. Hydrogen: A sustainable fuel for future of the transport sector. Renew. Sust. Energy Rev. 2015, 51, 623–633. [Google Scholar] [CrossRef]
  8. Qiang, Y.; Cai, X.; Xu, S.; Wang, F.; Zhang, L.; Wang, S.; Ji, C. Effect of injection strategy on the hydrogen mixture distribution and combustion of the hydrogen-fueled engine with passive prechamber ignition under lean burn condition. Fuel 2024, 375, 132610. [Google Scholar] [CrossRef]
  9. Aljabri, H.; Silva, M.; Houidi, M.B.; Liu, X.; Allehaibi, M.; Almatrafi, F.; AlRamadan, A.S.; Mohan, B.; Cenker, E.; Im, H.G. Comparative study of spark-ignited and prechamber hydrogen-fueled engine: A computational approach. Energies 2022, 15, 8951. [Google Scholar] [CrossRef]
  10. Özyalcin, C.; Sterlepper, S.; Roiser, S.; Eichlseder, H.; Pischinger, S. Exhaust gas aftertreatment to minimize NOx emissions from hydrogen-fueled internal combustion engines. Appl. Energy 2024, 353, 122045. [Google Scholar] [CrossRef]
  11. Taib, N.M.; Mansor, M.R.A.; Wan Mahmood, W.M.F. Combustion characteristics of hydrogen in a noble gas compression ignition engine. Energy Rep. 2021, 7, 200–218. [Google Scholar] [CrossRef]
  12. Taib, N.M.; Mahmood, W.M.F.; Mansor, M.R.A. Combustion characteristics of hydrogen direct injection in a helium–oxygen compression ignition engine. Energy Rep. 2022, 8, 494–511. [Google Scholar] [CrossRef]
  13. Taib, N.M.; Mahmood, W.M.F.; Ghopa, W.A.W.; Köten, H.; Mansor, M.R.A. Numerical study of heat transfer of hydrogen combustion in noble gases atmosphere in compression ignition engine. Int. J. Hydrogen Energy 2023, 48, 28970–28979. [Google Scholar] [CrossRef]
  14. Dimitriou, P.; Tsujimura, T. A review of hydrogen as a compression ignition engine fuel. Int. J. Hydrogen Energy 2017, 42, 24470–24486. [Google Scholar] [CrossRef]
  15. Zhu, S.; Akehurst, S.; Lewis, A.; Yuan, H. A review of the prechamber ignition system applied on future low-carbon spark ignition engines. Renew. Sust. Energy Rev. 2022, 154, 111872. [Google Scholar] [CrossRef]
  16. Pielecha, I.; Szwajca, F.; Skobiej, K. Experimental investigation on knock characteristics from prechamber gas engine fueled by hydrogen. Energies 2024, 17, 937. [Google Scholar] [CrossRef]
  17. Lou, D.; Rao, X.; Zhang, Y.; Fang, L.; Tan, P.; Hu, Z. Investigation of impacts of hydrogen injection and spark strategy on knock in hydrogen engine. Int. J. Hydrogen Energy 2024, 82, 1252–1262. [Google Scholar] [CrossRef]
  18. Lai, F.; Sun, B.; Wang, X.; Zhang, D.; Luo, Q.; Bao, L. Research on the inducing factors and characteristics of knock combustion in a DI hydrogen internal combustion engine in the process of improving performance and thermal efficiency. Int. J. Hydrogen Energy 2023, 48, 7488–7498. [Google Scholar] [CrossRef]
  19. Soltic, P.; Hilfiker, T. Efficiency and raw emission benefits from hydrogen addition to methane in a prechamber–equipped engine. Int. J. Hydrogen Energy 2020, 45, 23638–23652. [Google Scholar] [CrossRef]
  20. Liu, P.; Zhong, L.; Zhou, L.; Wei, H. The ignition characteristics of the prechamber turbulent jet ignition of the hydrogen and methane based on different orifices. Int. J. Hydrogen Energy 2021, 46, 37083–37097. [Google Scholar] [CrossRef]
  21. Heywood, J.B. Internal Combustion Engine Fundamentals; McGraw-Hill: New York, NY, USA, 1988; ISBN 0-07-028637-X. [Google Scholar]
  22. Min, K.; Chung, J.; Sunwoo, M. Torque balance control for light-duty diesel engines using an individual cylinder IMEP estimation model with a single cylinder pressure sensor. Appl. Therm. Eng. 2016, 109, 440–448. [Google Scholar] [CrossRef]
  23. Szwajca, F.; Gawrysiak, C.; Pielecha, I. Effects of passive prechamber jet ignition on knock combustion at hydrogen engine. Combust. Engines 2024, 198, 110–122. [Google Scholar] [CrossRef]
  24. Bucherer, S.; Rothe, P.; Sobek, F.; Gottwald, T.; Kraljevic, I.; Vacca, A.; Gal, T.; Chiodi, M.; Kulzer, A. Experimental and numerical investigation of spark plug and passive prechamber ignition on a single-cylinder engine with hydrogen port fuel injection for lean operations. In SAE Technical; SAE International: Warrendale, PA, USA, 2023. [Google Scholar] [CrossRef]
  25. Hountalas, D.T.; Kouremenos, A.D. Development and application of a fully automatic troubleshooting method for large marine diesel engines. Appl. Therm. Eng. 1999, 19, 299–324. [Google Scholar] [CrossRef]
  26. Papagiannakis, R.G.; Hountalas, D.T. Combustion and exhaust emission characteristics of a dual fuel compression ignition engine operated with pilot diesel fuel and natural gas. Energy Convers. Manag. 2004, 45, 2971–2987. [Google Scholar] [CrossRef]
  27. Zhang, Z.F.; Sun, B.G.; Zhang, S.W.; Lai, F.Y.; Ma, N.; Ju, X.; Luo, Q.H.; Bao, L.Z. Experimental investigation of the working boundary limited by abnormal combustion and the combustion characteristics of a turbocharged direct injection hydrogen engine. Energy Convers. Manag. 2024, 299, 117861. [Google Scholar] [CrossRef]
  28. Hong, C.; Xu, S.; Zhao, S.; Zhang, H.; Su, F.; Wang, S.; Ji, C. Analysis of ammonia as a combustion inhibitor for combustion knock and power expansion in a DI hydrogen engine. Fuel 2024, 375, 132481. [Google Scholar] [CrossRef]
  29. Liu, F.; Zhou, L.; Hua, J.; Liu, C.; Wei, H. Effects of prechamber jet ignition on knock and combustion characteristics in a spark ignition engine fueled with kerosene. Fuel 2021, 293, 120278. [Google Scholar] [CrossRef]
  30. Sementa, P.; De Vargas Antolini, J.B.; Tornatore, C.; Catapano, F.; Vaglieco, B.M.; López Sánchez, J.J. Exploring the potentials of lean-burn hydrogen SI engine compared to methane operation. Int. J. Hydrogen Energy 2022, 47, 25044–25056. [Google Scholar] [CrossRef]
  31. Molina, S.; Novella, R.; Gomez-Soriano, J.; Olcina-Girona, M. Experimental activities on a hydrogen-fueled spark-ignition engine for light-duty applications. Appl. Sci. 2023, 13, 12055. [Google Scholar] [CrossRef]
  32. Pan, S.; Wang, J.; Liang, B.; Duan, H.; Huang, Z. Experimental study on the effects of hydrogen injection strategy on the combustion and emissions of a hydrogen/gasoline dual fuel SI engine under lean burn condition. Appl. Sci. 2022, 12, 10549. [Google Scholar] [CrossRef]
Figure 1. AVL 5804 test bench.
Applsci 14 08996 g001
Figure 2. Passive (a) and active (b) prechamber (dashed square) system (based on [15]; blue arrows —intake port, red arrows—exhaust port, DI—direct injection, PFI—port fuel injection).
Applsci 14 08996 g002
Figure 3. Schematic of a test bench for the combustion of hydrogen and hydrogen/helium mixtures.
Applsci 14 08996 g003
Figure 4. MAPO calculation scheme.
Applsci 14 08996 g004
Figure 5. Pressure: (a) in the main chamber; (b) in the prechamber; with a hydrogen supply (He/H2 = 0/100) and with varying excess air ratio values; n = 1500 rpm; IMEP = 3.5–4.25 bar; red line—passive prechamber data; other—active combustion chamber with increased fuel dose in PC.
Applsci 14 08996 g005
Figure 6. Variation in engine operating parameters: (a) IMEP; (b) CoV(IMEP).
Applsci 14 08996 g006
Figure 7. Map of variations in the throttle position, hydrogen content of the mixture, and resulting excess air ratio (color—resulting excess air ratio; circles— excess air ratio values; triangles—projection onto the plane of λ-value).
Applsci 14 08996 g007
Figure 8. Heat release rate dQ: (a) in the main chamber; (b) in the prechamber; fueled with hydrogen without helium (He/H2 = 0/100), variable excess air ratio and n = 1500 rpm; red line—passive prechamber data; other—active combustion chamber with increased fuel dose in PC.
Applsci 14 08996 g008
Figure 9. Heat release: (a) in the main chamber; (b) in the prechamber; fueled with hydrogen without helium (He/H2 = 0/100), variable excess air ratio and n = 1500 rpm; red line—passive prechamber; other—active combustion chamber with increased fuel dose in PC.
Applsci 14 08996 g009
Figure 10. Cylinder pressure: (a) in the main chamber; (b) in the prechamber, with changes in the He/H2 ratio at different throttle opening (qo_PC = 2 ms, active prechamber; CoC = 8–10 deg).
Applsci 14 08996 g010
Figure 11. Heat release: (a) in MC; (b) in PC.
Applsci 14 08996 g011
Figure 12. Heat release rate: (a) in MC; (b) in PC (n = 1500 rpm; CoC = 8–10 deg aTDC).
Applsci 14 08996 g012
Figure 13. MAPO variation (knock combustion) depending on λ: (a) in MC; (b) in PC (n = 1500 rpm; CoC = 8–10 deg aTDC).
Applsci 14 08996 g013
Figure 14. Percentage of knock combustion cycles depending on λ: (a) in MC; (b) in PC (n = 1500 rpm; CoC = 8–10 deg aTDC).
Applsci 14 08996 g014
Figure 15. (a) Changes in exhaust gas temperature; (b) NOx concentration in exhaust gas (n = 1500 rpm; CoC = 8–10 deg aTDC).
Applsci 14 08996 g015
Table 1. Test bench equipment.
ParameterNameValue
EngineAVL 58041-cyl.; 4 valves; TJI
InjectorsPFI (EM)
BrakeAMKASYN AVL AMK DW13-170
Parameter recorderAVL IndiSmart8-chanell, 0.5 CA
Pressure sensor (MC)AVL GH14D0–25 MPa
Pressure sensor (PC)Kistler M3.5 6081 AQ220–25 MPa
Airflow meterABB SensyFlow0–720 kg/h, error < ±0.8%
Injection controllerMechatronika0–20 ms, ±0.1 ms
Fuel flowmeter (MC)Micro Motion ELITE CMFS010M Coriolis Meter0.1–2 kg/h, accuracy ±0.25%
Fuel flowmeter (PC)Bronkhorst 111B0.1–100 g/h;
accuracy 0.1% FS
Oxygen sensorBosch LSU 4.90.7 do 12.5
ThrottleBosch ETB 32 mm±1°
Table 2. Chemical composition of the fuel in each measurement series.
Measurement SeriesHelium Content of the FuelHydrogen Content of the Fuel
10%100%
210%90%
320%80%
430%70%
540%60%
Table 3. Properties of fuels used in each measurement series.
He/H2Density
[kg/m3]
Energy in a Unit of Mass [MJ/kg]Energy in a Unit of Volume [MJ/m3]
0/1000.0898512010.782
10/900.0987110810.661
20/800.107589610.327
30/700.11644849.781
40/600.12531729.022
Table 4. Test conditions.
ParameterUnitValue
Engine speed, rpmrpm1500
Oil temperature°C90
Coolant temperature°C90
Injection time (MC)ms9.5
Injection time (PC)ms0; 2; 4; 6; 8
Throttle%8, 14, 19, 27, 36
Disclaimer/Publisher’s Note: The statements, opinions and data contained in all publications are solely those of the individual author(s) and contributor(s) and not of MDPI and/or the editor(s). MDPI and/or the editor(s) disclaim responsibility for any injury to people or property resulting from any ideas, methods, instructions or products referred to in the content.

