Article

Corrosion Assessment in Reinforced Concrete Structures by Means of Embedded Sensors and Multivariate Analysis—Part 2: Implementation

by
Josep Ramon Lliso-Ferrando
1,2,*,
Ana Martínez-Ibernón
1,2,
José Enrique Ramón-Zamora
3 and
José Manuel Gandía-Romero
1,2
1
Research Institute for Molecular Recognition and Technological Development (IDM), Universitat Politècnica de València, Camino de Vera, s/n., 46022 Valencia, Spain
2
Department of Architectural Constructions, School of Architecture, Universitat Politècnica de València, Camino de Vera, s/n., 46022 Valencia, Spain
3
Instituto de Ciencias de la Construcción Eduardo Torroja, CSIC, c/Serrano Galvache, 4, 28002 Madrid, Spain
*
Author to whom correspondence should be addressed.
Appl. Sci. 2024, 14(19), 9002; https://doi.org/10.3390/app14199002 (registering DOI)
Submission received: 15 September 2024 / Revised: 26 September 2024 / Accepted: 30 September 2024 / Published: 6 October 2024
(This article belongs to the Section Mechanical Engineering)

Abstract

:
The economic cost of repairing corrosion-affected reinforced concrete structures (RCSs) means that reliable and accurate assessment and early detection methods must be sought after. Conventional techniques, such as visual inspections, or measuring either cover layer resistivity or the corrosion potential, are methods that require accessibility and involve personnel having to travel to take in situ measurements. Monitoring by embedded sensors is a much more efficient approach that allows early detection by remote sensing. This work presents the implementation of a new measurement protocol regarding the existing monitoring system called INESSCOM (Integrated Sensor Network for Smart Corrosion Monitoring). Along with the corrosion intensity measurement in embedded sensors, it also proposes monitoring the double layer capacity of the sensors’ responses. It aims to determine, along with the rebars’ corrosion rate, the triggering agent of the corrosion process. This study was carried out using three reinforced concrete scaled columns that were exposed to different environments. The results demonstrate with this new protocol that the remote INESSCOM monitoring system can establish the corrosion rate and identify the precursor agent of corrosion (carbonation or chlorides), even when the recorded corrosion rates are similar.

1. Introduction

The corrosion assessment in reinforced concrete structures (RCSs) is one of the greatest challenges faced by civil engineering today. Most developed countries invest huge amounts of money in repairing civil infrastructures, e.g., corrosion-affected RCSs [1,2,3]. Accurately quantifying their economic impact is difficult because both direct costs (e.g., repairs, rehabilitation, reconstruction, and materials or resources) and indirect costs (e.g., operating losses related to immobilisation of structures or aesthetic damages) must be taken into account to define the real cost [4,5,6]. The latest data refer to a total corrosion cost of around 3–4% of the GDP on average in industrialised countries [7,8,9,10,11], where corrosion in RCSs contributes to most of this percentage. For example, in 2016, a direct cost was estimated of some USD 40–50 thousand million in the USA [12]. Some authors have anticipated that these costs will increase in forthcoming years because a large number of corrosion-affected RCSs need to be repaired [13].
One of the main reasons for the high economic cost invested in repairing these constructions is because corrosion is detected late. Rebar corrosion is a spontaneous thermodynamic process that occurs because of steel metallurgic properties [14]. Under the high alkalinity conditions of concrete’s porous solution, corrosion is negligible because a layer of oxides, known as the passive layer, forms on rebars and protects metal [15,16,17,18]. Tuutti defined this scenario as an initiation stage, a period during which rebar corrosion may be considered negligible [19]. Nonetheless, two typical situations can trigger rebar corrosion [20]: (1) concrete carbonation, which corresponds to inward carbon dioxide penetration and leads the passive layer of rebars to dissolve and then to generalised corrosion [21,22,23]; or (2), chloride diffusion to rebars, which will trigger localised corrosion or pitting corrosion [24,25,26,27]. In the second scenario, defined by Tuutti as the propagation period [19], corrosion can no longer be considered negligible. It is in this second stage when the rebar corrosion rate progressively rises, which dissolves metal and generates products with higher specific volume than the original ones [28,29]. The accumulation of such oxides will bring about internal stresses in the concrete cover and will trigger the appearance of not only rust stains on the surface, but also cracks and concrete cover spalling once the damage is quite advanced [30,31].
Today, the assessment and maintenance routines performed in RCSs are based on visual inspections [32]. However, these works involve qualified personnel who have to travel and who are only limited to accessible elements, which, in turn, limits such practises being applied and renders such tasks inefficient. Some authors point out that it is also necessary to include non-destructive methods when assessing the corrosion condition of RCSs, such as corrosion potential measurements or cover layer resistivity analysis [32]. Nonetheless, these are qualitative corrosion measurements that do not actually allow us to know rebar corrosion intensity; instead, they establish a range for the risk of existing corrosion. Moreover, they are only applicable to accessible elements. All these drawbacks demonstrate that they are an inadequate strategy for structural monitoring and management [33]. Conversely, using embedded corrosion sensors for remote sensing is a much more rational approach. This strategy centres on generating indicators to detect corrosion early to reduce costs and to optimise time while performing RCS inspection and assessment tasks [3]. Such sensors make the complicated nature of present-day methods simple, avoid travelling, and allow even inaccessible structural elements to be analysed. Several authors have pointed out that, in forthcoming years, corrosion monitoring systems for remote sensing will play a key role in maintenance, assessment, and life prediction by providing quantitative information about the condition of rebars when embedded in concrete [34].
There are presently many examples of embedded sensors that can be used to determine RCS corrosion. Some of them, such as fibre optic sensors, allow us to qualitatively know the state that rebars are in [35,36,37]. Other examples are those that focus on determining if aggressive agents are present, such as those made up of Functional Magnetic Materials (FMMs) [38]. Nevertheless, the most efficient ones are capable of providing real data about the corrosion rate of rebars embedded in concrete [39,40]. These systems are based on an inserted sensor and are being applied to electrochemical measurement techniques [41]. The biggest drawback of this last group is that most of them have been validated in a laboratory, and very few have actually been implemented in real cases because there are still different challenges to be overcome [33]: the possibility of being implemented in both new and already existing structures; they must be autonomous and reliable systems; they must have a low cost; and their service life must be longer than that of the structure where they are to be implemented [33,42,43]. One of the examples that is able to overcome these drawbacks is the monitoring system named INESSCOM (Integrated Sensor Network for Smart Corrosion Monitoring) and developed by the authors of [44,45,46]. Despite being a remote sensing system already used in real structures [44,46], the authors are still working on improving it. Part 1 of this work proposed implementing a new measurement protocol in an existing monitoring system to determine double layer capacity [33]. The obtained results demonstrated that, in this way, it is possible to determine not only the corrosion intensity of embedded rebars, but also the triggering agent of the corrosion process, even when the recorded corrosion kinetics are similar [33]. This is actually a major contribution to this field because the information acquired by this monitoring system will allow intervention or repair strategies to be defined that will neither require supplementary testing nor involve having to make inspections or performing tasks in situ. All this will significantly reduce the costs of having to do repair work of corrosion-affected RCSs.
In Part 1 of this work, the designed measurement protocol (corrosion rate and double layer capacity) was validated in a laboratory as implemented in INESSCOM. This took place on reinforced concrete proves with embedded sensors [33]. The test specimens were exposed to different environments and, by applying the established protocol, it was possible to measure rebar corrosion rate and to determine the precursor agent of corrosion. The objective of this Part 2 is to demonstrate its suitability in a real case by monitoring structural elements exposed to distinct environments. To do so, first a brief description of the INESSCOM system is provided and the new implemented measurement system is defined. Second, a monitoring experimental plan is presented, which was carried out with this tool on three scaled columns exposed to different environments. For 4 months, the monitoring of the corrosion and double layer capacity of several sensors embedded in different zones of the test specimens was carried out. The results demonstrate the reliability with which the proposed protocol (>95%) can be applied to analyse corrosion and to identify the precursor agent of this phenomenon.

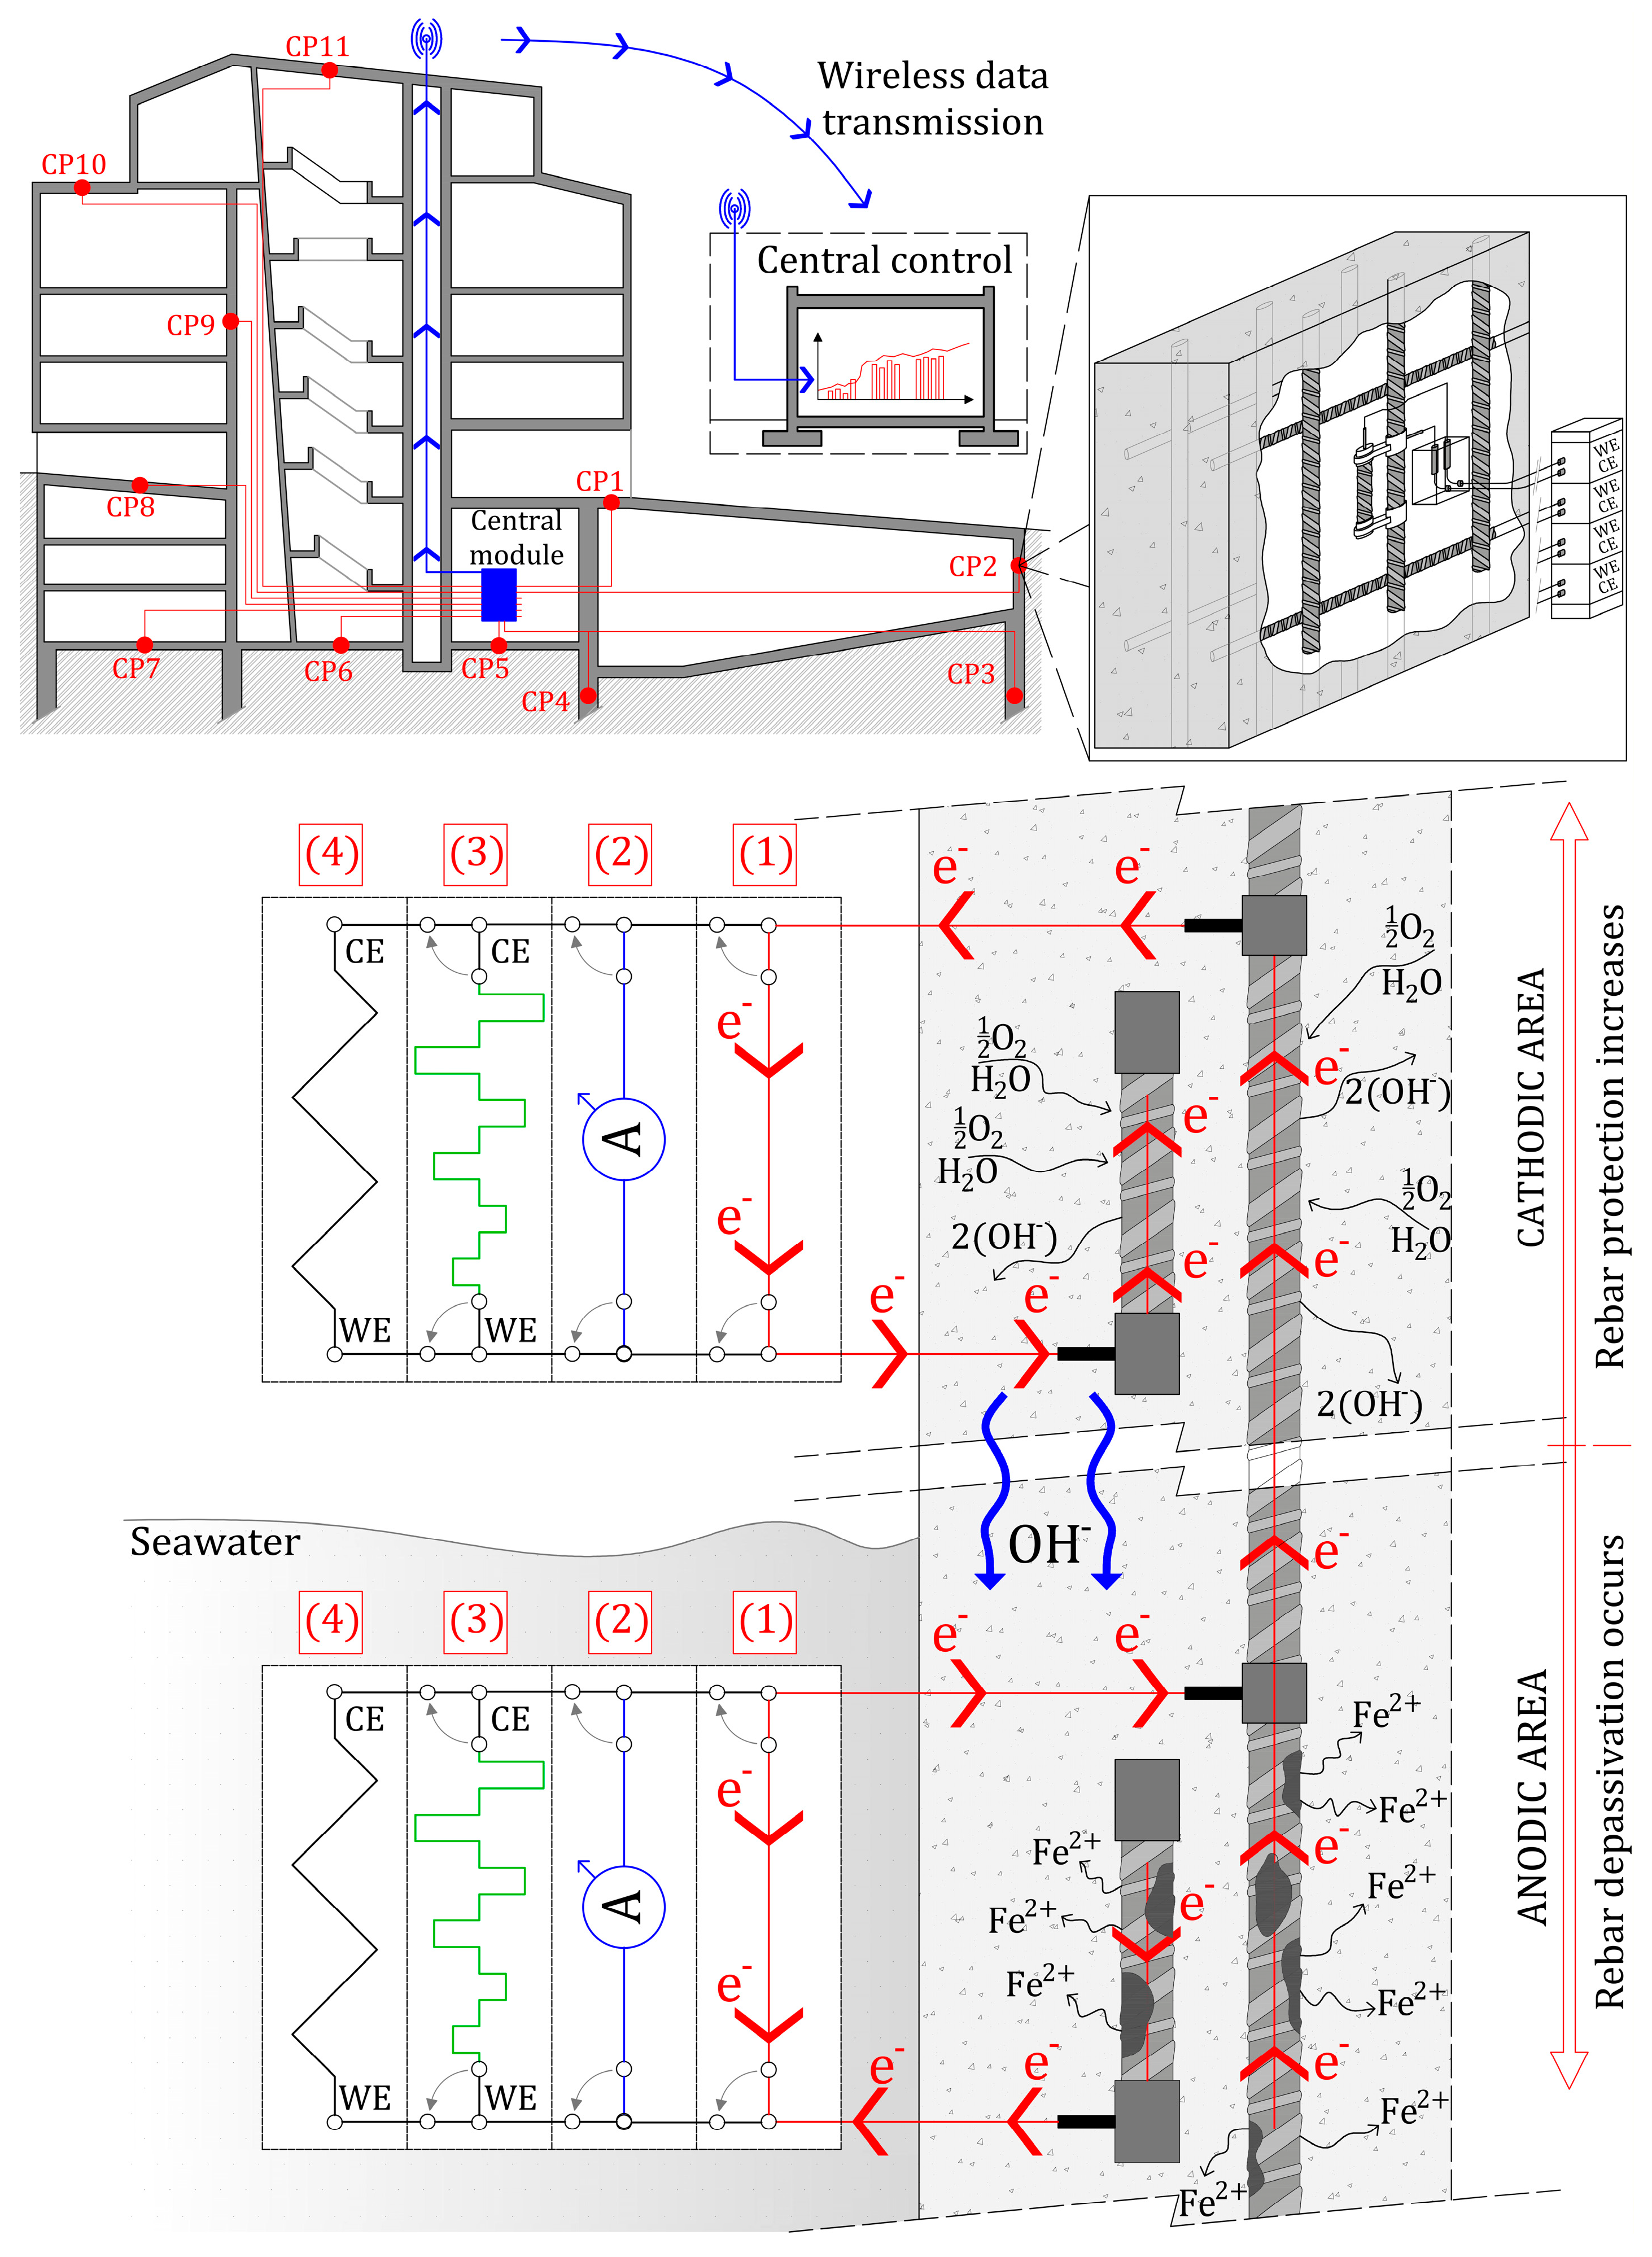
2. Background: The INESSCOM Monitoring System

Before the experimental plan is presented, the INESSCOM system and the protocol established for measuring and monitoring embedded rebar corrosion need to be presented. This tool has been presented and validated in previous works [41,44,45,46], but the authors have continued to work on improving it [41]. The system comprises a network of sensors placed in different zones of a given structure which are defined as control points (CPs), as depicted in Figure 1. At each CP, a corrosion sensor is embedded, which is made of metal with identical properties to those of the structure’s rebars, whose surface that comes into contact with concrete is known. In the insertion zone, there must be an electric connection with the closest rebar. The wiring of the sensor and rebar is led to a central module where microprocessors are placed. In electrical terms, the sensor has four positions. In the first one (Position 1), the sensor and rebar remain electrically connected, which allows the sensor to electrically participate in the macrocell processes that occur in RCSs while no measurements are taken. This is fundamental for the sensor to remain under the same conditions as the closest rebars [47]. When measurements are taken, microprocessors distinguish three positions; the first measurement to be taken is the macrocell current analysis (Position 2). In this case, it is an amperometric measurement taken to determine ( i C O R R , M A C R O ). In the measurement protocol, taking the value 3 min after measurement commences is considered to allow the measurement to stabilise. Second (Position 3), the INESSCOM system employs a novel measurement system to determine the sensor’s corrosion intensity ( i C O R R , M I C R O ). This technique, defined as PSV (Potential Step Voltammetry), has been previously validated [48,49,50] and is based on reconstructing the straight stretches of the anodic and cathodic Tafel extrapolation curves. This representation is obtained from analysing the intensity–time response ( I vs. t ) as opposed to potentiostatic-type disturbance ( E ). Moreover, its instrumentation does not require having to employ reference electrodes because the technique has been developed to be used in a two-electrode cell, where the sensor acts as the working electrode and the rebar as the pseudoreference electrode. This avoids having to resort to using reference electrodes, whose long-term reliability and stability in a measuring cell where traditional electrochemical techniques are employed have not yet been proven [51]. Furthermore, signal processing can be automated, which does away with the need to rely on humans supervising the whole process [41]. To know the sensor’s total corrosion intensity, it is necessary to bear in mind both the macrocell current and the sensor’s corrosion, i C O R R = i C O R R , M A C R O + i C O R R , M I C R O , as previous works have demonstrated [41,47] and as several authors have pointed out [3,52,53,54]. When corrosion measurements end, the INESSCOM system determines the sensors’ double layer capacity ( C D L ) by Cyclic Sweep Voltammetry (CSV), as other authors in the corrosion field have used [55,56,57], and as validated in a previous work [33]. When this last measurement has been taken, microprocessors return the sensor to Position 1 until the next measurement is taken.
When measurement ends, and thanks to the designed microprocessors, the system is capable of collecting data and transferring them to a central control so they can be viewed [44]. In this way, an autonomous protocol is generated in which the system performs the corrosion assessment and corrosion monitoring to offer a final result. This makes INESSCOM an extremely useful tool for the structural health monitoring and management sector that focuses on remotely assessing corrosion in RCSs.

3. Experimental Plan

3.1. Test Specimens

In order to conduct the study, three cylindrical columns (Ø150 mm diameter and 600 mm high) were manufactured and appear in Figure 2. The rebar of each part was composed of three continuous rebars (B 500 SD, Ø10 mm, and 550 mm long) with a 20 mm cover layer. Next to each rebar, a corrosion sensor with the same concrete cover was placed in both the bottom (lower zone, LZ) and top (upper zone, UZ) areas. These sensors were also produced with rebar B 500 SD (Ø10 mm and 50 mm long; area in contact with concrete ≈1571 mm2). Before concreting, all the rebars were wired up and the electric connection was protected with a PVC pipe filled with epoxy paint. The wires were routed to a switch box.

3.2. Materials

In order to manufacture the three columns, two different concrete types were used to generate two completely different zones and to simulate a part with a rebar part under active corrosion conditions. First, columns were concreted to a height of 150 mm with low-quality concrete (water/cement ratio (w/c) ratio of 0.8). The applied dose appears in Table 1. This dose was beyond the normative limits set for structural concrete, but it was designed intentionally to accomplish a high degree of porosity to accelerate the diffusion of aggressive agents and to obtain high corrosion levels in a short time. The employed cement was CEM I 52.5 R/SR. The concrete of one of the columns (column B) was contaminated by chlorides (35 g/L of NaCl were added to the mixing water), whereas the concrete of the other columns remained uncontaminated. Immediately after the first concreting, in a second phase, the upper parts of columns (height from 150 to 600 mm) were concreted with a higher quality concrete (w/c ratio of 0.5). In this case, CEM I 52.5 R/SR cement was used. The dose is also found in Table 1.
After concreting, the three columns were stored in a curing chamber (20 ± 2 °C and relative humidity (RH) higher than 95%) until they reached the age of 28 days. In parallel to the manufacturing of columns, for each concrete type, a series of samples was produced for concretes characterisation after 28 curing days. These tests were conducted to determine: (1) compressive strength following Standard UNE-EN 12390-3:2020 [58]; the absorption coefficient and the porosity accessible to water according to Standard UNE 83980:2014 [59]; (3) the depth of the penetration of water under pressure (Z) according to Standard UNE-EN 12390-8:2020 [60]; (4) the air permeability coefficient (Kgas) according to Standard UNE 83981:2008 [61]; (5) the non-steady-state migration coefficient (Dnssm) as set out in Standard UNE-EN 12390-18:2021 [62]; (6) concrete resistivity following UNE-EN 12390-19:2023 [63]. The number of employed samples, their geometry, the type of run test, the followed standard, and the obtained results are described in Table 2.

3.3. Exposure Conditions

At the end of the curing period, samples were taken out of the chamber and stored under laboratory conditions (23 ± 2 °C and 60% RH). One of the two columns without chloride-contaminated concrete underwent an accelerated carbonation process (column C), and the column was partially carbonated (150 mm LZ, which corresponded to the zone of that manufactured with lower quality concrete). For this purpose, casing was prepared on the first 150 mm of the column with PVC tubing (Ø180 mm), which was sealed at the perimeter of the zone that was to be contaminated. Into this space, CO2 was injected at a constant pressure of 1 atm. Based on the phenolphthalein tests and the weight control carried out on the auxiliary samples left in the casing (cylindrical specimens Ø150 mm and 100 mm high), it took 31 days to completely carbonate 35 mm (more than the concrete cover, 20 mm). Figure 3 shows the pictures of the carbonation process that was carried out and the employed system.
In this way, three columns under different conditions were used in this study:
  • Column A, where the part’s LZ was free of the aggressive agents that could generate rebar depassivation;
  • Column B, where the part’s LZ was affected by the presence of the chlorides introduced during mixing (LZ);
  • Column C, where the LZ underwent an accelerated carbonation process.
The UZ of the three columns was free of aggressive agents and made from higher quality concrete (w/c ratio of 0.5) than that of the LZ (w/c ratio of 0.8).
After curing and preparing samples, the three columns underwent a corrosion monitoring process on the 6 sensors embedded in each part (3 in the LZ and the other 3 in the UZ). This monitoring period lasted 4 months. During this period, the LZ of each column was periodically wetted with tap water, while the rest of the column remained aereated.

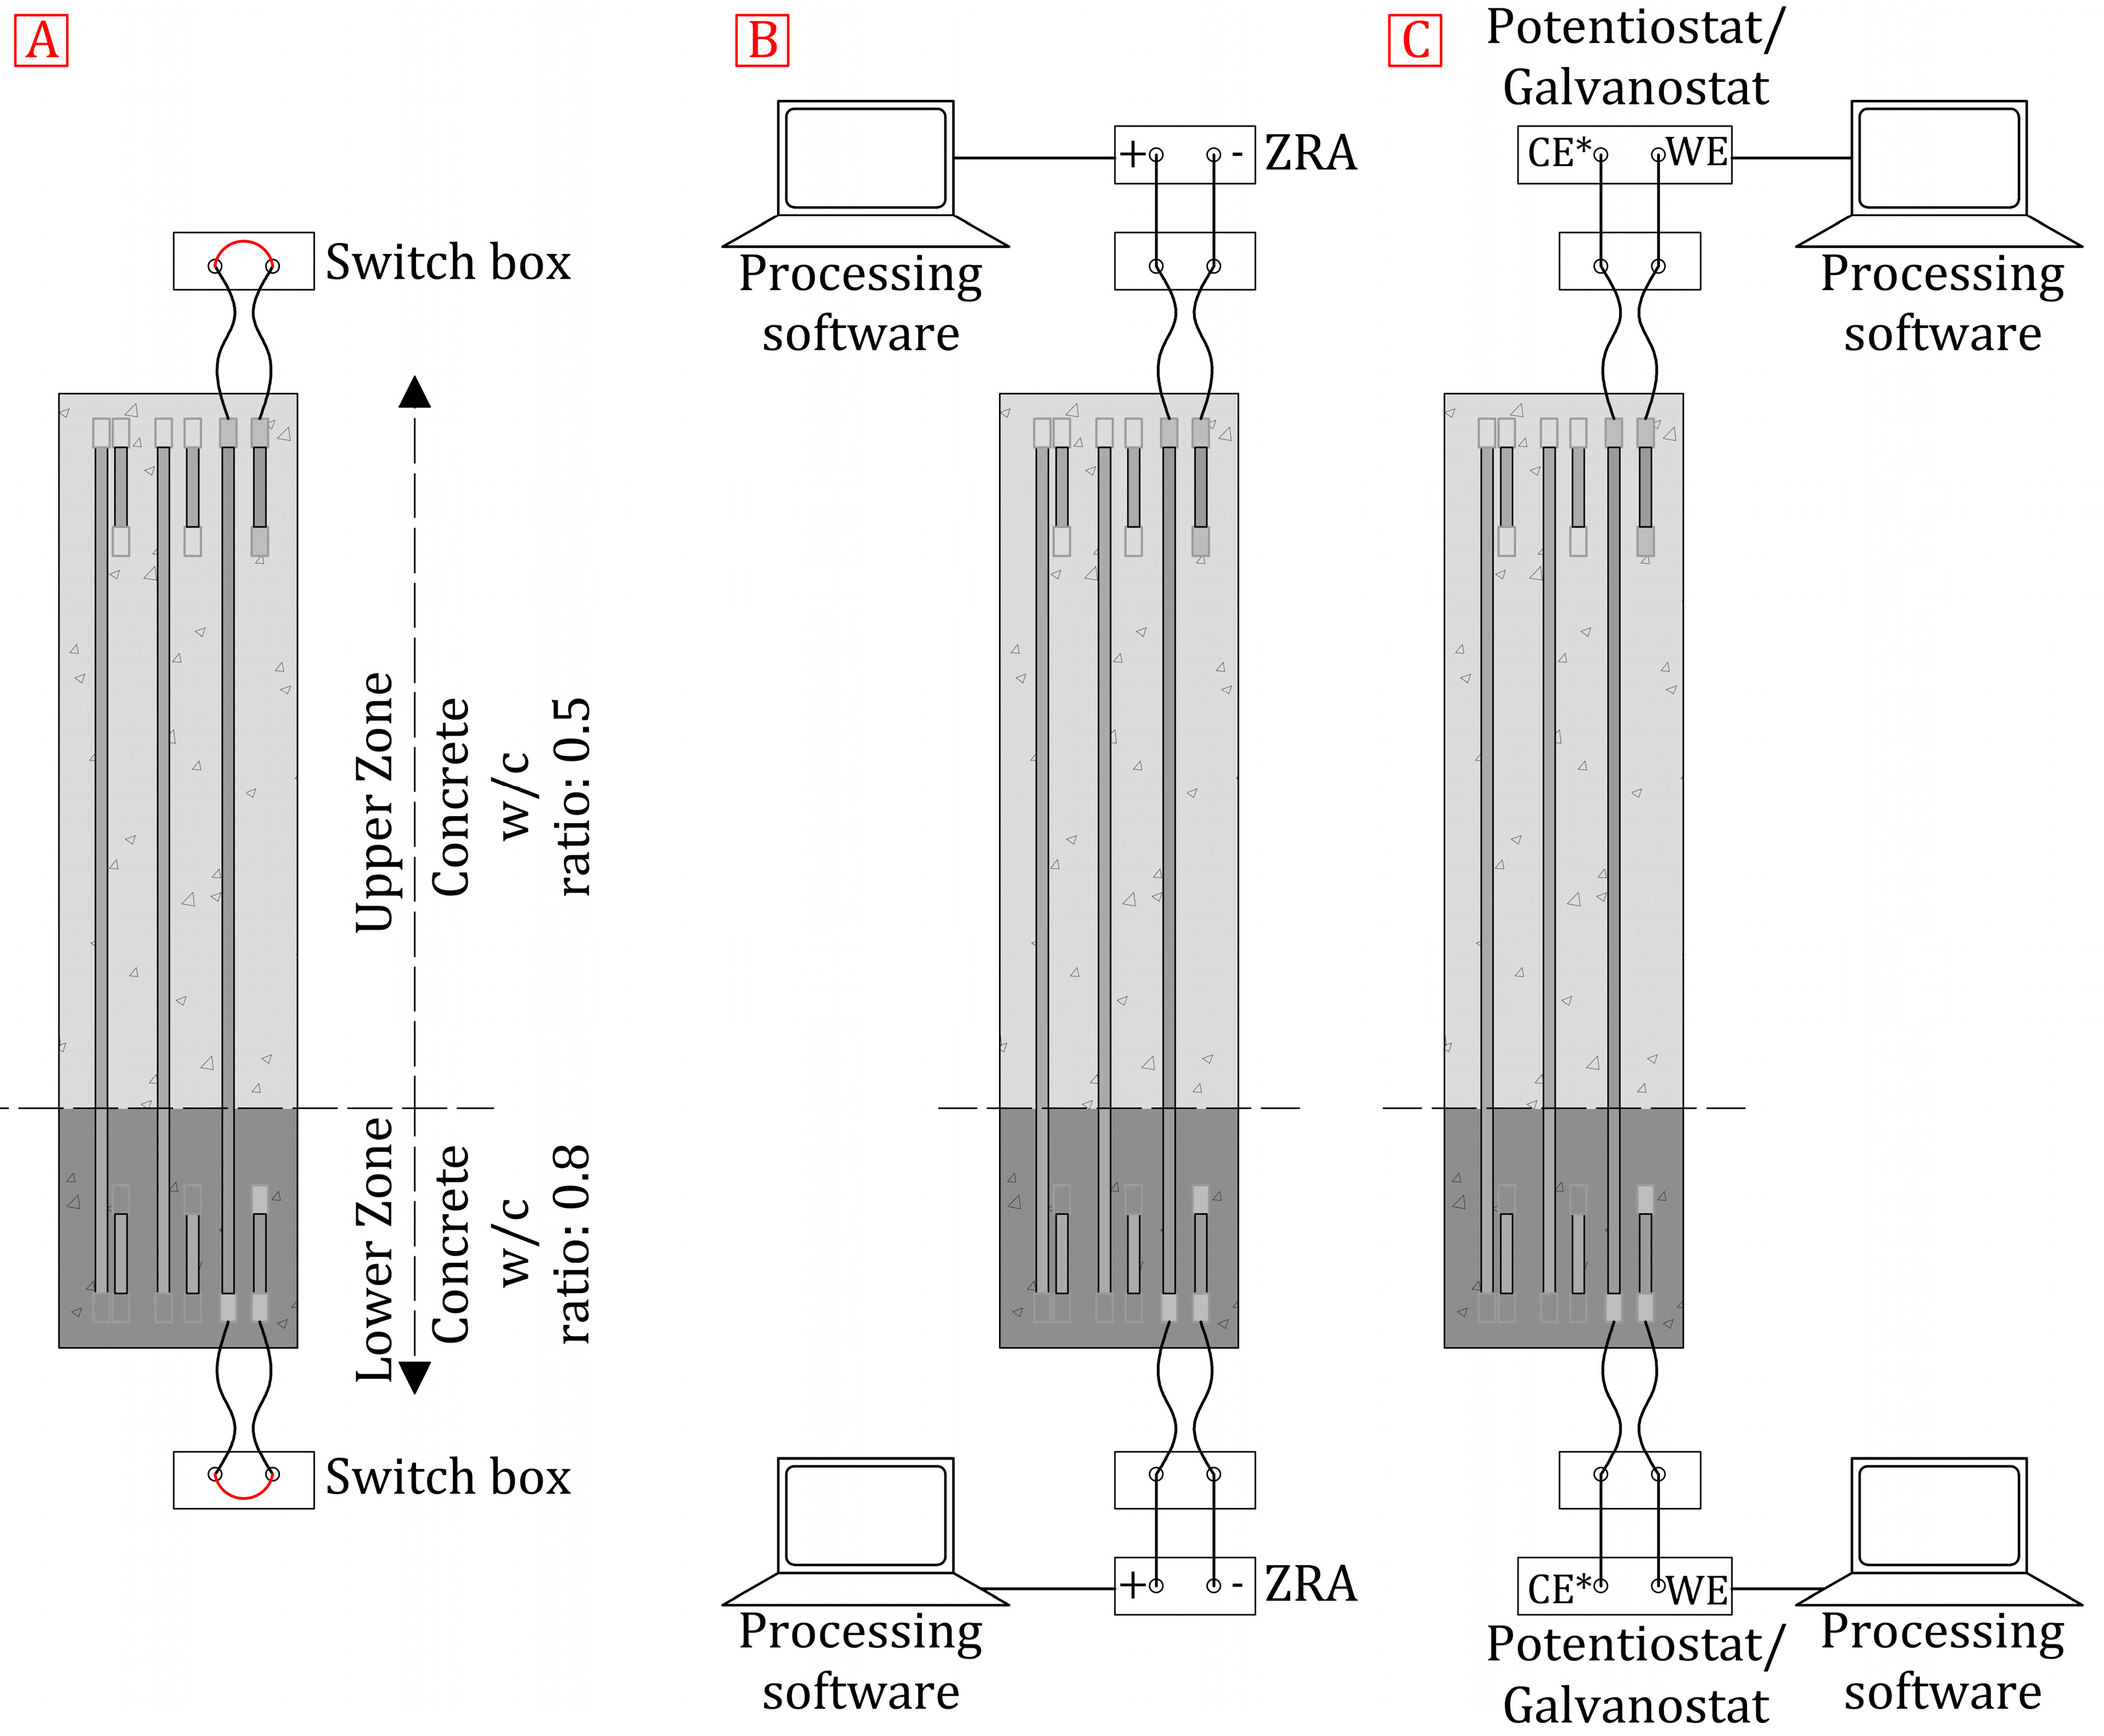
3.4. Testing Procedure

During the exposure period, each sensor was electrically connected to the column’s rebar where it was embedded, which corresponds to Position 1 of the previously described INESSCOM system (Section 2, Figure 2), presented in Figure 4A. Monitoring of the state that each sensor was in was periodically carried out following the procedure described in Section 2, which corresponds to that proposed to be implemented in the INESSCOM monitoring system. This process is summarised as follows:
  • First, the macrocell current ( i C O R R , M A C R O ) between the sensor and column reinforcement was measured by a Zero Resistance Ammeter (ZRA; Keithley 2000 Tektronix model). The value obtained for each sensor was normalised by its surface (≈1571 mm2). The value was recorded 3 min after measurements commenced to ensure that the recorded signal was stable enough. Macrocell currents were measured according to the criterion set out in Figure 4B.
  • Second, the local corrosion ( i C O R R , M I C R O ) of each sensor was determined by the Potential Step Voltammetry method. This technique, used by the INESSCOM system, has been introduced in former works and previously validated [45,46,48,49,50]. This measurement was taken with an Autolab PGSTAT 100 Potentiostat/Galvanostat, and the Nova 1.11 software was employed for signal processing. The measurement cell configuration was a 2-electrode one, as described in Section 2. The working electrode was each sensor. The three continuous rebars of each column were used as the pseudoreference (Figure 4C).
  • Third, the sensors’ double layer capacity ( C D L ) was determined from the voltammogram ( I E ) obtained after applying CSV, E C O R R ± 50 mV × 2 cycles at a sweep speed of 1 mV/s. This measurement was also taken with an Autolab PGSTAT 100 Potentiostat/Galvanostat, and the Nova 1.11 software was used for signal processing. This procedure, previously applied by other authors in the corrosion field [55,56,57], has been validated in a former work [33].
Finally, sensors were once again connected to the column’s rebar until the next measurement was to be taken. Figure 4 shows the scheme of the measurement process.

4. Results and Discussion

4.1. Monitoring Results

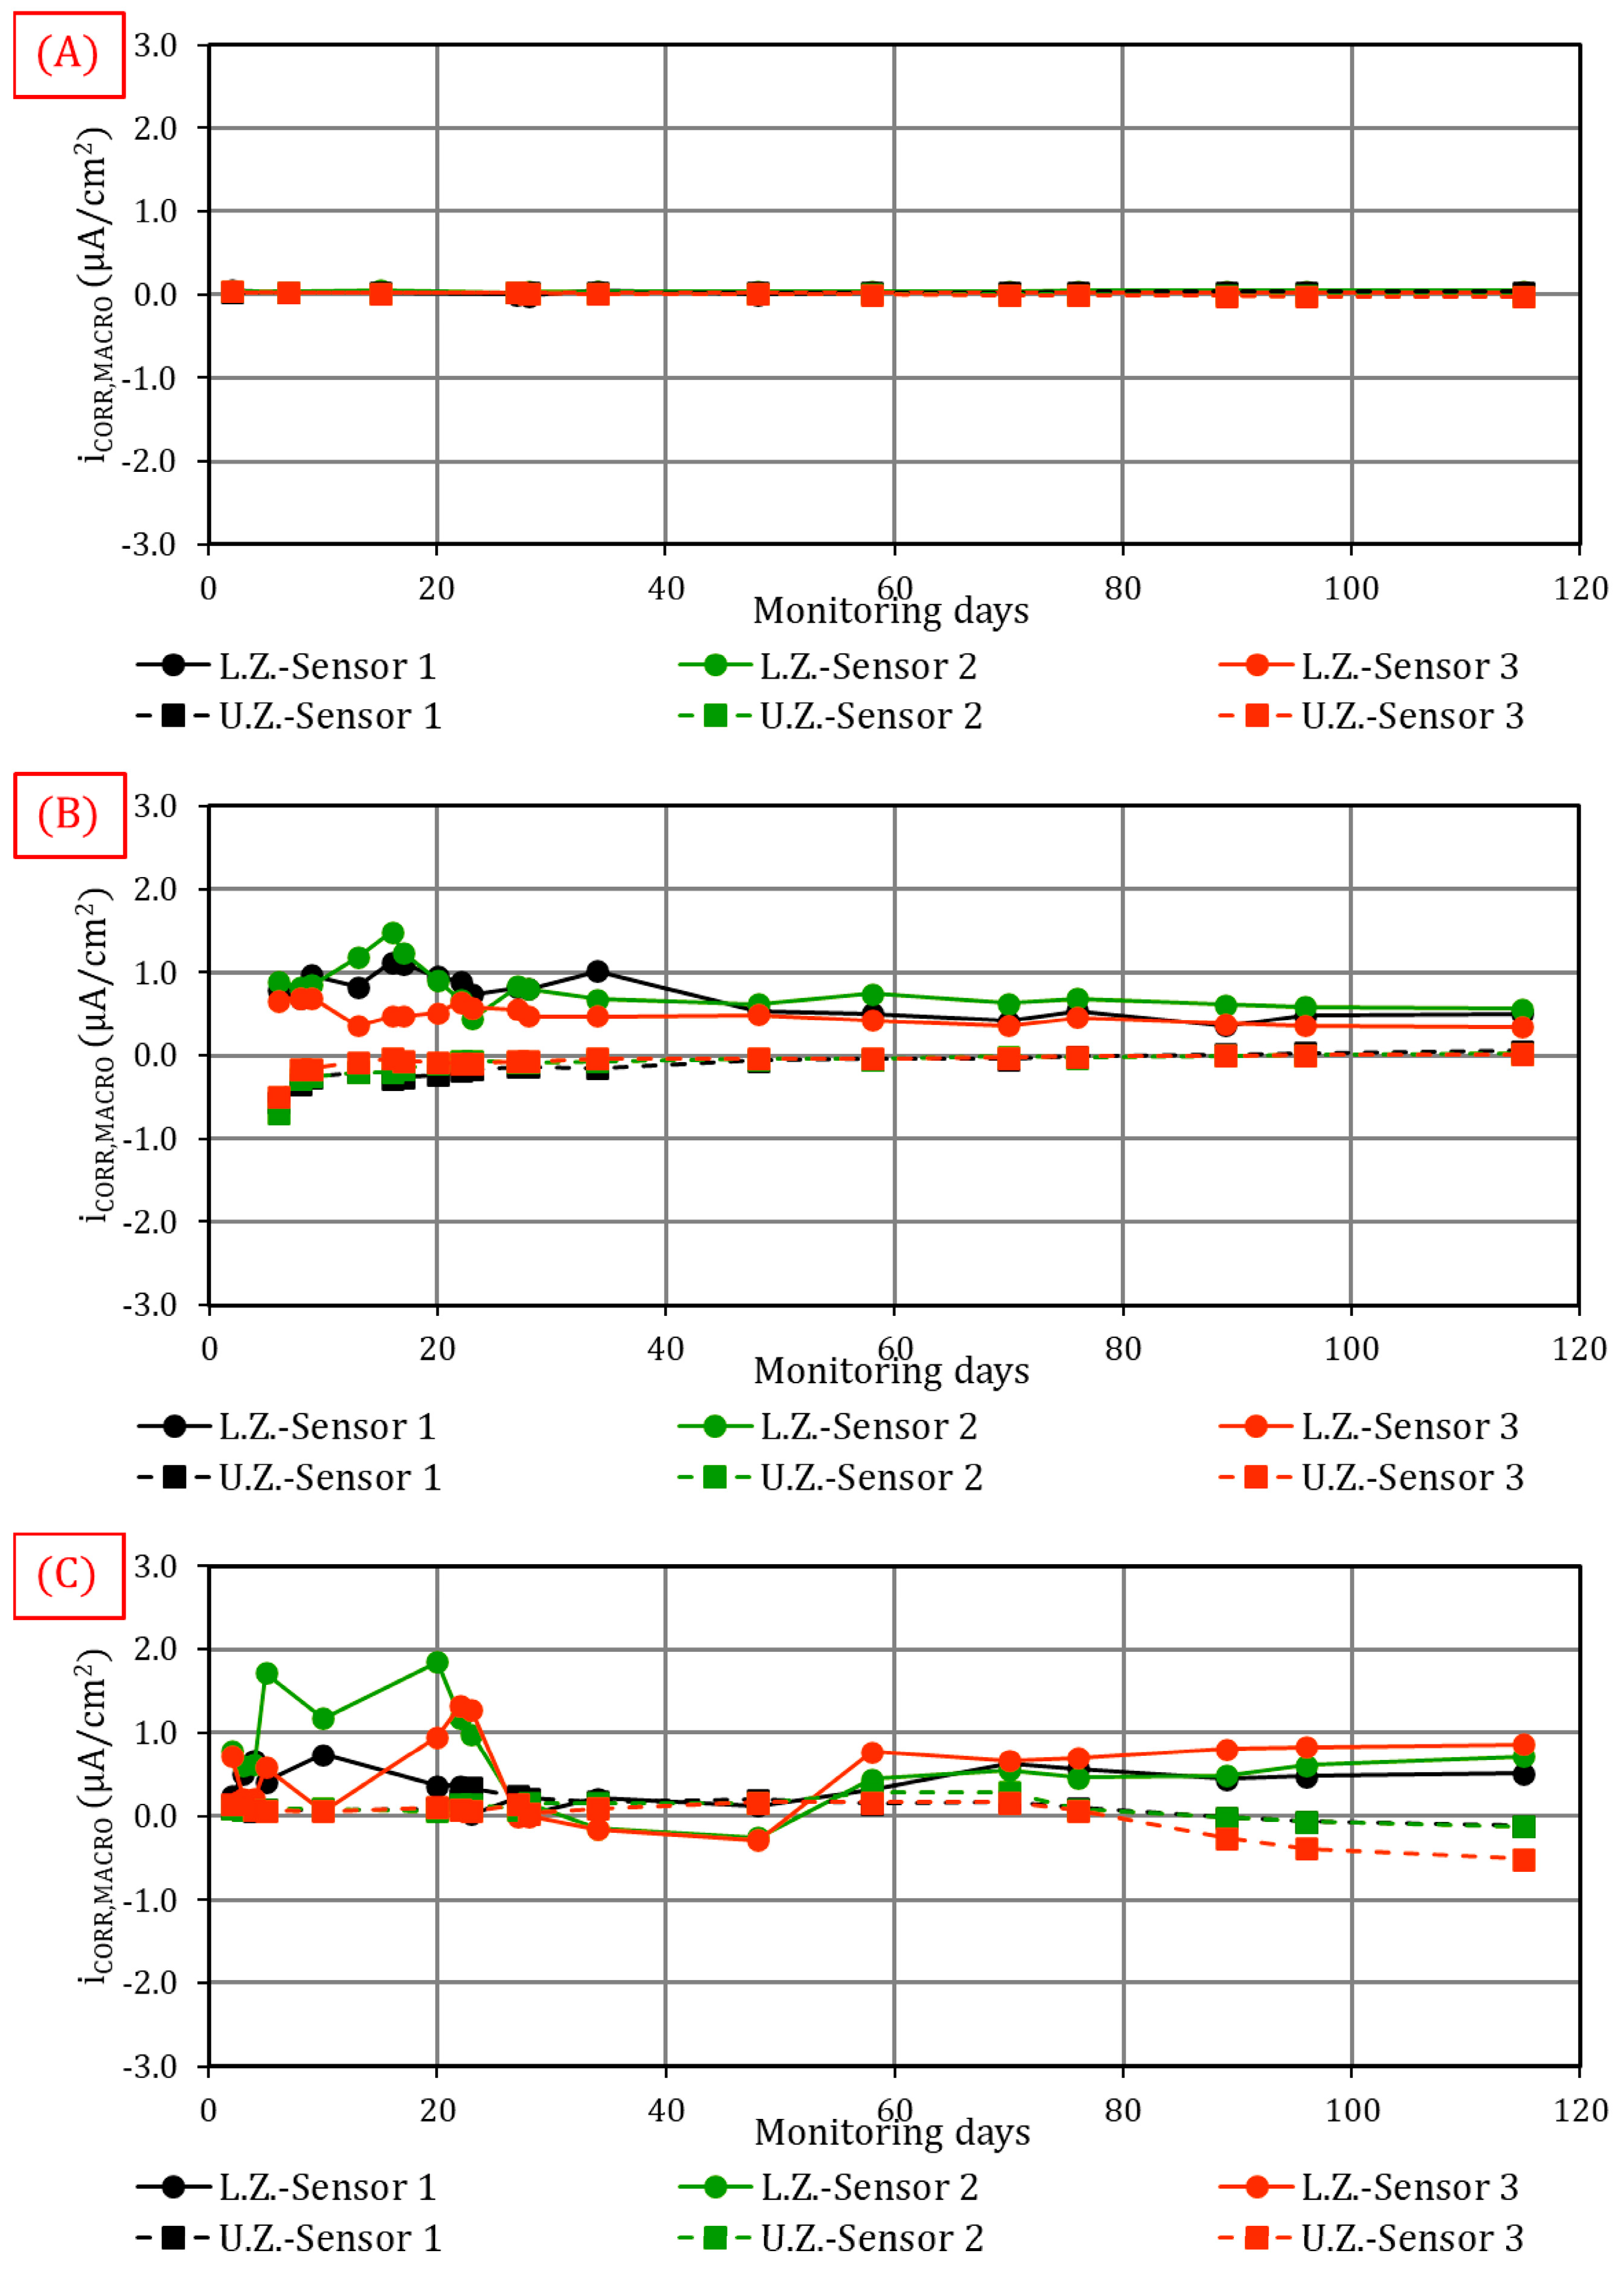
4.1.1. Macrocell Corrosion Current (iCORR,MACRO)

Macrocell corrosion currents occur when a difference exists in the potential between different rebar zones of the same reinforced concrete element. In RCSs, being exposed to differing environments means that rebars reach distinct free Gibbs energies, which induces potential gradients that produce macrocell currents. Figure 5 shows the results of following up iCORR,MACRO in the three columns: (A) free of aggressive agents; (B) the chloride-contaminated LZ; and (C) the carbonated LZ.
As revealed, for the column free of aggressive agents (Figure 5A), the intensity of macrocell currents is virtually negligible (below 0.2 µA/cm2 in all cases). In this case, lack of an aggressive agent favours potential gradients not being produced between the sensors and the column’s general rebar. This situation was left for the 4 months that monitoring lasted. Conversely, evolution in the other two columns differed.
However, differences were observed for the column whose LZ was manufactured with chloride-contaminated concrete (Figure 5B). The sensors placed in the LZ clearly displayed anodic behaviour at all times (values were 0.3–0.7 µA/cm2). The chloride ion triggered depassivation with the sensor placed in the LZ, which favoured corrosion by pitting under the thermodynamic conditions of oxygen (O2) and humidity (H2O) availability. The sensors placed in the UZ displayed cathodic behaviour, but their intensity dropped with time because humidity in the column progressively lowered for being under laboratory conditions (only the LZ was wetted).
Furthermore, differences were also seen for the column whose LZ was carbonated, although evolution was much less uniform over time with changes in polarity during the 4-month study period. In this case, the sample’s carbonation favoured generalised corrosion of the sensors placed in the LZ. Nonetheless, as the passive layer was not totally destabilised, the evolution of the macrocell currents showed much more unstable behaviour. The values obtained for such evolution were more stable after 60 days of follow-up. After this time, the sensors in the LZ behaved like net anodes with values between 0.4 and 1.0 µA/cm2.

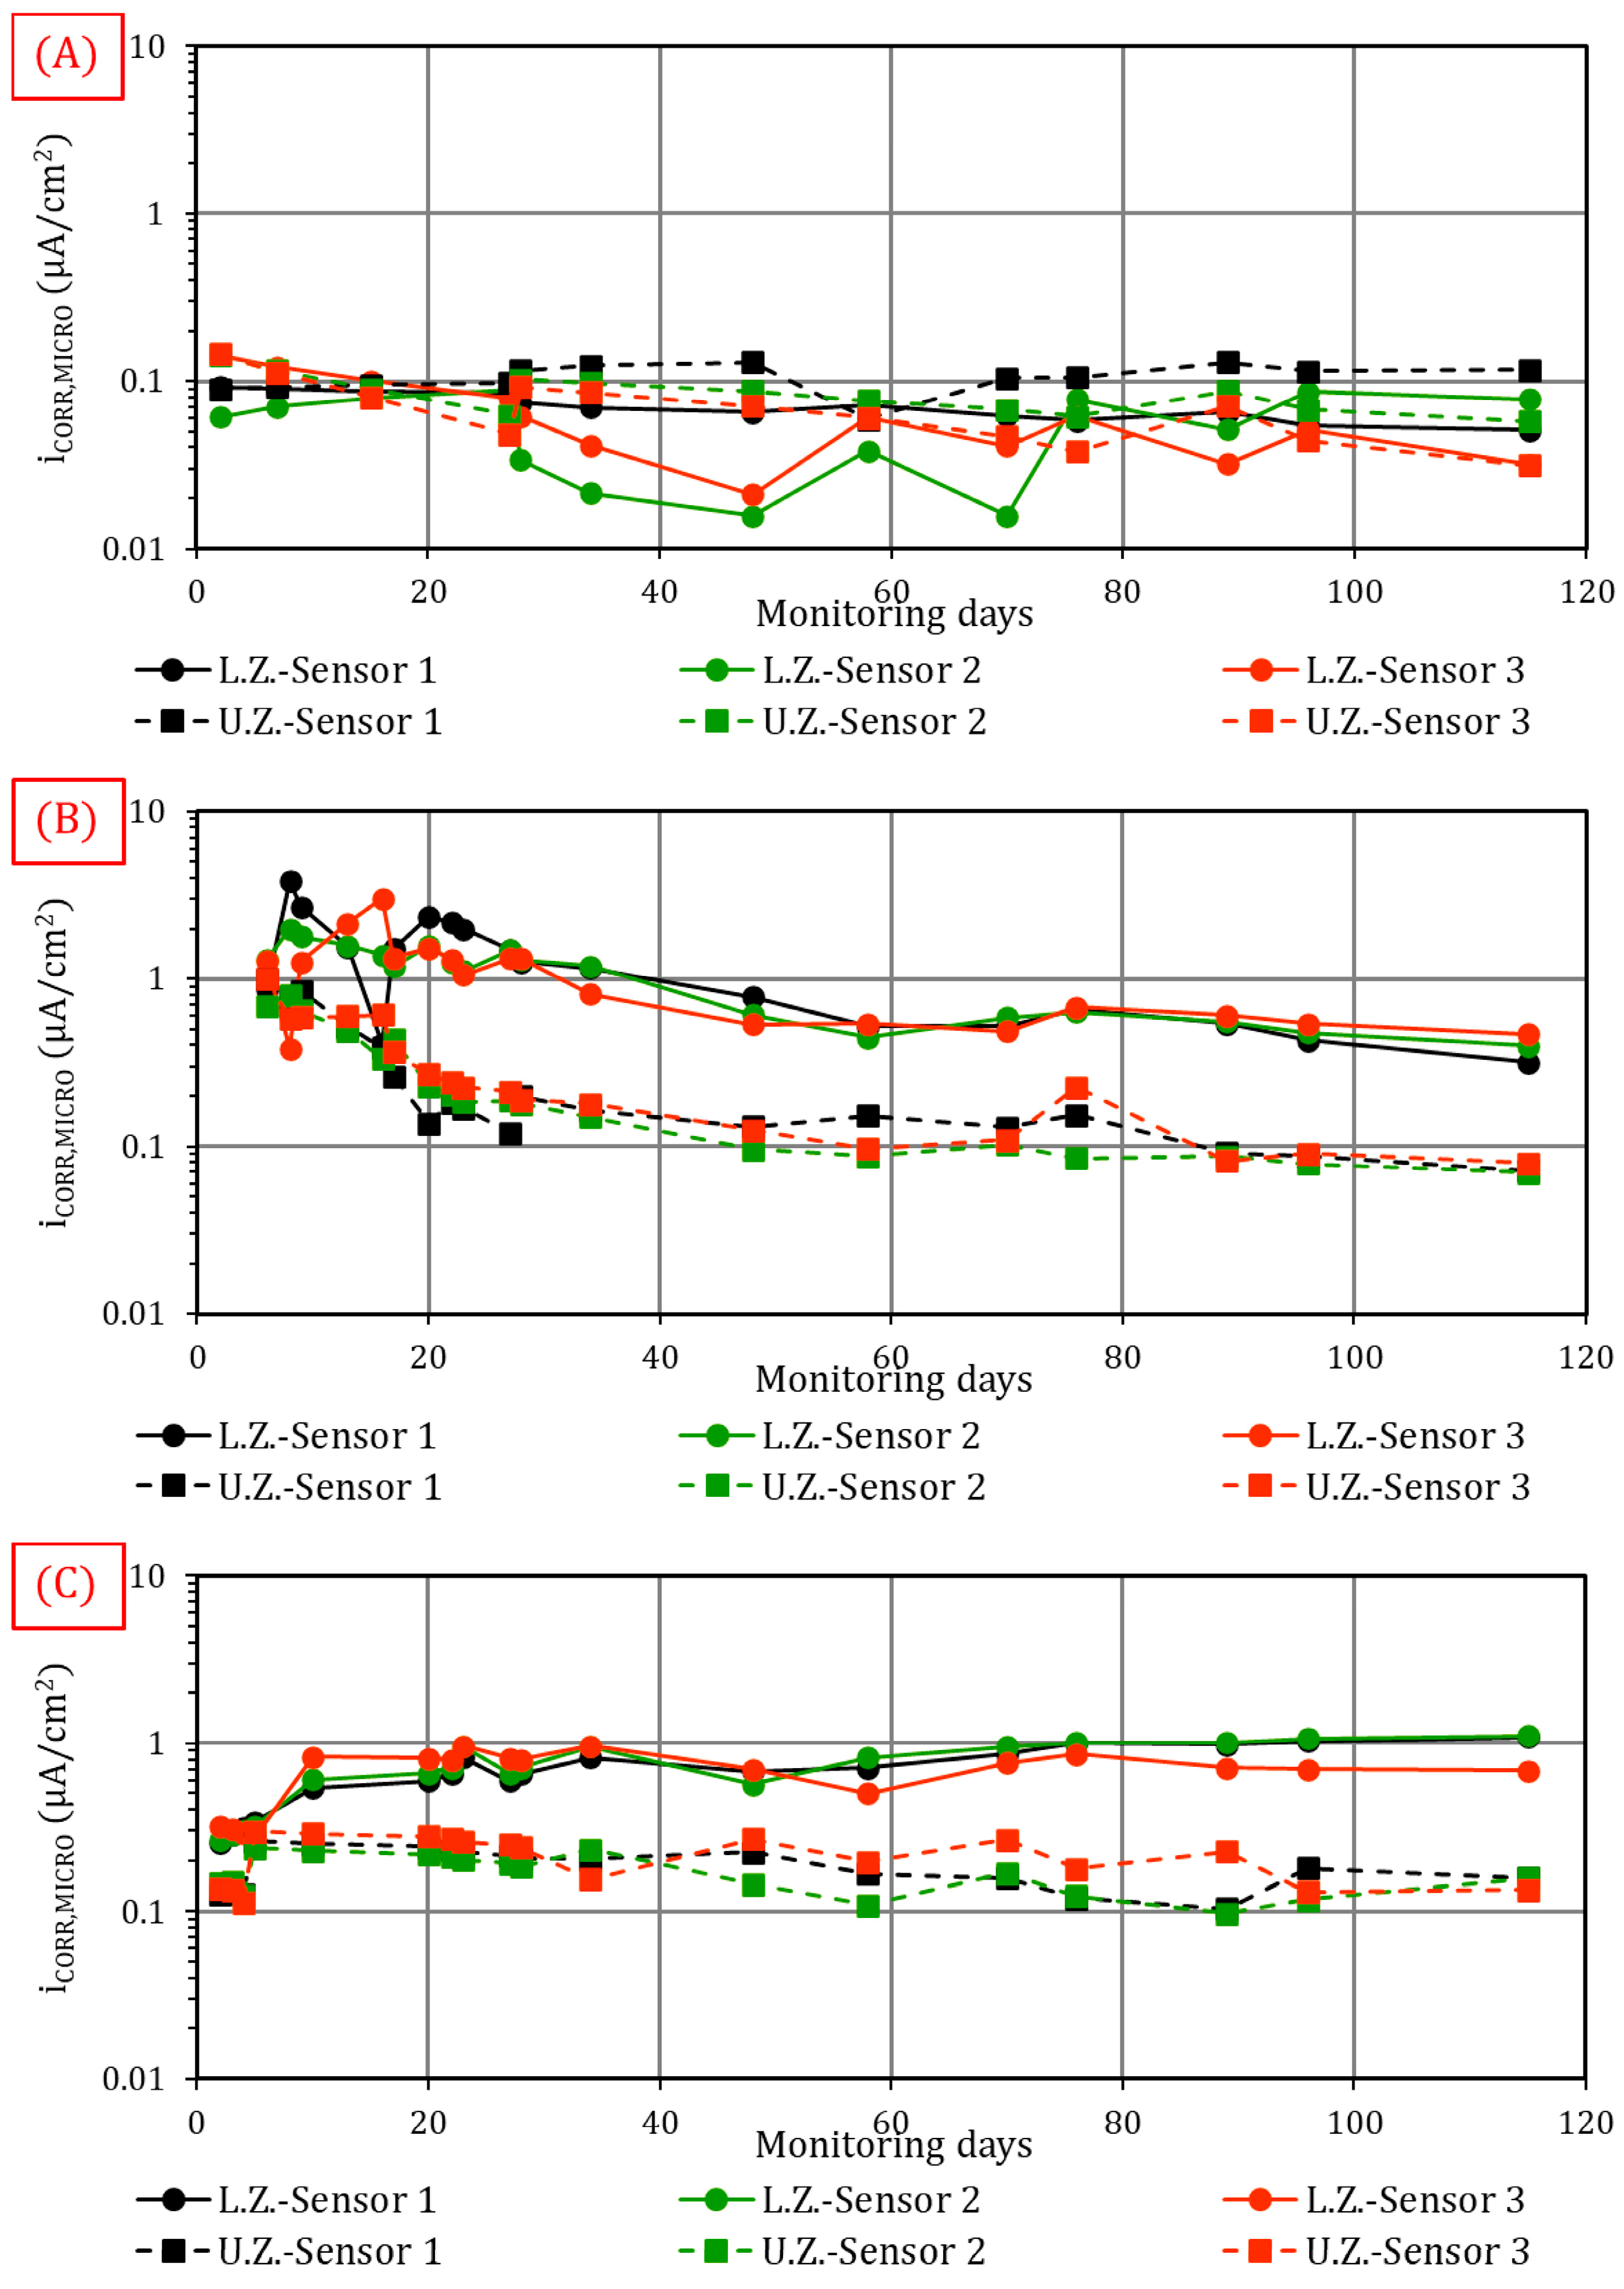
4.1.2. Microcell Corrosion Current (iCORR,MICRO)

Figure 6 shows the corrosion intensity results per microcell, which were obtained during the 4-month monitoring period.
As shown, the results reveal a similar tendency to that noted in Section 4.1.1. For the column not affected by the presence of chlorides (Figure 6A), the corrosion levels in both sensors were similar and below the threshold of 0.1 µA/cm2, set to consider if a rebar is no longer in the passive state and corrosion intensity is no longer negligible [40,64]. Conversely, the behaviour of columns B and C differed, and distinct results were obtained between the sensors in the LZ and the UZ.
For column B (with the chloride-contaminated LZ), the sensors in the UZ showed a first phase with very different results, which stabilised after the first 30–40 days and whose values were below 0.1–0.2 µA/cm2. On the contrary, the values for the sensors in the LZ were between five- and seven-fold higher, and even exceeded 0.8 µA/cm2 in some cases, which are moderate–high corrosion levels [40,64]. These data reflect the influence of including chlorides in the column zone to produce localised rebar depassivation. The presence of oxygen (high-porosity concrete, Table 2) and humidity (the LZ was periodically wetted) favoured high corrosion levels being maintained during the 4-month monitoring period.
In column C, an equally clear tendency was displayed, but it remained more stable over time. Although very different results were obtained for the first 15 days, values were high in the final study phase in the sensors placed in the LZ (sometimes above 1.0 µA/cm2), while the values for those in the UZ remained below 0.1 µA/cm2.

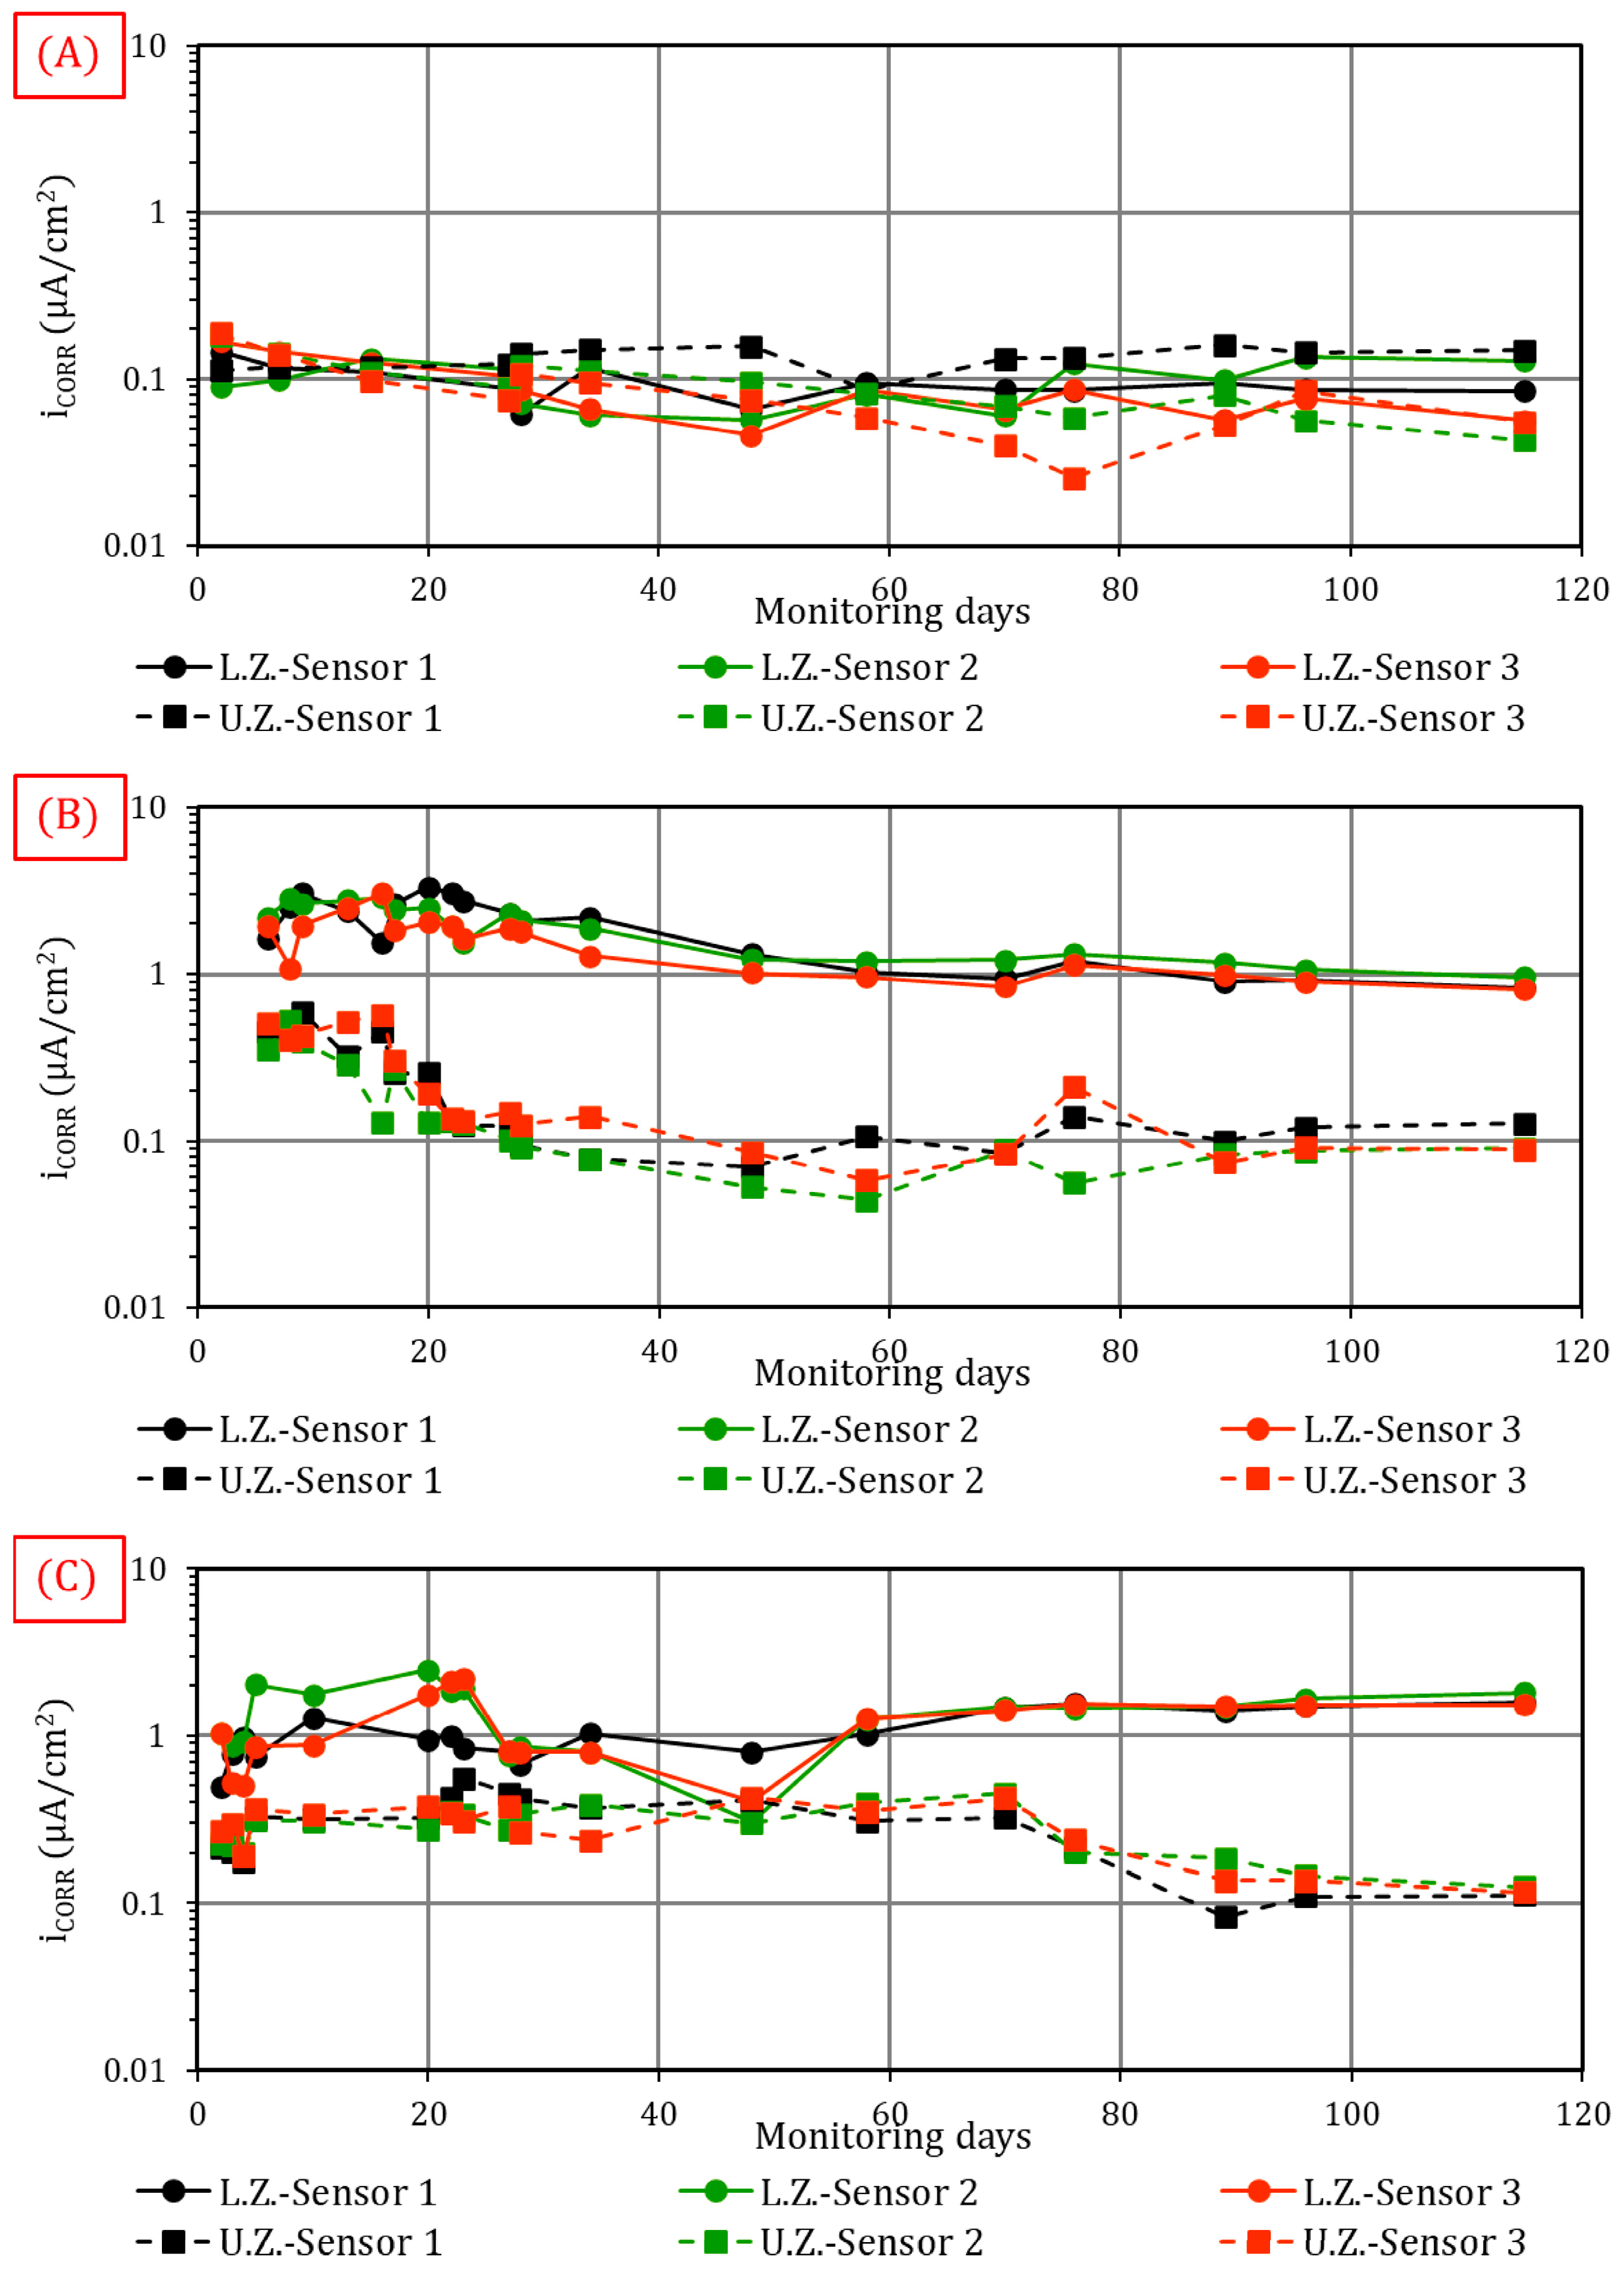
4.1.3. Corrosion (iCORR)

The corrosion rate corresponds to the sum of the two components that affect the sensor (iCORR,MACRO and iCORR,MICRO), as several authors have demonstrated [52,53,54] and as previously proven [41,47,65]. Figure 7 shows the evolution of iCORR.
These data follow the tendency of both the independently analysed components. With column A, the sensors in both the LZ and UZ still had low corrosion levels (below 0.1–0.2 µA/cm2) throughout the study. Conversely in columns B and C, the differences between the results in the UZ and the LZ grew. In this case, the anodic behaviour displayed by the sensors in the LZ favoured an increase in local corrosion intensity. Values were over 0.9–1.0 µA/cm2 in all cases and corresponded to moderate–high corrosion rates. On the contrary, the protection of the rebars in the UZ of both columns increased, which had a repercussion: the obtained total corrosion rate dropped, with values below 0.1–0.2 µA/cm2 in all cases by the end of the exposure period.

4.1.4. Double Layer Capacitance (CDL)

Figure 8 indicates the double layer capacitance values obtained during the 4-month monitoring period. These data were acquired with the new protocol implemented in the INESSCOM monitoring system based on the analysis of the sensor’s response to CSV-type disturbance.
Double layer capacitance represents the accumulation of charges at the steel–concrete interface. This parameter has been scarcely evaluated in studies into the corrosion of RCSs despite it being very interesting for the condition assessment.
Differences were observed among all three columns. For column A (free of aggressive agents in both the LZ and UZ), a constant tendency was noted in all the sensors, with values between 100 and 750 µF/cm2. Conversely with column B, the sensors placed in the LZ (chloride-contaminated concrete) obtained levels that were between two- and three-fold higher. Although values between 1500 and 2000 µF/cm2 were obtained on the first few days, they became stable as of day 40 and then remained constant until the end of the study within the 650–900 µF/cm2 range. Moreover, the sensors in the UZ (passive rebars) behaved similarly to what was found in column A, with values between 200 and 600 µF/cm2.
Despite the LZ of column C being carbonated, no differences were found in the results obtained for the sensors in both the LZ and UZ (values ranged between 100 and 900 µF/cm2). The fact that there were no differences in this parameter between the rebars with high corrosion levels and the passive rebars is aligned with corrosion type. The rebars affected by the carbonation front corroded in a uniform manner, which led to the formation of a layer of oxides on its surface. Likewise, when rebars maintained the passive layer that protected metal from corrosion, a layer of oxides also formed and covered the entire surface. This phenomenon has also been observed by other authors [55,66,67] and has been proven in former studies [33].

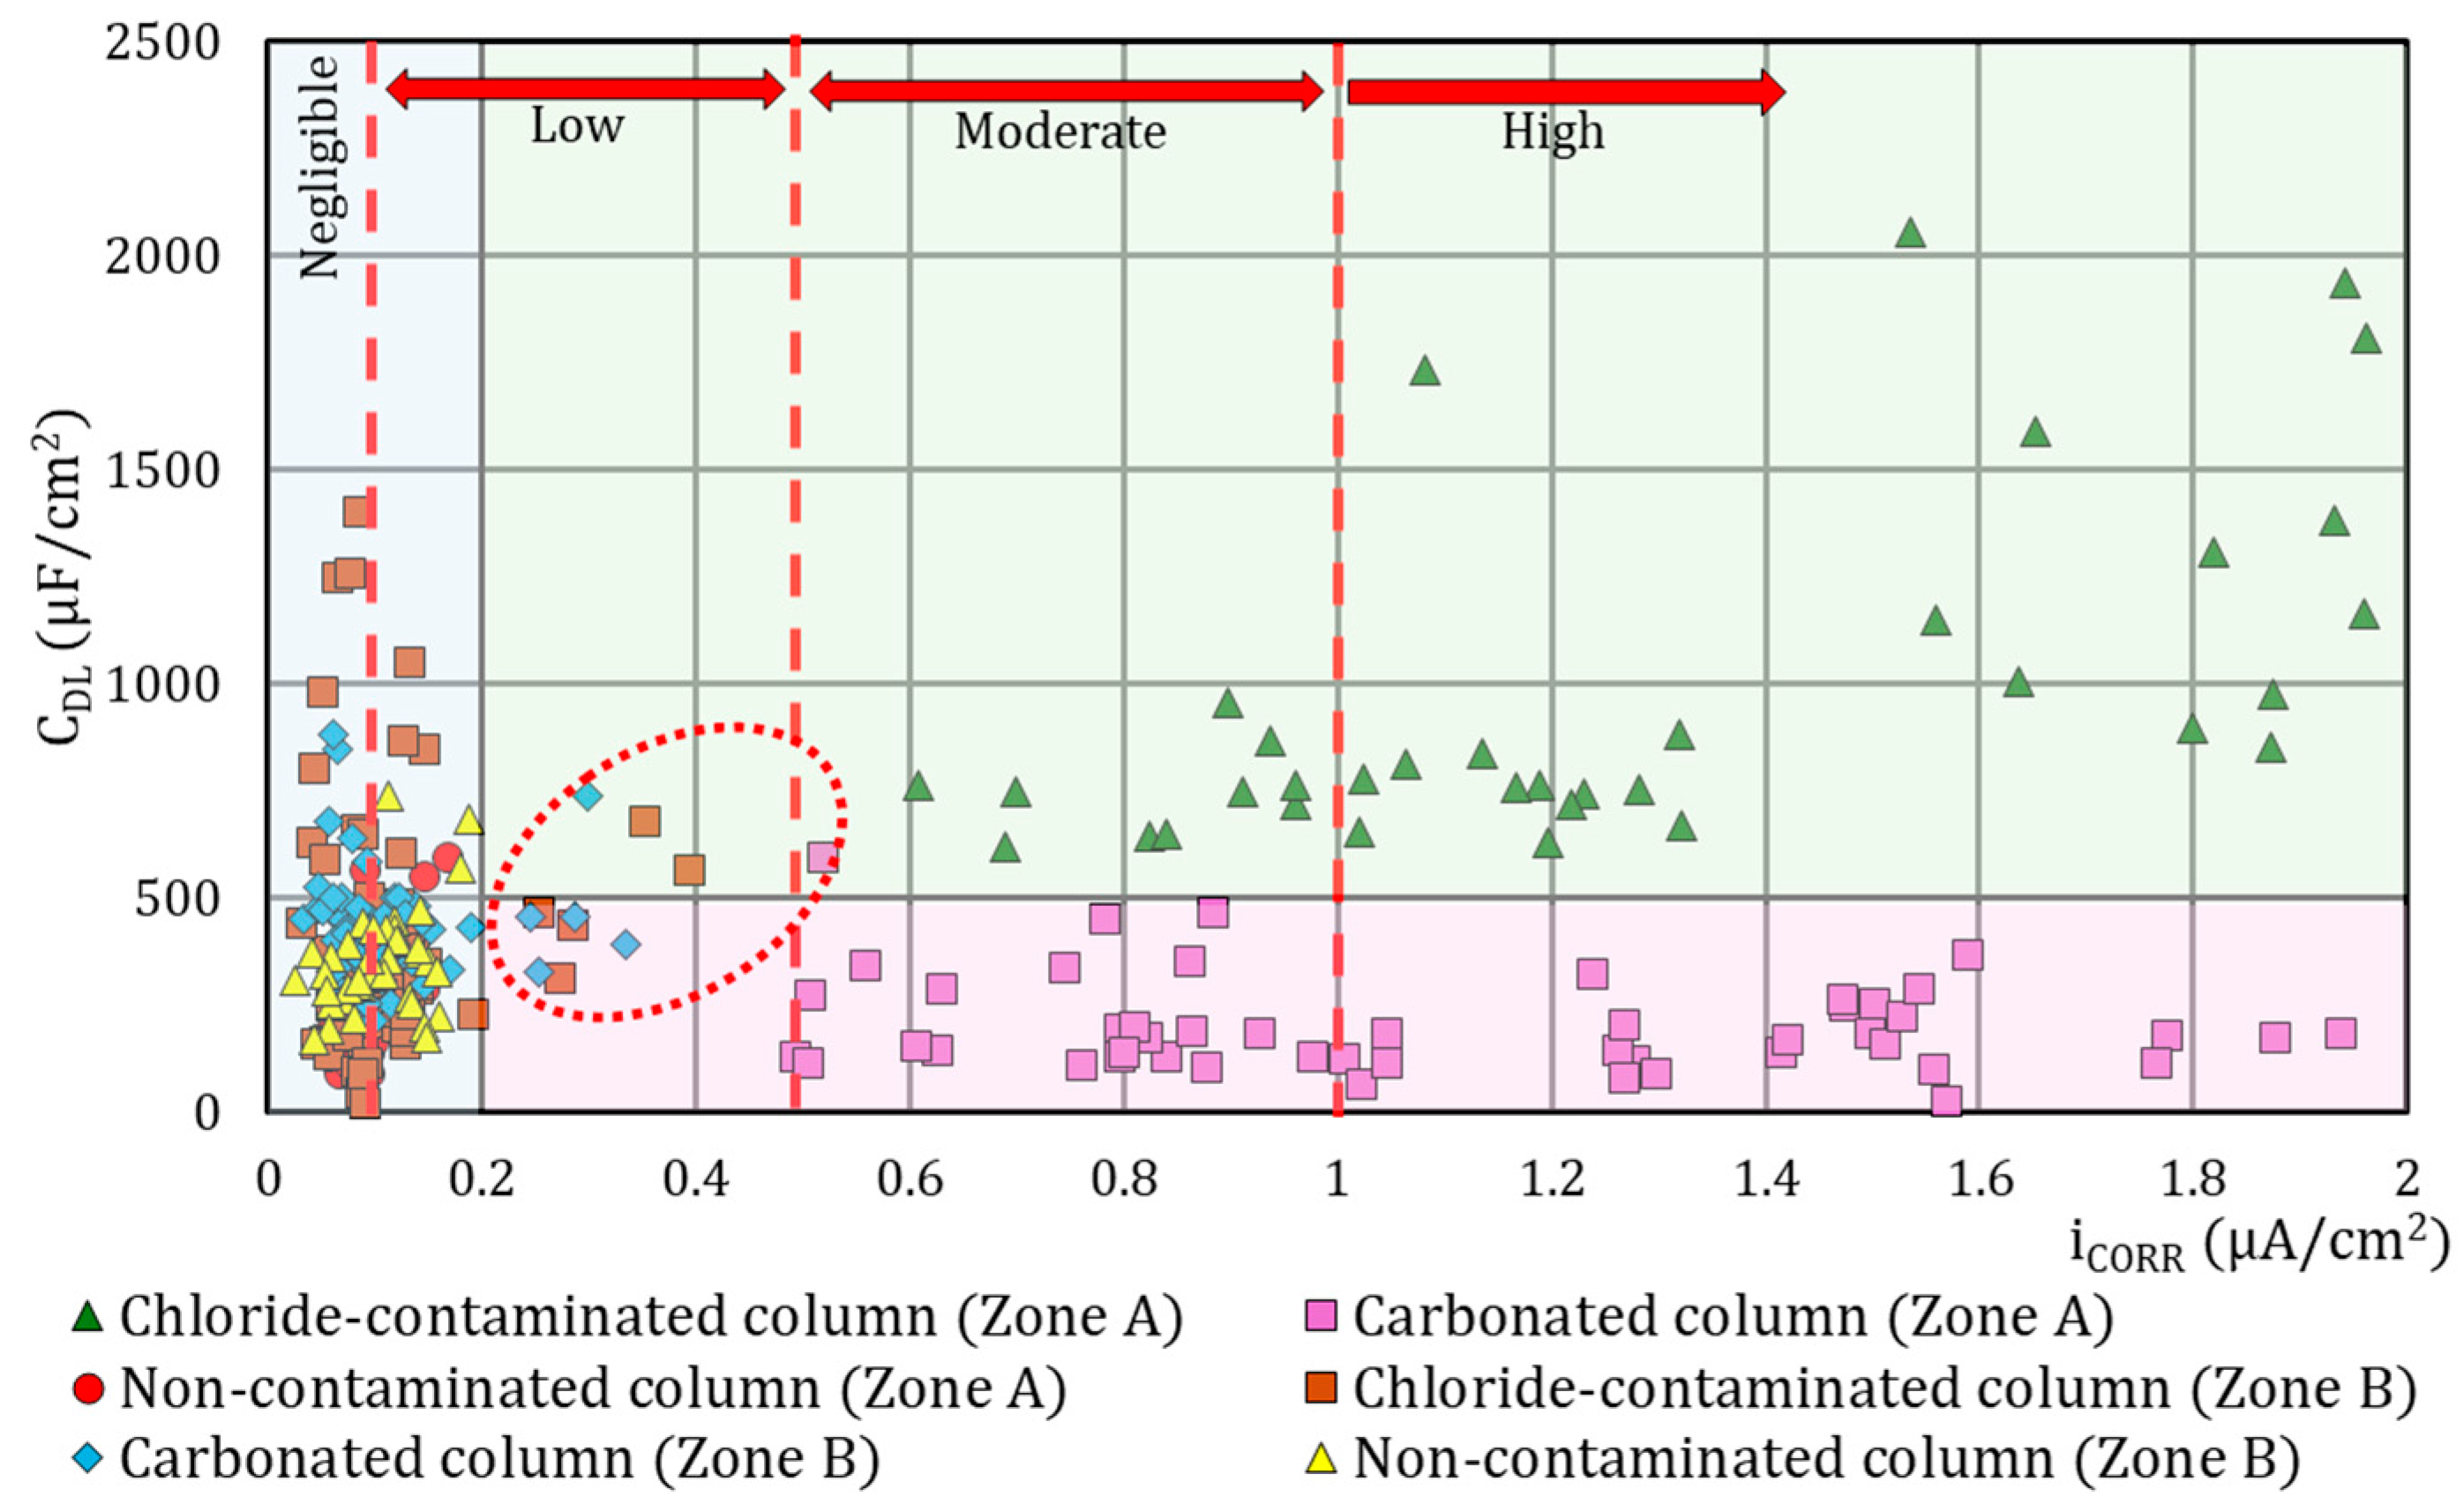
4.2. Classification Model: Degree of Corrosion vs. Attack Type
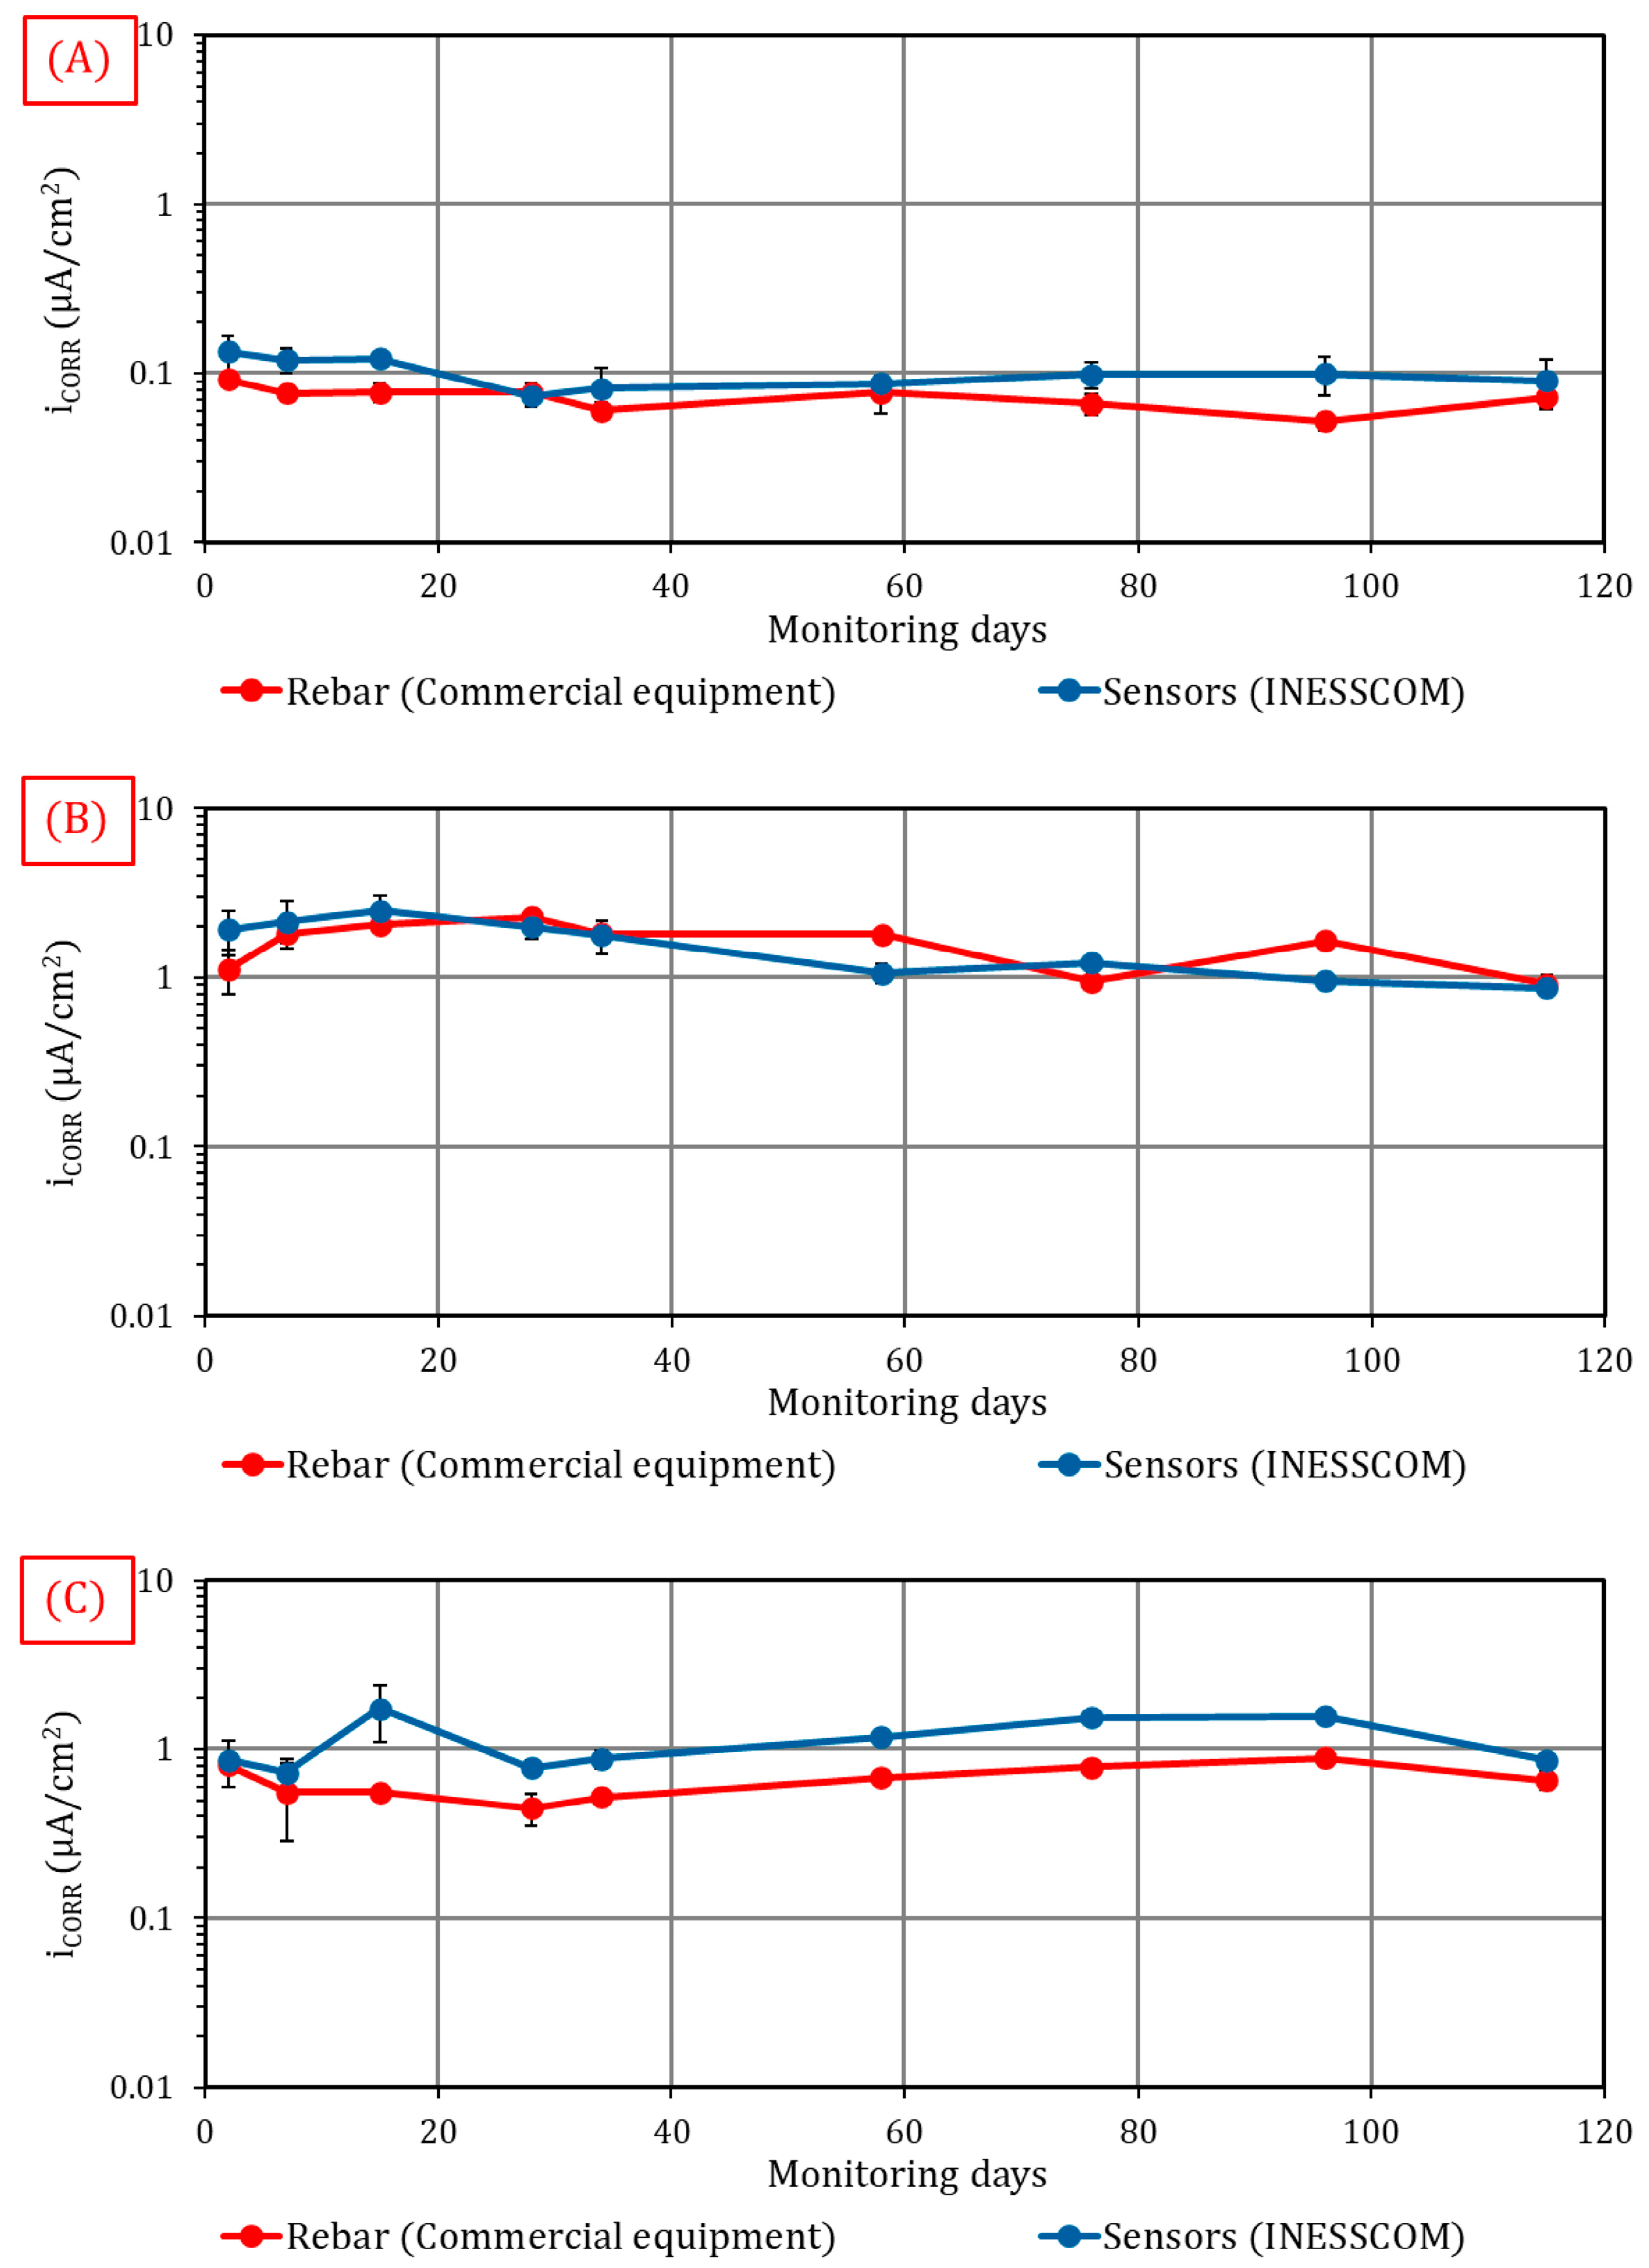
In Part 1 of this work, calibration and fitting the classification model were carried out in accordance with the degree of corrosion and double layer capacity [33]. In line with that study, and according to both parameters, it was possible to identify not only the corrosion level of a rebar embedded in concrete, but also the attack type (carbonation or chlorides) that caused corrosion. This study was performed on samples under laboratory conditions [33]. In this second work phase, the model to be implemented in the INESSCOM system was generated and validated from a study about structural elements. The objective of these tasks is, by means of such calibrating, to determine the limits of the areas where the different attacks are defined. Figure 9 shows the graph of the input of the data from the model that was derived in the first study part. Here, the objective is for the results obtained in this second work to be introduced into the model, which will allow the aggressive agent that is present, which is also the corrosion precursor to corrosion intensity and double layer capacity, to be defined.

4.3. Validation

In order to validate the model, the data collected while monitoring the three manufactured columns were used. The monitoring period lasted 4 months.

4.3.1. Validating the Capacity to Identify the Environment

Figure 10 represents the measurements taken in the sensors embedded in the three manufactured columns (300 samples in all). The clusters of samples are distributed in the graph according to the environment to which the sensor was exposed, except for the 11 samples surrounded by the dotted line. With this model, and following the protocol implemented in the INESSCOM system, it was possible to identify the different concrete conditions: no aggressive agents, carbonation, and chlorides present. The success rate was 96.4%.

4.3.2. The Probability of Classification Model Success

In order to evaluate the probability of the success of this classification model, the confidence interval (CI) was calculated for probability of population success with the 95% CI (α). In line with different authors, for this analysis, it was accepted that probability of success would be distributed as the Binomial Function [68,69,70,71]. In this case study, bearing in mind the results found in Section 4.2, there were 300 study samples and 289 accepted samples, which corresponds to an acceptance percentage ( p ^ ) of 96.3%. Moreover, the number of rejected samples was 11 out of 300, which corresponds to a rejection percentage ( q ^ ) of 3.7%.
Considering that n · p ^ = 300 · 0.963 = 288.9 > 5 and n · q ^ = 300 · 0.037 = 11.10 > 5 , it was possible for the Binomial Function, defined as B(n, p ^ ) = (300, 0.963), to come close to a Normal Distribution [72], N(n, q ^ · p ^ n ) = (300, 0.0111), in such a way that the CI can be obtained with Equation (1):
p ^ Z 2 · q ^ · p ^ n ; p ^ + Z 2 · q ^ · p ^ n
Equation (1) considers that Zα/2 = 1.96, with α/2 = 0.025 [48] by substituting the following values in Equation (1):
0.963 0.0111 ; 0.963 + 0.0111
Therefore, it can be stated that the CI for the model’s probability success was p = 0.963 ± 0.0111. This means that the real percentage of the model’s success with a 95% CI was between 95.19% and 97.41%.

4.3.3. Validating the Capacity to Estimate Degree of Corrosion

In order to validate the results obtained by the INESSCOM monitoring system, and in parallel to the measurements taken during the 4-month study period, measurements were sporadically taken of the general column rebar using commercial equipment, which is a tool based on the corrosion intensity measurement taken by a galvanostatic technique. This equipment comprises two zinc rings that act as a counterelectrode and a guard ring with outer/inner diameters of 60/30 and 100/86 mm, respectively. The Ag/AgCl reference electrode was placed at the centre of the part. The working electrode was the analysed rebar. The working surface was limited by the guard ring. Figure 11 presents part of the obtained results.
Figure 12 represents a comparison of corrosion intensity results obtained by two different methods to validate this study. On the one hand, on the ordinate axis, the corrosion intensity results obtained by the INESSCOM monitoring system (measurement performed on the sensors) are shown. On the other hand, the x-axis depicts the corrosion intensity data obtained with commercial equipment (measured on the general reinforcement of columns). As shown, the data are similar and tend to slightly overestimate the damage caused by corrosion as assessed by the monitoring system, but with a value close to 10% (Figure 12). These data corroborate the suitability of the taken measurements and suffice to validate the study data.

5. Conclusions

The results of this research work allow us to draw the following conclusions.
  • The protocol designed to be implemented in the INESSCOM monitoring system allows different parameters to be followed up, of which corrosion intensity and (iCORR) double layer capacity (CDL) are highlighted.
  • The proposed multivariate classification model (iCORR and CDL) quickly and simply allows the precursor agent of corrosion to be identified, even when corrosion kinetics are similar. The developed model simplifies the techniques used for defining classification and estimation models, commonly employed in voltammetric sensor systems. Some of these techniques, such as PCA and PLS, require advanced computational software, whereas the proposed model can be processed with simple tools like spreadsheets. This makes it easier for non-expert users to apply it and allows its more widespread use.
  • Implementing the proposed measurement protocol is simple and does not require modifying changes in technology, but merely a change in the data management of the control software. So, it can be implemented in already existing remote-testing systems.
  • The study data were validated with in situ measurement tools, with deviation close to 10% when the remote-sensing system INESSCOM was used.
The results presented in this study, along with those found in Part I, demonstrate the suitability of the modification designed to be implemented in the INESSCOM monitoring system and the repercussions that it would have on corrosion assessments of RCSs by remote sensing. The proposal improves structural corrosion monitoring through the innovative use of highly reliable voltammetric sensor systems by optimising data processing resources and employing simpler models than those typically used in these systems.

6. Patents

The work published in this manuscript has been completed thanks to tools such as INESSCOM (pantet code: ES2545669).

Author Contributions

Conceptualisation, J.R.L.-F., A.M.-I. and J.E.R.-Z.; methodology, J.R.L.-F., A.M.-I. and J.E.R.-Z.; software, A.M.-I. and J.E.R.-Z.; validation, J.R.L.-F., A.M.-I. and J.E.R.-Z.; formal analysis, J J.R.L.-F., A.M.-I. and J.E.R.-Z.; investigation, J.R.L.-F., A.M.-I. and J.E.R.-Z.; resources, J.M.G.-R.; data curation, A.M.-I. and J.E.R.-Z.; writing—original draft preparation, J J.R.L.-F., A.M.-I. and J.E.R.-Z.; writing—review and editing, J.R.L.-F., A.M.-I., J.E.R.-Z. and J.M.G.-R.; visualisation, J.R.L.-F., A.M.-I. and J.E.R.-Z.; supervision, J.M.G.-R.; project administration, J.M.G.-R.; funding acquisition, J.M.G.-R. All authors have read and agreed to the published version of the manuscript.

Funding

This research was funded by the Spanish Government, grant number PID2020-119744RB-C21 funded by MCIN/AEI/10.13039/501100011033.

Data Availability Statement

The data presented in this study are available upon request from the corresponding author(s).

Acknowledgments

The authors thank the Spanish Government for Grant PID2020-119744RB-C21 funded by MCIN/AEI/10.13039/501100011033, and the support of the Universitat Politècnica de València. They are also grateful for the predoctoral scholarship granted to Josep Ramon Lliso Ferrando as part of the “Formación de Personal Investigador” programme from the Universitat Politècnica de València (FPI-UPV-2018). They are also grateful for the postdoctoral mobility scholarship granted to Josep Ramon Lliso Ferrando from Generalitat Valenciana (CIBEST/2023/83).

Conflicts of Interest

The authors declare no conflicts of interest.

References

  1. Power, G.J.; Tandja M, C.D.; Bastien, J.; Grégoire, P. Measuring infrastructure investment option value. J. Risk Financ. 2015, 16, 49–72. [Google Scholar] [CrossRef]
  2. Ellingwood, B.R. Risk-informed condition assessment of civil infrastructure: State of practice and research issues. Struct. Infrastruct. Eng. 2005, 1, 7–18. [Google Scholar] [CrossRef]
  3. McCarter, W.J.; Vennesland, Ø. Sensor systems for use in reinforced concrete structures. Constr. Build. Mater. 2004, 18, 351–358. [Google Scholar] [CrossRef]
  4. Stewart, M.G.; Wang, X.; Nguyen, M.N. Climate change adaptation for corrosion control of concrete infrastructure. Struct. Saf. 2012, 35, 29–39. [Google Scholar] [CrossRef]
  5. Saad, L.; Aissani, A.; Chateauneuf, A.; Raphael, W. Reliability-based optimization of direct and indirect LCC of RC bridge elements under coupled fatigue-corrosion deterioration processes. Eng. Fail. Anal. 2016, 59, 570–587. [Google Scholar] [CrossRef]
  6. Ožbolt, J.; Oršanić, F.; Balabanić, G.; Kušter, M. Modeling damage in concrete caused by corrosion of reinforcement: Coupled 3D FE model. Int. J. Fract. 2012, 178, 233–244. [Google Scholar] [CrossRef]
  7. Ball, B.J.C.; Whitmore, D.W. Corrosion Mitigation Systems for Concrete Structures. Concr. Repair Bull. 2003, 16, 6–11. [Google Scholar]
  8. Cavaleri, L.; Barkhordari, M.S.; Repapis, C.C.; Armaghani, D.J.; Ulrikh, D.V.; Asteris, P.G. Convolution-based ensemble learning algorithms to estimate the bond strength of the corroded reinforced concrete. Constr. Build. Mater. 2022, 359, 129504. [Google Scholar] [CrossRef]
  9. Phulara, N.R.; Bhattarai, J. Assessment on Corrosion Damage of Steel Reinforced Concrete Structures of Kathmandu Valley Using Corrosion Potential Mapping Method. J. Inst. Eng. 2019, 15, 45–54. [Google Scholar] [CrossRef]
  10. Cavaco, E.; Pimenta, R.; Valença, J. A new method for corrosion assessment of reinforcing bars based on close-range photogrammetry: Experimental validation. Struct. Concr. 2019, 20, 996–1009. [Google Scholar] [CrossRef]
  11. François, R.; Laurens, S.; Deby, F. Corrosion and its Consequences for Reinforced Concrete Structures; ISTE Press Ltd.: London, UK; Elsevier Ltd.: Amsterdam, The Netherlands, 2018; ISBN 978-1-78548-234-2. [Google Scholar]
  12. Angst, U.M. Challenges and opportunities in corrosion of steel in concrete. Mater. Struct. Constr. 2018, 51, 4. [Google Scholar] [CrossRef]
  13. Polder, R.B.; Peelen, W.H.A.; Courage, W.M.G. Non-traditional assessment and maintenance methods for aging concrete structures—Technical and non-technical issues. Mater. Corros. 2012, 63, 1147–1153. [Google Scholar] [CrossRef]
  14. Helal, J.; Sofi, M.; Mendis, P. Non-destructive testing of concrete: A review of methods. Electron. J. Struct. Eng. 2015, 14, 97–105. [Google Scholar] [CrossRef]
  15. Li, C.; Jiang, Z.; Myers, R.J.; Chen, Q.; Wu, M.; Li, J.; Monteiro, P.J.M. Understanding the sulfate attack of Portland cement–based materials exposed to applied electric fields: Mineralogical alteration and migration behavior of ionic species. Cem. Concr. Compos. 2020, 111, 103630. [Google Scholar] [CrossRef]
  16. Jiang, Z.; Li, J.; Li, W. Preparation and characterization of autolytic mineral microsphere for self-healing cementitious materials. Cem. Concr. Compos. 2019, 103, 112–120. [Google Scholar] [CrossRef]
  17. Ahmad, S. Reinforcement corrosion in concrete structures, its monitoring and service life prediction—A review. Cem. Concr. Compos. 2003, 25, 459–471. [Google Scholar] [CrossRef]
  18. Brenna, A.; Bolzoni, F.; Beretta, S.; Ormellese, M. Long-term chloride-induced corrosion monitoring of reinforced concrete coated with commercial polymer-modified mortar and polymeric coatings. Constr. Build. Mater. 2013, 48, 734–744. [Google Scholar] [CrossRef]
  19. Tuutti, K. Corrosion of Steel in Concrete; Swedish Cement and Concrete Research Instittute: Stockholm, Sweden, 1982. [Google Scholar]
  20. Solla, M.; Lagüela, S.; Fernández, N.; Garrido, I. Assessing rebar corrosion through the combination of nondestructive GPR and IRT methodologies. Remote Sens. 2019, 11, 1705. [Google Scholar] [CrossRef]
  21. Medvedev, V.; Pustovgar, A. A Review of Concrete Carbonation and Approaches to Its Research under Irradiation. Buildings 2023, 13, 1998. [Google Scholar] [CrossRef]
  22. Chang, C.F.; Chen, J.W. The experimental investigation of concrete carbonation depth. Cem. Concr. Res. 2006, 36, 1760–1767. [Google Scholar] [CrossRef]
  23. Stefanoni, M.; Angst, U.; Elsener, B. Corrosion rate of carbon steel in carbonated concrete—A critical review. Cem. Concr. Res. 2018, 103, 35–48. [Google Scholar] [CrossRef]
  24. Khan, M.U.; Ahmad, S.; Al-Gahtani, H.J. Chloride-Induced Corrosion of Steel in Concrete: An Overview on Chloride Diffusion and Prediction of Corrosion Initiation Time. Int. J. Corros. 2017, 2017, 5819202. [Google Scholar] [CrossRef]
  25. Glass, G.K.; Buenfeld, N.R. Chloride-induced corrosion of steel. Prog. Struct. Eng. Mater. 2000, 2, 448–458. [Google Scholar] [CrossRef]
  26. Feng, W.; Tarakbay, A.; Ali Memon, S.; Tang, W.; Cui, H. Methods of accelerating chloride-induced corrosion in steel-reinforced concrete: A comparative review. Constr. Build. Mater. 2021, 289, 123165. [Google Scholar] [CrossRef]
  27. Angst, U.M.; Geiker, M.R.; Alonso, M.C.; Polder, R.; Isgor, O.B.; Elsener, B.; Wong, H.; Michel, A.; Hornbostel, K.; Gehlen, C.; et al. The effect of the steel–concrete interface on chloride-induced corrosion initiation in concrete: A critical review by RILEM TC 262-SCI. Mater. Struct. Constr. 2019, 52, 88. [Google Scholar] [CrossRef]
  28. Vera, R.; Villarroel, M.; Carvajal, A.M.; Vera, E.; Ortiz, C. Corrosion products of reinforcement in concrete in marine and industrial environments. Mater. Chem. Phys. 2009, 114, 467–474. [Google Scholar] [CrossRef]
  29. Hwang, W.; Yong Ann, K. Determination of rust formation to cracking at the steel–concrete interface by corrosion of steel in concrete. Constr. Build. Mater. 2023, 367, 130215. [Google Scholar] [CrossRef]
  30. Bertolini, L.; Carsana, M.; Gastaldi, M.; Lollini, F.; Redaelli, E. Corrosion assessment and restoration strategies of reinforced concrete buildings of the cultural heritage. Mater. Corros. 2011, 62, 146–154. [Google Scholar] [CrossRef]
  31. Angst, U.; Elsener, B.; Jamali, A.; Adey, B. Concrete cover cracking owing to reinforcement corrosion—Theoretical considerations and practical experience. Mater. Corros. 2012, 63, 1069–1077. [Google Scholar] [CrossRef]
  32. Reichling, K.; Raupach, M.; Broomfield, J.; Gulikers, J.; L’Hostis, V.; Kessler, S.; Osterminski, K.; Pepenar, I.; Schneck, U.; Sergi, G. Full surface inspection methods regarding reinforcement corrosion of concrete structures. Mater. Corros. 2013, 64, 116–127. [Google Scholar] [CrossRef]
  33. Ramón-Zamora, J.E.; Lliso-Ferrando, J.R.; Martínez-Ibernón, A.; Gandiá-Romero, J.M. Corrosion Assessment in Reinforced Concrete Structures by means of Embedded Sensors and Multivariate Analysis. Part 1: Laboratory Validation. Sensors 2023, 23, 8869. [Google Scholar] [CrossRef] [PubMed]
  34. Broomfield, J.P.; Davies, K.; Hladky, K. The use of permanent corrosion monitoring in new and existing reinforced concrete structures. Cem. Concr. Compos. 2002, 24, 27–34. [Google Scholar] [CrossRef]
  35. Kersey, A.D.; Davis, M.A.; Patrick, H.J.; LeBlanc, M.; Koo, K.P.; Askins, C.G.; Putnam, M.A.; Friebele, E.J. Fiber grating sensors. J. Light. Technol. 1997, 15, 1442–1462. [Google Scholar] [CrossRef]
  36. Fan, L.; Bao, Y. Review of fiber optic sensors for corrosion monitoring in reinforced concrete. Cem. Concr. Compos. 2021, 120, 104029. [Google Scholar] [CrossRef]
  37. Bao, Y.; Valipour, M.; Meng, W.; Khayat, K.H.; Chen, G. Distributed fi ber optic sensor-enhanced detection and prediction of shrinkage- induced delamination of ultra-high- performance concrete overlay. Smart Mater. Struct. 2017, 26, 085009. [Google Scholar] [CrossRef]
  38. Kadkhodazadeh, S.; Ihamouten, A.; Souriou, D.; Dérobert, X.; Guilbert, D. Parametric Study to Evaluate the Geometry and Coupling Effect on the Efficiency of a Novel FMM Tool Embedded in Cover Concrete for Corrosion Monitoring. Remote Sens. 2022, 14, 5593. [Google Scholar] [CrossRef]
  39. Martínez, I.; Andrade, C. Examples of reinforcement corrosion monitoring by embedded sensors in concrete structures. Cem. Concr. Compos. 2009, 31, 545–554. [Google Scholar] [CrossRef]
  40. Andrade, C.; Alonso, C.; Gulikers, J.; Polder, R.; Cigna, R.; Vennesland, Ø.; Salta, M.; Raharinaivo, A.; Elsener, B. Recommendations of RILEM TC-154-EMC: “Electrochemical techniques for measuring metallic corrosion” Test methods for on-site corrosion rate measurement of steel reinforcement in concrete by means of the polarization resistance method. Mater. Struct. 2004, 37, 623–643. [Google Scholar] [CrossRef]
  41. Lliso-Ferrando, J.R. Monitorizacion de la Durabilidad de Estructuras Existentes de Hormigon Armado Mediante la Inserción de una red de Sensores. Ph.D. Thesis, Universitat Politècnica de València, Valencia, Spain, 2022. [Google Scholar]
  42. Pallarés, F.J.; Betti, M.; Bartoli, G.; Pallarés, L. Structural health monitoring (SHM) and Nondestructive testing (NDT) of slender masonry structures: A practical review. Constr. Build. Mater. 2021, 297, 123768. [Google Scholar] [CrossRef]
  43. Sakiyama, F.I.H.; Lehmann, F.; Garrecht, H. Structural health monitoring of concrete structures using fibre-optic-based sensors: A review. Mag. Concr. Res. 2021, 73, 174–194. [Google Scholar] [CrossRef]
  44. Ramón, J.E.; Gandía-Romero, J.M.; Bataller, R.; López, J.A.; Valcuende, M.; Soto, J. Real-time corrosion monitoring of an ultra-high performance fibre-reinforced concrete offshore raft by using an autonomous sensor system. Struct. Control Heal. Monit. 2022, 29, e3102. [Google Scholar] [CrossRef]
  45. Ramon Zamora, J.E. Sistema de Sensores Embebidos para Monitorizar la Corrosión en Estructuras de Hormigón Armado. Fundamentos, Metodología y Aplicaciones. Ph.D. Thesis, Universitat Politècnica de València, Valencia, Spain, 2018. [Google Scholar]
  46. Ramón, J.E.; Gandía-Romero, J.M.; Valcuende, M.; Bataller, R. Integrated sensor network for monitoring steel corrosion in concrete structures. Vitr. Int. J. Archit. Technol. Sustain. 2016, 1, 65. [Google Scholar] [CrossRef]
  47. Lliso-Ferrando, J.R.; Gasch, I.; Martínez-Ibernón, A.; Valcuende, M. Effect of macrocell currents on rebar corrosion in reinforced concrete structures exposed to a marine environment. Ocean Eng. 2022, 257, 111680. [Google Scholar] [CrossRef]
  48. Martínez-Ibernón, A.; Ramón, J.E.; Gandía-Romero, J.M.; Gasch, I.; Valcuende, M.; Alcañiz, M.; Soto, J. Characterization of electrochemical systems using potential step voltammetry. Part II: Modeling of reversible systems. Electrochim. Acta 2019, 328, 135111. [Google Scholar] [CrossRef]
  49. Ramón, J.E.; Gandía-Romero, J.M.; Bataller, R.; Alcañiz, M.; Valcuende, M.; Soto, J. Potential step voltammetry: An approach to corrosion rate measurement of reinforcements in concrete. Cem. Concr. Compos. 2020, 110, 103590. [Google Scholar] [CrossRef]
  50. Ramón, J.E.; Martínez-Ibernón, A.; Gandía-Romero, J.M.; Fraile, R.; Bataller, R.; Alcañiz, M.; García-Breijo, E.; Soto, J. Characterization of electrochemical systems using potential step voltammetry. Part I: Modeling by means of equivalent circuits. Electrochim. Acta 2019, 323, 134702. [Google Scholar] [CrossRef]
  51. Duffó, G.S.; Farina, S.B.; Giordano, C.M. Characterization of solid embeddable reference electrodes for corrosion monitoring in reinforced concrete structures. Electrochim. Acta 2009, 54, 1010–1020. [Google Scholar] [CrossRef]
  52. Andrade, C. Propagation of reinforcement corrosion: Principles, testing and modelling. Mater. Struct. 2019, 52, 2. [Google Scholar] [CrossRef]
  53. Andrade, C.; Garcés, P.; Martínez, I. Galvanic currents and corrosion rates of reinforcements measured in cells simulating different pitting areas caused by chloride attack in sodium hydroxide. Corros. Sci. 2008, 50, 2959–2964. [Google Scholar] [CrossRef]
  54. Qian, S.; Zhang, J.; Qu, D. Theoretical and experimental study of microcell and macrocell corrosion in patch repairs of concrete structures. Cem. Concr. Compos. 2006, 28, 685–695. [Google Scholar] [CrossRef]
  55. Rodriguez, P.; Ramirez, E.; Gonzalez, J.A. Methods for studying corrosion in reinforced concrete. Mag. Concr. Res. 1994, 46, 81–90. [Google Scholar] [CrossRef]
  56. González, J.A.; Feliú, S.; Rodríguez, P.; Ramírez, E.; Alonso, C.; Andrade, C. Some questions on the corrosion of steel in concrete—Part I: When, how and how much steel corrodes. Mater. Struct. Constr. 1996, 29, 40–46. [Google Scholar] [CrossRef]
  57. González, J.A.; Feliú, S.; Rodríguez, P.; López, W.; Ramírez, E.; Alonso, C.; Andrade, C. Some questions on the corrosion of steel in concrete. Part II: Corrosion mechanism and monitoring, service life prediction and protection methods. Mater. Struct. Constr. 1996, 29, 97–104. [Google Scholar] [CrossRef]
  58. UNE-EN 12390-3:2020; Ensayos de Hormigón Endurecido. Parte 3: Determinación de la Resistencia a Compresión de Probetas. UNE: Madrid, Spain, 2020.
  59. UNE 83980; Durabilidad del Hormigón. Métodos de Ensayo. Determinación de la Absorción de Agua, la Densidad y la Porosidad Accesible al agua del Hormigón. UNE: Madrid, Spain, 2014.
  60. UNE-EN 12390-8; Ensayos de Hormigón Endurecido. Parte 8: Profundidad de Penetración de Agua bajo Presión. UNE: Madrid, Spain, 2020.
  61. UNE 83981:2008; Durabilidad del Hormigón. Métodos de Ensayo. Determinación de la Permeabilidad al Oxígeno del Hormigón Endurecido. UNE: Madrid, Spain, 2008.
  62. UNE-EN 12390-18:2021; Ensayos de Hormigón Endurecido. Parte 18: Determinación del Coeficiente de Migración de Cloruros. UNE: Madrid, Spain, 2021.
  63. UNE-EN 12390-19:2023; Ensayos de Hormigón Endurecido. Parte 19: Determinación de la Resistividad Eléctrica. UNE: Madrid, Spain, 2024.
  64. UNE 112072:2011; Determinación de la Velocidad de Corrosión de Armaduras en Laboratorio Mediante Medida de la Resistencia a la Polarización. UNE: Madrid, Spain, 2021.
  65. Lliso-Ferrando, J.R.; Soto, J.; Gasch, I.; Valcuende, M. Significance of macrocell currents in reinforced concrete columns partially immersed in seawater. Constr. Build. Mater. 2023, 389, 131739. [Google Scholar] [CrossRef]
  66. Sibatov, R.T.; Uchaikin, V.V. Fractional kinetics of charge carriers in supercapacitors. In Handbook of Fractional Calculus with Applications; De Gruyter: Berlin, Germany, 2019; ISBN 9783110571929. [Google Scholar]
  67. Conway, B.E.; Pell, W.G. Double-layer and pseudocapacitance types of electrochemical capacitors and their applications to the development of hybrid devices. J. Solid State Electrochem. 2003, 7, 637–644. [Google Scholar] [CrossRef]
  68. Martínez, M.; Marí, M. La Distribución Binomial; Universidad Politécnica de Valencia: Valencia, Spain, 2009; p. 8. [Google Scholar]
  69. Saturno, P.J. La distribución binomial y el muestreo para la aceptación de lotes (LQAS) como métodos de monitorización en servicios de salud. Rev. Calid. Asist. 2000, 15, 99–107. [Google Scholar]
  70. Jos, E.S.; Morales, R. Distribuciones de Probabilidad: Binomial y Normal Variables Aleatorias. pp. 1–13. Available online: https://www.google.com/url?sa=t&source=web&rct=j&opi=89978449&url=https://www.matematicasonline.es/BachilleratoCCSS/segundo/archivos/Inferencia_estadistica/binom.pdf&ved=2ahUKEwi7jsfH1OyIAxV72jgGHTiRMJIQFnoECBwQAQ&usg=AOvVaw3IDodTYE0p4SrWabvY4Cwr (accessed on 14 September 2024).
  71. Hodges, L. Common Univariate Distributions. In Methods in Experimental Physics; Elsevier Masson SAS: Amsterdam, The Netherlands, 1994; pp. 35–61. [Google Scholar]
  72. Tsokos, C.; Wooten, R. Normal Probability. In The Joy of Finite Mathematics; Elsevier: Amsterdam, The Netherlands, 2016; pp. 231–261. [Google Scholar]
Figure 1. The INESSCOM monitoring system.
Applsci 14 09002 g001
Figure 2. Concrete columns prepared for this study.
Applsci 14 09002 g002
Figure 3. Accelerated carbonation method.
Applsci 14 09002 g003
Figure 4. Testing procedure: (A) exposure condition; (B) macrocell measurement and (C) corrosion rate and double layer capacity measurement.
Applsci 14 09002 g004
Figure 5. Macrocell corrosion monitoring: (A) the column free of aggressive agents; (B) the column with the chloride-contaminated lower zone; (C) the column with the carbonated lower zone.
Applsci 14 09002 g005
Figure 6. Microcell corrosion monitoring: (A) the column free of aggressive agents; (B) the column with the chloride-contaminated lower zone; (C) the column with the carbonated lower zone.
Applsci 14 09002 g006
Figure 7. Corrosion rate: (A) the column free of aggressive agents; (B) the column with the chloride-contaminated lower zone; (C) the column with the carbonated lower zone.
Applsci 14 09002 g007
Figure 8. Double layer capacitance monitoring: (A) the column free of aggressive agents; (B) the column with the chloride-contaminated lower zone; (C) the column with the carbonated lower zone.
Applsci 14 09002 g008
Figure 9. Classification model: corrosion level and aggressive agent. Corrosion level (red lines) by Standard UNE 112072:2011 [64].
Applsci 14 09002 g009
Figure 10. Model of the classification of degree of corrosion and attack type. Degree of corrosion (red lines) according to the limits set out by Standard UNE 112072:2011 [64].
Applsci 14 09002 g010
Figure 11. Comparison of the iCORR values obtained using INESSCOM on sensors to those acquired by commercial equipment on rebars: (A) the column free of aggressive agents; (B) the column with the chloride-contaminated lower zone; (C) the column with the carbonated lower zone.
Applsci 14 09002 g011
Figure 12. Data comparison: results obtained by means of the INESSCOM monitoring system (sensors) and commercial equipment (rebars). Regression line (red dotter line).
Applsci 14 09002 g012
Table 1. Mixture proportions of concrete (kg/m3).
CementWaterSand (0/4)Gravel (4/6)w/c
Lower zone3002401112.9599.20.8
Upper zone3801901152.3620.50.5
w/c: water/cement ratio.
Table 2. Concrete characterisation.
Test
Specimens 1
GeometryStandardResults 2
Compressive strength (fc)3Ø100 × 200 mmUNE-EN 12390-3:2020 [58]0.8: 18.98 MPa
0.5: 40.50 MPa
Absorption
coefficient
3Ø100 × 50 mmUNE 83980:2014 [59]0.8: 8.38 %
0.5: 7.49 %
Porosity accessible to water3Ø100 × 50 mm0.8: 18.24 %
0.5: 16.42 %
Penetration of water under pressure (Z)4Ø150 × 150 mmUNE-EN 12390-8: 2020 [60]0.8: 103 mm
0.5: 18 mm
Gas permeability (Kgas)3Ø150 × 50 mmUNE 83981:2008 [61]0.8: 433.15 × 10⁻¹⁸ m2
0.5: 50.37 × 10⁻¹⁸ m2
Non-steady-state migration coefficient (Dnssm)3Ø100 × 50 mmUNE-EN 12390-18:2021 [62]0.8: 50.04 × 10⁻¹² m2/s
0.5: 25.35 × 10⁻¹² m2/s
Concrete resistivity (Ω)340 × 40 × 160 mmUNE-EN 12390-19:2023 [63]0.8: 170.36 Ωm
0.5: 195.69 Ωm
1 Test specimens per concrete type. 2 Results of the concretes with a water/cement ratio of 0.8 or 0.5.
Disclaimer/Publisher’s Note: The statements, opinions and data contained in all publications are solely those of the individual author(s) and contributor(s) and not of MDPI and/or the editor(s). MDPI and/or the editor(s) disclaim responsibility for any injury to people or property resulting from any ideas, methods, instructions or products referred to in the content.

