Article

Microscopic Experiments to Assess the Macroscopic Sweep Characteristics of Carbon Dioxide Flooding

1
Tarim Oilfield Company, PetroChina, Korla 841000, China
2
R&D Center for Ultra-Deep Complex Reservoir Exploration and Development, CNPC, Korla 841000, China
3
Engineering Research Center for Ultra-Deep Complex Reservoir Exploration and Development, Xinjiang Uygur Autonomous Region, Korla 841000, China
4
PetroChina Research Institute of Petroleum Exploration & Development, CNPC, Beijing 100083, China
5
School of Petroleum Engineering, China University of Petroleum (East China), Qingdao 266580, China
*
Author to whom correspondence should be addressed.
Appl. Sci. 2024, 14(19), 9007; https://doi.org/10.3390/app14199007 (registering DOI)
Submission received: 10 July 2024 / Revised: 30 August 2024 / Accepted: 3 September 2024 / Published: 6 October 2024

Abstract

:
The Lunnan oilfield in the Tarim Basin, one of China’s major onshore oilfields with substantial geological reserves, faces particular challenges due to the complexity of its reservoir environment and the dispersion of remaining oil. Carbon dioxide, a greenhouse gas, presents an opportunity for enhanced oil recovery (EOR) and geological storage. In this context, the use of carbon dioxide for EOR can simultaneously address environmental concerns and improve oil recovery rates. This study focuses on the TI reservoir in the No. 2 well area of the Lunnan oilfield, employing advanced techniques to analyze the micro- and macro-characteristics of carbon dioxide flooding. Results: From the microscopic point of view, carbon dioxide flooding is mainly miscible with crude oil, which has a strong component exchange effect and can be displaced in the form of full pores, and the microscopic displacement efficiency is close to 100%. Macroscopically, under the combined injection and production of different injected hydrocarbon pore volume multiples (HCPVs), it is injected at the upper and lower layers of the interlayer and produced far away from the lower layer of the interlayer, with a total recovery rate of 52.83%. With the increase in the HCPV, the recovery increased rapidly at first and then slowly, and the HCPV at the demarcation point was 0.5, while the oil production rate increased in a wave-like manner and then decreased rapidly, and the HCPV at the breakthrough point of TI gas was 0.5. However, when the upper and lower layers far away from the interlayer are injected at the same time, the upper and lower layers of the interlayer are produced at the same time, and the total recovery rate can reach 83.02%. With the increase in the HCPV, the recovery rate increases rapidly at first and then slowly, and the HCPV at the turning point is 6.52. The oil production rate increases in a wave-like manner, then decreases rapidly, rises rapidly, and then decreases slowly in a wave-like manner. The HCPV at the breakthrough point of TI gas is 0.63, and the HCPV at the injection–production transition point is 0.63. The total recovery rate of carbon dioxide miscible displacement can reach 88.68% under the condition of separate injection and combined production with different injected hydrocarbon pore volume multiples. With the increase in the HCPV, the recovery increased rapidly at first and then slowly. The HCPV at the demarcation point was 6.5, the oil production rate increased in a wave-like manner, then decreased rapidly, increased rapidly, and then decreased slowly in a wave-like manner. The HCPV at the breakthrough point of TI gas was 0.63, and the HCPV at the injection–production transition point was 6.5. The research results provide data support for the physical reality of the microscopic and macroscopic sweep characteristics of carbon dioxide flooding in the Lunnan oilfield, Tarim Basin.

1. Introduction

Alongside the rapid development of conventional oil reservoirs worldwide, the reserves and annual production of conventional and high-quality oil reservoirs are declining, while the reserves and production of tight oil and gas are steadily increasing. These resources have now become a significant portion of the global oil and natural gas production. The Lunnan oilfield in the Tarim Basin is one of the important onshore oilfields in China, known for its substantial geological reserves [1]. However, the increase in carbon dioxide emissions is exacerbating global climate change and increasing the frequency and intensity of extreme weather events such as droughts, floods, and storms. Rising carbon dioxide levels contribute to global warming, accelerating the melting of polar ice caps and leading to a rise in sea levels. In some regions, higher temperatures and insect pests may severely impact global grain production, potentially causing a decline in yields. As the Lunnan oilfield develops, traditional water flooding technology faces challenges in maintaining a satisfactory recovery rate. Carbon dioxide flooding technology leverages the supercritical properties of carbon dioxide by injecting it into underground oil formations to improve the fluidity and recovery of crude oil. Compared to traditional water and polymer flooding, CO2 flooding offers environmental benefits, enhances recovery, and reduces production costs. Consequently, CO2 flooding technology has been implemented to enhance oil recovery in the Lunnan oilfield in the Tarim Basin [2,3,4,5].
Some significant achievements have been made in the study of CO2 flooding. In the oil field displacement schemes being implemented in the United States, the volume of injected carbon dioxide typically accounts for about 30% of the hydrocarbon pore volume, with enhanced oil recovery ranging from 7% to 12%. In Daqing oilfield, a field test of CO2 immiscible flooding was conducted using high-purity carbon dioxide (96%) as a byproduct from the hydrogenation workshop in a refinery. Although gas channeling caused by reservoir heterogeneity affects the sweep efficiency, it still achieves the overall effect of reducing water cut and improving oil recovery. Wang et al. (2020) studied the underground diffusion behavior of CO2. Through numerical simulation, they concluded that, when the temperature of the underground environment exceeds the critical temperature (31.1 °C) of CO2, CO2 exists in a supercritical state. When the critical pressure (72.9 MPa) is exceeded, CO2 remains in a supercritical state, and its diffusion and migration are influenced. CO2 can move and diffuse more easily in reservoirs with high porosity and high permeability [6]. Xu et al. (2021) studied the interaction between crude oil and CO2. By analyzing the composition, properties, and temperature of crude oil, they found that there are complex interactions between crude oil and CO2. They concluded that the density and viscosity of crude oil can be altered due to the dissolution of CO2, which impacts the recovery efficiency and recovery rate of the reservoir. In the process of injecting CO2 to extract crude oil, the ideal driving pattern is the formation of two-phase flow. However, the deposition of asphaltenes may negatively affect the permeability of the core. The oil–vapor interfacial tension is also influenced by the acting pressure and temperature when CO2 interacts with crude oil, which directly relates to the ease or difficulty of extracting the crude oil [7]. Sen et al. (2022) investigated the effect of CO2 flooding on the ripple characteristics and recovery rate of underground oil reservoirs. Through laboratory and numerical simulations, they concluded that CO2 flooding can significantly improve the ripple characteristics and increase the recovery rate of underground oil reservoirs. However, their findings lack the support of field experiments and monitoring data from actual oil fields [8]. Syed et al. (2022) analyzed the diffusion behavior of CO2 in the subsurface using advanced microscopy and image analysis techniques. It was concluded that the diffusion behavior of carbon dioxide in the subsurface is influenced by subsurface temperature, pressure, pore structure, and other factors [9]. Shafiai et al. (2020) investigated the effect of carbon dioxide oil displacement on the wave and characteristics of subsurface oil reservoirs and on the recovery rate. Using modern mathematical models and computational methods, they concluded that carbon dioxide oil displacement can significantly improve the wave and sweep efficiency and increase the recovery rate of subsurface oil formations. Furthermore, the effectiveness of carbon dioxide oil displacement on wave and sweep efficiency and recovery rate is influenced by the properties of the subsurface oil formation, temperature, pressure, and other factors [10].
The Lunnan oilfield in the Tarim Basin is in the late stage of dual TI water flooding development, with highly dispersed residual oil and a complex reservoir environment, posing a significant challenge for enhancing the recovery rate. In this study, we focused on the TI reservoir in the No. 2 well area of the Lunnan oilfield in the Tarim Basin. We analyzed the geological characteristics of the Lunnan oilfield and utilized transparent micro-models and high-resolution imaging technology to observe the real-time interaction between carbon dioxide and crude oil. We conducted a visual physical simulation of the “microscopic wave and characteristics” of carbon dioxide using a glass etching object model. “Microscopic wave and characteristics” specifically refers to the behavior of fluids at the pore scale, including the detailed interaction between carbon dioxide and crude oil within the pores of the reservoir rock. The “wave”, here, refers to the movement of carbon dioxide at the microscopic level, and the “characteristics” include details such as how the carbon dioxide displaces oil, how it interacts with the rock matrix, and how it spreads through the interconnected pore spaces. By analyzing the microscopic wave and characteristics, we aimed to understand the fundamental mechanisms of carbon dioxide displacement and improve the efficiency of oil recovery. This understanding is crucial for optimizing the injection strategy and maximizing the extraction of residual oil. Based on the 2D visual, large physical model, we also conducted simulations of the macroscopic wave and characteristics of carbon dioxide using co-injection and co-precipitation as well as split-injection and co-precipitation models. The goal was to improve the extraction efficiency and economic benefits of the oilfield and provide data support for the physical reality of carbon dioxide oil displacement at both the microscopic and macroscopic levels in the Lunnan oilfield of the Tarim Basin.

2. Research Methods

2.1. Geological Characteristics of the Study Area

The Lunnan oilfield is situated at the northern edge of the Taklimakan Desert, within Luntai County, Xinjiang Uygur Autonomous Region, approximately 35 km south of Luntai County. As part of the Tarim oil industry’s development, the Lunnan oilfield is located in an area with convenient transportation. Along the northern edge of the basin, National Highway 314 (Wuqia Highway) and the South Xinjiang Railway serve as major transportation routes. The oilfield features a comprehensive network of mining roads that connect with National Highway 314 (Wuqia Highway) at Erbadai, east of Luntai County, and at the 29th Regiment. The northern starting point of the Desert Highway, which traverses the Tarim Basin north to south, is also located within the oilfield. With the development of the oilfield, there is a significant presence of foreign permanent residents within the area. The power grid has been established, and the communication infrastructure is well developed [11]. The surface of the Lunnan oilfield is relatively flat, with an average elevation of about 930 m above sea level. Apart from local red willow and hyacinth vegetation, there is no other significant plant growth [12].
Geologically, the Lunnan oilfield is situated within the Lunnan fault zone of the Lunnan low uplift in the Tabei uplift of the Tarim Basin. It consists of a series of long-axis anticlines oriented nearly east–west, encompassing five development blocks: Lunnan 1, Lunnan 26, Lunnan 2, Lunnan 3, and Lunnan 10 well areas. The focus of this study is the TI reservoir in the Lunnan 2 well area. Within this reservoir, there are 48 oil and water wells, including 24 oil extraction wells (10 of which are operational), with a daily liquid production level of 754 metric tons and a daily oil production level of 30 metric tons at the wellhead. The integrated water content is 95.98%, with a verified cumulative oil production of 519.07 million metric tons and a cumulative liquid production of 2200.33 million metric tons. The geological reserve recovery level is 42.00%, and the geological reserve recovery speed is 0.13% [13]. For sampling the crude oil formation, the LN 2-33-H 2 well was selected. This well was brought into production on 25 October 2001 and is currently being exploited in the complex reservoir area, with a borehole depth of 5001 to 5050.16 m and a productive interval from 5004 to 5050.16 m.

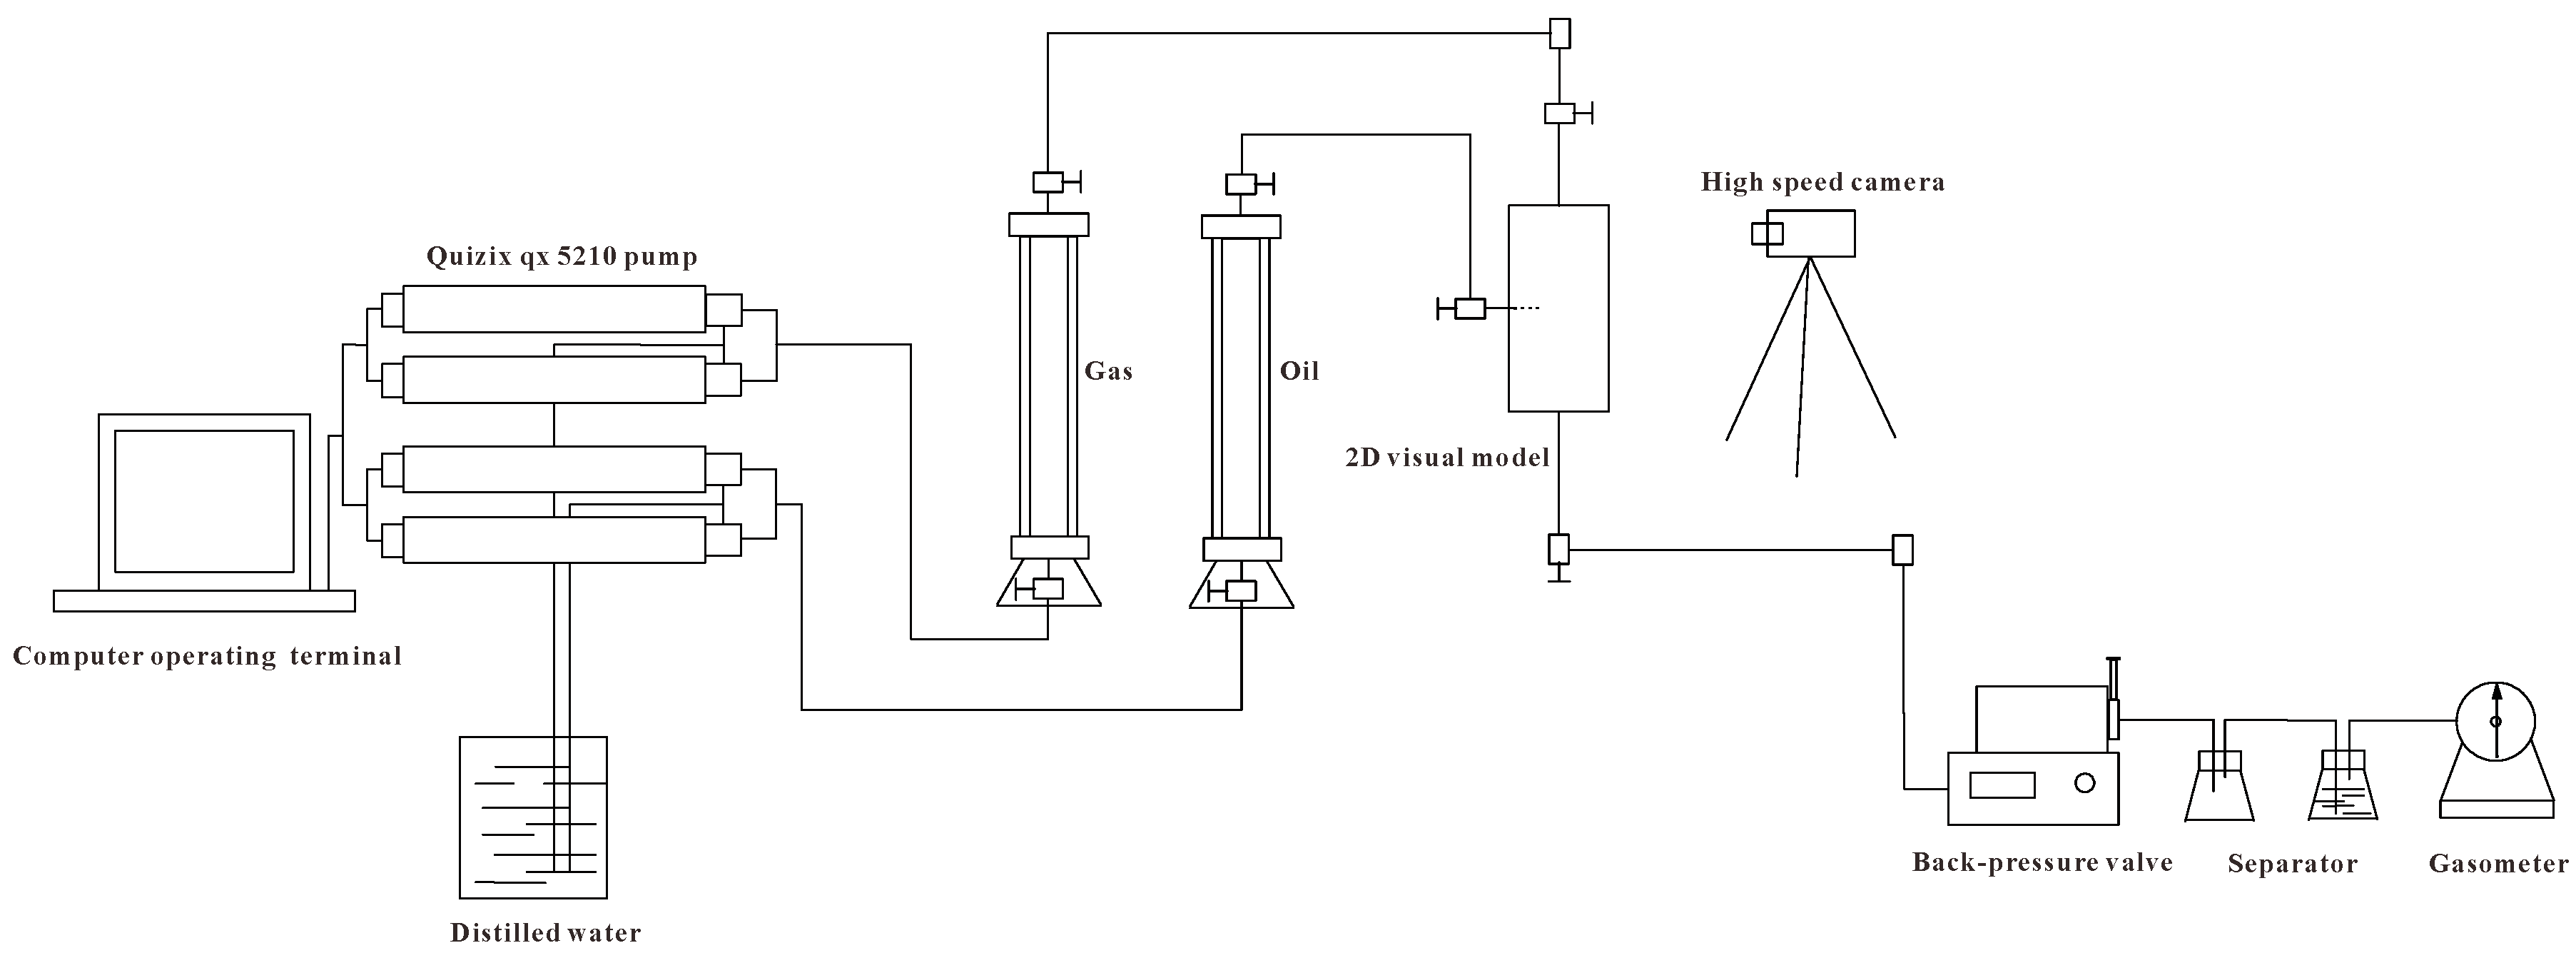
2.2. Experimental Devices and Samples

In this study, considering the non-homogeneous stratigraphic characteristics of reservoirs in CO2-driven target blocks in the study area, a two-layer, two-dimensional visual large-object model was designed to conduct two-dimensional visual experiments of CO2 mixed-phase flooding. The experiments involve the visualization of CO2 microscopic waves and features using a glass-etched object model and the visualization of CO2 macroscopic waves and features using a two-dimensional visual large-object model [14].
Wet-etching equipment, ICP etching machines, and optical and electron microscopes were primarily used to create the glass etching object models. In the glass wet-etching process, a hydrofluoric acid (HF) solution is used to etch the glass surface. The key parameters include the concentration of the HF solution, the temperature, and the etching time. Before etching, the glass substrate surface is polished and coated with a protective mask, followed by a coating of photoresist and pre-treatments such as baking, exposure, and development. The etching solution removes the exposed film layer within the pattern, after which the substrate undergoes cleaning and hardening to prepare for the final etching treatment. An apparatus for performing high-precision etching using an ICP (inductively coupled plasma) etching machine includes a power supply generated by upper and lower electrodes. The upper electrode is responsible for dissociating the gas into plasma, while the lower electrode serves as a support for the substrate and also plays a role in controlling the pressure within the etching chamber. The plasma created by the upper electrode interacts with the gas and the substrate, facilitating the etching process. The lower electrode helps maintain the desired pressure conditions necessary for precise etching. To observe the surface morphology after etching, an optical microscope can be used to inspect the photoresist pattern, and a scanning electron microscope (SEM) can be used to examine the detailed surface features of the etched glass [15].
The experimental setup for the two-dimensional visual large-object model consists of five main components: the drive replacement system, the two-dimensional visual large-object model itself, a high-speed camera, a back pressure controller, and a fluid metering system. We utilized a high-pressure precision displacement pump, the Chandler Quizix QX5210, for the drive replacement system. The two-dimensional visual large-object model had a visual area of 170 × 150 mm, with a maximum working pressure of 22 MPa and a working temperature of up to 110 °C. Distilled water served as the pressure transfer medium, and non-mercury piston pressurization was used to apply pressure to the test fluid. The flow chart of the two-dimensional visualization experiment device is shown in Figure 1 [16].
In this study, crude oil from the target block of the CO2 flooding in the Lunnan oilfield was selected, and the experiments utilized glass materials to create a granular-filled microscopic model to visualize the drive process in the porous medium and to analyze the morphology of the microscopic residual oil and its formation mechanism. The crude oil samples were prepared by mixing ground, degassed oil, aviation paraffin, and C2~C5 components in a specific ratio. The purity of the CO2 injection gas samples was 99.95%.

2.3. Experimental Methods

The experimental steps for the glass etching object modeling of carbon dioxide microscopic waves and features were as follows:
(1)
A model with specific pore structures and channels was created on a transparent glass plate using a hydrofluoric acid solution to simulate a real micro-pore network.
(2)
Simulation oil (a viscous liquid with dye mark) and simulation water (an aqueous solution with dye mark) were prepared according to the specific experimental conditions to be simulated.
(3)
The model was placed under a microscope or transparent observation equipment and connected to a fluid injection system to conduct different driving experiments, such as water flooding, carbon dioxide non-miscible flooding, and carbon dioxide miscible flooding, to simulate various extraction processes.
(4)
Using a microscopic visualization system, the initiation characteristics and dynamic evolution of residual oil in the blind-end pore space were observed and recorded through a microscope or a high-resolution camera under different alternation modes [17].
The experimental steps for the macro-wave and characterization of carbon dioxide in a two-dimensional visible large-object model were as follows:
(1)
All experimental equipment, including the injection pump, nitrogen cylinder, pressurization device, fluid intermediate container (containing N2 + CO2 mixture, formation water, crude oil), gas mass flow meter, and steam generator, were checked. The two-dimensional scaled physical model was prepared to simulate the environment of the underground reservoir.
(2)
The 2D visualized physical model was vacuumed and then saturated with simulated oil and placed at a constant temperature of 20 °C for 2 h to ensure full saturation. The vacuum pressure was 0.
(3)
Simulated formation water was injected at a rate of 50 μL/min until no further flow occurred in the 2D physical model.
(4)
During the experiment, parameters such as pressure, temperature, and flow rate were monitored and recorded, and the flow and ripple characteristics of the fluid in the porous medium were observed by the visualization equipment.
(5)
After the completion of the experiment, the collected data were analyzed to evaluate the macroscopic progression and coverage (wave and reach) of carbon dioxide in porous media and its impact on the displacement of oil and the change in the oil–gas interface [18]. In this context, “wave” refers to the movement of the injected carbon dioxide as it advances through the reservoir, forming a front that displaces the oil. “Reach” describes how far this wave extends and how effectively it sweeps through the reservoir, displacing oil from the rock matrix. Evaluating these characteristics helps to understand the efficiency of the recovery process and the extent to which the injected carbon dioxide can displace oil from the reservoir.

2.4. Experimental Scheme

2.4.1. Core Model Preparation

A core model was prepared using sand-filling technology to replicate the strong heterogeneity of the formation in the target block. The model was designed as a double-layer oil reservoir with an internal interlayer and a permeability gradient. The model featured a permeability gradient with a spacer, in which the permeability of the upper T12 reservoir was 40 mD and the thickness was 5 cm, while the permeability of the lower T13 reservoir was 200 mD and the thickness was 10 cm. The visible area of the model measured 170 × 150 mm. The pore diameter was 0.1~0.2 cm, and the pore length was about 12 cm, from which it can be concluded that the pore volume of the microscopic model was about 0.0942~0.3768 cm3. The design of the large model and the physical diagram of the model are shown in Figure 2 [19].

2.4.2. Micro-Model Preparation

A granular-filled micro-model was fabricated to visualize the drive process in the porous medium and to analyze the morphology of the microscopic residual oil and the formation mechanism. The crude oil samples were prepared by mixing ground degassed oil, aviation paraffin, and C2~C5 components in a specific ratio. The purity of the CO2 injection gas samples was 99.95%.

2.4.3. Glass Etching Object Modeling

A glass etching object model was prepared using a hydrofluoric acid solution to create a model with specific pore structures and channels on a transparent glass plate, simulating a real micro-pore network. This model was used to visualize the CO2 microscopic wave and features.

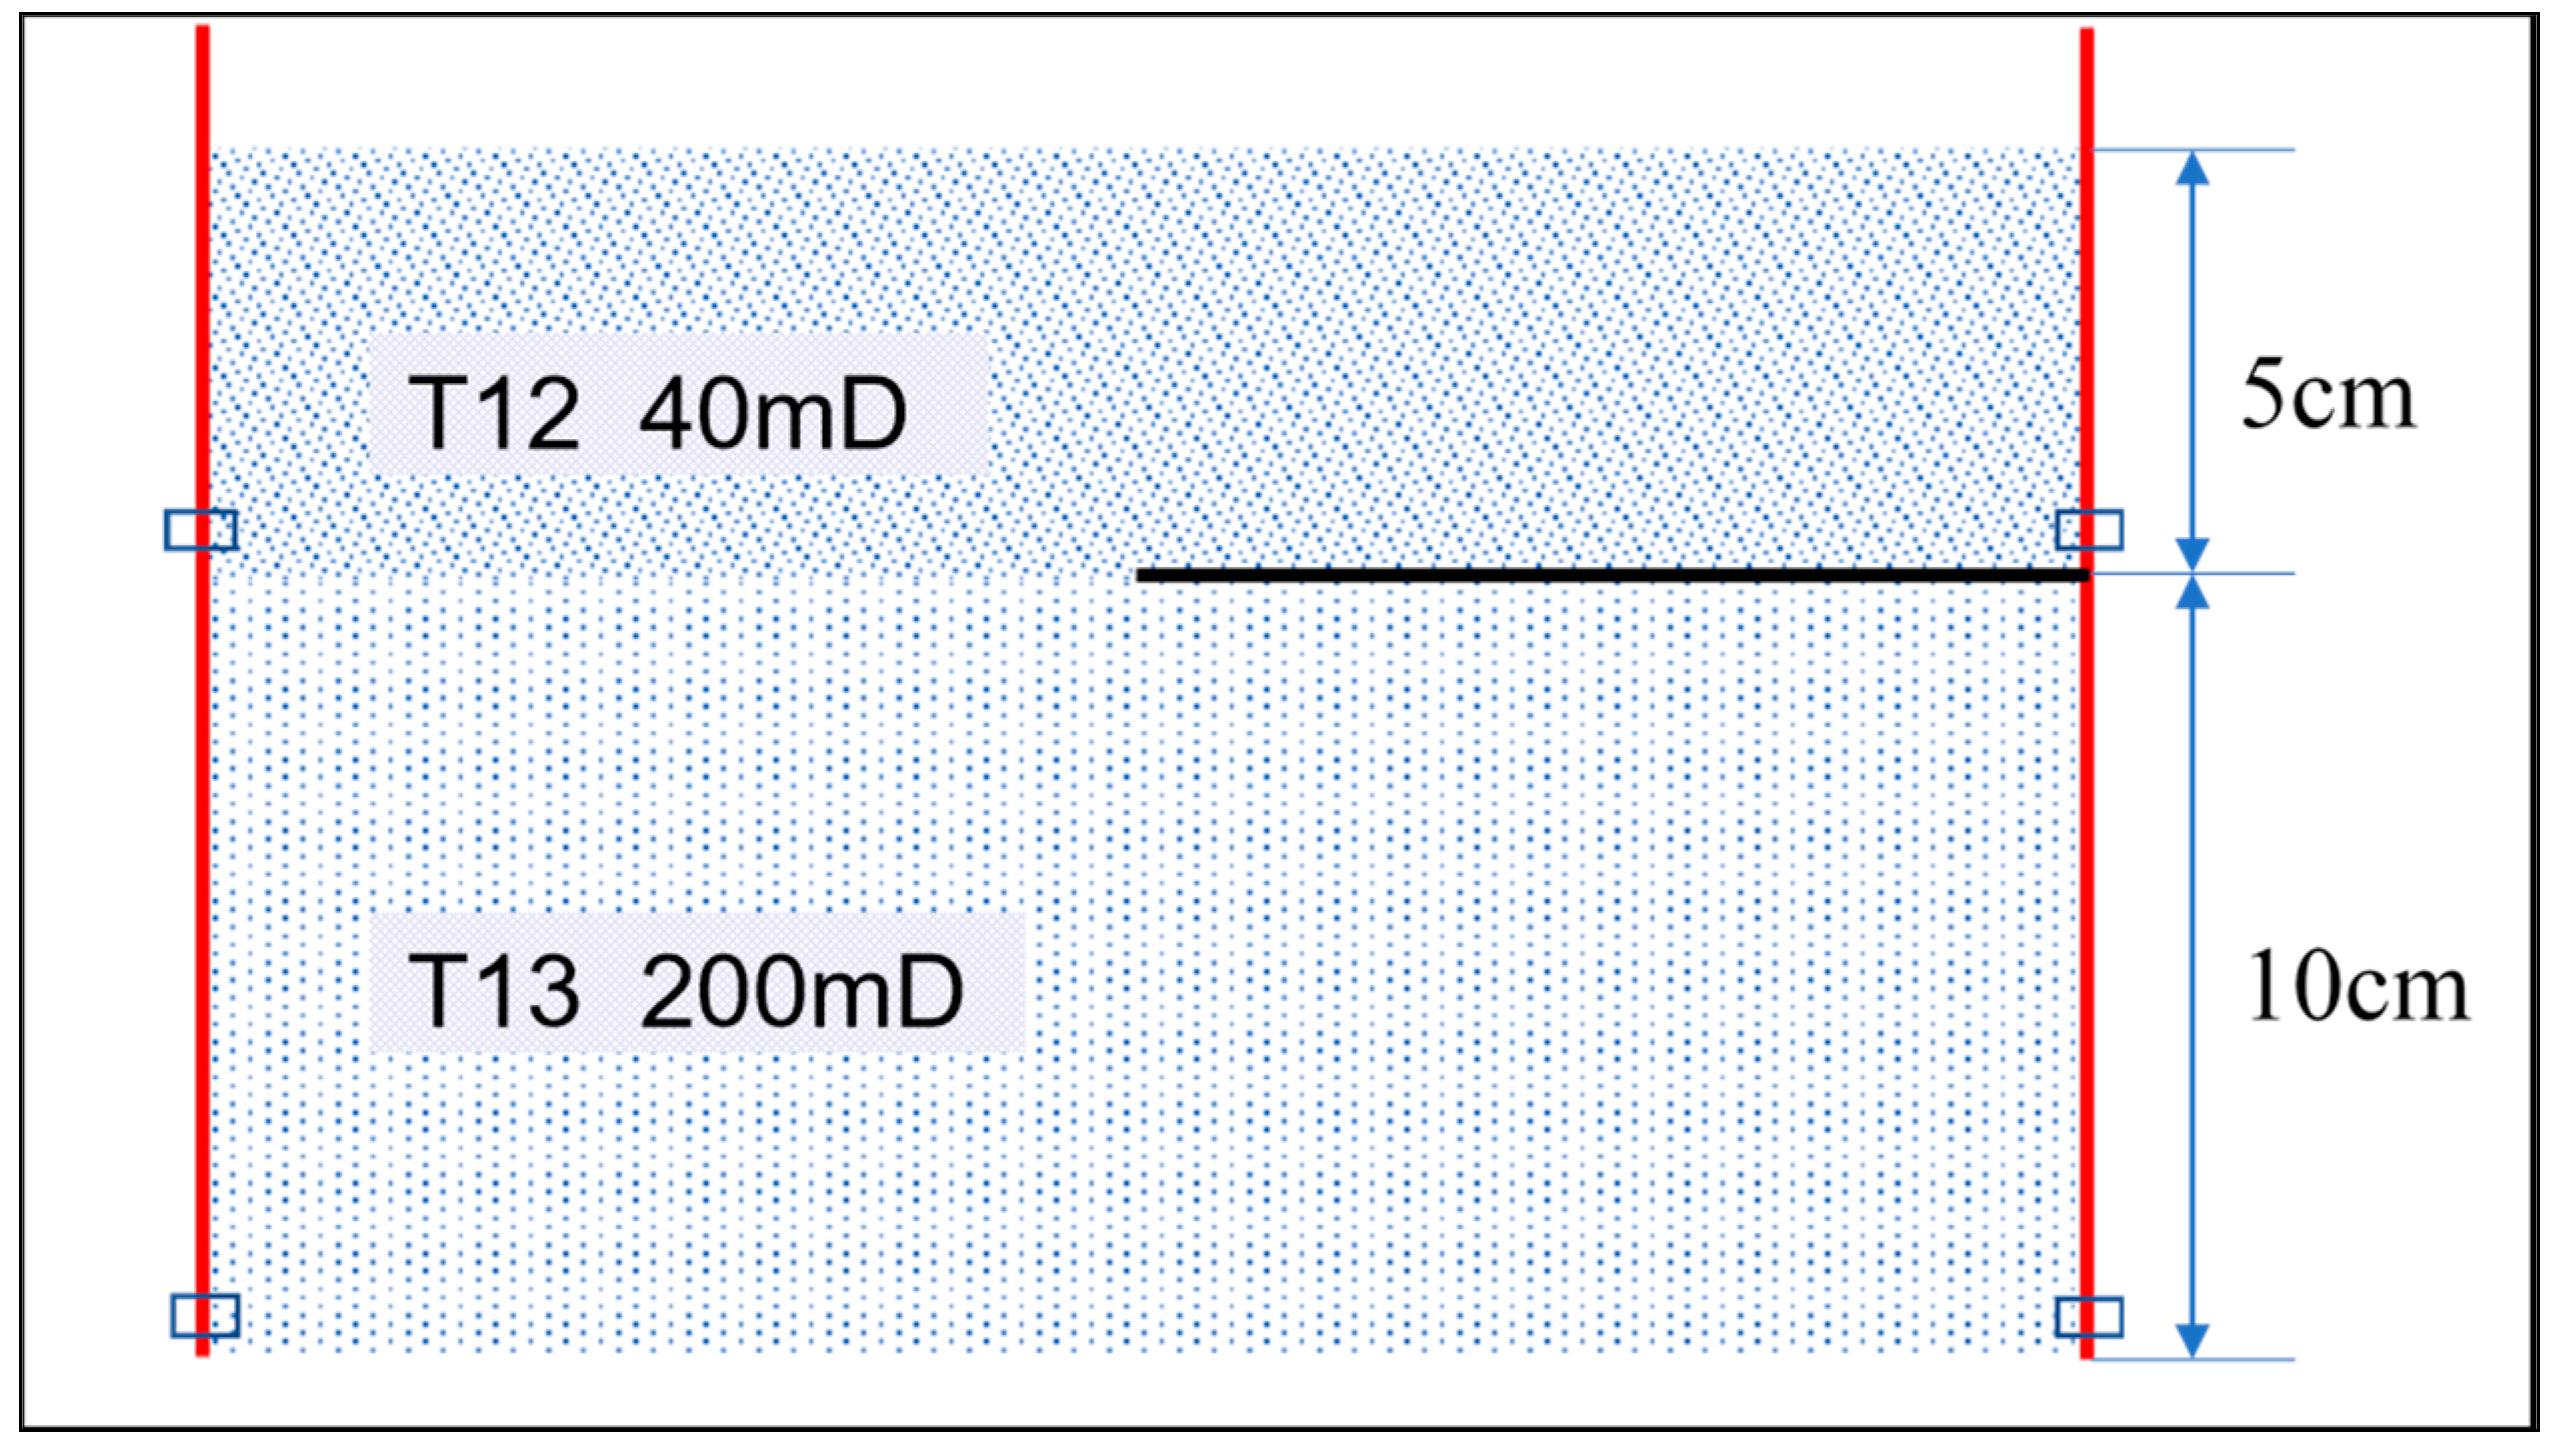
2.4.4. Two-Dimensional Visual Large-Object Model Setup

The two-dimensional visual large-object model was prepared to simulate the environment of the underground reservoir. All the experimental equipment, including an injection pump, nitrogen cylinder, pressurization device, fluid intermediate container (containing N2 + CO2 mixture, formation water, crude oil), gas mass flow meter, and steam generator, was checked. The 2D visualized physical model was vacuumed, saturated with simulated oil, and placed at a constant temperature of 20 °C for 2 h to ensure the model was fully saturated. Simulated formation water was injected at a rate of 50 μL/min until there was no more flow in the 2D physical model.

2.4.5. Two-Dimensional Visual Physical Simulation Experiments

T12 has a permeability of 40 mD and a thickness of 5 cm, while T13 has a permeability of 200 mD and a thickness of 10 cm. According to the distribution location of the spacer and the physical properties of the two small layers, TI2 and TI3, three groups of two-dimensional visual physical simulation experiments were designed. For the spacer located at the injection end and the extraction end, the experiments were simulated using combined injection and extraction and split injection and extraction modes, respectively. Table 1 shows the different injection and production model schemes, and Figure 3 illustrates the different injection and production design schemes.

3. Experimental Results

3.1. Microscopic Sweep Characteristics of Carbon Dioxide Flooding

Through the visual material simulation of a glass etching model, we obtained microscopic simulations of water flooding and CO2 flooding. Figure 4 presents the results of the glass etching model for water flooding and CO2 flooding, including the distribution of residual oil. From these results, we can see that the following: [20].
Water flooding:
In the process of water flooding, water predominantly occupies the large pore throats and the pores connected to them. Water has difficulty displacing oil in small pore throats, large pores controlled by small throats, and the blind ends of pores. When single-phase seepage reaches a steady state, the fluid flow rate at the center of the flow channel is higher than that at the entrance. The pressure drop is slower in the larger pore throats. Residual oil is mainly stored in small pore throats and also adsorbed on the walls.
CO2 flooding:
CO2 flooding is characterized by a mixed-phase flooding with crude oil, involving strong component exchange. CO2 can displace oil throughout the pore space, even in the blind ends of pores, achieving nearly 100% microscopic sweep efficiency. As CO2 is injected, the pore volume multiplier increases, allowing the crude oil in the blind ends of pores to be displaced. Supercritical CO2 enters the blind ends of pores through component exchange with the residual oil, triggering mass transfer and the desorbing oil films from the pore walls.
These observations highlight the superior sweep efficiency of CO2 flooding compared to water flooding, particularly in terms of accessing and displacing oil from smaller pore spaces and blind ends.

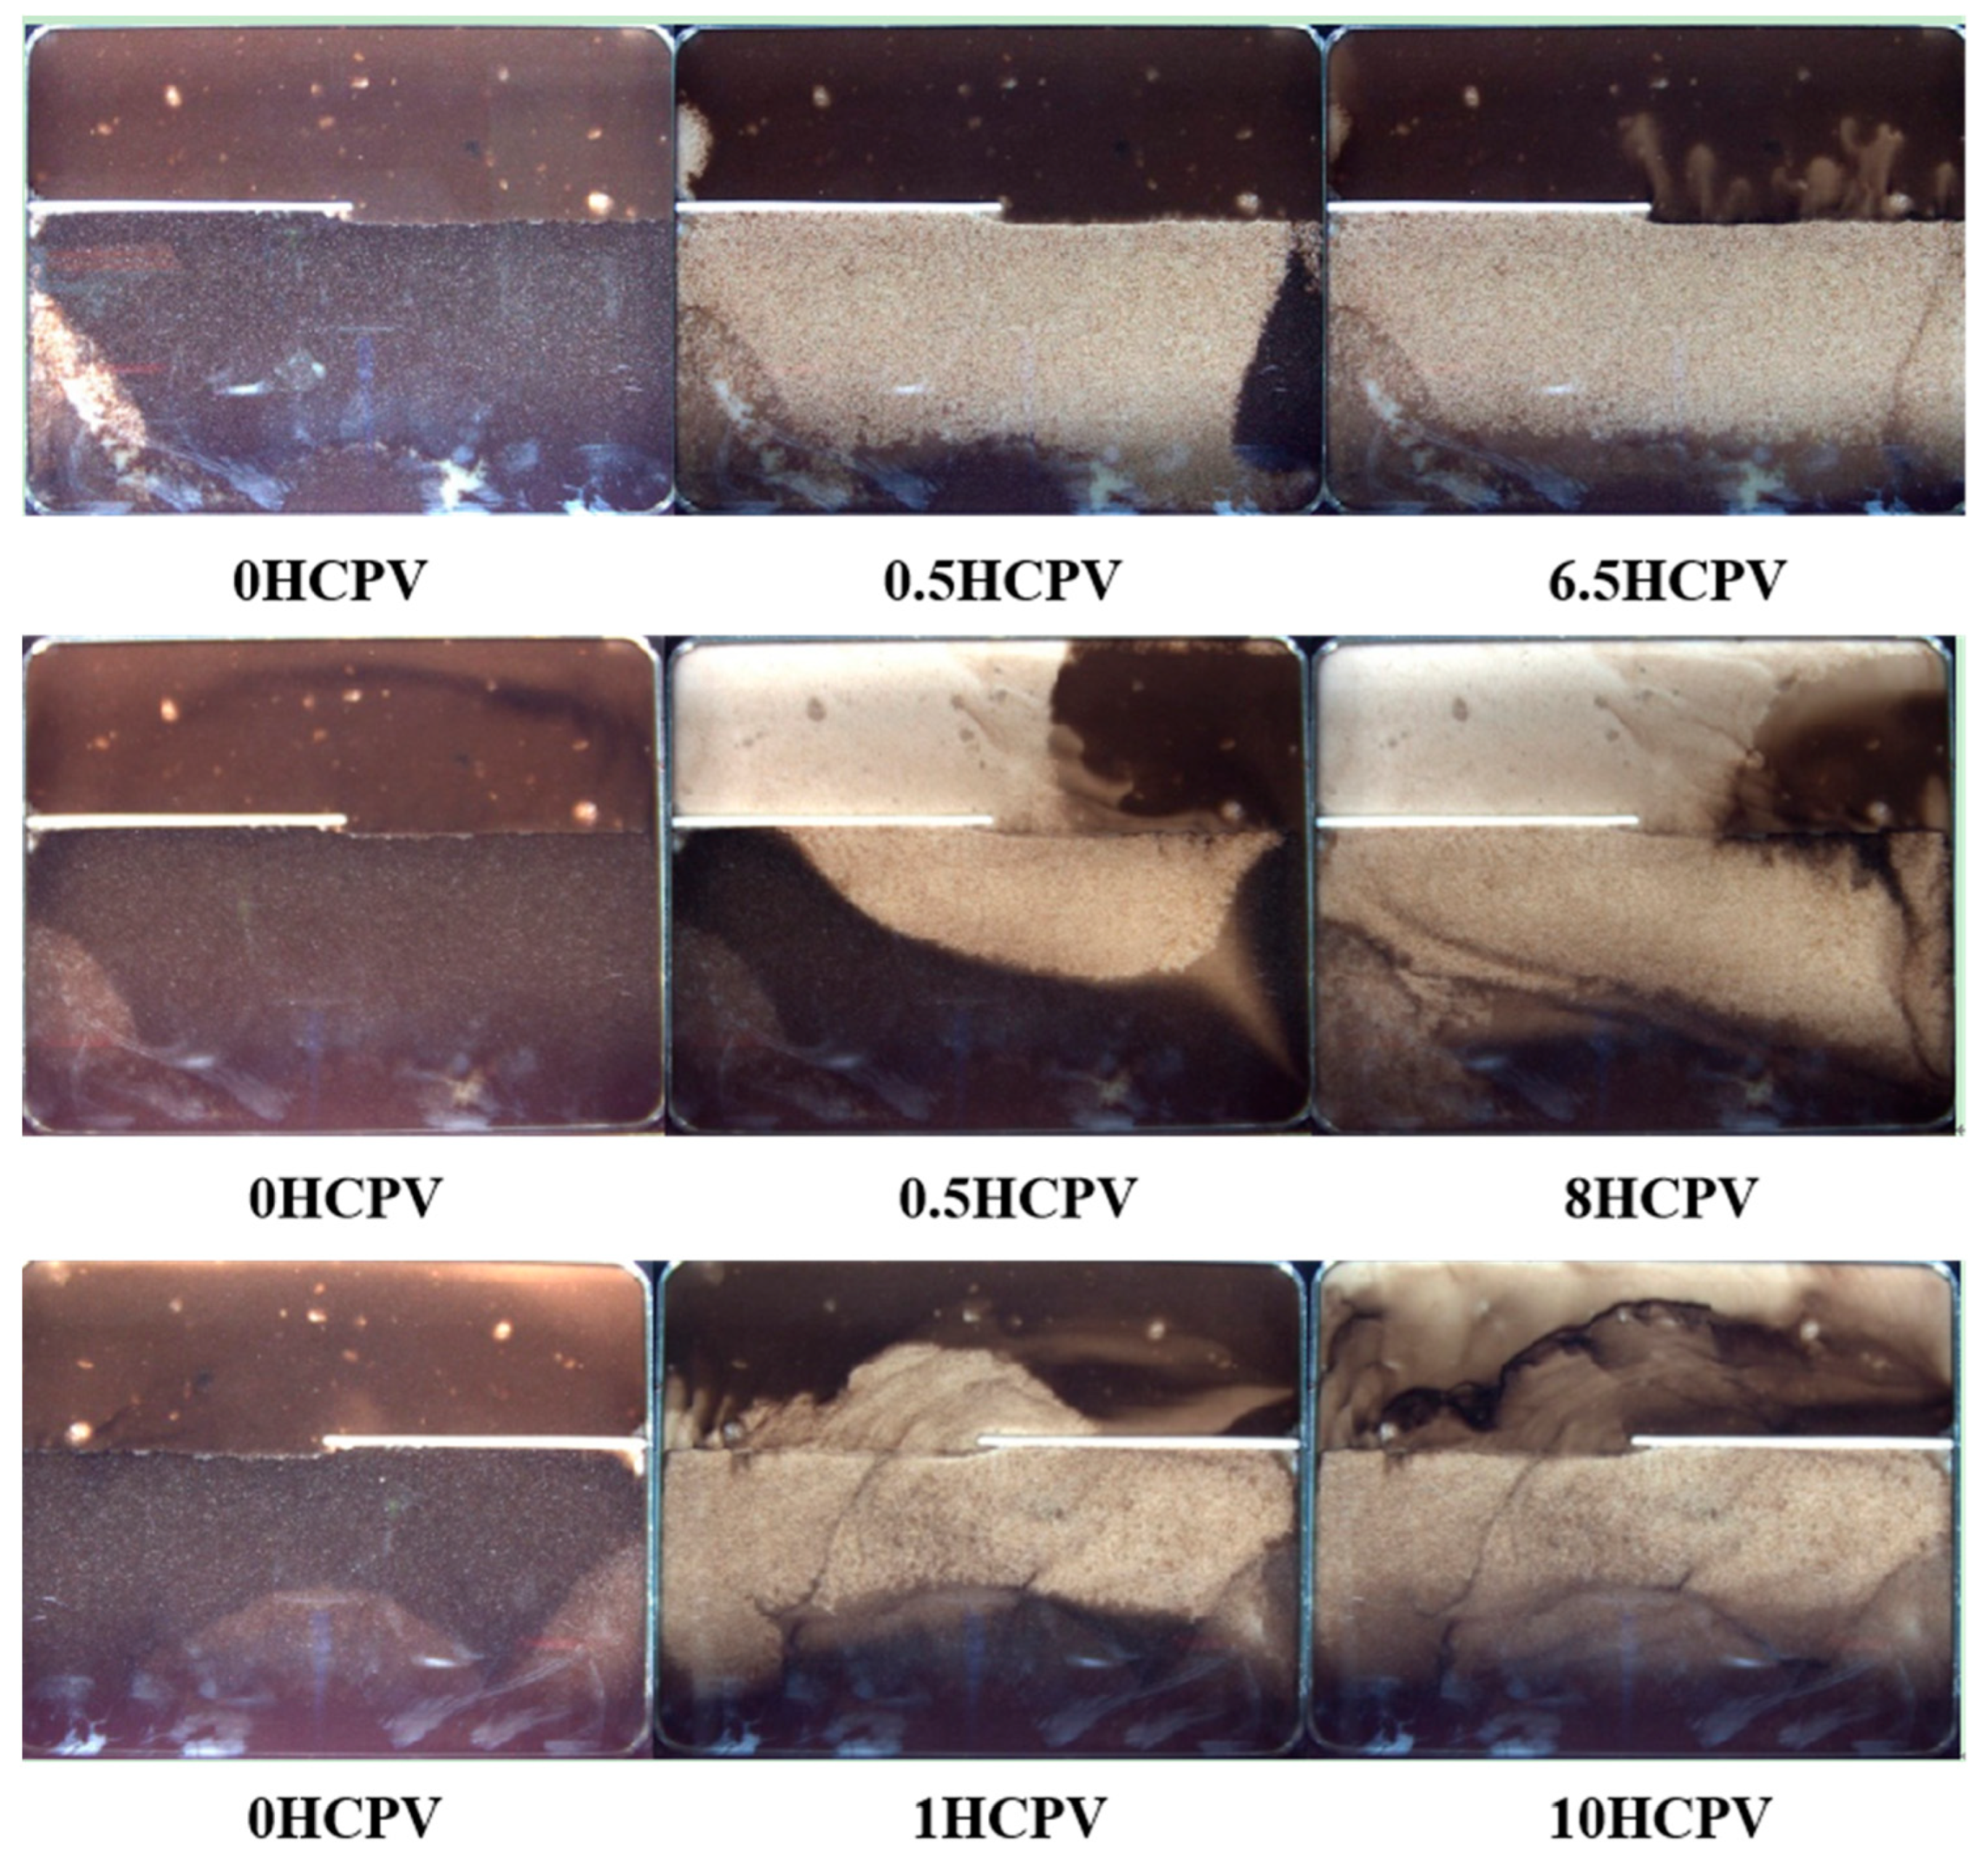
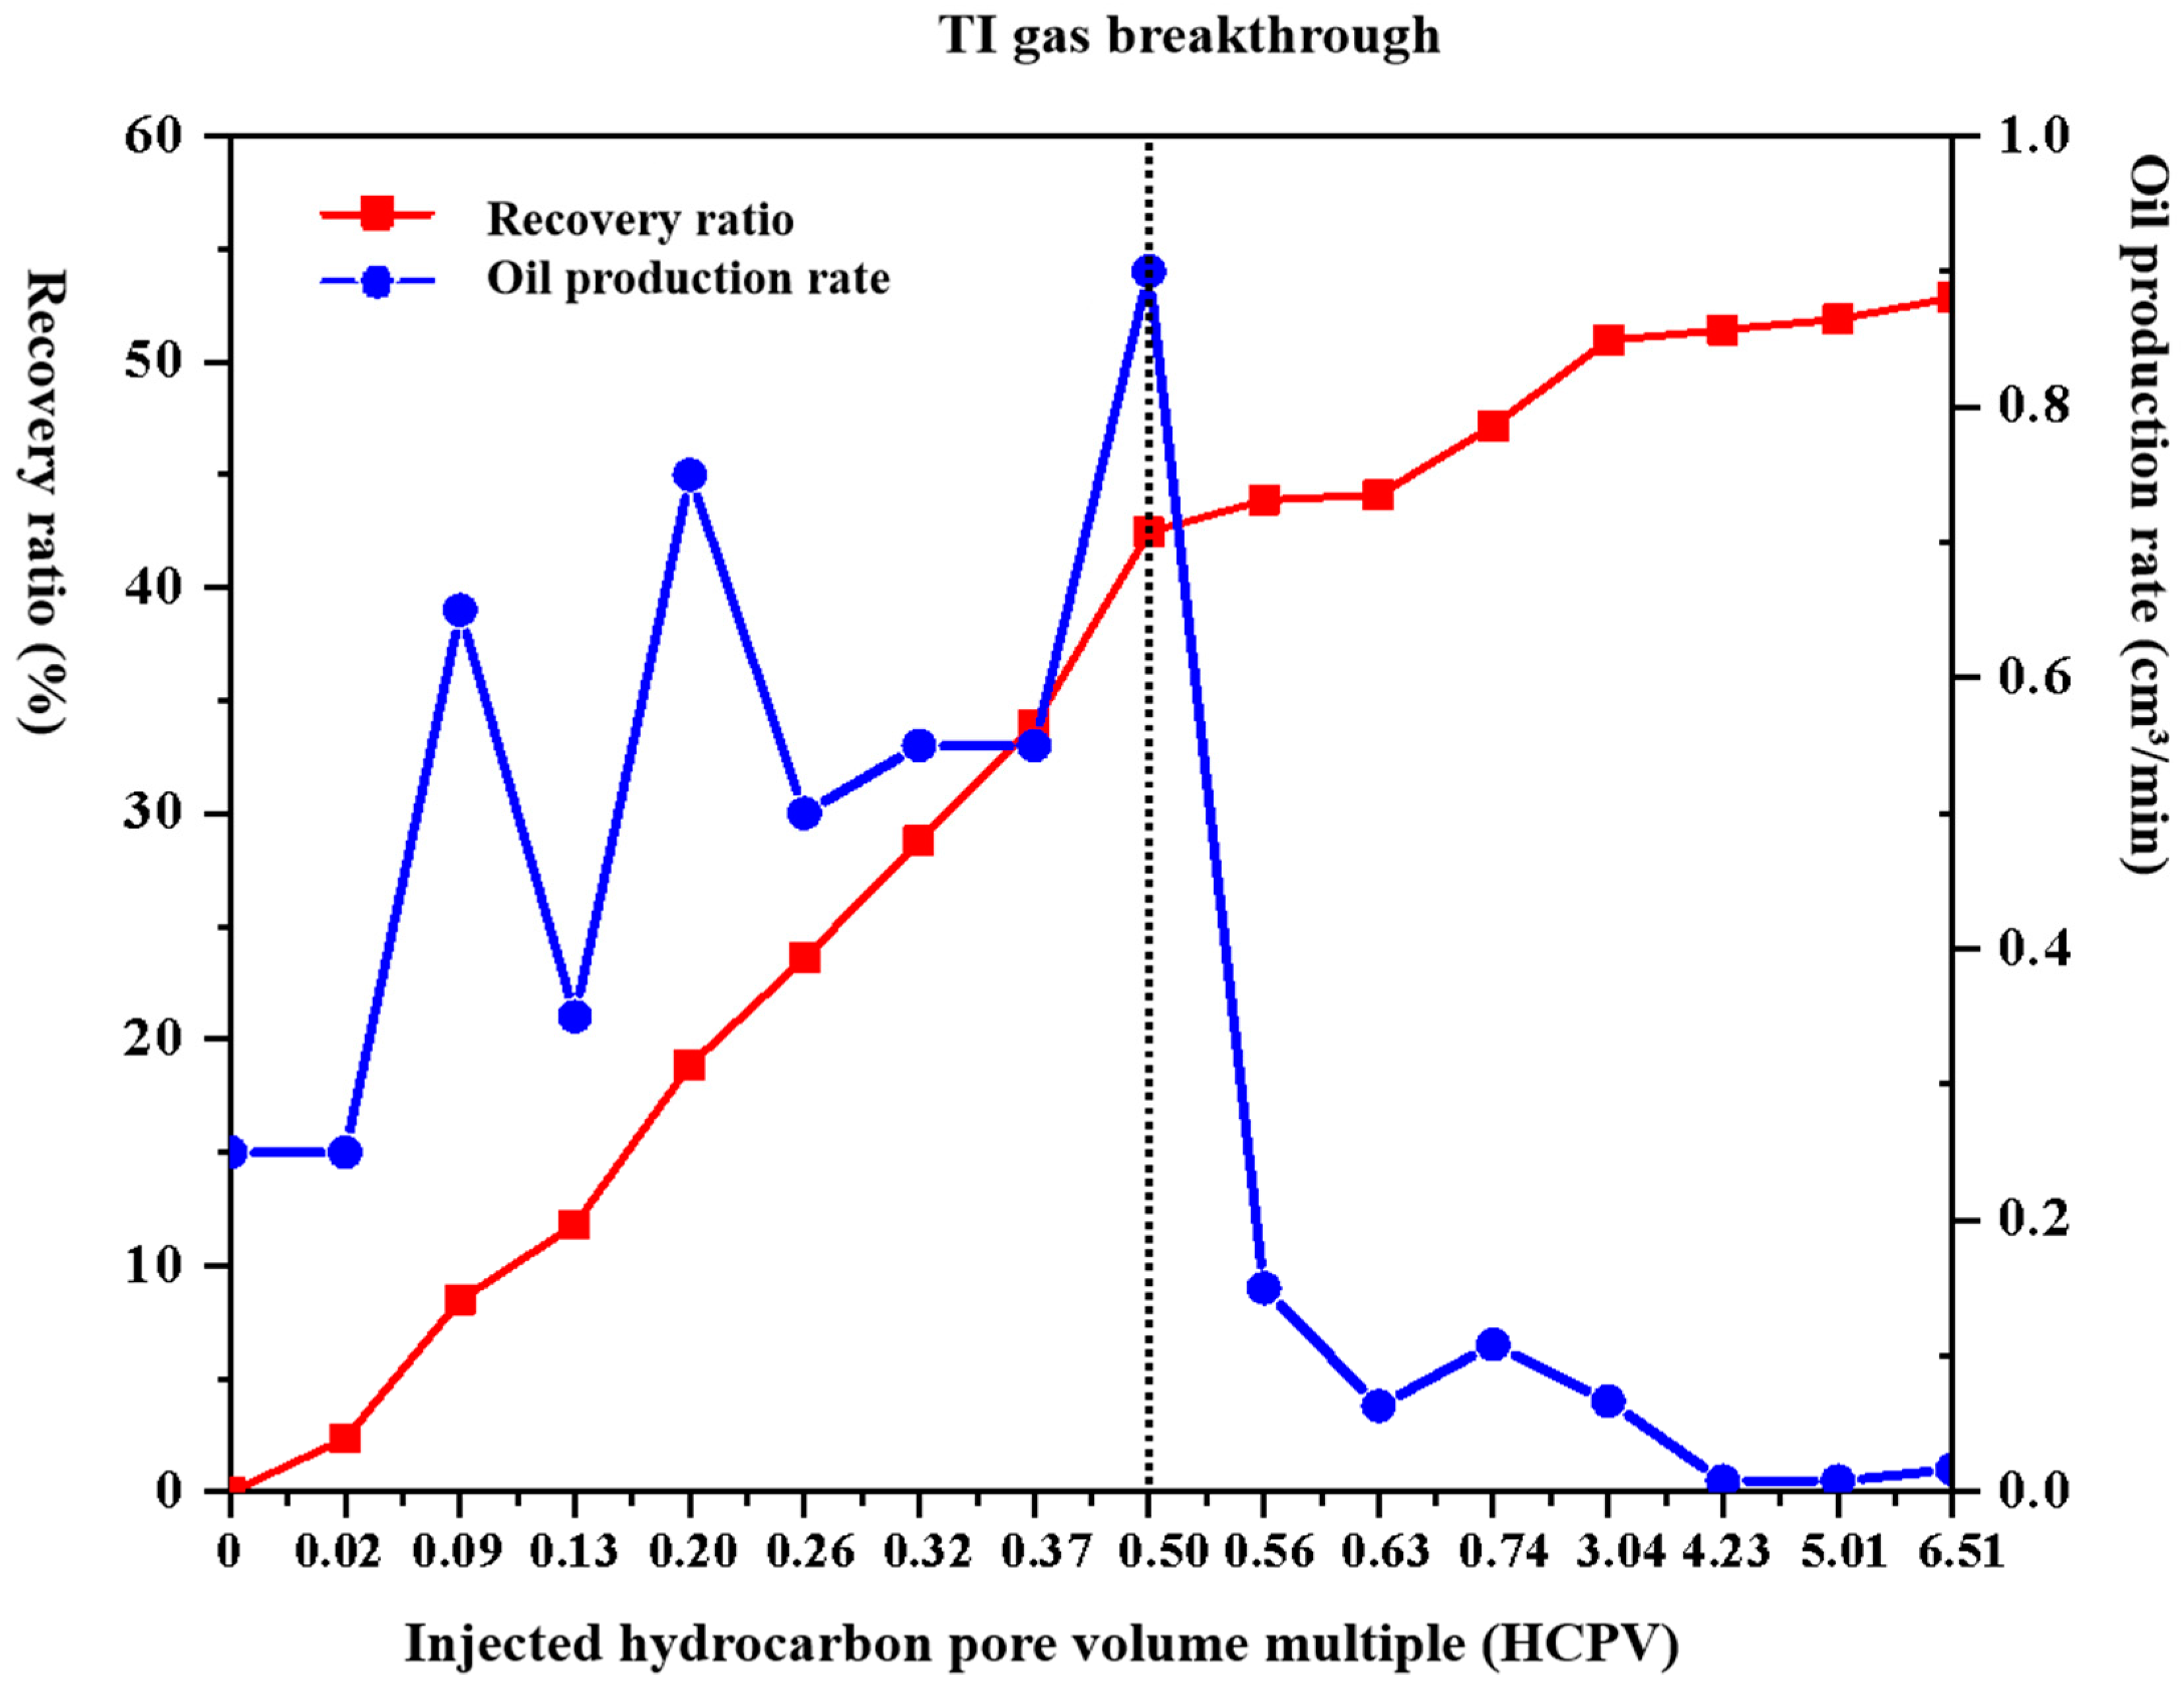
3.2. Macroscopical Sweep Characteristics of Carbon Dioxide Flooding

Figure 5 and Figure 6 show the images and curves related to the carbon dioxide (CO2) oil displacement process under conditions of co-injection and co-production with different hydrocarbon pore volume doubling rates (HCPVs) of injected hydrocarbons.
Co-Injection and Co-Production:
As depicted in Figure 5, when the upper and lower layers were co-injected with an isolation fluid and the lower layers far from the isolation fluid are produced, the total recovery rate was 52.83%. The process was dominated by flooding, with a weak miscibility effect. The inhalation ability is positively correlated with the permeability, leading to distinct differences in reservoir drive effects. A notable phenomenon of non-injection and non-extraction occurred in T12, which contrasted significantly with the T13 flooding [21].
Figure 7 illustrates the curves of the recovery degree and the oil recovery rate under different HCPV co-injection and co-production conditions. It can be observed that as the HCPV increased, the recovery degree initially rose rapidly before slowing down, with a critical HCPV of 0.5. The oil production rate initially increased in a wave-like pattern, then rapidly decreased, and subsequently declined more gradually. The HCPV at the TI gas breakthrough point was 0.5. The TI gas breakthrough indicates the point at which gas begins to break through into the production wells, marking a significant change in the flow dynamics and recovery efficiency [22].
Separate Injection and Combined Production:
Figure 5 also depicts the CO2 oil displacement process under separate injection and combined production with different pore volume doubling rates of injected hydrocarbons. The upper and lower layers were simultaneously injected with isolation fluid, while production occurred away from the lower layer. Considering the differences in physical properties, T12 was injected first, followed by T13, creating a dual effect of gravitational differentiation and spacer influence on fluid transport. This significantly affected the behavior of both the T12 and T13 layers, allowing CO2 to further reduce residual oil and effectively displace the mixed-phase zone, achieving a total recovery rate of up to 88.68% [23].
Figure 8 displays the curves of the recovery degree and the oil recovery rate under different HCPV separate injection and combined production conditions. With increasing HCPV, the recovery degree initially rose rapidly before slowing down, with a critical HCPV of 6.5. The oil production rate exhibited a wave-like increase, followed by a rapid decline, a subsequent rapid increase, and finally a gradual decline. The HCPV at the TI gas breakthrough point was 0.63, and the HCPV at the injection and recovery transformation point was 6.5. This is primarily due to the increased injection rate accelerating the diffusion of hydrocarbons within the pore space. Once the pore space is fully saturated with hydrocarbons, the development and production efficiencies improve, but further increases in the injection rate have minimal impact on recovery degree and oil recovery speed. “Suction capacity” refers to the capacity of the reservoir to absorb fluid. It is positively correlated with permeability, which means that, the higher the permeability, the stronger the inhalation ability. This is important because it affects the distribution and displacement of fluid in the reservoir.
Co-Injection and Co-Production with Different HCPVs:
Figure 5 provides images of the CO2 oil displacement process under co-injection and co-production with varying pore volume doubling rates of injected hydrocarbons. In this scenario, the upper and lower layers are co-injected away from the compartment and co-produced above and below the compartment. The total recovery can reach 83.02%, achieving mixed-phase flooding. The overall wave range is expanded under the effects of inhalation ability and density differences, particularly influencing the residual oil in T12 due to the interference of the diaphragm layer on oil and gas transport.
Figure 6 shows the change curves of the recovery degree and the oil production rate under different HCPV co-injection and co-production conditions. With increasing HCPV, the recovery degree initially rose rapidly before slowing down, with a critical HCPV of 6.52. The oil production rate exhibited a wave-like increase, followed by a rapid decrease, a subsequent rapid increase, and finally a gradual decline. The HCPV at the TI gas breakthrough point was 0.63, and the HCPV at the injection and recovery transformation point was 6.52. This is mainly due to the superior permeability of CO2, which effectively reduces interfacial tension and promotes crude oil flow. When the effect of CO2 flooding diminishes, the flow capacity of crude oil is reduced, and gas produced during flooding forms bubble bands in the reservoir, hindering crude oil flow.
Analyzing the dynamic displacement of different injection and recovery designs reveals that, under the strong heterogeneous conditions of the Lunnan 2 TI reservoir, different injection and recovery methods lead to noticeable differences in the mixed-phase wave characteristics and displacement effects between the two layers with permeability gradients. These differences directly impact the utilization of reservoir inhalation ability, gravitational anisotropy, density differences, and diaphragm control. Additionally, the development effectiveness of various injection methods is closely tied to diaphragm control effects. The development outcomes of different injection–production methods are highly dependent on the diaphragm control effect.

4. Conclusions

The Lunnan oilfield in the Tarim Basin is in the late stage of double-layer water flooding development, characterized by highly dispersed remaining oil reservoirs and a complex reservoir environment, making the improvement of oil recovery a challenging task. This study focuses on the TI reservoir in the No. 2 well area of the Lunnan oilfield in the Tarim Basin. Through the analysis of the geological characteristics of the Lunnan oilfield in the Tarim Basin, we observed the real-time interaction process between carbon dioxide and crude oil using transparent microscopic models and high-resolution imaging technologies. We visually simulated the microscopic waves and characteristics of carbon dioxide using glass etching models and simulated the development scenarios of the oilfield under various injection–production combinations using two-dimensional visual large-scale physical models. Based on these models, we conducted CO2 miscible flooding experiments under different injection–production modes, comparing the microscopic and macroscopic waveforms and characteristics of CO2 flooding, as well as the oil displacement efficiency under various injection–production modes. Our findings provide valuable data supporting the physical authenticity of the microscopic and macroscopic waveforms and characteristics of CO2 flooding in the Lunnan oilfield of the Tarim Basin. The main findings are summarized as follows:
(1)
Carbon dioxide flooding in non-homogeneous reservoirs: The target block reservoirs exhibit non-homogeneous stratigraphic characteristics. Two-dimensional visual experiments were conducted based on a glass etched object model to investigate the microscopic waves and characteristics of CO2 flooding. During water flooding, water is predominantly found in the large pore throats and pores connected to large pore throats, while the small pore throats and pore spaces controlled by small pore throats, as well as pore blind ends, are difficult to drain, leaving residual oil primarily in the form of small pore channel retention and adsorption on the wall surface. CO2 flooding is primarily a mixed-phase driving with crude oil, characterized by strong component exchange and pore filling. At the late stage of the driving, the oil film on the wall surface can be desorbed. The microscopic driving efficiency approaches 100%, and with an increasing CO2 pore volume multiplier, the crude oil in the pore blind ends can be cleanly displaced. Supercritical CO2 enters the blind-end pore space through component exchange and mass transfer, mobilizing a large amount of residual oil.
(2)
Macroscopic waves and characteristics of CO2 flooding: Three groups of two-dimensional visual physical simulation experiments were designed based on the distribution position of the isolation layer and the physical properties of T12 and T13. For the isolation layer located at the injection and production ends, combined injection–production and split injection-production methods were used to simulate the conditions. Under the strong non-homogeneity of the Lunnan 2 TI reservoir, different injection and production modes lead to noticeable differences in the mixed-phase wave characteristics and displacement effects between the two layers with permeability gradient differences. These differences directly impact the utilization of reservoir suction capacity, gravitational anisotropy, density differences, and the control effect of the isolation layer. The differences in the development effects of various injection and production modes are more closely related to the control effect of the isolation layer.
In summary, this study employed advanced transparent microscopic models, high-resolution imaging, and two-dimensional visual large-scale physical simulations to analyze the micro- and macro-characteristics of CO2 flooding. By directly observing the interaction process between CO2 and crude oil, this study provides unprecedented insights into the oil displacement effect of CO2 in a challenging reservoir environment. The research results are of direct significance for optimizing the reservoir development strategy and improving oil recovery in the Lunnan oilfield and similar geological environments. Overall, this study represents a significant advancement in the field of enhanced oil recovery and provides new insights into the application of carbon dioxide for oil recovery under challenging reservoir conditions.

Author Contributions

Conceptualization, R.W. and L.L.; Methodology, R.W.; Software, Y.T.; Validation, Y.T.; Formal analysis, D.Z.; Investigation, D.Z.; Resources, W.Z. and L.L.; Data curation, W.Z. and Z.W.; Writing—original draft, W.Z.; Writing—review & editing, W.Z.; Visualization, Z.W. All authors have read and agreed to the published version of the manuscript.

Funding

This research received no external funding.

Institutional Review Board Statement

Not applicable.

Informed Consent Statement

Not applicable.

Data Availability Statement

The figures and tables used to support the findings of this study are included in the article.

Acknowledgments

The authors would like to show sincere thanks to those who have contributed to this research.

Conflicts of Interest

Authors Rujun Wang, Yongliang Tang, Daiyu Zhou and Zangyuan Wu were employed by the company Tarim Oilfield Company, PetroChina. The remaining authors declare that the research was conducted in the absence of any commercial or financial relationships that could be construed as a potential conflict of interest.

References

  1. Li, X.; Peng, B.; Liu, Q.; Liu, J.; Shang, L. Micro and nanobubbles technologies as a new horizon for CO2-EOR and CO2 geological storage techniques: A review. Fuel 2023, 341, 127661. [Google Scholar] [CrossRef]
  2. Chowdhury, S.; Rakesh, M.; Medhi, S.; Shrivastava, S.; Dehury, R.; Sangwai, J.S. Three-phase fluid flow interaction at pore scale during water-and surfactant-alternating gas (WAG/SAG) injection using carbon dioxide for geo-sequestration and enhanced oil recovery. Energy Fuels 2023, 37, 5270–5290. [Google Scholar] [CrossRef]
  3. Wu, F.; Li, N.; Yang, W.; Chen, J.; Ding, B.; Xia, L.; Liu, J.; Wang, C.; Wang, L. Experimental characterization and mechanism of hydraulic pulsation waves driving microscopic residual oil. Pet. Explor. Dev. 2022, 49, 1411–1422. [Google Scholar] [CrossRef]
  4. Wang, X.; Li, S.; Tong, B.; Jiang, L.; Lv, P.; Zhang, Y.; Song, Y. Wettability and capillary behavior in a CO2–oil–solid system under near-miscible conditions: A pore-scale study. Fuel 2024, 364, 131164. [Google Scholar] [CrossRef]
  5. Chen, Z.; Yuan, Y.; Yan, C.; Wang, W.; Qin, Z. A novel carbon dioxide phase transition rock breaking technology: Theory and application of non-explosive blasting. Processes 2022, 10, 2434. [Google Scholar] [CrossRef]
  6. Wang, L.; He, Y.; Wang, Q.; Liu, M.; Jin, X. Multiphase flow characteristics and EOR mechanism of immiscible CO2 water-alternating-gas injection after continuous CO2 injection: A micro-scale visual investigation. Fuel 2020, 282, 118689. [Google Scholar] [CrossRef]
  7. Xu, J.; Zhai, C.; Ranjith, P.G.; Sun, Y.; Cong, Y.; Zheng, Y.; Tang, W.; Yang, W. Investigation of non-isothermal effect of cyclic carbon dioxide on the petrography of coals for coal mine methane recovery. Fuel 2021, 290, 120085. [Google Scholar] [CrossRef]
  8. Sennaoui, B.; Pu, H.; Afari, S.; Malki, M.L.; Kolawole, O. Pore- and core-scale mechanisms controlling supercritical cyclic gas utilization for enhanced recovery under immiscible and miscible conditions in the three forks formation. Energy Fuels 2022, 37, 459–476. [Google Scholar] [CrossRef]
  9. Syed, F.I.; Dahaghi, A.K.; Muther, T. Laboratory to field scale assessment for EOR applicability in tight oil reservoirs. Pet. Sci. 2022, 19, 2131–2149. [Google Scholar] [CrossRef]
  10. Shafiai, S.H.; Gohari, A. Conventional and electrical EOR review: The development trend of ultrasonic application in EOR. J. Pet. Explor. Prod. Technol. 2020, 10, 2923–2945. [Google Scholar] [CrossRef]
  11. Shewchuk, S.R.; Mukherjee, A.; Dalai, A.K. Selective carbon-based adsorbents for carbon dioxide capture from mixed gas streams and catalytic hydrogenation of CO2 into renewable energy source: A review. Chem. Eng. Sci. 2021, 243, 116735. [Google Scholar] [CrossRef]
  12. Zhang, X.; Li, L.; Su, Y.; Fu, J.; Wang, R.; Chen, F. Microfluidic investigation on asphaltene interfaces attempts to carbon sequestration and leakage: Oil-CO2 phase interaction characteristics at ultrahigh temperature and pressure. Appl. Energy 2023, 348, 121518. [Google Scholar] [CrossRef]
  13. Wang, Y.; Han, X.; Li, J.; Liu, R.; Wang, Q.; Huang, C.; Wang, X.; Zhang, L.; Lin, R. Review on oil displacement technologies of enhanced oil recovery: State-of-the-art and outlook. Energy Fuels 2023, 37, 2539–2568. [Google Scholar] [CrossRef]
  14. Li, L.; Zhang, D.; Lei, Z.; Zhang, X.; Xie, Q.; Su, Y.; Qin, Y.; Zhang, T. Investigation on displacement efficiency and enhance oil recovery performance of CO2 and CO2-chemical additive composite system flooding using LBM simulation. J. Ind. Eng. Chem. 2024, 131, 593–606. [Google Scholar] [CrossRef]
  15. Luo, X.J.; Wei, B.; Gao, K.; Jing, B.; Huang, B.; Guo, P.; Yin, H.-Y.; Feng, Y.-J.; Zhang, X. Gas channeling control with an in-situ smart surfactant gel during water-alternating-CO2 enhanced oil recovery. Pet. Sci. 2023, 20, 2835–2851. [Google Scholar] [CrossRef]
  16. Ma, D.; Cheng, C.; Ding, C.; Song, J.; Hu, D.; Zhou, H. Comparisons of fracturing mechanism of tight sandstone using liquid CO2 and water. J. Nat. Gas Sci. Eng. 2021, 94, 104108. [Google Scholar] [CrossRef]
  17. Pal, N.; Verma, A.; Ojha, K.; Mandal, A. Nanoparticle-modified gemini surfactant foams as efficient displacing fluids for enhanced oil recovery. J. Mol. Liq. 2020, 310, 113193. [Google Scholar] [CrossRef]
  18. Dong, Y.; Song, L.; Lai, F.; Zhao, Q.; Lu, C.; Chen, G.; Chong, Q.; Yang, S.; Wang, J. Characterization of the Macroscopic Impact of Diverse Microscale Transport Mechanisms of Gas in Micro-Nano Pores and Fractures. Energies 2024, 17, 1145. [Google Scholar] [CrossRef]
  19. Zhao, X.; Zhan, F.; Liao, G.; Liu, W.; Su, X.; Feng, Y. In situ micro-emulsification during surfactant enhanced oil recovery: A microfluidic study. J. Colloid Interface Sci. 2022, 620, 465–477. [Google Scholar] [CrossRef]
  20. Huang, M.; Hu, Y.; Wang, X.; Kang, Y.; Cai, C. Experimental investigation on the flow and rock breaking characteristics of supercritical carbon dioxide jets. J. Pet. Sci. Eng. 2020, 187, 106735. [Google Scholar] [CrossRef]
  21. Gao, D.; Yang, J.; Qi, Y.; Guo, C.; Zhang, H. Review and perspectives on CO2 bubble dynamic characteristics in different liquids during carbon capture, utilization, and storage process. Energy Fuels 2022, 37, 58–73. [Google Scholar] [CrossRef]
  22. Yuan, C.; Varfolomeev, M.A.; Kok, M.V.; Nurgaliev, D.K.; Gabbasov, A.H. Applications of Enhanced Oil Recovery Techniques of Heavy Crudes. In Catalytic In-Situ Upgrading of Heavy and Extra-Heavy Crude Oils; John Wiley & Sons, Ltd.: Hoboken, NJ, USA, 2023; pp. 153–167. [Google Scholar]
  23. Saw, R.K.; Sinojiya, D.; Pillai, P.; Prakash, S.; Mandal, A. Experimental investigation of the synergistic effect of two nonionic surfactants on interfacial properties and their application in enhanced oil recovery. ACS Omega 2023, 8, 12445–12455. [Google Scholar] [CrossRef] [PubMed]
Figure 1. Flow chart of two-dimensional visual experimental device.
Applsci 14 09007 g001
Figure 2. Visual large model design and physical drawing.
Applsci 14 09007 g002
Figure 3. Different injection–production design schemes.
Applsci 14 09007 g003
Figure 4. Microscopic simulation and remaining oil distribution of water flooding in glass etching model.
Applsci 14 09007 g004
Figure 5. Images of CO2 oil flooding process under co-injection and co-production with different injected hydrocarbon pore volume multiplication rates.
Applsci 14 09007 g005
Figure 6. Change curves of recovery degree and oil production rate under different HCPV co-injection and co-production conditions.
Applsci 14 09007 g006
Figure 7. Variation curves of recovery degree and oil production rate under different HCPV co-injection and co-production conditions.
Applsci 14 09007 g007
Figure 8. Variation curves of recovery degree and oil production rate under different HCPV split injection and combined recovery conditions.
Applsci 14 09007 g008
Table 1. Different injection–production model schemes.
Scheme LabelInjection PositionProduction Position
1T12, T13 co-injection, with compartmentalized interlayer at injection end (co-injection and co-extraction)T12 and T13 combined mining
2T12, T13 split injection, with the compartmentalized sandwich at the injection end (split injection and combined mining)T12 and T13 combined mining
3T12, T13 split injection, isolated interlayer at extraction end (combined injection and extraction)T12 and T13 combined mining
Disclaimer/Publisher’s Note: The statements, opinions and data contained in all publications are solely those of the individual author(s) and contributor(s) and not of MDPI and/or the editor(s). MDPI and/or the editor(s) disclaim responsibility for any injury to people or property resulting from any ideas, methods, instructions or products referred to in the content.

