

Seismic Wave Amplification Characteristics in Slope Sections of Various Inclined Model Grounds


Abstract
:1. Introduction
2. Experimental Method for Model Ground Using Shaking Table
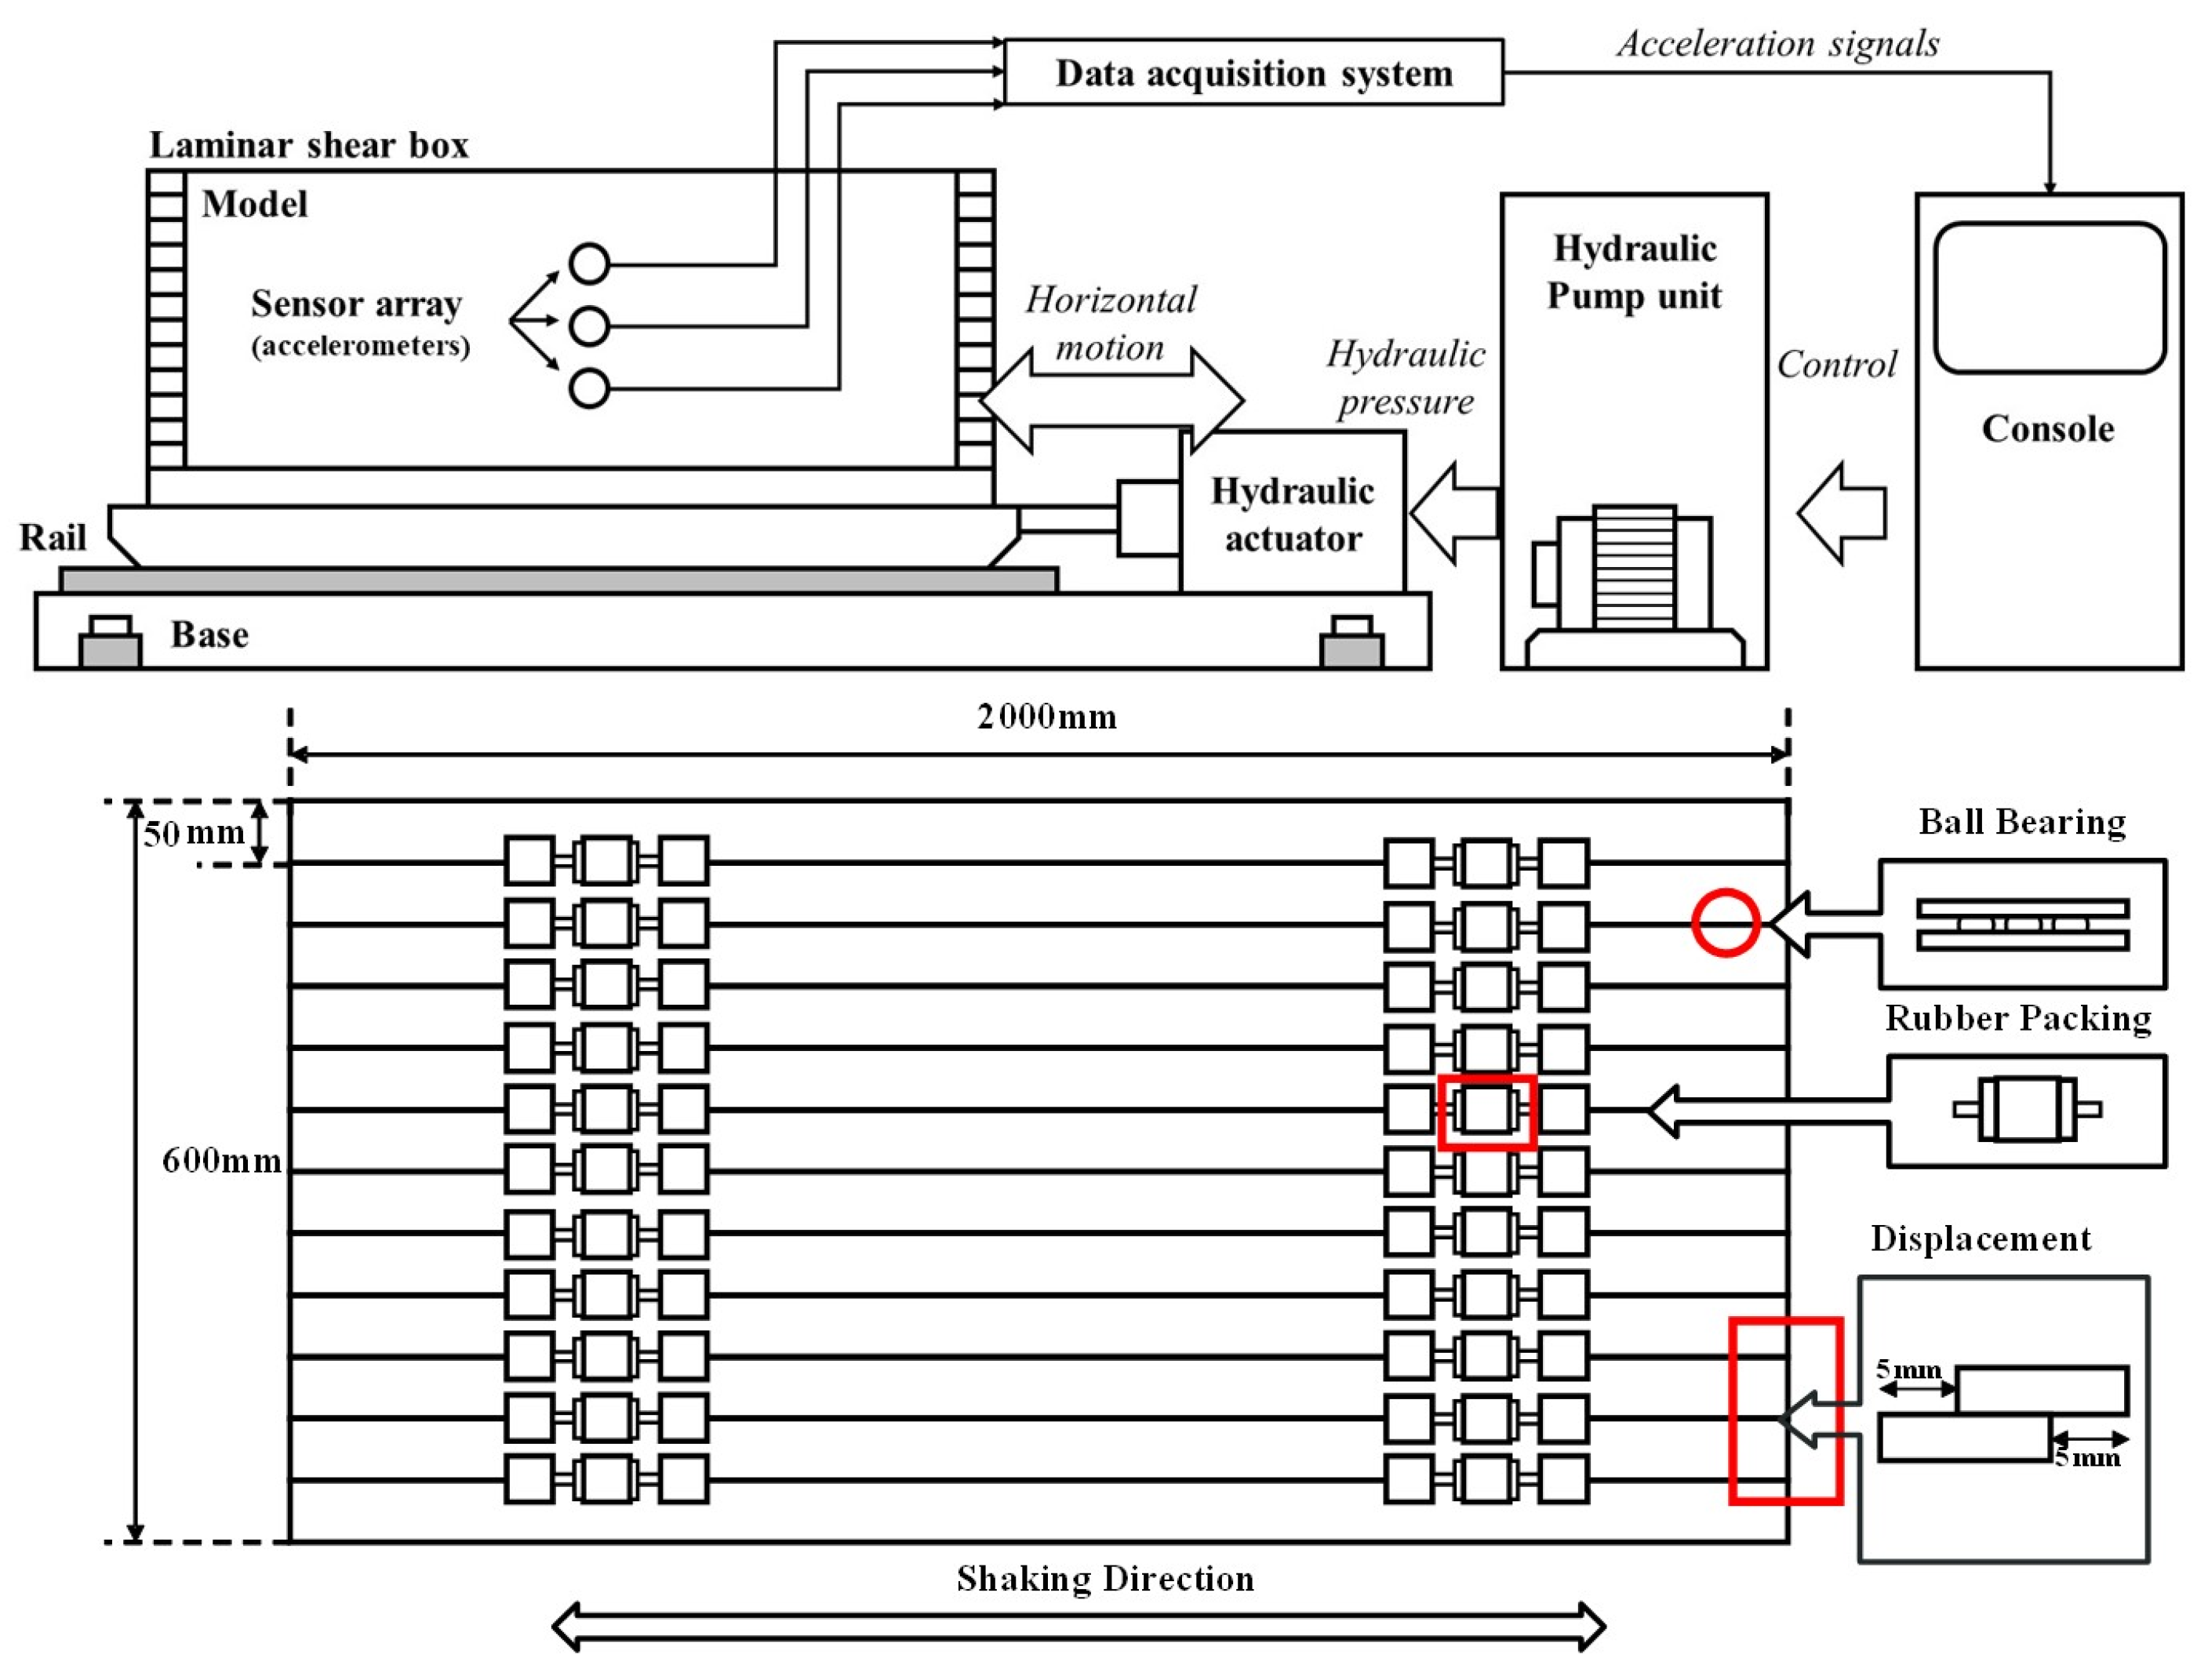
2.1. Expermental Equipment
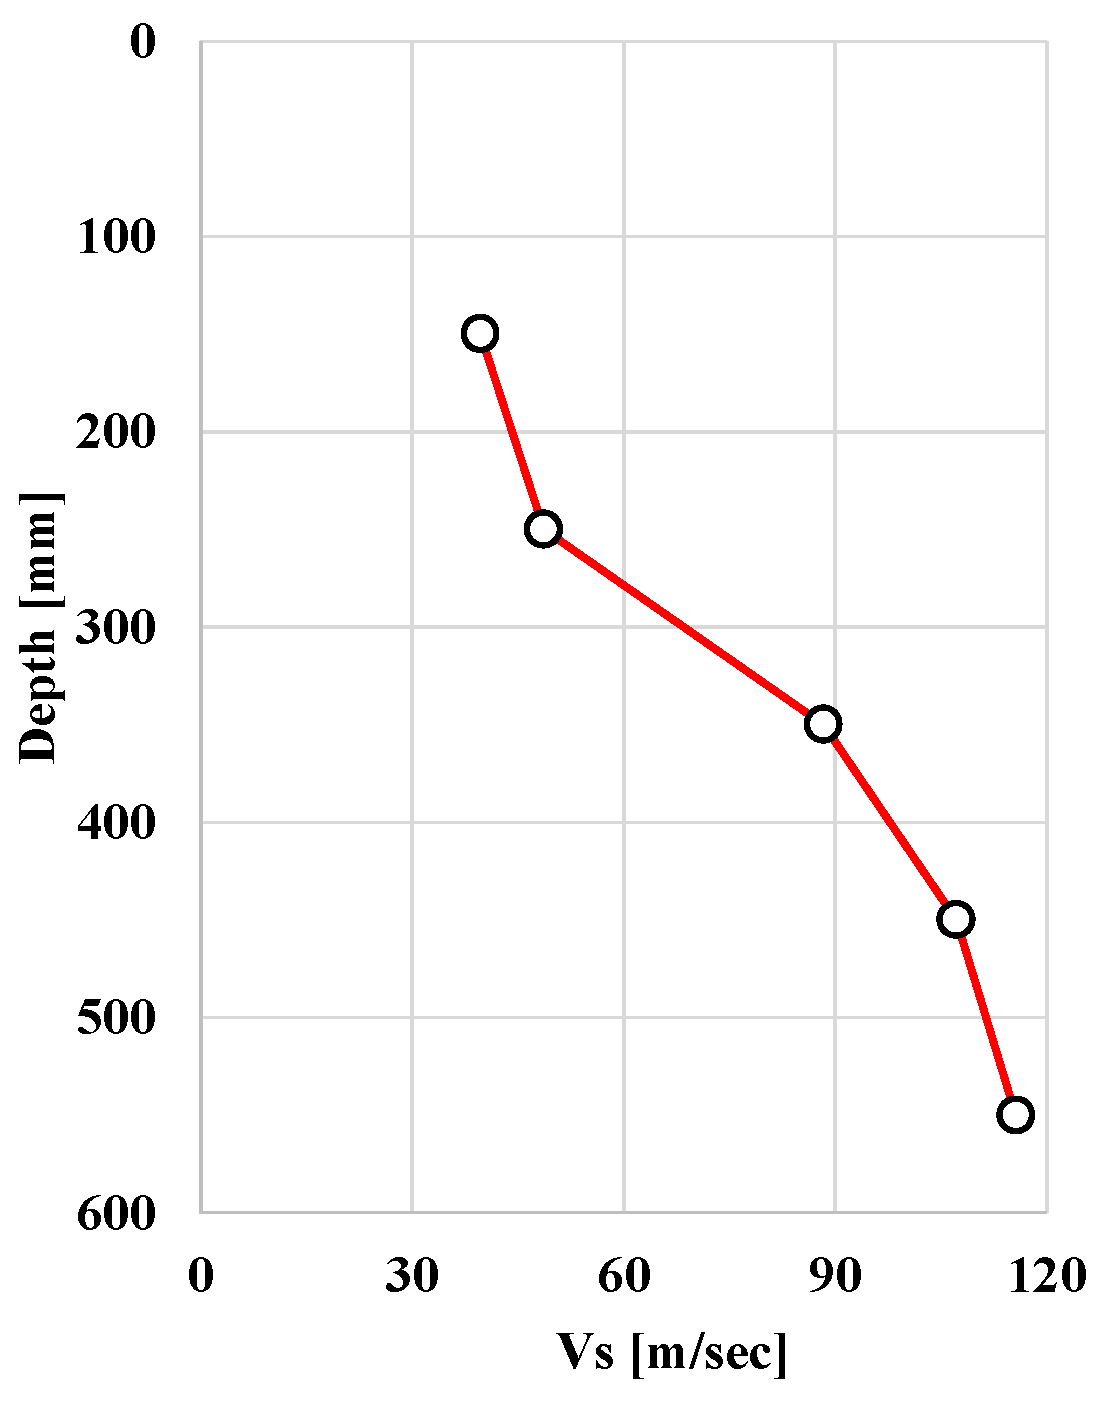
2.2. Physical Properties of Weathered Soil Specimens
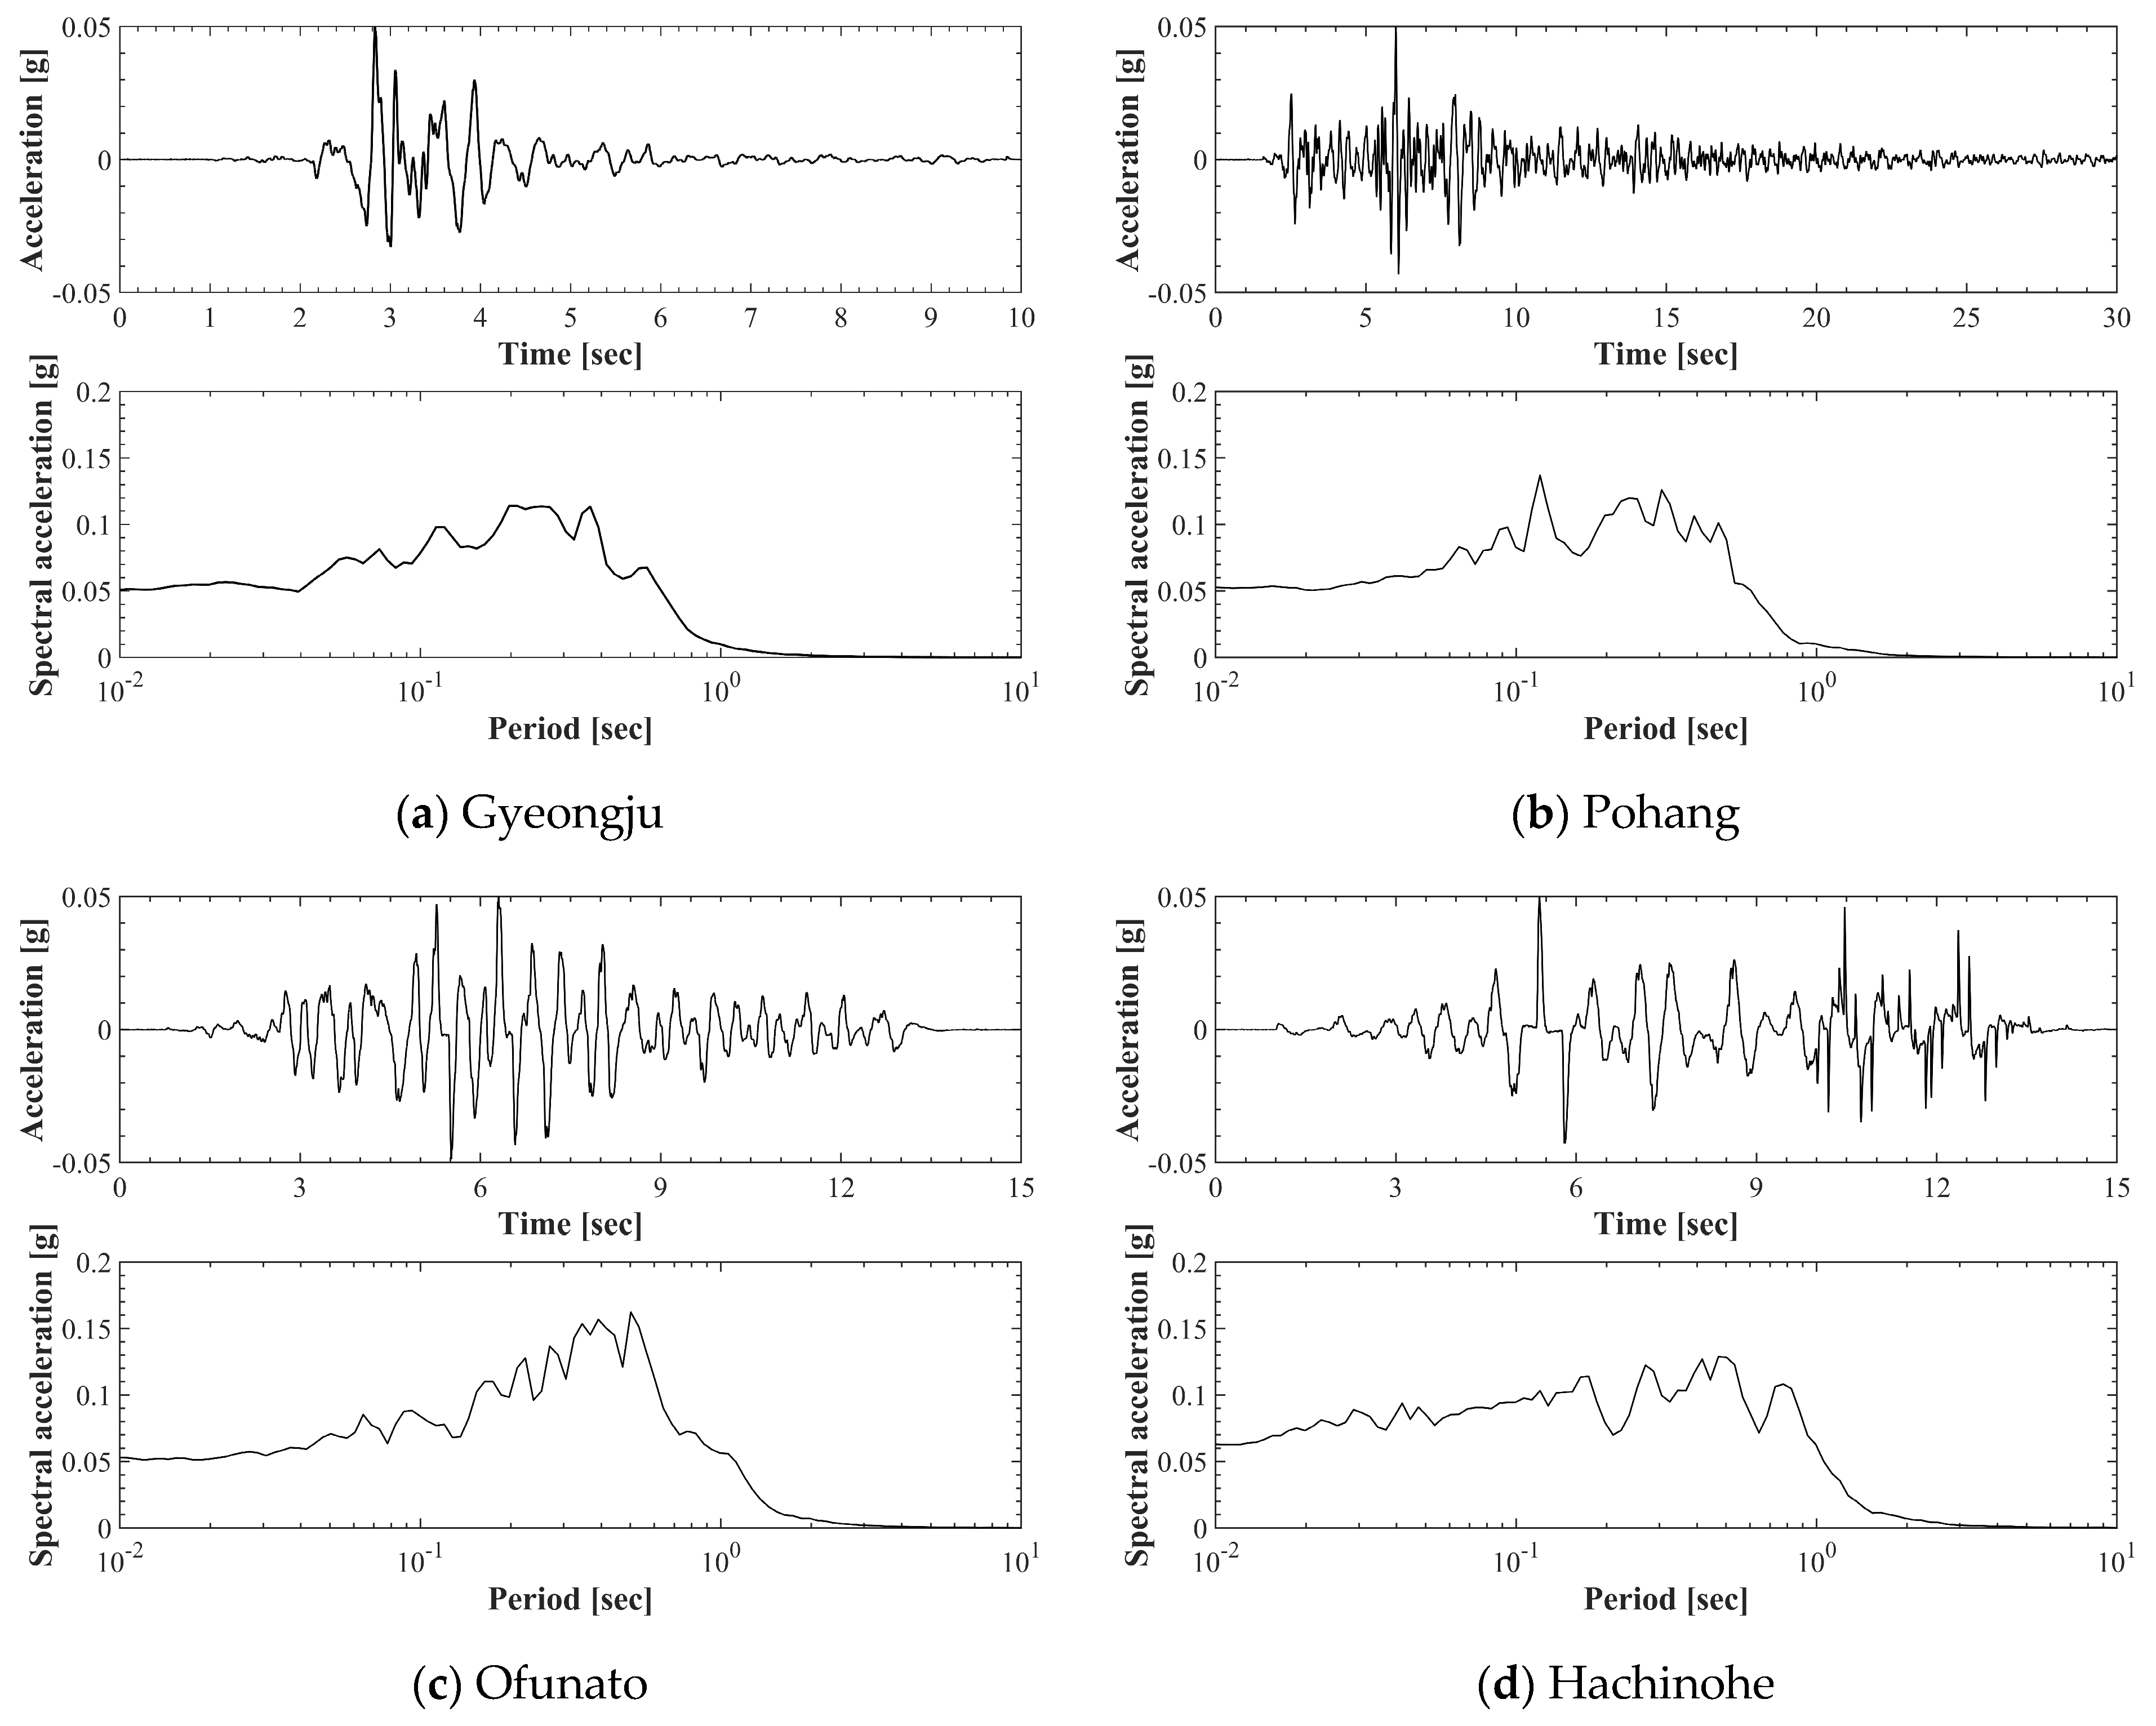
2.3. Input-Motion
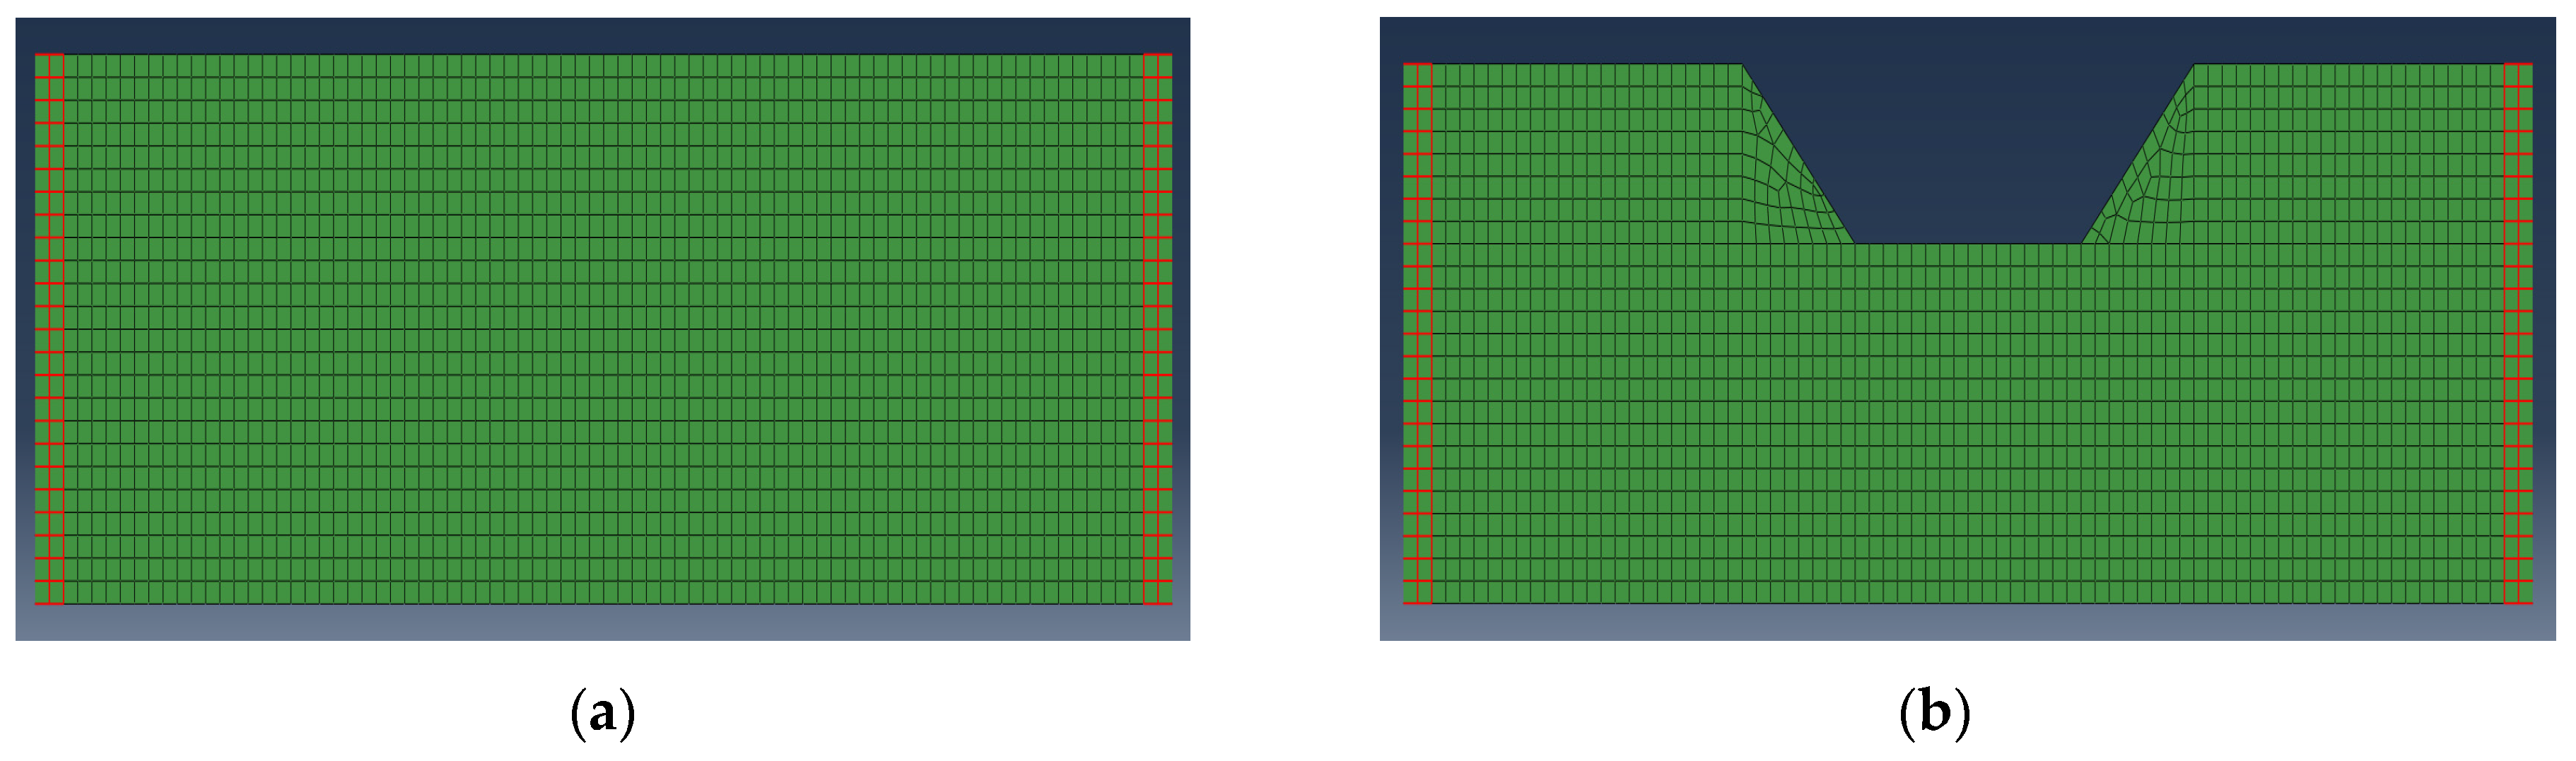
2.4. Ground Models
3. Analysis of 1 g Shaking Table Experiment Results
3.1. Comparative Analysis of Acceleration Amplification
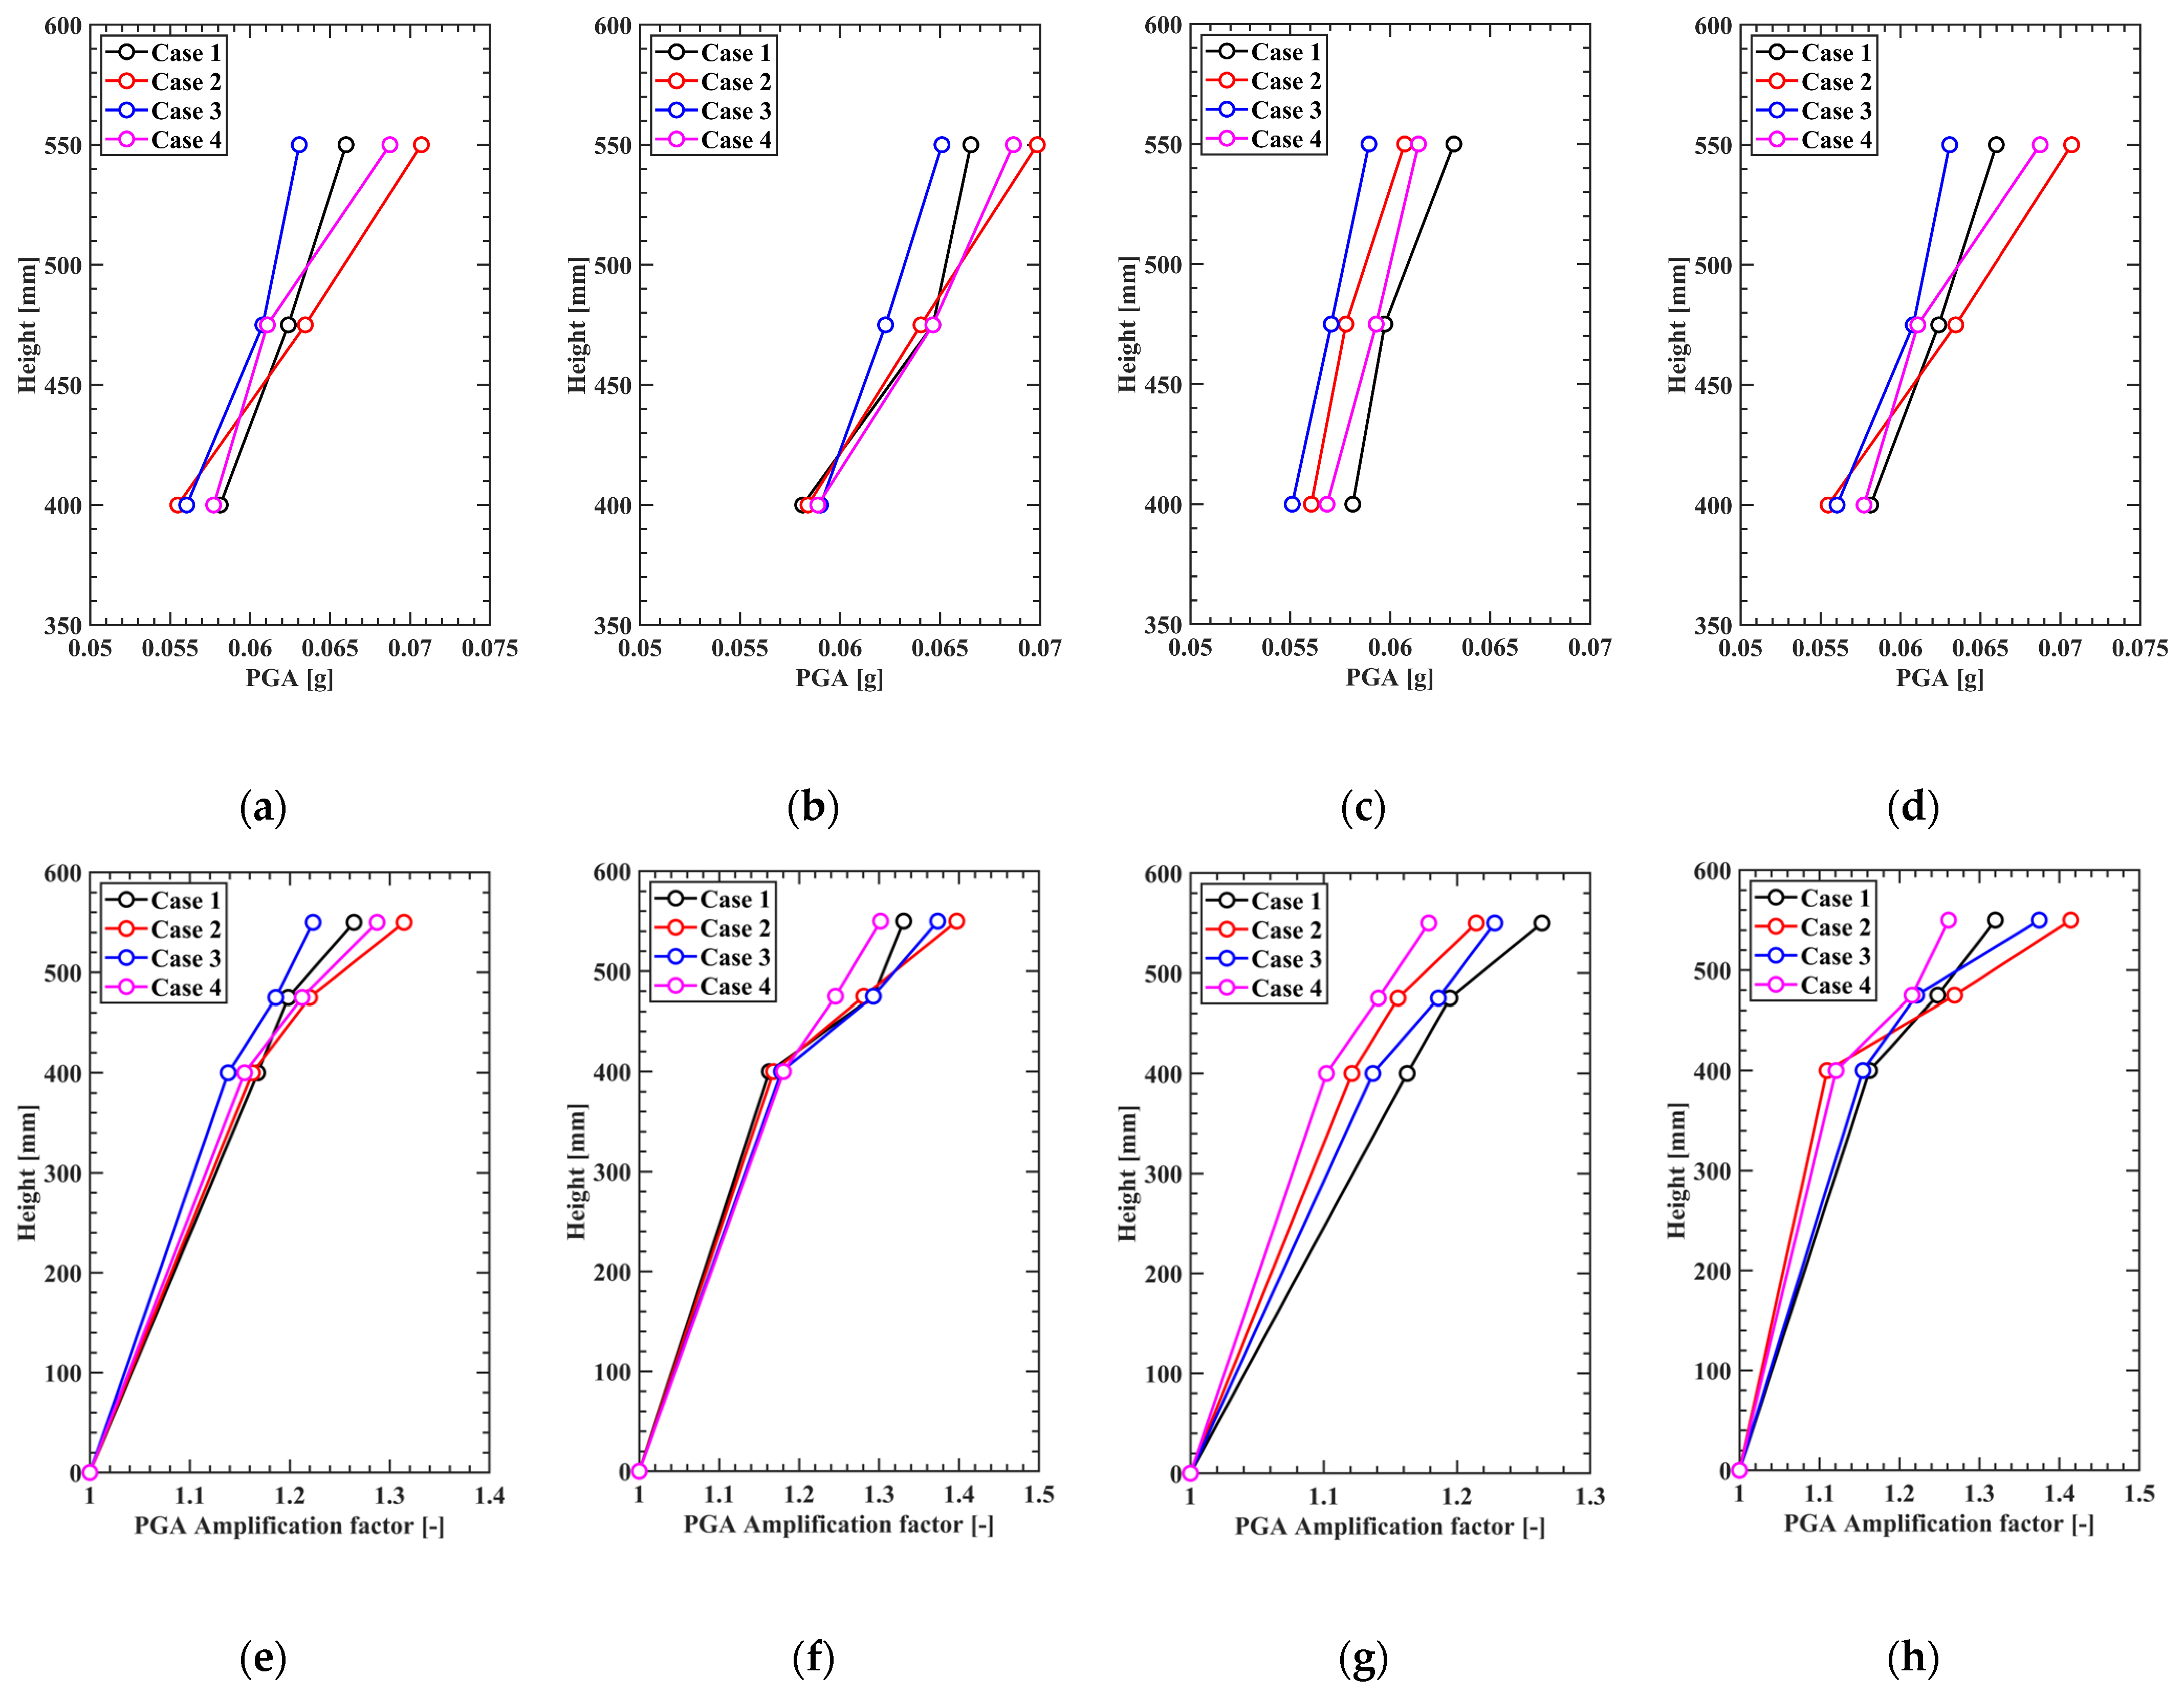
3.1.1. Slope Section PGA
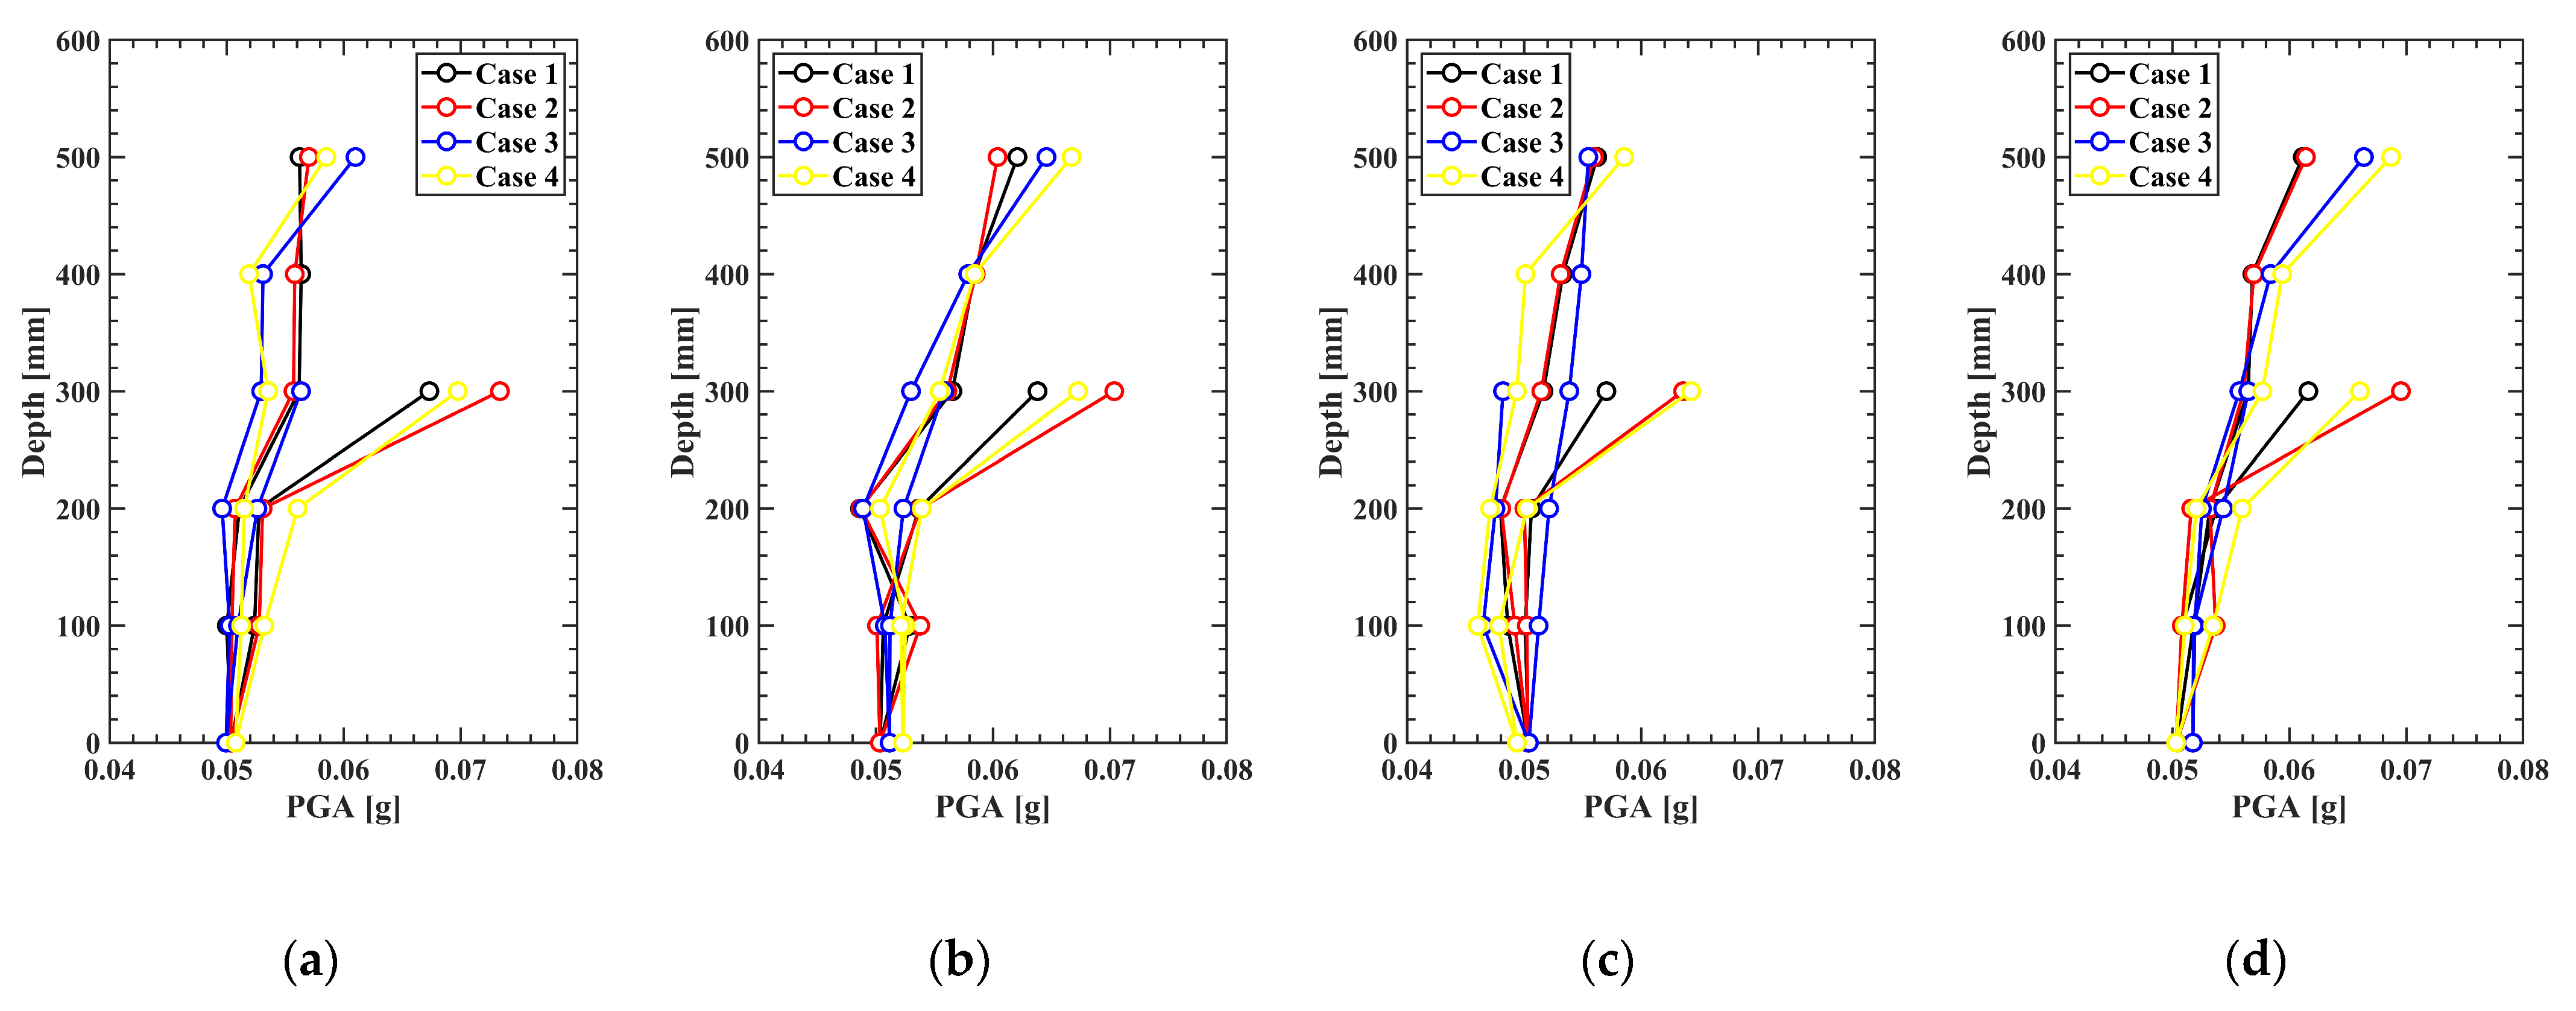
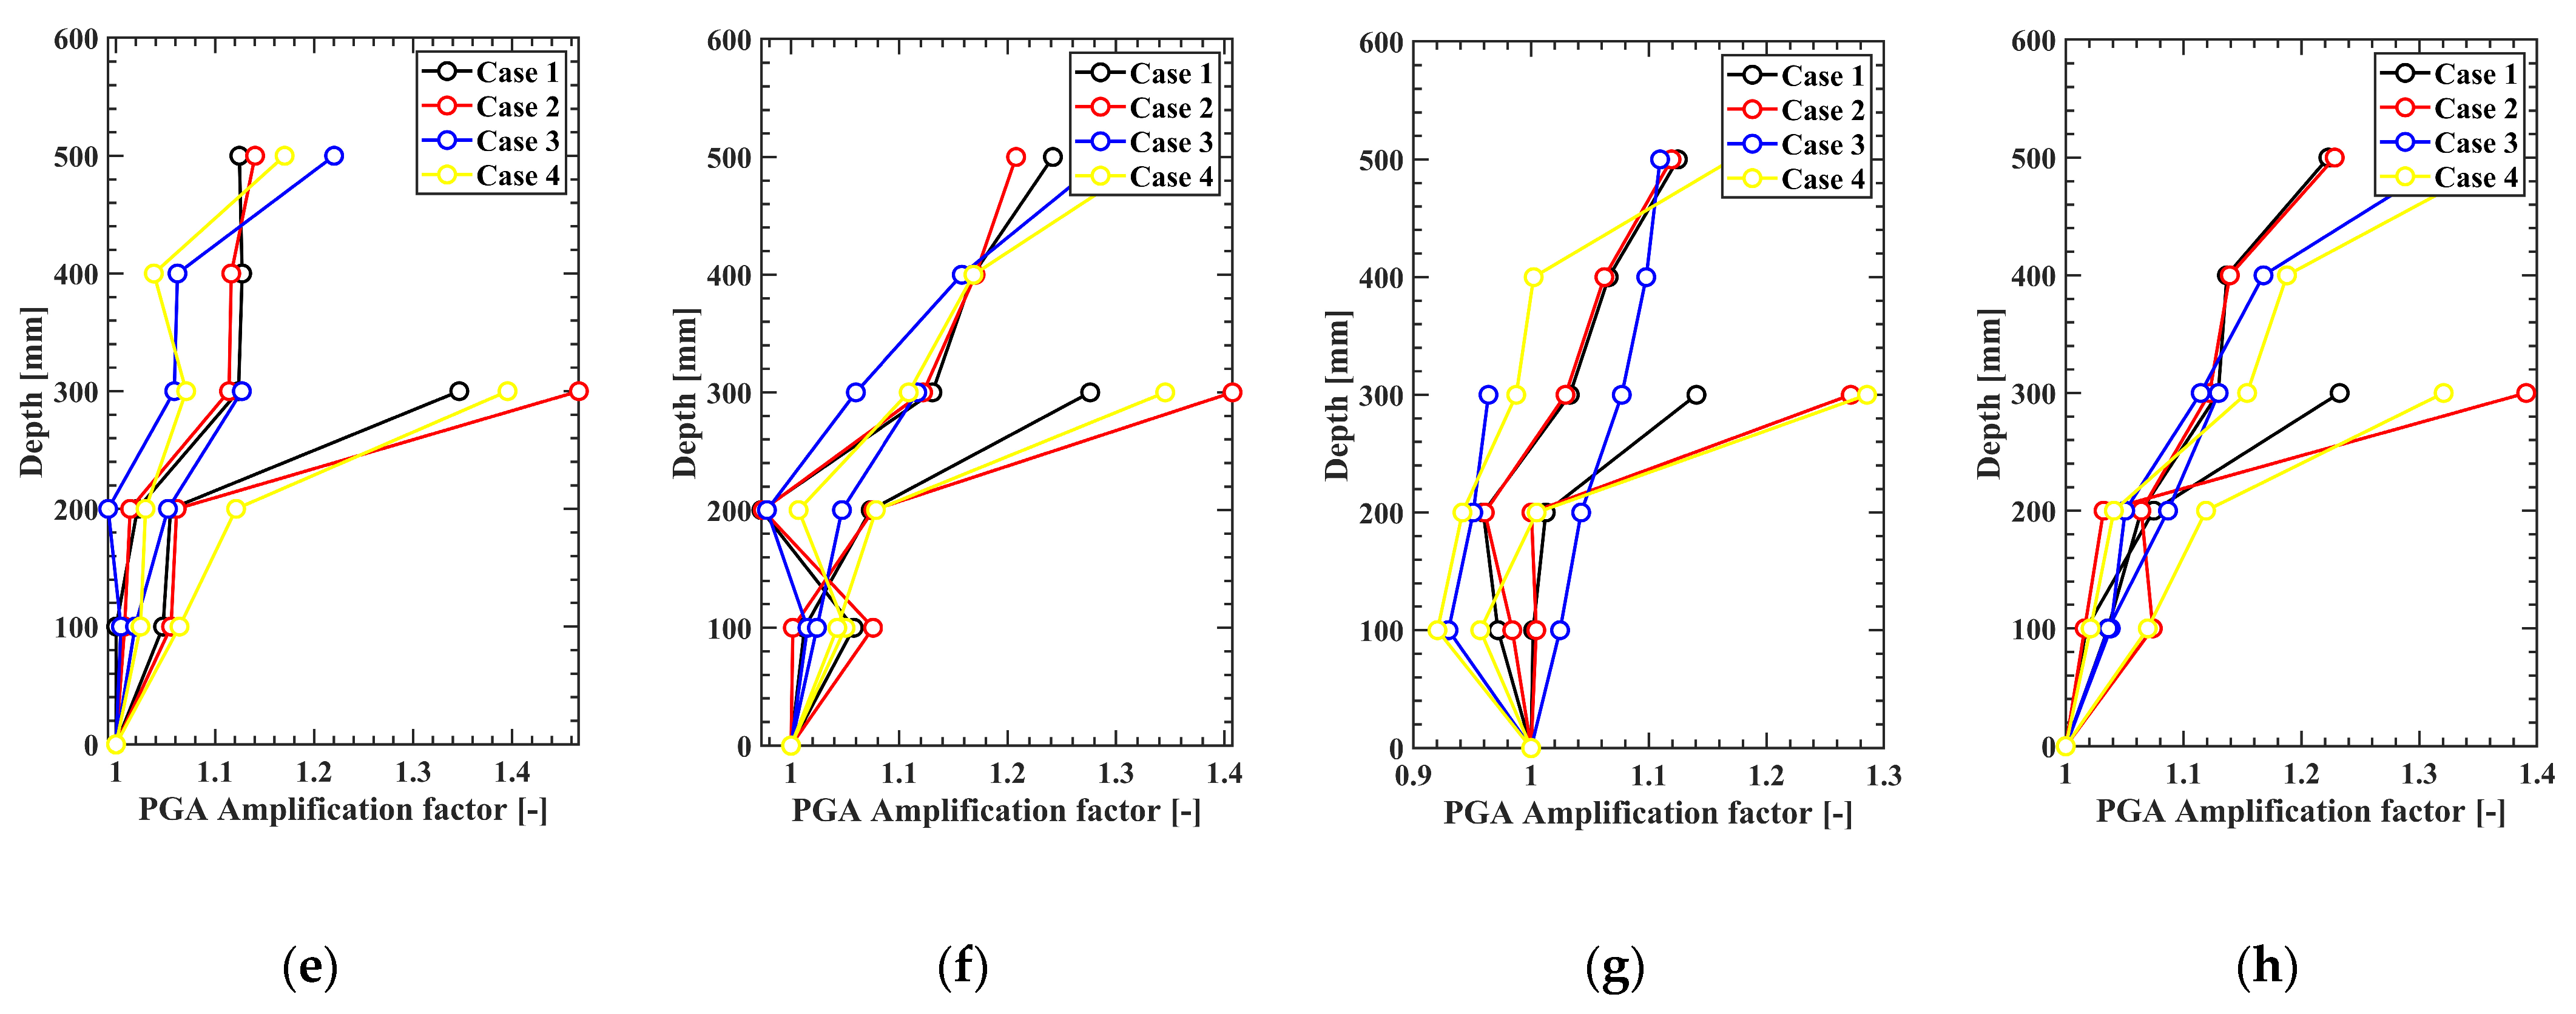
3.1.2. Vertical PGA of Model Grounds
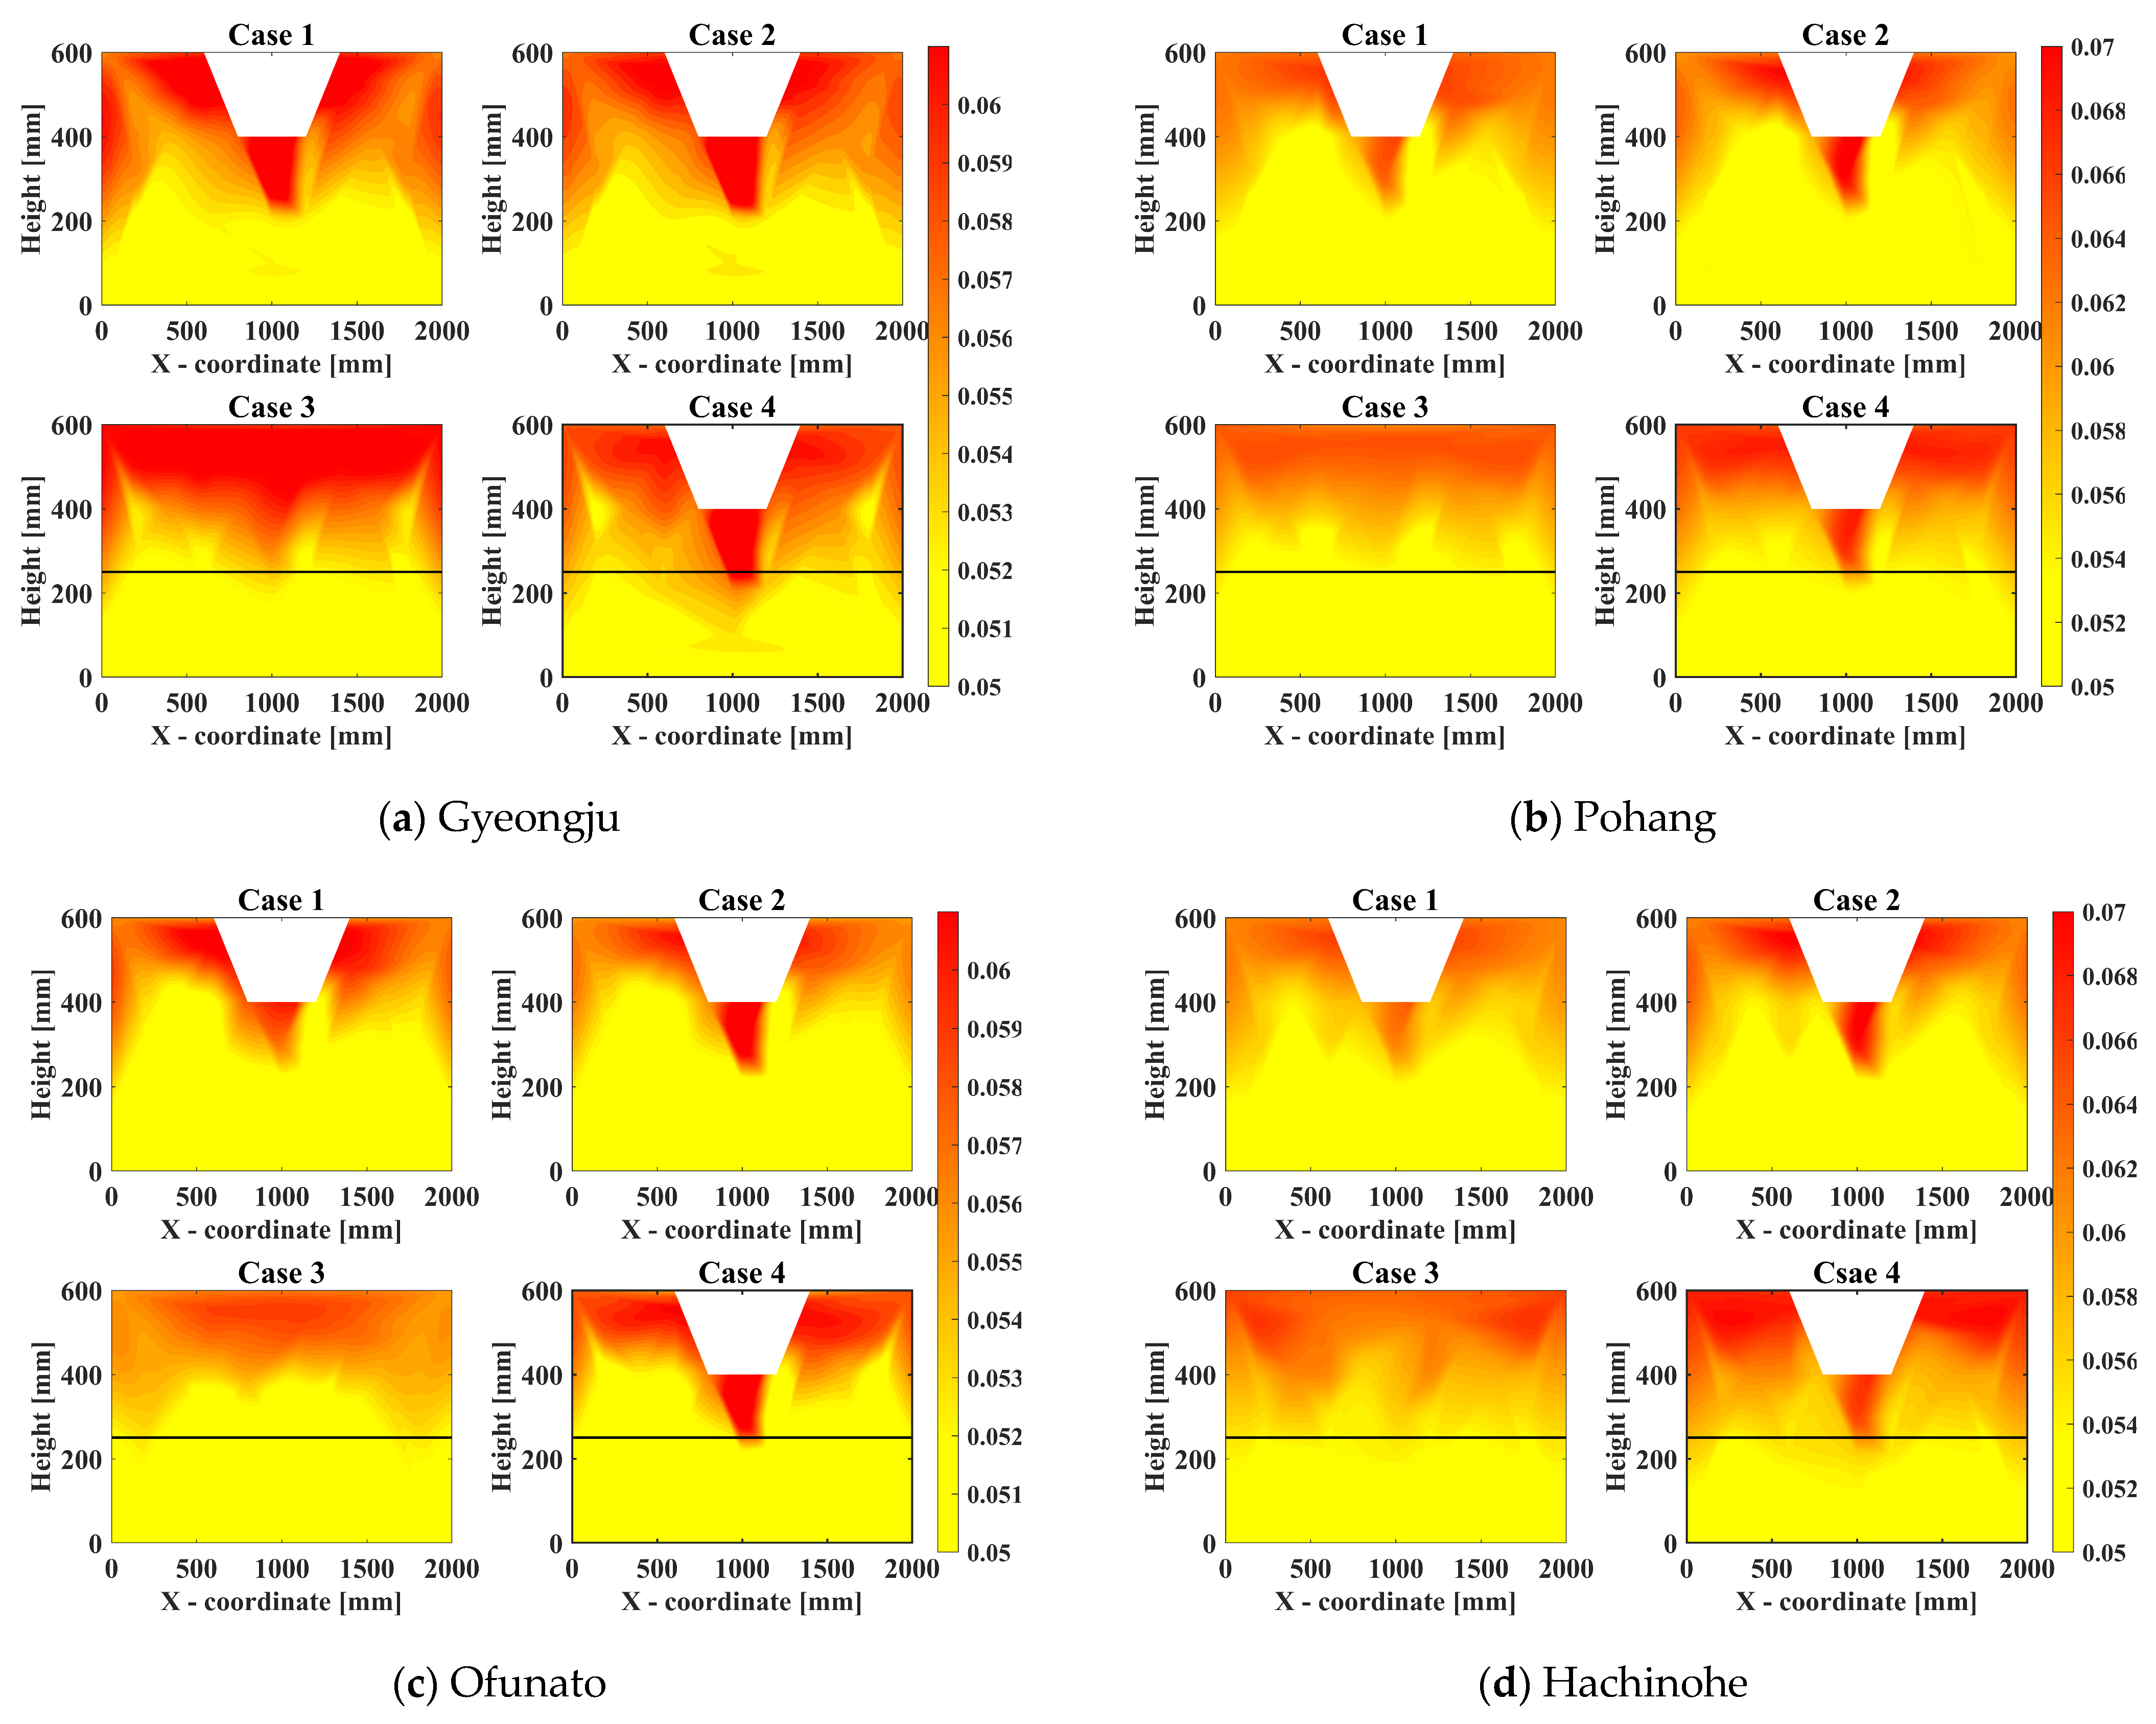
3.1.3. PGA Contours of the Model Ground
4. Comparative Analysis of 1 g Shaking Table Experiment Results and Numerical Simulation Results
4.1. Input Prameters Used in Numerical Analysis
4.2. Spectral Acceleration(SA) Analysis
5. Conclusions
- The analysis of peak ground acceleration (PGA) results showed that the acceleration amplification from the lower to the middle and upper parts of the slope was greater in the sloped model grounds compared to the flat model ground. The least amplification occurred in the flat ground of Case 3, while greater amplification was observed in the order of Case 1, Case 4, and Case 2.
- The contour plots of PGA trends revealed varying patterns of amplification at different points. It was found that, on average, approximately 60% of the PGA impact occurred at the topmost part of the slope, with specific amplifications of about 31.75% at the upper slope and 27.85% at the lower slope compared to the input motion. These results suggest that the influence of PGA varies across different points on the slope, and such variations should be carefully considered when designing seismic reinforcement. In the multi-layered model ground, different amplification patterns were observed at the layer transition points, indicating that the stratification of the ground significantly affects seismic wave amplification. This finding underscores the importance of accurately understanding the layered structure during the design process.
- When comparing the experimental results with the numerical analysis results through Spectrum Acceleration (SA), differences of 3.22%, 3.39%, 2.56%, and 2.24% were observed for each case. Overall, there was approximately a 3% difference. The good agreement between the numerical analysis and the 1 g shaking table experiment results suggests that the experiments using the shaking table are valid.
- This study identified differences in seismic wave amplification due to variations in relative density and layered soils. It also observed varying PGA values at different points. These findings suggest that in future ground design, especially for various geometric configurations, it is crucial to consider the effects of layered soil profiles, differences in relative density, and the diverse PGA values at different points. Based on the contour plot analysis, it is considered that approximately 60% of the PGA impact should be considered in seismic design, particularly at the topmost part of the slope.
Author Contributions
Funding
Institutional Review Board Statement
Informed Consent Statement
Data Availability Statement
Conflicts of Interest
References
- Keefer, D.K. Investigating Landslides Caused by Earthquakes—A Historical Review. Surv. Geophys. 2002, 23, 473–510. [Google Scholar] [CrossRef]
- Lee, S.I.; Seo, J.I.; Kim, J.H.; Ryu, D.S.; Seo, J.P.; Kim, D.Y.; Lee, C.W. International Research Trend on Mountainous Sediment-related Disasters Induced by Earthquakes. J. Korean Soc. For. Sci. 2017, 106, 431–440. [Google Scholar]
- Seo, J.I.; Lee, S.I.; Kweon, H.K.; Chun, K.W.; Kim, S.W.; Jun, K.W.; Kim, J.H.; Lee, C.W. Future Research Direction in Response to Mountainous Sediment-Related Disasters Induced by Earthquakes in South Korea. Crisinomy 2018, 14, 119–138. [Google Scholar] [CrossRef]
- Park, S.; Kim, W.; Lee, J.; Beak, Y. Case Study on Slope Stability Changes Caused by Earthquakes—Focusing on Gyeongju 5.8 ML EQ. Sustainability 2018, 10, 3441. [Google Scholar] [CrossRef]
- Kim, S.-H.; Lee, K.-W. A Study on Stabilization of the Collapsed Slope due to Gyeongju Earthquake at Seokguram Access Road based on Geological Investigation. J. Korean Geosynth. Soc. 2019, 18, 225–242. [Google Scholar]
- Jibson, R.W. Summary of Research on the Effects of Topographic Amplification of Earthquake Shaking on Slope Stability; U.S. Geological Survey: Reston, VA, USA, 1987; pp. 1–166.
- Bard, P.Y.; Riepl-Thomas, J. Wave propagation in complex geological structures and their effects on strong ground motion. Wave Motion Earthq. Eng. 1999, 38–95. [Google Scholar]
- Paolucci, R. Amplication of earthquake ground motion by steep topographic irregularities. Earthq. Eng. Struct. Dyn. 2002, 31, 1831–1853. [Google Scholar] [CrossRef]
- Burjanek, J.; Fäh, D.; Pischiutta, M.; Rovelli, A.; Calderoni, G.; Bard, P.-Y. JRA1 Site Effects at Sites with Pronounced Topography: Overview & Recommendations; ETH: Zurich, Switzerland, 2014. [Google Scholar]
- Korean Geotechnical Society. Earthquake-Resistant Design of Ground Structures; Goomibook: Seoul, Republic of Korea, 2006; pp. 199–200. [Google Scholar]
- Lin, M.-L.; Wang, K.-L. Seismic slope behavior in a large-scale shaking table model test. Eng. Geol. 2006, 86, 118–133. [Google Scholar] [CrossRef]
- Kim, H.; Jin, Y.; Lee, Y.; Kim, H.S.; Kim, D. Dynamic Response Characteristics of Embankment Model for Various Slope Angles. J. Korean Geosynth. Soc. 2020, 19, 35–46. [Google Scholar] [CrossRef]
- Jin, Y.; Kim, H.; Kim, D.; Lee, Y.; Kim, H. Seismic Response of Flat Ground and Slope Models through 1 g Shaking Table Tests and Numerical Analysis. Appl. Sci. 2021, 11, 1875. [Google Scholar] [CrossRef]
- Jin, Y.; Jeong, S.; Kim, D. Prediction of Dynamic Behavior of Large-Scale Ground Using 1 g Shaking Table Test and Numerical Analysis. Material 2023, 16, 6093. [Google Scholar] [CrossRef] [PubMed]
- Zhou, Z.; Ren, C.; Xu, G.; Zhan, H.; Liu, T. Dynamic Failure Mode and Dynamic Response of High Slope Using Shaking Table Test. Shock Vib. 2019, 2019, 4802740. [Google Scholar] [CrossRef]
- Park, S.G. Behavioral Characteristics of Slope by Constrained Soil Nail Head Using 1-g Shaking Table Tests. Master’s Thesis, Chungbuk National University, Cheongju, Republic of Korea, 2012. [Google Scholar]
- Srilatha, N.; Madhavi Latha, G.; Puttappa, C.G. Effect of frequency on seismic response of reinforced soil slopes in shaking table tests. Geotext. Geomembr. 2013, 36, 27–32. [Google Scholar] [CrossRef]
- Hu, H.; Huang, Y.; Xiong, M.; Zhao, L. Investigation of seismic behavior of slope reinforced by anchored pile structures using shaking table tests. Soil Dyn. Earthq. Eng. 2021, 150, 106900. [Google Scholar] [CrossRef]
- Zhang, J.; Li, Y.; Zhang, C. Pounding induced overturning resistance of FPB-isolated structures considering soil-structure-interactions. Soil Dyn. Earthq. Eng. 2024, 177, 108416. [Google Scholar] [CrossRef]
- Liu, G.; Meng, H.; Song, G.; Bo, W.; Zhao, P.; Ning, B.; Xu, X. Numerical simulation of wedge failure of rock slopes using three-dimensional discontinuous deformation analysis. Environ. Earth Sci. 2024, 83, 310. [Google Scholar] [CrossRef]
- Du, W.; Wang, G. Fully probabilistic seismic displacement analysis of spatially distributed slopes using spatially correlated vector intensity measures. Earthq. Eng. Struct. Dyn. 2014, 43, 661–679. [Google Scholar] [CrossRef]


| Property | Value | Property | Value |
|---|---|---|---|
| Specific gravity () | 2.65 | Mean particle size () [mm] | 0.235 |
| Minimum void ratio () | 0.64 | coefficient of curvature () | 1.03 |
| Maximum void ratio () | 1.06 | coefficient of uniformity () | 1.76 |
| Angle of internal friction () [] | 38 | Unified soil classification system (USCS) | SP |
| Relative Density 75% Ground Property Conditions | |||
| Properties | Value | Properties | Value |
| Mass density [kg/m3] | 1833 | Young’s modulus [kPa] | 17,160 |
| Friction Angle [°] | 23 | Cohesion [kg/cm2] | 0.32 |
| Relative Density 85% Ground Property Conditions | |||
| Properties | Value | Properties | Value |
| Mass density [kg/m3] | 1916 | Young’s modulus [kPa] | 24,418 |
| Friction Angle [°] | 25 | Cohesion [kg/cm2] | 0.21 |
Disclaimer/Publisher’s Note: The statements, opinions and data contained in all publications are solely those of the individual author(s) and contributor(s) and not of MDPI and/or the editor(s). MDPI and/or the editor(s) disclaim responsibility for any injury to people or property resulting from any ideas, methods, instructions or products referred to in the content. |
© 2024 by the authors. Licensee MDPI, Basel, Switzerland. This article is an open access article distributed under the terms and conditions of the Creative Commons Attribution (CC BY) license (https://creativecommons.org/licenses/by/4.0/).
Share and Cite
Jeong, S.; Moon, M.; Kim, D. Seismic Wave Amplification Characteristics in Slope Sections of Various Inclined Model Grounds. Appl. Sci. 2024, 14, 9014. https://doi.org/10.3390/app14199014
Jeong S, Moon M, Kim D. Seismic Wave Amplification Characteristics in Slope Sections of Various Inclined Model Grounds. Applied Sciences. 2024; 14(19):9014. https://doi.org/10.3390/app14199014
Chicago/Turabian StyleJeong, Sugeun, Minseo Moon, and Daehyeon Kim. 2024. "Seismic Wave Amplification Characteristics in Slope Sections of Various Inclined Model Grounds" Applied Sciences 14, no. 19: 9014. https://doi.org/10.3390/app14199014