Article

Development of an Automatic Rock Mass Classification System Using Digital Tunnel Face Mapping

1
Department of Earth Resources and Environmental Engineering, Hanyang University, 222, Wangsimni-ro, Seongdong-gu, Seoul 04763, Republic of Korea
2
Partprime Inc., Room no. 714, 193, Gwangdukdae-ro, Gyeonggi-do, Ansan-si 15461, Republic of Korea
*
Author to whom correspondence should be addressed.
Appl. Sci. 2024, 14(19), 9024; https://doi.org/10.3390/app14199024
Submission received: 26 August 2024 / Revised: 29 September 2024 / Accepted: 30 September 2024 / Published: 6 October 2024

Abstract

:
To mitigate unforeseen incidents, such as key block failure or tunnel collapse during excavation, an appropriate support pattern that correlates with the geological conditions of the rock mass at the tunnel face should be designed. Rock mass evaluations should be conducted through geological face mapping during the construction phase, alongside predictions based on field investigations during the design phase. When marked discrepancies are identified, it is customary to convene an on-site evaluation involving a committee of experts. This study develops a digital tunnel face mapping system that utilises mobile devices to facilitate online evaluations during the construction phase. This system effectively replaces the traditional on-site field evaluation method. Tunnel face mapping can be promptly accomplished using images captured at the excavation face, enabling rapid analysis. In conjunction with the mapping capabilities, the developed system was designed to digitally store geological information, which includes parameters such as rock strength distribution, the spacing and length of discontinuities observed during the mapping process, as well as data pertaining to weathering and the groundwater conditions of those discontinuities. This information was then correlated with the rock mass rating sheet to automate the determination of ratings for each parameter, ultimately leading to a conclusive classification of the rock mass quality. By employing this system for tunnel face mapping and rock quality evaluation, we significantly reduced the discrepancies in the evaluation results that often arise due to the subjective judgement of geologists, as well as human errors that can occur throughout the rating process.

1. Introduction

At the design stage of tunnel construction, the quality of the rock mass along the designated route is classified based on geological survey results. Subsequently, suitable rock support patterns and reinforcement methods are determined according to the conditions of the rock masses observed at the tunnel face. However, discrepancies may arise during excavation if the actual quality of the rock masses deviates from the preliminary assessments conducted during the design phase. In such cases, it is essential to convene a rock quality evaluation committee. This committee is responsible for assessing the geological condition of the site and enacting subsequent amendments to the chosen support type or recommending additional reinforcement methods. This committee is tasked with performing an on-site evaluation of the excavation face by utilising an array of information, such as the results from tunnel face mapping, design documents, displacement monitoring data, and other pertinent data generated during the excavation process, which are provided by the field manager. However, such on-site rock mass evaluations are inherently time-consuming, as they necessitate the formation of a committee and a thorough assessment of the site’s geological conditions, which invariably burdens the project team.
Traditionally, tunnel face mapping has been manually conducted by geological specialists or geologists employed by construction firms. As shown in Figure 1, geological information on tunnel cross-sections is meticulously recorded, detailing the geometrical configurations and filling conditions of joint surfaces, the strength characteristics of the rock mass, and groundwater seepage conditions. This information is subsequently employed to assess various parameters related to rock mass quality based on typical classification systems in Table 1.
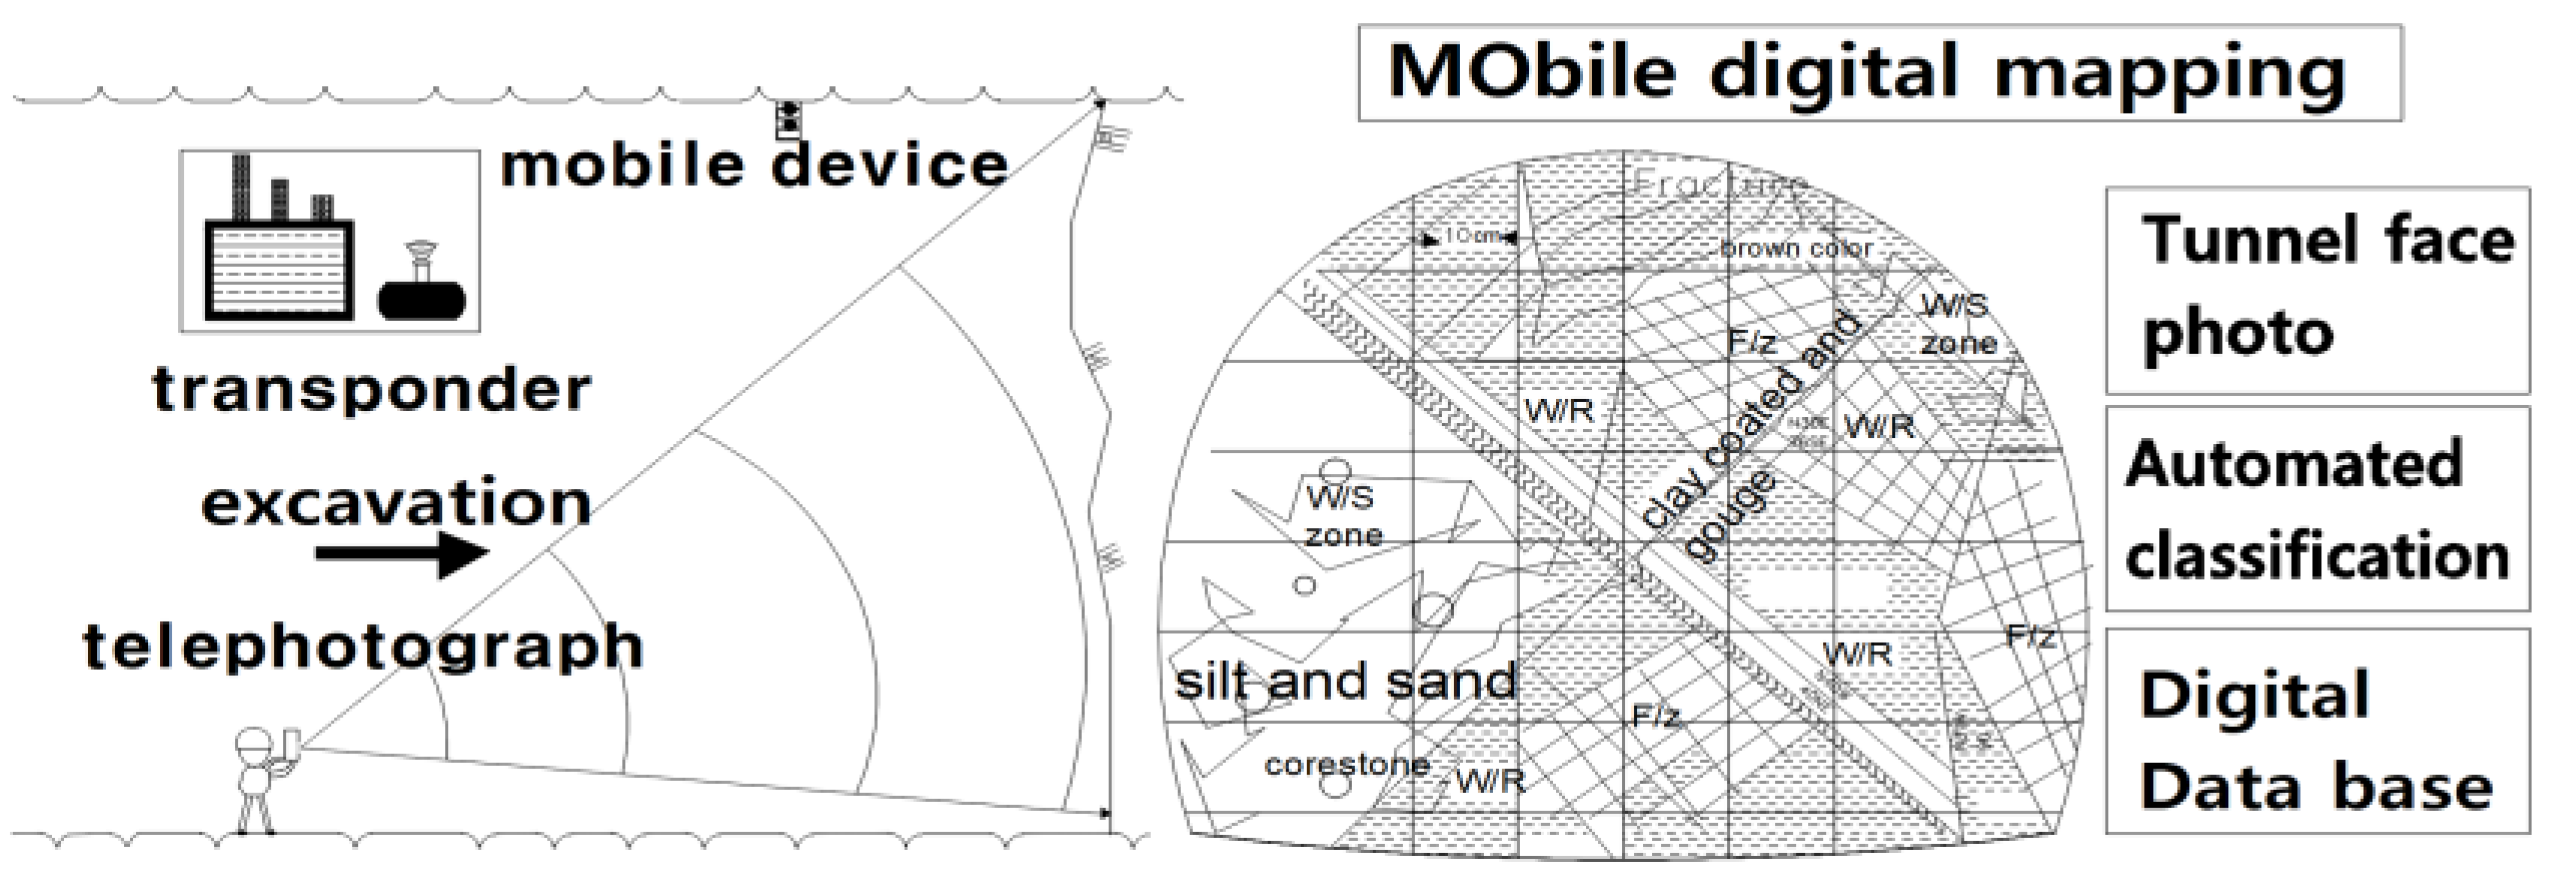
In this context, the current study introduces the use of mobile devices, such as tablets, for capturing images of the tunnel face, and the acquired image data are used for digital mapping and rock quality rating [1]. Figure 2 illustrates the implementation of digital mapping through image-based data. The digital data generated during the mapping and rock mass rating are temporarily stored in the internal memory of the mobile device via a proprietary application, thus allowing offline functionality. When an Internet connection becomes available, the data are automatically uploaded to a centralised database. This innovative approach enables tunnel face mapping and rock mass classification in areas with limited or no cellular signal.
Table 1. Typical rock mass classification methods.
Classification MethodResearcherKey Contents
Rock loadTerzaghi 1946 [2]
-
Evaluation of rock load height for nine rock conditions
-
Selection of a rough support pattern for each rock load
RQD (rock quality designation)Deere 1988 [3]RQD = core length greater than 10 cm/total core length
five levels of rock quality (very poor–excellent)
RSR (rock
structure rating)
Wickham 1972 [4]
-
Rock type and property, discontinuity properties
-
Construction parameters: tunnel size, direction of drive, method of excavation
RMRBieniawski 1973 [5]Five parameters: rock strength, RQD, joint spacing, joint condition, groundwater inflow rate
Rating score: 0~100 (very poor–very favourable)
Q-SystemBarton 1974 [6]Six parameters: RQD, No. of joints set, joint roughness, joint aperture, groundwater, insitu stress
Rating score: 0~100 (very poor–very favourable)
SMR (slope mass rating)Romana 2015 [7]Basic RMR x three coefficients by joint orientation (F1–F3) + F4 (coefficient by excavation method)
GSI (Geological Strength Index)Hoek 2019 [8]Detailed classification of very poor rock masses with an RMR value of 23 or below
Furthermore, geometric characteristics of the rock masses, including lithology and discontinuities, as well as groundwater information collected during the digital mapping process, are systematically stored in a database. This setup enables the rock masses to be automatically evaluated by cross-referencing the collected information with the rock mass rating table. Thus, the methodology significantly reduces the time and resources required for geological face mapping and subsequent evaluations while minimising potential errors associated with variability in the geologists’ skill levels during mapping and evaluation tasks. This digital system enhances the overall reliability and efficiency of rock mass classification, ultimately contributing to improved decision making in tunnel construction management.

2. Literature Review and Case Study

2.1. Traditional Rock Mass Classification

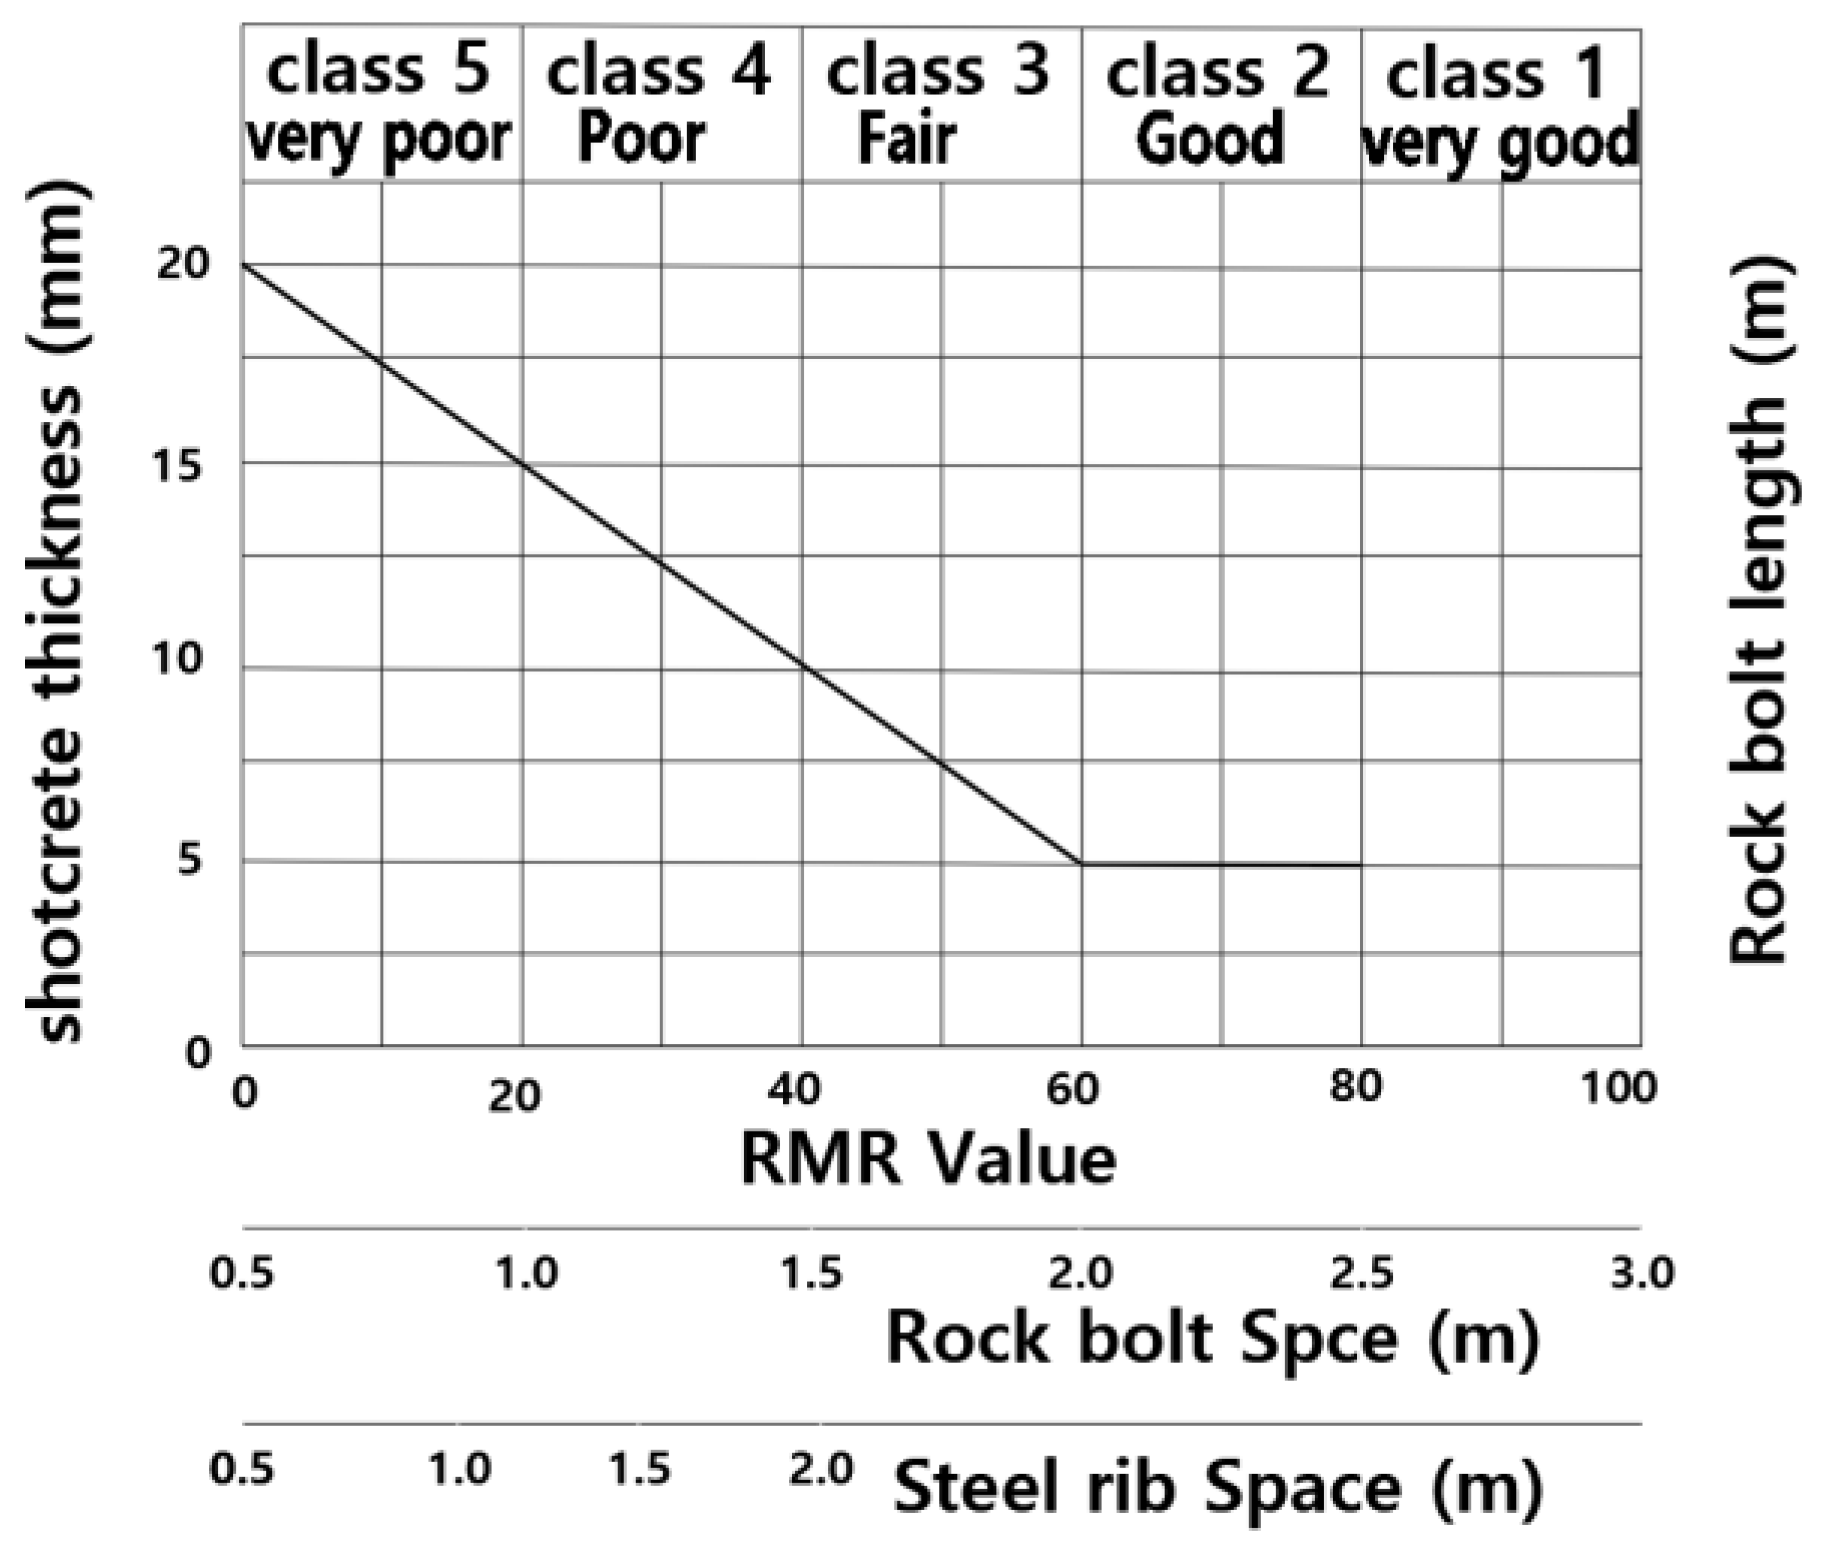
Z. T. Bieniawski [9] originally introduced the well-established RMR classification system, which is critical in the assessment of rock mass quality. The RMR value is computed as the sum of five critical parameters: rock strength, rock quality designation (RQD), joint spacing, the condition of joint surfaces, and groundwater outflow. Subsequently, the initial RMR value is adjusted based on a correction factor that accounts for the orientation and dip angle of the joints in relation to the tunnel axis, culminating in the final RMR value. Figure 3 illustrates the methodology employed in selecting appropriate rock support types, with the RMR chart as a reference for informed decision making in tunnel engineering.
Barton [10] proposed the Q-System, a well-regarded rock mass classification framework that comprises six critical parameters. The Q-value is mathematically defined as
Q = (RQD/Jn)·(Jr/Ja)·(Jw/SRF)
where RQD represents the rock quality designation, Jn denotes the number of joint sets, Jr refers to the roughness of the principal joint set, Ja signifies the alteration of the primary joint set, Jw is indicative of the groundwater outflow condition, and SRF represents the stress reduction factor.
The RMR classification method assigns a numerical score between 0 and 100, informed by five characteristics of rock mass quality. The survey and evaluation techniques associated with the RMR are relatively straightforward, contributing to their widespread application in tunnel and slope design, particularly in Korea.
In contrast, the rock mass classification method employing the Q-System evaluates rock quality by multiplying values related to the distribution characteristics of joints and the state of filling and roughness of joint surfaces, along with aspects regarding groundwater conditions and local rock mass stress. The complexity of the investigation and assessment of joint characteristics renders it a valuable reference material in domestic tunnel design and promotes its active utilisation in tunnel and slope engineering across Europe and the Middle East.
In the digital mapping system developed as part of this study, configurations were established to facilitate rock quality evaluations and report generation by utilising both the RMR and Q-System. This digital mapping system ensures applicability not only in domestic tunnel projects in Korea but also in initiatives within the Middle East, Southeast Asia, and Europe.
Prevalent tunnel digital mapping systems exhibit a notable limitation, as they require the rock quality characteristics, such as joint surface conditions, overall rock quality, and groundwater discharge rates, to be manually documented on the tunnel face. Subsequently, the RMR rating or rock quality evaluation must be conducted again post-mapping.
To alleviate the inefficiencies associated with this duplicative process, this study proposes a solution that involves recording the parameters essential for rock quality evaluation during mapping. These data points can then be leveraged to automate the scoring of the RMR value during subsequent rock quality evaluations, thus enhancing operational efficiency and reducing the need for repetitive tasks.

2.2. New Techniques of Rock Masses Classification

Apart from the regular RMR system in Korea, which treats the upper and lower benches of the tunnel face as equal in weight of their RMR values, there are new attempts to apply the Weight (W)-RMR classification system, which is illustrated in Figure 4. The W-RMR categorises RMR values into two distinct groups based on associated levels of risk. To obtain the weighted RMR of the entire tunnel section in this W-RMR system, it is concluded that 80% weightage is reasonable for the upper section of the tunnel, whereas the lower section has the remaining 20% weightage, according to the site demonstrations carried out by Korea Express Corporation [11]. This differential weighting approach allows the engineers to have a more nuanced understanding of the structural integrity and risk factors present in different sections of the tunnel face. This approach is justified as the rock quality of the upper-half section has a much greater impact on the stability of the tunnel.
Furthermore, Hoek [8] proposed the Geological Strength Index (GSI) rock classification method, which emphasises the assessment of joint set numbers and the conditions of discontinuities, and Table 2 indicates the correlation between RMRb and GSI values [12,13]. Unlike the RMR method, which is primarily qualitative, the GSI enables a detailed classification of rock masses that exhibit very poor quality. Specifically, the RMR system is incapable of further differentiating rock masses with an RMR value of 23 or below. In contrast, the GSI classification method allows for a more refined delineation of support patterns for these poor-quality rock masses, thus enhancing the effectiveness of engineering interventions (Figure 5).

2.3. New Technologies Related to Digital Mapping of the Tunnel Face

Table 3 presents a concise summary of emerging technologies related to digital mapping and rock mass characterisation. These advanced techniques represent significant improvements over conventional methods, with advantages in enhanced accuracy, efficiency, and safety in geological assessments.
The geological conditions in Japan often present significant challenges for tunnel excavation. Consequently, the development and implementation of digital tunnel mapping techniques involving the optical analysis of tunnel faces have become essential tools in the field. These digital mapping techniques are complemented by stability management practices that leverage the data obtained from such analyses to enhance excavation safety and efficacy.
In Europe, particularly in Austria, extensive research is being conducted on the automatic extraction of discontinuities with the aid of photographic imagery and laser-scanning technologies. This research encompasses the creation of three-dimensional (3D) image models, geological mapping, and tunnel stability analysis, all of which are integral to conventional tunnelling techniques. The advancing methodologies aim to optimise tunnel excavation processes and improve the overall safety and reliability of tunnel infrastructures.
In South Korea, research and development efforts related to digital tunnel mapping commenced in 2017 and have since been integrated into various tunnelling projects. Current initiatives are focused on using laser scanners in conjunction with deep-learning algorithms to detect rock joints automatically. These advancements also include the calculation of safety factors for critical rock blocks, thereby enhancing the analysis of tunnel stability and addressing the unique geological challenges faced in the region.

3. Automated Rock Quality Classification Using Digital Tunnel Face Mapping

3.1. Digital Tunnel Face Mapping

The ventilation and installation of support systems must be executed promptly following blasting operations, which imposes considerable constraints on the temporal and spatial flexibility of tunnel face mapping. Hence, there is a pressing need for efficient methodologies in this context.
The digital tunnel mapping software v. 1.0 developed in this study significantly reduces the time required for tunnel face mapping and reliable rock mass quality evaluation. This is achieved by enabling rapid image capture, allowing subsequent analysis to be conducted remotely from a safe location, thereby minimising interference with ongoing construction activities.
Captured images facilitate the extraction of crucial geological information, including the distribution of rock masses classified by strength and groundwater outflow characteristics, as well as the density, spacing, length, roughness, and infill materials of discontinuities. Additionally, the degree of weathering of adjacent rock masses and the strike and dip directions of the discontinuities relative to the excavation direction can be derived from the images to automate the assignment of rock quality ratings.
In scenarios where Internet connectivity is unavailable, a mobile application designed for tablets and smartphones can be used to capture photos, conduct digital mapping at each excavation face, and complete rock quality assessments. These data can be temporarily stored in the internal memory of the device until they can be uploaded to a central server when an Internet connection becomes available.
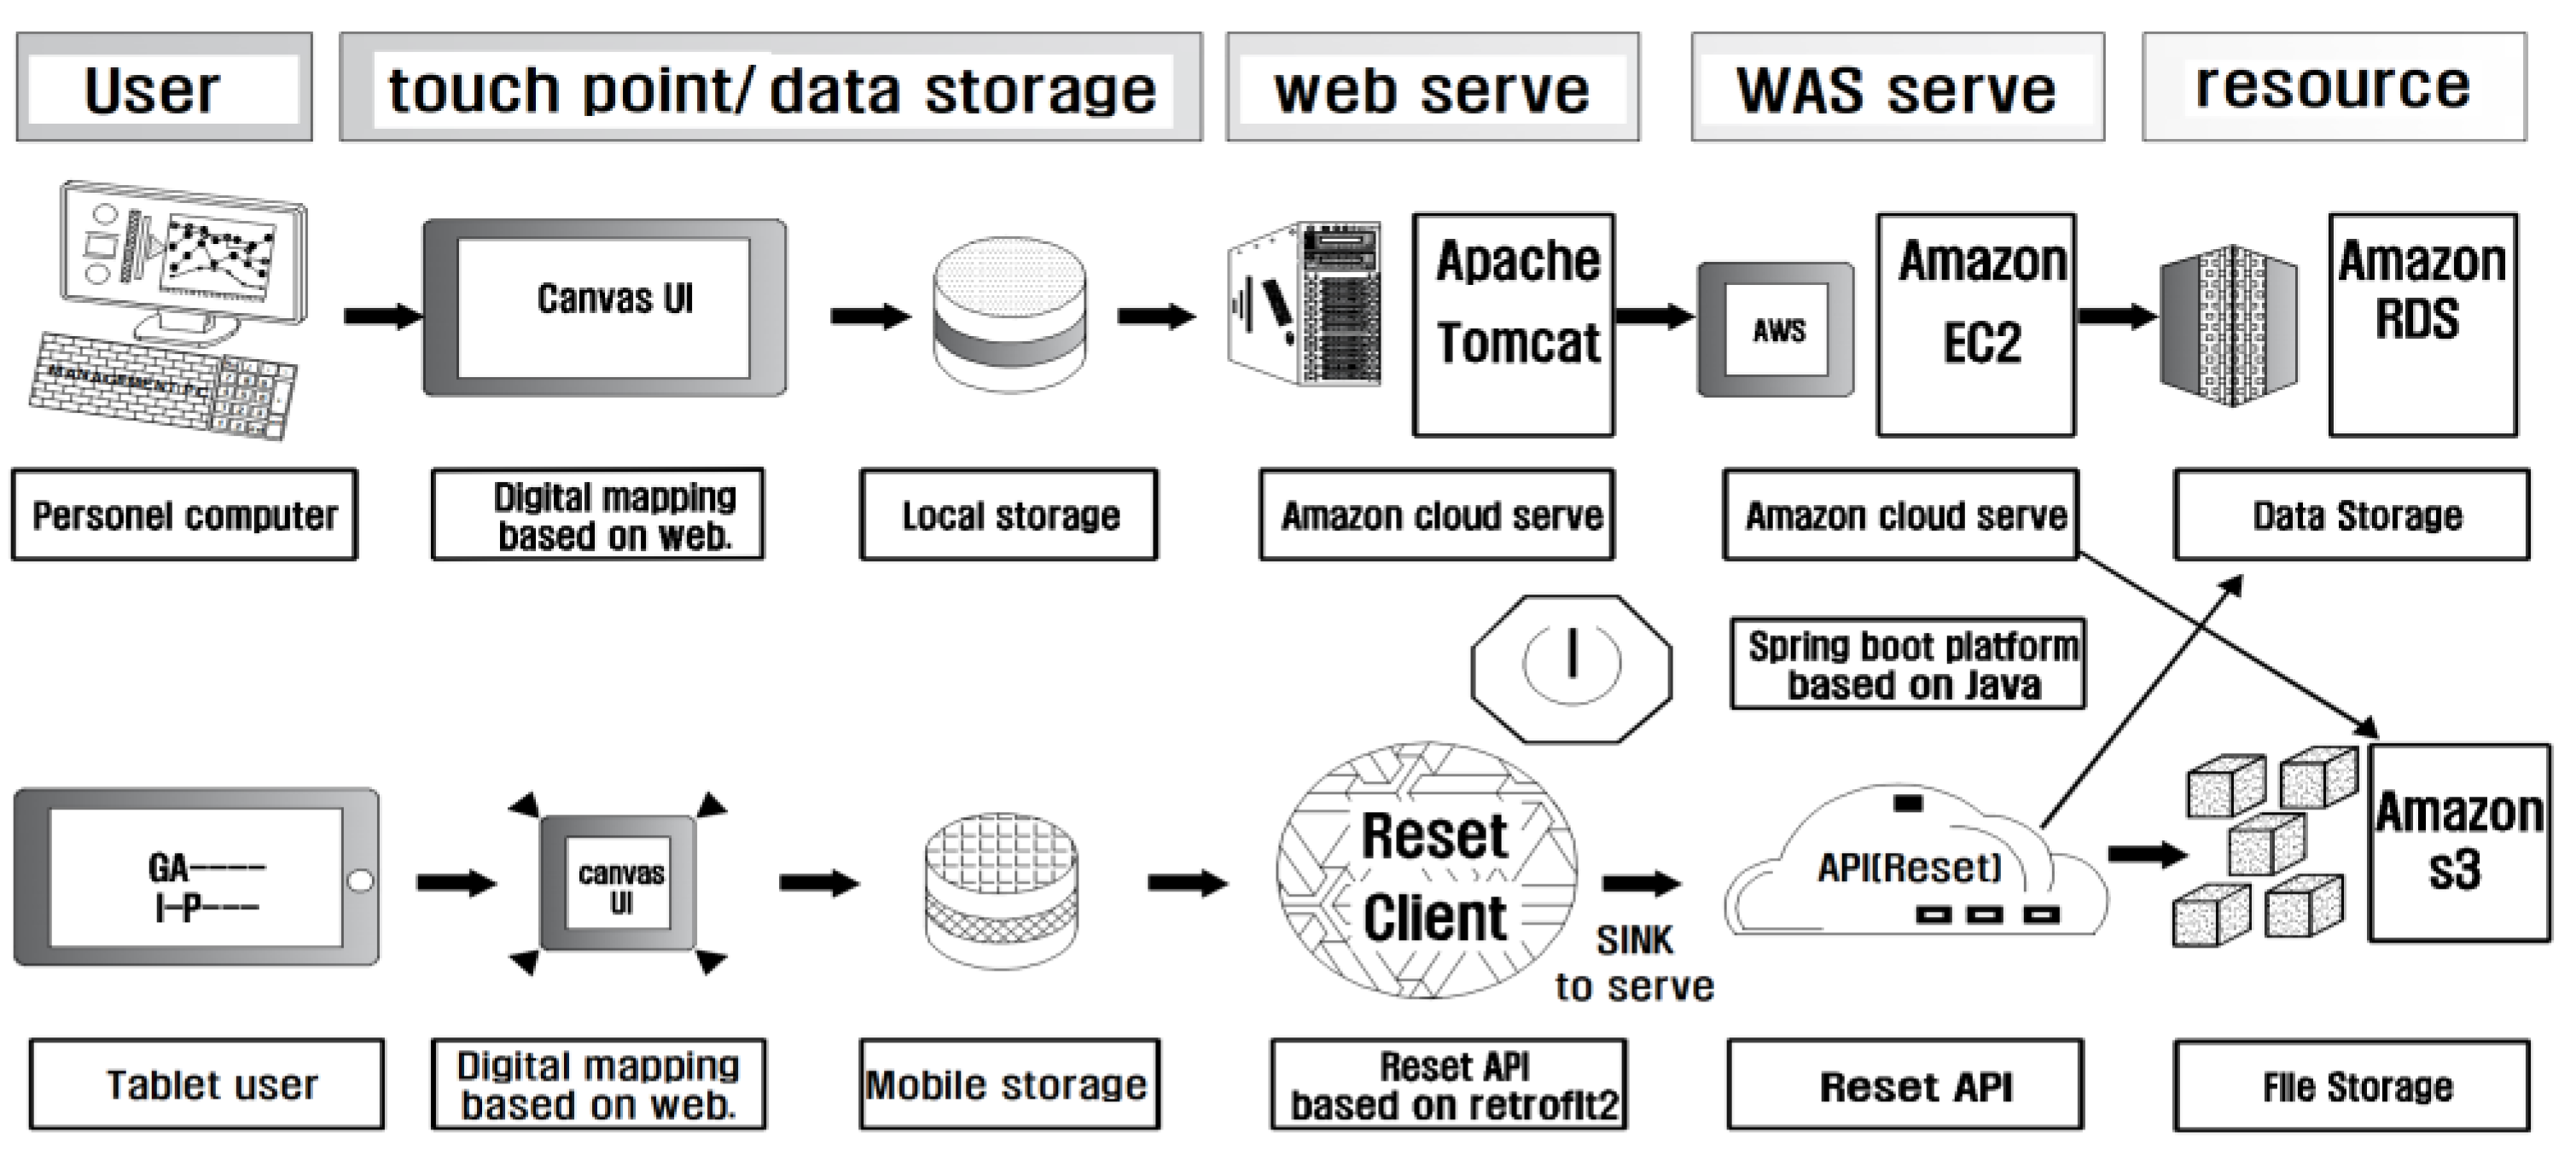
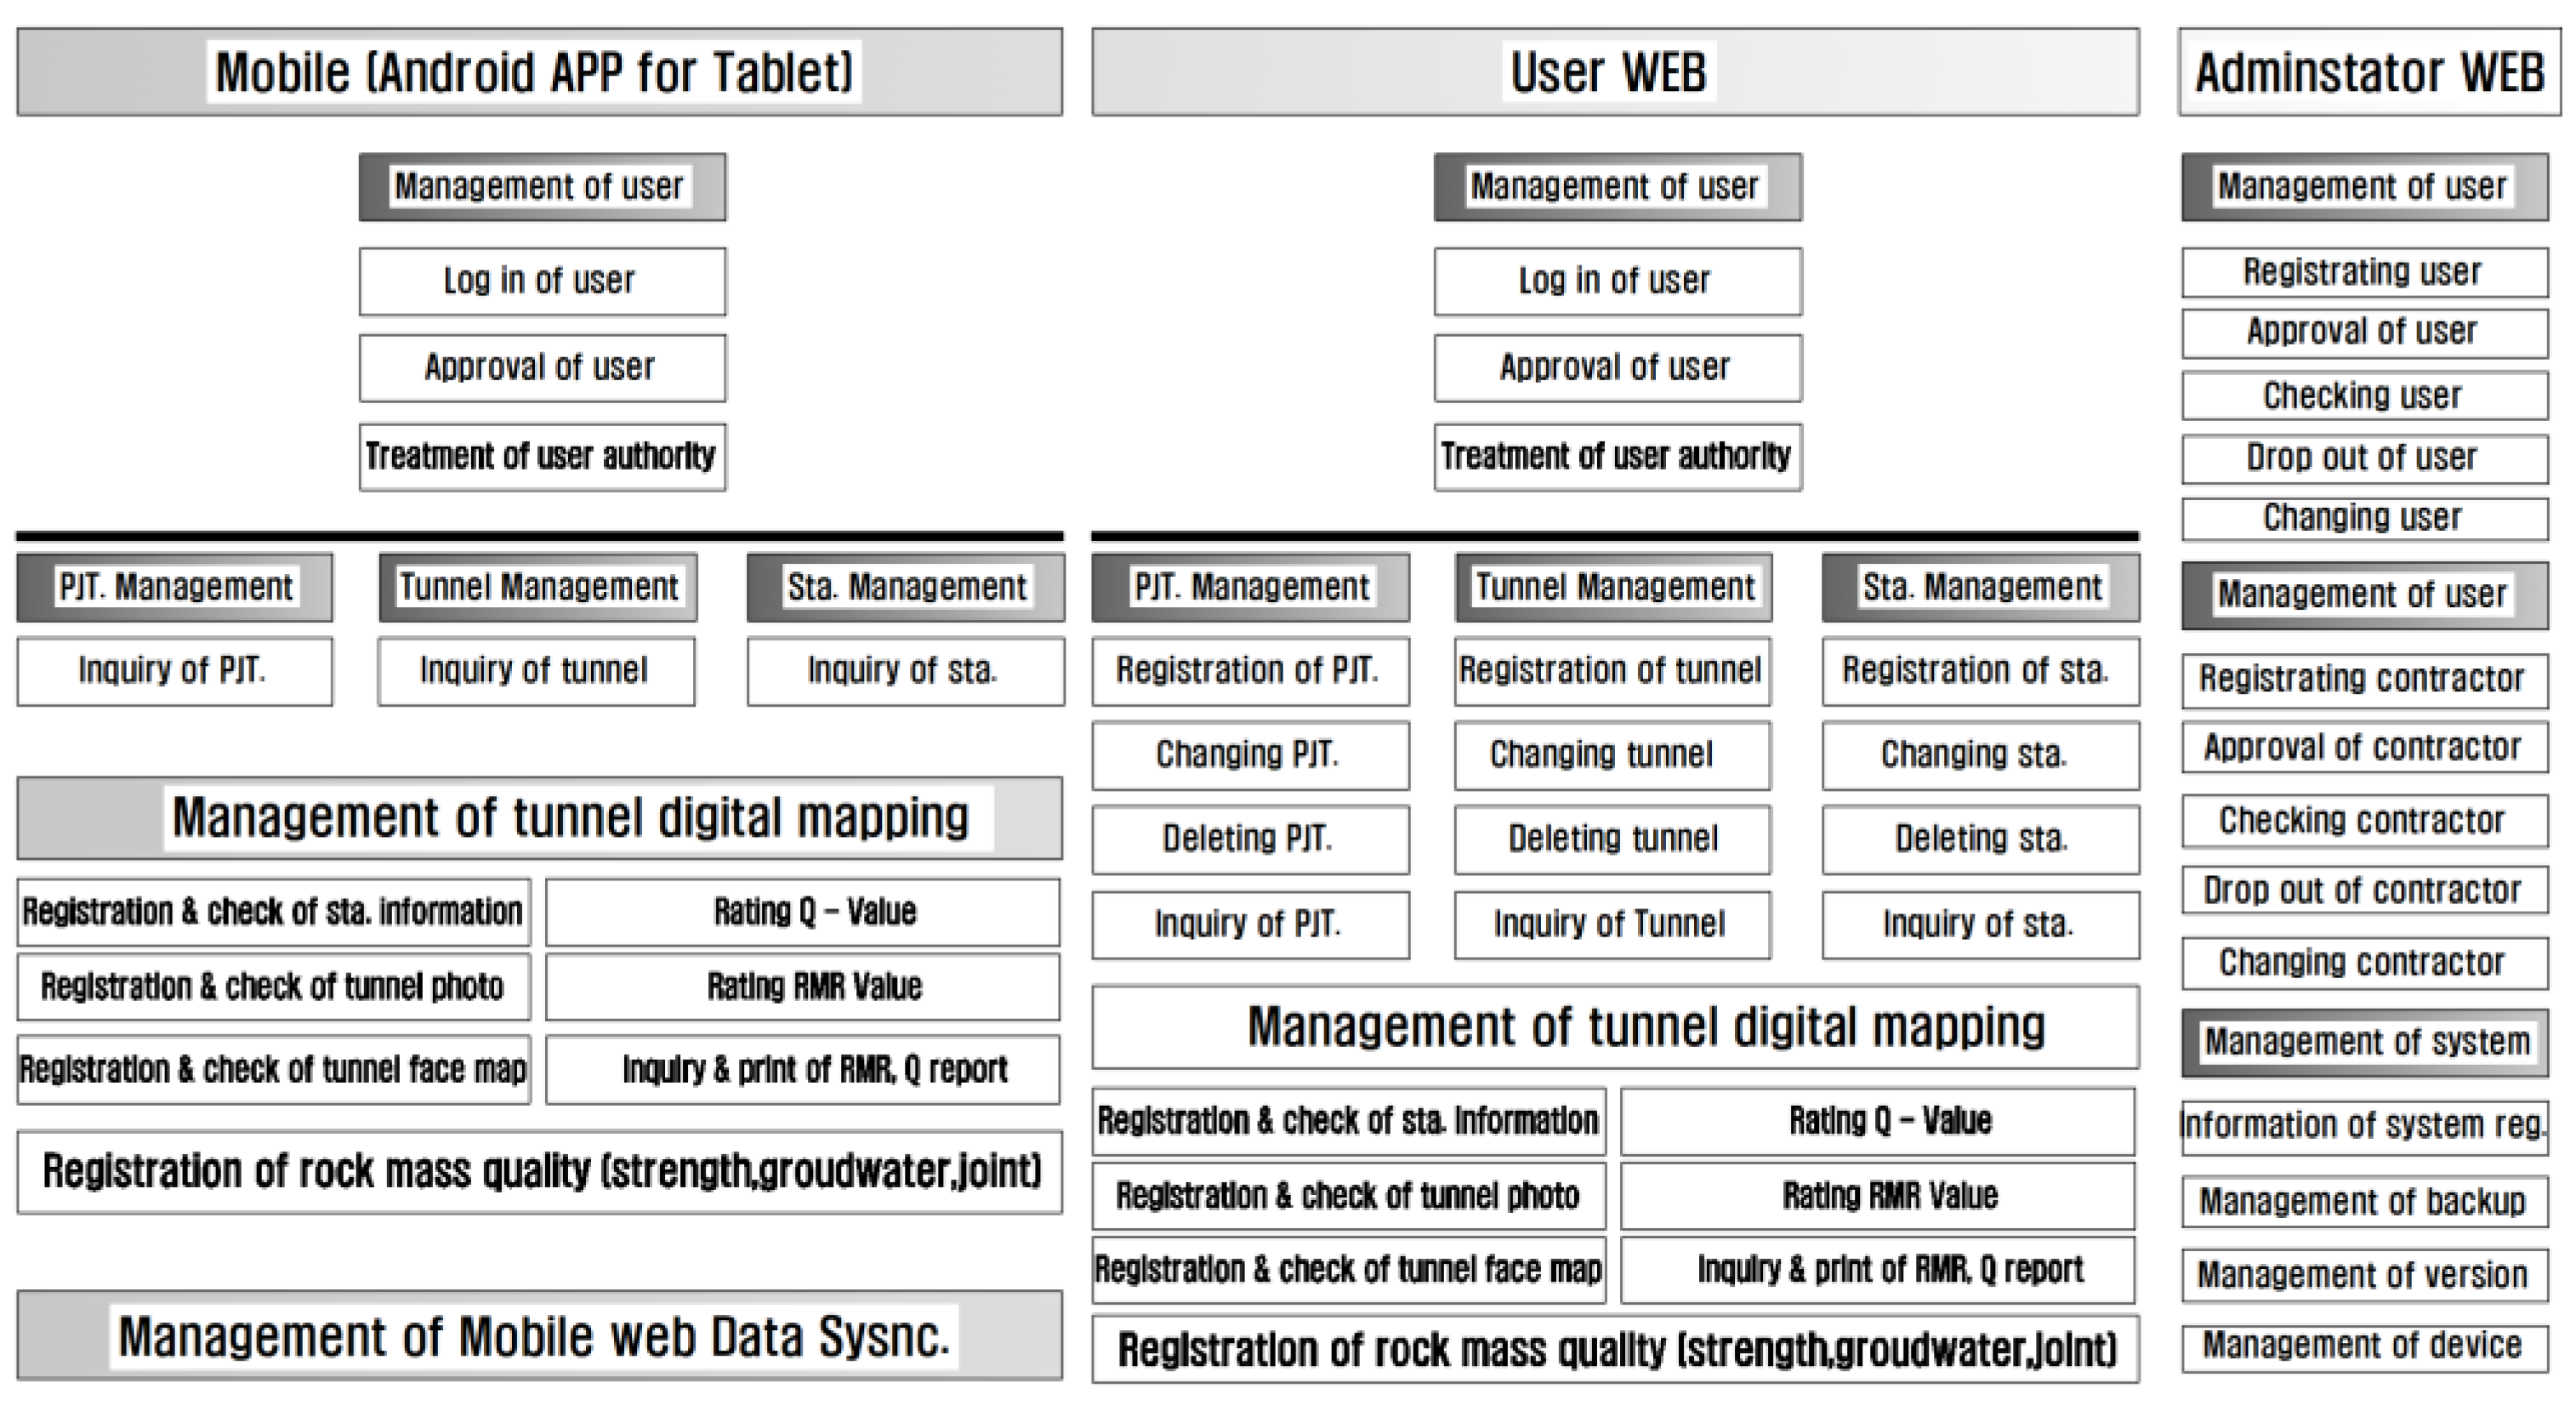
Figure 6 illustrates the overall configuration of the system, showcasing both the mobile application and web-based versions developed for this study. Figure 7 provides a detailed diagram of the system architecture. Additionally, Table 4 enumerates the hardware components integral to the tunnel digital mapping system, whereas Figure 8, Figure 9 and Figure 10 present the main menu, face mapping methodologies, and detailed features of the digital mapping system based on image data, respectively.
Figure 8 presents the main interface of the mobile digital mapping system developed in this study. Upon loading an image of the tunnel surface, the dimensions are adjusted to correspond with the sketched tunnel image file. A pull-down menu facilitates the input of various parameters, including rock quality, joint characteristics, and groundwater conditions.
Figure 9 illustrates a pop-up window that enables users to input critical geometric characteristics of the joint orientations, as well as spacing and length. This feature allows the joint surface properties to be comprehensively described, which is essential for accurate geological assessments.
Since it is impossible to estimate the strike and dip direction based solely on photographic images, the strike and dip direction of joints should be measured using devices such as a clinometer, and then the user should input those values to the mapping screen.
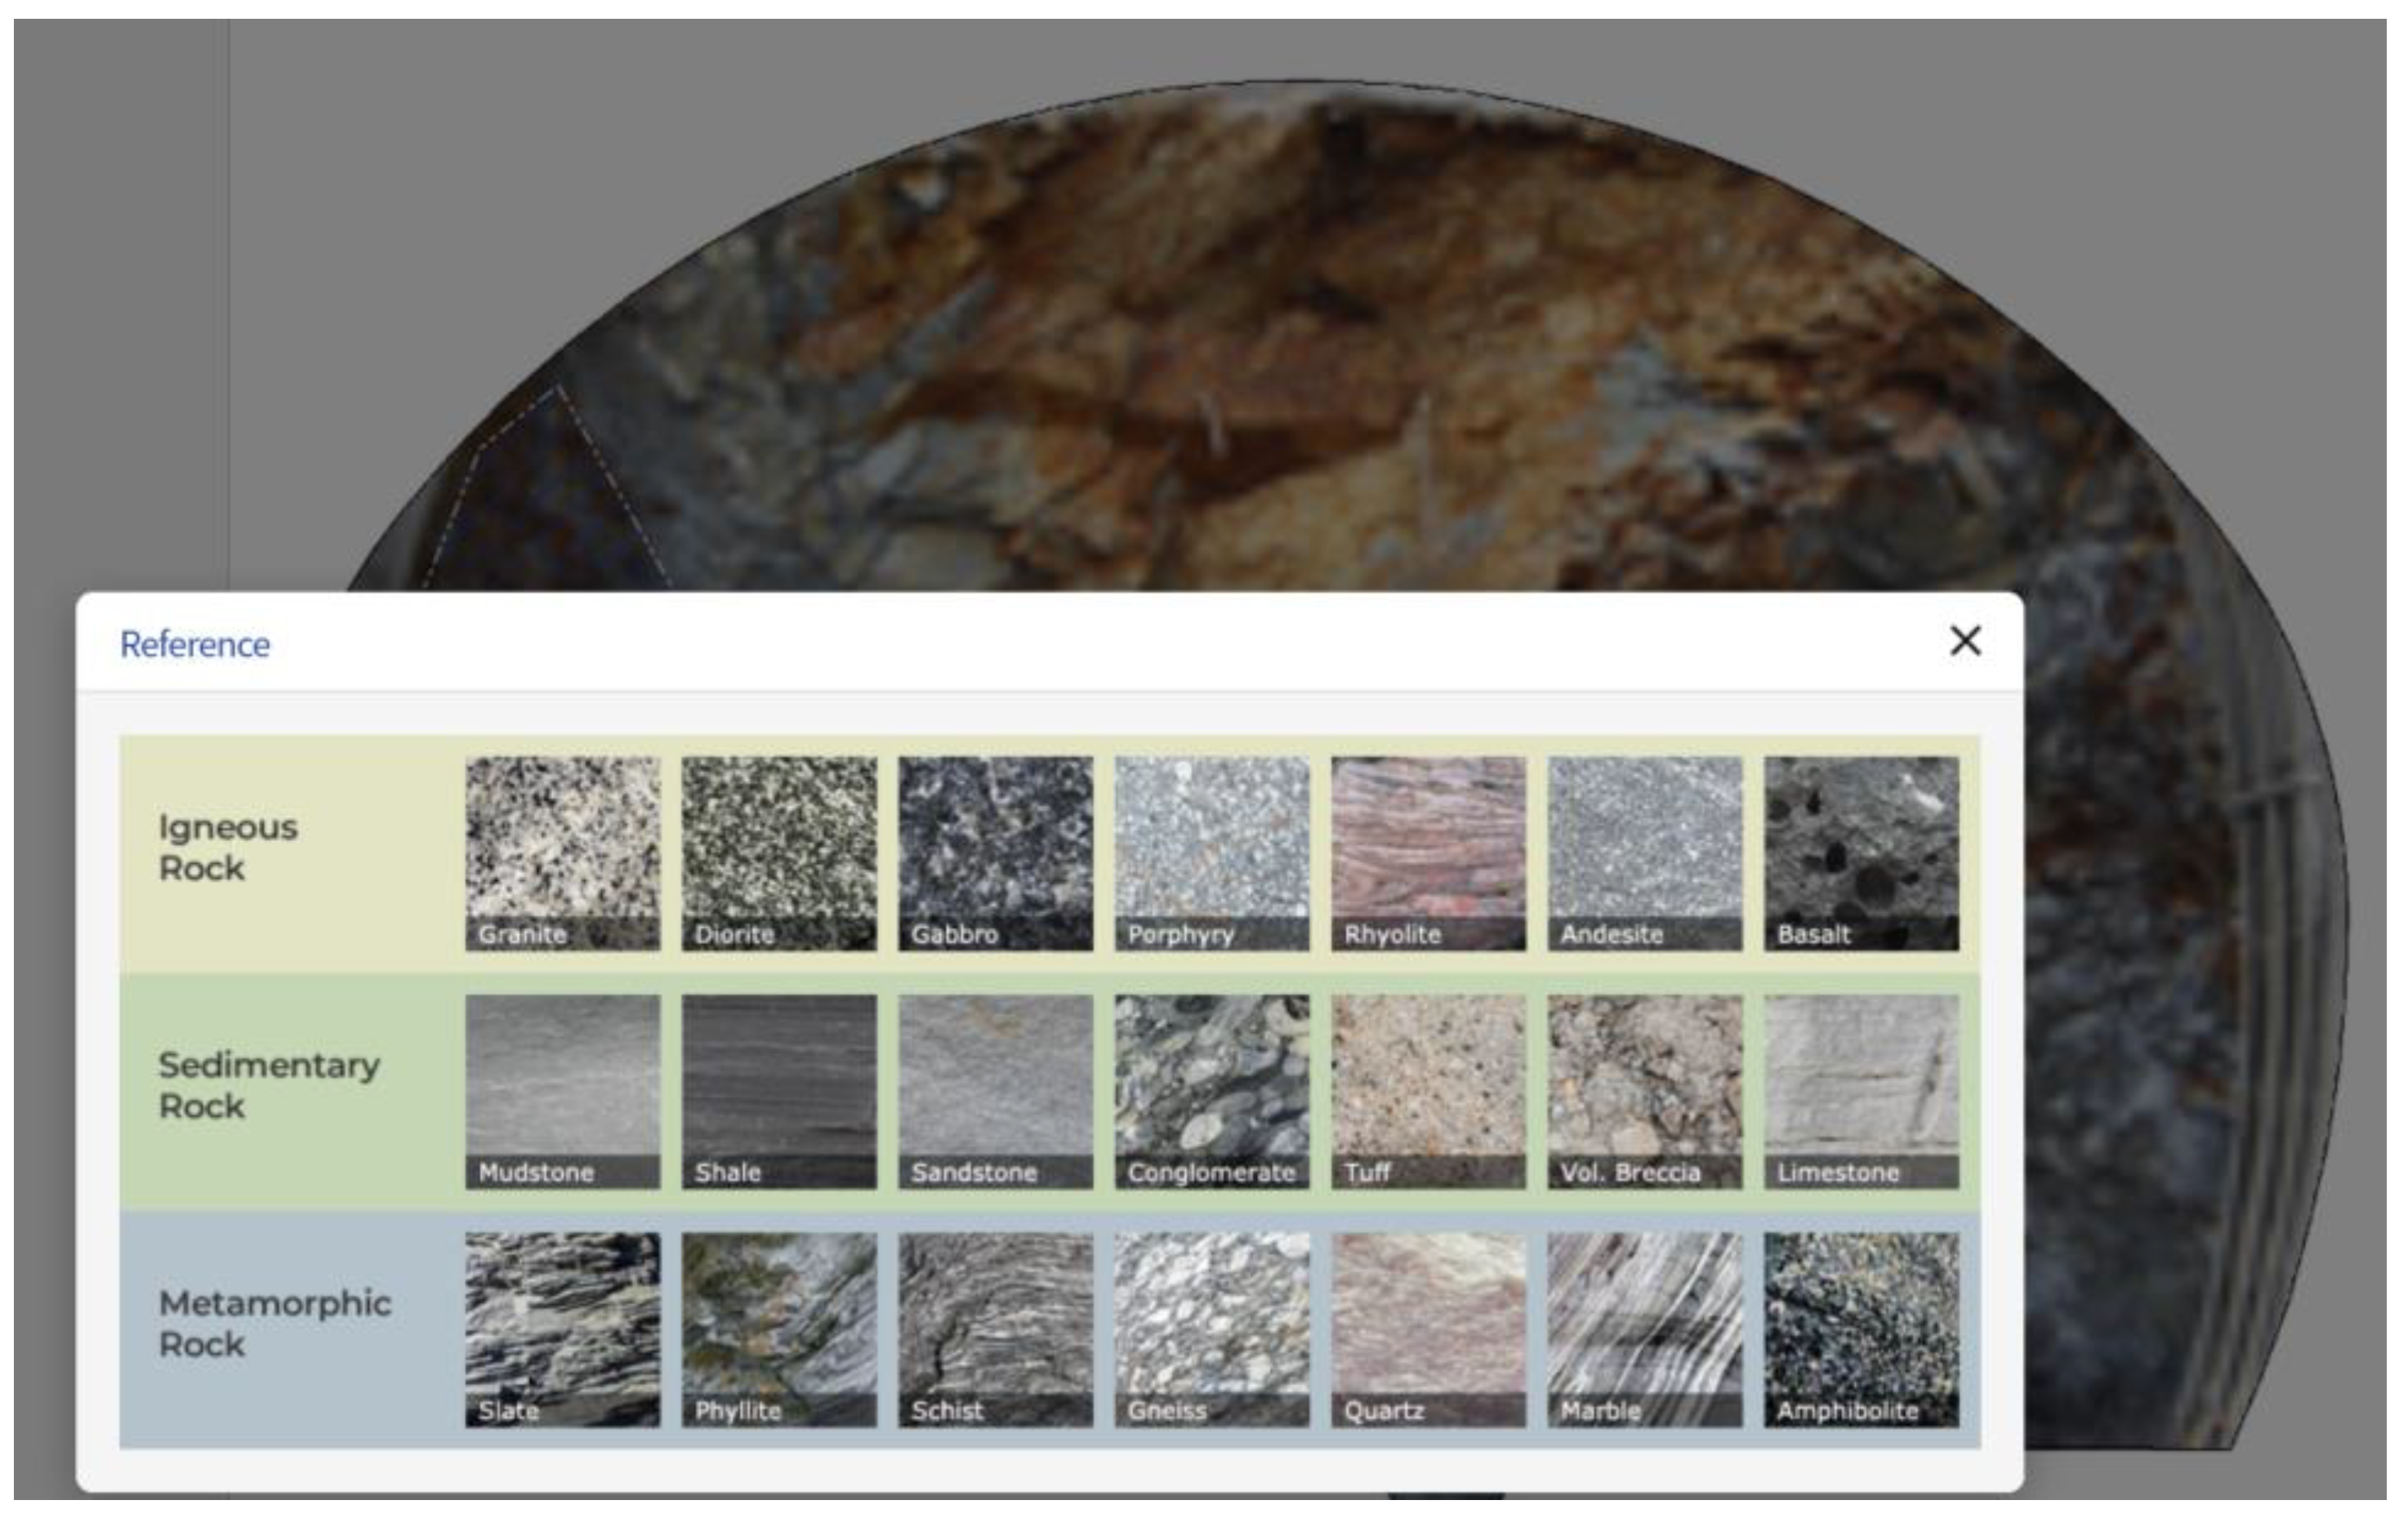
A pop-up window displaying photographs of seven representative rock types of granite, sedimentary rock, and metamorphic rock is presented in Figure 10. This visual reference assists users in accurately identifying and specifying the rock type encountered during mapping.
Figure 11 delineates the strength characteristics of the rock alongside the properties of the joints. Additionally, the groundwater condition was categorised into distinct areas, with the user interface designed to represent these conditions across five stages, ranging from dry to flowing states. This structured representation enhances the clarity and usability of the geological data collected using the mapping system.

3.2. Automated Rock Mass Classification System

The construction field manager is a key player in reporting tunnel face mapping and rock mass quality rating results to stakeholders, including clients and upper management. This process is significantly optimised by utilising the developed software system, which facilitates effective communication and data management.
During the digital mapping of each tunnel section, geological information and quantitative data are systematically stored in a digital format on a dedicated server. Utilising an automatic rock quality evaluation program, the stored digital information is aligned with parameter grades contained in RMR or Q-value rating sheets, thereby enabling the automatic computation of the final rock mass quality score.
The software automatically calculates geometric information, such as the average spacing and length of joints, using computational formulas. The strike and dip directions are also displayed as numerical data and subsequently stored in the database for future reference. This integration of geometric data enhances the precision of the rock mass evaluations.
The average roughness of joint surfaces visible on the excavation face is classified into five distinct categories, ranging from ‘very rough’ to ‘slickenside’. This classification is visually represented using varying line thicknesses corresponding to each joint set, providing a clear indication of joint characteristics.
The composition and thickness of fill material within the joints are denoted by colours: black indicates no fill material, red indicates hard fill material with a thickness greater than 5 mm, orange denotes hard fill material of 5 mm thickness or less, purple signifies soft fill material exceeding 5 mm, and green represents soft fill material with a thickness of 5 mm or less.
The weathering of the wall rock adjacent to the joints is represented by different line types. For instance, a double solid line signifies unweathered wall rock, a solid line indicates slight weathering, a single dashed line represents moderate weathering, a double dashed line indicates high weathering, and a dotted line signifies completely weathered rock.
Groundwater characteristics at the excavation face are quantified by translating the observed outflow into measurable values that are stored in the database. This quantitative representation aids in the assessment of rock mass parameters for subsequent evaluations.
The orientation of the major joint is recorded numerically during mapping by assessing the angle between the tunnel excavation direction and the major joint. These orientation data serve as a reference for automated rock mass evaluations, contributing to the accuracy of the calculations. The resultant correction value is integrated into the final rock mass rating.
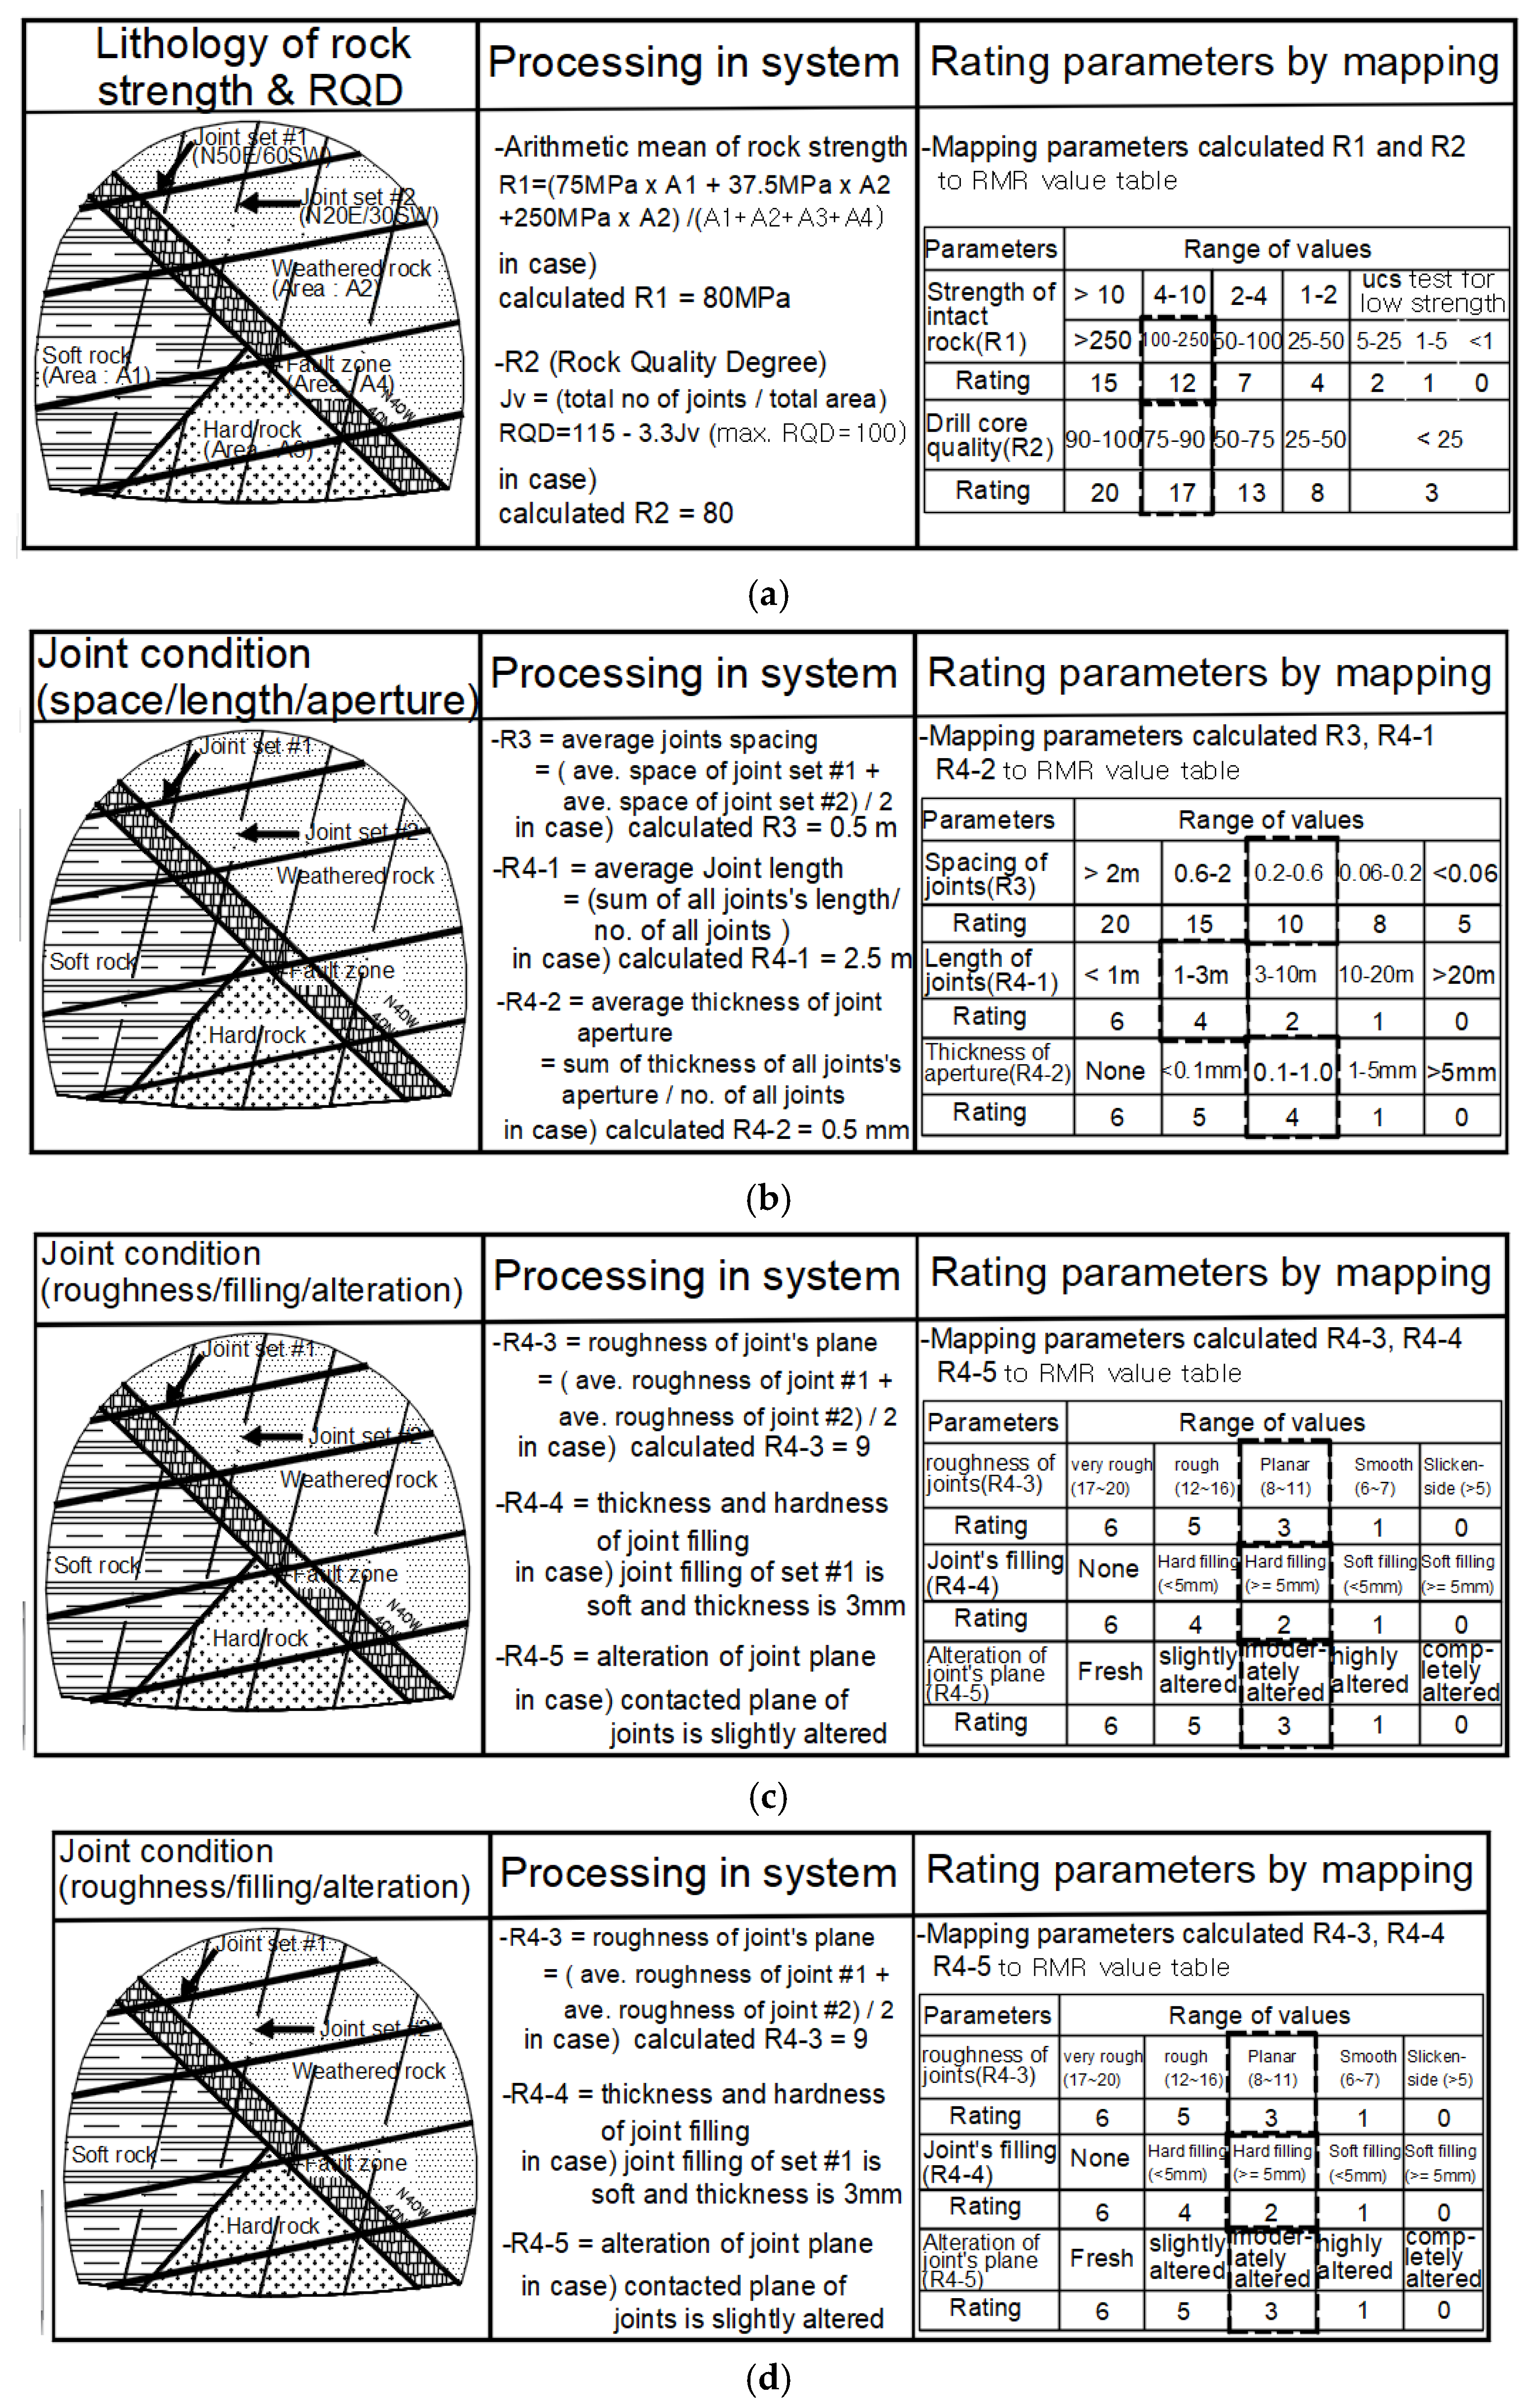
Figure 12 delineates the procedure for deriving the ultimate rating value by correlating the geometric and physical characteristic values generated during the tunnel digital mapping process with the RMR or Q-value classification tables.
The rock mass strength at the tunnel excavation face is quantified using various parameters: R1 represents the rock mass strength, R2 denotes the joint density score, R3 signifies the joint spacing score, R4-1 corresponds to the average length score of the joints, R4-2 indicates the average void size score of the joints, R4-3 reflects the average roughness score of the joint surface, R4-4 represents the filling material score of the joint surface, R4-5 corresponds to the weathering degree score of the wall rock adjacent to the joints, and R5 signifies the groundwater outflow score on the excavation surface. These values are summed, and the final RMR rating is computed by subtracting a correction value (R6), which is based on the orientation of the main joint set relative to the tunnel axis.
Figure 13 illustrates the final RMR report, which is automatically generated by selecting the evaluated parameter values obtained through the tunnel digital mapping process from the corresponding RMR classification table. This automation significantly improves both the efficiency and accuracy of documenting rock mass assessments.

4. Tunnel Digital-Mapping-Based Online Rock Mass Evaluation

4.1. Challenges

Manual tunnel face mapping often yields rock mass information with low reliability relative to the time and effort invested. The variability in results can be considerable, largely depending on the individual skills and preferences of the geologist, which complicates the attainment of accurate and consistent evaluations of rock mass quality. This inconsistency underscores the need for more standardised methodologies in rock mass assessment.
Digital tunnel mapping can mitigate these challenges by allowing geologists to capture images of the tunnel excavation face using devices such as tablets or mobile phones. Thereafter, the geologists relocate to a position that does not obstruct subsequent work activities. The recently developed system enables geologists to input geological information directly onto the excavation face image within minutes, thereby streamlining the mapping process and facilitating the automatic generation of rock mass evaluation reports.
The transition to a digitised approach minimises the errors and inaccuracies often associated with subjective differences in the skills and opinions of geologists during mapping and assessment. This process enhances the efficiency and accuracy of mapping, report writing, and information delivery.
While the current system markedly improves the mapping process, the biases and skill disparities among geologists cannot be entirely eliminated without implementing methods that incorporate automatic geological information assignment through deep-learning techniques. The integration of such advanced analytical methods will represent the next steps in the development of more robust geological evaluation systems.

4.2. Discussion

Currently, the assessment of rock mass quality at the tunnel excavation face is only conducted when the support pattern requires modification or additional reinforcement is needed due to alterations in the rock mass conditions relative to the parameters used during the tunnel’s design phase. In such instances, upon solicitation from the construction manager, the contractor, along with the responsible supervisor and pertinent tunnel experts, performs an on-site inspection of the tunnel face. This team reviews the materials present at the site to determine the requisite modifications to rock support patterns and the incorporation of additional reinforcements.
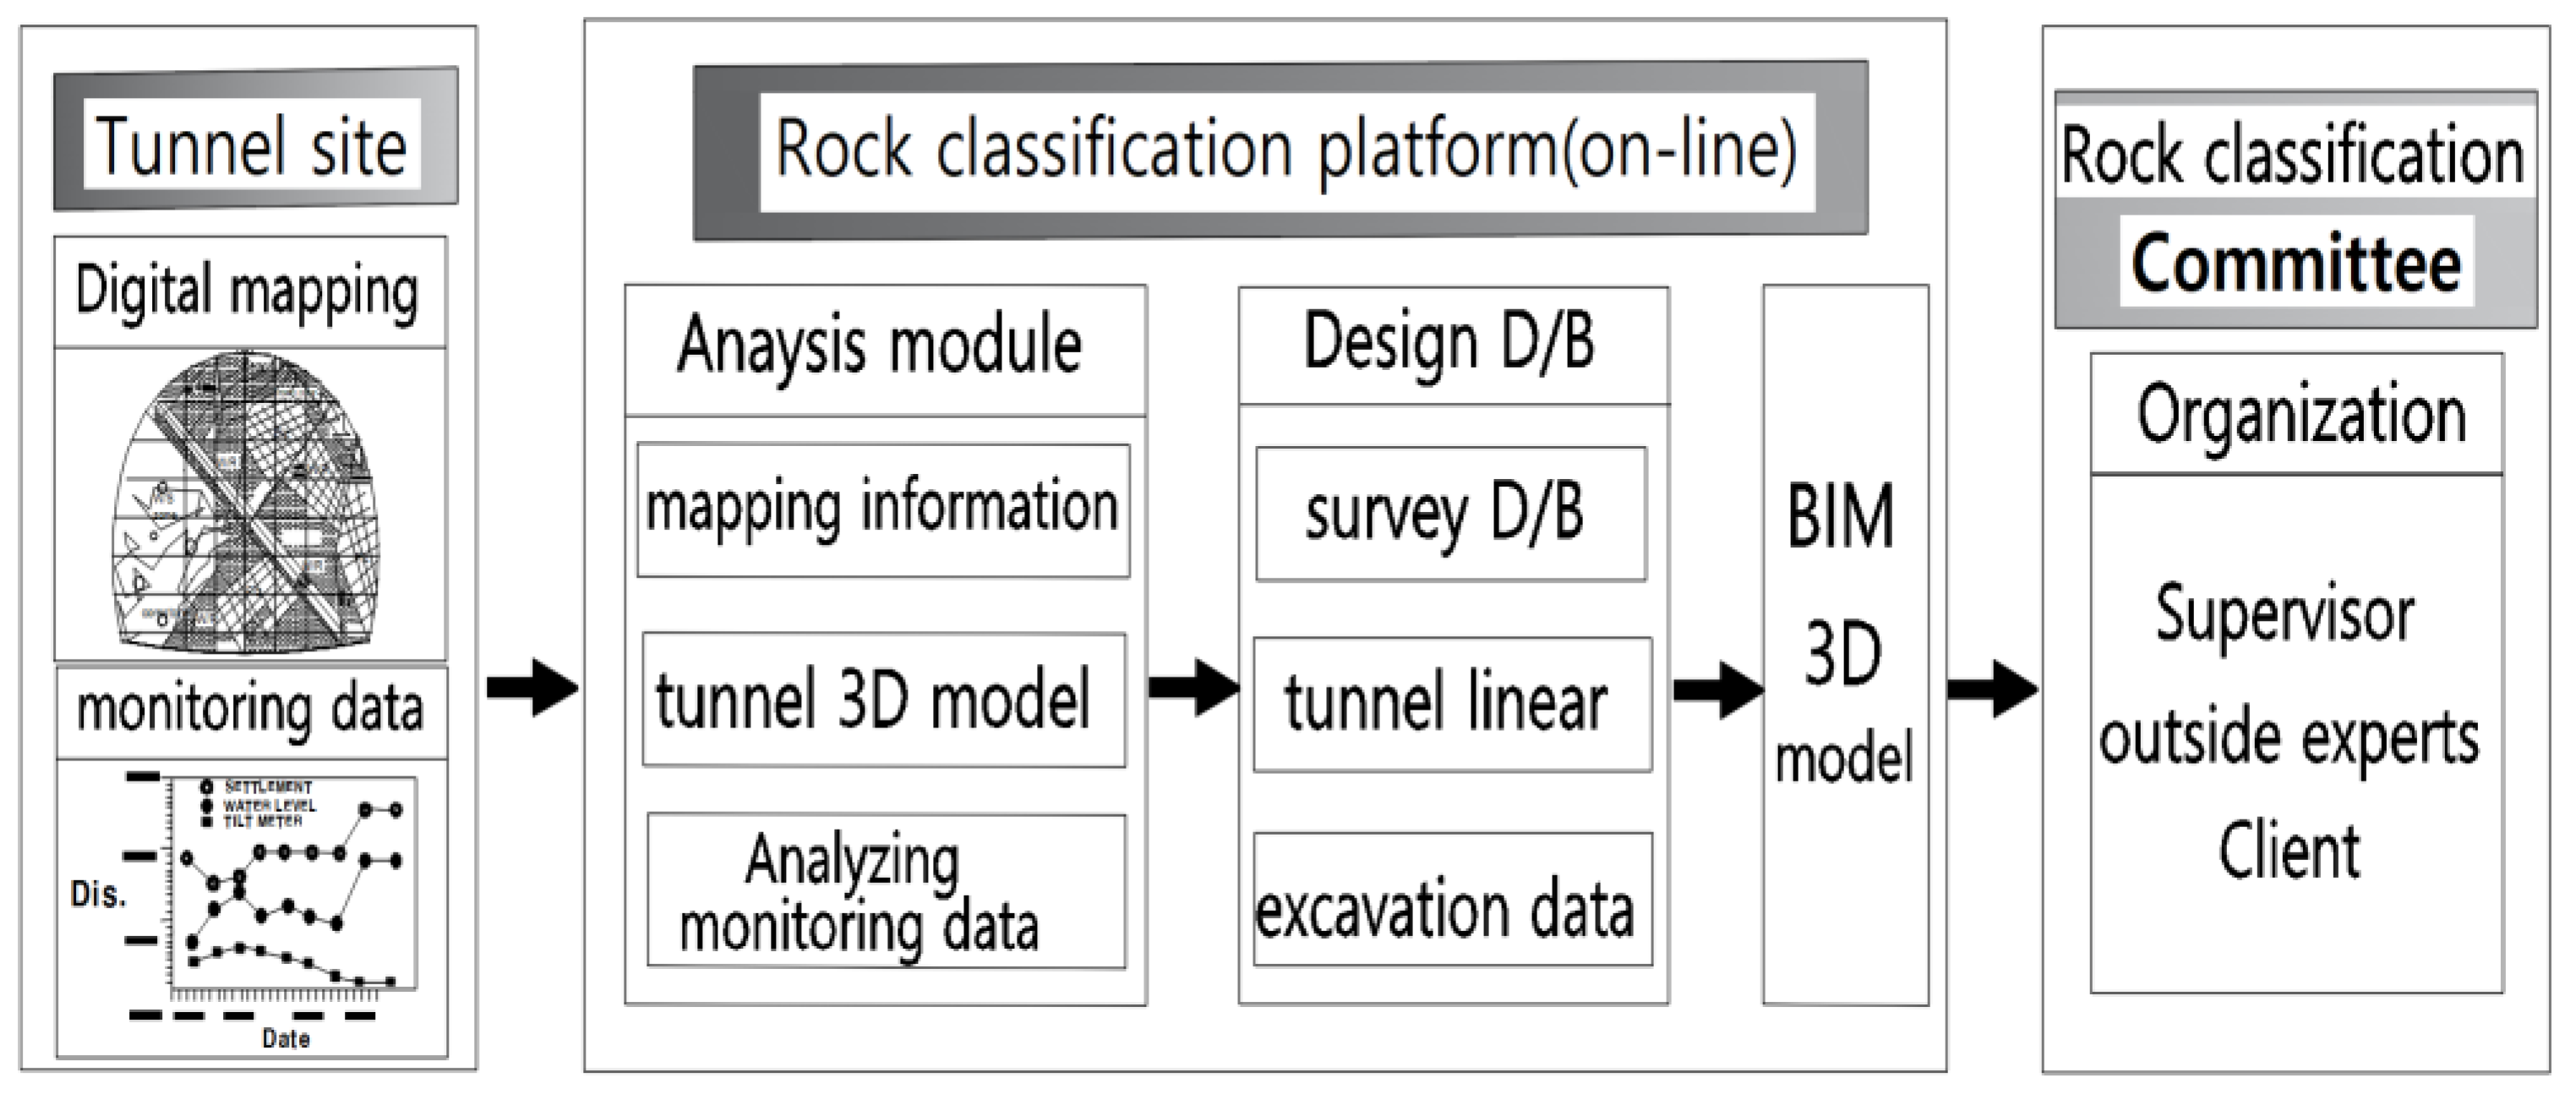
Implementing digital excavation face mapping enhances efficiency and the streamlining of production, management, transmission, and reporting of mapping results. This digital approach can substantially reduce the time frame required for critical decision-making processes, such as rock quality evaluation and adjustments to support patterns. Utilising face mapping derived from image data is a promising opportunity to transition from the traditional offline rock quality evaluation to an online platform, thus enabling more realistic and timely data to be obtained.
To effectively establish an online rock mass quality assessment system, it is imperative to provide comprehensive 3D geological profiles, 3D models of the tunnel face, and pertinent monitoring data and information on design and construction materials. This integration is vital for facilitating accurate evaluations of rock mass quality, thus allowing assessment committee members to engage with the rock mass characteristics remotely, even in the absence of physical site visits.
Consequently, there is a need to establish a digital platform that serves as a repository for digital face mapping materials alongside essential data from the design and construction phases. This platform should be designed to enable remote access by assessment committee members, thereby equipping them with the necessary information for informed decision making regarding rock mass quality assessment, as illustrated in Figure 14.
In future research, we will enhance the current system by integrating a three-dimensional geological profile map. Additionally, we plan to incorporate wedge analysis and implement an automated extraction system for identifying joints from photographs of tunnel faces using artificial intelligence techniques, including deep learning. These advancements are intended to improve the accuracy and efficiency of geological assessments within tunnel environments.

5. Conclusions

Conventional manual tunnel face mapping relies heavily on the geologist’s direct visual observation, which often presents challenges in accurately assessing tunnel conditions. Factors such as inadequate lighting and ventilation, along with the limited time available for investigation, particularly when subsequent construction activities are imminent, can hinder the evaluation. Therefore, this approach may not consistently yield reliable results.
In contrast, adopting digital mapping techniques allows for the excavation face to be documented using mobile devices, such as tablets. Geologists can subsequently enhance captured images by adding geological information related to rock quality, joint conditions, and groundwater presence after relocating to a safe distance from the construction site. This methodology not only facilitates the rapid and accurate documentation of geological information but also minimises interference with ongoing construction processes. Furthermore, in regions where real-time communication is unavailable, mapping and rating can be executed using mobile applications, with data temporarily stored on the mobile device. Upon regaining connectivity, a hybrid system can be employed to automatically upload data to a centralised server.
During the digital mapping of the tunnel excavation face, critical information regarding rock strength, geometric characteristics of joints, and groundwater inflow is stored as digital data within the database of the system. The software subsequently aligns these data with the RMR classification table to ascertain the quality grade based on predefined parameters to calculate the corresponding rating value. Consequently, by capturing images and performing digital mapping, the RMR sheet is automatically generated, resulting in the efficient production of report files. This enhances the convenience of data storage, preservation, and reporting.
The use of high-precision equipment, such as laser scanners, is becoming commonplace for the automatic extraction of joints from the tunnel excavation face and for assessing joint directionality and roughness with improved accuracy. Concurrently, efforts are underway to develop three-dimensional models of discontinuities for tunnel stability analysis, including key block analysis. Artificial intelligence methodologies, especially machine learning, are being explored for automating joint extraction and evaluating rock quality. However, it is important to note that while deep learning can generate geometric information regarding joints from image or scanner data, it struggles to accurately interpret physical properties, such as rock strength, joint filling states, and groundwater conditions. Therefore, there is an imperative need to develop integrative solutions that combine qualitative rock quality insights from direct geologist surveys with digital information to enhance the overall rock quality evaluation process.
Beyond the digital mapping of tunnel faces, further investigation into three-dimensional geological mapping is necessary. This includes predicting fault zone developments, analysing tunnel stability, and implementing automatic rock quality evaluations that leverage images integrated with artificial intelligence, virtual reality, and augmented reality technologies. Such advancements can greatly enhance the accuracy and efficiency of geological assessments in tunnel engineering.

Author Contributions

Digital mapping tool development, H.-K.L.; coding, Y.-O.J.; coding assistant, M.-K.S.; investigation, H.-K.L.; methodology, S.S.-W.L.; validation, M.-K.S.; writing—original draft preparation, H.-K.L.; conceptualisation, M.-K.S.; supervision, S.S.-W.L.; writing—review and editing, S.S.-W.L. All authors have read and agreed to the published version of the manuscript.

Funding

This work was supported by the Korea Agency for Infrastructure Technology Advancement (KAIA) grant funded by the Ministry of Land, Infrastructure and Transport (Grant 21UUTI-B157786-02).

Institutional Review Board Statement

Not applicable.

Informed Consent Statement

Not applicable.

Data Availability Statement

Data are contained within the article.

Acknowledgments

This work was supported by the Korea Agency for Infrastructure Technology Advancement (KAIA) grant funded by the Ministry of Land, Infrastructure and Transport (Grant 21UUTI-B157786-02) and by the National Research Foundation of Korea (NRF) grant funded by the Korea government (MSIT) (NRF-2020R1A6A3A13077513).

Conflicts of Interest

Author Young-Oh Jeong was employed by the company Partprime Inc. The remaining authors declare that the research was conducted in the absence of any commercial or financial relationships that could be construed as a potential conflict of interest.

References

  1. Clegg, P.; Bruciatelli, L.; Domingos, F.; Jones, R.R.; De Donatis, M.; Wilson, R.W. Digital geological mapping with tablet PC and PDA: A comparison. Comput. Geosci. 2006, 32, 1682–1698. [Google Scholar] [CrossRef]
  2. Terzaghi, K. Rock defects and loads on tunnel supports. In Rock Tunneling with Steel Supports; Proctor, R.V., White, T.L., Eds.; Commercial Shearing and Stamping Company: Youngstown, OH, USA, 1946; Volume 1, pp. 17–99. [Google Scholar]
  3. Deere, D.U.; Deere, D.W. The rock quality designation (RQD) index in practice. In Rock Classification Systems for Engineering Purposes; Kirkaldie, L., Ed.; ASTM Special Publication: West Conshohocken, PA, USA, 1988; Volume 984, pp. 91–101. [Google Scholar]
  4. Wickham, G.E.; Tiedemann, H.R.; Skinner, E.H. Support determination based on geologic predictions. In Proceedings of the North American Rapid Excavation and Tunneling Conference, Chicago, IL, USA, 5–7 June 1972; Lane, K.S., Garfield, L.A., Eds.; American Institute of Mining, Metallurgical, and Petroleum Engineers: New York, NY, USA, 1972; pp. 43–64. [Google Scholar]
  5. Bieniawski, Z.T. Engineering classification of jointed rock masses. Trans. S. Afr. Inst. Civ. Eng. 1973, 15, 335–344. [Google Scholar]
  6. Barton, N.R.; Lien, R.; Lunde, J. Engineering classification of rock masses for the design of tunnel support. Rock Mech. 1974, 6, 189–239. [Google Scholar] [CrossRef]
  7. Romana, M.; Tomás, R.; Serón, J.B. Slope Mass Rating (SMR) geomechanics classification: Thirty years review. In Proceedings of the ISRM Congress 2015 Proceedings—International Symposium on Rock Mechanics, Montreal, QC, Canada, 10–13 May 2015; 10p. ISBN 978-1-926872-25-4. [Google Scholar]
  8. Hoek, E.; Brown, E.T. The Hoek—Brown failure criterion and GSI—2018 edition. J. Rock Mech. Geotech. Eng. 2019, 11, 445e463. [Google Scholar] [CrossRef]
  9. Bieniawski, Z.T. (Ed.) Rock mass classification in rock engineering. In Exploration for Rock Engineering, Proceedings of the Symposium; Balkema: Cape Town, South Africa, 1976; Volume 1, pp. 97–106. [Google Scholar]
  10. Barton, N.; Choubey, V. The shear strength of rock joints in theory and practice. Rock Mech. 1977, 10, 1–54. [Google Scholar] [CrossRef]
  11. Doohwan, J. A management plan for rock tunnel sites considering geological characteristics. J. Korean Geotech. Soc. 2020, 36, 333–340. [Google Scholar]
  12. Fernando, O.; Olalla, C.; Jiménez, R. Relationship between RMRb and GSI based on in situ data. In Proceedings of the Ceballos EUROCK Vigo 2014, ISRM European Rock Mechanics Symposium, Vigo, Spain, 26–28 May 2014. [Google Scholar] [CrossRef]
  13. Zhang, Q.; Huang, X.; Zhu, H.; Li, J. Quantitative assessments of the correlations between rock mass rating (RMR) and geological strength index (GSI). Tunn. Undergr. Space Technol. 2019, 83, 73–81. [Google Scholar] [CrossRef]
  14. Gaich, A.; Pischinger, G. 3D images for digital geological mapping. Geomech. Tunn. 2016, 9, 45–51. [Google Scholar] [CrossRef]
  15. Fekete, S.; Diederichs, M. Integration of three-dimensional laser scanning with discontinuum modelling for stability analysis of tunnels in blocky rock masses. Int. J. Rock Mech. Min. Sci. 2013, 57, 11–23. [Google Scholar] [CrossRef]
  16. Park, S.W.; Kim, H.G.; Bae, S.W.; Kim, C.Y.; Yoo, W.K.; Lee, J.D. Development of Mobile System Based on Android for Tunnel Face Mapping. J. Eng. Geol. 2014, 24, 343–351. [Google Scholar] [CrossRef]
  17. Sagong, M.; Lee, J.S.; You, K.; Kim, J.G. Digitalized tunnel face mapping system (DiTFAMS) using PDA and wireless network. Tunn. Undergr. Space Technol. 2006, 21, 390. [Google Scholar] [CrossRef]
  18. Lee, H.W.; Kim, B.R.; Choi, S.O. Technical Development for Extraction of Discontinuities in Rock Mass Using LiDAR. Tunn. Undergr. Space 2021, 31, 10–24. [Google Scholar] [CrossRef]
  19. Kim, C.-H.; Kemeny, J. Measurement of Joint Roughness in Large-Scale Rock Fracture Using LiDAR. Tunn. Undergr. Space Technol. 2009, 19, 52–63. [Google Scholar]
  20. Kim, H.; Cho, L.; Kim, K.S. Rock Classification Prediction in Tunnel Excavation Using CNN. J. Korean Geotech. Soc. 2019, 35, 37–45. [Google Scholar]
  21. Chen, J.; Zhou, M.; Huang, H.; Zhang, D.; Peng, Z. Automated extraction and evaluation of fracture trace maps from rock tunnel face images via deep learning. Int. J. Rock Mech. Min. Sci. 2021, 142, 104745. [Google Scholar] [CrossRef]
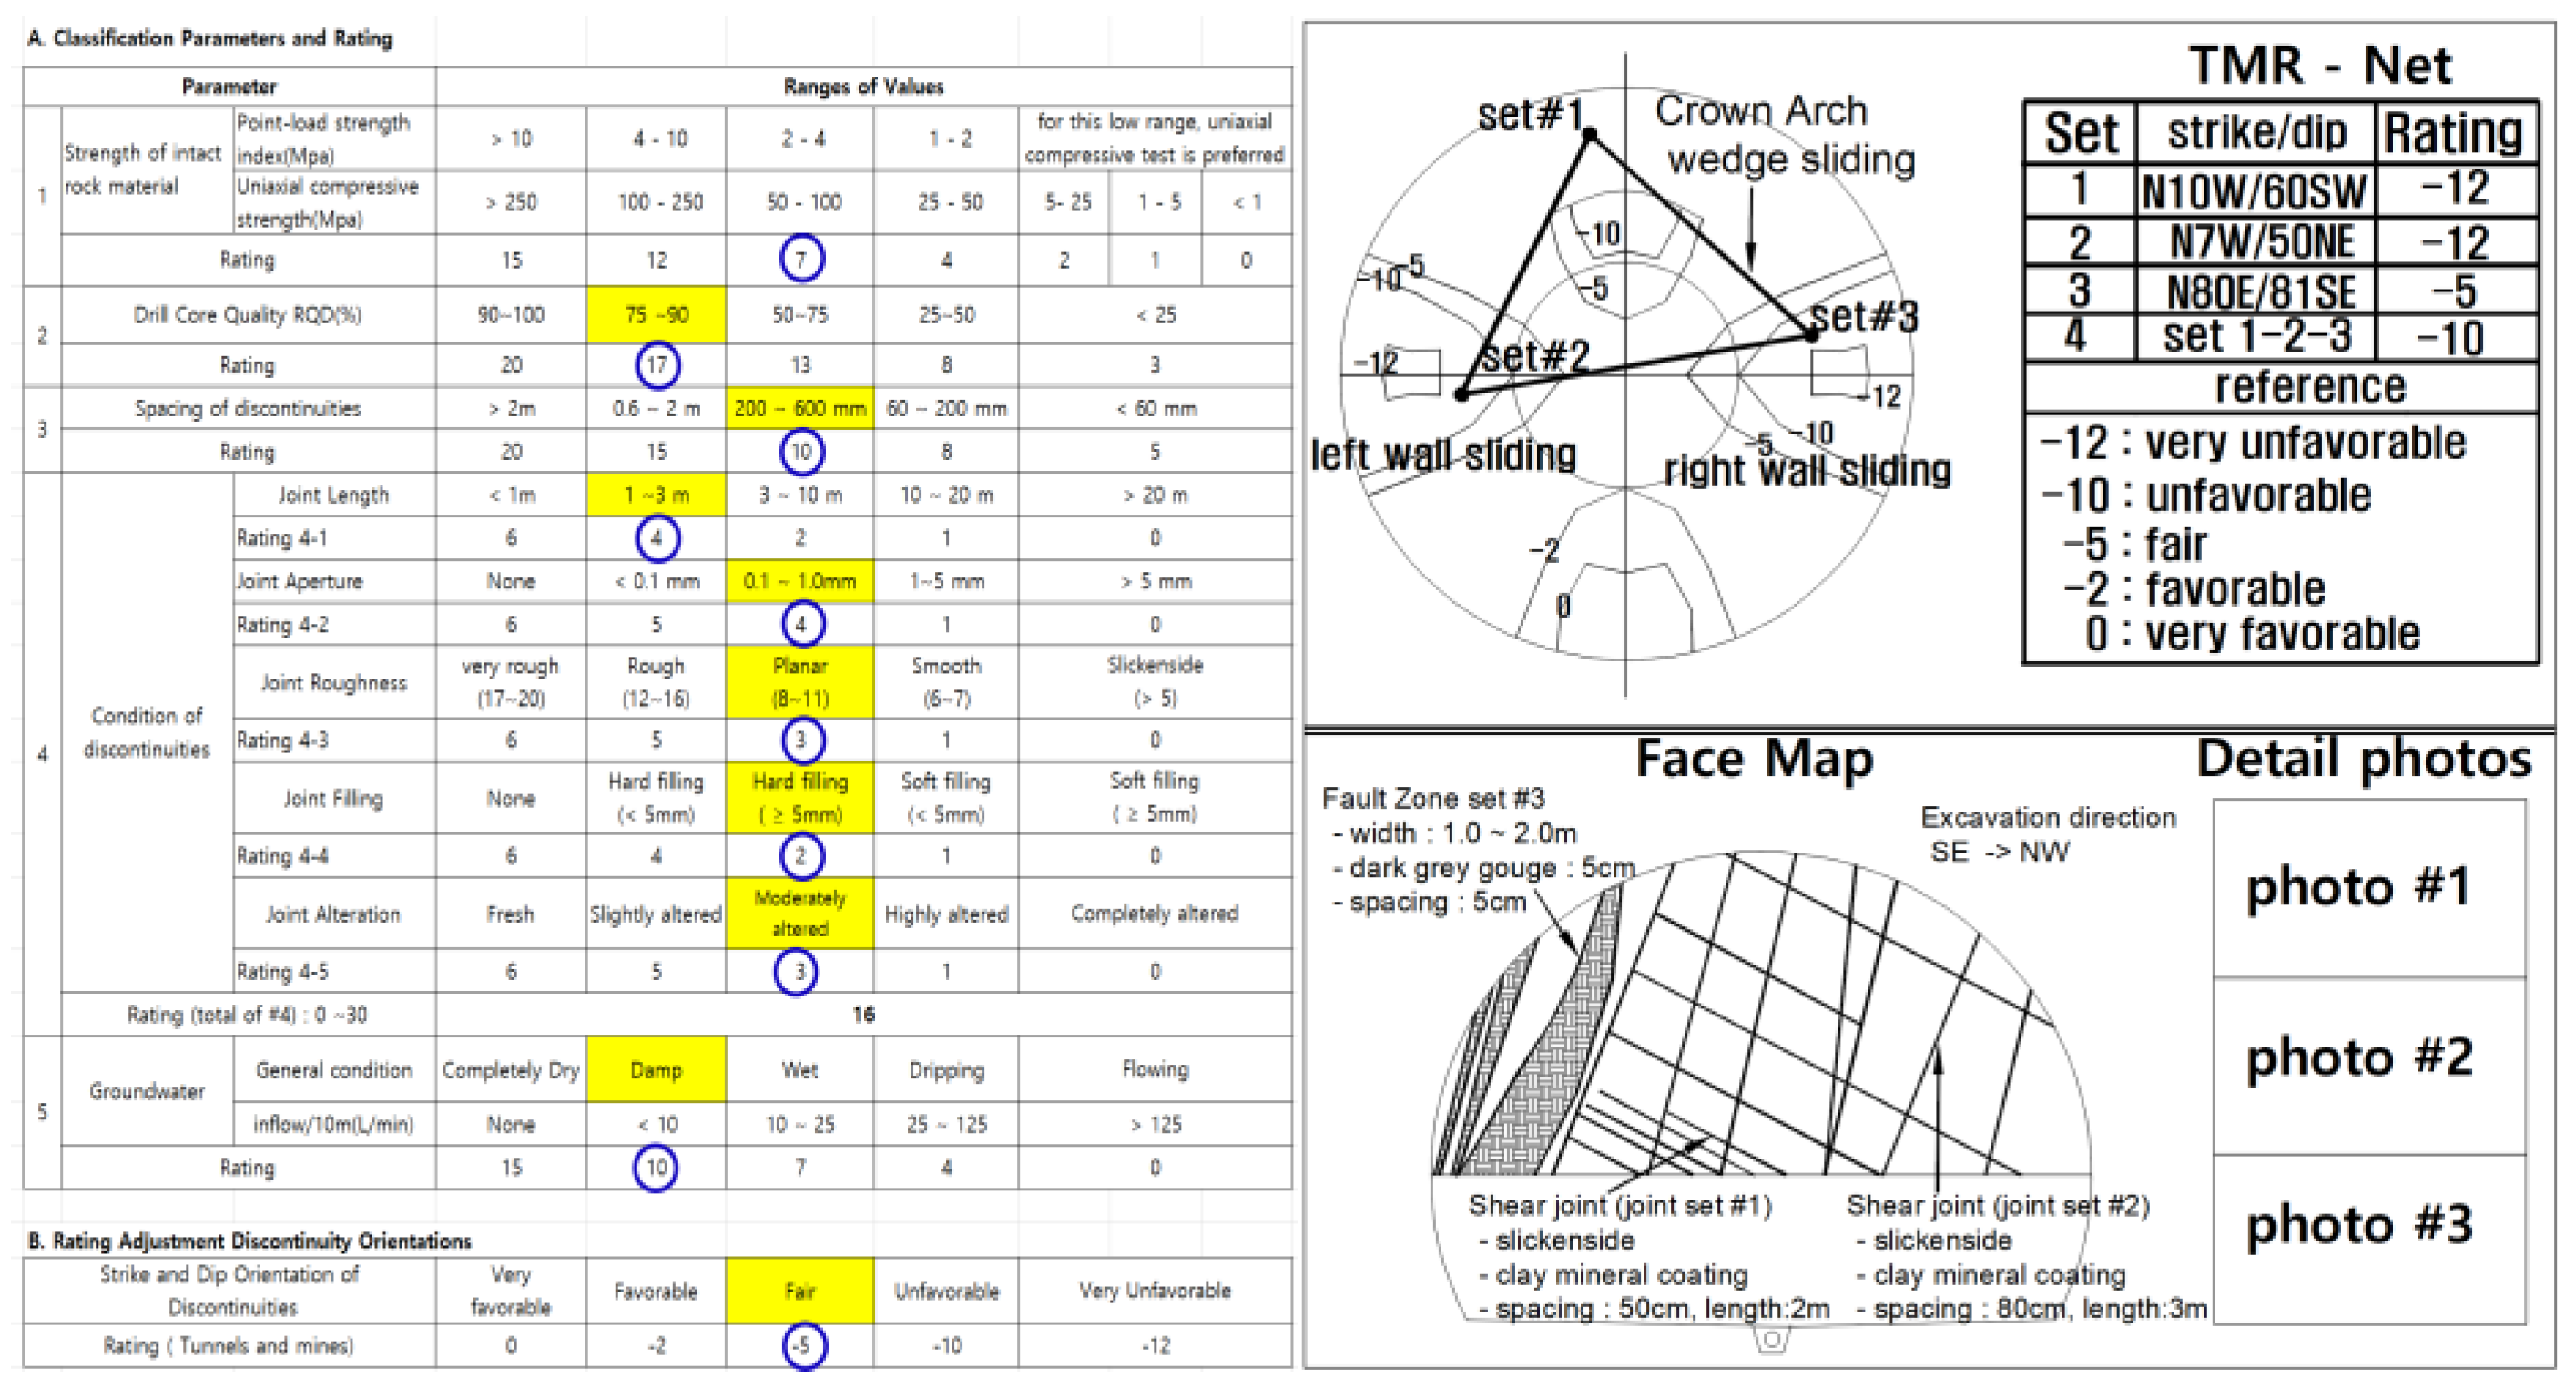
Figure 1. Conventional tunnel face mapping using a geological sketch and RMR sheet.
Applsci 14 09024 g001
Figure 2. Digital mapping system using the tunnel face photo.
Applsci 14 09024 g002
Figure 3. Selecting the support type by RMR classification.
Applsci 14 09024 g003
Figure 4. Implementation case of weighted RMR.
Applsci 14 09024 g004
Figure 5. Classification of support patterns using GSI under extremely poor rock quality.
Applsci 14 09024 g005
Figure 6. System configuration for the tunnel digital face mapping.
Applsci 14 09024 g006
Figure 7. The system diagram for the tunnel digital face mapping.
Applsci 14 09024 g007
Figure 8. Main screen of the tunnel digital face mapping system.
Applsci 14 09024 g008
Figure 9. Input window of the joint properties.
Applsci 14 09024 g009
Figure 10. Reference window for selecting the rock type.
Applsci 14 09024 g010
Figure 11. Reference window for selecting the groundwater condition.
Applsci 14 09024 g011
Figure 12. Rating parameters by matching the digital mapping to the RMR value table. (a) Rating R1 (rock strength) and R2 (drill core quality) parameters. (b) Ratings R3 (joint spacing), R4-1 (joint length), and R4-2 (joint aperture). (c) Ratings R4-3 (joint roughness), R4-4 (joint filling), and R4-5 (joint alteration). (d) Rating R5 (groundwater condition).
Applsci 14 09024 g012
Figure 13. An RMR report using an automated rock mass classification system.
Applsci 14 09024 g013
Figure 14. A diagram of an online rock mass rating system using digital mapping.
Applsci 14 09024 g014
Table 2. Rock mass classification by RMR and GSI.
DivisionRMRb (1989)GSIRemark
Uniaxial
Strength
150
Mechanical
Structure
4050RQD
Joint space
Discontinuities
Condition
3050
Groundwater
Condition
150
Table 3. New technologies related to digital mapping and rock mass characterisation.
SystemCountry
(Company)
Main Function
Four-dimensional super NATM
measurement system
Japan
(Toda corp.)
A tunnel displacement prediction technique using a 3D laser scanner.
Shape-Matrix
3D program
Austria
(3GSM GmbH) [14]
Three-dimensional tunnel modelling and geological digital tunnel mapping using several types of image data and a laser scanner.
Tunnel program
by 3D laser
Greece
(Seraphim
Amvrazis) [15]
Tunnel projection mapping (tunnel face
mapping using a laser scanner).
Forecasting the progress of excavation.
Tunnel digital
mapping system
Korea
(KICT) [16]
Digital mapping of the tunnel face on
a tunnel photo image.
Extraction of discontinuitiesKorea (Seoul
University) [17,18,19]
Extracting joint sets using a laser scanner and deep learning.
Rock classification prediction in tunnel excavation using CNNKorea
(Samsung E&C) [20]
Rock quality classification using a convolutional neural network (CNN).
Automated extraction fracture trace maps from tunnel face imagesChina (Jiayao Chen,
Tongji University) [21]
Extracting fracture and analysing rock structures using a CNN.
Table 4. Hardware lists of tunnel face mapping system.
DivisionServeCloudOSVersionTPMC/CoreCoreMEMDISCSW_WAS
OperationWeb ServeAWSLinux/
UNIX
Amazon
Linux
2/4.2.17
35,490.93
(t2.large)
2Virtualization
Management
Virtualization
Management
Tomcat 8.5
WASAWSLinux/
UNIX
Amazon
Linux
2/4.2.17
35,490.93
(t2.large)
2Virtualization
Management
Virtualization
Management
Tomcat 8.5
DB ServeAWSLinux/
UNIX
Amazon
Linux
2/4.2.17
35,490.93
(t2.large)
2Virtualization
Management
Virtualization
Management
Mysql5.6
DevelopmentWeb Serve-Linux/
UNIX
Ubuntu
20.04
-432GITTomcat 8.5
WAS-Linux/
UNIX
Ubuntu
20.04
-432GITTomcat 8.5
DB Serve-Linux/
UNIX
Ubuntu
20.04
-432GITMysql5.6
Disclaimer/Publisher’s Note: The statements, opinions and data contained in all publications are solely those of the individual author(s) and contributor(s) and not of MDPI and/or the editor(s). MDPI and/or the editor(s) disclaim responsibility for any injury to people or property resulting from any ideas, methods, instructions or products referred to in the content.