Abstract
The following research paper concerns the analysis and characterisation of commercially available surface-enhanced Raman scattering (SERS) substrates. SERS has long been a potentially very powerful method with a great deal of interest around it; however, there are still many obstacles which do not allow SERS to be easily applied to real-world detection and analysis problems. As such, research around the various types of substrates is ongoing, in the hope of streamlining and improving the Raman enhancement mechanism. Scanning electron microscope images were obtained for each of the three substrates, and their features and scales were described. Enhanced Raman spectra for Rhodamine B were obtained for a range of concentrations using each of the three substrates, and, in addition, surface enhancement maps are presented. Enhancement factors were calculated for the 1358 cm−1 peak of Rhodamine B. Complementing the experimental work, theoretical FEM modelling in COMSOL Multiphysics was performed, with the resulting calculations yielding an enhancement prediction adequately accurate to the real substrates.
1. Introduction
Raman spectroscopy has long been established as a powerful analytic tool for the detection of compounds and chemical bonds, as well as analysis of the vibrational and structural properties of a given material. Owing to its non-destructive nature, it is a very attractive method for various applications, including medicine, environmental monitoring, substance regulation and geology [1]. Although very informative, the normal Raman signal of any given analyte is weak and can easily become obscured by fluorescence and even just the background noise. There are multiple ways to remedy this issue, and surface-enhanced Raman spectroscopy (SERS) is one of the most efficient techniques which allows to enhance the intensity of the Raman signal by several orders of magnitude [2]. Two main effects are considered to be responsible for the enhancement of the signal, namely, local electromagnetic (EM) field enhancement and chemical enhancement [3]. Chemical enhancement involves charge transfer between the analyte and substrate molecules, thus enhancing the Raman signal. The main contributor to the enhancement effect, however, is the EM field enhancement which is attributed to surface plasmon resonance (SPR) observed in metallic structures. In addition, by creating nanoscale feature sizes, which are what is often used for SERS applications, these SPRs become localised and, by fine-tuning various structural parameters and configurations, it is possible to obtain a considerable EM field enhancement which in turn creates a large Raman signal amplification. In the best cases, SERS is a method capable of detecting single molecules.
The most widely used SERS substrates contain silver or gold nanoparticles. These metal nanoparticles have unique plasmonic properties that enable the amplification of Raman signals [4]. The size, shape, and surface chemistry of the nanoparticles can be tailored to enhance their SERS activity [5,6]. In recent years, researchers have also developed more complex nanostructures, such as nanorods, nanostars, nanocubes, nanocages, and even fractal structures, which exhibit unique plasmonic properties and offer improved SERS sensitivity [7,8,9]. In addition to the experimental development of SERS substrates, researchers have also used theoretical and computational models to understand the factors that contribute to SERS enhancement and to design new SERS substrates with improved performance. The electromagnetic theory of SERS enhancement is based on the interaction between incident electromagnetic radiation and the plasmonic resonance of the SERS substrate. This theory explains how the plasmonic properties of metallic nanostructures can amplify the Raman signal of analytes. Computational models such as finite-difference time-domain (FDTD) and finite element method (FEM) simulations have been used to reveal the plasmonic properties of metallic nanostructures and predict their SERS performance [10,11,12].
In this work, an analysis of SERS performance for commercially available substrates is conducted. Raman spectra are presented for different concentrations of the analyte Rhodamine B and SEM images are obtained, showing in detail the structures of these substrates. We hypothesise in the context of this research that more chaotic structures lead to better overall Raman enhancement due to the increased likelihood of small interstructural distances. FEM modelling is also carried out in a novel approach, where the real nanostructures are approximated and modelled inside COMSOL, and the relevant results are used to support our observations.
2. Materials and Methods
2.1. Chemicals and Materials
Rhodamine B (C28H31ClN2O3) was obtained from Merck KGaA, Darmstadt, Germany, dye content 80%, molar mass M = 479.02 g/mol. This was used as the analyte for all Raman measurements in order to assess the performance of substrates.
Three substrates were obtained from three different manufacturers. The first batch (called A in the paper) of substrates features glass covered with gold nanostructures. The second (B) batch of substrates is made by covering a plate of silicon with gold nanostructures. The third (C) batch consists of substrates made with gold and silver nanostructures on silicon.
2.2. Sample Preparation
Rhodamine B solutions were prepared at concentrations ranging from 10−2 M down to 10−12 M. The base 10−2 M solution was made by mixing 0.144 g of Rhodamine B with 30 mL of deionized water. Afterwards, the solution was diluted tenfold each time in order to obtain the lower concentrations. After stirring the solutions, the SERS substrates were immersed in every concentration of the solution for 1 h. Following immersion, the substrates were removed from the solutions and left to dry for 15 min. After drying the substrates, Raman measurements were performed. Drying is necessary in order to increase the amount of analyte molecules in close proximity to the active surface of the substrate which both increases the Raman enhancement and quenches the fluorescence of the analyte [13].
2.3. SERS Measurements
Raman spectra were measured using a Princeton Instruments TriVista CRS (777) spectrometer combined with an optical microscope (20× objective). One monochromator was used with gratings of 1800 mm−1 and 600 mm−1. The excitation source used was a Cobolt Samba 150 532 nm YAG diode-pumped laser with a power of 2.55 mW at the sample. Measurements were conducted using various exposure times and accumulations. Each sample was measured at multiple points in order to obtain a more complete dataset of spectra characterising the average performance of the substrate.
Before every measurement, the system was calibrated using a crystalline silicon plate to eliminate any spectral inaccuracies of the Raman signal, as well as to obtain the maximum possible intensity (peak position at 520 cm−1). Regarding data comparison, the signal of the different samples was measured under the same conditions with constant parameters—exposure time and laser power—using filters. The spectra were averaged from around 15–20 measurements at various points on the substrates. In this way, signal fluctuations (which can be large in the case of SERS) tend to be minimised and a better overall characterisation for each substrate is obtained. The fluorescence backgrounds were removed using a spline, manually approximating the shape of the fluorescence spectrum. The (analytical) enhancement factor was calculated by taking the intensity ratio of a Raman peak between a normal Raman measurement and a SERS measurement, normalised by the respective concentrations of the analyte [2].
2.4. SEM Measurements
Scanning electron microscope (SEM) measurements were performed on the Phenom Pro SEM with a magnification range of 160–350 000×, a maximum theoretical resolution of around 8 nm, and acceleration voltages of 5, 10, and 15 kV. High-resolution images were also obtained with the Thermo Fisher Scientific Helios 5 UX SEM with a magnification up to 350 000× and a maximum theoretical resolution of 0.7 nm.
2.5. FEM Modelling
FEM modelling was performed in COMSOL Multiphysics. A somewhat rare approach was employed by constructing a 2D model using cross-sectional electron microscope images of the real substrates as a reference for the geometry. This allows for the modelling of a more accurate representation of the real substrates, instead of being limited to geometrically simple shapes and trivial configurations. The SEM images were imported and contours were drawn on them using an edge threshold. There is an element of choice when deciding the threshold value and the curve tolerance value as these cannot be inquired precisely due to the limited resolution of the SEM. These are therefore chosen so as to minimise artefacts created by the edge detection algorithm while at the same time retaining the smaller details distinguishable in the images.
Using the electromagnetic waves frequency domain physics package, the steady-state solution for an incoming electromagnetic wave of different frequencies interacting with the nanometre scale structure was calculated. The power of the incoming electric field wave was fixed at . Scattering boundary conditions were defined on the edges of the model, alongside perfectly matched layers at the top and the bottom of the models. The full field was calculated. The materials used in the models were representative of the real substrates, with gold and silicon defined for the nanostructures and the substrate, respectively. The interface used for modelling can be found in Supplementary Materials (Figure S1).
3. Results
3.1. SEM
In the SEM (Figure 1) images, it can be seen that the surface of substrate A is covered with large-sized, inhomogeneous, and chaotically arranged silver and gold structures. The particle average sizes are in the range from 100 to 300 nm due to some of the particles being agglomerated. Substrate A shows a fractal structure with high amounts of irregular details seen even at 150,000× magnification, and, as such, the interstructural distances are small. In contrast, substrate B shows a less finely detailed, more ordered gold nanostructure with an, on average, larger effective inter-structural distance. Here, the average particle size is 97 nm. Substrate C consists of especially tiny silver nanoparticles (average size 18 nm), spread out very evenly across the surface, with distances being roughly of the same magnitude as the average particle size.
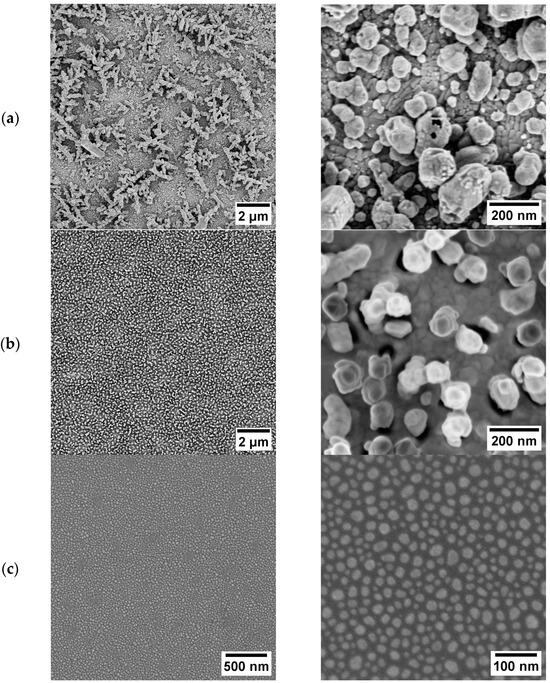
Figure 1.
SEM images of the substrates: (a) substrate A; (b) substrate B; (c) substrate C.
These differences in the morphology of the substrates affect the efficiency of the Raman enhancement in various ways, although the complete relationships between geometric parameters and the SERS enhancement factor are not fully known. However, certain relationships can be noted. For one, the distances between nanostructures and the EF are strongly correlated, with smaller distances yielding a higher EF. At the same time, a reverse relationship can be noted for the sizes of the nanoparticles themselves where a larger nanoparticle shows increased scattering efficiency [14,15]. A certain degree of fractality is also seemingly conducive to a higher Raman signal amplification, a hypothesis previously put forth and researched in some publications [16,17,18]. This influence of fractality, though not directly analysed in this paper, is tentatively characterised in Section 3.3. concerning FEM modelling.
3.2. Raman Measurements
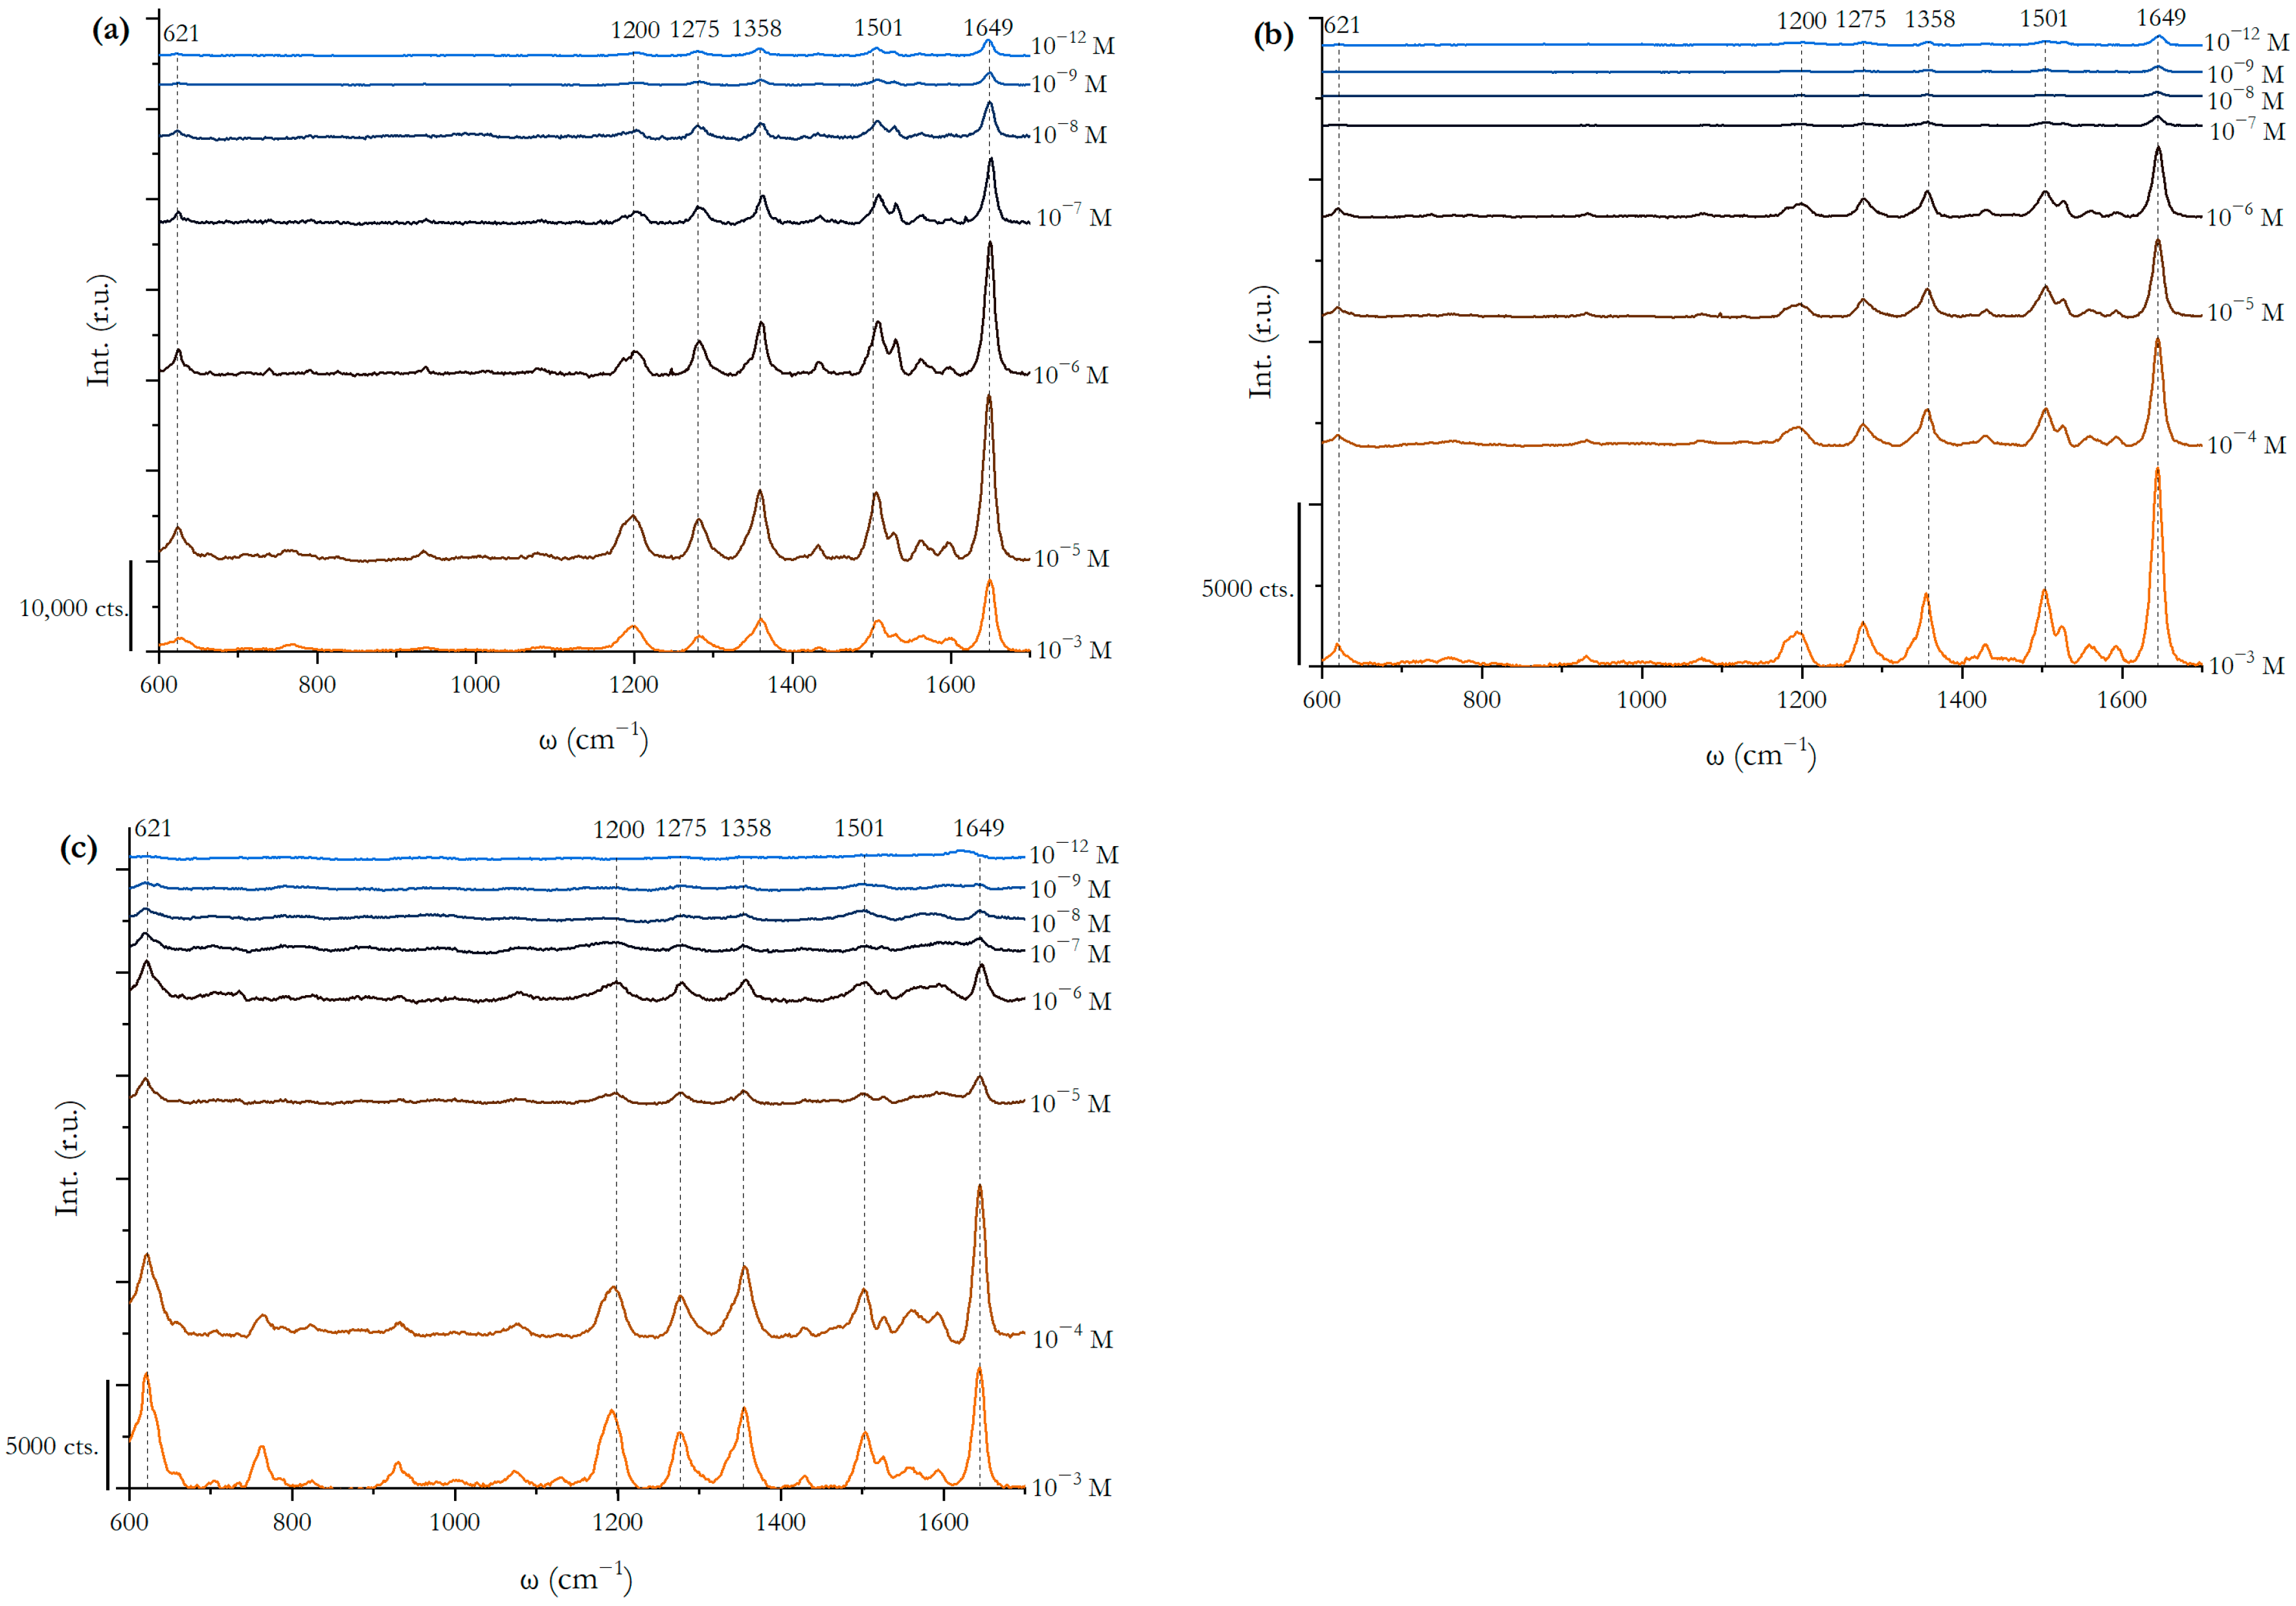
The Raman spectra (Figure 2) of Rhodamine B show a general decrease in intensity with decreasing concentrations, though this decrease is not a simple linear one, nor is it fully monotonous. One can note, in particular, that, almost consistently, the 10−3 M spectra are less intense than the spectra for lower concentrations. This is most probably due to the fact that the highly concentrated solution creates a thicker layer of Rhodamine B upon the substrate; however, since the SERS effect is a surface phenomenon, the additional molecules further away from the surface have little to no effect to the increase in the Raman signal. In fact, they seemingly have the opposite effect—blocking light from hitting the active surface and imparting a large luminescence signal on top of the Raman signal; therefore, a larger concentration of the analyte may not be preferable and may not lead to a larger Raman signal intensity when conducting SERS-based spectroscopy.
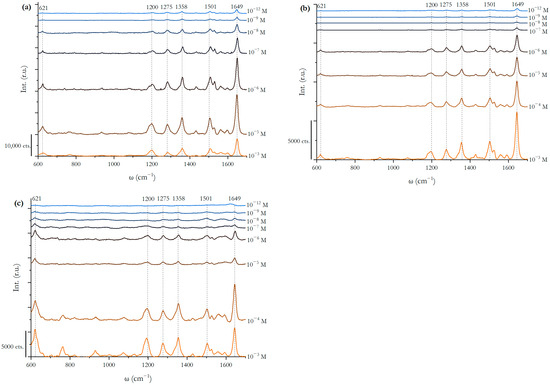
Figure 2.
Rhodamine B SERS spectra at concentrations 10−3...10−12 M on the substrates: (a) substrate A; (b) substrate B; (c) substrate C. The incident laser wavelength is 532 nm @ 2.55 mW, 1 s exposure.
Regarding the various substrates, with the 532 nm incident laser, all substrates show a distinguishable Raman signal down to the 10−9 M Rhodamine B solution. Substrates A and B show stronger Raman signals than C, although substrate C takes over in signal intensity compared to substrate B from around 10−7 M. However, the strong EF leads to the spectrum of amorphous carbon being more enhanced and overwhelming the signal from Rhodamine B. This amorphous carbon spectral contamination is a known problem with the SERS method [19]. The analytical enhancement factors for each substrate at the 1358 cm−1 peak are , , and for substrates A, B, and C, respectively. The EFs have been calculated for concentration 10−6 M; a somewhat high analyte concentration is chosen since it allows for more analyte molecules to be evenly distributed on the surfaces, minimising the random error due to large fluctuations in enhancement caused by a lower number of molecules.
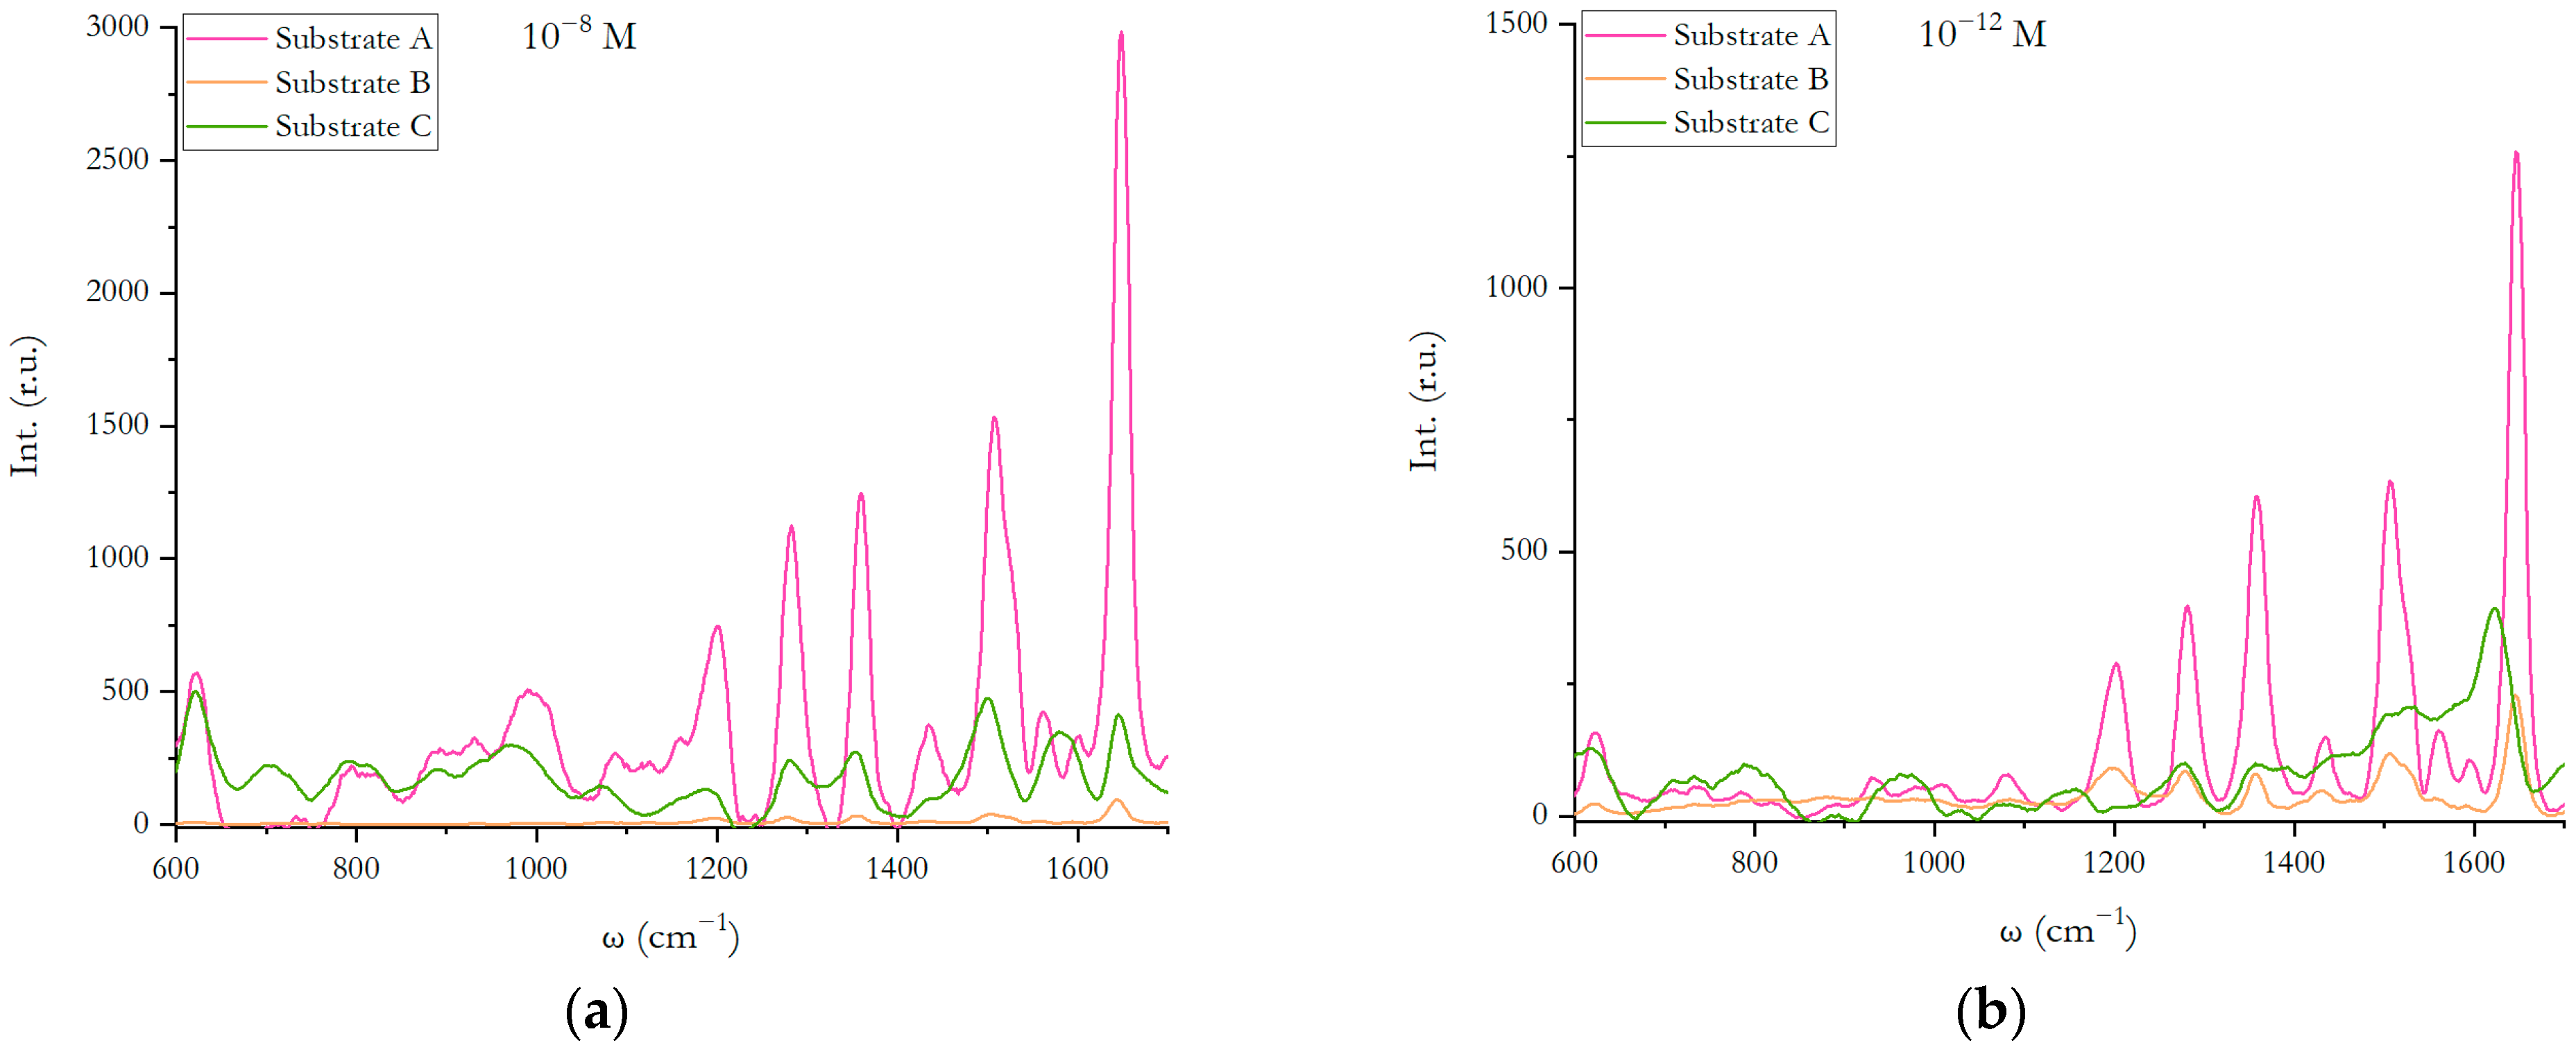
It must be said that the EF by itself is not the only metric by which to determine the quality of a SERS substrate. Some substrates may show less background fluorescence relative to the Raman spectrum which, in turn, makes the Raman maxima easier to distinguish, even if the AEF of the Raman lines may be smaller. This is apparent with substrate B, especially where the resolution of the Raman spectra is still adequately distinguishable down to 10−12 M, although the EF and the general signal intensity for substrate B is at times smaller than those for substrates A and C (Figure 3).
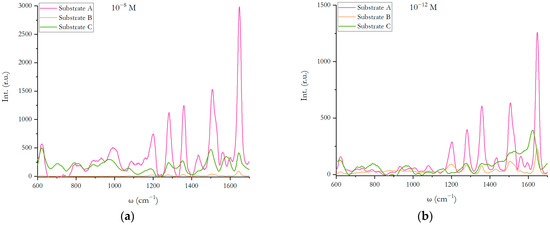
Figure 3.
Comparison of Rhodamine B SERS spectra measured on the substrates (A, B, and C) at concentrations of (a) 10−8 M and (b) 10−12 M. The incident laser wavelength is 532 nm @ 2.55 mW, 1 s exposure.
The way the analytical enhancement factor is conventionally defined (proportional to the analyte concentration) does not accurately describe the way molecules adsorb on the substrate surface and contribute to the enhanced Raman spectra. This is particularly evident when considering single-layered substrates (such as substrate C), where any additional molecules are quickly pushed further and further away from the active surface, in turn barely contributing to the spectrum at all. More accurate EF definitions use an evaluation of the number of molecules within the analyte volume being excited. An even more accurate EF would be defined by taking into consideration the three-dimensionality and multi-layered structure of the substrate, as well as the ways in which the adsorbed analyte molecules contribute to the Raman spectrum. One such definition is the following
which includes the analyte concentration , the effective sampling height , the surface density and surface area of the metallic nanostructures, and the surface density of the analyte molecules . However, such definitions are challenging to use in practice due to the difficulty in evaluating these complex quantities.
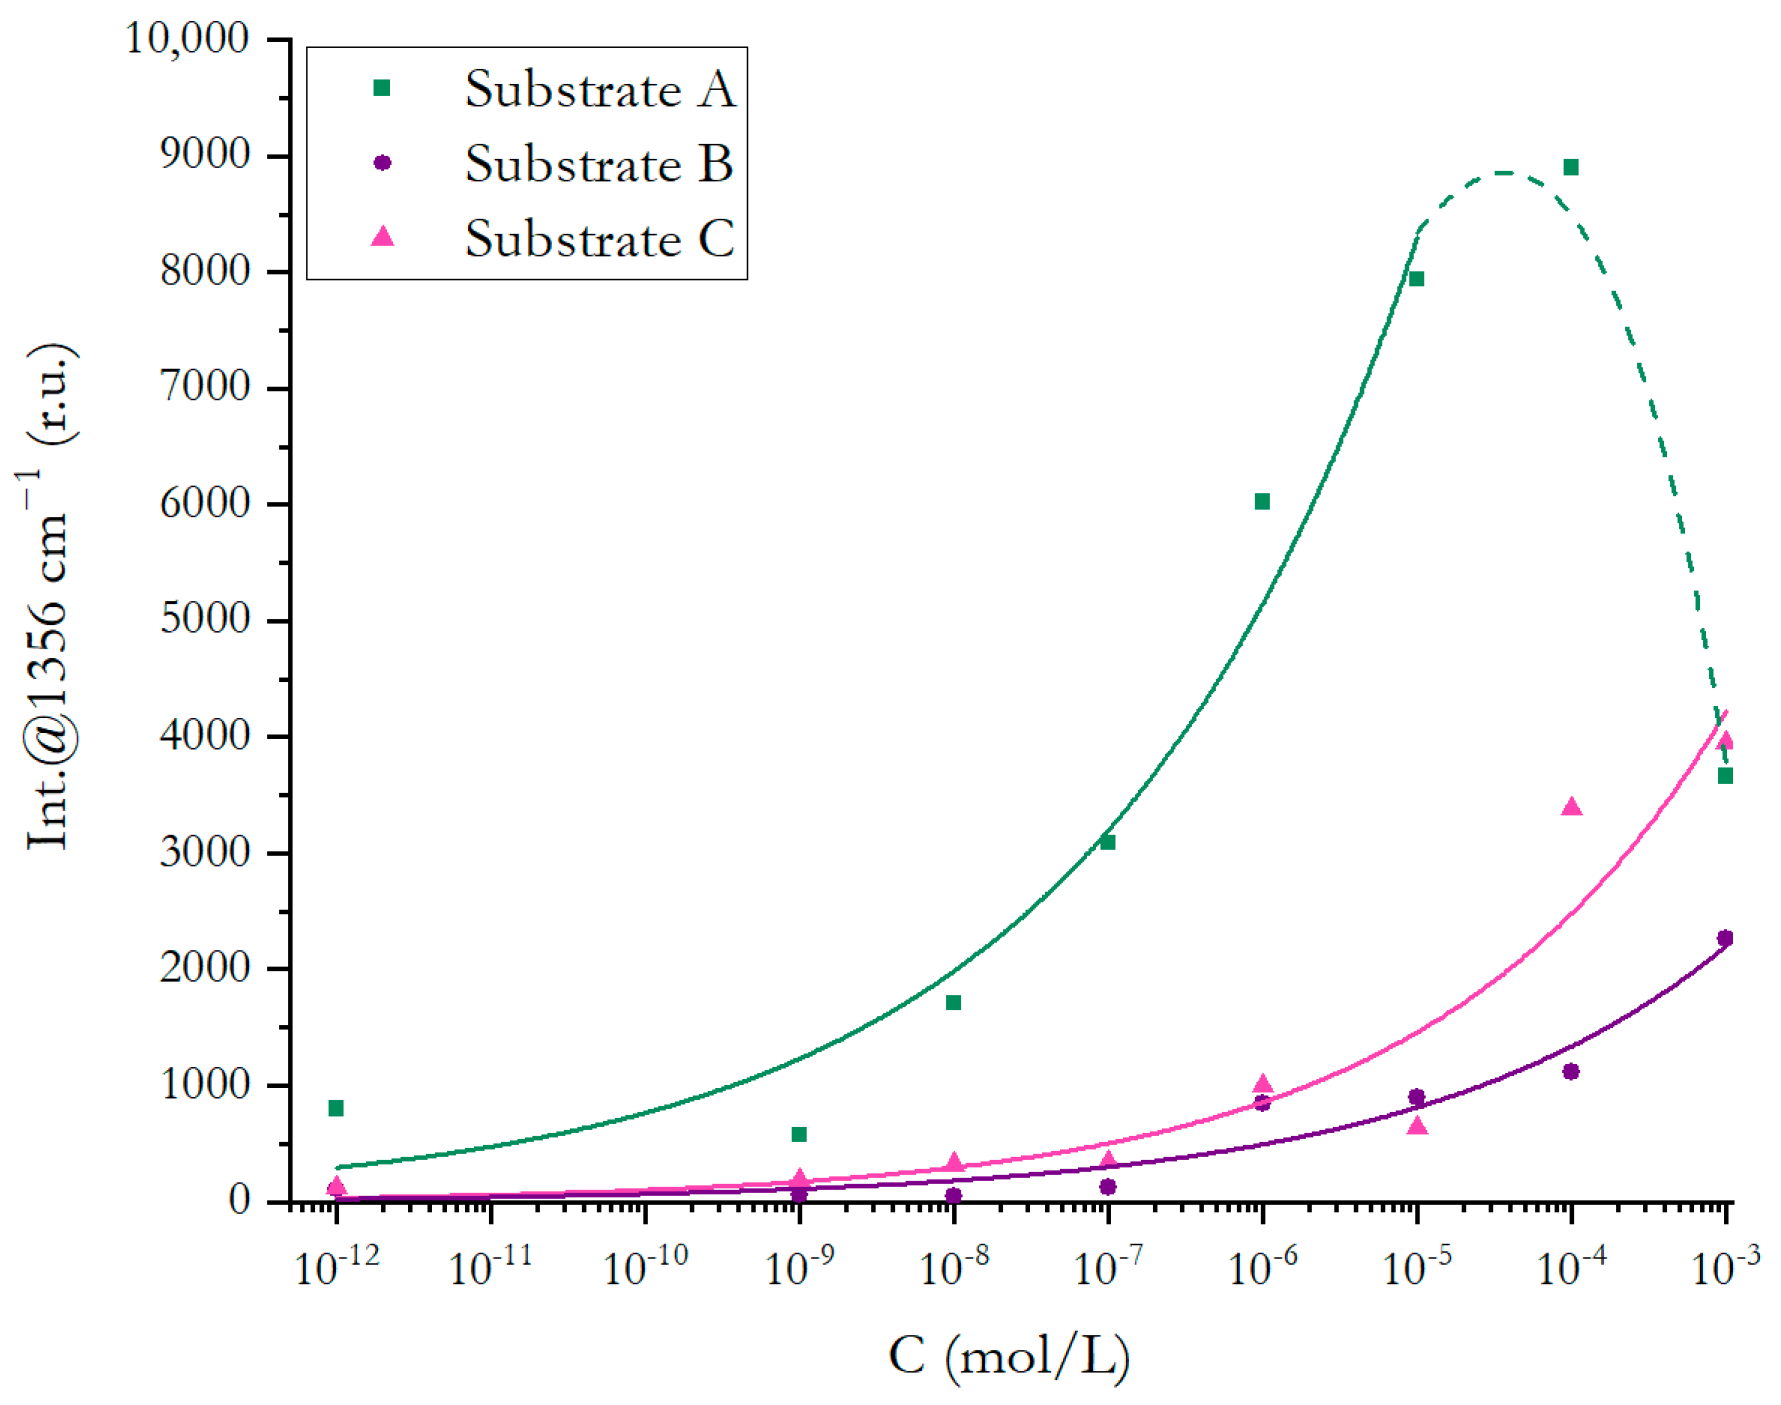
Plotting the 1358 cm−1 Raman peak intensity against concentration and fitting a curve to the data points, an allometric exponential relationship ( can be noted (Figure 4). The approximation is slightly inaccurate around the higher concentration points, due to the reasons described previously. The obtained approximation curves can be used as callibration curves, by which an unknown concentration of Rhodamine B could be deduced, performing a SERS measurement on one of these substrates and relating the obtained 1358 cm−1 peak intensity to the concentration. It can be noted from this exponential relationship that the enhanced Raman intensity is not proportional to the concentration of the analyte (as is the case for conventional Raman spectra). This points to the fact that SERS is a non-linear surface phenomenon; the change in intensity () is larger in the range of higher concentrations but becomes smaller with diminishing analyte concentrations. At lower concentrations, the molecules on average get closer and closer to the active surface and hotspots, which are the main contributors to the enhanced Raman signal, and thus the signal diminishes at a slower rate. This again shows the limitations of the commonly used AEF as a reliable metric for the characterisation of SERS substrates.
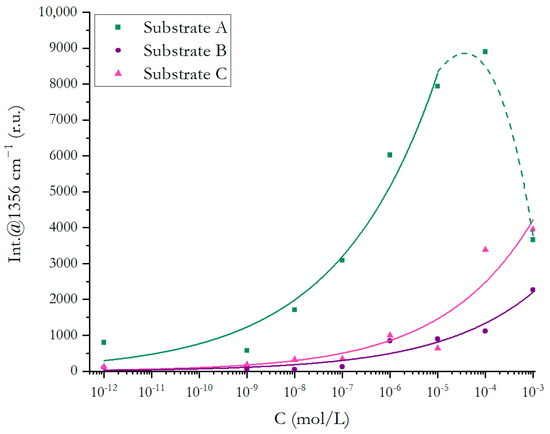
Figure 4.
The 1358 cm−1 Raman peak of Rhodamine B intensity dependence on concentration (substrates A, B, and C). The incident laser wavelength is 532 nm @ 2.55 mW, 1 s exposure.
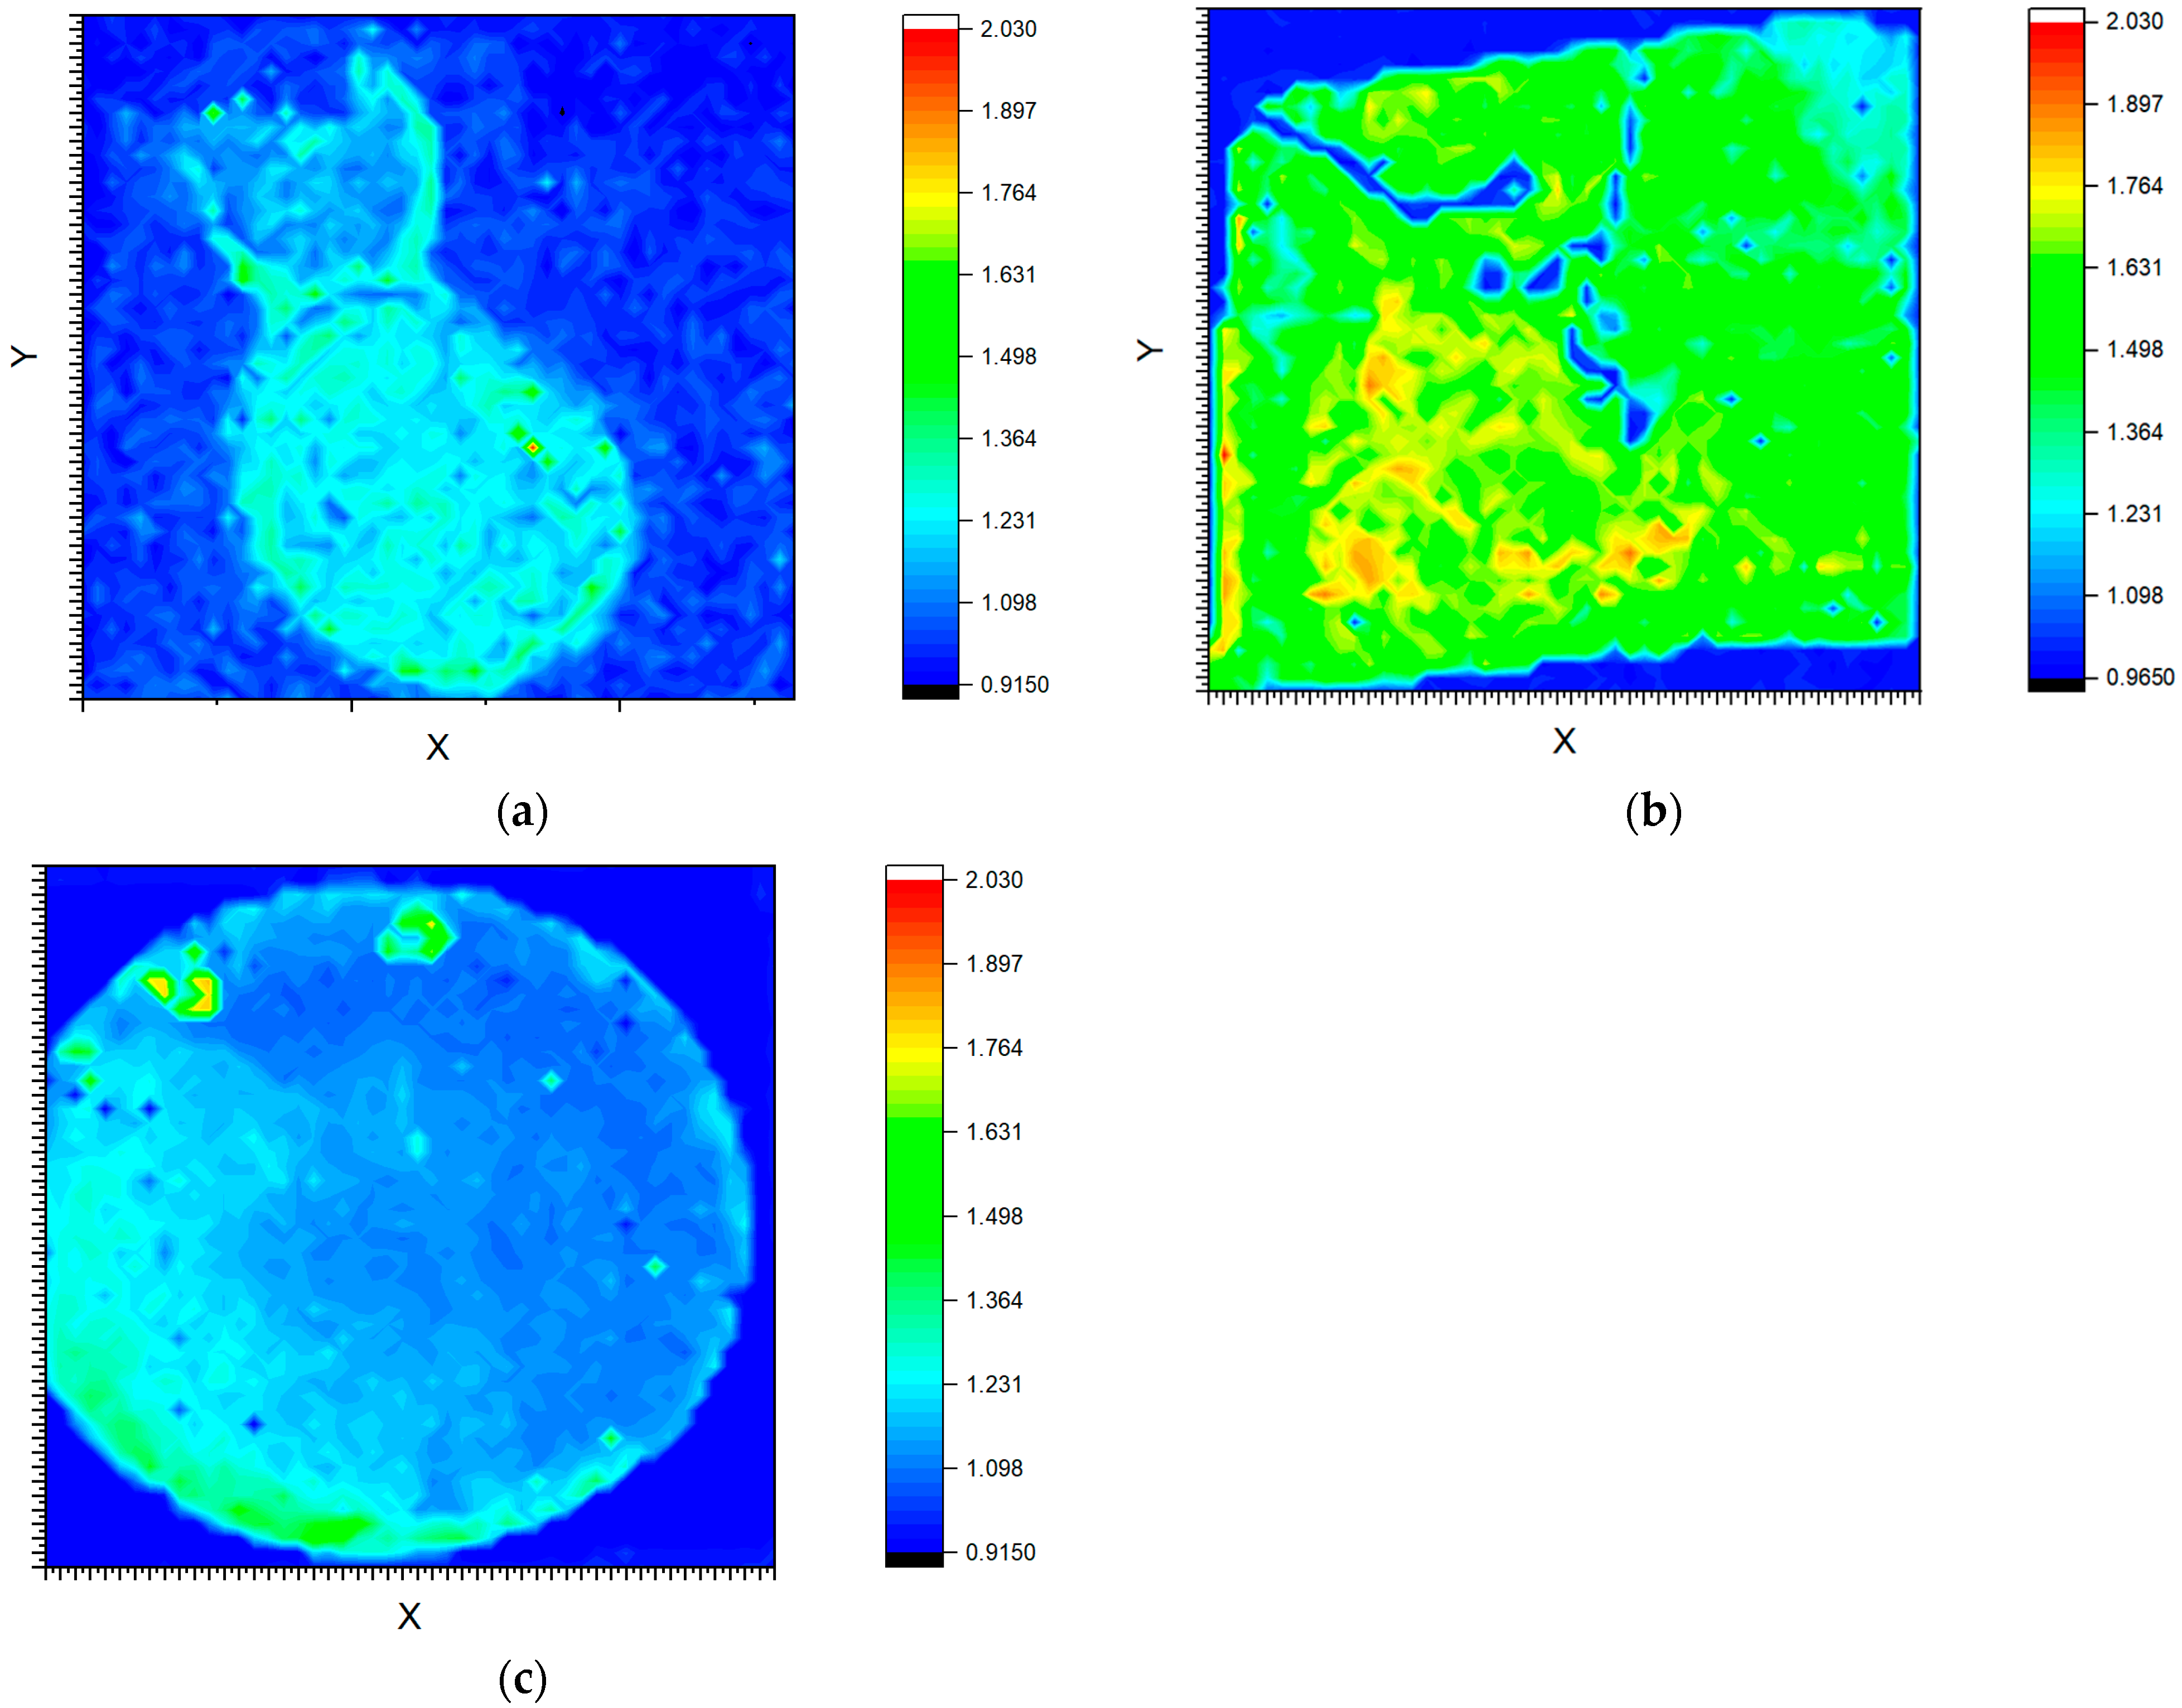
In Figure 5, surface enhancement maps are presented in which the intensity ratio of the 1649 cm−1 Raman maximum to the background intensity (taken as intensity at position 1680 cm−1) is calculated and plotted. Each map consists of ~2500 points, at which the Raman spectrum has been measured and the ratio calculated. These maps give an idea of the enhancement uniformity of the substrates, clearly showing the locations of hotspots as well as locations of weak enhancement. However, the enhancement distribution is also highly dependent on the way the analyte dries after being deposited on the surface, and this drying is an uncontrolled and somewhat random process. Nevertheless, it can be seen that substrate B is the one yielding the most homogeneous signal-to-background intensity ratio along its surface.

Figure 5.
Spectral intensity ratio maps of the 1649 cm−1 Raman peak of Rhodamine B at a concentration of 10−5 M on substrates (a) A; (b) B; and (c) C. The incident laser wavelength is 532 nm @ 0.452 mW, 1 s exposure.
3.3. FEM Modelling
Finite element method modelling in COMSOL was performed on representative models of substrates B and C, built from fragments of their SEM images (Figure 6). In order to assess the influence of irregularities in the nanostructure on the enhancement factor, a perfectly uniform configuration of nanospheres was also modelled. Here, the nanospheres had diameters and interparticular distances equal to the average particle size and interparticular distance of the modelled fragment of substrate C. The resulting electric field calculations were used to determine the ratio between the electric field around an unstructured substrate and a structured one (). This ratio for both models is mapped in Figure 7 and it clearly shows the formation of hotspots in locations where the nanostructures are in close proximity to one another.
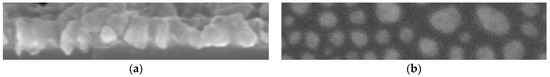
Figure 6.
The chosen input images for contour drawing in COMSOL: (a) substrate B; (b) substrate C.
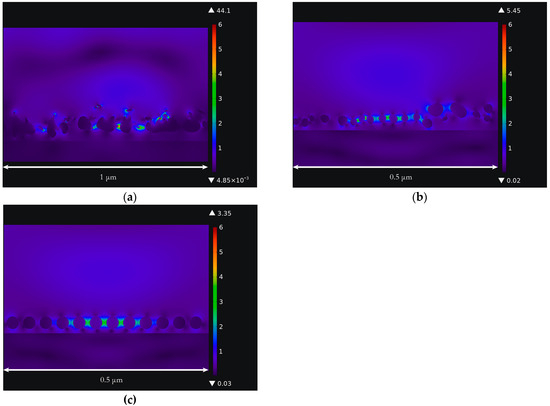
Figure 7.
Electric field enhancement maps at 530 nm excitation for three different FEM models representing the real substrates, as well as a uniform configuration of spheres: (a) substrate B; (b) substrate C; (c) uniform configuration.
Alongside electric field enhancement maps, the average and maximum electromagnetic enhancement of the Raman signal was calculated, using the well-established fourth power approximation with [4]:
The maximum EF was identified in the whole domain of calculation.
The maximum electromagnetic enhancement from the COMSOL modelling results was predicted to be around 106 for substrate B and 103 for substrate C, with the uniform configuration reaching only around 102 (Figure 8). The enhancement factor in the more chaotic and fractal-like substrate B was predicted to be higher, which seems to be supporting our hypothesis about small-scale detail improving the SERS performance of a substrate. Looking at the field enhancement maps, it is quite clearly visible that there are more hotspots in the geometry based on substrate B. That is despite the fact that substrate C features on average smaller interstructural distances—the random protrusions and imperfections in the nanostructure of substrate B allow for locations where the interstructural distances are tiny, leading to a large EF in them. This is especially clearly underlined by comparison to the uniform configuration where the large amount of small gaps between the nanospheres cannot outperform the enhancement obtained from the more chaotic real-like substrates where smaller gaps, though not as abundant, are enough to yield a higher Raman spectral enhancement.
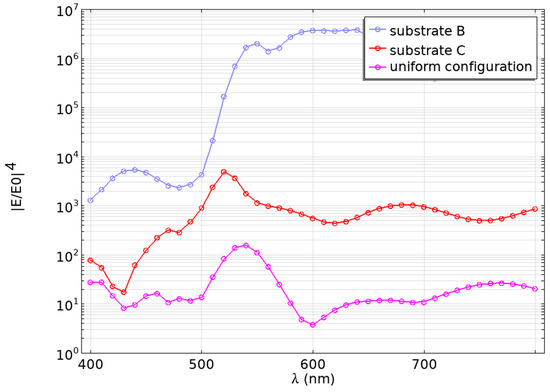
Figure 8.
Maximum EM enhancement dependency on incident wavelength for three different FEM models based on the real substrates (substrate B and substrate C), as well as a uniform configuration of spheres.
4. Discussion
The Raman enhancement is highest for substrate A and B, and the Raman spectral maxima of Rhodamine B can be identified down to concentrations of 10−12 M. The structure of these two substrates is largely more chaotic, and although the feature sizes are around 100 nm, the distances between them at multiple locations are less than that. Substrate C, on the other hand, features a highly periodic arrangement of feature sizes around 20 nm; however, the minimal interstructural distances between them appear to be on average larger than for substrates A and B, which leads to a lower enhancement. These two substrates also have a layered structure with considerable depth between the nanostructures. This also leads to an overall higher chance of the analyte molecule falling in-between them and experiencing a larger Raman enhancement. Substrate C is more or less single-layered. The surface maps show that substrate B is the most uniform one in terms of enhancement.
Our hypothesis seems to be substantiated, that is, a more bottom-up and controlled approach where the nanostructures are more periodic is great for obtaining small feature sizes; however, the artificial nature of such structures means that any kind of fractality and added detail needs to be manually engineered—something that takes more time and effort. In contrast, nanostructures which are more chaotic, often obtained from somewhat stochastic chemical processes, feature more complexity and small-scale detail without much added time and energy required. As such, it appears that substrates obtained by methods employing stochastic physical processes could yield a higher SERS enhancement factor. It must be mentioned, however, that a method such as electron-beam lithography could potentially allow for such small-scale structuring (with interstructural distances on the order of 10 nm) that would surpass the benefit of the more chaotic substrates. This direction could potentially be pursued in future research. This fact about chaotic arrangements generally leading to higher enhancement is also hinted at by FEM models. The substrate model featuring a larger variation in distances and containing more detail shows a larger enhancement than the substrate model containing more periodic arrangements.
All of the substrates presented in this work showed respectable performance and the large amount of work, presented both here and in many research papers in the past 50 years, repeatedly proves the powerfulness of the SERS method. There are, however, nuances regarding SERS, some of which are an impediment to its successful implementation in analysis, especially quantitative. The first, and most obvious one, is the fact that any molecule which happens to be adsorbed on the surface adds its own Raman spectrum, as well as possible fluorescence. The most common is the aforementioned amorphous carbon. Although conditions can be controlled in the lab to minimise the chance of this happening, real-world applications often involve highly impure samples. Possibly a combination of SERS and resonance Raman spectroscopy (SERRS) helps to more selectively enhance the analyte’s spectrum.
Secondly, the reusability of substrates is somewhat limited, since any deeper cleaning of the surface easily destroys the nanostructures themselves, reducing the enhancement efficiency of the active area. Thirdly, the use of the Raman peak intensity and the subsequent enhancement factor for quantitative analysis is quite prone to inducing measurement errors. This is because the SERS method is highly sensitive, which in turn means that it is also highly sensitive to any change in location of the analyte molecules in relation to the active surface and the incident laser spot. At sufficiently small concentrations, the SERS spectrum is largely created by a very small number of analyte molecules which happen to land in the hotspots of the active area; thus, the diffusion of the analyte molecules due to thermal effects, however small they may be, can make the spectrum behave in a highly unstable manner, changing in time and not allowing a trustworthy collection of data points. Consequently, a very large amount of measurements (as was the case for the surface maps presented in this paper) is required, in order to at least adequately gain confidence in the data describing the performance of the substrate, the concentration of the analyte, or any other relevant metric.
This investigation also highlights the issues associated with the definitions of the enhancement factor. As we have shown in the results, the intensity of enhanced Raman lines does not follow the analyte concentration in a linear manner, likely due to the non-linear nature of the adsorption of analyte molecules near the nanostructured active surface. Additionally, due to the fact that the analytical enhancement factor and theoretical enhancement factor are defined in conceptually different ways, a one-to-one comparison between the experiment and theoretical models is not possible using just this one metric. Moreover, the theoretically calculated enhancement factor does not take into account the contribution of some chemical enhancement, or resonance due to the fluorescence of Rhodamine B. The discrepancy between the experimental and theoretical enhancements could also be attributed to the fact that analyte molecules may adsorb better on the surface of substrate C compared to substrate B—something that the FEM model inherently cannot take into consideration.
Despite this, the enhancement factor obtained theoretically does hint to the reality of the substrate performance. These models also show the possibility of modelling not just idealised nanostructures and particle configurations but also more complex morphologies reflecting those of real substrates. Therefore, such modelling can help with getting an idea of the potential real-life enhancement strength of different nanostructured configurations.
5. Conclusions
Substrates A and B show larger Raman enhancement and a lower detectable analyte concentration of 10−12 M compared to substrate C.
The logarithm of the intensity of surface-enhanced Raman lines is proportional to the logarithm of the analyte concentration.
The distribution of the enhancement is not exactly correlated with the distribution of the nanostructures due to the inherently random way the analyte molecules are adsorbed and dry up on the surface.
FEM simulations show the chaotic structure based on substrate B yielding a larger enhancement than the more periodically ordered substrate C and the idealised configuration of uniformly distributed spheres. This is due to the increased likelihood of extremely small interstructural distances found in more chaotic structures.
The FEM model can give a rough description of the performance of real substrates but cannot fully describe them since it cannot include all factors contributing to the SERS effect. This especially includes the lack of analyte molecules, due to the model being a classical electromagnetic model.
Supplementary Materials
The following supporting information can be downloaded at: https://www.mdpi.com/article/10.3390/app14199040/s1, Figure S1: the COMSOL Multiphysics interface showing the model (geometry and physics) of a SERS substrate.
Author Contributions
Conceptualization, C.F.T., K.V. and A.S.; methodology, C.F.T., K.V., A.T. and A.S.; software, C.F.T.; validation, C.F.T., K.V. and T.K.; formal analysis, C.F.T. and K.V.; investigation, C.F.T., K.V., T.K. and A.T.; resources, A.S.; data curation, C.F.T.; writing—original draft preparation, C.F.T. and K.V.; writing—review and editing, C.F.T., K.V., A.S. and T.K.; visualization, C.F.T.; supervision, A.S.; project administration, A.S.; funding acquisition, A.S. All authors have read and agreed to the published version of the manuscript.
Funding
This research was funded by the Latvian Council of Science, project/grant VPP-EM-FOTONIKA-2022/1-0001. The APC was funded by project/grant VPP-EM-FOTONIKA-2022/1-0001.
Institutional Review Board Statement
Not applicable.
Informed Consent Statement
Not applicable.
Data Availability Statement
The raw data supporting the conclusions of this article as well as the additional details about the substrates will be made available by the authors on request.
Acknowledgments
We are grateful for the technical support granted to us by the Institute of Solid-State Physics, University of Latvia.
Conflicts of Interest
The authors declare no conflicts of interest.
References
- Kumar, S.D.; Manik, P.; Arnulf, M. Progress in Optical Science and Photonics: Modern Techniques of Spectroscopy: Basics, Instrumentation, and Applications; Springer Nature: Singapore, 2021; Volume 13. [Google Scholar]
- Le Ru, E.C.; Blackie, E.; Meyer, M.; Etchegoint, P.G. Surface enhanced raman scattering enhancement factors: A comprehensive study. J. Phys. Chem. C 2007, 111, 13794–13803. [Google Scholar] [CrossRef]
- Han, X.X.; Rodriguez, R.S.; Haynes, C.L.; Ozaki, Y.; Zhao, B. Surface-enhanced Raman spectroscopy. Nat. Rev. Methods Primers 2021, 1, 87. [Google Scholar] [CrossRef]
- Ding, S.Y.; You, E.M.; Tian, Z.Q.; Moskovits, M. Electromagnetic theories of surface-enhanced Raman spectroscopy. Chem. Soc. Rev. 2017, 46, 4042–4076. [Google Scholar] [CrossRef] [PubMed]
- Pérez-Jiménez, A.I.; Lyu, D.; Lu, Z.; Liu, G.; Ren, B. Surface-enhanced Raman spectroscopy: Benefits, trade-offs and future developments. Chem. Sci. 2020, 11, 4563–4577. [Google Scholar] [CrossRef] [PubMed]
- Israelsen, N.D.; Hanson, C.; Vargis, E. Nanoparticle properties and synthesis effects on surface-enhanced Raman scattering enhancement factor: An introduction. Sci. World J. 2015, 2015, 124582. [Google Scholar] [CrossRef] [PubMed]
- Krajczewski, J.; Dumiszewska, E.; Czolak, D.; Turczyniak Surdacka, S.; Kudelski, A. New, epitaxial approach to SERS platform preparation—InP nanowires coated by an Au layer as a new, highly active, and stable SERS platform. Appl. Surf. Sci. 2023, 607, 155096. [Google Scholar] [CrossRef]
- Zhu, J.; Liu, M.J.; Li, J.J.; Li, X.; Zhao, J.W. Multi-branched gold nanostars with fractal structure for SERS detection of the pesticide thiram. Spectrochim. Acta Part A Mol. Biomol. Spectrosc. 2018, 189, 586–593. [Google Scholar] [CrossRef] [PubMed]
- Bar, J.; de Barros, A.; de Camargo, D.H.; Pereira, M.P.; Merces, L.; Shimizu, F.M.; Sigoli, F.A.; Bufon, C.C.B.; Mazali, I.O. Silicon Microchannel-Driven Raman Scattering Enhancement to Improve Gold Nanorod Functions as a SERS Substrate toward Single-Molecule Detection. ACS Appl. Mater. Interfaces 2021, 13, 36482–36491. [Google Scholar] [CrossRef] [PubMed]
- Knorr, I.; Christou, K.; Meinertz, J.; Selle, A.; Ihlemann, J.; Marowsky, G. Prediction and Optimization of Surface-Enhanced Raman Scattering Geometries using COMSOL Multiphysics. In Proceedings of the COMSOL Conference, Hannover, Germany, 5 November 2008. [Google Scholar]
- Khoury, C.G.; Norton, S.J.; Vodinh, T. Plasmonics of 3-D nanoshell dimers using multipole expansion and finite element method. ACS Nano 2009, 3, 2776–2788. [Google Scholar] [CrossRef] [PubMed]
- Yan, B.X.; Zhu, Y.Y.; Wei, Y.; Pei, H. Study on surface enhanced Raman scattering of Au and Au@Al2O3 spherical dimers based on 3D finite element method. Sci. Rep. 2021, 11, 8391. [Google Scholar] [CrossRef] [PubMed]
- Wei, D.; Chen, S.; Liu, Q. Review of fluorescence suppression techniques in raman spectroscopy. Appl. Spectrosc. Rev. 2015, 50, 387–406. [Google Scholar] [CrossRef]
- Kumari, G.; Kandula, J.; Narayana, C. How Far Can We Probe by SERS? J. Phys. Chem. C 2015, 119, 20057–20064. [Google Scholar] [CrossRef]
- Yang, Y. SERS enhancement dependence on the diameter of Au nanoparticles. J. Phys. Conf. Ser. 2017, 844, 012030. [Google Scholar] [CrossRef]
- Risović, D.; Gebavi, H.; Ivanda, M. Influence of fractal and lacunar characteristic of a nanostructured substrate on SERS enhancement. Appl. Surf. Sci. 2021, 537, 147915. [Google Scholar] [CrossRef]
- Grigorenko, I. Fractal nanostructures with the Hilbert curve geometry as a SERS substrate. arXiv 2011, arXiv:1109.3817. [Google Scholar]
- Lo Faro, M.J.; D’Andrea, C.; Leonardi, A.A.; Morganti, D.; Irrera, A.; Fazio, B. Fractal Silver Dendrites as 3D SERS Platform for Highly Sensitive Detection of Biomolecules in Hydration Conditions. Nanomaterials 2019, 9, 1630. [Google Scholar] [CrossRef] [PubMed]
- Heck, C.; Kanehira, Y.; Kneipp, J.; Bald, I. Amorphous Carbon Generation as a Photocatalytic Reaction on DNA-Assembled Gold and Silver Nanostructures. Molecules 2019, 24, 2324. [Google Scholar] [CrossRef] [PubMed]


Disclaimer/Publisher’s Note: The statements, opinions and data contained in all publications are solely those of the individual author(s) and contributor(s) and not of MDPI and/or the editor(s). MDPI and/or the editor(s) disclaim responsibility for any injury to people or property resulting from any ideas, methods, instructions or products referred to in the content. |
© 2024 by the authors. Licensee MDPI, Basel, Switzerland. This article is an open access article distributed under the terms and conditions of the Creative Commons Attribution (CC BY) license (https://creativecommons.org/licenses/by/4.0/).