Abstract
Over the last decade, hardware-in-the-loop (HIL) simulation has been established as a safe, efficient, reliable, and flexible method for performing real-time simulation. Furthermore, in the automotive sector, the HIL system has been recommended in the ISO 26262 standard as a powerful platform for performing realistic simulation during system integration testing. As a result of performing HIL black-box tests, the results of executing test cases (TCs) are reported as pass/fail without determining the nature and root causes of the underlying failures. The conventional analysis process of the failed TCs relies on expert knowledge. The higher the number of failed TCs, the higher the cost of manual analysis in terms of time and effort. In light of the shortcomings of existing methodologies, this study presents a novel intelligent framework capable of analyzing failed TCs without the need for expert knowledge or code access. To this end, a convolutional auto-encoder-based deep-learning approach is proposed to extract representative features from the textual description of the failed TCs. Furthermore, k-means-based clustering is used to categorize the extracted features according to their respective failure classes. To illustrate the effectiveness and validate the performance of the proposed method, a virtual test drive with real-time HIL simulation is presented as a case study. The proposed model exhibits superior clustering performance compared to other standalone k-means algorithms, as demonstrated by the David Bouldin Index (DBI) and accuracy values of 0.5184 and 94.33%, respectively. Furthermore, the proposed model shows a significant advantage in terms of feature extraction and clustering performance compared to the current state-of-the-art fault-analysis method. The proposed approach not only supports the validation process and improves the safety and reliability of the systems but also reduces the costs of manual analysis in terms of time and effort.
1. Introduction
In the automotive domain, a high level of complexity was observed in the software-driven system architecture during the development of software systems [1]. In a modern vehicle, the number of embedded electronic control units (ECUs) can reach 120, interconnected by multiple system buses, resulting in software with millions of lines of code [2,3]. Accordingly, throughout the development process, it is of the utmost importance to adhere to the rigorous standards of safety and reliability, namely those set forth by the functional safety standard ISO 26262 [4,5]. In accordance with the V-model development approach, various validation platforms are employed to guarantee the quality of the developed system, specifically Model-in-the-Loop (MIL), Software-in-the-Loop (SIL), Processor-in-the-Loop (PIL), Hardware-in-the-Loop (HIL), and Vehicle-in-the-Loop (VIL) [6,7].
As stated in ISO 26262, HIL simulation is an explicitly recommended test environment for verification and validation [8]. The ability to provide a safe, flexible, and reliable platform for simulating complex systems under real-time conditions has made it a widely used tool in both academic and industrial contexts [9]. In contrast to utilizing real physical systems, the controlled system is modeled and executed within the HIL simulator and linked to the actual System Under Test (SUT) via the Controller Area Network (CAN) bus. In such a structure, the functional and non-functional testing process is conducted against the requirements as a black-box testing approach without access to the source code. Following the completion of the test evaluation, a test report is automatically generated, comprising the evaluation results (pass or fail) and a description of the failed test cases (TCs) [10].
Despite the ability to automatically execute the TCs in the HIL, the evaluation process itself is constrained to merely reporting the results as either pass or fail, without any insight into the underlying nature or cause of the occurred failures [11]. Furthermore, the inspection steps to infer the category for the failure occurrence are carried out manually based on expert knowledge [12]. In the case of complex systems, a high number of failed TCs may be observed, which may subsequently increase the cost of failure analysis in terms of time and effort [13]. Furthermore, some failures may not be identified by the tester, which adds another factor of complexity to the process of analyzing failed TCs within HIL testing. In light of these considerations, the necessity for computer-aided analysis of failed tests has emerged, with the objective of providing failure efficiently debugging information. The objective of automated failure analysis is to identify the failure classes of failed TCs. Consequently, the high costs and time demands associated with the manual failure analysis process can be reduced. Furthermore, the developed system’s corrective process can be effectively implemented when the developer is provided with debugging information about the investigated failure.
To address the shortcomings of a knowledge-based approach for failure analysis, a data-driven Machine Learning (ML) approach has been introduced. Instead of using expert knowledge, this approach involves extracting knowledge from historical data [14]. Consequently, in recent years, the advancement of ML-based models has been extensively investigated as a tool for the software development life cycle across various phases, including software requirements analysis, architecture design, implementation, quality assurance, and maintenance [15,16].
Clustering methods have been utilized to extract latent patterns within the data and categorize them into multiple clusters as an unsupervised learning approach [17]. In light of this capability, clustering approaches have been employed in software testing with the objective of reducing the time and effort required for analysis by grouping similar failed test runs. Some of the studies focus on parallel debugging [18,19], while others investigate the use of clustering for failed TCs [20]. Alternatively, some studies aim to detect the outcome of test runs (pass or fail) with the aim of creating an automated test oracle [21]. However, the studies conducted have required the accessibility of the source code in the white-box state, which is not present in HIL black-box testing, where the source code is not accessible. Furthermore, the efficacy of pure ML-based clustering techniques in terms of accuracy remains a subject for further investigation.
Accordingly, in this study, we proposed a novel Deep-Learning (DL)-based framework combining One-Dimensional Convolutional Neural Network (1dCNN)-based Auto-Encoder (AE) with k-means clustering for failure analysis of failed TCs of HIL tests as a clustering problem. The objective of the proposed framework is to determine the failure category of failed TCs based on text log data. To demonstrate the effectiveness of the proposed framework, experimental data from a real-time virtual test drive platform comprising a HIL simulator and a real ECU are employed. To the best of our knowledge, our study is the first to investigate the feasibility of using DL methods for a short text clustering problem to support failure analysis during real-time HIL testing.
The main contributions of the proposed study can be summarized as follows:
- A novel failure analysis framework has been proposed for identifying the failure classes of the failed TCs without expert knowledge and code access;
- To improve the clustering process, a novel feature extraction model based on deep convolutional auto-encoder has been developed;
- The effect of various AE structures on the clustering performance in terms of accuracy and David Bouldin Index (DBI) has been investigated;
- The effect of the hyperparameters tuning of the developed DL models on the clustering performance has been investigated and discussed;
- Finally, to demonstrate the applicability of the developed model, a high-fidelity entire vehicle model is used with a virtual test drive platform, including a real-time simulator and ECU.
The remainder of the paper is organized as follows. Section 2 provides an overview of related work, highlighting the main differences between the proposed study and previous research. Subsequently, Section 3 delineates the architectural framework of the proposed approach. Section 4 presents a case study to validate the proposed framework, including the setup and implementation steps. Section 5 discusses the evaluation of the proposed model’s results. Finally, Section 6 outlines the conclusions and future directions for research.
2. Related Work
Over the past decade, researchers have increasingly focused their attention on software failure analysis across the entire project life cycle [22]. A number of methodologies have been put forth to address the issue of identifying the underlying causes and the nature of failed tests. Proposed studies illustrate a variety of techniques for applying ML to identify the failure classes of failed TCs. This section presents a concise overview of recent research in the field of failure analysis during software system testing across a range of applications. Furthermore, we examine the principal limitations and contributions of the existing literature, elucidating the distinctions between our proposed study and other related works.
ML-based clustering of test execution results shows remarkable achievements have been performed based on textual or time series datasets. To illustrate, Zhang et al. in [23] have employed word-textual data, specifically code comments that offer valuable insights into failures, to develop an approach with an implemented tool called FailureDoc. The objective of this approach is to explain failed tests, therefore offering valuable aid to developers engaged in troubleshooting and fault diagnosis. Although the conducted study demonstrated strong scalability, the process can only be derived with code comment access, which limits its applicability in black-box testing.
In a similar context but pertaining to black-box testing, an automated text clustering approach was put forth in [24] with the aim of identifying the underlying causes of test failure. To this end, ML techniques, specifically Density-Based Spatial Clustering of Applications with Noise (DBSCAN) for detection and Naive-Bayes/ Support vector machine (SVM) for classification, are employed based on the test failure messages. To train the model, three real-world datasets were employed, comprising 115, 143, and 63 failed TCs, respectively. The results demonstrate the superiority of the proposed method in terms of performance compared to several baselines. The primary limitation of the conducted study is that the training process relies on labeled datasets, which presents a significant challenge in real-world applications within the automotive industry. In contrast, our proposed method employs an unsupervised DL approach to construct a failure analysis model using unlabeled data.
To address the issue of the unavailability of ground truth categories in the training data, Kahles et al. in [25] employed the information obtained through interviews with test engineers to extract meaningful features from the log data. Based on the collected expert knowledge, two ML algorithms were explored as classification and clustering problems with the objective of identifying the causes of failed tests in agile software testing environments. In particular, the authors employed a combination of AE and k-means clustering, as well as Gaussian Mixture Models (GMMs) for clustering, while Artificial Neural Network (ANN) was utilized for classification purposes. The findings indicate that the classification model is applicable to the task of failure analysis task, with an accuracy of 0.880%. However, further investigation into other DL-based methods for enhancing the performance in terms of failed TC clustering is still necessary. A further distinction pertains to the level at which the tests are targeted. In the aforementioned study, the time constraints of testing were not taken into account, as the focus was on the log data of non-real-time tests. In contrast, the target test level in our study is real-time system-level HIL testing.
In recent times, significant strides have been made in the automotive sector towards the utilization of real-time HIL simulation for the verification and validation of control strategies [26,27,28]. Concurrently, a number of studies have been proposed with the objective of automating the inspection process for HIL test results, eliminating the need for human intervention [29]. For example, the use of a clustering approach to group failed TCs in HIL tests according to the underlying faults was proposed in [30]. In the mentioned study, the utilization of non-code-based data sources has demonstrated that the proposed techniques possess the capacity to reduce the required analysis time by 60% in comparison to traditional inspection methods. Furthermore, the adapted approach was evaluated on a real industrial dataset comprising 8743 failed tests and 1531 faults. It should be noted, however, that the study is limited in scope to a specific application class, with the objective of organizing the debugging process without identifying the failure category of the failed TCs. However, a clustering approach has developed in our study, enabling the failure classes based on log data of embedded cyber-physical system applications, i.e., automotive systems, without the need for domain-specific knowledge.
Similarly, in the context of fault localization during automotive software testing in an HIL environment, Choi et al. [31] presented a method to identify the root cause of faults in HIL tests. The work is centered on the idea of comparing the normal unit test to a failed integration test using memory-update information. While black-box testing without source code offers certain advantages, it is essential to devote considerable attention to the pre- and post-processing steps that are necessary for its implementation. This presents a significant challenge in the context of large-scale industrial projects. In contrast, our proposed method requires a historical dataset to extract knowledge for subsequent inference processes.
As an alternative, the recorded multivariate system-level time series can be employed in lieu of the textual information provided by the generated test report as a representation of the system behavior for the purpose of fault clustering in the HIL records [32]. For example, in [33], records of HIL test execution were employed to construct an ML-based model with the capacity to identify the underlying faults of failed TCs. In this study, a time series clustering method based on the k-means algorithm was developed to group the failed runs according to their causes based on the similarity of the recorded behaviors. Consequently, the required analysis time in system-level black-box testing can be diminished by up to 80% in a domain-independent manner. Nevertheless, the accuracy attained by pure ML techniques on a dataset comprising 57 test runs is 75.85%, therefore paving the way for further investigation.
In contrast, our proposed study aims to enhance the clustering process and achieve high accuracy through the introduction of an advanced automatic feature extraction method based on a DL approach. In contrast to sequential data, the descriptions of failed TCs employed in our approach serve as the basis for training the model and are less complex in terms of analysis and preprocessing. Similarly, in the context of automated test evaluations of embedded systems, Scharoba et al. in [34] conducted a comparative study to investigate the feasibility of using ML methods to detect abnormal test runs based on the records of previous tests. In accordance with the tenets of ML-based anomaly detection, the records of preceding tests are employed in a manner that enables the identification of test runs that deviate from normal behavior. Therefore, by concentrating on the anomalous TC, the expense of superfluous manual inspections can be diminished. The case study of a drive controller illustrates the efficacy of the proposed proximity-based anomaly detection techniques in diverse configurations. Nevertheless, in our study, we concentrate on investigating diverse nonlinear feature extraction-based DL techniques utilizing various AE variants rather than relying on expert knowledge.
In conclusion, it can be observed that most existing studies on the analysis of failed TCs in HIL tests still require further development in several key areas, including accuracy, generalizability, and efficiency. In light of the aforementioned shortcomings, the proposed work introduces a novel approach that leverages the advantages of the unsupervised DL method with clustering techniques to efficiently perform a failure analysis process of the failed TCs in HIL tests based on text data.
3. Methodology
3.1. The Proposed Method
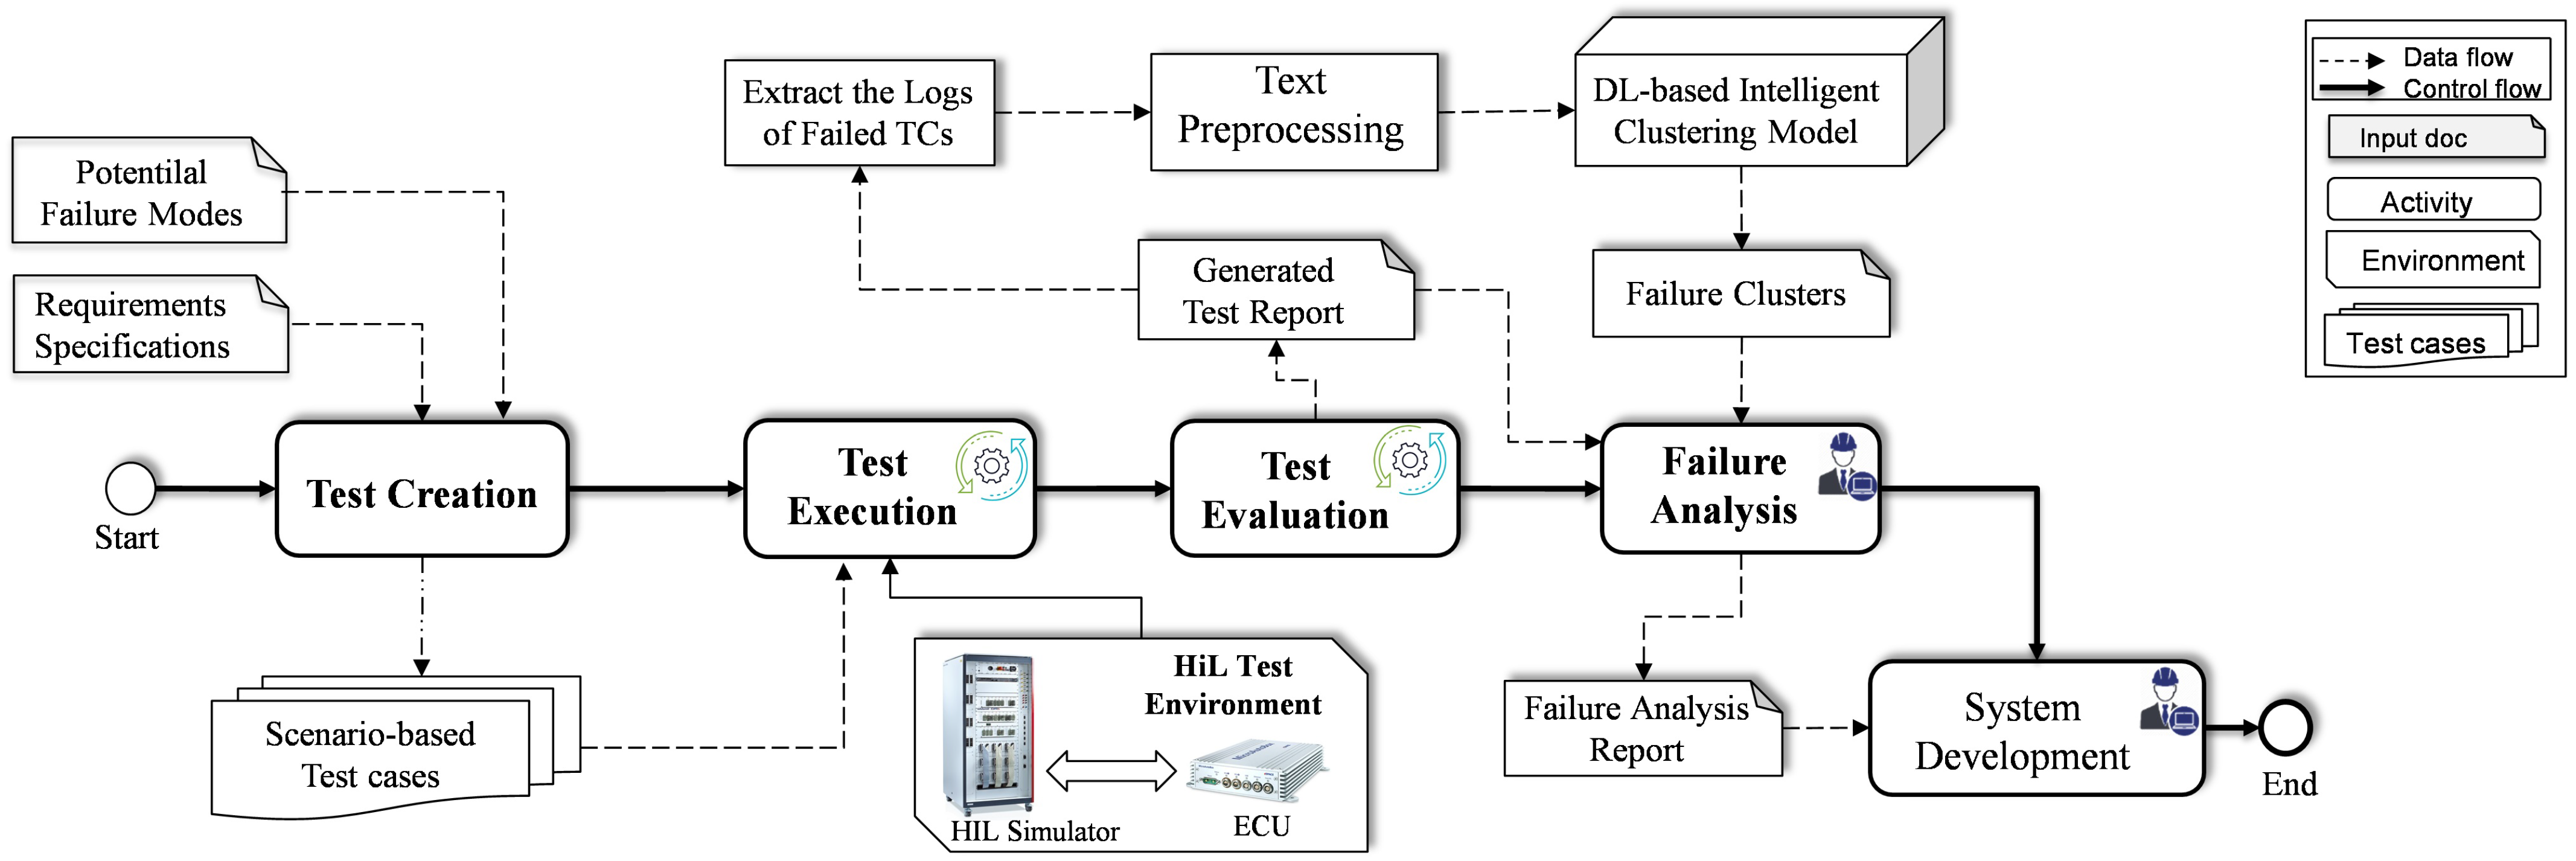
In this section, the proposed failure analysis approach is presented, highlighting the integration of the proposed DL-based clustering model into the HIL-based testing process at the system level. The framework, as can be seen in Figure 1, is divided into four distinct phases constituting the process of failure analysis for HIL testing, namely test development, test creation, test execution, and failure analysis.

Figure 1.
Proposed framework for failed test cases analysis during real-time HIL tests.
In the system development phase, the software behavioral model is designed in accordance with the requirements via a convenient development environment, e.g., MATLAB/Simulink [35]. However, since new features are added to the system during the life cycle, the model architecture is then upgraded by the developer. Once the model is updated, the testing phase is initiated to start the process of unit and integration testing of the SUT. Such type of testing is carried out in the form of black-box testing using real-time HIL simulation, without access to the source code. To be specific, the developed model is validated in real time against the requirements in three phases, i.e., test generation, test execution, and test evaluation.
The testing workflow starts with the test generation phase, in which the TCs are generated from the functional requirements specification. Furthermore, the potential failure modes stated in the classification report are considered to be covered by the generated TCs. To this end, various techniques according to ISO 26262 are adopted to generate the required TCs. As a result of this phase, the TC specifications and the traceability matrix between the requirements, potential failure, and TCs are created. In the second phase, i.e., test execution, all generated TCs are automatically executed in the HIL test environment, which contains the test data, the environmental conditions, and the prerequisites of the expected results. The execution results of the TCs are then forwarded to the third phase, i.e., test evaluation.
The assessment phase finally compares the real measured behavior with the anticipated theoretical behavior. Therefore, the output values of the executed TCs are compared with the expected values. As a result, a test report is automatically generated containing the evaluation results, i.e., pass/fail. Following this approach, several regression tests are performed before the final release, resulting in a large amount of log data of failed TCs. Inspection of the test-run results is then conducted by test engineers, who focus on the failed TCs to determine the root cause and the category of the failure. Generally, a software debugging tool can be used by the tester for failure analysis of the failed TCs. However, the existing tools require access to the source code and need to be monitored at each step, which is not possible in HIL testing. Therefore, in HIL testing, expert knowledge is employed for manual failure analysis of failed TCs, which in turn increases the effort and cost for complex systems. Motivated by this, in this study, an intelligent model is developed and integrated into the testing process so that the failure analysis of failed TCs can be automatically conducted. To this end, various techniques for text preprocessing, feature extraction, and clustering have been employed. More specifically, the descriptions of the failed TCs are automatically extracted from the generated test report and fed to the preprocessing phase. Then, once the short text data are preprocessed, the nonlinear features are automatically extracted using the DL method, i.e., 1dCNN-based AE. Subsequently, the extracted features are fed into the clustering phase, where the clusters of the corresponding failure analysis are determined. Finally, the determined clusters of failed TCs are reviewed by the test engineers in the failure analysis phase to confirm the reason behind the occurring failures. The corresponding information about the failure analysis is sent as feedback to the developer to fix the error and update the model accordingly.
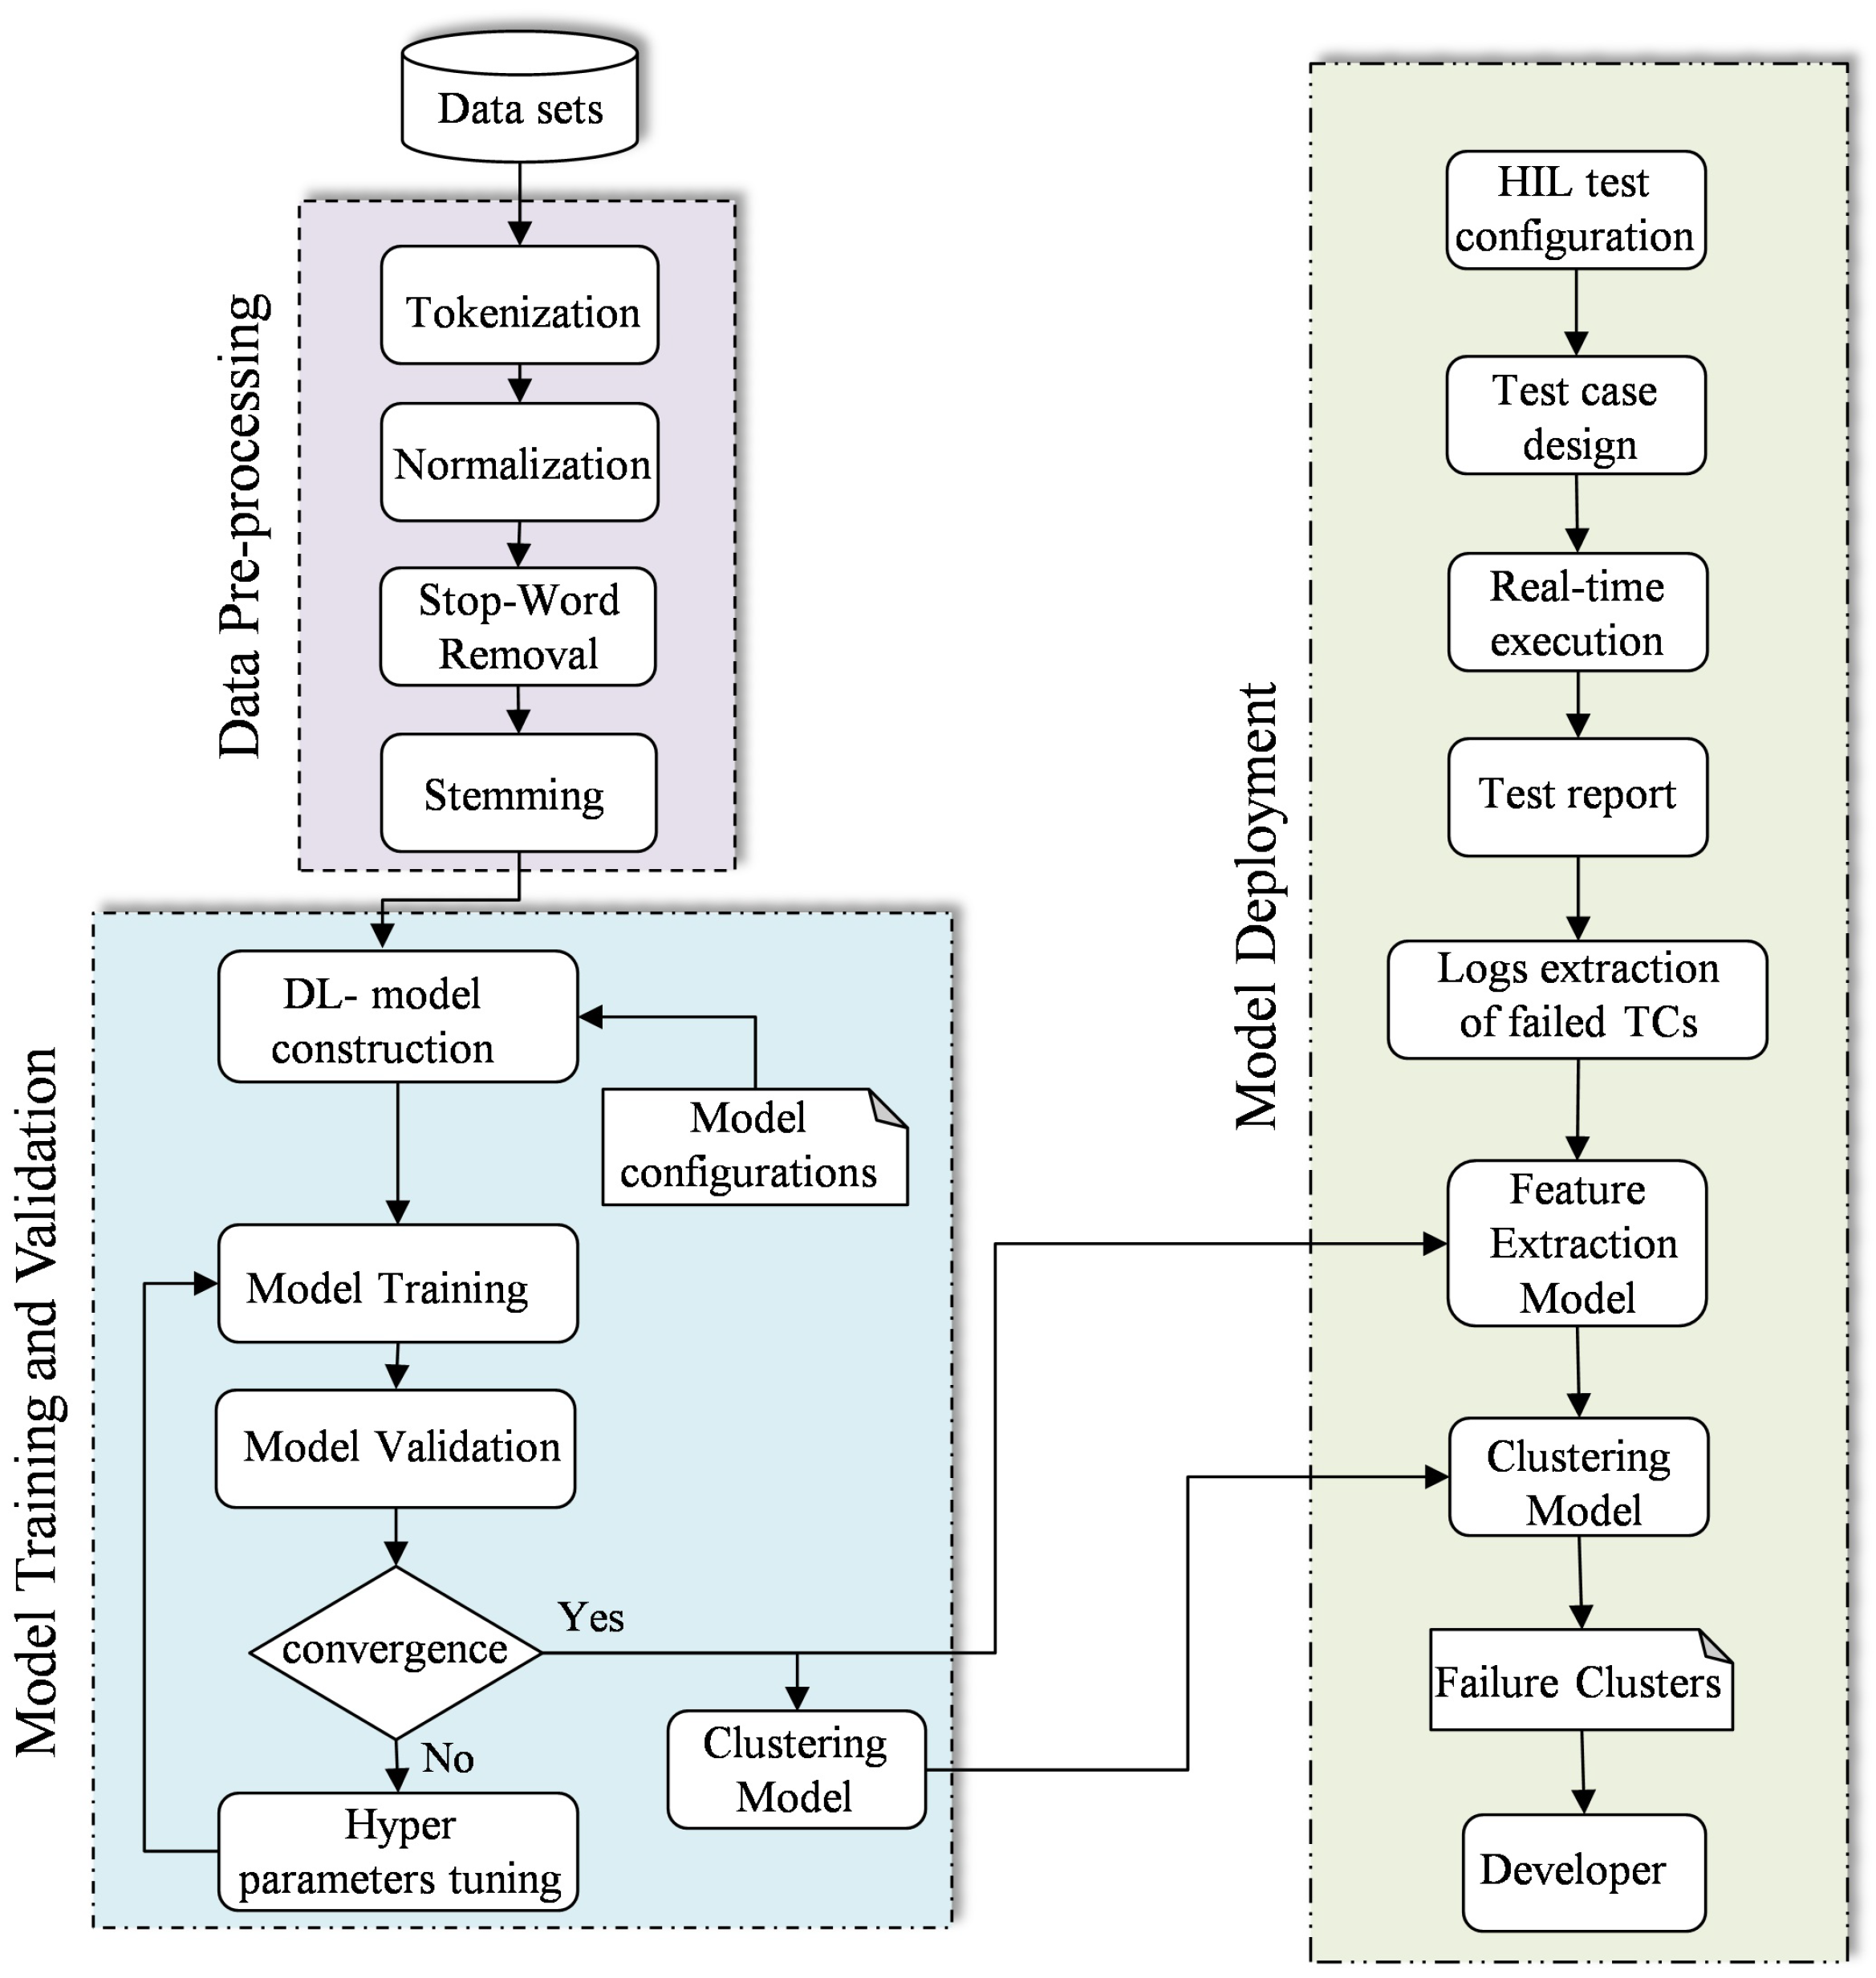
The development of the failure clustering model is accomplished by several steps in three phases, i.e., preprocessing, training and validation, and deployment, as shown in the flowchart in Figure 2.
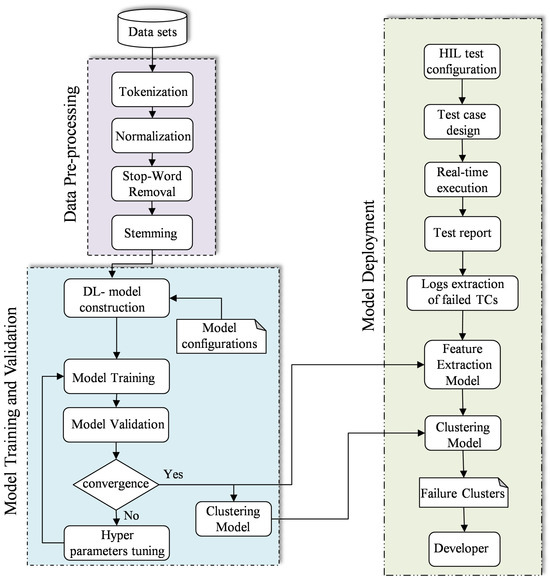
Figure 2.
The flowchart of DL-based failure clustering model development.
3.2. Data Preprocessing
Prior to the development of the target model, a series of processes are applied to the historical dataset with the objective of producing an efficient model with high performance. This phase is referred to as preprocessing and is comprised of four distinct steps: tokenization, normalization, stop word removal, and stemming [36].
The significance of the aforementioned process lies in the fact that the original text data are characterized by noise, lack of structure, and the presence of superfluous features, including characters, words, symbols, and digits. Consequently, the utilization of the data in its original form for the construction of the model, without preliminary processing, may have a negative impact on the training process. The initial step in the preprocessing phase is tokenization, which is employed to transform the text data into a format that can be analyzed by DL methods. In this phase, the text data are divided into significant units, such as words, terms, and symbols, to create so-called tokens, which are then constructed from the original natural language text. The transformed data can be devoid of superfluous features and noise through the implementation of a normalization process on the target data.
In addition to data cleaning through tokenization and normalization, the removal of stop words represents an effective step to improve the quality of the dataset. For example, the presence of “this”, “is”, “a”, and “an” can have a negative impact on the training process, occupying space and increasing the time required to ascertain the intended meaning. The removal of stop words from short texts can play a pivotal role in enhancing model performance and reducing computational time. By doing so, the intended meaning and useful information can be directly identified.
The final step in this phase is stemming, which involves applying the prepossessing technique to obtain the root word. The utilization of this technique provides the benefit of concentrating on a particular lexicon rather than employing all possible prefixes and suffixes. In the final step, the preprocessed data are organized and divided into three distinct categories: training, validation, and testing.
3.3. Model Training and Validation
Following the cleansing and splitting of the dataset, the training data are employed to train the target model during the training phase. In addition, the validation data are employed to assess the trained model and adjust the hyperparameters as necessary. As the efficacy of the ML/DL model is contingent upon the quality of the extracted features, two models are developed in this study: one for nonlinear feature extraction and another for clustering. AE was selected among the various architectures of DL methods due to its superiority in the selection and extraction of nonlinear features and reduction of data dimensionality [37]. Recently, various variants have been proposed to address disparate issues in a multitude of applications and domains [38]. To achieve this objective, a variety of Auto-Encoder (AE) variants are utilized, including Convolutional Neural Network (CNN)-based AE, Long Short-Term Memory (LSTM)-based AE, and standard AE. To illustrate the superiority of the proposed model, a comparison was conducted between the developed model and the other AE structure-based models.
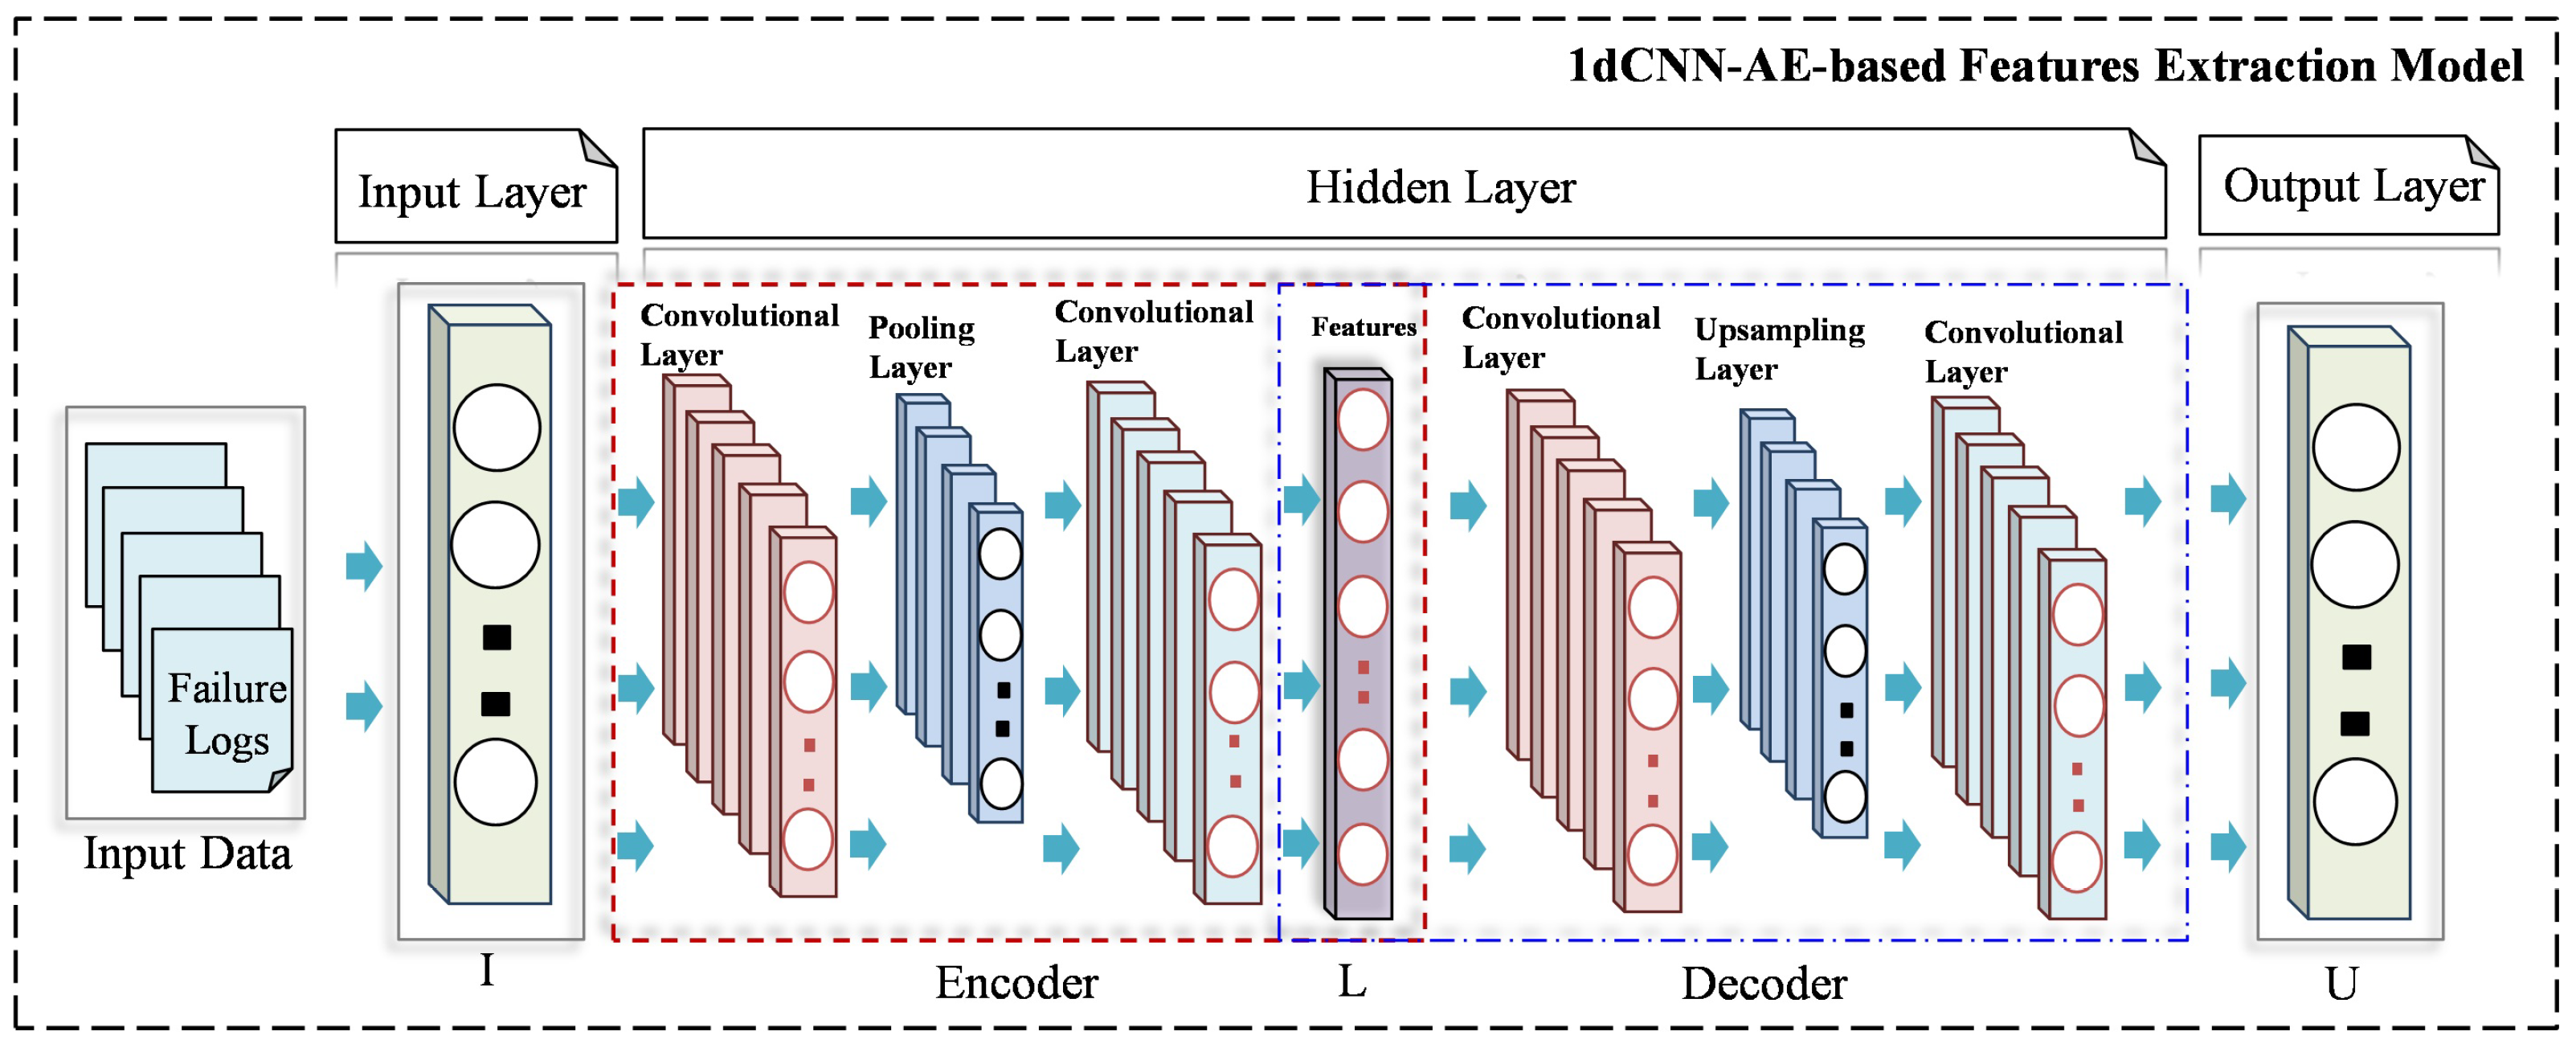
In general, AE can be divided into two main components, i.e., the encoder and the decoder [39]. The primary objective of the encoder is to transform the high-dimensional input data into a low-dimensional representation, commonly referred to as the latent code. Conversely, the decoder is tasked with converting the extracted features into the original input, effectively mapping the latent code as output back into the original data space, as seen in Figure 3. Equations (1) and (2) illustrate the encoder and decoder components of the CNN-based AE model, respectively.
where and represent the activation function of the encoder and decoder, respectively. I is the input data, L is the latent feature, U is the output data. W and are the encoder and decoder’s weight, respectively. Finally, b and represent the offset vector of the encoder and decoder, respectively.
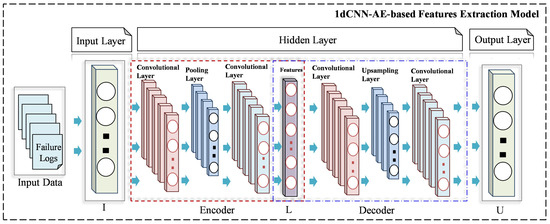
Figure 3.
Architecture of the proposed DL-based features extraction model.
Table 1 illustrates the architecture parameters of the developed 1dCNN-based AE model. Once the model architecture has been designed, the training process is initiated. Concurrently, each training set is validated against the corresponding validation data, allowing for the tuning and optimization of the hyperparameters associated with the model architecture. The objective of this phase is to identify the optimal hyperparameters that will result in the highest performance, as indicated by low loss and high accuracy.

Table 1.
The architecture parameters of the proposed model.
Once the feature extraction model is trained and optimized, a cluster model is developed based on the k-mean clustering algorithm. The core idea of the algorithm is to group the extracted features of the text data into different clusters according to their similarities [40]. The k-mean algorithm has been widely used in the last decade and has achieved great success in unsupervised learning [41]. Therefore, in this study, unlabeled features are used to train the cluster model, and the number of clusters was determined based on the number of failure classes, i.e., k = 4.
3.4. Model Deployment
The final stage following the training and validation phases is the deployment of the models. Consequently, the trained models, specifically the feature extraction model and the cluster model, are verified and deployed using real-time simulation data from the HIL system. To this end, a real-time virtual test drive is employed, which incorporates a real ECU and a real-time HIL simulator, in addition to external drive components, such as wheels and pedals. Once the parameters of the target model and the configuration of the test setup have been established, the test scenario is designed to validate the target requirements. Upon completion of the real-time test execution, a report is generated, delineating both passed and failed TCs. To obviate the necessity for manual analysis of the report, an automatic extraction of the failed TCs description has been implemented. Consequently, the generated report can be directly fed into the trained model, therefore focusing solely on the target text. Subsequently, the input data undergoes a process of preprocessing, after which it is fed into the 1dCNN-based AE model for the purpose of extracting the corresponding features. The extracted features are classified into four distinct clusters, each of which corresponds to a specific failure class, i.e., sensor, hardware, software, and communication failure. Ultimately, the meaningful information, including the failed TCs with their failure class, is sent to the developer for potential corrective action so that the required functionality is ensured according to the requirements.
3.5. HIL Test Report: Experiment Sample
The HIL test report is automatically generated as a consequence of the execution of TCs during real-time simulation.
To validate the proposed approach and generate the aforementioned test report, which includes failed TCs, the real-time fault injection framework developed in the previous study [42] is employed. The framework’s primary function is to inject faults into target components, e.g., sensor signals, via the CAN bus without necessitating changes to the system architecture. Furthermore, the aforementioned framework enables the comprehensive coverage of a diverse range of sensor and actuator fault types. Further details about the employed fault injection attributes and parameters can be found in the referenced study.
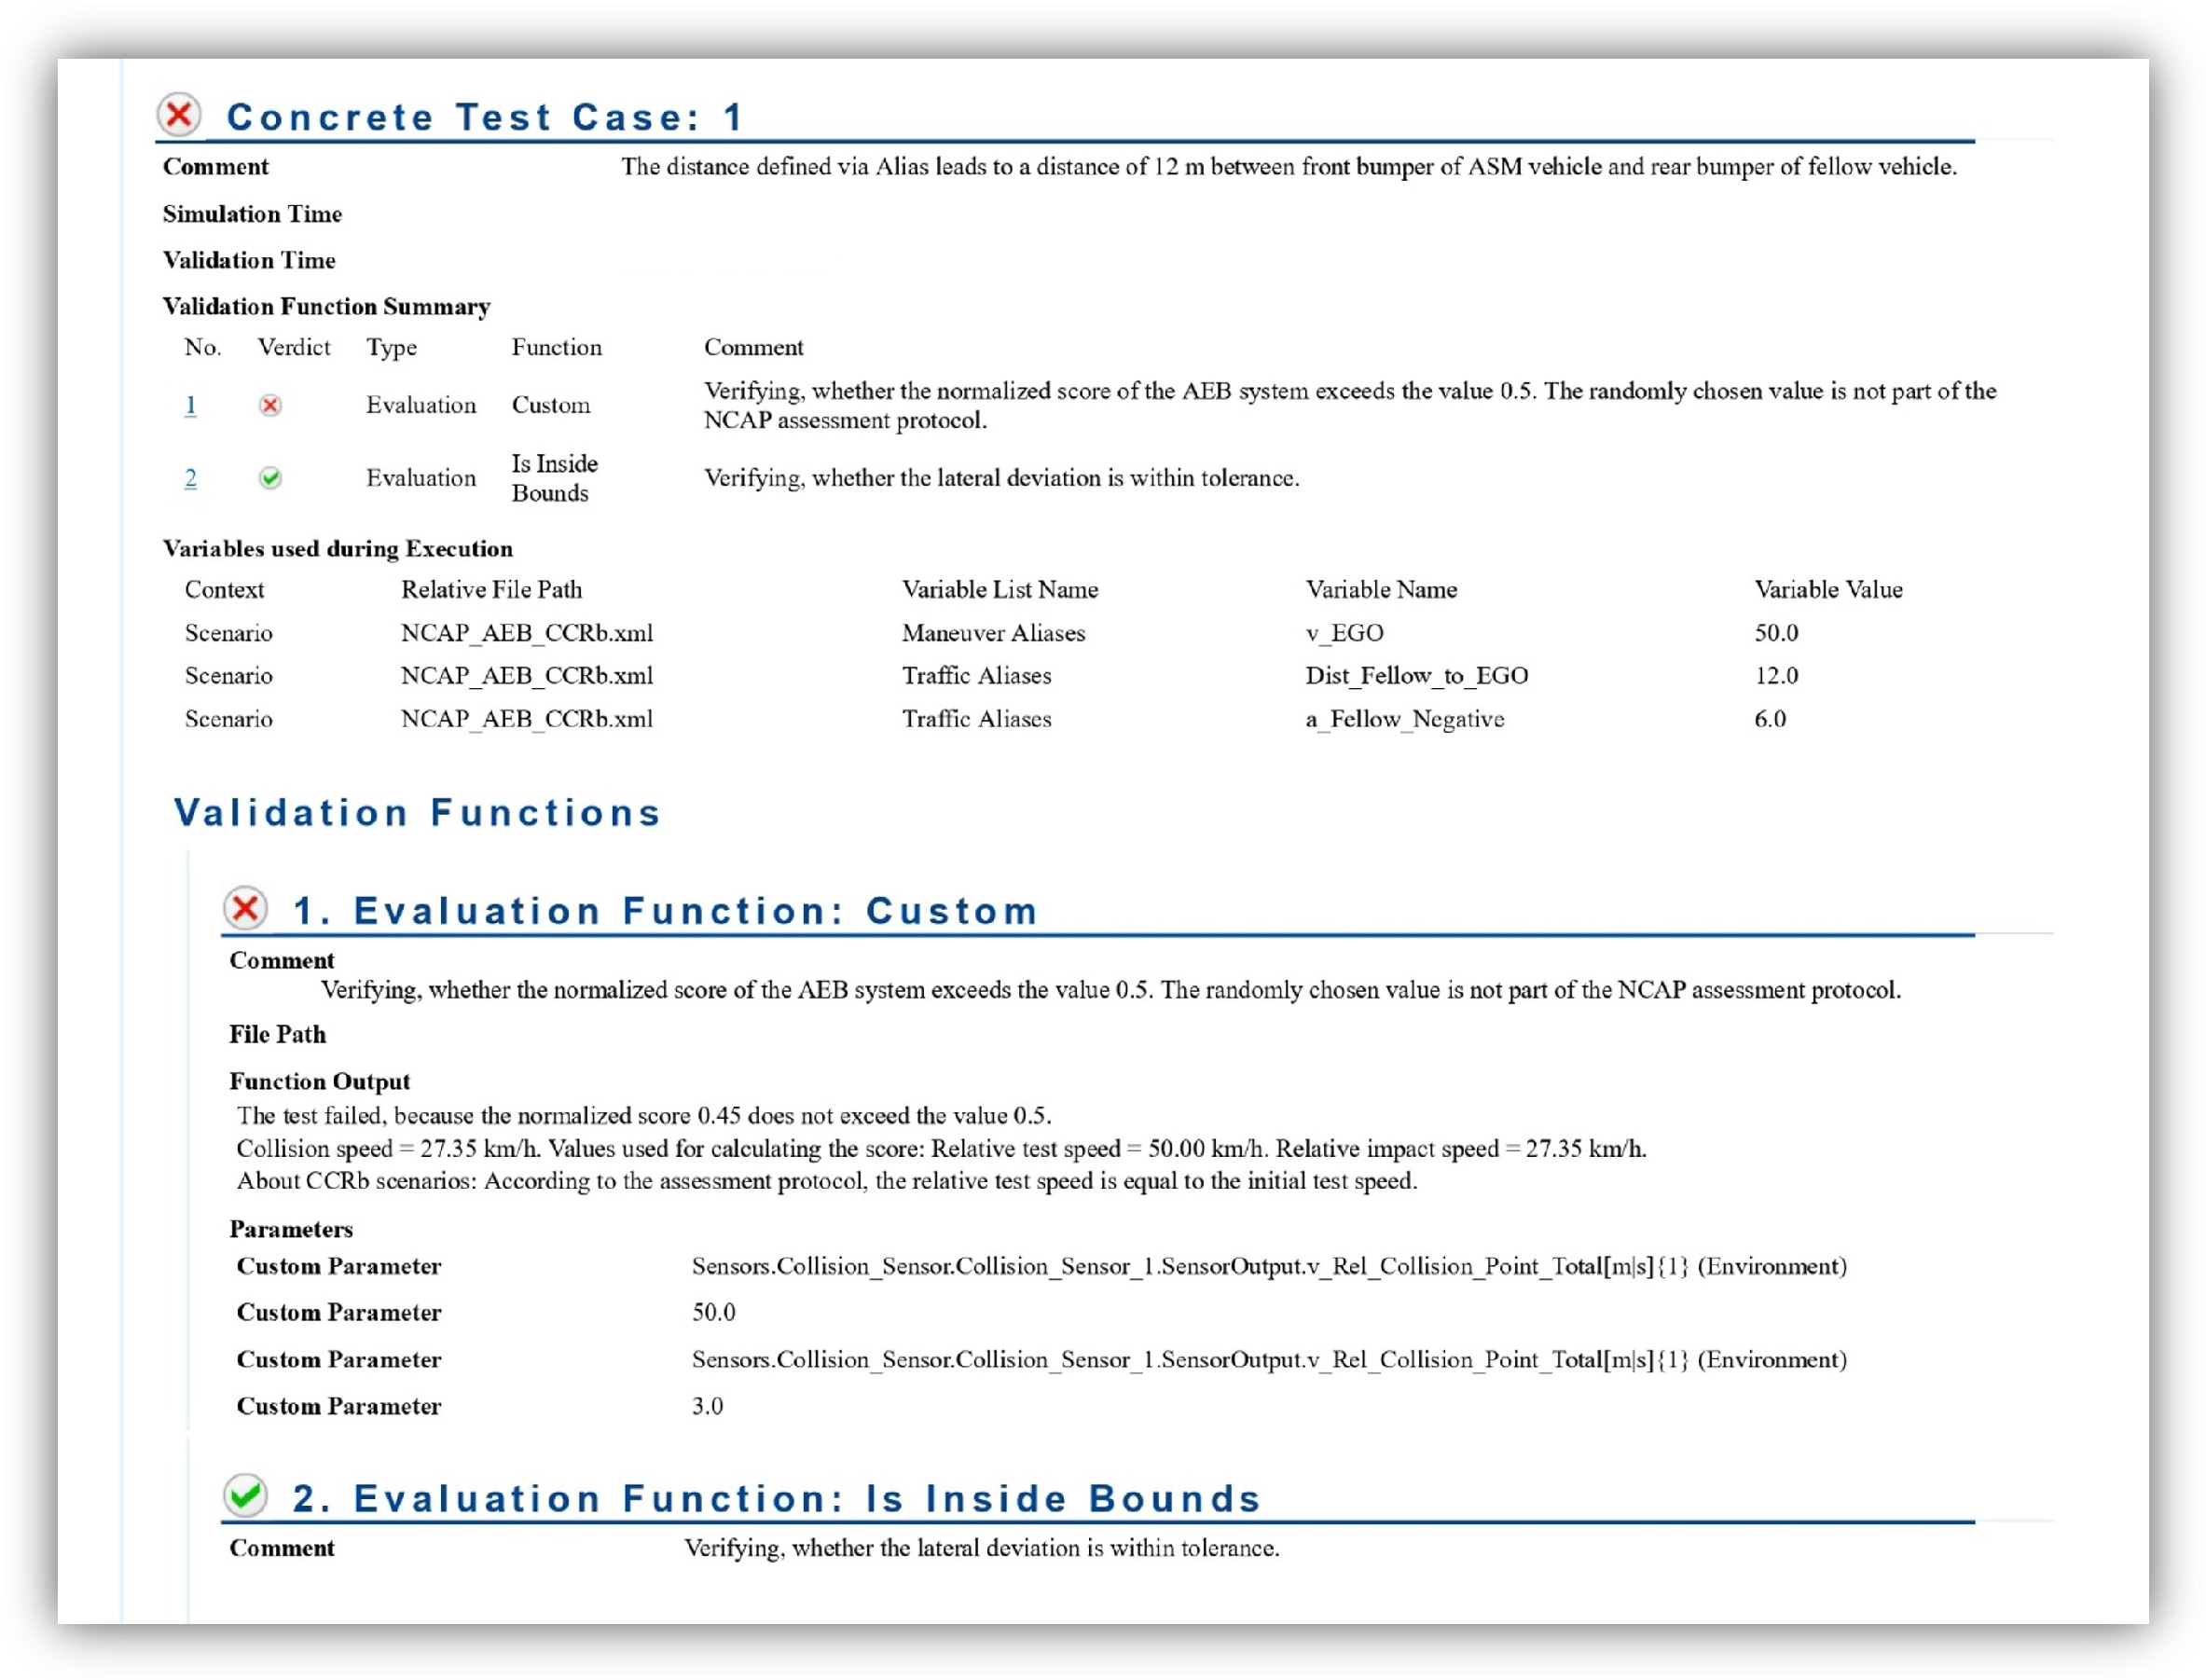
As illustrated in Figure 4, the test report comprises superfluous information in addition to the logs of test execution. Therefore, the target logs, i.e., the comments of the evaluation function, were extracted through preprocessing steps subsequent to their conversion to JSON format. In this case, the comment “Verifying, whether the normalized score of the AEB system exceeds the value 0.5. The randomly chosen value is not part of the NCAP assessment protocol” is extracted. The text features of the mentioned comment are extracted via the 1dCNN-AE. Then, the extracted textual features are grouped according to the corresponding clusters using the k-means algorithm. Consequently, the aforementioned failed TCs, as documented in the report, have been grouped according to cluster 1, i.e., sensor failure. Thus, the proposed approach enables the automatic clustering of failed TCs into their corresponding failure classes, therefore reducing the time and effort required by the manual method.
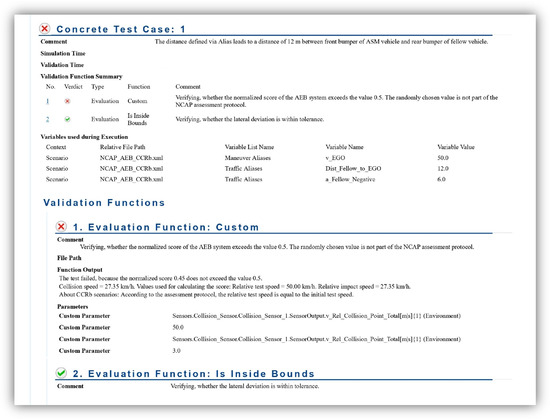
Figure 4.
Generated report of HIL test-case executions, including the logs.
4. Case Study and Experimental Implementation
This section outlines the implementation phases of the proposed framework, including a description of the dataset and the training process. Furthermore, the system architecture of the case study and the experimental configuration are presented in detail.
4.1. HIL System and Experimental Setup
In this study, a real-time simulation HIL system from dSPACE is employed as a validation platform for the developed failure analysis model. The system is comprised of two distinct levels: a software layer and a hardware layer. At the software level, the Automotive Simulation Model (ASM) vehicle dynamics model [43], developed in MATLAB/Simulink with high fidelity, is considered. In particular, the electric system, gasoline engine, powertrain, driver, and environmental system are modeled and simulated in conjunction with the vehicle dynamics system. This approach allows for the comprehensive capture of the system’s behavioral characteristics. The model-based development approach allows for the automatic generation of code from the aforementioned model, which can then be deployed directly in HIL at the hardware level. In addition, the ECU system of the gasoline engine has been modeled as a separate entity on the same simulation platform. The interface connection between the entire vehicle system and the ECU is established using the CAN bus protocol, specifically the real-time interface CAN Multimessage Blockset.
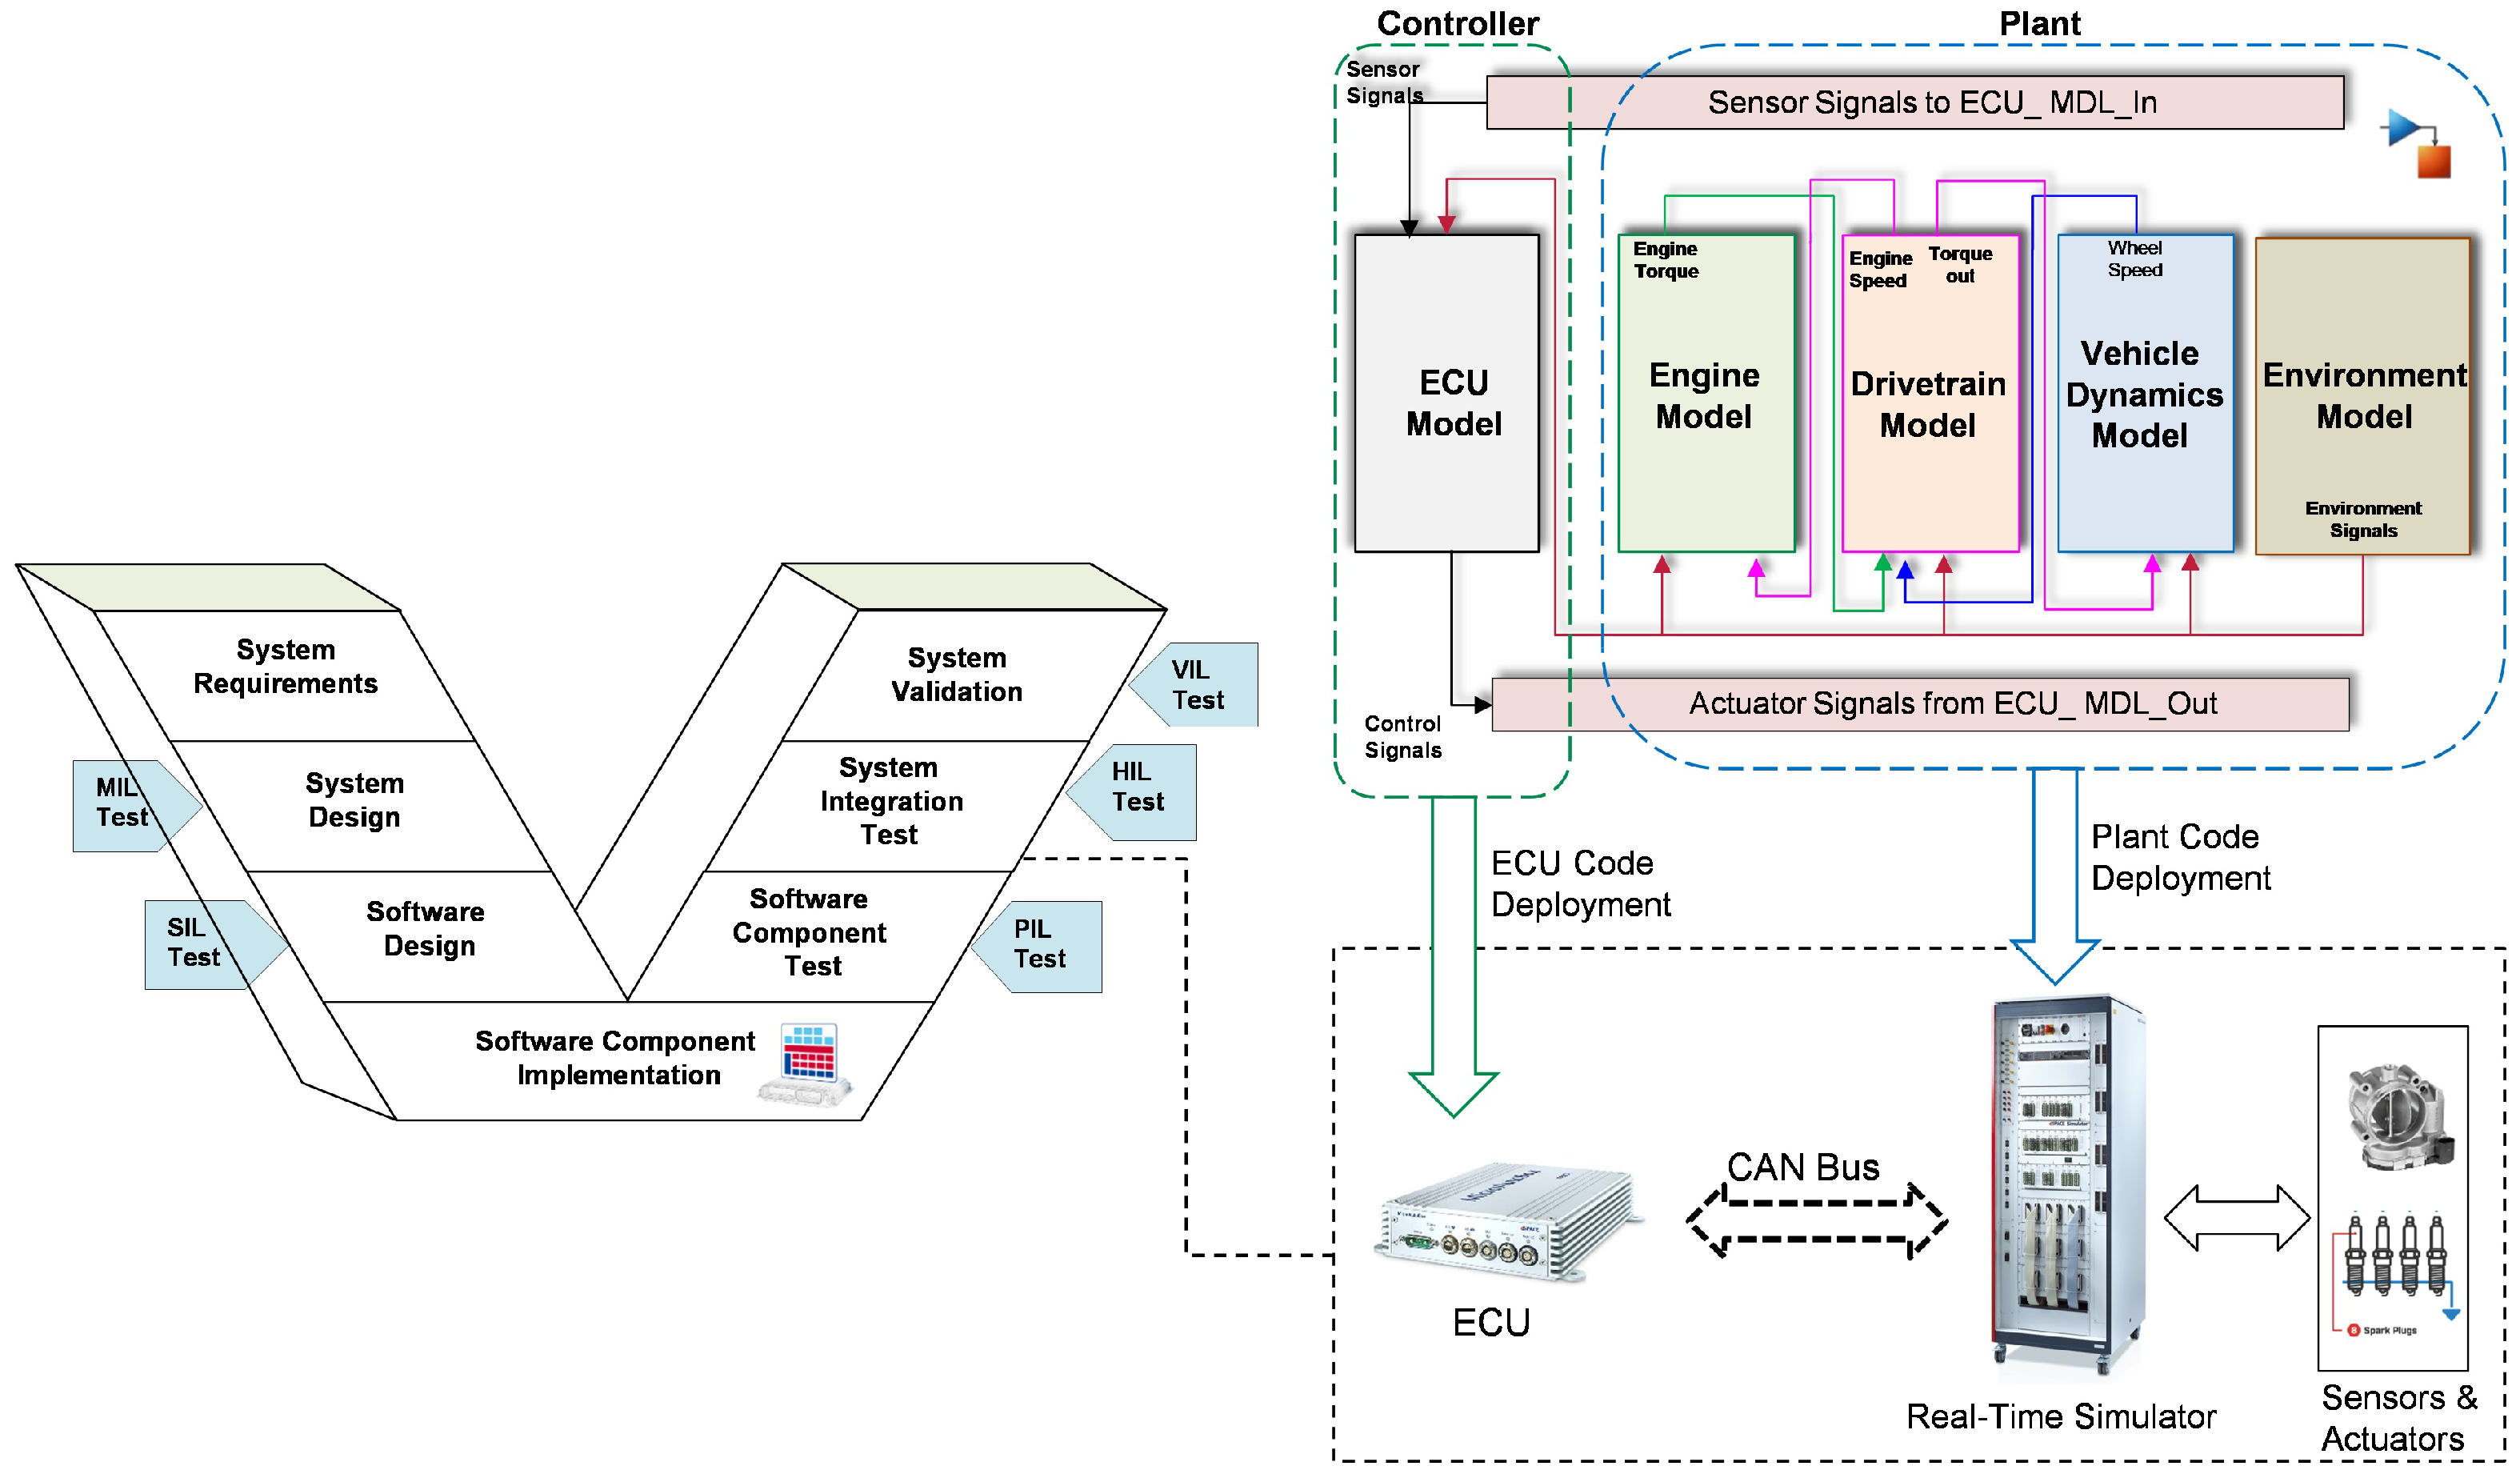
Conversely, at the hardware level, the HIL simulator is connected to MicroAutoBox II via the CAN bus to facilitate the real-time execution of the vehicle model. In particular, the dSPACE SCALEXIO is employed as the real-time simulator for the controlled system, namely the dynamic ASM vehicle model. MicroAutoBox II is employed as the Rapid Control Prototype (RCP), serving to emulate the functionality of the actual ECU and execute the control model in real time. The code generated for the ECU model is implemented in MicroAutoBox II, while the code generated for the ASM vehicle dynamics model is implemented in HIL SCALEXIO, as illustrated in Figure 5. The HIL system is linked to the host PC via the Ethernet communication protocol, therefore facilitating the configuration, monitoring, and analysis of the system, as well as the setting of targets for execution.
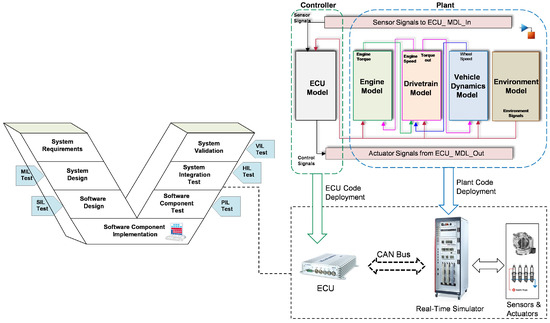
Figure 5.
System architecture of the case study with different test phases of V-Model.
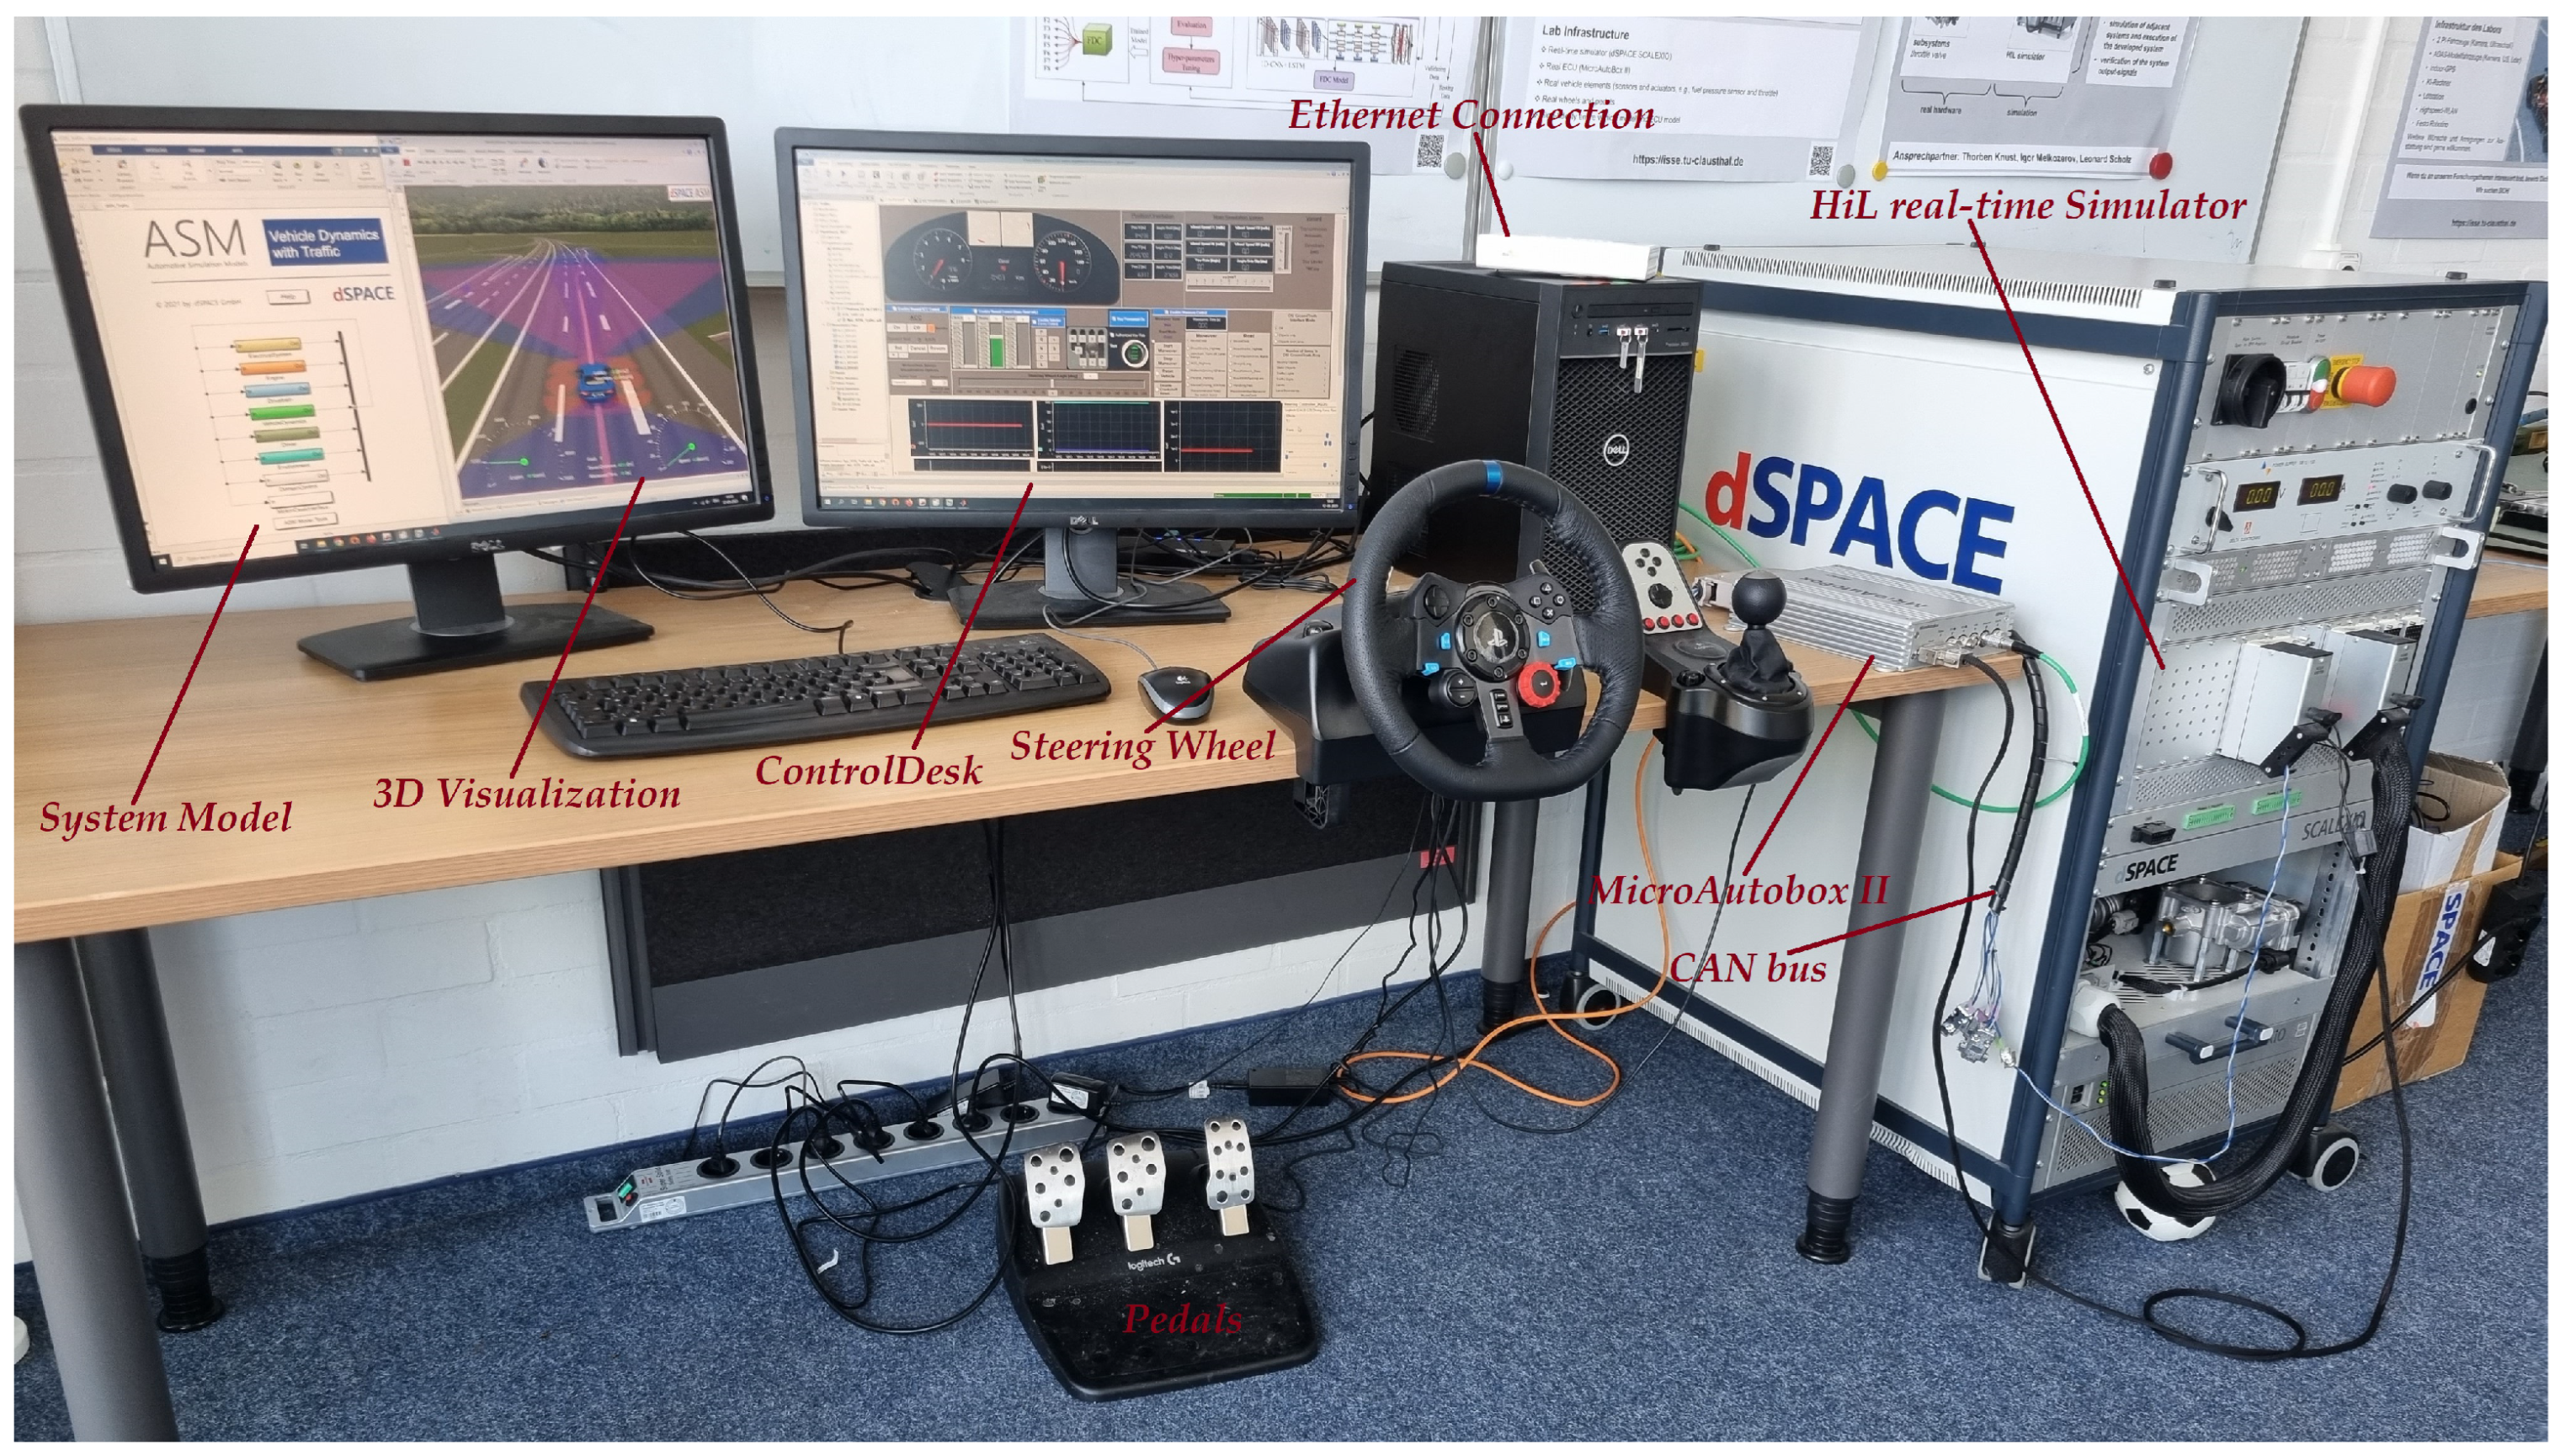
In order to facilitate real-time virtual test driving by the user, the HIL system is connected to real steering wheels and pedals, as illustrated in Figure 6. This approach allows for the execution of driving scenarios and TCs based on not only the automated behavior of the system but also the real behavior of the driver [44].
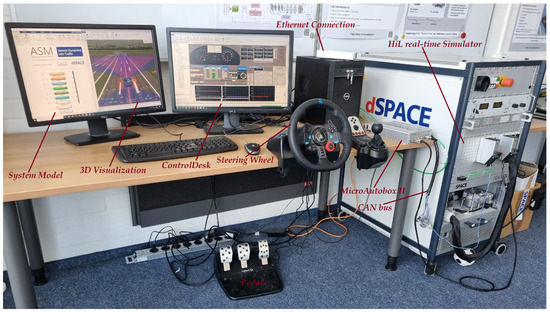
Figure 6.
Photography of the virtual test drive platform with HIL simulation system.
In addition to the aforementioned models and real-time systems, software tools from dSPACE, i.e., ModelDesk, MotionDesk, ConfigurationDesk, and ControlDesk [45], are employed to facilitate the implementation process. In particular, the parameterization and configuration of system variables are performed using the ModelDesk software. In addition, the real-time test function of ModelDesk is employed to create and implement the test scenario and corresponding TCs. To this end, a critical situation is defined within the scenario in order to verify the system’s behavior under abnormal conditions. In this study, three test scenarios have been developed in both automatic and manual driving modes. In the test development environment, the logical and concrete TC description, including the TC specification, can be identified. In other words, the input data for the TC and the expected results are defined. Subsequently, the validation criteria are defined in order to validate the actual output of the SUT and provide the corresponding information for the test report. Once the configurations and parameterizations are complete, the code is automatically generated from the model and implemented in the corresponding hardware system using ConfigurationDesk. The functionality of MotionDesk is illustrated by a 3D animation, which provides a visual representation of the driving scenario and the surrounding environment. Ultimately, ControlDesk facilitates the instrumentation of test variables, calibration, measurement, analysis, and control of test executions. Moreover, the selected driving scenario can be executed in either automatic or manual mode, according to the tester’s specifications.
4.2. Dataset Description
To investigate the various potential classes of failure in dynamic systems, two distinct datasets were employed: a factory dataset and an automotive dataset. The factory dataset comprises text descriptions of factory events collated from factory reports. Each event was described in brief in natural language and assigned a category indicating the type of failure. In total, three distinct categories of failures were identified: software failure, hardware failure, and communication failure [46]. The dataset comprises 480 descriptions of disparate events, each of which has been assigned one of three categories of cause. In contrast, the second dataset employed the Autonomous Vehicle Disengagement Reports, which compiled descriptions of failures that occurred during the testing of self-driving vehicles in California between 2018 and 2019 [47]. In particular, the dataset describes various failures in autonomous vehicle technology. However, the descriptions of the detected failures are presented in natural language without identifying the causes of each event, rendering the data unlabeled. The total number of events described is 455. Both sets of data are saved as CSV files, which are then used as input for the preprocessing phase prior to training. Consequently, two CSV files comprising 935 samples are employed for the training and validation of the target model.
In accordance with the proposed framework, the data undergoes a series of preprocessing steps, including the removal of special characters and digits, tokenization, i.e., the conversion of text into individual words, normalization, and the elimination of stop words and stemming. In order to facilitate the tokenization process, the text is transformed into a sequence of components, referred to as "tokens," through the utilization of the Keras Tokenizer [48]. Consequently, the dataset is transformed into a binary matrix. The Snowball Stemmer [49] is a function that reduces words to their fundamental form through a process known as stemming.
Following the completion of the preprocessing phase, the data are split with 80% allocated for training, 10% for validation, and 10% for testing. Following the cleaning steps, 748 samples were utilized for the training phase as unsupervised learning, while 93 samples were employed for the validation phase. The same number of validation samples were used as unseen data for the testing process.
4.3. Hyperparameters Optimization
The objective of this step is to identify the optimal hyperparameters that result in the highest performance, as indicated by low loss and high accuracy. In particular, the hyperparameters of the 1dCNN-AE model architecture are calibrated using the David Bouldin Index (DBI) and a validation dataset. The DBI is a metric for evaluating the quality of clustering, whereby the mean distance between clusters is considered in relation to their respective sizes. In order to achieve this objective, a series of hyperparameters have been selected, encompassing the learning rate, optimizer, number of layers, kernel size, and filter size. Table 2 illustrates the range of hyperparameters under consideration and the optimal values selected.
Table 2.
Hyperparameters used in optimization process.
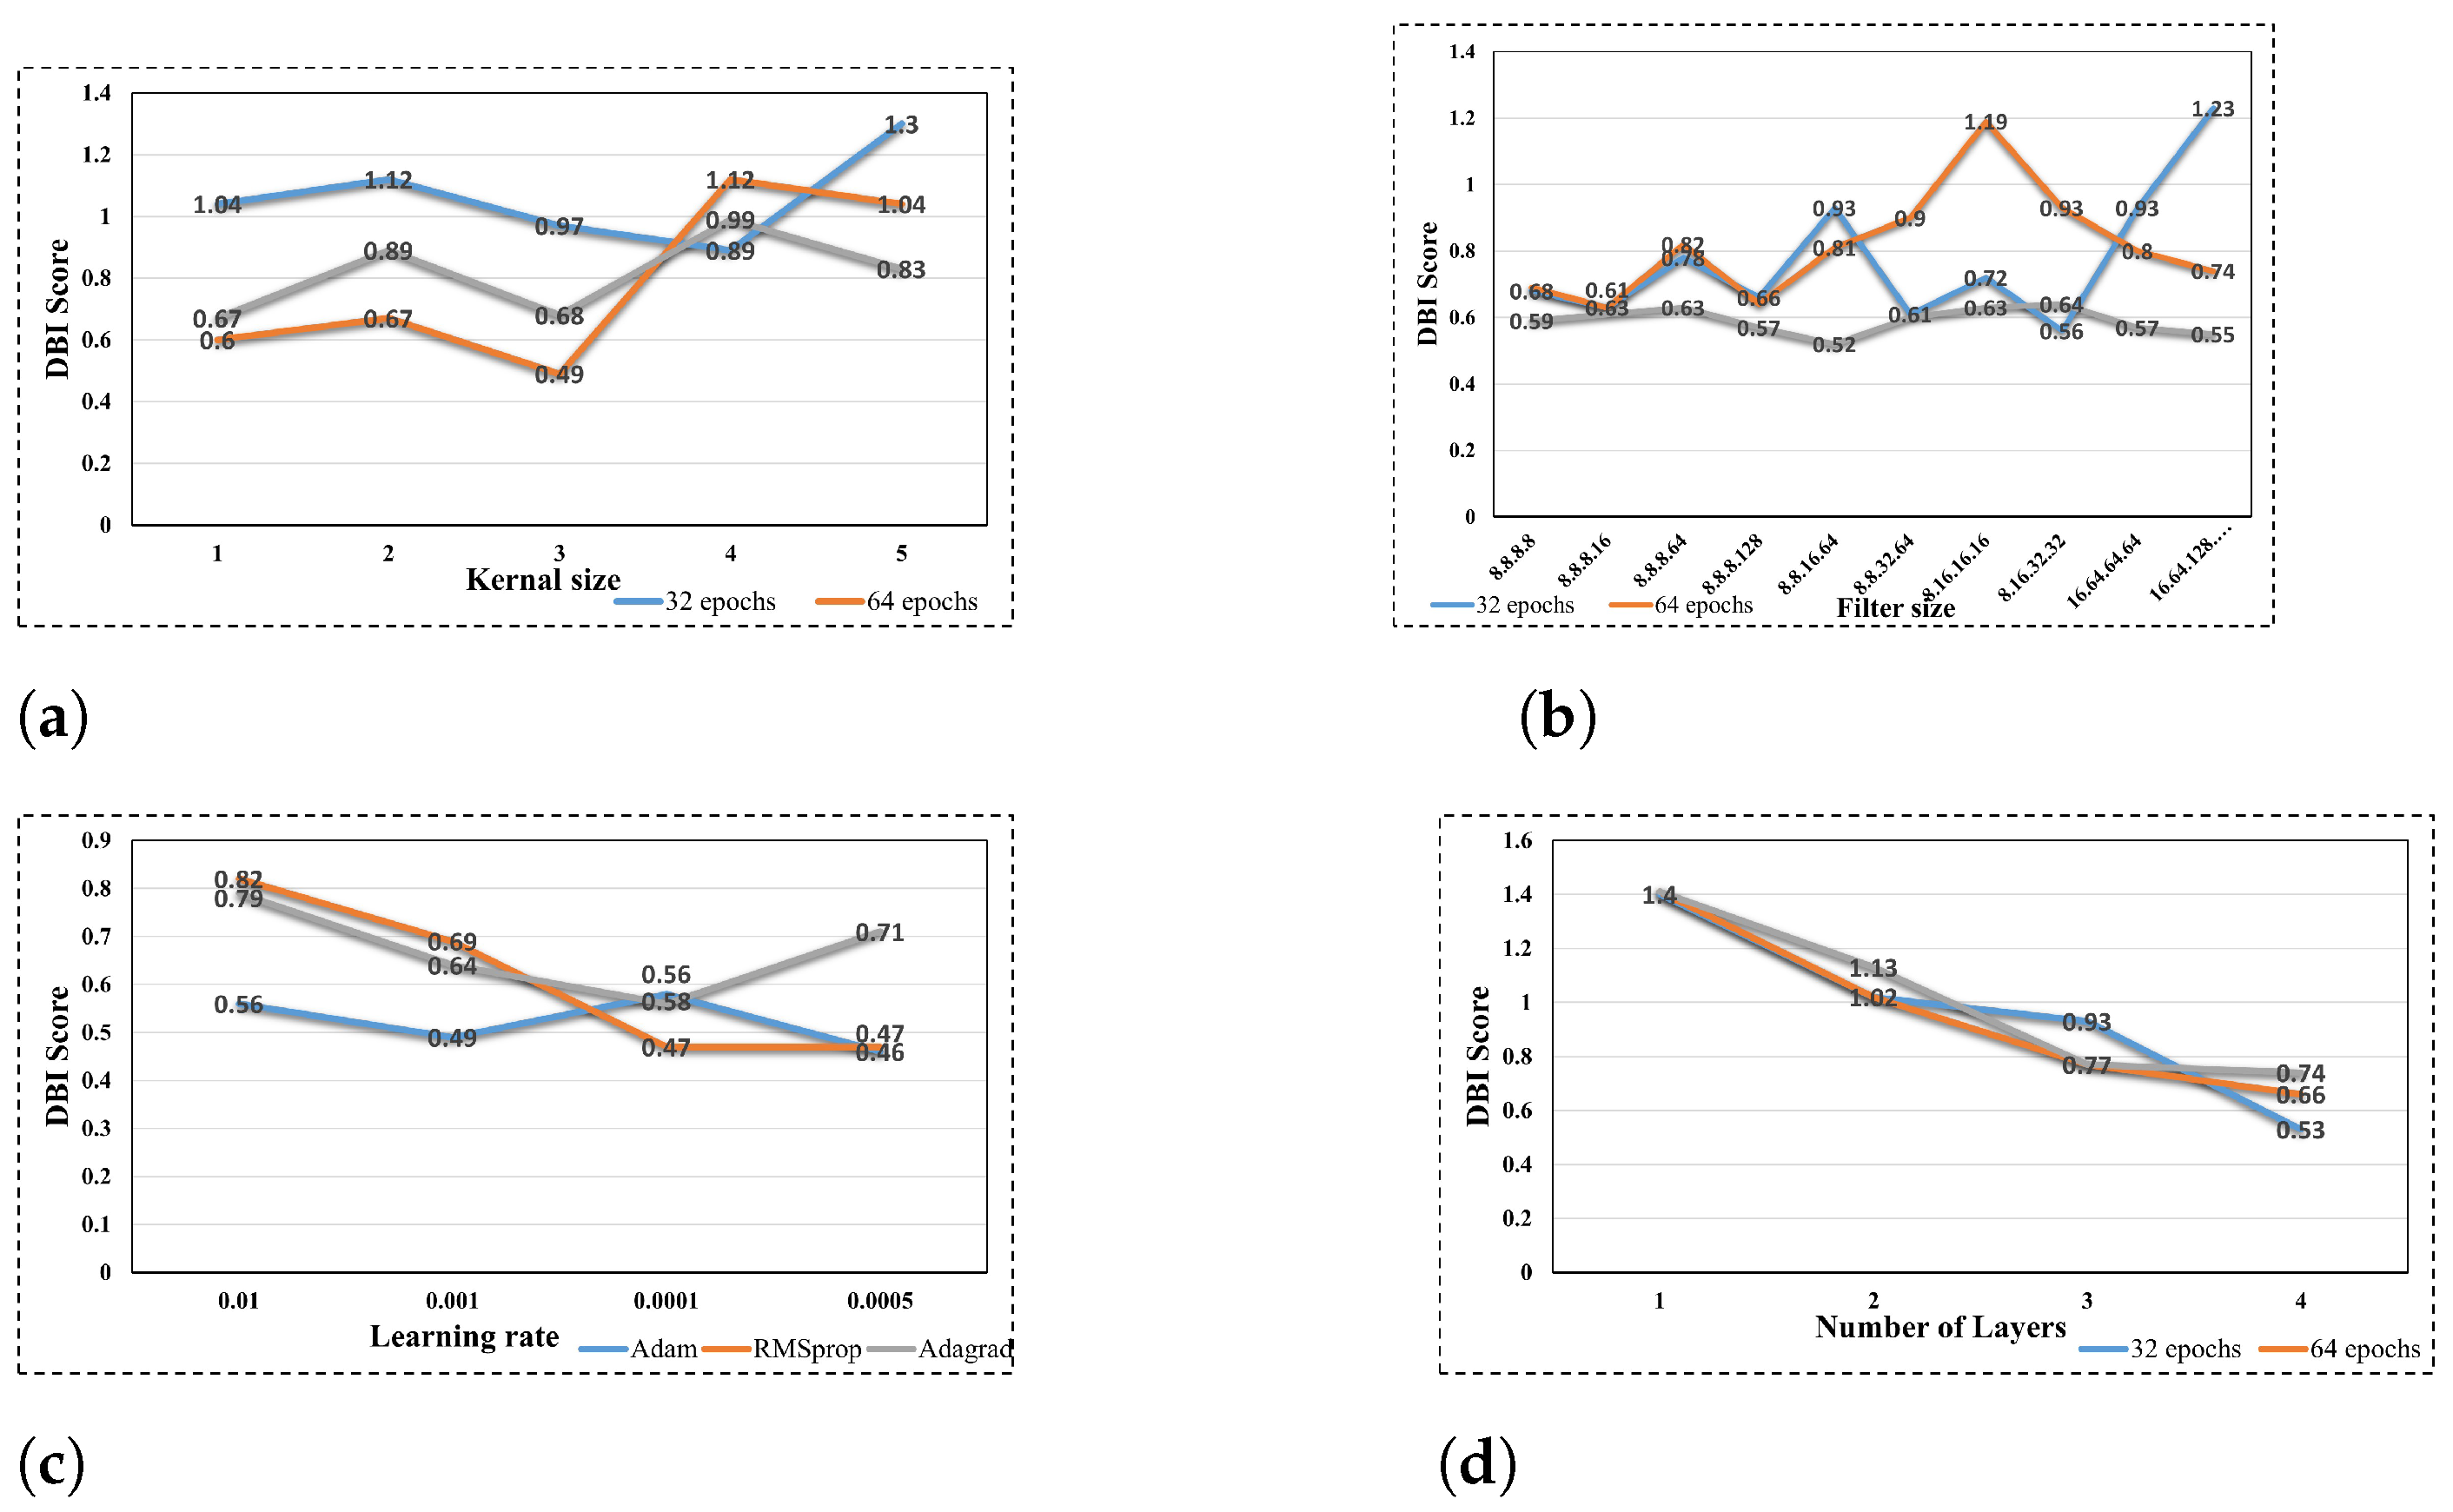
Figure 7 illustrates the impact of tuning the hyperparameters of the 1dCNN-AE model on the clustering performance, as reflected in the DBI score. It was determined that the lower the DBI score, the more optimal the clustering performance. Figure 7a illustrates the impact of modifying the kernel size of the 1dCNN-AE on the clustering performance across distinct epochs. It can be observed that an increase in kernel size allows the 1dCNN-AE model to capture more global features, therefore improving the clustering results. The model was trained over different epochs, and the kernel size of 3 with 64 epochs demonstrated the optimal clustering performance with a DBI score of 0.493. It is noteworthy that a larger kernel size for the 1dCNN-AE model correlates with a higher level of complexity and a higher DBI score, particularly when working with a smaller dataset.
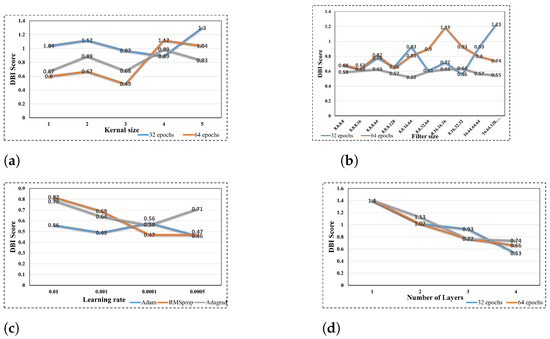
Figure 7.
Hyperparameters optimization results. (a)Validation accuracy with different kernel sizes. (b) Validation accuracy with different filter sizes. (c) Validation accuracy with different learning rates. (d) Validation accuracy with different number of layers.
Similarly, an increase in the filter size allows for the expansion of the model’s capacity, enabling the learning of more complex and varied features and the capture of diverse patterns. This resulted in an improvement in the clustering performance, as can be observed in Figure 7b, where filter size 8.8.16.64 was used with the model trained over 128 epochs.
The learning rate and the utilized optimizer represent noteworthy hyperparameters that exerted a considerable influence on the model performance. Figure 7c illustrates the accuracy of the Adam optimizer in terms of low DBI (0.49) at a learning rate of 0.001, in comparison to the RMSprop and Adagrad optimizers, which exhibited DBI values of 0.64 and 0.69, respectively.
Alongside the use of various optimizers, the 1dCNN-AE model was trained using different learning rates. It can be demonstrated that a low learning rate was instrumental in enhancing the clustering performance, with a DBI of 0.46 at a learning rate of 0.0005. Nevertheless, the low learning rate necessitates a considerable computational expenditure in the form of training time.
Figure 7d illustrates the impact of augmenting the 1dCNN-AE architecture with additional hidden layers. As can be observed, the DBI score has been markedly reduced by augmenting the model layers, reaching a value of 0.533 with four layers. Despite the ability to learn a more complex, hierarchical representation of data, the more layers there are, the greater the complexity of the model.
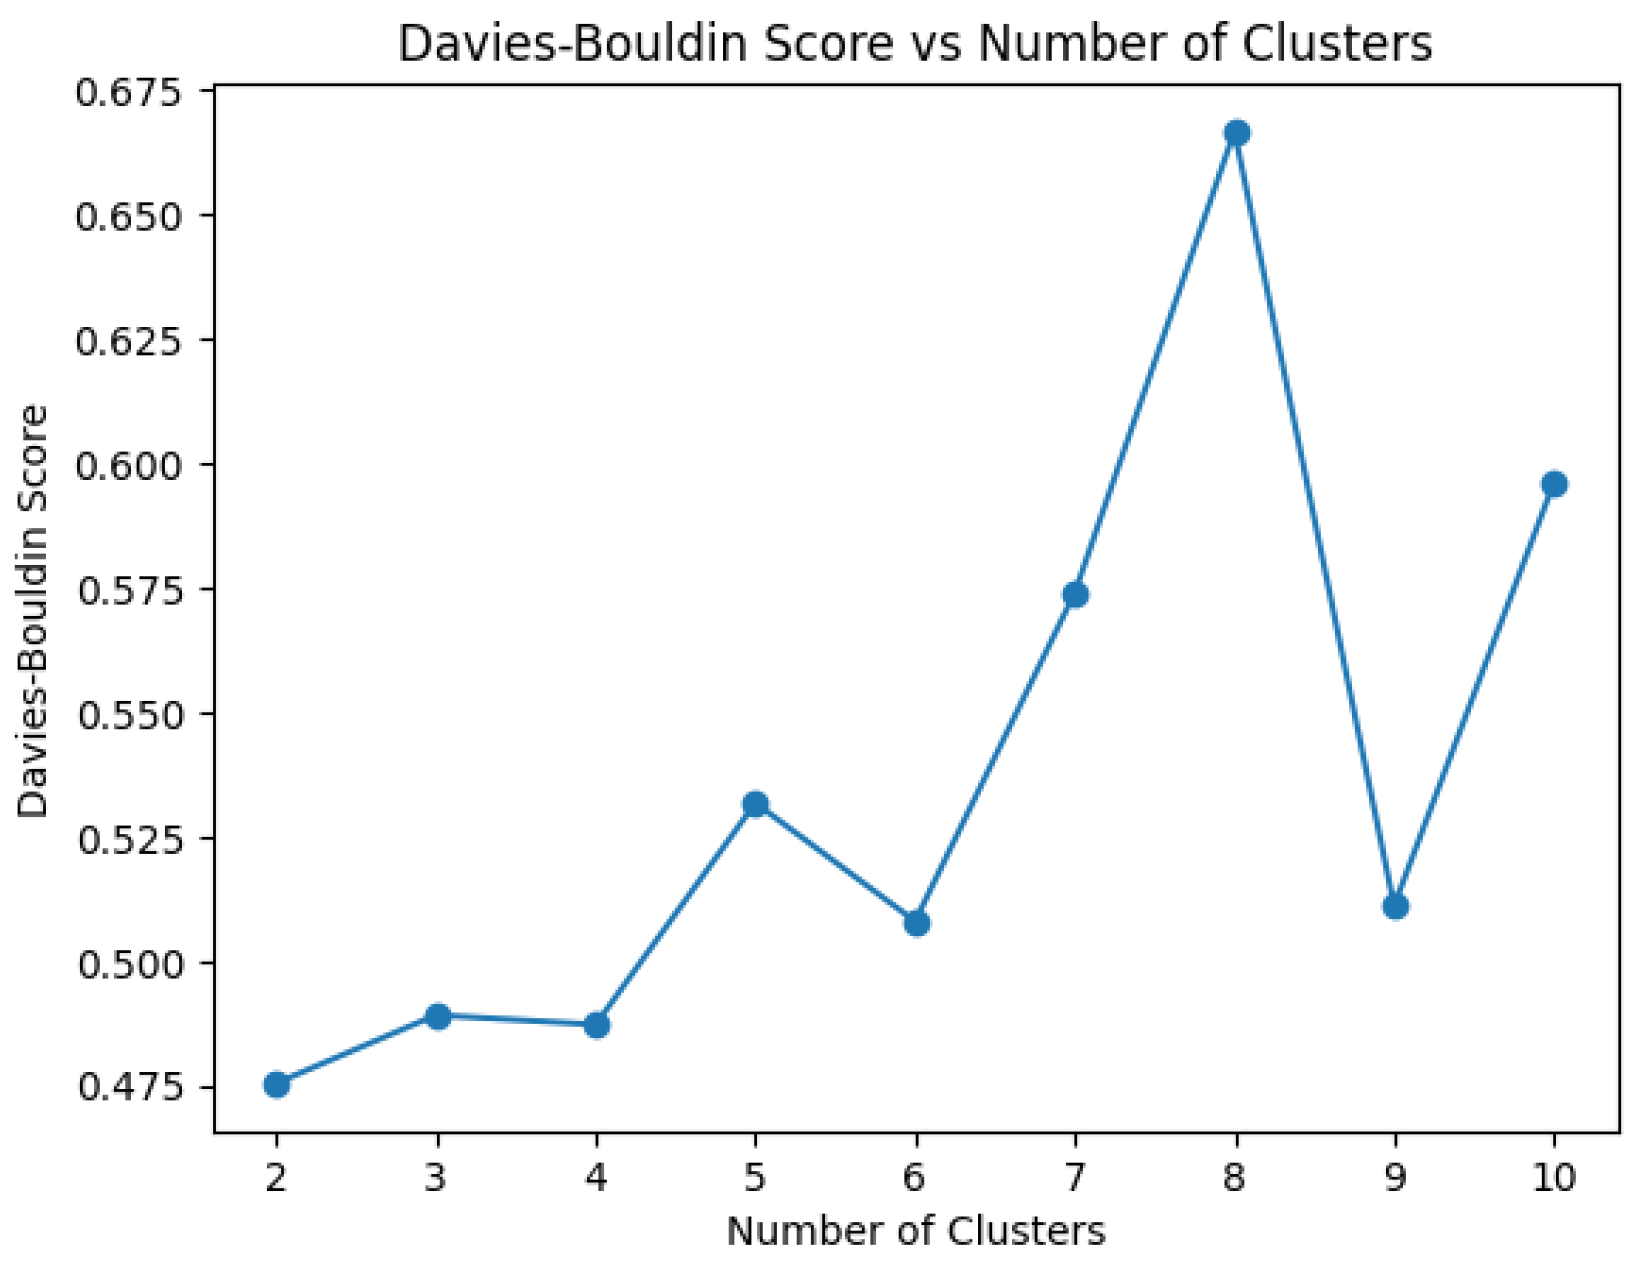
Once the optimal structure of 1dCNN-AE has been determined, the developing clustering model is constructed using the k-mean algorithm. To ascertain the optimal number of clusters, the DBI score is employed as a metric for the inertia value, therefore enabling the selection of cluster numbers at the elbow point where the DBI exhibits a notable increase from its minimum values. A range of clusters between 2 and 10 has been considered for the analysis process, with a view to selecting the optimal number of clusters. In accordance with the validation results presented in Figure 8, which indicate a DBI value of 0.47, the clustering model incorporates four clusters, representing the four failure classes.

Figure 8.
Optimization of clusters number selection.
5. Results and Discussion
This section presents and discusses the evaluation results of the proposed methods for clustering the failed TCs of HIL tests. The performance evaluation of the proposed model has been compared with the results of other AE structures and a standalone clustering technique. To this end, the efficacy of the proposed model has been demonstrated through the application of a range of evaluation metrics, including MSE, DBI, and accuracy.
5.1. Evaluation Metrics
The mean square error (MSE) is employed to quantify the discrepancy between the original input of the 1dCNN-AE and the reconstructed data in the decoder. A low MSE value is indicative of the high performance of the developed 1dCNN-AE. The MSE is represented mathematically by the following equation:
where and denotes the samples of the original input data and the reconstructed output data, respectively. N represents the total number of data points.
Conversely, the DBI represents the quality measure of the clustering process. A lower DBI score indicates an improved data clustering performance of the trained model. The mathematical equation used to calculate DBI is presented in Equation (4).
where K is the number of clusters. The average distance between cluster data points and its centroid is donated as d. Z represents the distance between the centroids of clusters and .
In order to ascertain the efficacy of the proposed model, accuracy is employed as a quantitative performance criterion, whereby the effectiveness is verified using testing data with known labels. The accuracy metric represents the ratio between the number of correct predictions and the total number of input instances.
5.2. Evaluation of 1dCNN-AE Model
Based on the results of the previous phase, which included both model validation and hyperparameter tuning, the optimal structure of the 1dCNN-AE model has been selected for use in the testing phase. The testing results, which utilized 10% of the dataset as unseen data, demonstrated the efficacy of the proposed optimal model in extracting spatial features and learning efficient encodings from input data. As demonstrated by the reconstruction error measure, the proposed model exhibits a low MSE, with values of 0.0058 and 0.0066 observed in the training and validation, respectively.
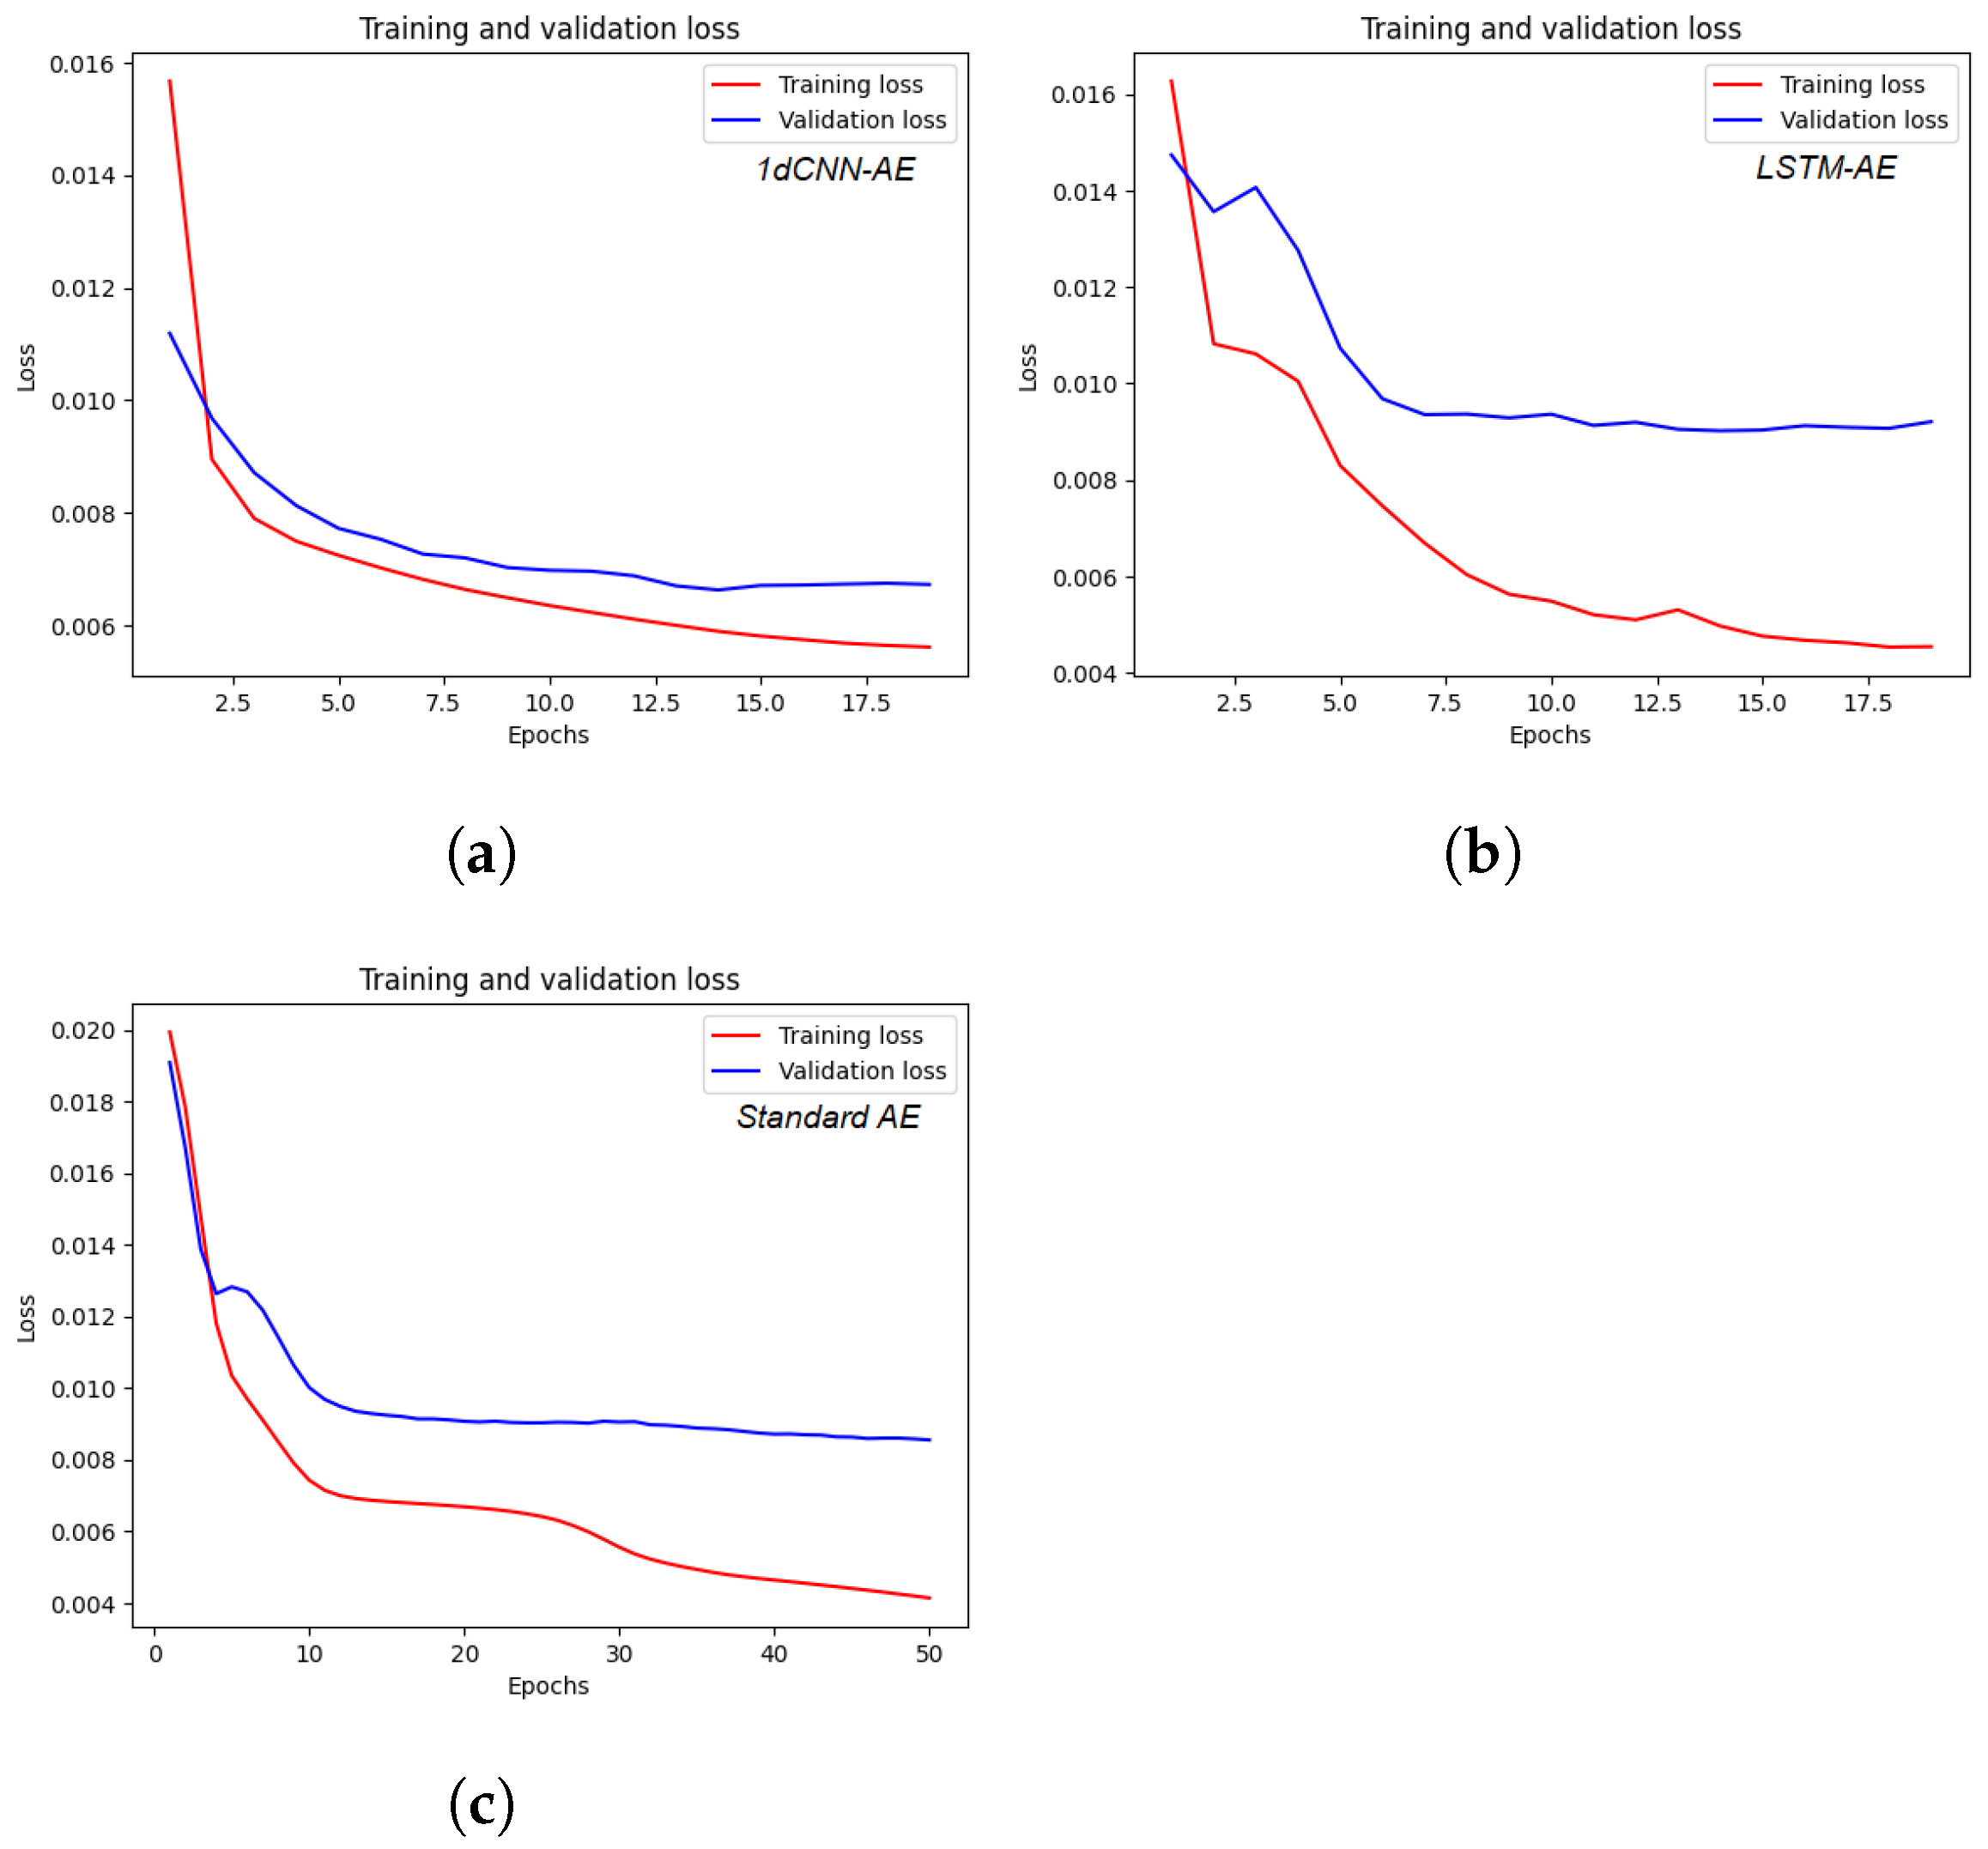
To demonstrate the superiority of the proposed architecture, the aforementioned testing result of 1dCNN-AE has been compared to those from other AE variants, specifically LSTM-AE and standard AE, using the same testing data. As can be observed in Table 3, the MSE_testing of the standard AE is 0.0093, indicating an adequate performance in terms of capturing complex hierarchical patterns. It can also be noticed that our proposed model employs convolutional layers for data processing and can extract multi-scale or hierarchical features automatically with low MSE (0.0063). In contrast to 1dCNN-AE, LSTM-AE demonstrates a suboptimal performance with a low MSE, i.e., 0.0106. Due to its sequential processing nature, achieving parallel execution by LSTM-AE is a significant challenge, particularly when dealing with large datasets. Figure 9 illustrates the training and validation results during the development process of various variants of the AE-based feature extraction model.
Table 3.
Reconstruction error of the proposed model compared to other AE variants.
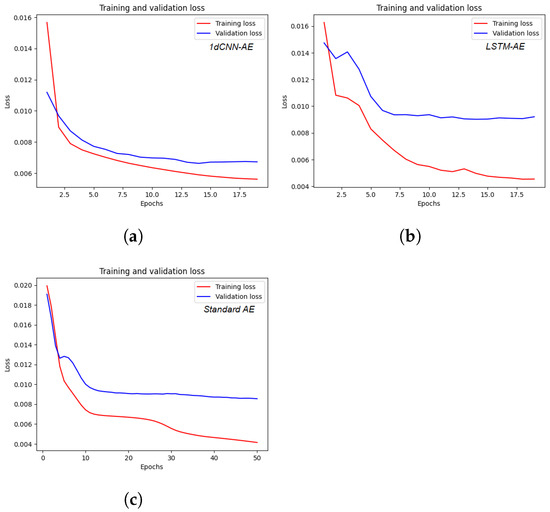
Figure 9.
Model performance during the training and validation process in terms of MSE. (a) Training and validation results of 1dCNN-AE. (b) Training and validation results of LSTM-AE. (c) Training and validation results of standard AE.
Regarding the computational time, it should be noted that AE has a relatively low computational cost in terms of training time due to the low complexity of the model structure, with training times of 21.3 s. On the other hand, 1dCNN-AE exhibits a satisfactory computational cost, with training and testing times of 73.6 s. However, LSTM-AE requires the highest training time with 363.45 s. This is due to the fact that the required computational time for each step is dependent on the output of the previous step, which results in longer training and testing times.
5.3. Evaluation of Clustering Model
The clustering performance has been evaluated in accordance with the DBI score, utilizing an unseen dataset. To demonstrate the superiority of the proposed method for failed TCs clustering, the DBI has been calculated for deep-learning-based clustering and standalone k-means clustering. As illustrated in Table 4, a comparative analysis in terms of DBI and accuracy of the proposed method has been conducted with LSTM-AE + k-means, AE + k-means, and standalone k-means. The testing results demonstrate that the proposed method exhibits both high feature extraction performance and high clustering accuracy. This fact has been illustrated by analyzing the impact of 1dCNN-AE on clustering performance, as demonstrated by a low DBI score of 0.51 and an accuracy score of 0.9434%. In instances where the data are particularly complex, the standalone k-means algorithm exhibits poor performance, as demonstrated by a high DBI score of 1.20 and a clustering accuracy of 59.49%. The AE + k-means method exhibited relatively high DBI and low accuracy with 1.07 and 62.26%, respectively. Nevertheless, the results indicate that integrating AE with k-means can enhance the clustering performance in comparison to a standalone method. In contrast, the application of the extracted features from LSTM-AE with k-means yielded effective clustering performance, as indicated by a DBI score of 1.06 and an accuracy score of 66.03%. It can thus be concluded that the use of 1dCNN-AE for comprehensive feature extraction has a discernible positive impact on the clustering process, as demonstrated by improvements in accuracy and a reduction in DBI.
Table 4.
Clustering performance of the proposed approach compared to other AE variants.
Figure 10 illustrates the k-means clustering process of the extracted features from the 1dCNN-AE, which have been grouped into four clusters. As illustrated in the aforementioned figures, the textual logs have been classified into four clusters, which collectively encompass four distinct types of failures: software, hardware, sensor, and network failure.
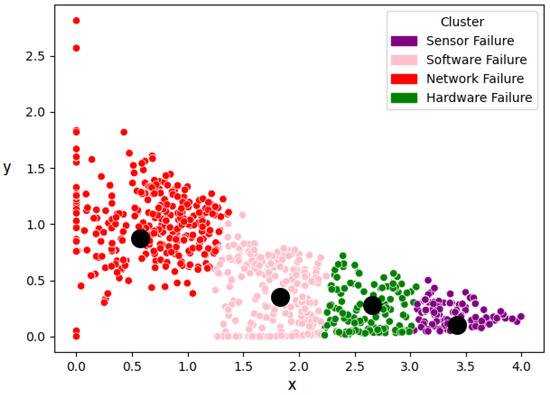
Figure 10.
k-means clustering of the extracted features.
6. Conclusions
This article presents a novel deep-learning-based intelligent clustering framework designed to facilitate the real-time validation of ASSs through the enhancement of the HIL testing process. The primary objective of the proposed approach is to improve the process of clustering and analyzing failed TCs. This allows the corresponding failure classes of failed TCs to be identified efficiently. To this end, the integration of a DL-based architecture with a clustering approach has been proposed as a means of addressing the challenge of poor clustering performance. In particular, a convolutional auto-encoder model has been constructed with the objective of extracting comprehensive representative features from the logs of failed TCs. Furthermore, the k-means algorithm has been employed for the purpose of clustering the extracted features, with the objective of associating each cluster with a specific category.
The proposed framework has been evaluated using a HIL-based real-time virtual test drive platform comprising a high-fidelity entire vehicle model. The findings demonstrate the possibility of incorporating the proposed framework into the HIL testing process, thus allowing the generated report to be automatically analyzed without the need for domain expertise or code access. In accordance with the evaluation metrics, i.e., DBI and accuracy, the proposed clustering approach has demonstrated a noteworthy accomplishment in comparison to the traditional approach, with a score of 0.5184 and 94.3%, respectively. Furthermore, the proposed 1dCNN-AE architecture for feature extraction has demonstrated superior performance in terms of MSE compared to other AE variants, including standard AE and LSTM-AE. In comparison to the traditional clustering model, the proposed clustering approach has achieved an improvement of 34.85% by leveraging the advantages of AE in the extraction of comprehensive and meaningful features from the dataset. This approach constitutes a notable contribution to the field of real-time validation of automotive systems, reducing the cost of manual analysis in terms of time and effort.
As future research, the proposed framework can be expanded to identify the root causes of the detected failure. Furthermore, the potential for applying the proposed framework to other safety-critical systems in diverse domains, such as railway and aviation, can be investigated.
Author Contributions
Conceptualization, M.A.; methodology, M.A.; software, M.A.; validation, M.A.; formal analysis, M.A.; investigation, M.A.; resources, M.A., C.K. and A.R.; data curation, M.A.; writing—original draft preparation, M.A.; writing—review and editing, M.A., C.K. and A.R; visualization, M.A.; supervision, M.A., C.K. and A.R.; project administration, M.A., C.K. and A.R.; funding acquisition, A.R. All authors have read and agreed to the published version of the manuscript.
Funding
We acknowledge support by the Open-Access Publishing Fund of Clausthal University of Technology.
Institutional Review Board Statement
Not applicable.
Informed Consent Statement
Not applicable.
Data Availability Statement
Data available on request due to restrictions.
Conflicts of Interest
The authors declare no conflict of interest.
References
- Abelein, U.; Lochner, H.; Hahn, D.; Straube, S. Complexity, quality and robustness-the challenges of tomorrow’s automotive electronics. In Proceedings of the 2012 Design, Automation & Test in Europe Conference & Exhibition (DATE), Dresden, Germany, 12–16 March 2012; pp. 870–871. [Google Scholar]
- Ebert, C.; Favaro, J. Automotive software. IEEE Softw. 2017, 34, 33–39. [Google Scholar] [CrossRef]
- Bello, L.L.; Mariani, R.; Mubeen, S.; Saponara, S. Recent advances and trends in on-board embedded and networked automotive systems. IEEE Trans. Ind. Informatics 2018, 15, 1038–1051. [Google Scholar] [CrossRef]
- ISO 26262-10:2012; Road Vehicles—Functional Safety—Part 10: Guideline on ISO 26262. ISO: Geneva, Switzerland, 2012. Available online: https://www.iso.org/standard/54591.html (accessed on 22 November 2021).
- Pintard, L.; Fabre, J.C.; Leeman, M.; Kanoun, K.; Roy, M. From safety analyses to experimental validation of automotive embedded systems. In Proceedings of the 2014 IEEE 20th Pacific Rim International Symposium on Dependable Computing, Singapore, 18–21 November 2014; pp. 125–134. [Google Scholar]
- Garousi, V.; Felderer, M.; Karapıçak, Ç.M.; Yılmaz, U. Testing embedded software: A survey of the literature. Inf. Softw. Technol. 2018, 104, 14–45. [Google Scholar] [CrossRef]
- Lamberg, K. Model-based testing of automotive electronics. In Proceedings of the Design Automation & Test in Europe Conference, Munich, Germany, 6–10 March 2006; Volume 1, p. 28. [Google Scholar]
- Himmler, A.; Lamberg, K.; Beine, M. Hardware-in-the-Loop Testing in the Context of ISO 26262; Technical Report; SAE Technical Paper; SAE International: Warrendale, PA, USA, 2012. [Google Scholar]
- Sarhadi, P.; Yousefpour, S. State of the art: Hardware in the loop modeling and simulation with its applications in design, development and implementation of system and control software. Int. J. Dyn. Control 2015, 3, 470–479. [Google Scholar] [CrossRef]
- Bringmann, E.; Krämer, A. Model-based testing of automotive systems. In Proceedings of the 2008 1st International Conference on Software Testing, Verification, and Validation, Lillehammer, Norway, 9–11 April 2008; pp. 485–493. [Google Scholar]
- Vermeulen, B. Functional debug techniques for embedded systems. IEEE Des. Test Comput. 2008, 25, 208–215. [Google Scholar] [CrossRef]
- Li, W. Automatic Log Analysis Using Machine Learning: Awesome Automatic Log Analysis Version 2.0; DiVA: Stockholm, Sweden, 2013. [Google Scholar]
- Planning, S. The economic impacts of inadequate infrastructure for software testing. Natl. Inst. Stand. Technol. 2002, 1, 85–87. [Google Scholar]
- Mahesh, B. Machine learning algorithms-a review. Int. J. Sci. Res. IJSR 2020, 9, 381–386. [Google Scholar] [CrossRef]
- Shafiq, S.; Mashkoor, A.; Mayr-Dorn, C.; Egyed, A. A literature review of using machine learning in software development life cycle stages. IEEE Access 2021, 9, 140896–140920. [Google Scholar] [CrossRef]
- Shafiq, S.; Mashkoor, A.; Mayr-Dorn, C.; Egyed, A. Machine learning for software engineering: A systematic mapping. arXiv 2020, arXiv:2005.13299. [Google Scholar]
- Theissler, A.; Pérez-Velázquez, J.; Kettelgerdes, M.; Elger, G. Predictive maintenance enabled by machine learning: Use cases and challenges in the automotive industry. Reliab. Eng. Syst. Saf. 2021, 215, 107864. [Google Scholar] [CrossRef]
- Jones, J.A.; Bowring, J.F.; Harrold, M.J. Debugging in parallel. In Proceedings of the 2007 International Symposium on Software Testing and Analysis, London, UK, 9–12 July 2007; pp. 16–26. [Google Scholar]
- Zakari, A.; Lee, S.P. Parallel debugging: An investigative study. J. Softw. Evol. Process 2019, 31, e2178. [Google Scholar] [CrossRef]
- Hsueh, C.H.; Cheng, Y.P.; Pan, W.C. Intrusive test automation with failed test case clustering. In Proceedings of the 2011 18th Asia-Pacific Software Engineering Conference, Ho Chi Minh, Vietnam, 5–8 December 2011; pp. 89–96. [Google Scholar]
- Almaghairbe, R.; Roper, M. Separating passing and failing test executions by clustering anomalies. Softw. Qual. J. 2017, 25, 803–840. [Google Scholar] [CrossRef]
- Dalal, S.; Chhillar, R.S. Empirical study of root cause analysis of software failure. ACM SIGSOFT Softw. Eng. Notes 2013, 38, 1–7. [Google Scholar] [CrossRef]
- Zhang, S.; Zhang, C.; Ernst, M.D. Automated documentation inference to explain failed tests. In Proceedings of the 2011 26th IEEE/ACM International Conference on Automated Software Engineering (ASE 2011), Lawrence, KS, USA, 6–10 November 2011; pp. 63–72. [Google Scholar]
- Nguyen, X.V.; Nguyen, P.K.; Nguyen, V. Clustering automation test faults. In Proceedings of the 2019 11th International Conference on Knowledge and Systems Engineering (KSE), Da Nang, Vietnam, 24–26 October 2019; pp. 1–7. [Google Scholar]
- Kahles, J.; Törrönen, J.; Huuhtanen, T.; Jung, A. Automating root cause analysis via machine learning in agile software testing environments. In Proceedings of the 2019 12th IEEE Conference on Software Testing, Validation and Verification (ICST), Xi’an, China, 22–27 April 2019; pp. 379–390. [Google Scholar]
- Gelbal, Ş.Y.; Tamilarasan, S.; Cantaş, M.R.; Güvenç, L.; Aksun-Güvenç, B. A connected and autonomous vehicle hardware-in-the-loop simulator for developing automated driving algorithms. In Proceedings of the 2017 IEEE International Conference on Systems, Man, and Cybernetics (SMC), Banff, AB, Canada, 5–8 October 2017; pp. 3397–3402. [Google Scholar]
- Zhang, H.; Zhang, Y.; Yin, C. Hardware-in-the-loop simulation of robust mode transition control for a series—Parallel hybrid electric vehicle. IEEE Trans. Veh. Technol. 2015, 65, 1059–1069. [Google Scholar] [CrossRef]
- Pugi, L.; Paolieri, G.; Giorgetti, M.; Berzi, L.; Viviani, R.; Cabrucci, L.; Bocciolini, L. HIL testing of wheel slide protection systems: Criteria for continuous updating and validation. Railw. Eng. Sci. 2023, 31, 108–121. [Google Scholar] [CrossRef]
- Abboush, M.; Knieke, C.; Rausch, A. Intelligent Identification of Simultaneous Faults of Automotive Software Systems under Noisy and Imbalanced Data based on Ensemble LSTM and Random Forest. IEEE Access 2023, 11, 140022–140040. [Google Scholar] [CrossRef]
- Golagha, M.; Lehnhoff, C.; Pretschner, A.; Ilmberger, H. Failure clustering without coverage. In Proceedings of the 28th ACM SIGSOFT International Symposium on Software Testing and Analysis, Beijing, China, 15–19 July 2019; pp. 134–145. [Google Scholar]
- Choi, K.Y.; Lee, J.W. Fault Localization by Comparing Memory Updates between Unit and Integration Testing of Automotive Software in an Hardware-in-the-Loop Environment. Appl. Sci. 2018, 8, 2260. [Google Scholar] [CrossRef]
- Abboush, M.; Knieke, C.; Rausch, A. GRU-based denoising autoencoder for detection and clustering of unknown single and concurrent faults during system integration testing of automotive software systems. Sensors 2023, 23, 6606. [Google Scholar] [CrossRef]
- Jordan, C.V.; Hauer, F.; Foth, P.; Pretschner, A. Time-series-based clustering for failure analysis in hardware-in-the-loop setups: An automotive case study. In Proceedings of the 2020 IEEE International Symposium on Software Reliability Engineering Workshops (ISSREW), Coimbra, Portugal, 12–15 October 2020; pp. 67–72. [Google Scholar]
- Scharoba, S.; Basener, K.U.; Bielefeldt, J.; Wiesbrock, H.W.; Hübner, M. Towards machine learning support for embedded system tests. In Proceedings of the 2021 24th Euromicro Conference on Digital System Design (DSD), Palermo, Spain, 1–3 September 2021; pp. 166–173. [Google Scholar]
- Simulink. MathWorks. Available online: https://www.mathworks.com/products/simulink.html (accessed on 1 May 2024).
- Pradana, A.W.; Hayaty, M. The effect of stemming and removal of stopwords on the accuracy of sentiment analysis on indonesian-language texts. In Kinetik: Game Technology, Information System, Computer Network, Computing, Electronics, and Control; Kinetik: Bandung, Indonesia, 2019; pp. 375–380. [Google Scholar]
- Bank, D.; Koenigstein, N.; Giryes, R. Autoencoders. In Machine Learning for Data Science Handbook: Data Mining and Knowledge Discovery Handbook; Springer: Cham, Switzerland, 2023; pp. 353–374. [Google Scholar]
- Li, P.; Pei, Y.; Li, J. A comprehensive survey on design and application of autoencoder in deep learning. Appl. Soft Comput. 2023, 138, 110176. [Google Scholar] [CrossRef]
- Wang, Y.; Yao, H.; Zhao, S. Auto-encoder based dimensionality reduction. Neurocomputing 2016, 184, 232–242. [Google Scholar] [CrossRef]
- Likas, A.; Vlassis, N.; Verbeek, J.J. The global k-means clustering algorithm. Pattern Recognit. 2003, 36, 451–461. [Google Scholar] [CrossRef]
- Ahmed, M.; Seraj, R.; Islam, S.M.S. The k-means algorithm: A comprehensive survey and performance evaluation. Electronics 2020, 9, 1295. [Google Scholar] [CrossRef]
- Abboush, M.; Bamal, D.; Knieke, C.; Rausch, A. Hardware-in-the-loop-based real-time fault injection framework for dynamic behavior analysis of automotive software systems. Sensors 2022, 22, 1360. [Google Scholar] [CrossRef]
- Automotive Simulation Models—dSPACE, Version:10.0 (2021-B), Paderborn, Germany. Available online: https://www.dspace.com/en/pub/home/products/sw/automotive_simulation_models.cfm#176_26302_2 (accessed on 11 April 2023).
- Abboush, M.; Knieke, C.; Rausch, A. A Virtual Testing Framework for Real-Time Validation of Automotive Software Systems Based on Hardware in the Loop and Fault Injection. Sensors 2024, 24, 3733. [Google Scholar] [CrossRef]
- Software Development Tools—dSPACE, Release: 2021-B, Paderborn, Germany. Available online: https://www.dspace.com/en/pub/home/products/products.cfm. (accessed on 20 March 2023).
- Factory Reports. Available online: https://www.mathworks.com/help/textanalytics/ug/create-simple-text-model-for-classification.html. (accessed on 11 July 2024).
- Autonomous Vehicle Disengagement Reports. Available online: https://www.kaggle.com/datasets/art12400/2019-autonomous-vehicle-disengagement-reports?resource=download. (accessed on 11 July 2024).
- Ohm, A.K.; Singh, K.K. Study of Tokenization Strategies for the Santhali Language. SN Comput. Sci. 2024, 5, 807. [Google Scholar] [CrossRef]
- Porter, M.F. Snowball: A Language for Stemming Algorithms. 2001. Available online: http://snowball.tartarus.org/texts/introduction.html (accessed on 1 July 2024).

Disclaimer/Publisher’s Note: The statements, opinions and data contained in all publications are solely those of the individual author(s) and contributor(s) and not of MDPI and/or the editor(s). MDPI and/or the editor(s) disclaim responsibility for any injury to people or property resulting from any ideas, methods, instructions or products referred to in the content. |
© 2024 by the authors. Licensee MDPI, Basel, Switzerland. This article is an open access article distributed under the terms and conditions of the Creative Commons Attribution (CC BY) license (https://creativecommons.org/licenses/by/4.0/).