Article

Optimization Study on Nozzle Selection Based on the Influence of Nozzle Parameters on Jet Flow Field Structure

1
Fishery Machinery and Instrument Research Institute, Chinese Academy of Fishery Sciences, Shanghai 201403, China
2
College of Ocean Science and Engineering, Shanghai Maritime University, Shanghai 201306, China
*
Author to whom correspondence should be addressed.
Appl. Sci. 2024, 14(19), 9098; https://doi.org/10.3390/app14199098
Submission received: 29 August 2024 / Revised: 4 October 2024 / Accepted: 6 October 2024 / Published: 8 October 2024

Abstract

:
Currently, the primary method for controlling red tides in the ocean involves spraying water solutions with special chemicals as solutes. High-pressure spraying results in the formation of typical jet structures. In this study, numerical simulation methods are employed to investigate the velocity variations, turbulent characteristics, and gas content distribution of jet flow fields under different initial jet flow pressures, cone angles, and nozzle diameters. Based on practical application scenarios, cluster analysis is used to explore the similarities and differences in jet equivalent diameters under different parameter conditions. The research findings indicate the following. (1) The difference of jet velocity distribution at the far field exit will be enlarged with the increase in the nozzle cone angle. When the nozzle cone angle is 4 mm, the velocity uniformity at the outlet is the best. (2) The TKE of the flow field has no consistent change law along the central axis. At the jet exit, the TKE shows an obvious multi-peak structure. (3) The gas content demonstrates a typical “double-valley” feature at the jet outlet cross-section. Increasing the initial pressure leads to a decrease in the gas content within the jet due to reduced entrainment, while the entrainment range remains largely constant. (4) Cluster analysis reveals that the similarity of jet flow width when it reaches the water surface is minimal compared to other operating conditions when the initial pressure is 0.36 MPa, the cone angle is 115°, and the nozzle diameter is 2 mm. All conditions can be categorized into two or three groups to ensure jet effectiveness. The study results provide scientific guidance for selecting spray devices for controlling red tides in the ocean.

1. Introduction

A high-pressure water jet is a technology that utilizes water as a medium to convert mechanical energy into pressure energy through the principle of liquid pressurization via specific nozzles or pressurization devices. The pressure energy is then transformed into kinetic energy through the formation of a high-energy jet through small orifices of the nozzle [1,2]. Currently, due to the rapid advancement of water jet technology, various methods such as cavitation jet, self-excited jet, and abrasive jet have emerged, propelling this technology into a new stage and widely applying it in multiple fields including shipbuilding, chemical machinery, and the power industry [3,4,5].
The nozzle structure at the outlet of a high-pressure jet controls the flow performance of the jet, and is a critical component of high-pressure water jet systems that has been extensively studied by researchers. Chong et al. [6] conducted theoretical and experimental studies on two typical nozzles to investigate the influence of nozzle structure on the length of the jet in stagnant water, revealing that the nozzle length is inversely proportional to the expansion ratio of the fluid. Liu [7] optimized the nozzle structure to improve the cleaning efficiency of water jets based on the Optimal Latin Hypercube Sampling (OLHS) method. Zhu et al. [8] studied the effect of nozzle length on jet breakup behavior and droplet formation characteristics, finding that the frequency of primary droplet generation is independent of the nozzle length. Increasing the nozzle length can increase the droplet diameter and spacing between primary droplets. Shen et al. [9] conducted on-site experiments, numerical simulations, and multi-criteria decision analysis to study the impact of nozzle structure on jetting efficiency, leading to the design of an optimal nozzle structure. Sun et al. [10] investigated the influence of nozzle orifice shape on jet behavior, providing estimations of liquid jet states at any distance from the nozzle. To elucidate the flow field characteristics inside and outside the nozzle, Jiang et al. [11] analyzed the velocity distribution and vortex generation of internal jets with different nozzle structures through experimental methods, offering guidance for nozzle design. Veysi et al. [12] conducted detailed experimental studies to analyze the impact of nozzle types on air entrainment rate and jet energy with practical implications for environmental management and agricultural production. Matheus et al. [13] studied the geometric shape and operational parameters of Y-shaped nozzles on the atomization efficiency and spray uniformity. Zhang et al. [14] investigated the fluid velocity, droplet diameter, and droplet velocity under different jet velocities and nozzle diameters. Yang et al. [15] compared the flow characteristics of fluids inside four different diameter nozzles, utilizing numerical methods to study streamline, turbulent kinetic energy, and vortex distribution in the jet space and establishing a vortex nozzle design method based on pressure loss. Li et al. [16] analyzed the flow characteristics of jets under different nozzle sizes using CFD methods, determining the optimal nozzle size for the maximum mixing efficiency of the jet flow.
When determining the structural parameters of nozzles, it is necessary to analyze from the perspective of practical applications. In order to improve the rock-breaking effect of jets, some scholars have optimized the structure of spiral nozzles [17,18,19]. Chi et al. [20] analyzed the impact of the number of nozzles and ejection distance on rock fragmentation through experiments. Song et al. [21] studied the influence of different numbers of nozzles on the rock-breaking ability of jet flow fields based on mathematical modeling. Meanwhile, jet flow fields generated by nozzles are also applied to surface cleaning. Song et al. [22] investigated the effects of the nozzle position and angle on flow characteristics and cleaning efficiency through simulation and experiments. Such nozzles are small-diameter pipe sections installed on tools. When the fluid velocity is high, the jets used for cleaning cannot achieve the highest energy conversion efficiency and optimal cleaning effect. Therefore, the development of conical straight nozzles has attracted attention. The converging section of a conical straight nozzle can accelerate the fluid and concentrate fluid energy, which has been mainly applied in the petroleum field [23] (Jiang et al., 2021). Pan et al. [24] analyzed the influence of jet key parameters on jet flow characteristics based on the SST k-ω model. The results show that increasing the jet depth and cone angle will increase the air entrainment rate. Chen et al. [25] found that under the same conditions, the jet generated by a streamlined nozzle performs significantly better than a conical nozzle in practical applications. Liang et al. [26] further demonstrated through numerical simulations that the energy loss of streamlined nozzles is lower than that of conical nozzles.
Red tide is a common ecological phenomenon in coastal waters. In areas where red tide occurs, marine organisms such as fish, shrimp, and shellfish will die in large numbers due to poisoning or lack of oxygen, leading to severe damage to the marine ecosystem [27]. A special clay used for red tide control is mixed with water and sprayed onto the water surface to achieve the purpose of controlling red tide in China [28]. It is necessary to study the influence of nozzle structure and jet parameters on jet flow characteristics to improve the spraying effect. In the study, the computational fluid dynamics (CFD) numerical simulation method is used to investigate the flow characteristics of high-pressure water jet in the air using a model [29,30]. The changes in the flow velocity, turbulent characteristic parameters, and air content of the jet are analyzed by controlling the nozzle diameter, cone angle, and orifice diameter. The equivalent diameter classification results of the influence range at the jet outlet under different conditions are discussed by using statistical methods such as systematic clustering analysis. The study identified the optimal parameters of the nozzles, and the results provide scientific guidance for the selection of jetting devices for the control of red tides at sea.

2. Materials and Methods

2.1. Jet Motion Control Equation

When water is ejected from the nozzle at a high speed, the fluid is mostly in a turbulent state. So, its motion can be described by the continuity equation of fluid dynamics and the equation of motion after Reynolds time averaging [31]:
ρ u i t + ρ u i u j x j = P x i + x j ( ρ u j u i ¯ ) + τ i j x j + ρ g i
ρ u i x i + ρ t = 0
where ρ is density of fluid; P is pressure; t is time; u i and u j are the flow velocity of the i direction and j direction; and x i and x j are the Cartesian coordinates. τ i j is the strain rate tensor, and the specific expression is as follows:
τ i j = μ ( u i x j + u j x i 2 3 δ i j u k x k )
The turbulent motion of the water jet is described by a two-path Realizable k ε model which can predict the jet diffusion flow. The Reynolds stress term in Equation (1) is calculated using the following formula:
ρ u j u i ¯ = μ t ( u i x j + u j x i ) 2 3 δ i j ( ρ k + u t u k x k )
where μ t = ρ C u k 2 ε is the turbulent eddy viscosity; k is the turbulent kinetic energy; and ε is the turbulent dissipation rate; C u = ( A 0 + A s k U ε ) 1 ,
U = S i j S i j + Ω i j Ω i j Ω i j = 1 2 ( u i x j u j x i ) A s = 6 cos ( ϕ ) ϕ = 1 3 cos 1 ( 6 ω ) ω = S i j S k j S i k ( S / 2 ) S = 2 S i j S i j S i j = 1 2 ( u i x j + u j x i )
The Realizable k-epsilon model is widely used as a turbulence model for simulating complex flows [32,33]. This model, boasting strong reliability, wide application range and high computational efficiency, can predict the flow behavior of fluids better to a certain extent. According to the actual calculation results, the results calculated by choosing the Realizable k-epsilon model are very close to those of the k-omega model. Therefore, the k-epsilon model is finally selected to ensure computational efficiency in this paper.
In the Realizable k ε model, turbulence kinetic energy and dissipation rate are, respectively, solved using the transport equations as follows:
( ρ k ) t + ( ρ k u j ) x j = x j ( ( μ + μ t σ k ) k x j ) + G k + G b ρ ε
ρ ε t + ρ ε u j x j = x j ( ( μ + μ t σ ε ) ε x j ) + ρ C 1 S ε ρ C 2 ε 2 k + v ε + G 1 ε ε k C 3 G b
where G k = ρ u j u i ¯ u j x i and G b = γ g i μ t Pr t T x i , respectively, represent the average velocity gradient and the function of the air; Pr t = 0.85 is the Prandtl number of turbulent energy; γ = 1 ρ ( ρ T ) represents the characteristic expansion coefficient. σ ε = 1.2 is the flow dissipation rate Prandtl number; σ k = 1.0 is the turbulent kinetic energy Prandtl number; C 1 = max ( 0.43 , η η + 5 ) , η = S k ε , C 2 = 1.9 , C 1 ε = 1.44 ; C 3 ε = tanh w / v is the buoyancy action coefficient; and w and v are the vertical and radial velocity components, respectively.

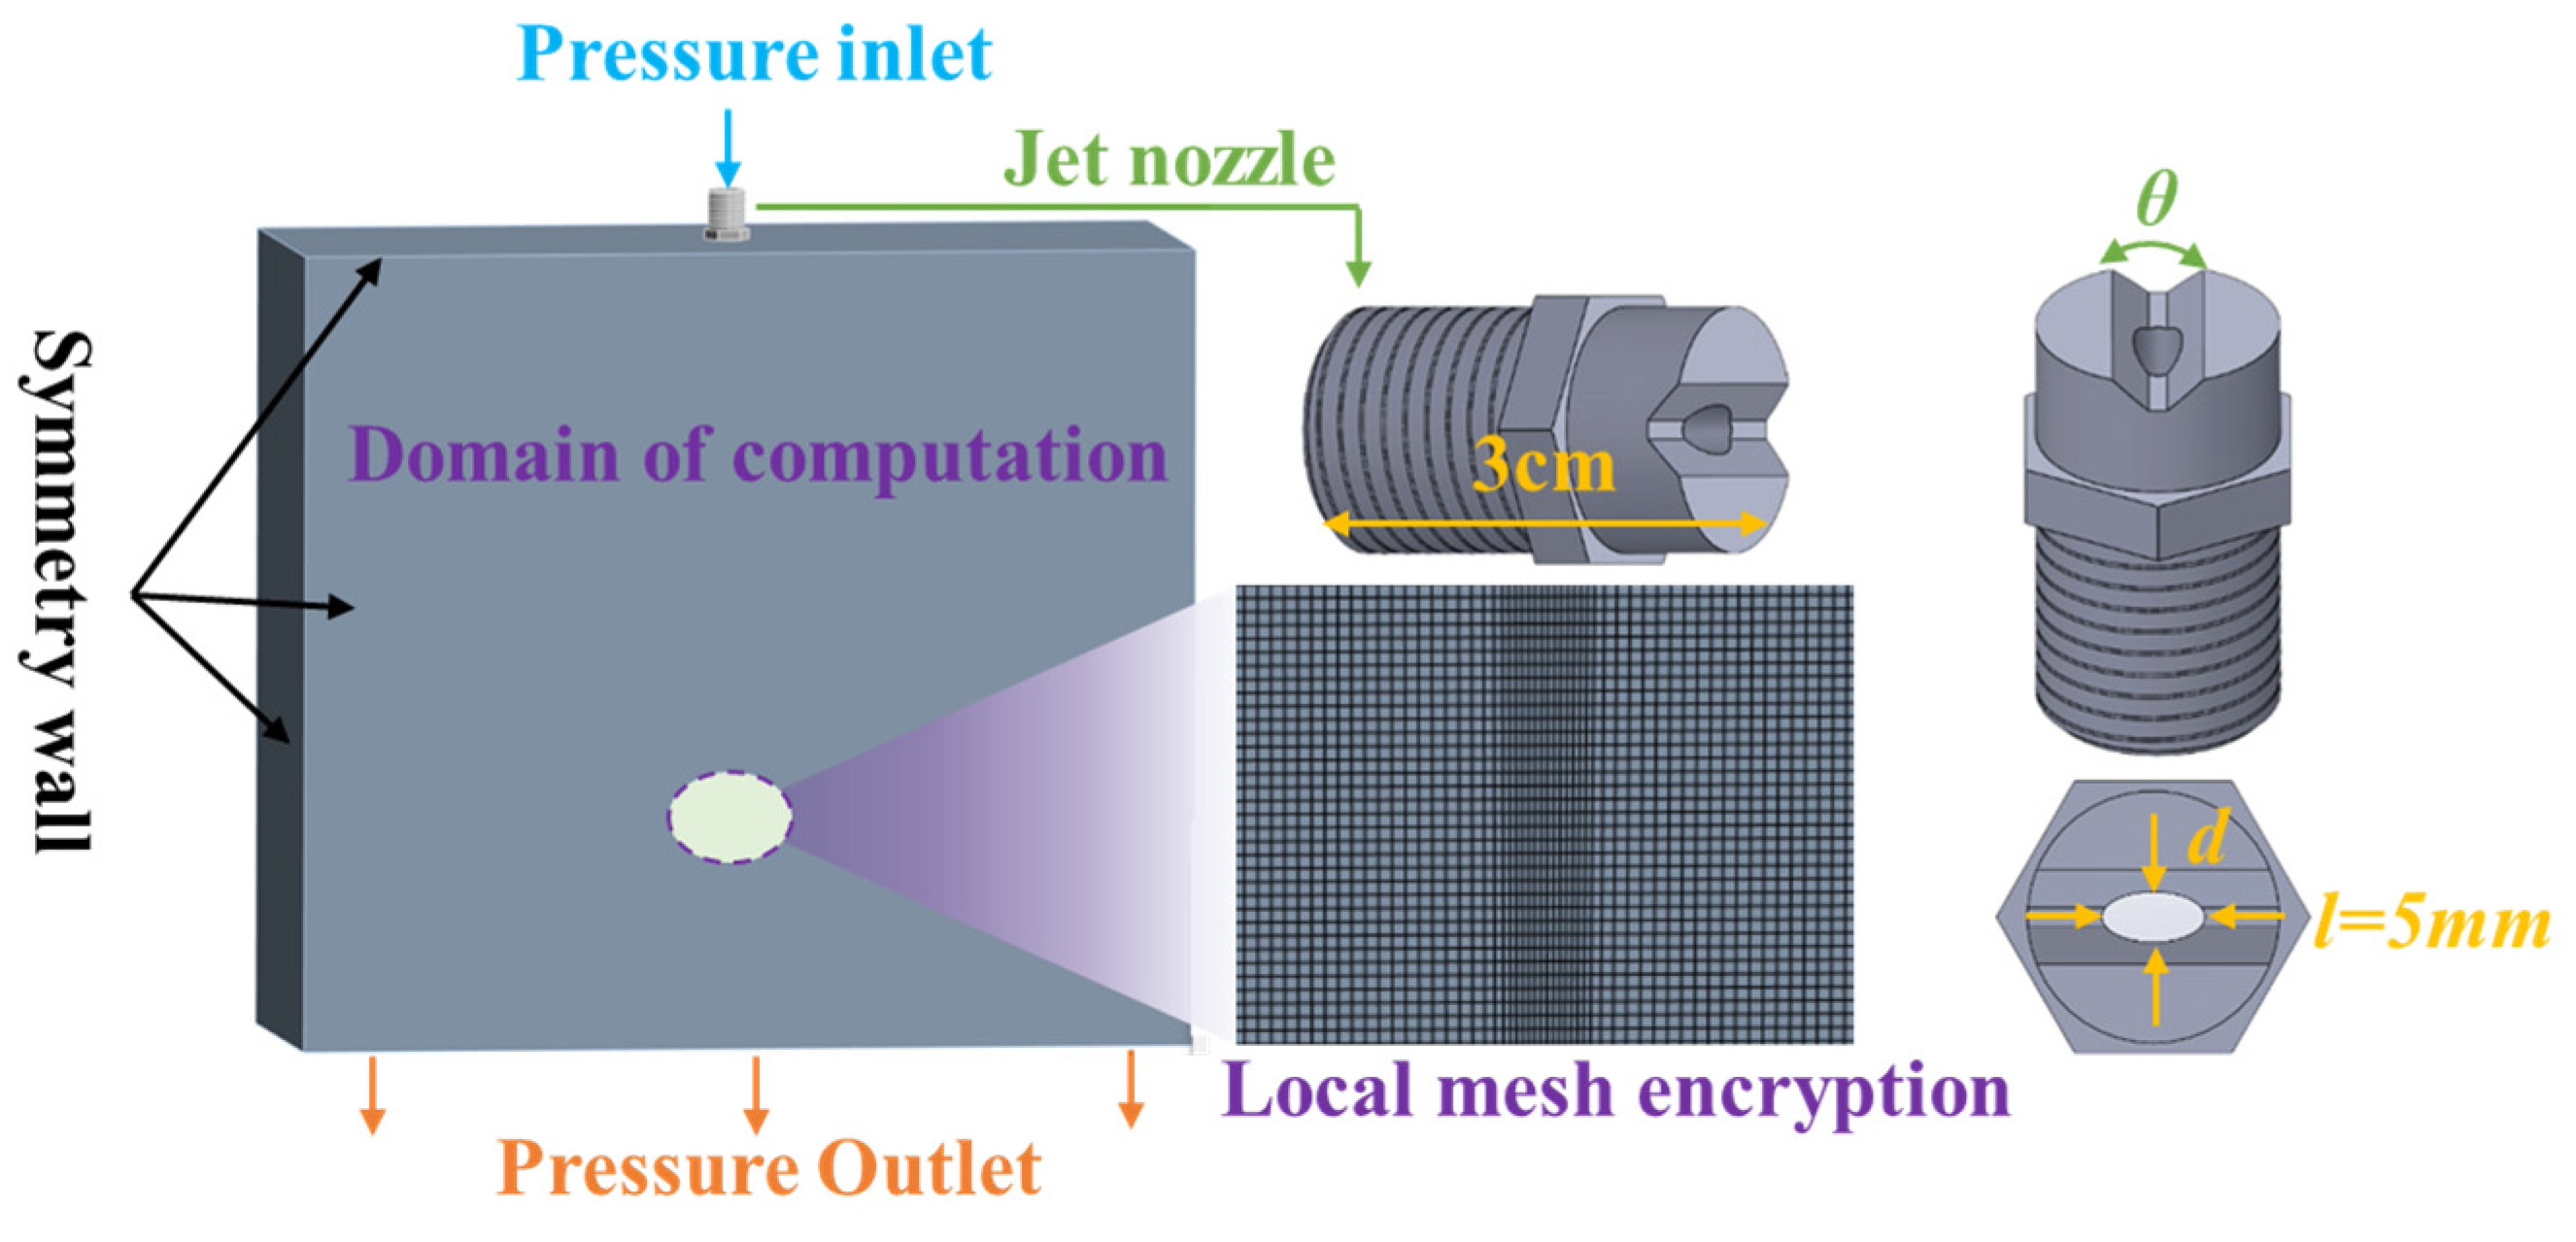
2.2. Model Parameter and Boundary Conditions

The model is constructed using ANSYS DesignModeler three-dimensional modeling software (version number 24.1) to facilitate better interaction with Fluent (Figure 1). The dimension of the computational domain is 50 mm × 80 mm × 100 mm. The nozzle length is 3 cm. The outlet of the nozzle is elliptical in shape. The major axis of the ellipse, l = 5 mm, is fixed. The minor axis of the elliptical, d (the radius below the middle finger), is a variable. The cone angle of the nozzle exit is θ. The computational domain as a whole is divided by a hexahedral mesh. In order to ensure the accuracy of the calculation results, the mesh is refined in the middle part of the spraying area. The pressure inlet boundary conditions are used for the nozzle in the model, and the pressure outlet boundary conditions are used for the computational domain outlet. Symmetric boundary conditions are used for the rest of the domain. The velocity–pressure coupling is completed using the simple algorithm, and the discrete equations are in second-order windward format. To ensure that the flow at the wall can be accurately captured, the scalable wall functions is utilized.
In order to study the effects of initial jet flow pressures, cone angles, and nozzle diameters on the flow characteristics of the jet, numerical simulation analysis is carried out under different working conditions. The specific working condition table is shown in the following Table 1.

2.3. Grid Sensitivity Test

To ensure the effective capture of the jet structure, grids of different sizes are designed for independent verification. The jet inlet pressure used is 0.36 MPa with a nozzle diameter of 4 mm and a cone angle diameter of 105°. A comparison is made of the maximum velocity of jet flow at the bottom of the computational domain under different grid sizes. The main grid parameters and simulation results for the same operating conditions are shown in Table 2 below. When the grid size is 0.05 mm, the results are most accurate. However, the mesh size of 0.1 mm is selected after consideration of the consumption of computational resources and the accuracy of the calculation results in the study.

3. Results

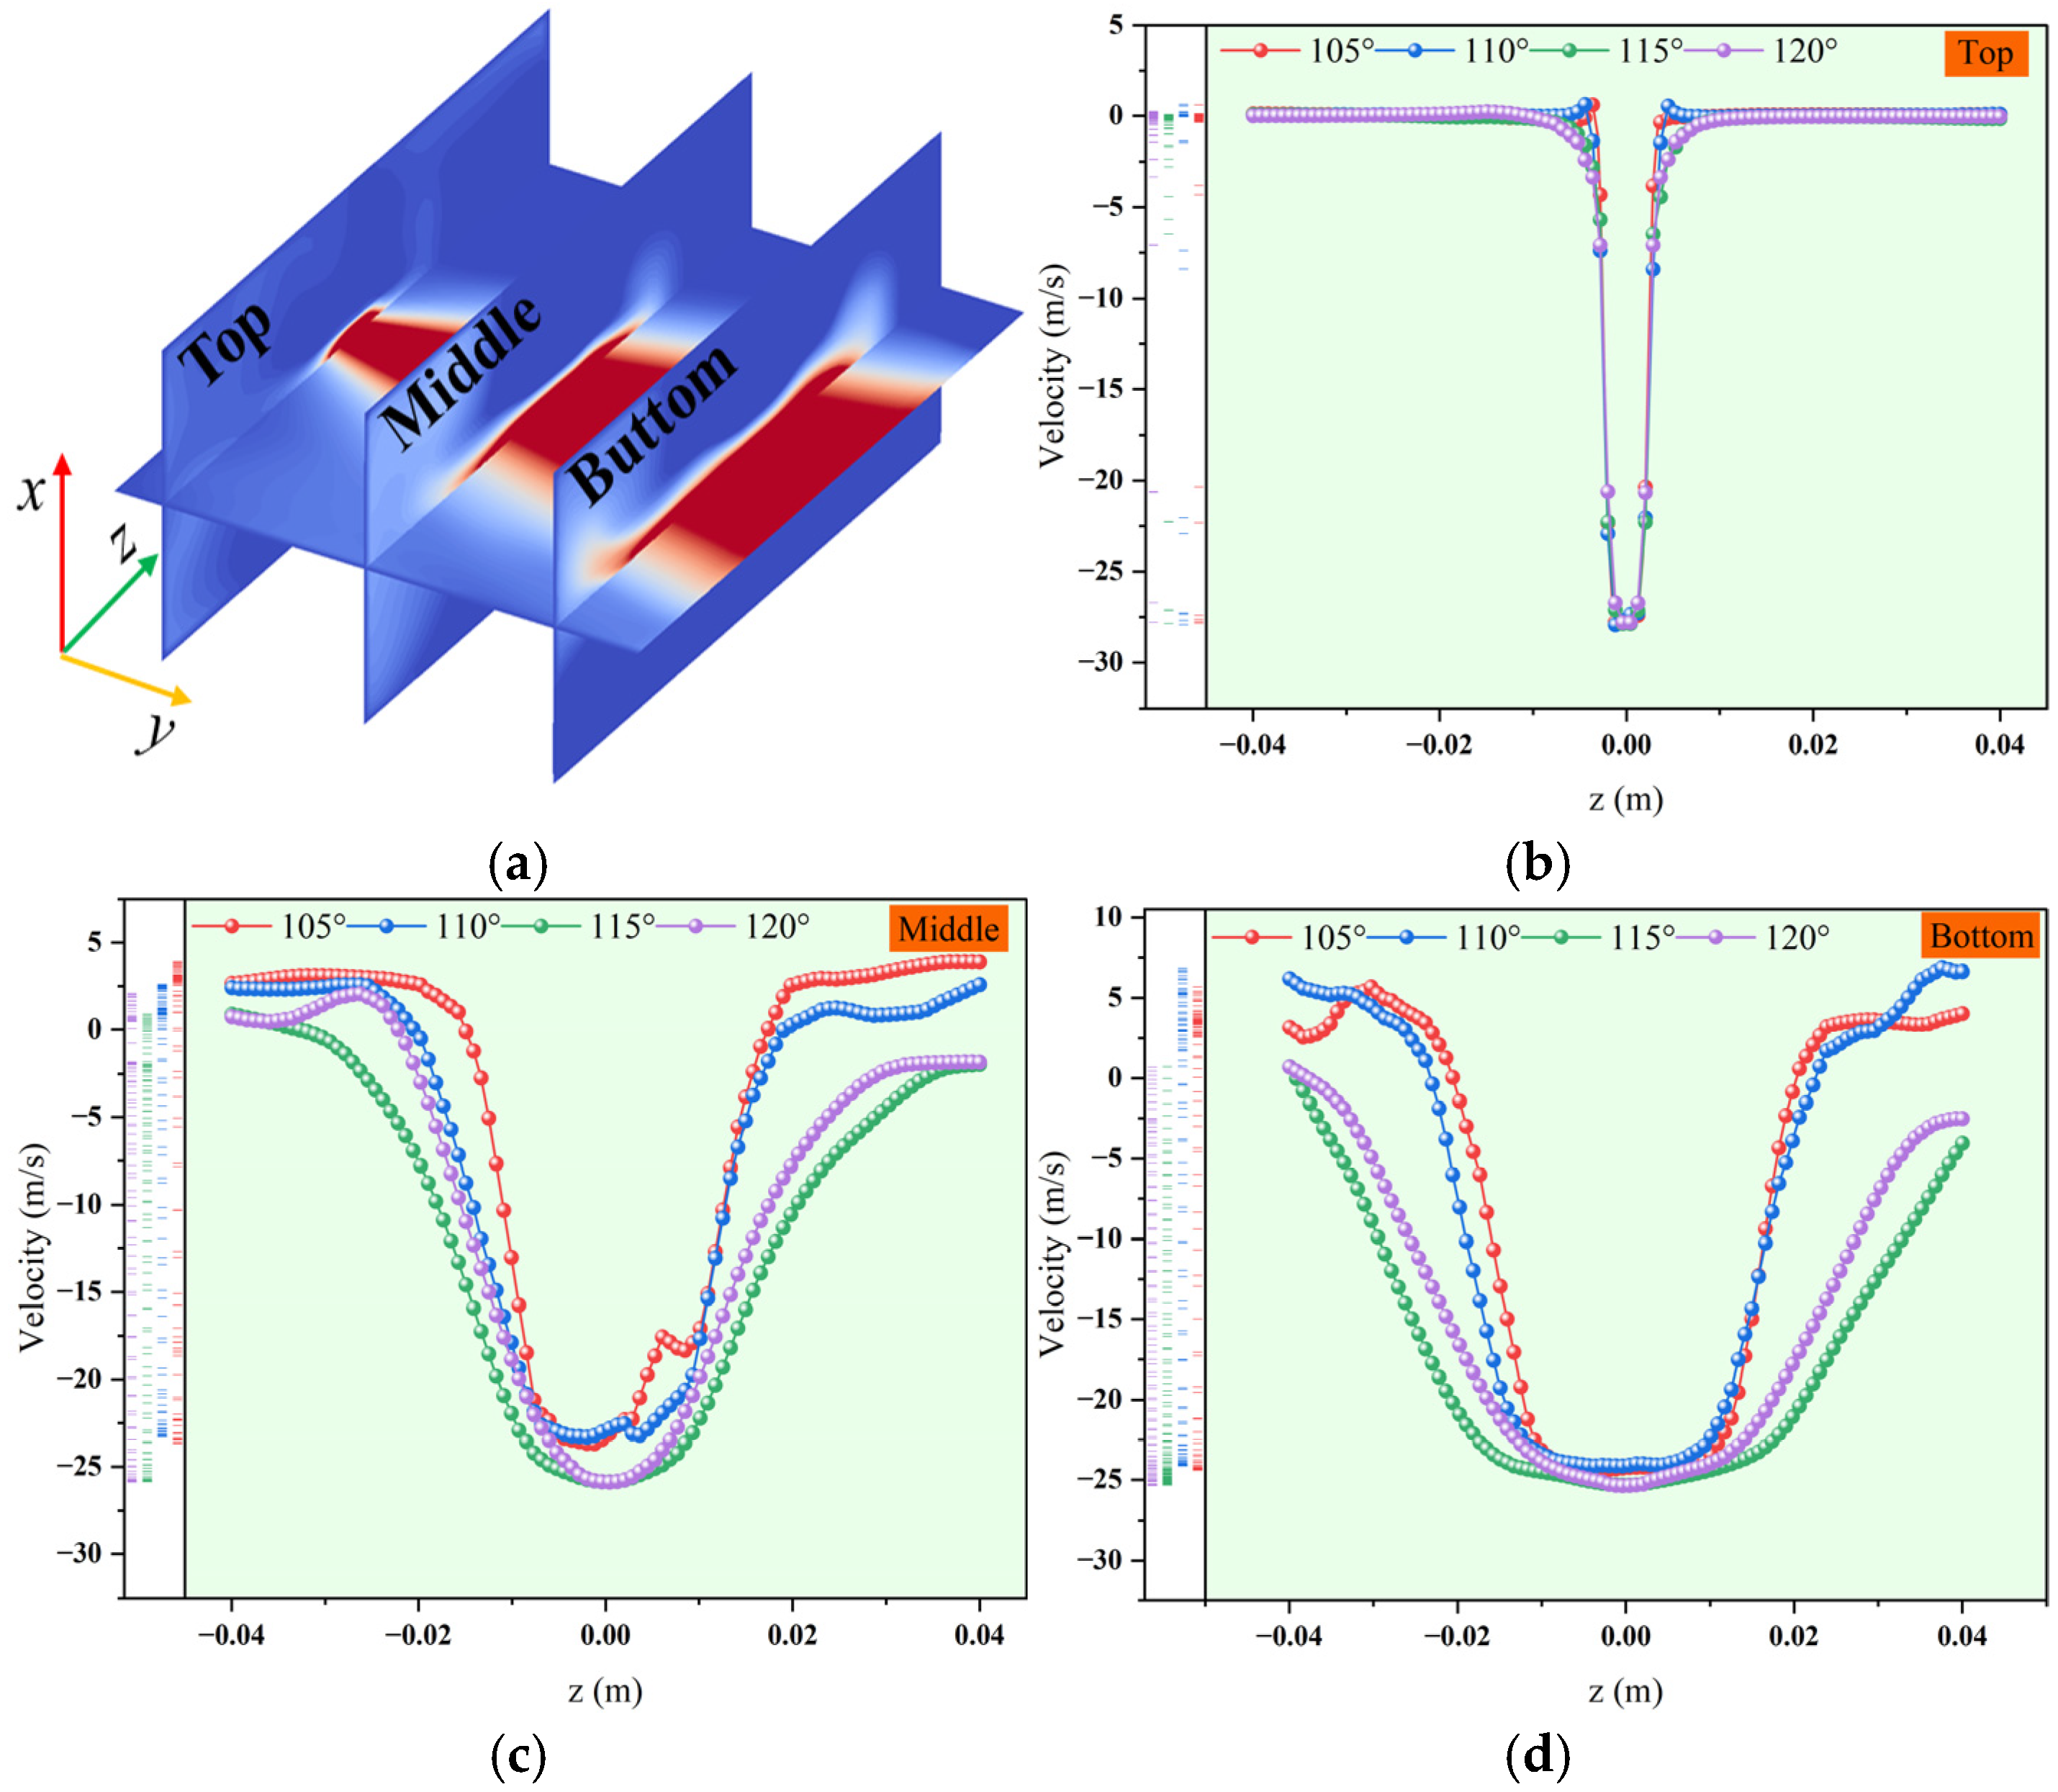
3.1. Velocity Field Analysis of Jet

The relationship between the nozzle angle and the jet velocity is analyzed when the pressure is 0.3 MPa and the diameter of the nozzle is 2 mm to study the effect of the nozzle cone angle on the jet. As depicted in Figure 2a, the interaction between the jet at the top position and the surrounding air is initially feeble, resulting in a relatively small region of high-speed jet flow. The turbulent shear between the jet and the air intensifies as the jet progresses, entraining a significant amount of air into the jet interior, increasing the mass flux across the jet cross-section. The jet undergoes a lateral expansion along the z-direction during the continuous process of mass and energy exchange with the ambient air. Notably, the jet’s expansion along the x-direction is significantly less pronounced compared to the other two directions due to the elliptical shape of the nozzle. Figure 2b illustrates the distribution of velocities at the top of velocity field. The liquid moves forward within a small range during the initial stage of the jet, leading to a concentrated velocity inside the liquid and a sharp gradient in velocity at the jet’s edge. The differentiated characteristics of the top velocity distribution become less pronounced with an increase in the nozzle opening angle. Figure 2c displays the variation in velocities in the lateral cross-section of the jet’s middle part. The disturbance to the jet structure during the air entrainment process decreases as the nozzle opening angle increases, resulting in a smoother velocity variation curve on the lateral cross-section. Velocity gradients begin to exhibit differences at the jet boundary. The velocity in the cross-section of the jet shows a clear uniform distribution near the bottom outlet (Figure 2d), and the range of uniform distribution expands to both sides as the angle of the nozzle increases. The fluid participating in mass and energy transfer increases under the entrainment effect, allowing more air to acquire the flow velocity, leading to a decrease in the velocity gradient in the velocity field. It can be observed that the jet structures under the four sets of nozzle angles exhibit two similar modes based on the velocity distribution patterns. The stability of the velocity at different lateral cross-sections is lower when the nozzle angles are set at 105° and 110°, indicating weaker mass and energy transfer between the jet and the surrounding air. Conversely, the stability of the jet structure is higher at nozzle angles of 105° and 110° with a larger influence of the entrainment effect of the jet. In the longitudinal aspect, the resistance is weak due to the alignment of the jet with the direction of gravity, resulting in minor differences in velocity.

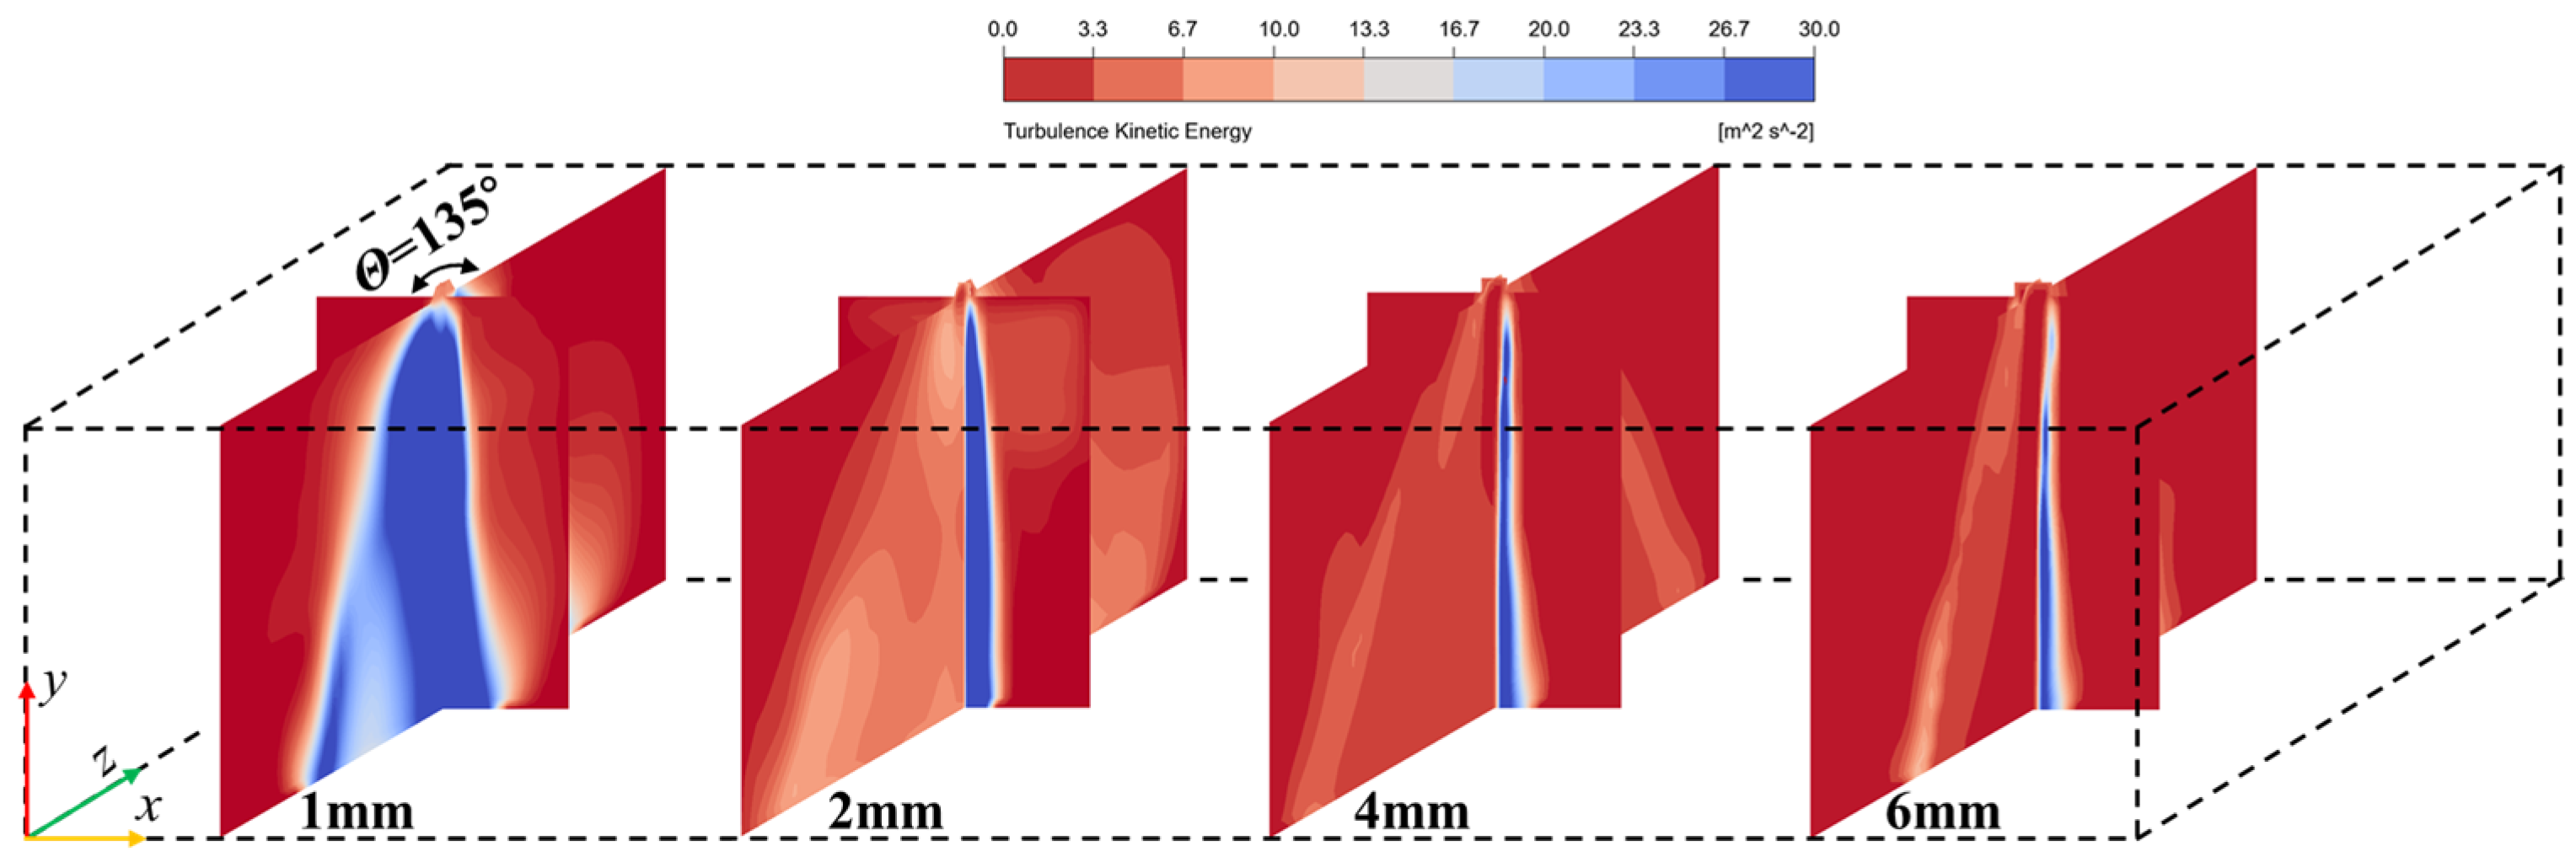
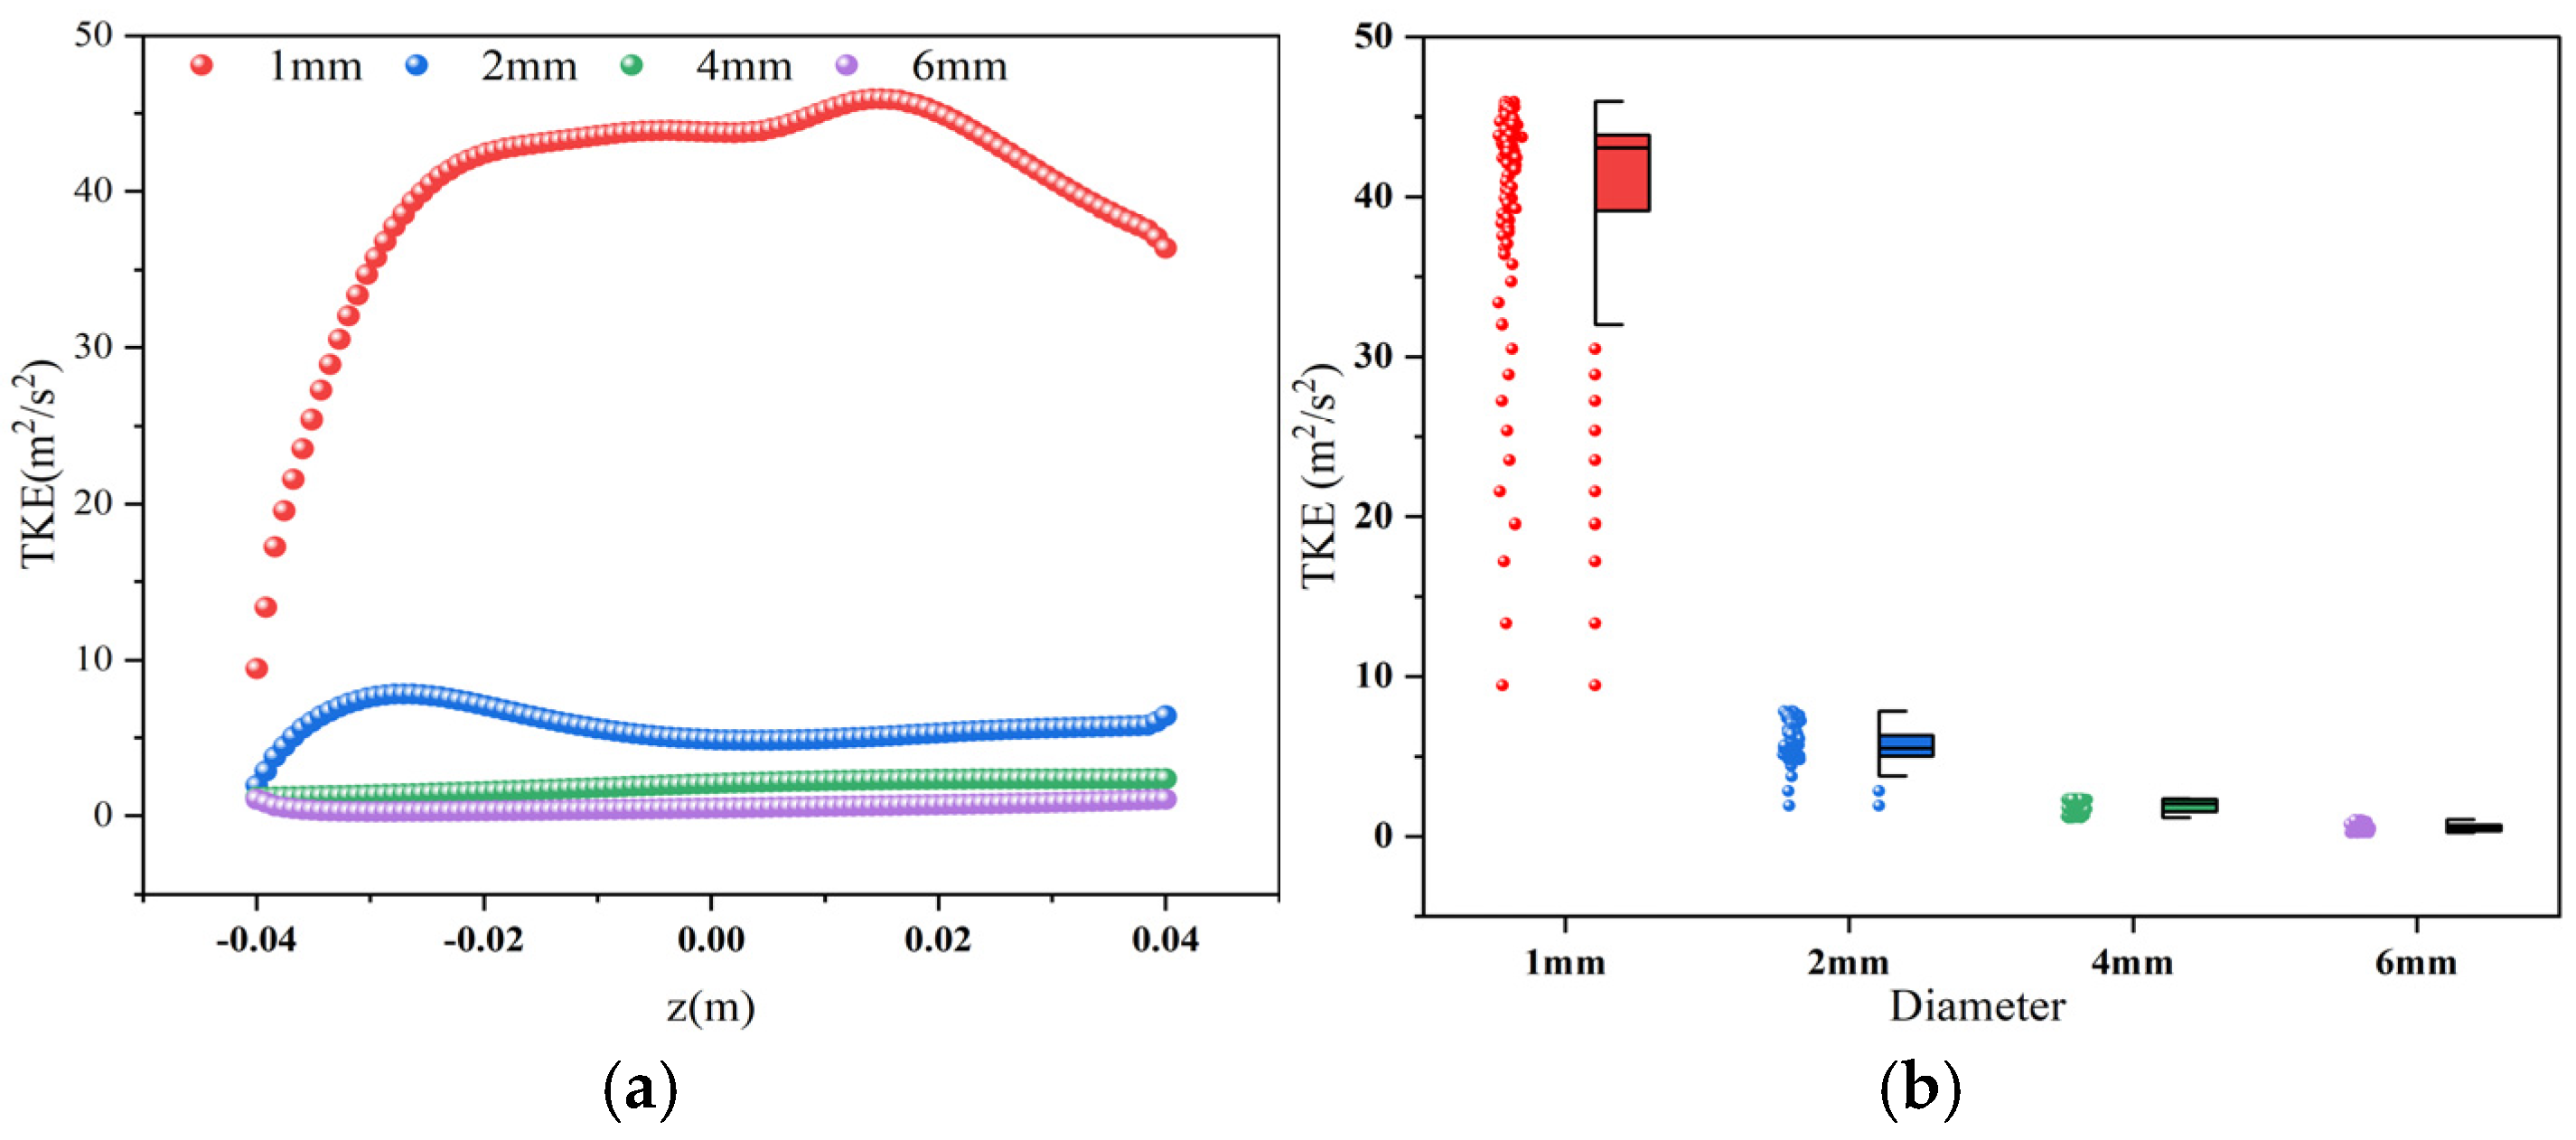
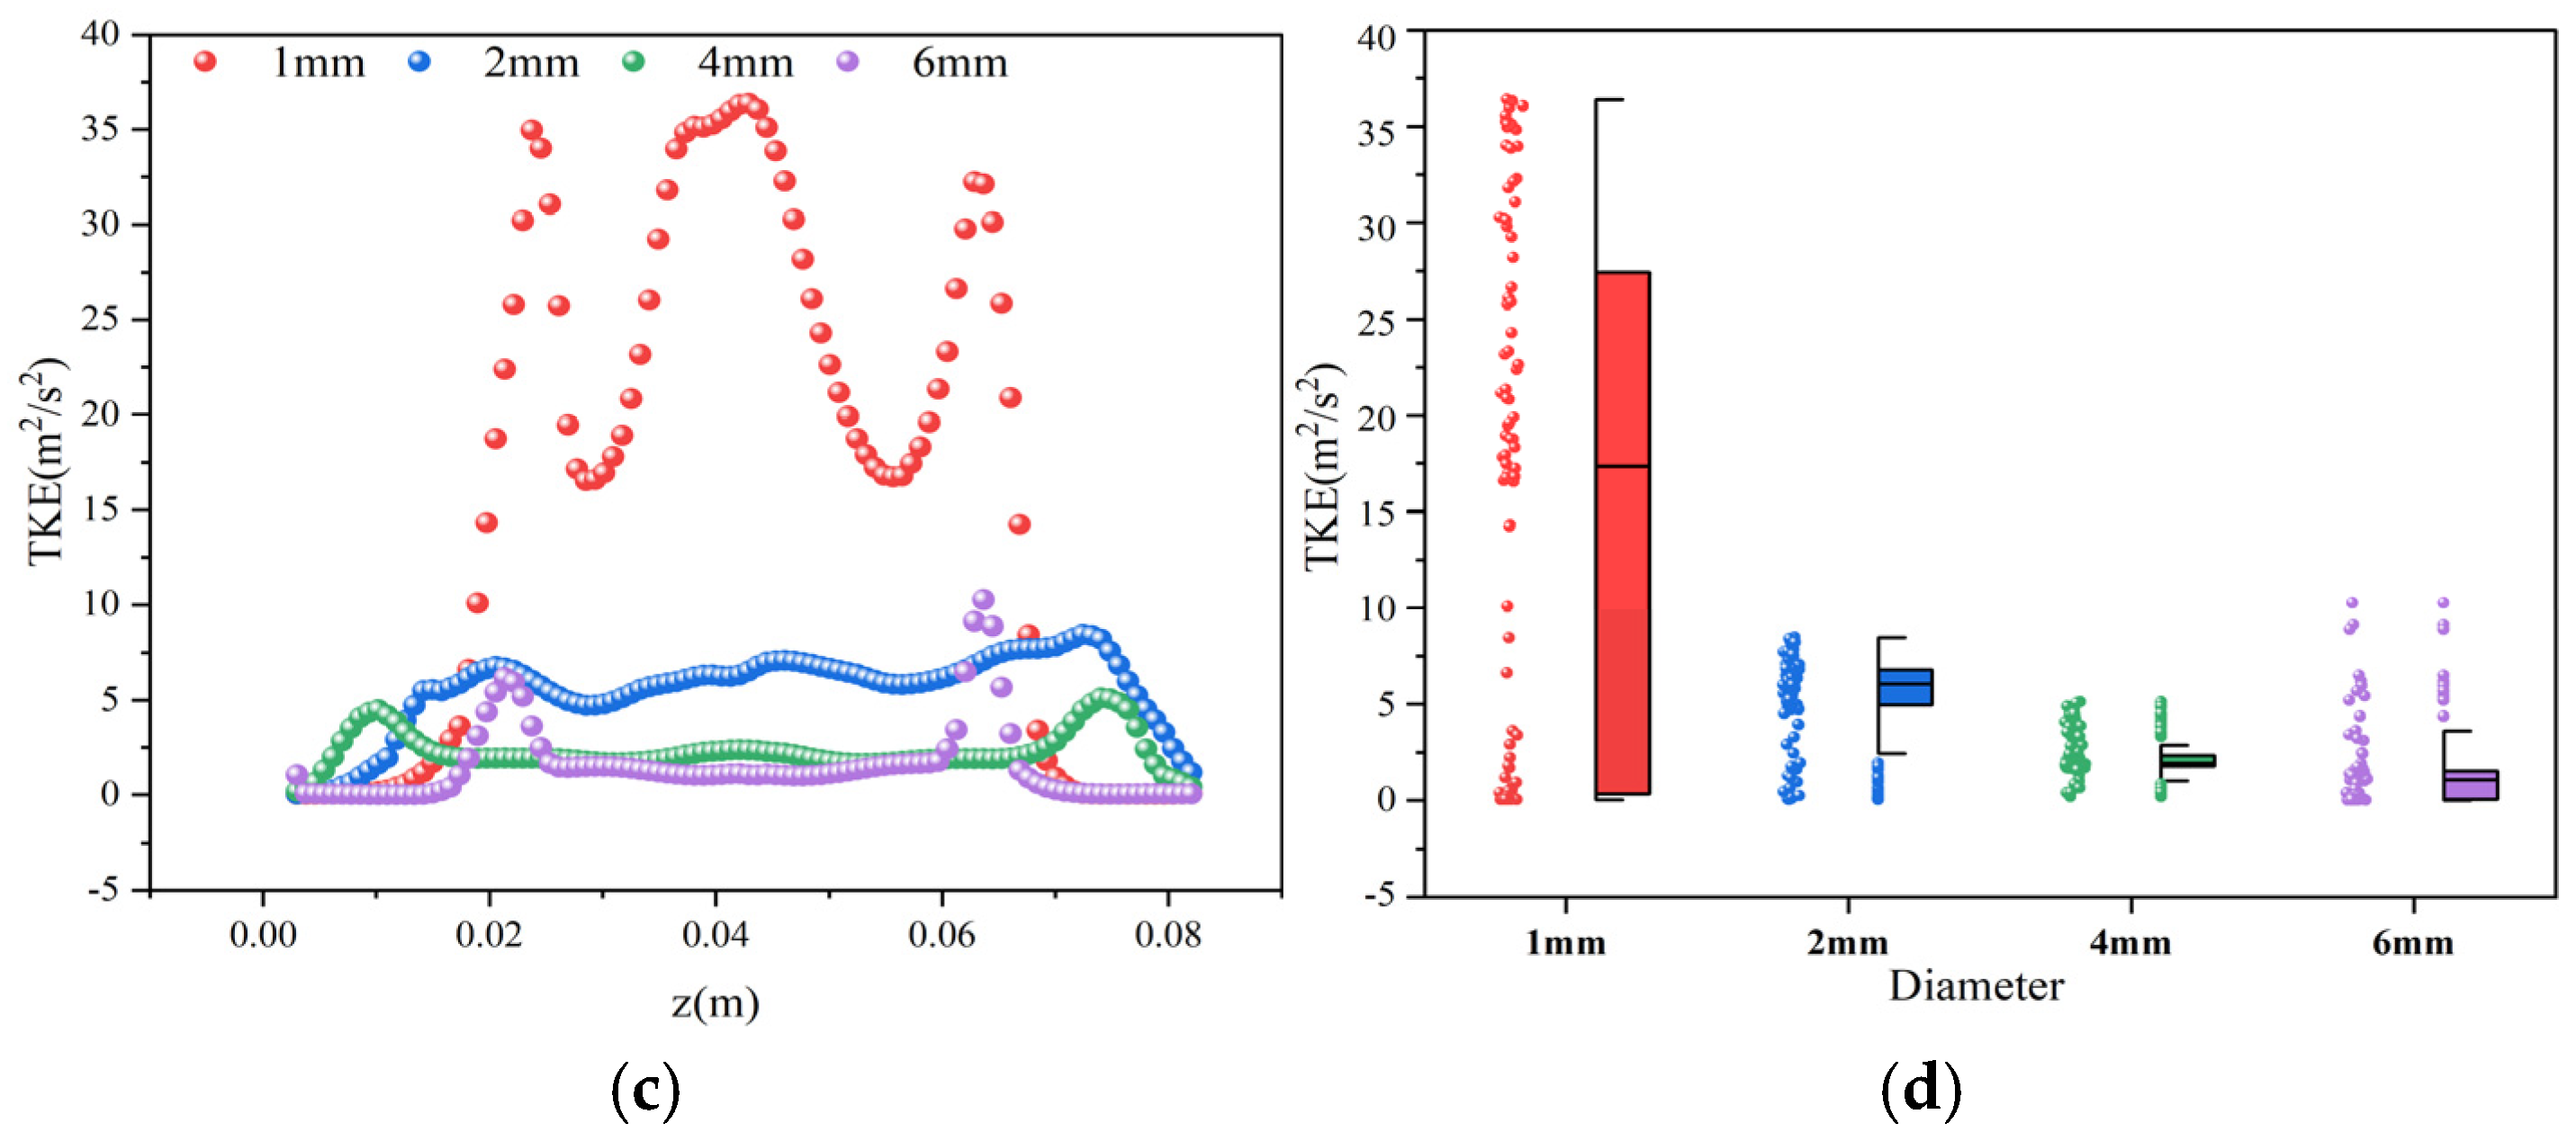
3.2. Analysis of Turbulent Kinetic Energy (TKE) in Flow Field

Figure 3 and Figure 4 show the effect of the nozzle diameter on the turbulent strength of the jet, respectively. The equation for the turbulent strength is as follows [34]:
T K E = 1 2 ( u 2 ¯ + v 2 ¯ )
where u and v represent the fluctuation velocity in the flow direction and normal direction, respectively. Figure 3 evidently shows that under a jet pressure of 0.36 MPa and a nozzle cone angle of 115°, the nozzle diameter has a significant influence on the turbulence kinetic energy (TKE) of the flow field. As the nozzle diameter increases, the intensity of shear disturbances in the flow field along the z-direction gradually declines. Both the magnitude and extent of the TKE in the flow field decrease along the x-direction, suggesting an enhanced stability of the jet outcome. However, the TKE in the flow field does not exhibit a consistent pattern of change along the central axis. Notably, the TKE is significantly higher than in the other three test conditions when the nozzle diameter is 1 mm, highlighting the intense entrainment effect on the internal flow field of the jet (as seen in Figure 4a). The degree of fluctuation in TKE data also suggests a pronounced interaction between the internal jet flow and the surrounding air when the nozzle diameter is 1 mm (Figure 4b). The TKE exhibits a distinct multi-peak structure at the jet outlet. Specifically, the flow field’s TKE displays three maxima and two minima with a 1 mm nozzle diameter, indicating relatively poor stability. Conversely, the TKE decreases significantly with a 2 mm nozzle diameter, exhibiting a peak-free and uniformly distributed pattern. When the nozzle diameters are 4 mm and 6 mm, distinct double-peak structures reappear on both sides of the flow field. The extreme values of TKE in the flow field initially decrease and then increase as the nozzle diameter increases. The range of fluctuation and the gradual change pattern of TKE data indicate that the flow fields corresponding to nozzle diameters of 2 mm and 4 mm exhibit the best stability.

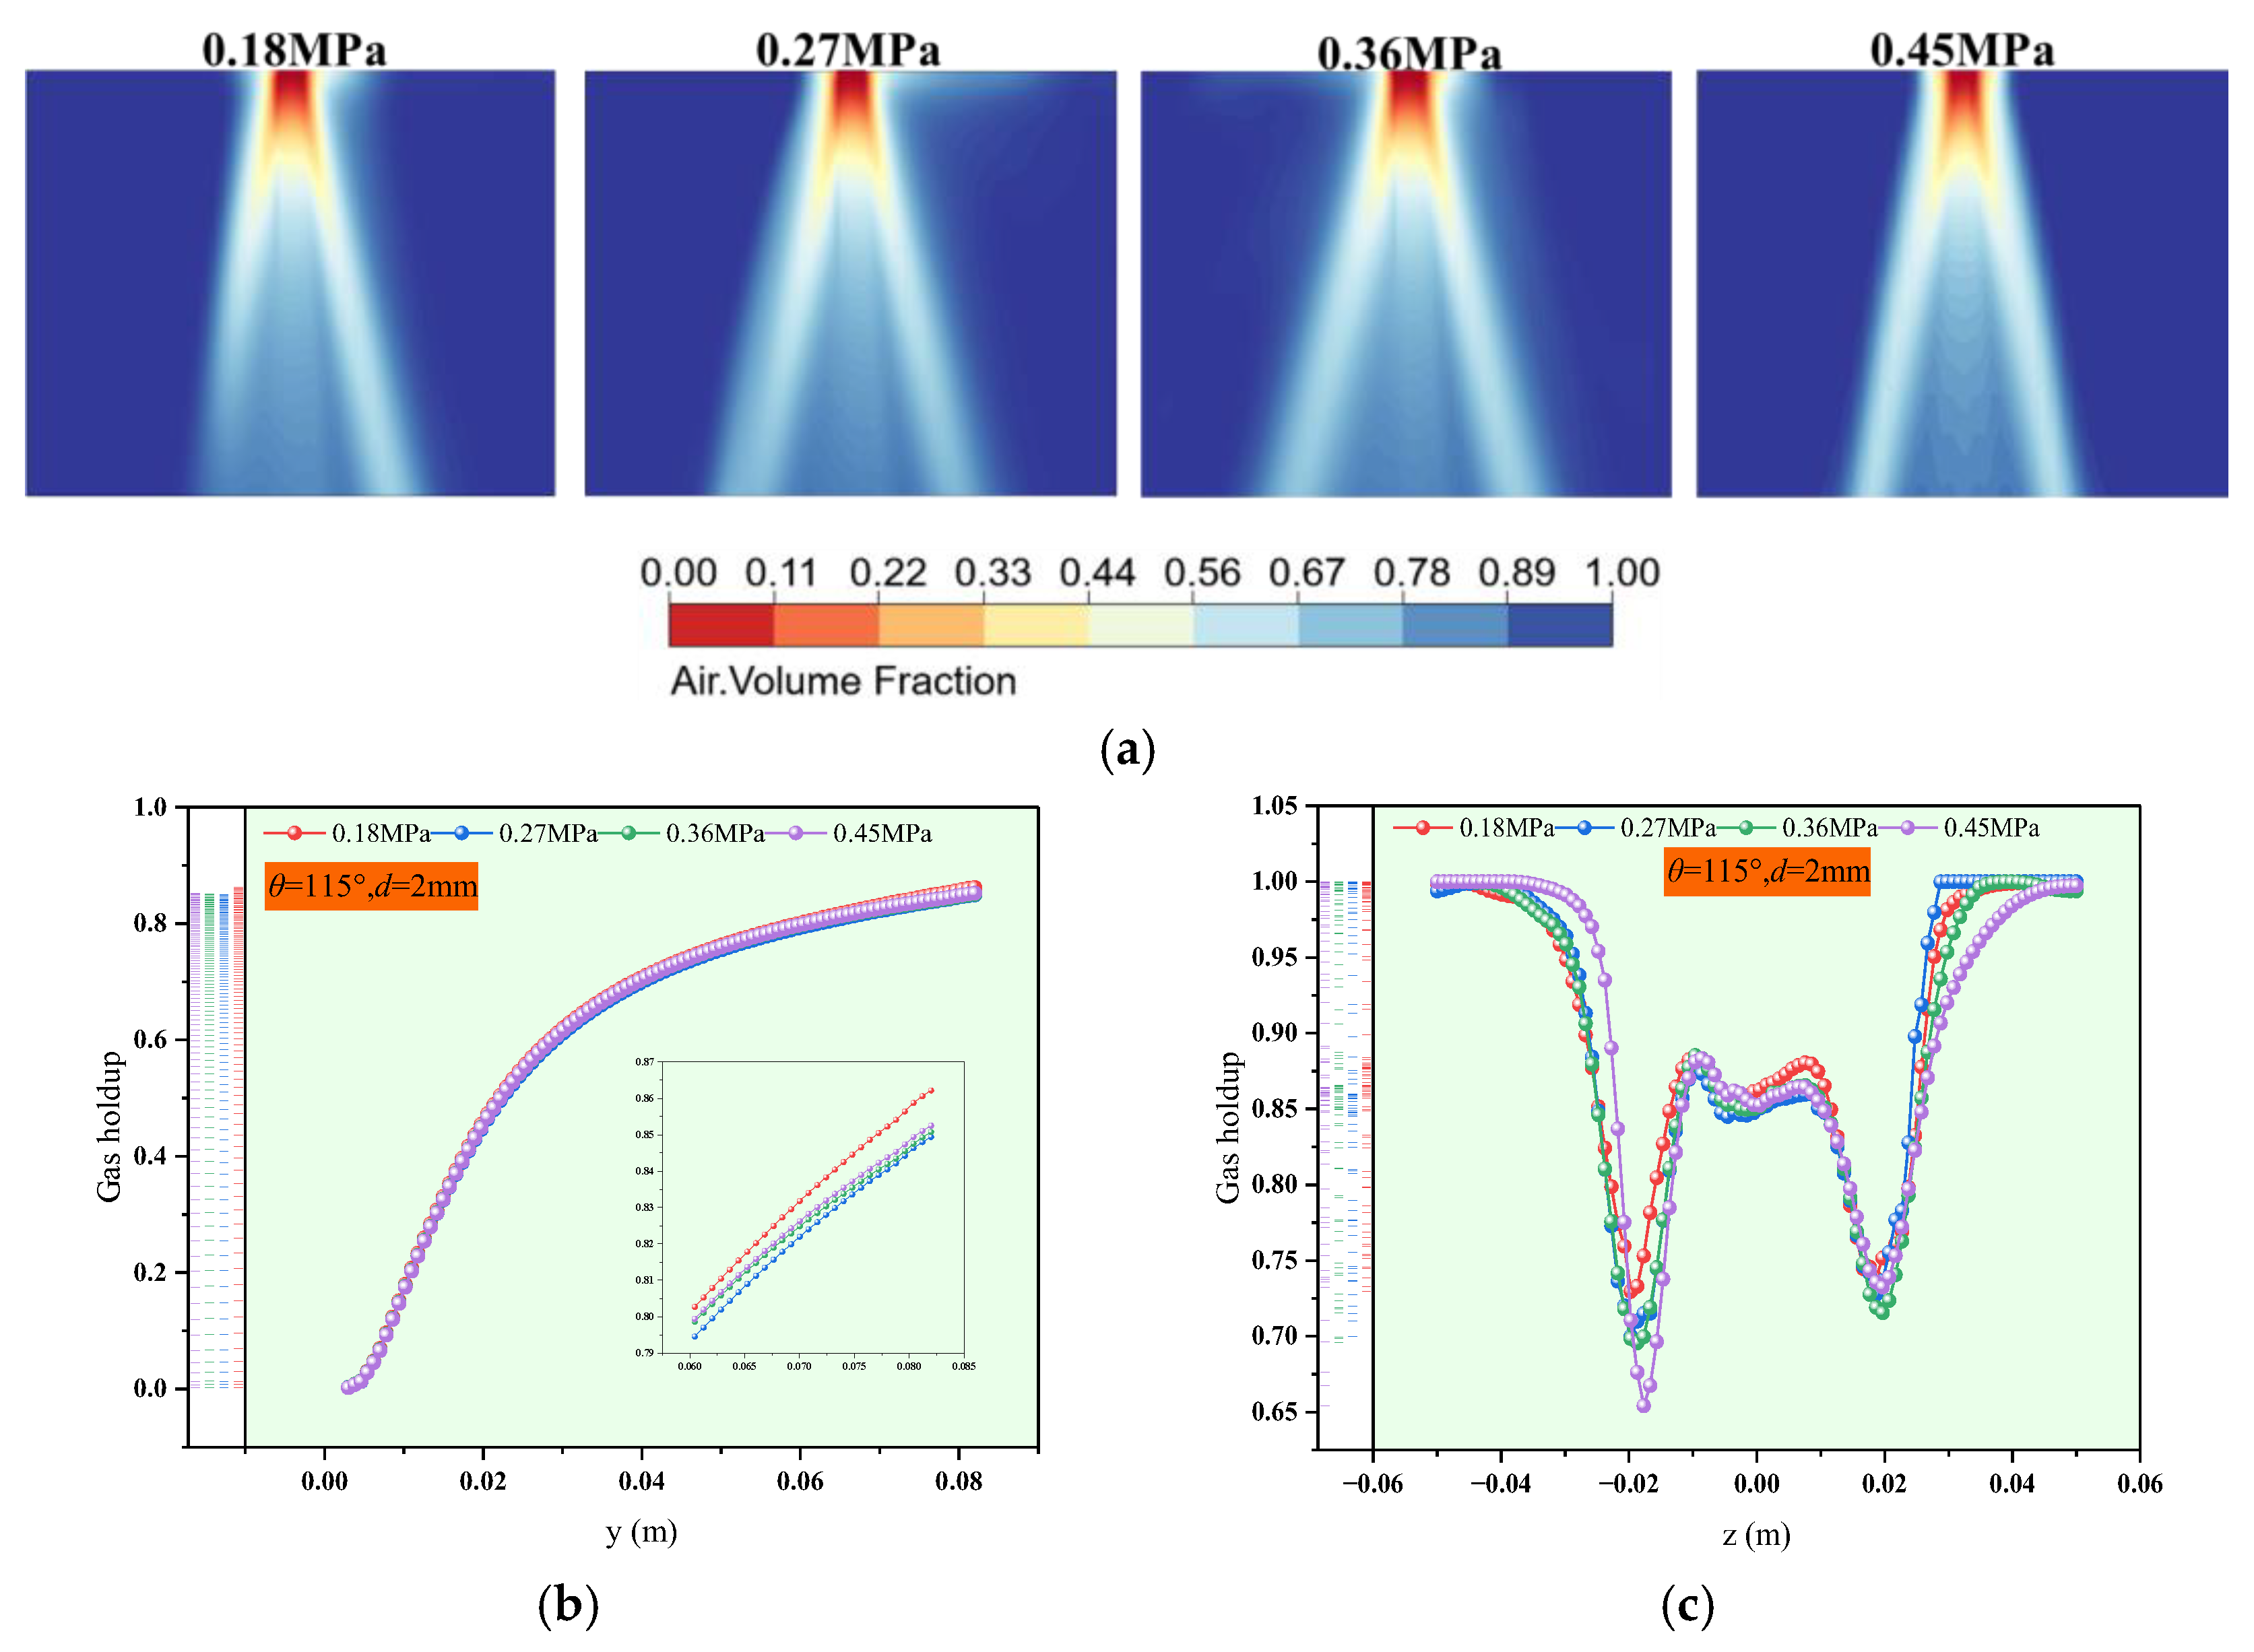
3.3. Distribution of Gas Holdup

Gas holdup is one of the basic parameters characterizing the flow characteristics of bubble plumes, which affects the aeration efficiency by affecting the contact area of two phases, gas and liquid. The gas holdup is affected by conditions such as the inlet flow rate, structural parameters, liquid phase properties and bubble size. Dong et al. [35] used experiments to study the variation law of gas–liquid hydraulic properties in non-Newtonian fluids. The results show that the gas holdup in non-Newtonian fluids is lower than that in Newtonian fluids. Besagni et al. [36] thought that the change in gas holdup is affected by the distribution of bubble size, and it is helpful to increase the gas holdup by the reasonable selection and arrangement of aeration equipment to stabilize the bubble size distribution. Xu et al. [37] increased the gas holdup in the container by 120% by changing the nozzle. When the cone angle is 115°and the nozzle diameter is 2 mm, the inlet pressure has a great influence on the gas holdup in the flow field (Figure 5a). The area with gas holdup less than 100% increases first and then decreases with the increase in inlet pressure, indicating that there is a great difference in the ability of jet entrainment. The larger the area with gas content less than 100%, the more favorable the coverage of the jet. The gas holdup variation along the central axis exhibits good similarity (Figure 5b). The gas holdup inside the jet is essentially consistent under different pressures during the initial stage of the jet. The pressure differences begin to manifest in the characteristics of gas holdup near the outlet. Specifically, the gas holdup in the jet is significantly higher than the other three sets of operating conditions when the pressure is 0.18 MPa. To further analyze the mass transfer and mixing effects of the gas–liquid two-phase flow, Figure 5c shows the variation in gas holdup at the outlet of jet field. The gas holdup generally exhibits a bimodal structure. The gas holdup is significantly lower than inside the jet at the jet–air boundary, indicating a strong entrainment effect between the gas and liquid phases within the jet. The gas holdup changes most dramatically at the gas–liquid interface when the pressure is 0.45 MPa. However, the extent of air entrainment does not show significant variations with increasing pressure, suggesting a limited lateral influence range of the jet. If the gas holdup is too high, the lateral spreading of the jet is more severe, leading to a higher degree of droplet dispersion and reducing the spraying effectiveness. The entrainment effect between the jet and air is weak when the gas holdup is too low, which impacts the spraying effectiveness. Therefore, the best spraying effectiveness is achieved at pressures of 0.27 MPa and 0.36 MPa when the cone angle is 115°and the nozzle diameter is 2 mm.

4. Discussion

Cluster analysis is a mathematical statistical method that categorizes research objects based on the information provided [38]. Its essence lies in classifying data by proximity, minimizing intra-category differences and maximizing inter-category differences. In multivariate statistical analysis, clustering can achieve dimensional reduction. The fundamental concept of hierarchical cluster analysis is to group variables based on proximity, starting with those closest in distance and progressively clustering more distant variables until each variable is appropriately assigned to a class. The cluster analysis is performed on 16 groups of sample data in this study. The basis for clustering is measured in terms of the distance between the individual samples. Each group of data can be regarded as a point in Rp (P-dimensional space), and n groups of sample data are n points in Rp. Euclidean distance should be used to measure the distance between these n points, that is, the degree of proximity. Suppose X = (X1, X2, …, XP)T and Y = (Y1, Y2, …, YP)T is a p-dimensional vector, which can be regarded as two points in the p-dimensional space. The Euclidean distance between the measurement points X and Y can be expressed as follows:
d ( x , y ) = i = 1 p ( X i Y i ) 2 0.5
In practical applications, the jet will form a certain coverage area upon reaching the water surface when the nozzle height above the water surface is 9 m (Figure 6). To optimize the nozzle parameters, the variation pattern of the cover width is studied based on cluster analysis using the operating conditions listed in Table 1. Due to duplicates in operating conditions 3, 6, and 11 in Table 1, these three conditions were merged to obtain a reorganized table of operating conditions, and the corresponding data results are shown in Table 3.
Figure 7a illustrates the distances between diameter values calculated under different operating conditions. Figure 7b displays the categorization results based on these distances. From the analysis of individual operating conditions, it can be observed that they can be classified separately into three categories when the distance between operating conditions is less than 3. The first category is the working conditions 5, 6 and 7. The second category is working conditions 2 and 4; the third category consists of conditions 8, 9, and 10. The conclusion, derived from the clustering results in Figure 7b, indicates that the jet impact ranges obtained under these three categories exhibit good internal similarity. Working condition 1, with distance values ranging between 4.43 and 15.63 from the other conditions, is separated into a distinct category.
Based on the numerical simulation results, the impact diameter of the jet obtained under working condition 1 is significantly smaller than that under other conditions, aligning with the clustering results. Working condition 3 exhibits a greater distance from the other conditions, ranging between 7.96 and 14.75. The impact diameter of the jet derived from working condition 3 is 54.8 cm, which is much larger than all other conditions. Looking at the overall clustering results, two categories can be identified: working condition 3 and the rest when the distance between clusters ranges from 7.47 to 11.37. Three categories emerge: operating conditions 3, 8, 9, and 10, and the remaining conditions when the distance between clusters falls between 5.97 and 7.47. When the distance between clusters is less than 5.97, further classification becomes overly detailed and lacks practical significance, thus avoiding excessive segmentation. Combining Table 3 with the clustering results suggests that changes in the pressure and nozzle diameter have far less impact on the jet compared to the cone angle. The optimal nozzle parameters for jet effectiveness correspond to working condition 3 according to the clustering results. In cases where the pressure supplied by the jetting device is insufficient, efforts should be made to maintain a nozzle diameter of 2 mm and a cone angle of 115°.

5. Conclusions

In the study, the effects of different initial jet pressures, cone angles, and nozzle diameters on the jet structure are investigated in the context of red tide management. The lateral distribution of jet velocity and variation characteristics of TKE and gas holdup are analyzed. The cluster analysis method is used to research the jet impact diameter. The following results can be obtained:
  • Along the lateral direction of the exit, the velocity gradient at the gas–liquid boundary flattens, and the uniformity of velocity distribution inside the jet continuously increases. When the initial pressure and nozzle diameter are constant, the lateral distribution of jet velocity exhibits two distinct changes due to the influence of cone angles (105° and 110°, 115° and 120°).
  • When the jet pressure and nozzle cone angle are constant, the peak value of turbulence kinetic energy (TKE) at the jet exit initially decreases and then increases. Along the central axis, the TKE of the flow field has no consistent change pattern. The corresponding TKE fluctuates sharply at two positions when the nozzle diameter is 1 mm, indicating an extremely unstable flow field structure.
  • Along the axial direction, the gas holdup inside the jet increases under the effect of entrainment. The gas hollows display a typical “double valley” feature in the cross-section at the jet exit. With the increase in initial pressure, the variation in gas holdup on the central axis of the jet is highly similar. The degree of entrainment at the jet outlet continuously decreases, and the entrainment range remains small.
  • When the initial pressure is 0.36 MPa, the cone angle is 115°, and the nozzle diameter is 2 mm, the obtained jet equivalent diameter has the least similarity with other operating conditions and can be classified as a separate category. Under the condition that it can effectively guide the actual jet parameter adjustment, all working conditions can be divided into two or three categories.

Author Contributions

Conceptualization, Writing—original draft, B.Z.; Data curation, Formal analysis, C.Z.; Investigation, Resources, J.L.; Software, Writing—review and editing, Validation, H.W.; Visualization, X.L.; Supervision, Funding acquisition, K.W. All authors have read and agreed to the published version of the manuscript.

Funding

This research was supported by the National Natural Science Foundation of China (Grant No. 52001196).

Institutional Review Board Statement

Not applicable.

Informed Consent Statement

Not applicable.

Data Availability Statement

The research data have been presented in the current paper.

Acknowledgments

All authors would like to express their sincere thanks to the editor and reviewers for valuable comments.

Conflicts of Interest

The authors declare no conflicts of interest.

References

  1. Li, G.; Shen, Z.; Zhou, C.; Zhang, D.; Chen, H. Investigation and application of self-resonating cavitating water jet in petroleum engineering. Petrol. Sci. Technol. 2005, 23, 1–15. [Google Scholar]
  2. Fontaine, R.; Elliott, G.; Austin, J.; Freund, J. Very near-nozzle shearlayer turbulence and jet noise. J. Fluid Mech. 2015, 770, 27–51. [Google Scholar] [CrossRef]
  3. Wang, H.; Liu, X.; Wang, K. Research on floating body resistance characteristics of floating photovoltaic and analysis of influencing factors. Front. Mar. Sci. 2024, 11, 1387564. [Google Scholar] [CrossRef]
  4. Folkes, J. Waterjet—An innovative tool for manufacturing. J. Mater. Process. Technol. 2009, 209, 6181–6189. [Google Scholar] [CrossRef]
  5. Li, G.; Huang, Z.; Tian, S.; Shen, Z. Research and application of water jet technology in well completion and stimulation in China. Petrol. Sci. 2010, 7, 239–244. [Google Scholar] [CrossRef]
  6. Chong, D.; Zhao, Q.; Yuan, F.; Wang, W.; Chen, W.; Yan, J. Research on the steam jet length with different nozzle structures. Exp. Therm. Fluid Sci. 2015, 64, 134–141. [Google Scholar] [CrossRef]
  7. Liu, Y.; Chen, X.; Zhang, J.; Feng, L.; Liu, H.; Hao, C. Structural optimization design of ice abrasive water jet nozzle based on multi-objective algorithm. Flow Meas. Instrum. 2024, 97, 102586. [Google Scholar] [CrossRef]
  8. Zhu, M.; Zhao, Q.; Chong, D.; Yan, H. Numerical investigation of nozzle length effects on Rayleigh jet breakup behaviors and droplet formation properties at different modulation amplitudes in liquid droplet radiator. Ann. Nucl. Energy 2024, 199, 110344. [Google Scholar] [CrossRef]
  9. Shen, S.; Pierreguy, A.; Zhou, A. Influence of nozzle structure on effectiveness of jet grouting operations and its optimal design. Geoenergy Sci. Eng. 2023, 226, 211788. [Google Scholar] [CrossRef]
  10. Sun, G.; Zhan, Y.; Tomio, O.; Mitsuhiro, A.; Akihiro, U.; Yasushi, O. Effects of nozzle orifice shape on jet breakup and splashing during liquid jet impact onto a horizontal plate. Exp. Therm. Fluid Sci. 2024, 151, 111095. [Google Scholar] [CrossRef]
  11. Jiang, T.; Huang, Z.; Li, J.; Zhou, Y.; Xiong, C. Experimental investigation of internal and external flow fields of jetting nozzles with different structures. J. Pet. Sci. Eng. 2022, 217, 110891. [Google Scholar] [CrossRef]
  12. Veysi, K.; Emin, E. Effect of nozzle type on local scour in water jets: An experimental study. Ocean Eng. 2023, 277, 114323. [Google Scholar]
  13. Matheus, R.; Lydia, A.; Udo, F. Effect of Y-jet nozzle geometry and operating conditions on spray characteristics and atomizer efficiency. Int. J. Multiph. Flow 2023, 168, 104585. [Google Scholar]
  14. Zhang, J.; Liang, P.; Liu, Y. Impingement and breakup characteristics of free opposed impinging jets with unequal nozzle diameter. Exp. Therm. Fluid Sci. 2023, 145, 110884. [Google Scholar] [CrossRef]
  15. Yang, T.; Sun, Y.; Xu, L.; Xi, L.; Gao, J.; Li, Y. Comparative study on flow and heat transfer characteristics of swirling impingement jet issuing from different nozzles. Int. J. Therm. Sci. 2023, 184, 107914. [Google Scholar] [CrossRef]
  16. Li, Z.; Leng, J.; Nidal, H.; Abu, H.; Abdullah, M.; Abusorrah, A. Effect of nozzle types on mass diffusion mechanism of hydrogen multi-jets at supersonic combustion chamber. Int. Commun. Heat Mass Transf. 2022, 139, 106509. [Google Scholar] [CrossRef]
  17. Liao, H.; Jia, X.; Niu, J.; Shi, Y.; Gu, H.; Xu, J. Flow structure and rock-breaking feature of the self-rotating nozzle for radial jet drilling. J. Phys. Sci. 2020, 17, 211–221. [Google Scholar] [CrossRef]
  18. Lu, Y.; Xiao, S.; Ge, Z.; Zhou, Z.; Ling, Y.; Wang, L. Experimental study on rock-breaking performance of water jets generated by self-rotatory bit and rock failure mechanism. Powder Technol. 2019, 346, 203–216. [Google Scholar] [CrossRef]
  19. Jiang, T.; Huang, Z.; Li, J. Effect of parameters on threshold pressure of sandstone tested by water jet. Int. J. Rock Mech. Min. Sci. 2021, 139, 104640. [Google Scholar] [CrossRef]
  20. Chi, H.; Li, G.; Liao, H.; Tian, S.; Song, X. Effects of parameters of self-propelled multi-orifice nozzle on drilling capability of water jet drilling technology. Int. J. Rock Mech. Min. Sci. 2016, 86, 23–28. [Google Scholar] [CrossRef]
  21. Song, X.; Lv, Z.; Li, G.; Hu, X.; Shi, Y. Numerical analysis of characteristics of multi-orifice nozzle hydrothermal jet impact flow field and heat transfer. J. Nat. Gas Sci. Eng. 2016, 35, 79–88. [Google Scholar] [CrossRef]
  22. Song, X.; Xu, Z.; Wang, M.; Li, G.; Shah, S.; Pang, Z. Experimental study on the wellbore-cleaning efficiency of microhole-horizontal-well drilling. SPE J. 2017, 22, 1189–1200. [Google Scholar] [CrossRef]
  23. Jiang, T.; Huang, Z.; Li, J.; Zhou, Y. Internal flow mechanism of conestraight nozzle. Petrol. Sci. 2021, 18, 1507–1519. [Google Scholar] [CrossRef]
  24. Pan, X.; Jiang, Y.; Li, H.; Hui, X.; Xing, S.; Junaid, N. Numerical simulation and experimental study of jet breakup using a water dispersal needle in irrigation sprinklers. Biosyst. Eng. 2024, 239, 49–67. [Google Scholar] [CrossRef]
  25. Chen, J.; Guo, L.; Hu, Y.; Chen, Y. Internal structure of a jet nozzle for coalbed methane mining based on airfoil curves. Shock Vib. 2018, 2018, 3840834. [Google Scholar] [CrossRef]
  26. Liang, Q.; Gao, G.; Liu, Q. Analysis of the influence of nozzle profile on nozzle energy loss based on CFD. Min. Mach. 2014, 42, 94–98. [Google Scholar]
  27. Chen, Y.; Zhao, L.; Zhou, A.; Shen, S. Evaluation of environmental impact of red tide around Pearl River Estuary, Guangdong, China. Mar. Environ. Res. 2023, 185, 105892. [Google Scholar] [CrossRef]
  28. Yu, Z.; Song, X.; Cao, X.; Liu, Y. Mitigation of harmful algal blooms using modified clays: Theory, mechanisms, and applications. Harmful Algae 2017, 69, 48–64. [Google Scholar] [CrossRef]
  29. Pan, Y.; Geng, Z.C.; Yuan, H.; Zhai, S.Y.; Huo, F.L. Numerical Simulation and Flow Field Analysis of Porous Water Jet Nozzle Based on Fluent. Appl. Sci. 2024, 14, 7075. [Google Scholar] [CrossRef]
  30. Lin, Y.F.; Wang, X.Q.; Tang, J.R. Dynamic Simulation Model and Performance Optimization of a Pressurized Pulsed Water Jet Device. Appl. Sci. 2024, 14, 6788. [Google Scholar] [CrossRef]
  31. Wang, H.; Wang, K.; Liu, X. Evaluation of damage performance in offshore floating photovoltaics-based hydrogen production system due to potential hydrogen release. Front. Mar. Sci. 2024, 11, 1413678. [Google Scholar] [CrossRef]
  32. Georgiadis, N.J.; Rumsey, C.L.; Yoder, D.A.; Zaman, K.B. Turbulence modeling effects on calculation of lobed nozzle flowfields. J. Propuls. Power 2006, 22, 567–575. [Google Scholar] [CrossRef]
  33. Mishra, A.A.; Mukhopadhaya, J.; Iaccarino, G.; Alonso, J. Uncertainty estimation module for turbulence model predictions in SU2. AIAA J. 2019, 57, 1066–1077. [Google Scholar] [CrossRef]
  34. Nie, B.; Wang, H.; Li, L.; Zhang, J.; Yang, H.; Liu, Z.; Wang, L.; Li, H. Numerical investigation of the flow field inside and outside high-pressure abrasive waterjet nozzle. Procedia Eng. 2011, 26, 48–55. [Google Scholar]
  35. Dong, X.; Liu, Z.; Liu, F. Effect of liquid phase rheology and gas-liquid interface property on mass transfer characteristics in bubble columns. Chem. Eng. Res. Des. 2019, 142, 25–33. [Google Scholar] [CrossRef]
  36. Besagni, G.; Pasquali, A.; Gallazzini, L. The effect of aspect ratio in counter-current gas-liquid bubble columns: Experimental results and gas holdup correlations. Int. J. Multiph. Flow 2017, 94, 53–78. [Google Scholar] [CrossRef]
  37. Xu, X.; Wang, J.; Yang, Q. Bubble size fractal dimension, gas holdup, and mass transfer in a bubble column with dual internals. Chin. J. Chem. Eng. 2020, 28, 2968–2976. [Google Scholar] [CrossRef]
  38. Chang, S.; Liu, j.; Cui, K. A cluster analysis-based shock wave pattern recognition method for two-dimensional inviscid compressible flows. J. Comput. Phys. 2024, 506, 112946. [Google Scholar] [CrossRef]
Figure 1. The physical model of numerical simulation of figure.
Applsci 14 09098 g001
Figure 2. (a) Flow velocity profile of the jet; (b) the transverse distribution of the velocity at the top position of the jet; (c) the transverse distribution of flow velocity at the middle position of the jet; (d) the transverse distribution of flow velocity at the bottom position of the jet.
Applsci 14 09098 g002
Figure 3. Turbulent kinetic energy (TKE) clouds under the condition of four different nozzle diameters.
Applsci 14 09098 g003
Figure 4. (a,c) are the turbulent kinetic energy at the central axis and exit, respectively; (b,d) show the distribution of turbulent kinetic energy data at the central axis and exit, respectively.
Applsci 14 09098 g004aApplsci 14 09098 g004b
Figure 5. (a) Gas holdup distribution under different injection pressure conditions; (b) the distribution of gas holdup at the central axis of the jet; (c) the horizontal distribution of the gas holdup at the outlet of the jet field.
Applsci 14 09098 g005
Figure 6. High-pressure jet schematic for red tide control.
Applsci 14 09098 g006
Figure 7. (a) Hotspot map of cluster distance distribution; (b) spectrum graph clustering results.
Applsci 14 09098 g007
Table 1. Working condition table.
No.Initial Jet Flow Pressure (p/MPa)Cone Angle
(θ)
Nozzle Diameter (d/mm)
10.36105°2
20.36110°2
30.36115°2
40.36120°2
50.36115°1
60.36115°2
70.36115°4
80.36115°6
90.18115°2
100.27115°2
110.36115°2
120.48115°2
Table 2. Parameter values for the grid independence test.
No.Size of Grid
(mm)
The Maximum Velocity
(m/s)
10.4022.56
20.2023.78
30.1024.41
40.0524.48
Table 3. Numerical simulation results of equivalent diameters under different jet parameters.
No.Initial Jet Flow Pressure (p/MPa)Cone Angle
(θ)
Nozzle Diameter (d/mm)Equivalent Diameters
(d/mm)
10.36105°239.3
20.36110°245.1
30.36115°254.8
40.36120°246.9
50.36115°141.2
60.36115°442.8
70.36115°640.6
80.18115°246.7
90.27115°249.1
100.48115°247.1
Disclaimer/Publisher’s Note: The statements, opinions and data contained in all publications are solely those of the individual author(s) and contributor(s) and not of MDPI and/or the editor(s). MDPI and/or the editor(s) disclaim responsibility for any injury to people or property resulting from any ideas, methods, instructions or products referred to in the content.

