Article

Thermal Runaway Diagnosis of Lithium-Ion Cells Using Data-Driven Method

Department of Radio and Information Communications Engineering, Chungnam National University, Daejeon 34134, Republic of Korea
*
Author to whom correspondence should be addressed.
Appl. Sci. 2024, 14(19), 9107; https://doi.org/10.3390/app14199107
Submission received: 10 September 2024 / Revised: 27 September 2024 / Accepted: 2 October 2024 / Published: 9 October 2024
(This article belongs to the Section Computing and Artificial Intelligence)

Abstract

:
Fault diagnosis is crucial to guarantee safe operation and extend the operating time while preventing the thermal runaway of the lithium-ion battery. This study presents a data-driven thermal runaway diagnosis framework where Bayesian optimization techniques are applied to optimize the hyperparameter of various machine learning techniques. We use different machine learning models such as support vector machine, naive Bayes, decision tree ensemble, and multi-layer perceptron to estimate a high likelihood of causes of thermal runaway by using the experimental measurements of open-source battery failure data. We analyze different evaluation metrics, including the prediction accuracy, confusion metrics, and receiver operating characteristic curves of different models. An experimental evaluation shows that the classification accuracy of the decision tree ensemble outperforms that of other models. Furthermore, the decision tree ensemble provides robust prediction accuracy even with the strictly limited dataset.

1. Introduction

The lithium-ion battery (LIB) has become the essential energy storage solution across various applications, including transportation, electric grid, and consumer electronics, since it has considerably improved efficiency and reduced costs over the past decade [1,2,3]. However, battery failures cause serious problems such as explosion and fire accidents in aircraft, robots, and smartphones [4,5,6].
Mechanical, electrical, thermal, and electrochemical abuse are the critical factors that trigger and cause severe battery failure. Thermal runaway is an uncontrollable chemical process within a battery cell that causes a catastrophic fire. Chain reactions can occur between heat, temperature, and chemical reactions if a battery exceeds specific temperature thresholds [7]. This is especially dangerous for cylindrical cells that could explode due to their pressure build-up design. Conventional approaches have developed the thermal runaway prediction model based on the internal mechanism of Li-ion cells to support early warning [8,9]. However, the behaviors of Li-ion cells depend on various factors, including the manufacturer and model during thermal runaway [10]. Furthermore, repeatedly tested identical cells under the same abuse conditions still show considerably different heat output and temperatures [11]. Thus, deterministic analytical models are insufficient for capturing the complicated behaviors of cells undergoing failure, even for the same cell.
Most previous works on machine learning (ML) techniques focus on lifetime predictions [12,13] and the development of optimal charging protocols for LIB cells [14,15]. Although some ML models are developed for fault diagnosis, most works consider the system level rather than the cell level of LIBs [4]. Recent research combines the ML model with varying levels of simulation model complexity to investigate the vast parameter spaces in abuse testing [16,17]. However, the experimental validation of these models is costly and complex, making the validation process especially challenging.
We use different ML techniques to estimate the most likely cause of the thermal runaway by using the experimental measurements of open-source battery failure data [18]. Bayesian optimization techniques are applied to optimize the hyperparameter of various ML techniques such as support vector machine (SVM), naive Bayes (NB), decision tree ensemble (DTE), and multi-layer perceptron (MLP) models. We analyze different evaluation metrics, including prediction accuracy, confusion metrics, receiver operating characteristic (ROC) curves, and the feature importance of ML models.

2. Open Battery Failure Dataset

The fractional thermal runaway calorimeter (FTRC) aims to quantify the heat and mass released from the battery cell during the thermal runaway [19]. In [18], they conduct extensive experiments and build a large open-source database of battery failure incidents for different commercial cell types and causes. This rich set of experimental data using different cell manufacturers and abuse types provides a valuable benchmark.
In [18], the thermal runaway of each cell was triggered using three different abuse methods, namely, “Heat”, “ISC”, and “Nail”.
  • Heat: Heat is applied to the battery cell until it reaches thermal runaway.
  • ISC: One of the latent defects in cell electrodes is an internal short-circuiting (ISC) device [20]. It can trigger thermal runaway at specific locations within the cell if the temperature reaches about 57 °C, much lower than that of the Heat abuse method.
  • Nail: The pneumatically activated nail of FTRC penetrates 9 mm of the cell body.
Table 1 summarizes the measured features and the causes of the open-source battery failure databset [18]. The dataset includes the heat and mass ejected data using FTRC from 364 tests on various batteries. Abuse tests use different cylindrical battery models with cell formats such as 18,650 and 21,700 from multiple manufacturers. Each sample of the abuse test consists of 26 measured features and 1 output label of causes. By considering the ejected location within the cell, most heat and mass measurements using FTRC can be categorized into three distinct groups, namely, (1) positive, (2) body, and (3) negative. In addition, the released energy is computed based on the fractional heat output. This dataset offers insights into the heat, mass, and energy changes in each cell under different abuse tests.

3. Data-Driven Thermal Runaway Diagnosis

Figure 1 shows the thermal runaway diagnosis framework using different ML techniques. We use SVM, NB, DTE, and MLP models to estimate three causes of thermal runaway, namely, Heat, ISC, and Nail as the fault diagnosis of lithium-ion cells. Most previous works of thermal runaway prediction focus on the model development of early warning to prevent battery failure rather than the thermal runaway diagnosis [8,9]. We use the Bayesian algorithm to optimize the hyperparameter of different models. The Bayesian optimization algorithm aims to minimize the cross-validation loss for the given hyperparameter set in a bounded domain of each model [21]. We use 10-fold cross-validation to determine how effectively each ML model generalizes.

3.1. Support Vector Machine

SVM is a conventional ML technique that finds the hyperplane to maximize the margin between different classes [22]. The eligible hyperparameters of SVMs to optimize are box constraint, strategy, kernel function, feature scale, and polynomial order related to the hyperplane.
Table 2 shows the range of these hyperparameters and selected values obtained by Bayesian optimization. A box constraint regulates the maximum penalty for violating data points of the margin to avoid overfitting. Increasing the box constraint reduces the number of hyperplanes at the cost of the training times. Two common strategies to apply binary classification algorithms for multi-classification problems are the one-vs-rest (OvR) and one-vs-one (OvO) schemes [22]. OvR divides a multi-class problem into one binary problem per class, while OvO converts it into binary problems per each pair of classes. Thus, for the given total number of unique class labels K, the number of binary learners of OvR is K, while the one of OvO is K ( K 1 ) 2 , where it exhausts all combinations of class pair assignments.
The Gram matrix is computed using the kernel function in Lagrange dual formulation for nonlinear SVM model [22]. The kernel trick essentially generates the Gram matrix G ( x i , x j ) instead of the inner product of the features ( x i x j ) , where x i , x j R p represent the vectors of samples i and j. We use different kernel functions: linear, Gaussian, and polynomial. The feature matrix is divided by the feature scaling parameter for computing the Gram matrix. In addition, the polynomial order is the order of the polynomial kernel function.

3.2. Naive Bayes

Naive Bayes classifier relies on the probability density estimation technique of input features of a given class, which naively assumes that the features are conditionally independent [23]. Since this assumption allows us to individually estimate the univariate class-conditional probability density function of each feature, it considerably reduces the complexity of the training process and the amount of training data required compared to other classifiers. The class-conditional independence assumption performs well in practice, even when the one is not generally valid.
The naive Bayes classifier applies a kernel density estimation (KDE) method to the training dataset of each class. A non-parametric estimation technique of KDE uses a kernel distribution characterized by a kernel function and its bandwidth parameter to regulate the smoothness of the resulting probability density function. Thus, the eligible hyperparameters to optimize are kernel smoothing functions and their bandwidth. We consider different kernel smoothing functions of Gaussian, uniform, parabolic, and triangle functions with a bandwidth in the range of [ 0 , 100 ] . Bayesian optimization algorithm picks the Gaussian smoothing function and 0.873 as the bandwidth.

3.3. Decision Tree Ensemble

A classifier ensemble combines multiple classification models to enhance the prediction accuracy and generalization compared to a single classifier [24]. We use the decision tree as the weak classification model where the standard CART algorithm [25,26] is used to build trees.
We use the adaptive boosting aggregation method, which sequentially trains learners as the classifier ensemble [27]. The algorithm calculates the weighted pseudo-loss of each classifier t over N samples and K classes:
ϵ t = 1 2 i = 1 N k y i d i , k t ( 1 h t ( x i , y i ) + h t ( x i , k ) )
where y i { 1 , , K } is the class label of sample i, h t ( x i , k ) is the confidence probability of classifier obtained by model t to class k of sample i, and d i , k t is the weight of classifier t to class k of sample i. Note that the second part of the sum is over all erroneous classes k y i .
It essentially increases and decreases weights for misclassified samples and correctly classified samples, respectively, by classifier t. The data are then used to train the next classifier t + 1 using the updated weights d i , k t + 1 . The decision trees use the pseudo-loss as a metric of classification accuracy. After training finishes, it uses the weighted combination of the multiple models to estimate the class of new sample x :
h f i n ( x ) = arg max k K t = 1 T η α t h t ( x , k )
where η is the learning rate and α t = log 1 ϵ t ϵ t are weights of the classifier within the ensemble.
Table 3 summarizes the hyperparameter to optimize for the aggregation method and decision tree model. We adapt the number of ensemble learning cycles where we train one weak tree learner at every learning cycle. Furthermore, we optimize the learning rate η for shrinkage of the adaptive boosting aggregation method by multiplying η by α t , essentially the shrink in the contribution of each new model learned in the ensemble. This parameter controls how much the new model contributes to the existing one. The hyperparameters of the decision tree model include the maximal number of node splits, the minimum number of samples per leaf, and the split criterion [26]. The depth of a tree affects the training time, memory consumption, and classification accuracy. Large values of the maximal number of node splits per tree and small values of the minimum number of samples per leaf generate deep trees. A decision tree splits nodes according to various criteria, including Gini’s diversity, deviance (also known as cross-entropy), and the twoing rule.

3.4. Multi-Layer Perceptron

We apply the fully connected (FC) neural network thanks to its relative simplicity and ease of implementation while extracting useful information from noisy signal [28]. Figure 2 shows our proposed MLP network consisting of the input layer, FC layer, batch normalization layer, activation function, dropout layer, and softmax layer for the classification. The input layer defines the input data size dependent on the input feature set. The middle layers of the network use the repeating set block denoted as FCSet, composed of FC, batch normalization, and ReLu layers. We add the dropout layer between two repeating set blocks in series. Then, the additional FC layer and the softmax activation function predict the classification label as the final output. The eligible hyperparameters to optimize are the dropout probability, initial learning rate, and gradient decay factor of the Adam optimizer, as shown in Table 4.

4. Performance Evaluation

We split a dataset 0.8:0.2 into training and testing sets, which means 291 samples for training and 73 samples for testing out of N = 364 . The number of samples per class is 99 , 155 , and 110 for abuse classes of ISC, Heat, and Nail, respectively. The ML models are trained and tested on the Intel Xeon Platinum 8270 processor (Intel, Santa Clara, CA, USA) and the NVIDIA RTX 8000 and A6000 GPUs (NVIDIA, Santa Clara, CA, USA). We use different evaluation metrics, including the prediction accuracy, confusion metrics, ROC curves, area under the curve (AUC), and feature importance scores of various ML models.

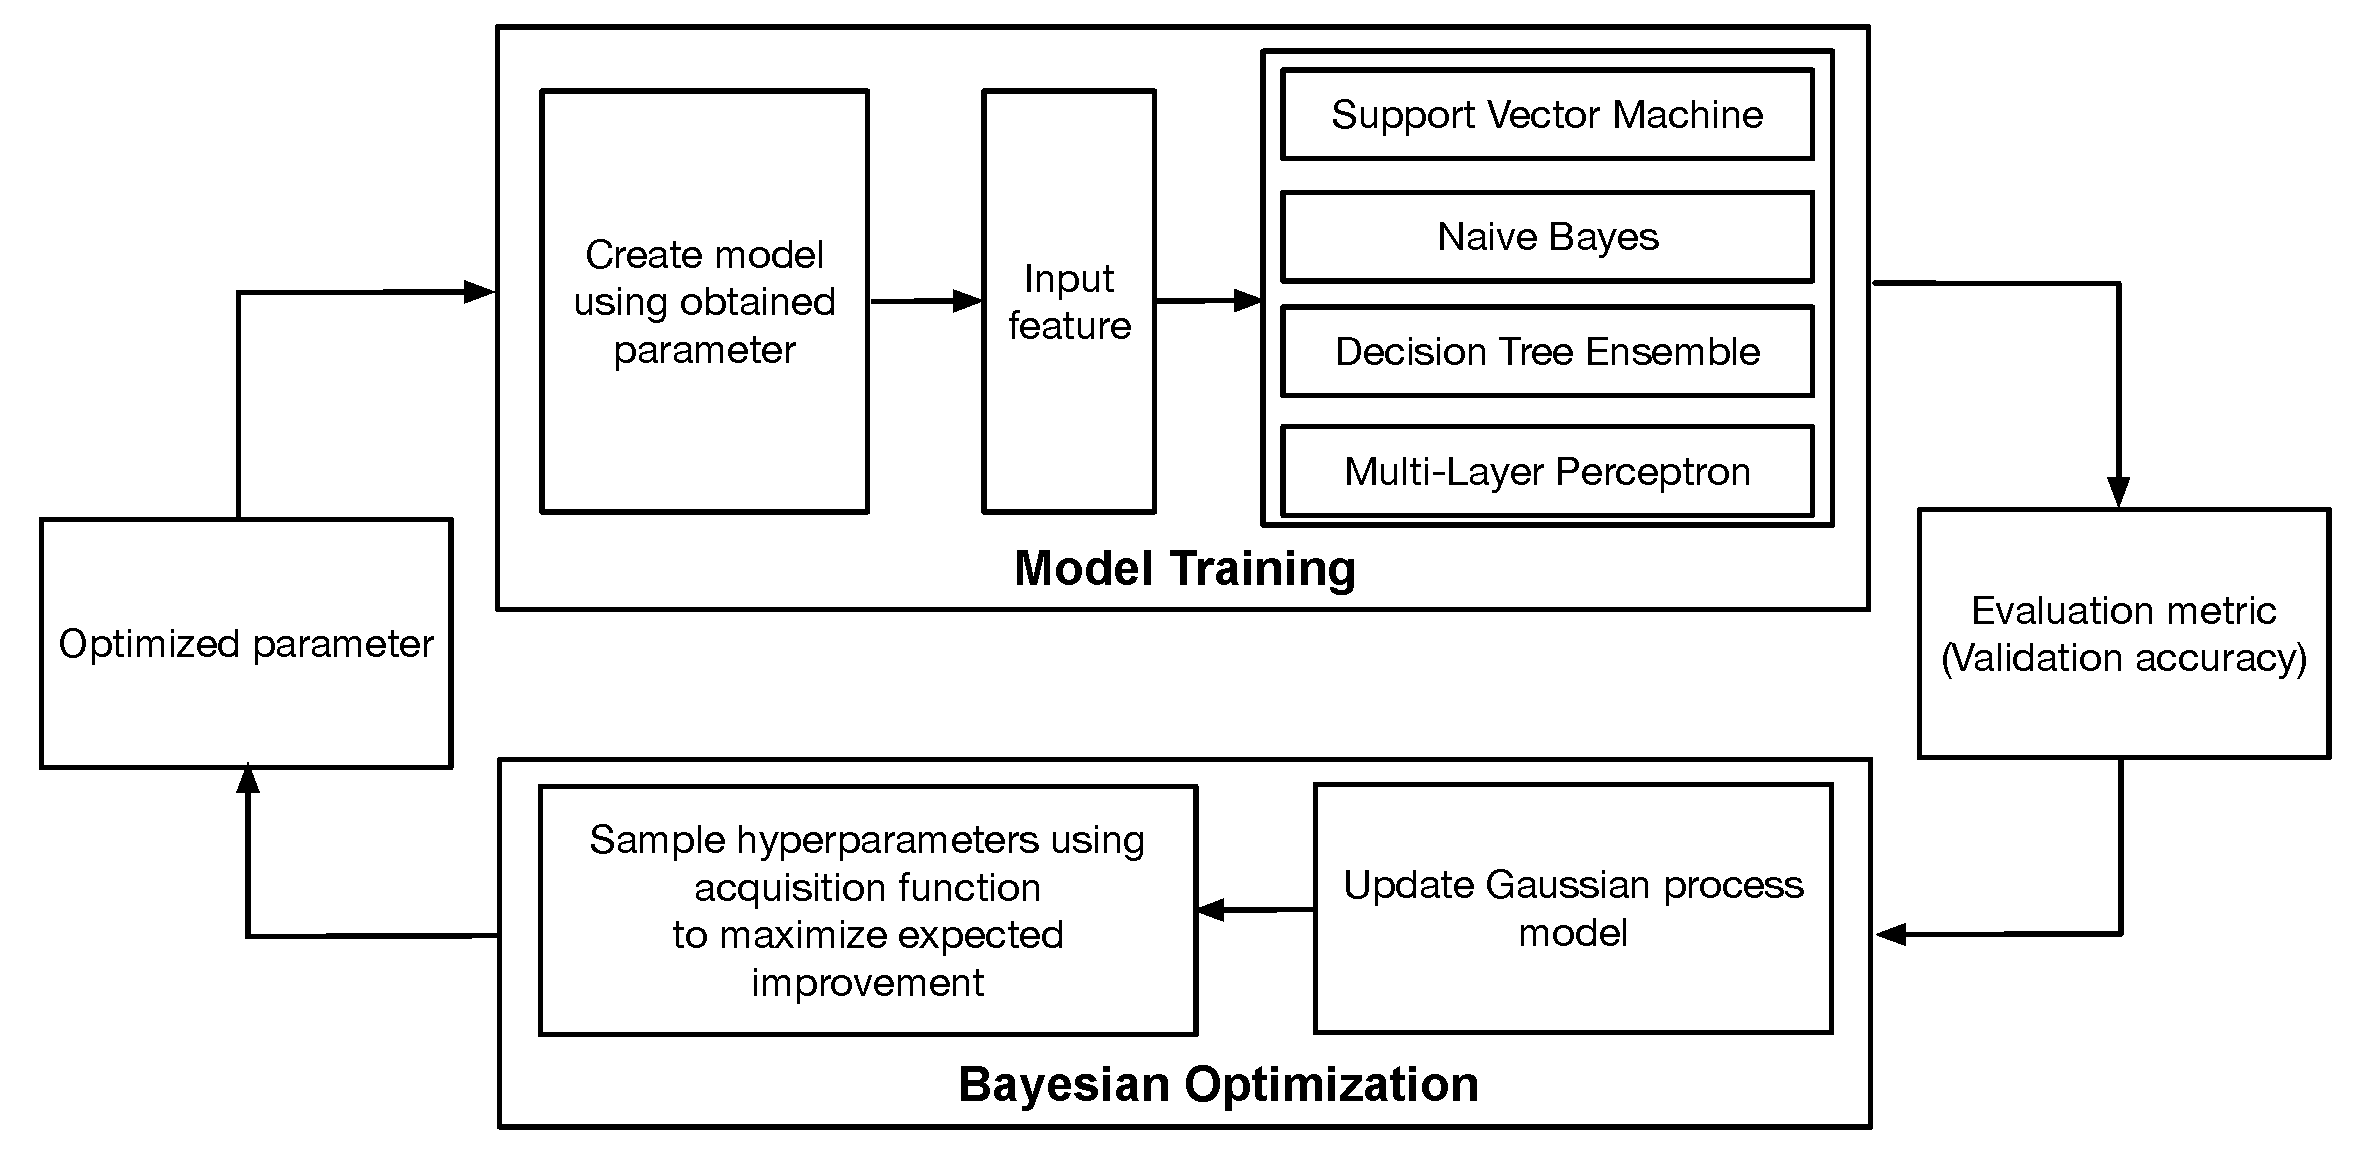
4.1. Comparison between Different Machine Learning Models

The strictly limited amount of samples N = 364 may incur serious generalization problems such as overfitting or data selection bias for different ML models. To quantify the uncertainty of limited data, we evaluate the average and standard deviation of classification accuracies of multiple trained models for each ML technique. We train multiple SVM, NB, DTE, and MLP models based on the randomly shuffled dataset with different 10 random seeds. Table 5 summarizes the average and standard deviation of classification accuracies of 10 trained models of each SVM, NB, DTE, and MLP. The standard deviation of classification accuracy is not significant for each model. Due to the effective dropout layer, the MLP model shows a standard deviation range similar to the other ML models. This result proves that the Bayesian optimization algorithm and the cross-validation efficiently generalize each ML model by reducing the overfitting or data selection bias problems.
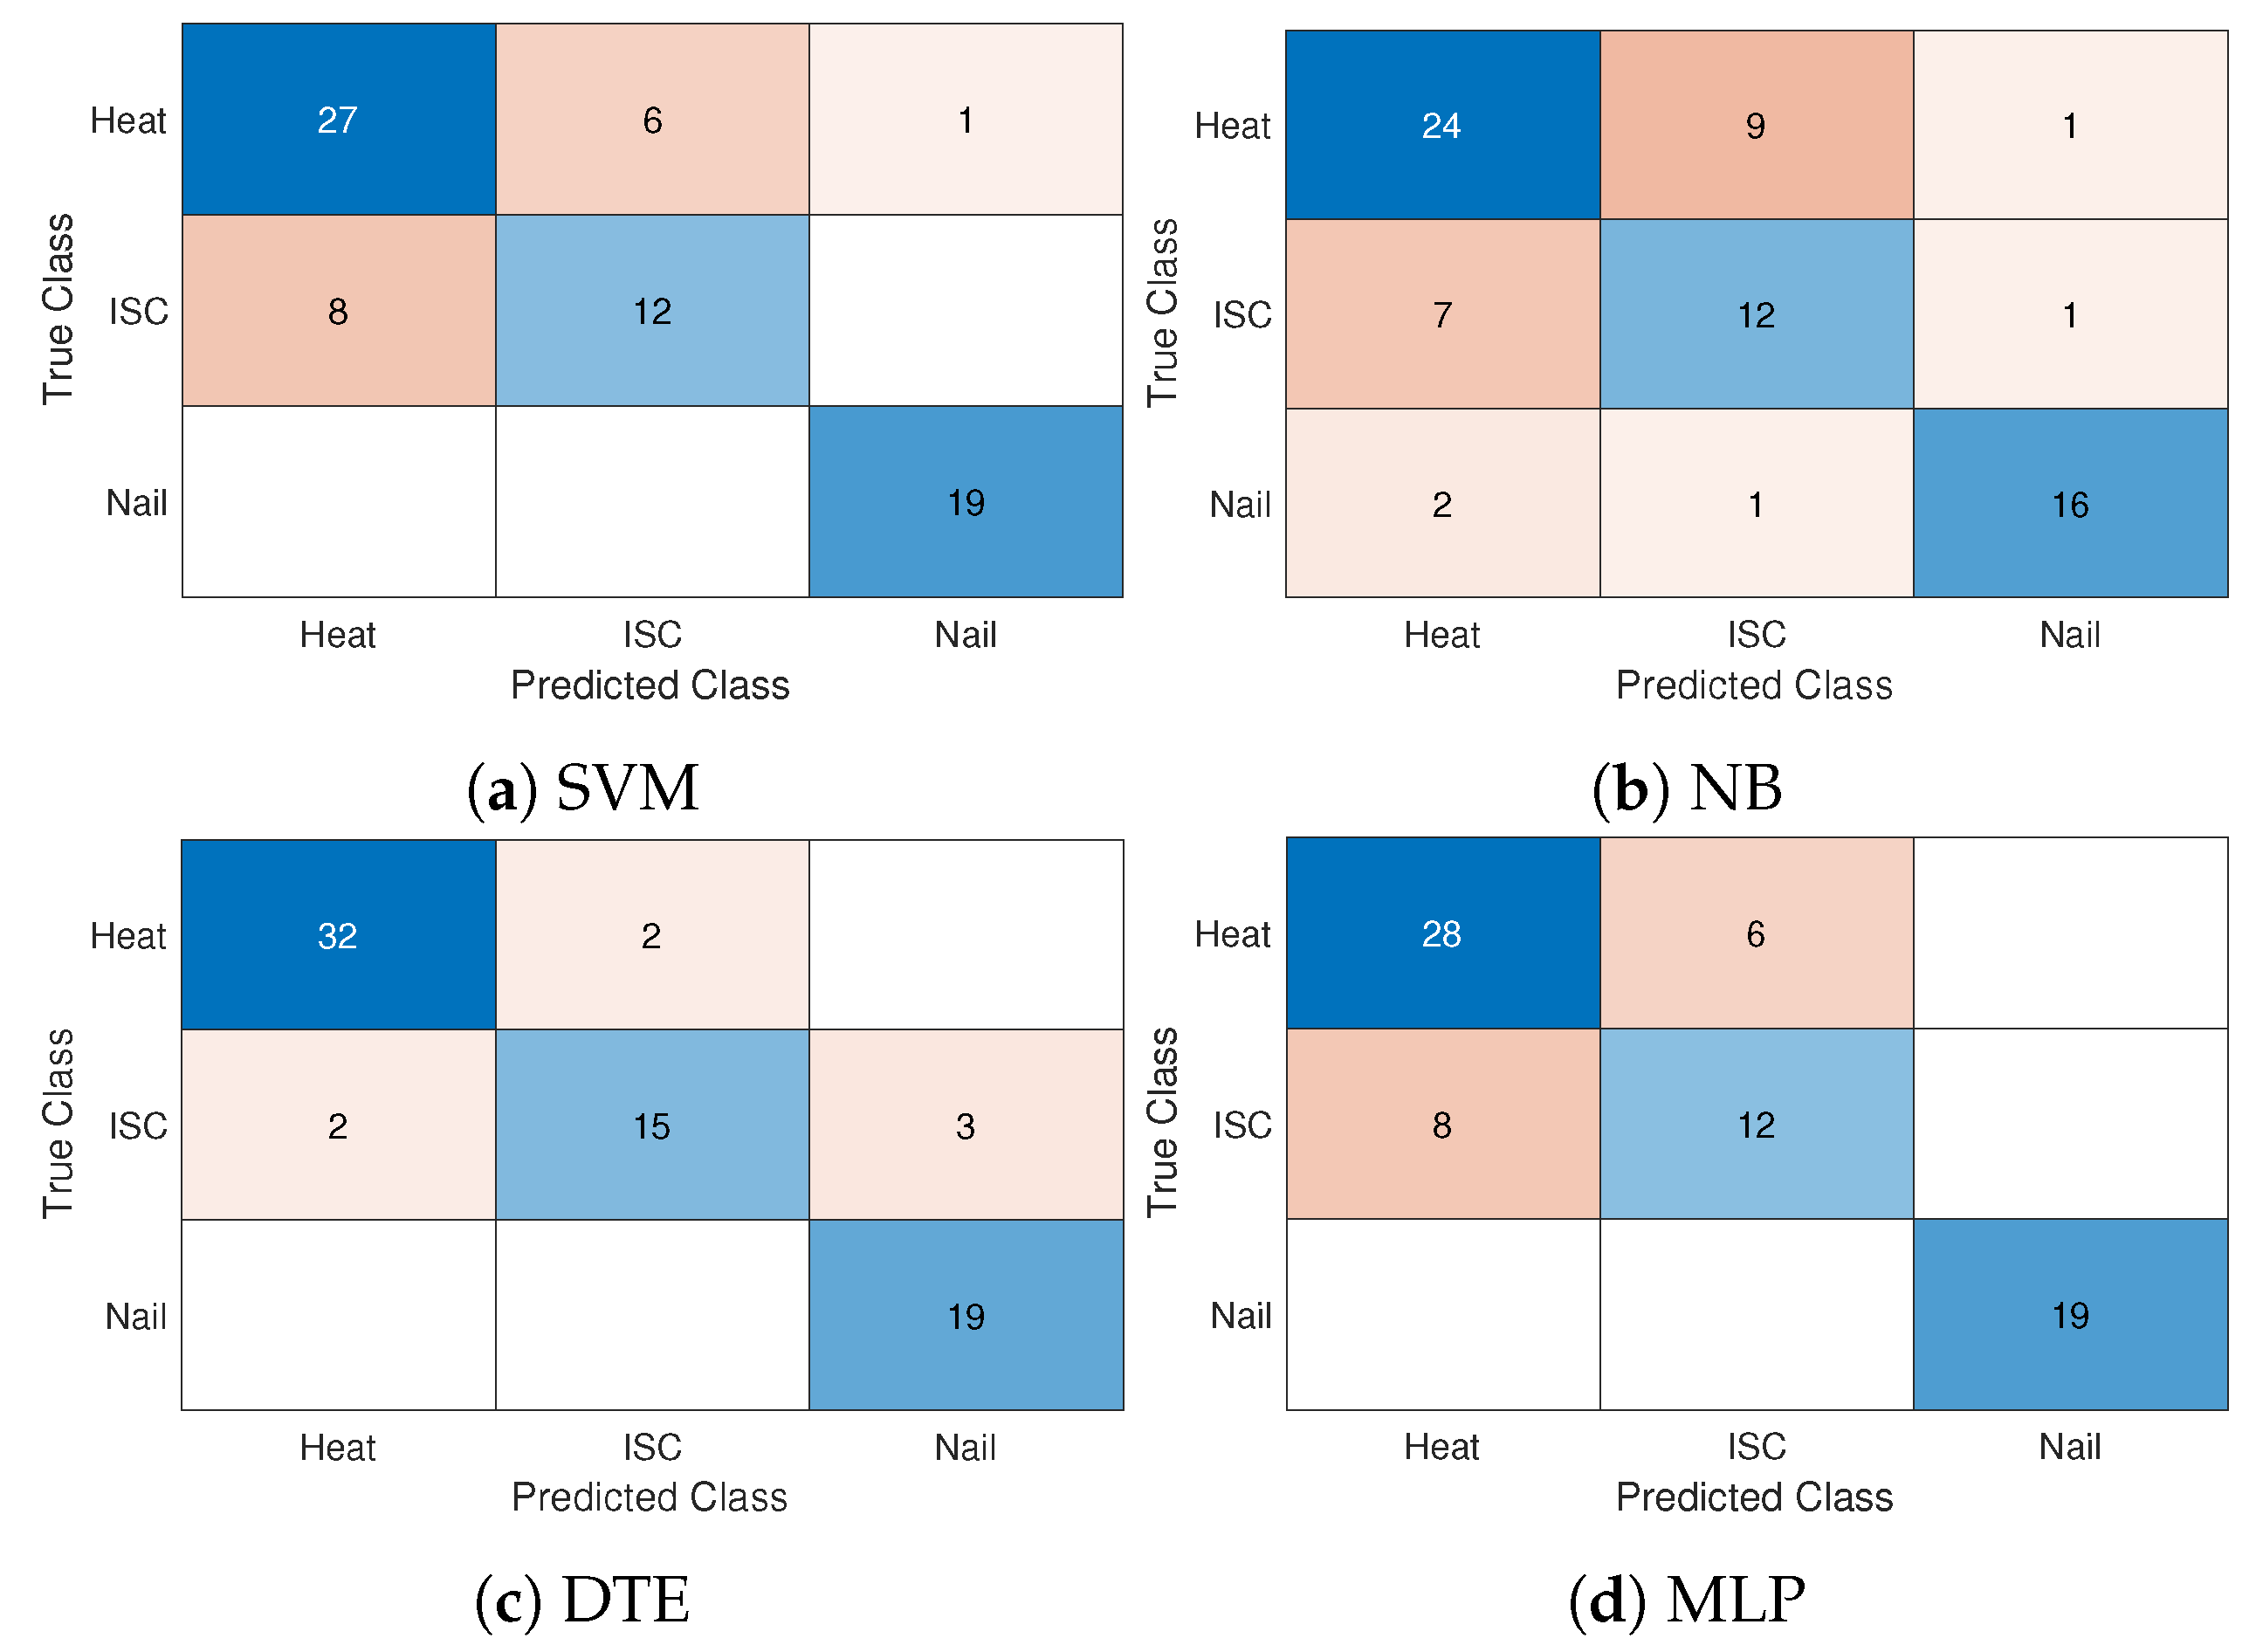
Now, we compare the performance of the representative SVM, NB, DTE, and MLP models trained using the same training dataset. Figure 3 shows the confusion matrices of SVM, NB, DTE, and MLP models to predict three causes, including Heat, ISC, and Nail. A confusion matrix presents how well a classification model performs for the testing dataset [29]. Overall, the classification accuracies of SVM, NB, DTE, and MLP are 0.80 , 0.71 , 0.90 , and 0.81 , respectively. DTE predicts the abuse method of the thermal runaway well compared to other models of SVM, NB, and MLP due to the strength of the model aggregation of multiple decision trees. SVM and MLP show a comparable prediction accuracy of around 0.8 , while NB has a higher classification error than other models. We note that the accuracy of DTE is comparable to the average one while other models of SVM, NB, and MLP slightly perform better than the corresponding ones of Table 5.
We conduct the mid-p McNemar test of DTE since it allows us to evaluate the statistical significance of whether one classification model performs better than another [30]. The mid-p values of DTE compared to SVM, NB, and MLP are 0.049 , 7.2861 × 10 4 , and 0.022 , respectively. All tests have a mid-p value of nearly zero, which indicates that DTE guarantees better prediction than other models.
Both Heat and ISC classes are generally hard to distinguish for different classification models, as shown in Figure 3. Although the ISC abuse may occur at a considerably lower temperature than the one of Heat, there are no measured features that explicitly provide the detailed heat and mass changes during the thermal runaway experiments using FTRC. Furthermore, the real-time measurements are also hard to obtain in practice. The classification accuracies of DTE are around 0.94 and 0.75 for Heat and ISC classes, respectively, greater than SVM, NB, and MLP. SVM, NB, and MLP models show considerably low classification accuracy for the ISC class around 0.6 . While SVM, DTE, and MLP perfectly predict nail abuse, the classification accuracy of NB is only around 0.84 for the Nail class. The NB model has classification errors between all abuse methods of the thermal runaway.
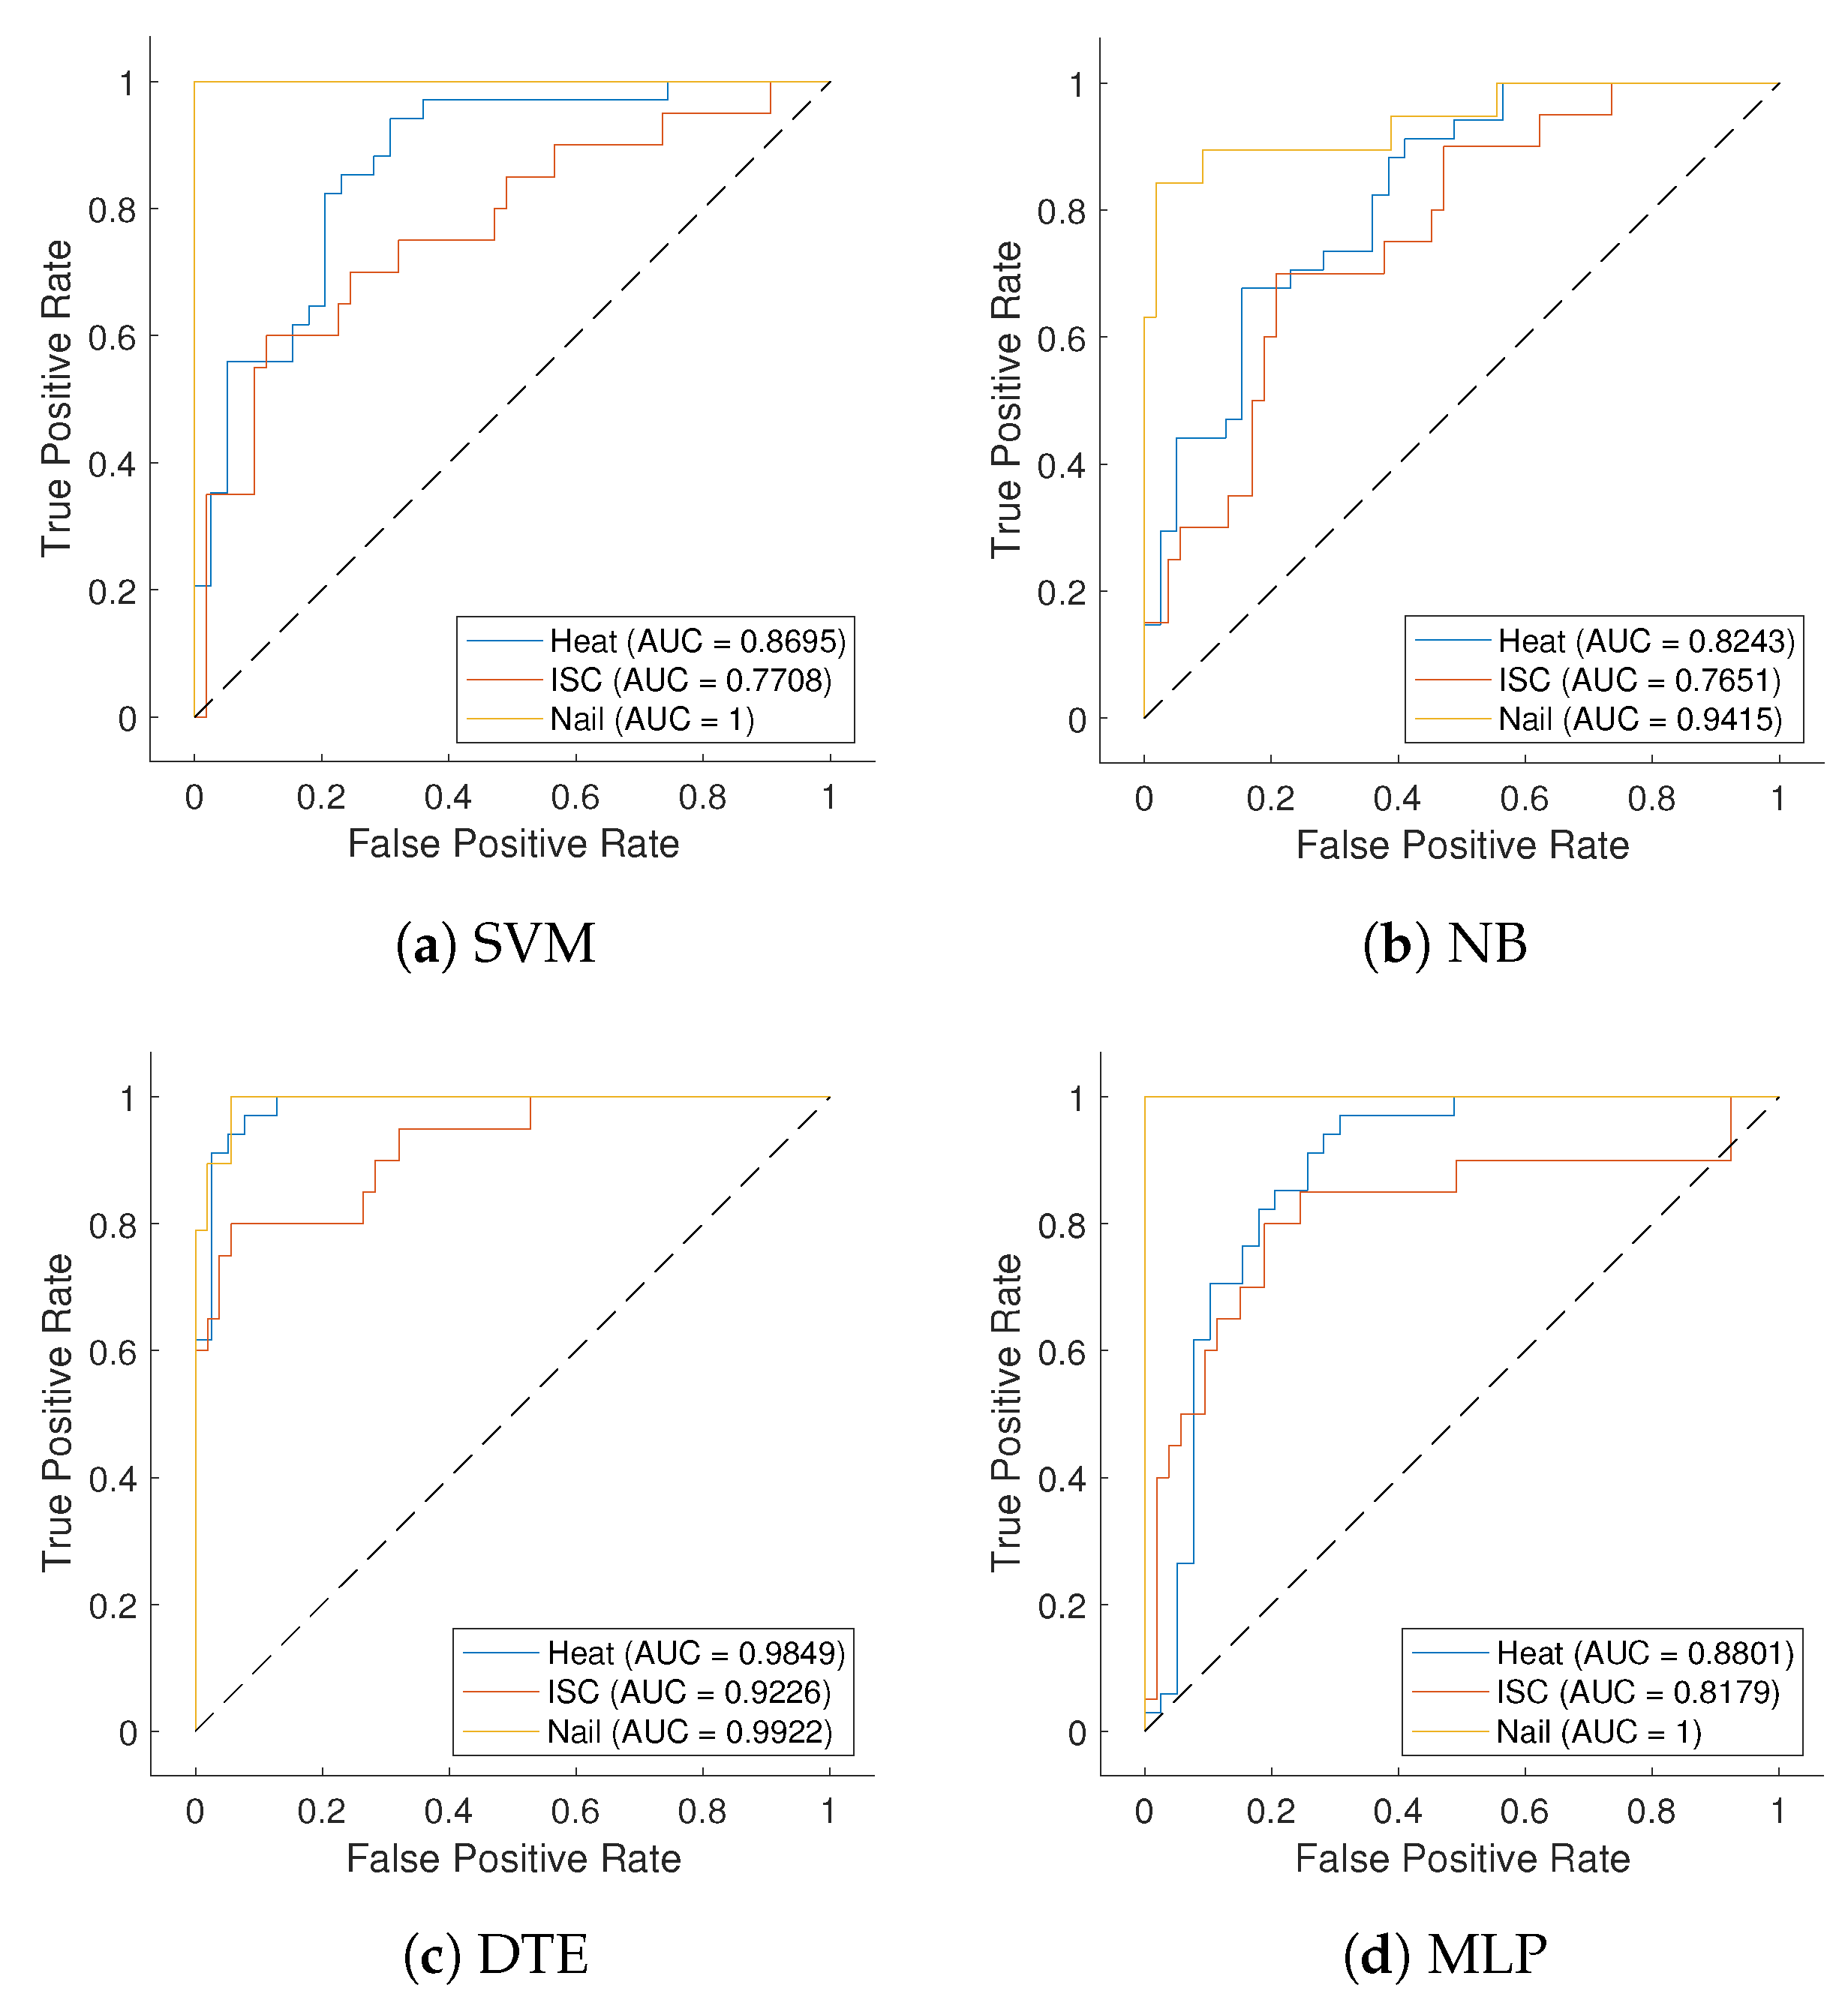
Figure 4 presents the ROC curves using SVM, NB, DTE, and MLP models for different ISC, Heat, and Nail abuses. It shows the true positive ratio (TPR) over the false positive ratio (FPR) of each abuse throughout threshold intervals of [ 0 , 1 ] . In each figure, as the curve approaches the upper left corner and the diagonal line, the classifier improves and worsens, respectively. Note that the upper left corner is the optimal operating point (i.e., TPR = 100%, FPR = 0%) of the classifier. The DTE curve moves toward the upper left corner, especially for Heat and Nail, because of the low FPR of DTE. DTE significantly outperforms other classifiers for all causes.
To provide a more detailed analysis, Figure 4 also summarizes the AUCs of all models for different abuse methods. The DTE model consistently provides higher AUCs than those using other models for the Heat and Nail classes. For the ISC abuse, the AUC value of DTE remains above 0.92 , while other models, including SVM, NB, and MLP, show relatively low AUC values below 0.82 . Hence, the comparison between different models proves the strengths of the ensemble aggregation methods of diverse decision trees to capture the complex relationship between various features and abuse methods.
Next, we discuss the performance sensitivity of ML models for various batteries of cell formats and manufacturers. Table 6 summarizes the classification accuracies of trained ML models for various cell formats, including 18650 and 21700, and manufacturers including KULR, LG, Molicel, Saft, Samsung, Sanyo, Sony, and Soteria. DTE still performs better than any other models for 18650 and 21700 cells. The prediction accuracy of the 21700 cell is worse than that of the 18650 cell for all models. The main reason is the imbalanced data between different cell formats of the open failure dataset [18]. The dataset ratio between 18650 and 21700 cell formats is 0.77:0.23.
Similarly, DTE shows better accuracy than other models, even for all different manufacturers. We note that the prediction accuracy of Saft, Samsung, Sanyo, and Sony does not heavily affect the overall performance since the number of testing samples for these products is around 3–4. In Table 6, KULR and Soteria batteries show relatively low accuracy for all models. Even though 21,700 cells from both KULR and LG are used for abuse tests, the prediction accuracies are considerably different. While the DTE model perfectly classifies the abuse classes for all 18,650 and 21,700 cells of LG, both cell formats of KULR return a significantly low prediction performance. The description of the KULR battery does not provide any distinct factors compared to other batteries from different manufacturers. On the other hand, one of the specific Soteria 18,650 cells has lower prediction accuracy when it includes the standard current collectors and a Dreamweaver gold separator, which is different from other battery products. Thus, we might need more experimental data and additional features to better predict the abuse classes of KULR and Soteria battery failure.

4.2. Sensitivity and Feature Analysis of DTE

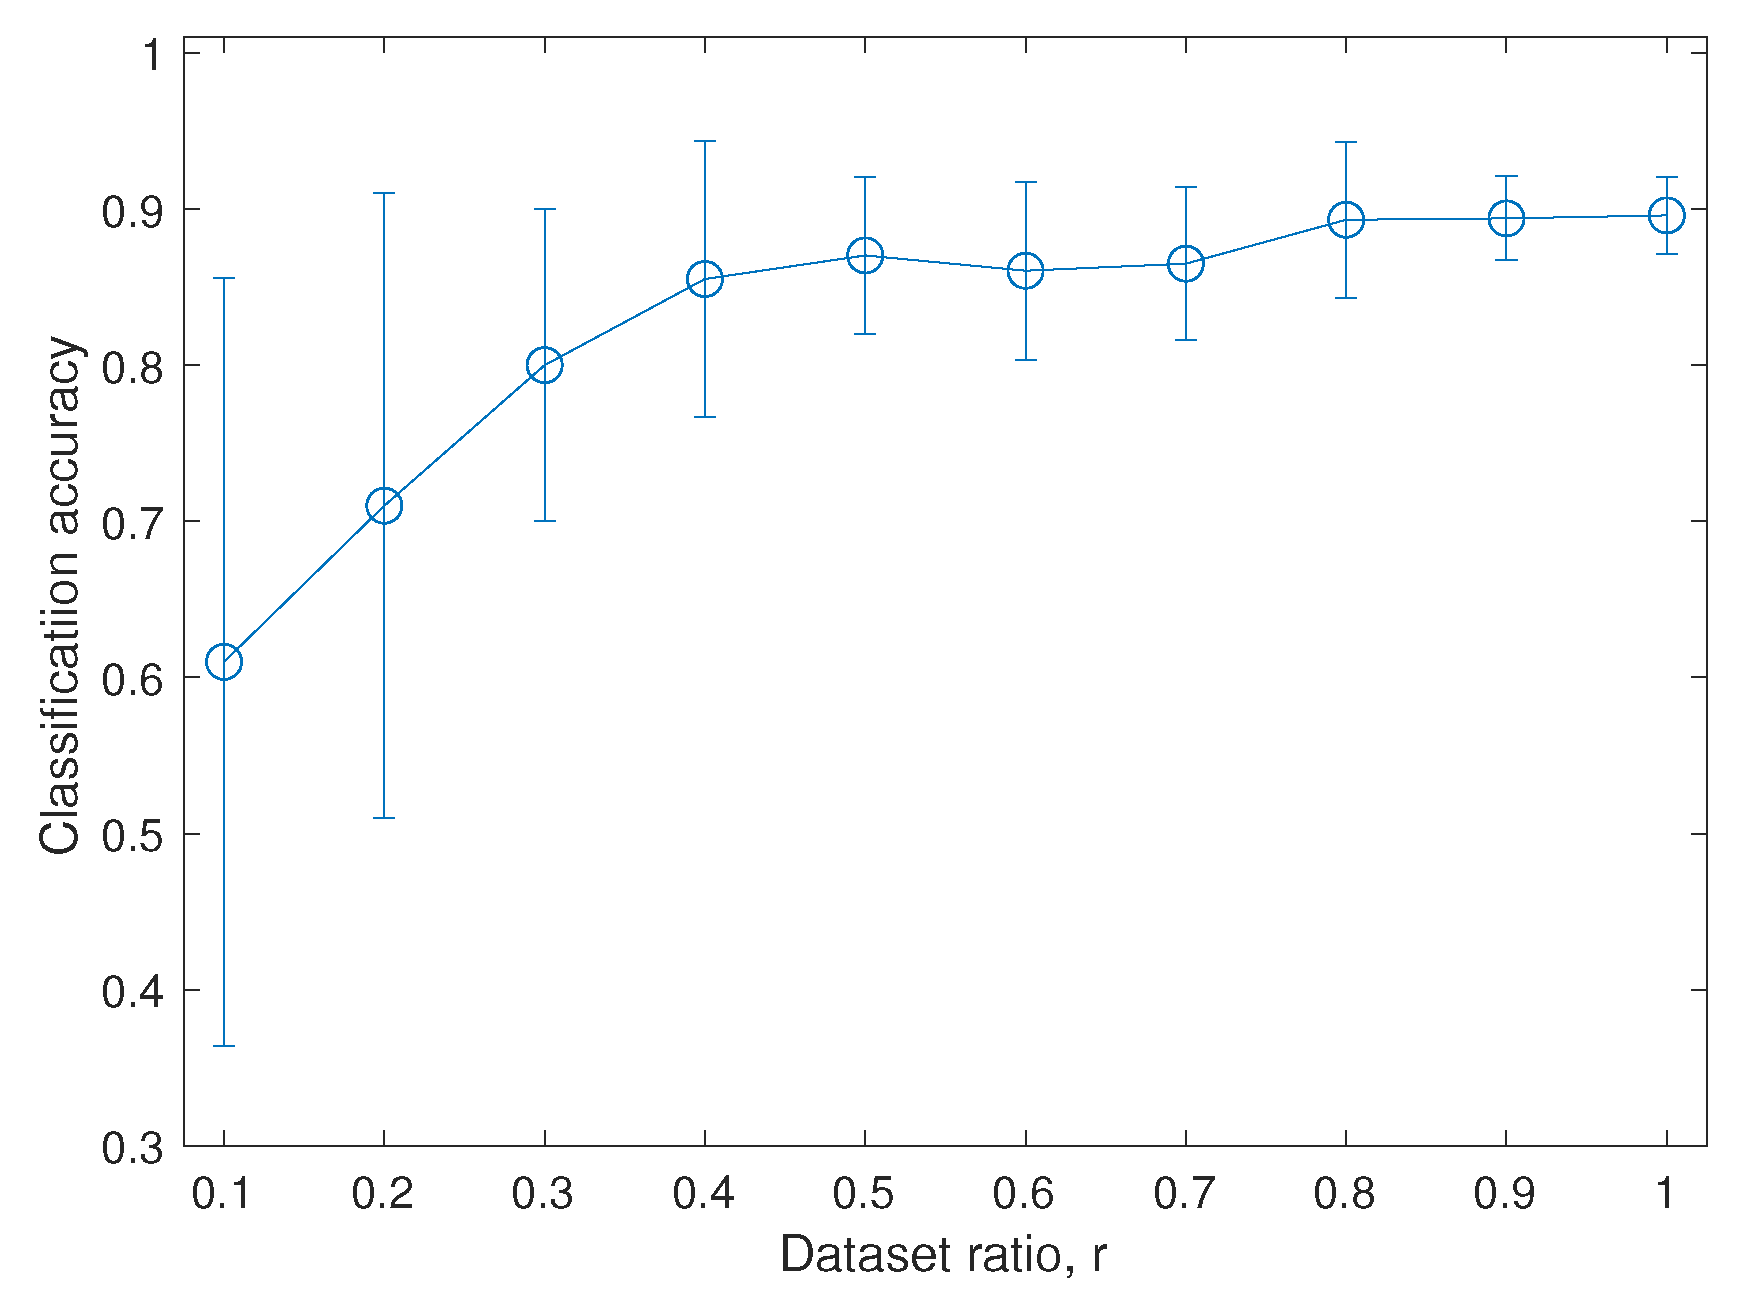
Since the DTE model considerably outperforms other models, we analyze more details of DTE, including the sensitivity of dataset size and feature importance. Even though the relationship between the dataset size and model heavily depends on the specific problems, ML models generally improve their performance with dataset size. However, the experimental battery failure data are costly to obtain in practice, especially for the thermal runaway of the battery. Thus, we conduct a sensitivity analysis to quantify the relationship between dataset size and model performance. Figure 5 presents the classification accuracy of DTE as a function of different ratios r = 0.1 , , 1 of the dataset size with respect to the total number of available samples N = 364 . The error bar shows the standard deviation around the average accuracy. We observe a nearly logarithmic relationship of the average accuracy with the dataset size. The uncertainty shown as the error bar dramatically increases for the small dataset r 0.4 and stabilizes for the modest dataset r 0.5 . We could achieve a comparable average accuracy of DTE for the dataset r 0.8 even though the uncertainty is still high for the dataset r = 0.8 .
Figure 6 compares the feature rank obtained by feature independence analysis using chi-square tests with the feature importance score of DTE. We first evaluate the independence of each feature variable to the abuse classes by using chi-square tests. Figure 6a shows the feature scores, defined as the negative logarithm of the p-values. The seven most important features of the feature independence analysis are HeatLossRate, NegEnP, CellEn, CellCap, BodyEnP, CorrLossEn, and ConfPos. The ratio of these seven scores over the total score sum is around 0.38 in Figure 6a. We further analyze the feature importance score of DTE, which is defined as the total changes in the risk due to splits on each feature divided by the number of branch nodes of the decision tree, as shown in Figure 6b [31]. Note that the minimum importance score is 0. The weighted average is then applied to the feature importance score of the overall weak learners of the ensemble. HeatLossRate is the most crucial feature, followed by PreCellM and NegEnP. The ratio of the score sum of the three most important features of HeatLossRate, PreCellM, and NegEnP over the total score sum is 0.44 . We observe that HeatLossRate and NegEnP are still critical factors even for the trained DTE model.
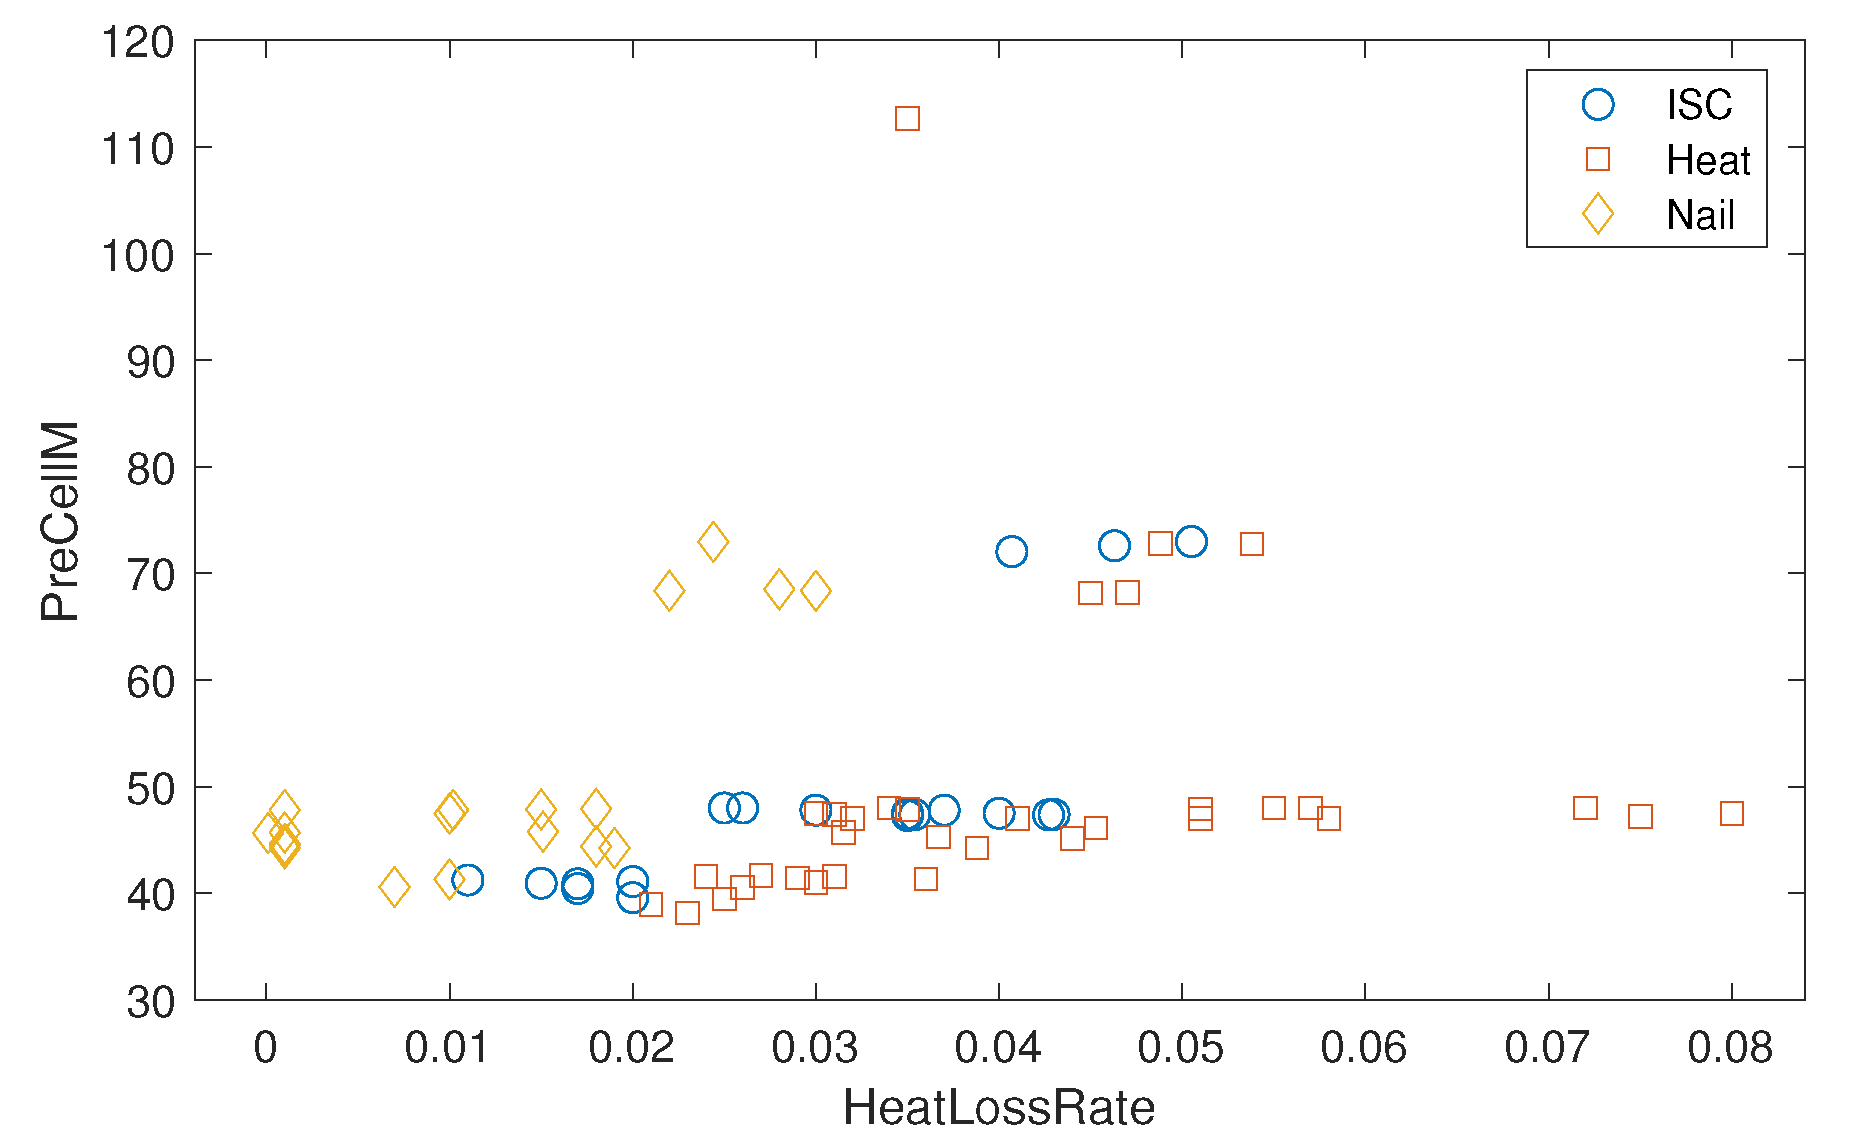
Figure 7 presents three abuse classes, Heat, ISC, and Nail, against the two most critical features of DTE, namely, HeatLossRate and PreCellM, obtained from Figure 6b. The Nail class is relatively easy to separate from other classes of Heat and ISC. The Nail class has the lowest HeatLossRate, while the boundary with other classes increases as the PreCellM value increases. On the other hand, the Heat class shows the highest variation in HeatLossRate, particularly for PreCellM  50 . The classification boundaries between Heat and ISC classes are apparent when HeatLossRate is in the range between 0.03 and 0.08 for PreCellM 50 . Thus, this explains the dominant classification errors between Heat and ISC classes of different models, as shown in the confusion matrix of Figure 3.
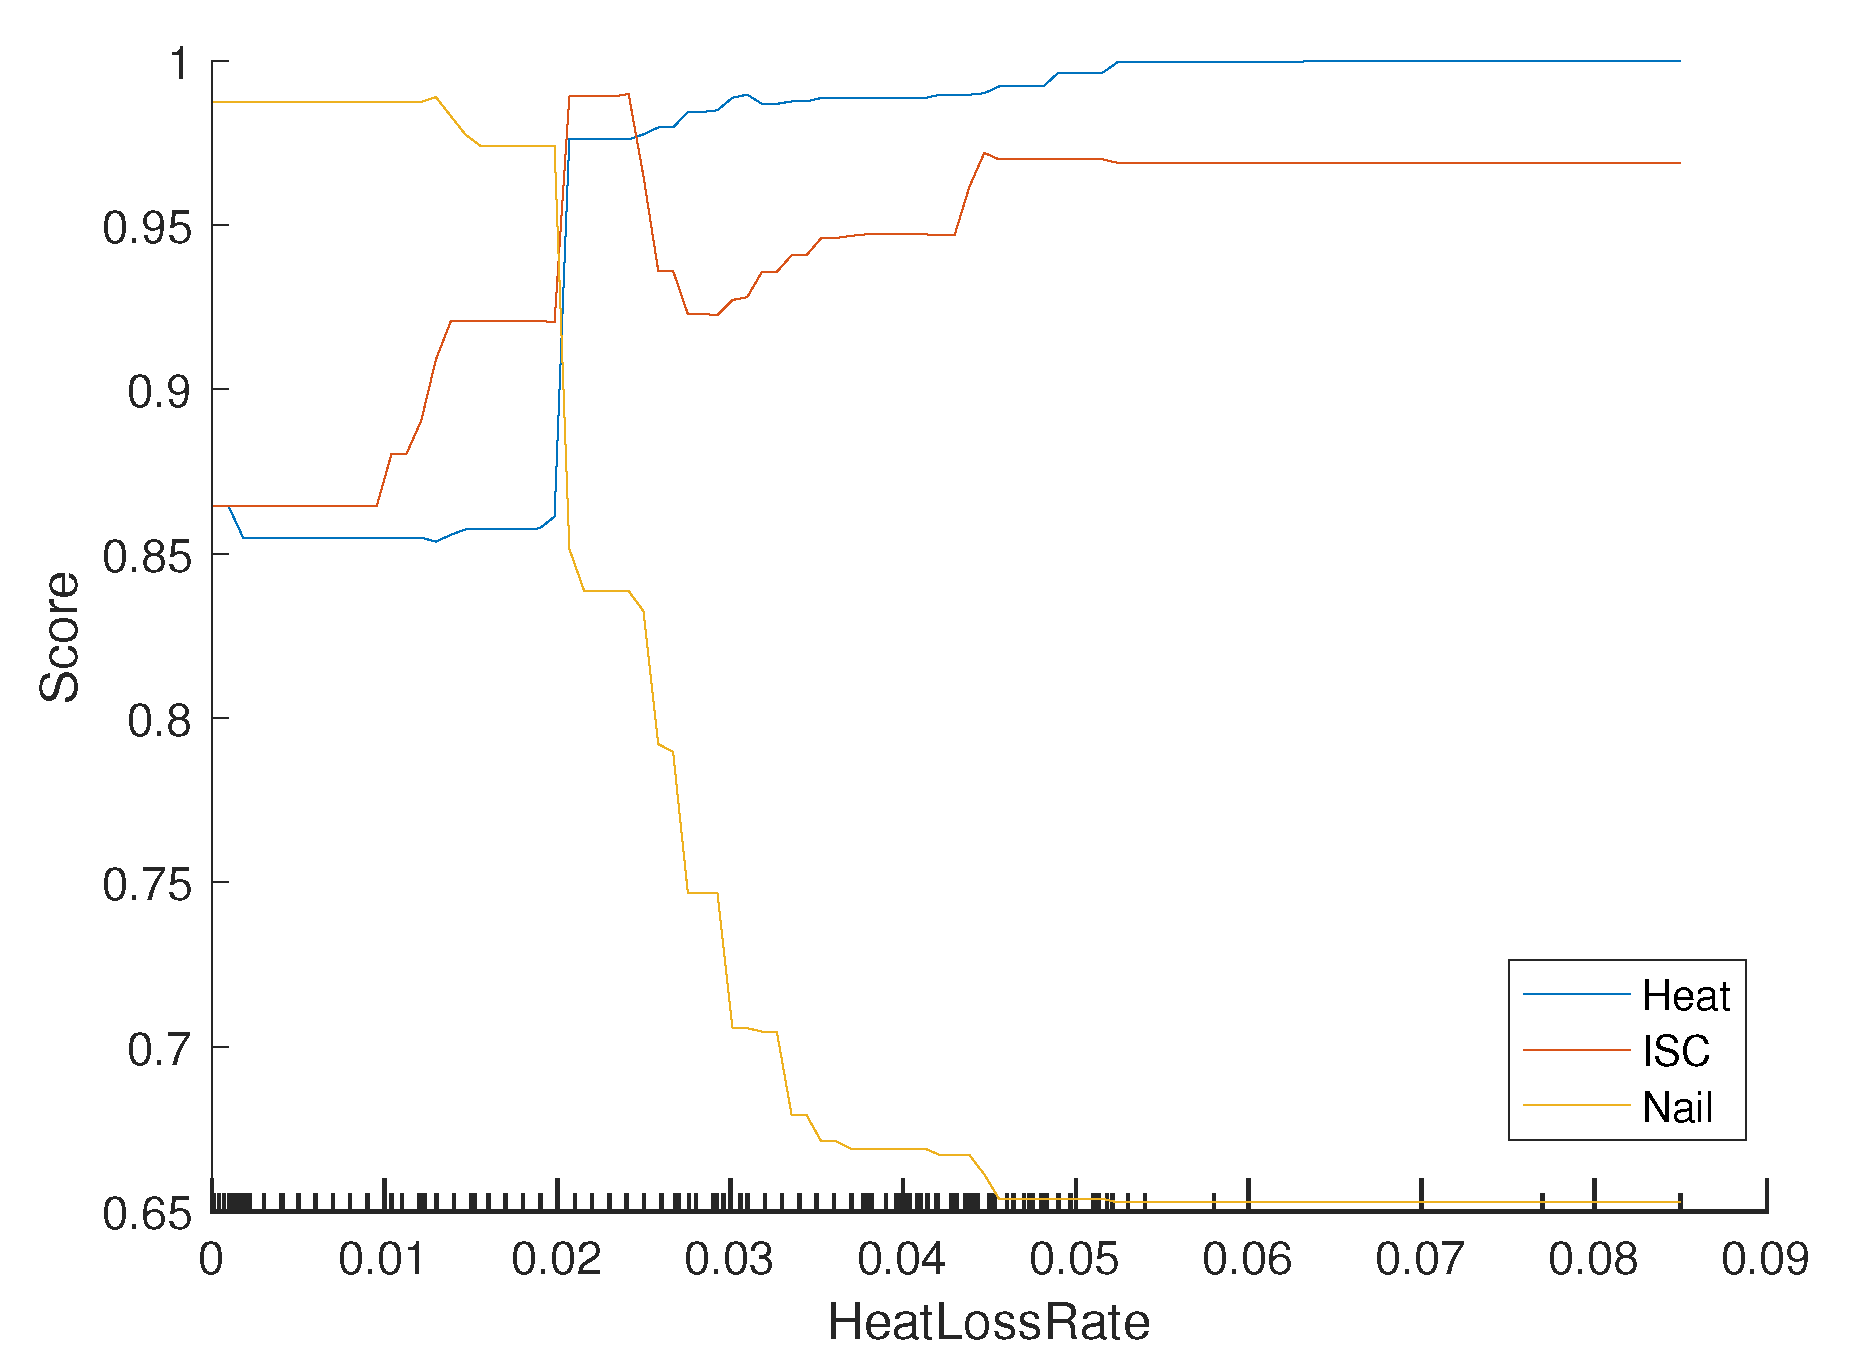
Partial dependence represents the relationships between feature variables and predicted scores (posterior probabilities) of all abuse methods obtained by the trained DTE model [31]. Figure 8 shows the estimated partial dependence of DTE for all abuse classes against the most critical features, HeatLossRate. According to DTE, the probability of the Heat class significantly changes around HeatLossRate  0.02 , then stays almost flat. The probability of Nail is greater than 0.97 for HeatLossRate < 0.02 , while it drops fast to almost 0.65 for HeatLossRate 0.02 . The probabilities of both Heat and ISC classes are similar, being greater than 0.97 for 0.02 HeatLossRate 0.024 .

5. Conclusions

This study presents a thermal runaway diagnosis framework using various ML models where Bayesian optimization techniques are applied to optimize the hyperparameter of these models. Using the experimental data, we use SVM, NB, DTE, and MLP models to estimate a high likelihood of abuse classes of thermal runaway. Open-source battery failure data were used to analyze the diagnosis performance of different abuse types in terms of the classification accuracy, confusion metrics, and ROC curves of ML models. An experimental evaluation shows that the DTE model outperforms other classifiers by around 11.87–26.93% for prediction accuracy. Furthermore, the DTE model provides robust prediction accuracy even with the strictly limited dataset. By analyzing the feature importance, the heat loss rate feature from the experimental measurements is shown to be the most crucial feature in estimating the causes of the thermal runaway for the DTE model.

Author Contributions

Conceptualization, P.P.; Investigation, Y.C. and P.P.; Methodology, P.P.; Software, Y.C.; Validation, P.P.; Writing—original draft, P.P.; Writing—review & editing, Y.C. and P.P. All authors have read and agreed to the published version of the manuscript.

Funding

This work was supported by research fund of Chungnam National University.

Institutional Review Board Statement

Not applicable.

Informed Consent Statement

Not applicable.

Data Availability Statement

Data is contained within the article.

Conflicts of Interest

The authors declare no conflict of interest.

References

  1. Nykvist, B.; Nilsson, M. Rapidly falling costs of battery packs for electric vehicles. Nat. Clim. Chang. 2015, 5, 329–332. [Google Scholar] [CrossRef]
  2. Chen, Y.; Kang, Y.; Zhao, Y.; Wang, L.; Liu, J.; Li, Y.; Liang, Z.; He, X.; Li, X.; Tavajohi, N.; et al. A review of lithium-ion battery safety concerns: The issues, strategies, and testing standards. J. Energy Chem. 2021, 59, 83–99. [Google Scholar] [CrossRef]
  3. Park, P.; Ergen, S.C.; Fischione, C.; Lu, C.; Johansson, K.H. Wireless Network Design for Control Systems: A Survey. IEEE Commun. Surv. Tutor. 2018, 20, 978–1013. [Google Scholar] [CrossRef]
  4. Hu, X.; Zhang, K.; Liu, K.; Lin, X.; Dey, S.; Onori, S. Advanced Fault Diagnosis for Lithium-Ion Battery Systems: A Review of Fault Mechanisms, Fault Features, and Diagnosis Procedures. IEEE Ind. Electron. Mag. 2020, 14, 65–91. [Google Scholar] [CrossRef]
  5. Omakor, J.; Miah, M.S.; Chaoui, H. Battery Reliability Assessment in Electric Vehicles: A State-of-the-Art. IEEE Access 2024, 12, 77903–77931. [Google Scholar] [CrossRef]
  6. Park, P.; Marco, P.D.; Nah, J.; Fischione, C. Wireless Avionics Intracommunications: A Survey of Benefits, Challenges, and Solutions. IEEE Internet Things J. 2021, 8, 7745–7767. [Google Scholar] [CrossRef]
  7. Li, D.; Liu, P.; Zhang, Z.; Zhang, L.; Deng, J.; Wang, Z.; Dorrell, D.G.; Li, W.; Sauer, D.U. Battery Thermal Runaway Fault Prognosis in Electric Vehicles Based on Abnormal Heat Generation and Deep Learning Algorithms. IEEE Trans. Power Electron. 2022, 37, 8513–8525. [Google Scholar] [CrossRef]
  8. Azuaje-Berbeci, B.J.; Ertan, H.B. A model for the prediction of thermal runaway in lithium–ion batteries. J. Energy Storage 2024, 90, 111831. [Google Scholar] [CrossRef]
  9. Zhang, X.; Chen, S.; Zhu, J.; Gao, Y. A Critical Review of Thermal Runaway Prediction and Early-Warning Methods for Lithium-Ion Batteries. Energy Mater. Adv. 2023, 4, 8. [Google Scholar] [CrossRef]
  10. Finegan, D.P.; Darcy, E.; Keyser, M.; Tjaden, B.; Heenan, T.M.M.; Jervis, R.; Bailey, J.J.; Vo, N.T.; Magdysyuk, O.V.; Drakopoulos, M.; et al. Identifying the Cause of Rupture of Li-Ion Batteries during Thermal Runaway. Adv. Sci. 2018, 5, 1700369. [Google Scholar] [CrossRef]
  11. Finegan, D.P.; Darst, J.; Walker, W.; Li, Q.; Yang, C.; Jervis, R.; Heenan, T.M.M.; Hack, J.; Thomas, J.C.; Rack, A.; et al. Modelling and experiments to identify high-risk failure scenarios for testing the safety of lithium-ion cells. J. Power Sources 2019, 417, 29–41. [Google Scholar] [CrossRef]
  12. Severson, K.A.; Attia, P.M.; Jin, N.; Perkins, N.; Jiang, B.; Yang, Z.; Chen, M.H.; Aykol, M.; Herring, P.K.; Fraggedakis, D.; et al. Data-driven prediction of battery cycle life before capacity degradation. Nat. Energy 2019, 4, 383–391. [Google Scholar] [CrossRef]
  13. Li, L.; Li, Y.; Mao, R.; Li, L.; Hua, W.; Zhang, J. Remaining Useful Life Prediction for Lithium-Ion Batteries With a Hybrid Model Based on TCN-GRU-DNN and Dual Attention Mechanism. IEEE Trans. Transp. Electrif. 2023, 9, 4726–4740. [Google Scholar] [CrossRef]
  14. Attia, P.M.; Grover, A.; Jin, N.; Severson, K.A.; Markov, T.M.; Liao, Y.-H.; Chen, M.H.; Cheong, B.; Perkins, N.; Yang, Z.; et al. Closed-loop optimization of fast-charging protocols for batteries with machine learning. Nature 2020, 578, 397–402. [Google Scholar] [CrossRef] [PubMed]
  15. Ouyang, Q.; Wang, Z.; Liu, K.; Xu, G.; Li, Y. Optimal Charging Control for Lithium-Ion Battery Packs: A Distributed Average Tracking Approach. IEEE Trans. Ind. Inform. 2020, 16, 3430–3438. [Google Scholar] [CrossRef]
  16. Kriston, A.; Podias, A.; Adanouj, I.; Pfrang, A. Analysis of the effect of thermal runaway initiation conditions on the severity of thermal runaway-numerical simulation and machine learning study. J. Electrochem. Soc. 2020, 167, 090555. [Google Scholar] [CrossRef]
  17. Li, W.; Zhu, J.; Xia, Y.; Gorji, M.B.; Wierzbicki, T. Data-Driven safety envelope of lithium-ion batteries for electric vehicles. Joule 2019, 3, 2703–2715. [Google Scholar] [CrossRef]
  18. Finegan, D.P.; Billman, J.; Darst, J.; Hughes, P.; Trillo, J.; Sharp, M.; Benson, A.; Pham, M.; Kesuma, I.; Buckwell, M.; et al. The battery failure databank: Insights from an open-access database of thermal runaway behaviors of Li-ion cells and a resource for benchmarking risks. J. Power Sources 2024, 597, 234106. [Google Scholar] [CrossRef]
  19. Finegan, D.P.; Cooper, S.J. Battery safety: Data-driven prediction of failure. Joule 2019, 3, 2599–2601. [Google Scholar] [CrossRef]
  20. Finegan, D.P.; Darcy, E.; Keyser, M.; Tjaden, B.; Heenan, T.M.M.; Jervis, R.; Bailey, J.J.; Malik, R.; Vo, N.T.; Magdysyuk, O.V.; et al. Characterising thermal runaway within lithium-ion cells by inducing and monitoring internal short circuits. Energy Environ. Sci. 2017, 10, 1377–1388. [Google Scholar] [CrossRef]
  21. Wang, X.; Jin, Y.; Schmitt, S.; Olhofer, M. Recent Advances in Bayesian Optimization. ACM Comput. Surv. 2023, 55, 287. [Google Scholar] [CrossRef]
  22. Campi, M.C.; Garatti, S. A theory of the risk for optimization with relaxation and its application to support vector machines. J. Mach. Learn. Res. 2021, 22, 1–38. [Google Scholar]
  23. Bielza, C.; Larrañaga, P. Discrete Bayesian Network Classifiers: A Survey. ACM Comput. Surv. 2014, 47, 5. [Google Scholar] [CrossRef]
  24. Younas, N.; Ali, A.; Hina, H.; Hamraz, M.; Khan, Z.; Aldahmani, S. Optimal Causal Decision Trees Ensemble for Improved Prediction and Causal Inference. IEEE Access 2022, 10, 13000–13011. [Google Scholar] [CrossRef]
  25. Lomax, S.; Vadera, S. A survey of cost-sensitive decision tree induction algorithms. ACM Comput. Surv. 2013, 45, 16. [Google Scholar] [CrossRef]
  26. Mienye, I.D.; Jere, N. A Survey of Decision Trees: Concepts, Algorithms, and Applications. IEEE Access 2024, 12, 86716–86727. [Google Scholar] [CrossRef]
  27. Freund, Y.; Schapire, R.E. Experiments with a new boosting algorithm. In Proceedings of the International Conference on International Conference on Machine Learning, Bari, Italy, 3–6 July 1996; pp. 148–156. [Google Scholar]
  28. Park, P.; Marco, P.D.; Santucci, F. Efficient Data Collection and Training for Deep-Learning-Based Indoor Vehicle Navigation. IEEE Internet Things J. 2024, 11, 20473–20485. [Google Scholar] [CrossRef]
  29. Bang, J.; Di Marco, P.; Shin, H.; Park, P. Deep Transfer Learning-Based Fault Diagnosis Using Wavelet Transform for Limited Data. Appl. Sci. 2022, 12, 7450. [Google Scholar] [CrossRef]
  30. Mohammadi, M.; Hofman, W.; Tan, Y.-H. A Comparative Study of Ontology Matching Systems via Inferential Statistics. IEEE Trans. Knowl. Data Eng. 2019, 31, 615–628. [Google Scholar] [CrossRef]
  31. Bennetot, A.; Donadello, I.; El Qadi El Haouari, A.; Dragoni, M.; Frossard, T.; Wagner, B.; Sarranti, A.; Tulli, S.; Trocan, M.; Chatila, R.; et al. A Practical tutorial on Explainable AI Techniques. ACM Comput. Surv. 2024, Accepted. [Google Scholar] [CrossRef]
Figure 1. Thermal runaway diagnosis framework using different ML techniques including SVM, NB, DTE, and MLP models where the optimal parameters are obtained by Bayesian optimization algorithm.
Applsci 14 09107 g001
Figure 2. MLP network architecture consisting of the input layer, FC layer, batch normalization layer, ReLu function, dropout layer, and softmax layer for the classification.
Applsci 14 09107 g002
Figure 3. Confusion matrix of SVM, NB, DTE, and MLP models for different Heat, ISC, and Nail abuses.
Applsci 14 09107 g003
Figure 4. ROC curves of SVM, NB, DTE, and MLP models for different Heat, ISC, and Nail abuses.
Applsci 14 09107 g004
Figure 5. Average and standard deviation of prediction accuracy of DTE with different dataset ratios (r) compared to the maximum available dataset N = 364 .
Applsci 14 09107 g005
Figure 6. Comparison of feature ranks obtained by feature independence analysis using chi-square tests and feature importance score of DTE. (a) Negative logarithm of p-value using chi-square test. (b) Feature importance score of DTE.
Applsci 14 09107 g006
Figure 7. Three abuse classes against HeatLossRate and PreCellM features.
Applsci 14 09107 g007
Figure 8. Partial dependence predicted by DTE for all abuse classes against HeatLossRate.
Applsci 14 09107 g008
Table 1. Measured features of open-source battery failure dataset [18].
Data TypeUnitDescription
CellCapAhMaximum capacity of the cell.
CellEnWhMaximum possible stored energy of the cell.
PreCellMgMass of the cell before the experiment.
BottomVent-Whether the cell includes a bottom vent or not.
PrePosMgMass of the copper mesh of the FTRC positive side.
PreNegMgMass of the copper mesh of the FTRC negative side.
ConfPos-Seal material of the FTRC positive side.
ConfNeg-Seal material of the FTRC negative side.
CellFail-Mechanism of the cell fails.
HeatLossRatekJsHeat loss rate
DiffMgMass difference between before and after the experiment.
PostCellMgMass of the remained cell.
PostPosMateMgMass of the positive side ejected mating.
PostPosBoreMgMass of the positive side ejected bore.
PostPosCuMgMass of the positive side copper mesh.
PostNegMateMgMass of the negative side ejected mating.
PostNegBoreMgMass of the negative side ejected bore.
PostNegCuMgMass of the negative side copper mesh.
BaselineEnkJReleased energy without corrections for heat and mass loss.
CorrLossEnkJReleased energy corrected for heat loss.
CorrEnkJReleased energy, corrected for both heat and mass loss.
PosEnkJEnergy of unrecovered mass ejected through the positive side.
NegEnkJEnergy of unrecovered mass ejected through the negative side.
BodyEnP%Percent of the released energy from the cell casing.
PosEnP%Percent of the released energy from the positive side.
NegEnP%Percent of the released energy from the negative side.
Cause-Trigger mechanism to induce thermal runaway.
Table 2. Hyperparameter of SVM.
RangeSelectedNote
Box constraint [ 10 3 , 10 3 ] 374.73-
Strategy[OvR, OvO]OvO-
Kernel function[Linear, Gaussian, Polynomial]Gaussian-
Feature scale [ 10 3 , 10 3 ] 6.14-
Polynomial order [ 2 , 4 ] -Polynomial
Table 3. Hyperparameter of DTE.
RangeSelectedNote
Number of learning cycles [ 10 , 500 ] 17Aggregation
Learning rate [ 10 3 , 1 ] 0.86Aggregation
Maximum number of splits [ 1 , 145 ] 119Decision tree
Minimum leaf size [ 1 , 290 ] 2Decision tree
Split criterion[Gini, Deviance, Twoing]GiniDecision tree
Table 4. Hyperparameter of MLP.
RangeSelected
Drop probability [ 0.1 , 0.8 ] 0.5
Initial learning rate [ 10 3 , 1 ] 0.001
Gradient decay factor [ 0.1 , 1 ] 0.9
Table 5. Average and standard deviation of classification accuracies using SVM, NB, DTE, and MLP models.
SVMNBDTEMLP
Accuracy 0.79 ± 0.04 0.68 ± 0.03 0.90 ± 0.02 0.78 ± 0.03
Table 6. Classification accuracies of SVM, NB, DTE, and MLP models for various manufacturers and cell formats.
SVMNBDTEMLP
Cell format18650 0.85 0.72 0.93 0.85
21700 0.46 0.64 0.82 0.56
ManufacturerKULR 0.58 0.42 0.59 0.33
LG 0.85 0.81 1 0.96
Molicel 0.9 111
Saft0010
Samsung1111
Sanyo1 0.75 11
Sony 0.75 0.75 11
Soteria 0.79 0.57 0.86 0.71
Disclaimer/Publisher’s Note: The statements, opinions and data contained in all publications are solely those of the individual author(s) and contributor(s) and not of MDPI and/or the editor(s). MDPI and/or the editor(s) disclaim responsibility for any injury to people or property resulting from any ideas, methods, instructions or products referred to in the content.

