Article

Evaluation of Cumulative Damage and Safety of Large-Diameter Pipelines under Ultra-Small Clear Distance Multiple Blasting Using Non-Electric and Electronic Detonators

1
State Key Laboratory Precision Blasting, Jianghan University, Wuhan 430056, China
2
Hubei Key Laboratory of Blasting Engineering, Jianghan University, Wuhan 430056, China
3
School of Civil Engineering, Qingdao University of Technology, Qingdao 266520, China
*
Author to whom correspondence should be addressed.
Appl. Sci. 2024, 14(19), 9112; https://doi.org/10.3390/app14199112
Submission received: 24 August 2024 / Revised: 25 September 2024 / Accepted: 28 September 2024 / Published: 9 October 2024
(This article belongs to the Special Issue New Challenges in Urban Underground Engineering)

Abstract

:
The safety assessment and control of large-diameter pipelines under tunnel blasting at ultrasmall clear distances is a significant problem faced in construction. However, there has been no reference case for the quantitative comparison of the disturbance degree of surrounding rock by using two blasting schemes of non-electric detonator design and electronic detonator design under a similar total blasting charge consumption. In this study, the blasting test was carried out based on the engineering background of drilling and blasting methods to excavate the tunnel under the water pipeline at a close distance. The peak particle velocity (PPV), stress, and deformation responses of the pipeline under the two construction methods of non-electric and electronic detonators were comparatively analyzed. The PPV can be remarkably reduced by 64.2% using the hole-by-hole initiation of the electronic detonators. For the large-diameter pipeline, the PPV on the blasting side was much larger than that on the opposite side because the blasting seismic wave propagated a longer distance and attenuated more rapidly, owing to its greater cavity vibration reduction effect. The PPV of the electronic detonators decayed more slowly than that of the non-electric detonators. The cumulative damage caused by consecutive hole-by-hole blasting using electronic detonators was less than that caused by simultaneous multi-hole initiation using non-electric detonators, with a reduction of about 50.5%. When the nearest peripheral holes away from the pipeline are detonated, the cumulative damage variable D and damage range increase rapidly. The PPV, dynamic tensile strength, and cumulative damage variables were used to evaluate the safety of the pipelines.

1. Introduction

The blasting method offers a high degree of flexibility and notable cost-effectiveness in excavating hard rock tunnels, such as urban subways, highways, and high-speed railways. When an urban tunnel passes through an underground pipeline at a close distance, it is prone to cause blasting damage to the pipeline because of inadequate blasting vibration control technology. The underground pipelines, due to their limited internal space and deep burial, make it almost impossible to monitor the explosion response effectively. Moreover, owing to the influence of many factors, such as the pipeline itself, stratum properties, and blasting construction methods, research on blasting vibration damage mechanisms and safety evaluation control of pipelines is more complicated.
Currently, some scholars use the theory of explosion stress wave propagation [1], the Winkler model [2], and the Timoshenko beam model [3] to make the vibration response calculation of a pipeline under blasting consistent with an actual situation. However, the calculation process is complicated and inconvenient for engineering applications, and the influence of many factors cannot be sufficiently considered. Numerical simulations have been widely used in engineering blasting because of their high efficiency and low cost. Yan et al. [4] and Mohsen et al. [5] concluded that the displacement and vibration velocity of the pipeline explosion side are larger than those of its opposite side and determined that the part of the pipeline with an incident angle of 0–45° is a vulnerable area. Zhou et al. [6,7,8,9,10] studied the vibration and stress responses of cast iron, high-density polyethylene, reinforced concrete, and steel pipes, and the different interface types of pipelines under blasting using a numerical simulation method. A dynamic failure mechanism of a pipeline, owing to blasting under different conditions, was put forward. Guan et al. [11] studied the vibration response characteristics of circular, horseshoe, and rectangular pipelines and concluded that the parts of pipelines vulnerable to damage were significantly different for different shapes of pipelines. Qin et al. [12] observed that the maximum values of stress and vibration velocity were not located at the same position. In addition, the experimental method mainly used a dynamic strain and blasting vibration velocity test system to test parameters such as the axial and circumferential strain, pressure, and vibration velocity; however, this test is more suitable for shallow-buried pipelines. Francini et al. [13] obtained the relationship between the allowable stress of the pipeline, explosive charge, and wall thickness of the pipeline by monitoring the blasting operation. Anirban [14] and Mane [15] conducted a dynamic response test of pipelines under surface explosions and found that a protective device made of polyurethane material or the addition of geotechnical foam around the pipeline can effectively reduce explosion damage and deformation. Based on an open-pit deep-hole blasting test. Jiang et al. [16] conducted an analysis of the vibration characteristics caused by blasting on pipelines at various burial depths and proposed safety control standards for pipeline vibration velocity. Other scholars have studied the influence of steel large-diameter pipelines on resistance to dynamic disturbance. Patnaik et al. [17] studied the underground blasting performance of X70 grade steel pipe pipeline, calculated the anti-explosion load performance of pipeline thickness, internal pressure, soil type, carbon fiber cloth thickness, and other factors, and summarized the safety area of underground pipeline against underground explosion load. Mahgoub et al. [18] studied the impact of earthquakes on large-diameter culverts built with corrugated steel plates. It is found that the widely used equation evaluation method significantly underestimates the destructive effect of earthquakes. Davis et al. [19] studied the damage effect of large-diameter corrugated metal pipes against seismic load dynamic waves and summarized the quasi-static analysis method of large-diameter flexible underground pipelines based on ground strain. The evaluation of transient strain and permanent strain of the pipeline can be realized.
For the safe operation of pipelines under tunnel blasting vibrations, the key is to ensure that the peak particle velocity (PPV, under the action of seismic waves—the velocity of reciprocating motion of medium particles, generally obtained by blasting vibration sensor and supporting blasting vibration monitor) does not exceed the allowable vibration speed standard. According to the Blasting Safety Regulations (GB6722-2014) [20], the standard for PPV of a hydraulic tunnel under different frequencies is in the range of 7–15 cm/s. By fitting the relationship between the tensile stress and vibration velocity of a structure under tunnel blasting, Jiang [21] and Zhang [22] proposed a blasting safety vibration control standard for underground structures according to the maximum tensile stress failure criterion. Cui et al. [23] and Li et al. [24] studied the failure behavior of pipelines with dent defects under the action of nearby explosions, quantified the deformation of pipelines caused by different defect sizes, and obtained a wider function relationship between defect and plastic deformation. Zhu [25] proposed a formula to calculate the safe vibration velocity of blasting under different operating pressures based on the maximum shear stress failure criterion. Zhang et al. [26] and Chen et al. [27] studied the damage behavior of polyethylene bellows subjected to explosion. Based on intelligent algorithms such as genetic algorithm and particle swarm optimization, the optimal intelligent model of pipeline response characteristics was predicted. The research results provide suggestions for blasting design. In addition, there were many cases of analyzing the failure of surrounding rock under close blasting from the perspective of cumulative damage [28,29,30,31,32,33], while there is little research on the cumulative damage and safety evaluation of pipelines under the blasting of a large number of boreholes and continuous initiation of multiple rows of multiple blast holes.
In summary, most studies have focused on the vibration response and stress-velocity safety evaluation methods for small-diameter pipelines (usually less than 1 m) under tunnel blasting. However, the research on large-diameter (more than 6 m) pipelines is not yet sufficient. In addition, the effect of close-range blasting on pipelines has been relatively overlooked, as most studies tend to concentrate on the vibration response of pipelines caused by far-field blasting. Moreover, quantitative comparative analyses of the vibration response and cumulative damage of pipelines under different types of simultaneous multi-hole initiation using non-electric detonators and hole-by-hole initiation using electronic detonators have been less studied. Finally, a pipeline safety evaluation standard based on the cumulative damage variable and damage range was not available.
There is a lack of quantitative research on the vibration reduction design of electronic detonators in the field of safety performance research of large-diameter water pipelines under the influence of ultra-close drilling and blasting construction. Based on typical engineering cases, this study carried out field tests, theoretical analysis, and numerical calculation methods to conduct a detailed quantitative comparative study on the design of non-electric detonators and electronic detonators under approximate consumption. The cumulative damage characteristics of the pipeline under multi-hole simultaneous initiation and hole-by-hole blasting were analyzed. The PPV can be reduced by up to 64.2%, and the cumulative damage range can be significantly reduced by about 50.5% by using the electronic detonator explosion scheme, which can realize one-by-one explosion hole initiation. A blasting safety evaluation method for pipelines based on vibration velocity, dynamic load, ultimate tensile strength, and cumulative damage threshold was established. Finally, a comprehensive vibration-reduction technology is proposed.

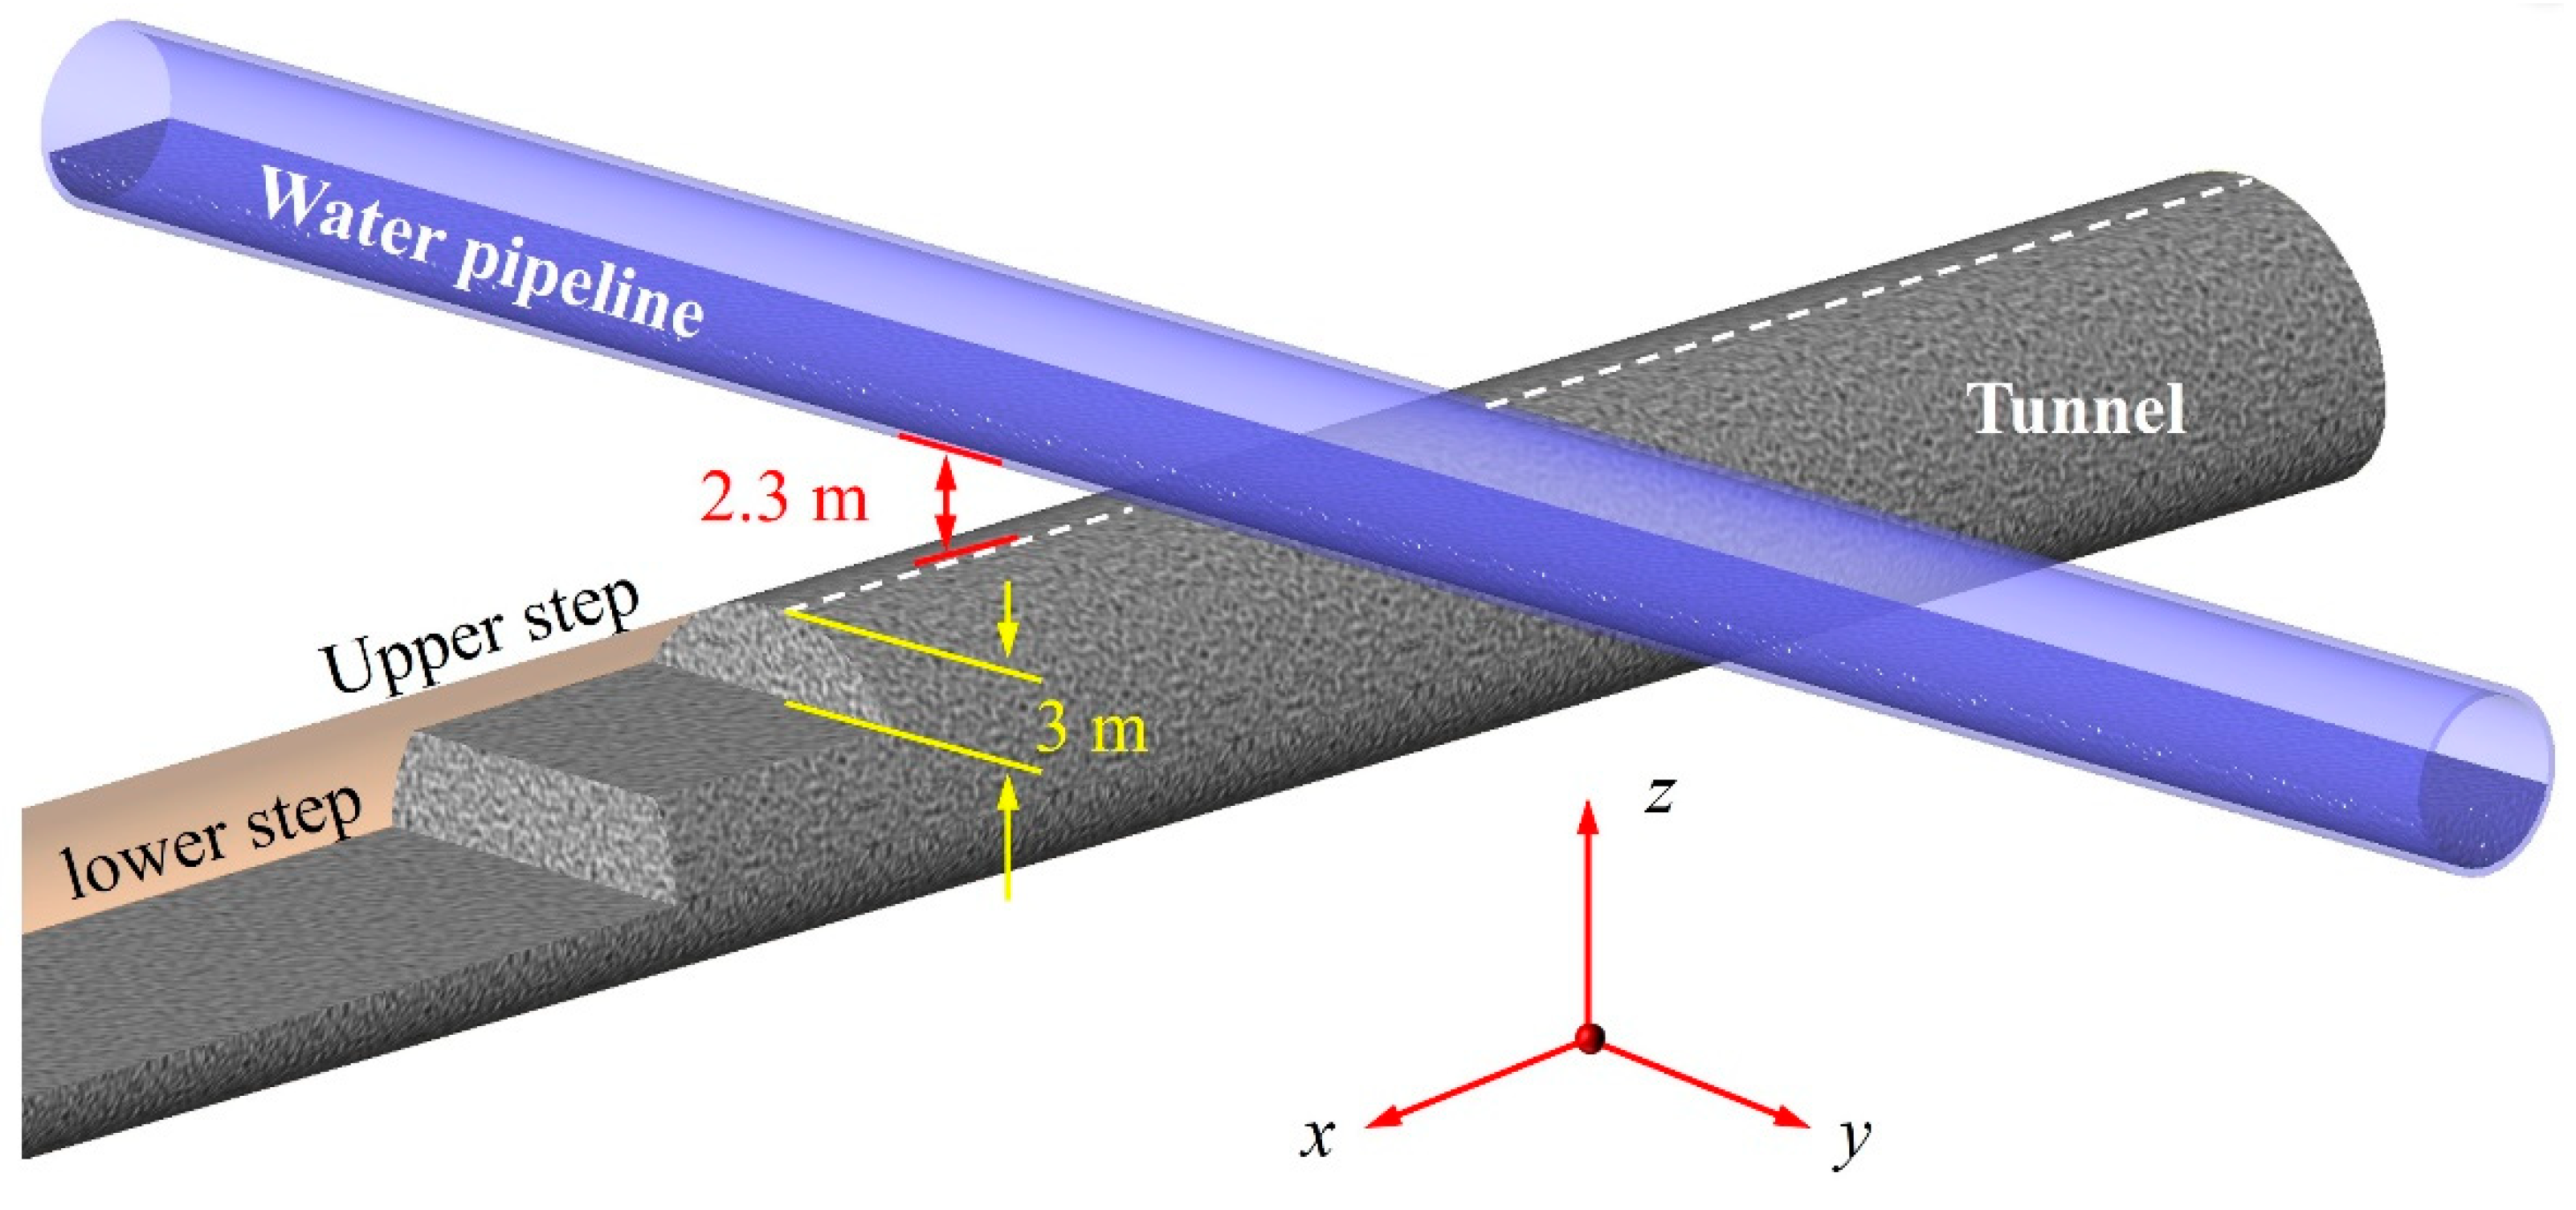
2. Engineering Information

2.1. Project Overview

A high-speed railway tunnel is composed of two main tunnels, the south and north tunnels and auxiliary cross-passages. The span of the maximum excavation section is 29.8 m, which belongs to the super-large-span tunnel category, and its buried depth is approximately 28 m. The tunnel stratum is primarily composed of granite mixed with metamorphic rock and a fully weathered zone. In some areas, the distribution of jointed fracture zones was dense. Groundwater is present, and the geological conditions are complex. As the tunnel section is large and irregular, an appropriate and economical drilling and blasting method with good and economy was used in the project.
The main line of the tunnel is located in the urban area of Shenzhen City, and buildings and structures are densely distributed along the tunnel. The tunnel under construction is being built in close proximity, at a minimum distance of 2.3 m, to the bottom of an existing large pipeline. The axial line of the tunnel is nearly perpendicular to that of the pipeline. The spatial relationship between the tunnel and pipeline is illustrated in Figure 1—high-speed railway tunnel underneath an existing large water pipeline. Existing water pipelines are the main urban pipelines and are composed mainly of a cast-in-place reinforced concrete lining. The existing pipeline has a diameter of 6 m and is made of C50 concrete with a thickness of 35 cm. The reinforced concrete lining contains a reinforced skeleton composed of Φ16 HRB335 longitudinal bars and Φ10 stirrups.

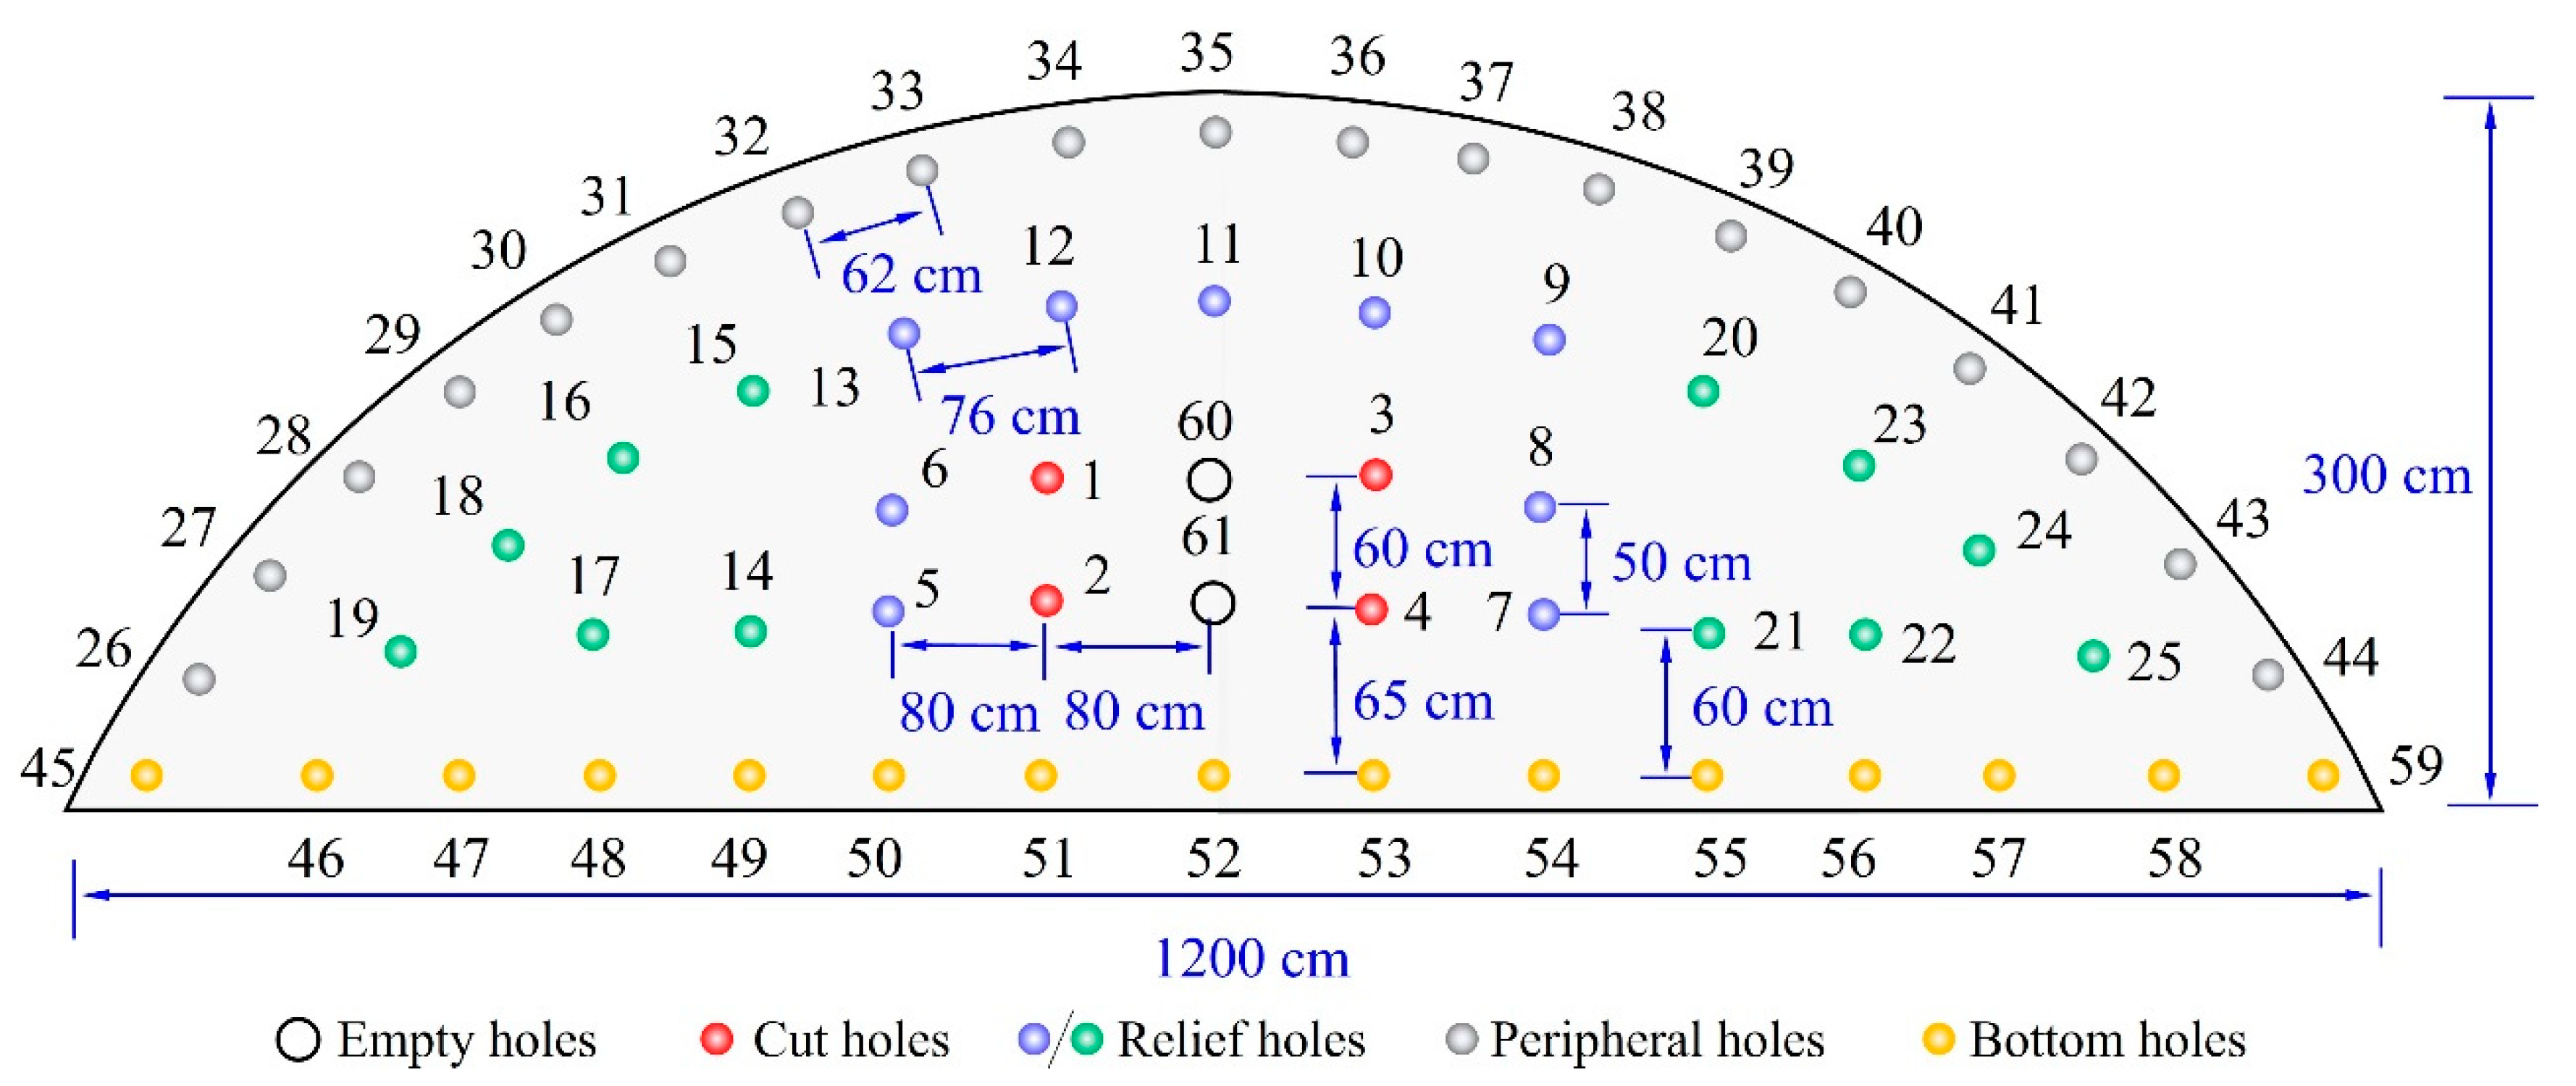
2.2. Parameters of Blasting Scheme

The upper- and lower-bench methods with high efficiency are used for excavating tunnels when the tunnel excavation face is far from the water pipeline. The design parameters for the upper bench are shown in Figure 1 and Figure 2. Each blast advances the excavation face forward by 2.5 m and uses a #2 rock emulsion explosive. A nonel tube detonator was used for the detonation. The single-hole charges of the cut, relief, peripheral, and bottom holes were 0.9, 0.7, 0.6, and 0.8 kg, respectively. Empty holes are arranged around the cutting holes to reduce blasting vibration and to help form a cutting area. The specific blasting hole arrangement and design parameters are presented in Figure 2 and Table 1, respectively.

3. Blasting Test and Vibration Safety Evaluation

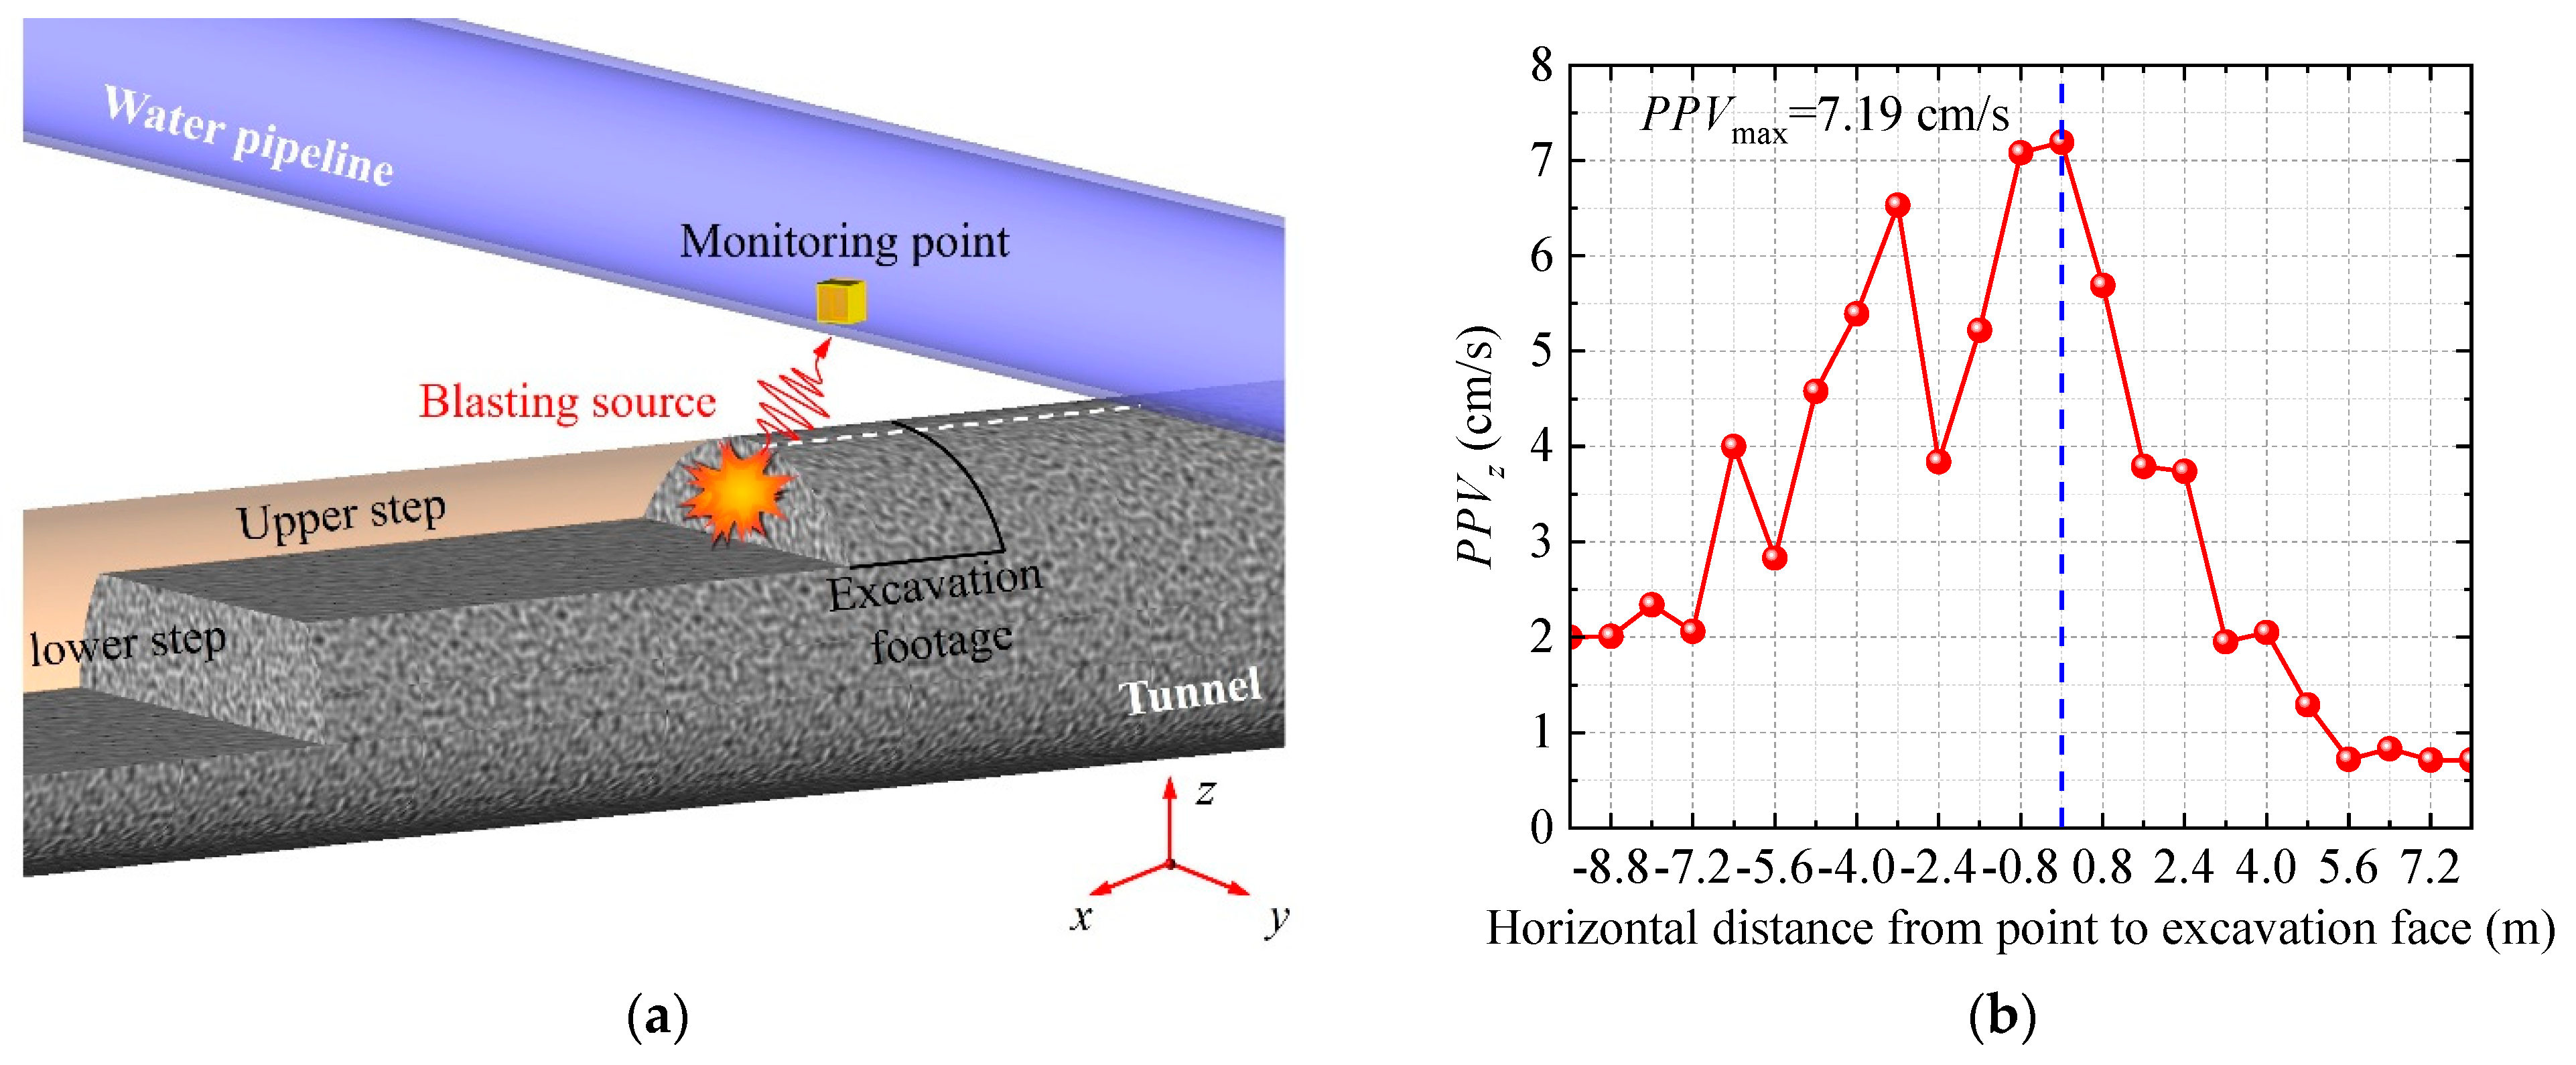
3.1. Determination of the Blast Hole Type for Greatest Influence on Pipeline

To evaluate the adverse effects of vibrations caused by upper bench blasting on pipeline safety, it is necessary to search the type and location of blast holes that have the greatest impact on pipelines. Based on a large number of in-situ interlaid rock blasting tests, Fu et al. [33] studied the blasting vibration law of different blast holes in different areas. When the other blast holes are detonated, there are two or more free surfaces, and the energy decays faster than that at the cut holes. The energy of the cut holes remains higher than that of other holes after attenuation over a certain distance. Therefore, in long-range blasting, the PPV generated by cut holes is often the highest. But when the distance between the excavation face and the research object is close enough, the spacing of the blast holes will become a determining factor. The maximum PPV was induced by the blasting of the nearest holes (i.e., peripheral holes) in the near field of the tunnel.
The near and far fields of the blasting division are generally divided by a scaled distance (SD), which is defined as follows:
S D = R Q n
where R is the distance from the blasting face to the measuring point (m). Q is the maximum simultaneous explosive charge (typically includes multiple holes) per delay (kg), and n is the attenuation index, which is related to the form of the explosive package. For columnar charges, n = 1/3 is generally used. When SD ≤ 5.0, the blasting is considered to be near-field, and when SD > 5.0, it is considered far-field. Specifically, when it is in the far field of the explosion source, the peak value of the vibration velocity is mainly affected by the blasting of the cutting holes with a large charge. In the near-field of the explosion source, the distance becomes the most important influencing factor, and the peak value of the vibration velocity is mainly affected by the blasting of the peripheral holes closest to the monitoring position.
In this project, for cut holes, R = 4.0 m, Q = 0.9 kg, SD = 4.143; for peripheral holes, R = 2.3 m, Q = 0.6 kg, SD = 2.727. Irrespective of whether they are cut holes or peripheral holes, because SD < 5, the pipeline is located near the field of tunnel blasting. Therefore, the pipeline was primarily affected by the impact of the explosion on the closest peripheral holes [34].

3.2. Blasting Test and Vibration Safety Evaluation of Water Pipeline

According to the relative locations of the tunnel and pipeline, the closest distance between the peripheral holes and pipeline was 2.3 m. A testing condition was found here that approximately reproduces the effect of the blasting face on the pipeline above it. Specifically, the research case was replicated by drilling blast holes at a distance of 2.3 m below the surface of the upper bench. Three blast holes were drilled at a depth of 2 m, with a 1 m interval on the lower bench, and each hole was loaded with 0.6 kg of explosive. Due to the close spacing of the blast holes, to eliminate mutual interference, their ignition times were defined as MS1, MS3, and MS5, respectively. After installing vibration monitoring equipment on the upper bench, the blasting vibration assessment test was carried out for the work on the lower bench, as shown in Figure 3. Design and implementation process of alternative in situ testing: (Figure 3a) Diagram of the testing; (Figure 3b) the operating process of testing. In addition, the monitoring equipment adopted the TC-4850N wireless network vibrometer developed by Zhongke (Chengdu) Instruments Co., Ltd. (Chengdu, China). The maximum sampling rate can be up to 100 k Sps, and the sampling rate of 5 k Sps can well meet the test requirements of blasting frequency. The result of the blasting response is shown in Figure 4. Vibration waveform monitored from tests. Figure 4a–c correspond to the vibration velocity in the x, y, and z directions, respectively.
The PPV in each direction of the monitoring results exceeds the standard required by the “the safety standards for hydraulic tunnels in Blasting Safety Regulations (GB6722-2014) [20]”, which states that when subjected to high-frequency vibration (50 Hz), the maximum PPV should not exceed 15 cm/s. Therefore, vibration damage is likely to occur in the water pipeline when the closest peripheral holes are blasted.
To further evaluate the degree of damage to the pipeline under the original blasting method, the vibration response and accumulative damage characteristics of the pipeline under non-electric detonator blasting were studied using numerical simulations. Subsequently, a vibration reduction blasting scheme for the electronic detonator was proposed, and the blasting vibration response and accumulative damage characteristics of the pipeline were analyzed. By comparing the pipeline damage characteristics of the two blasting methods described above, an optimal blasting scheme was obtained.

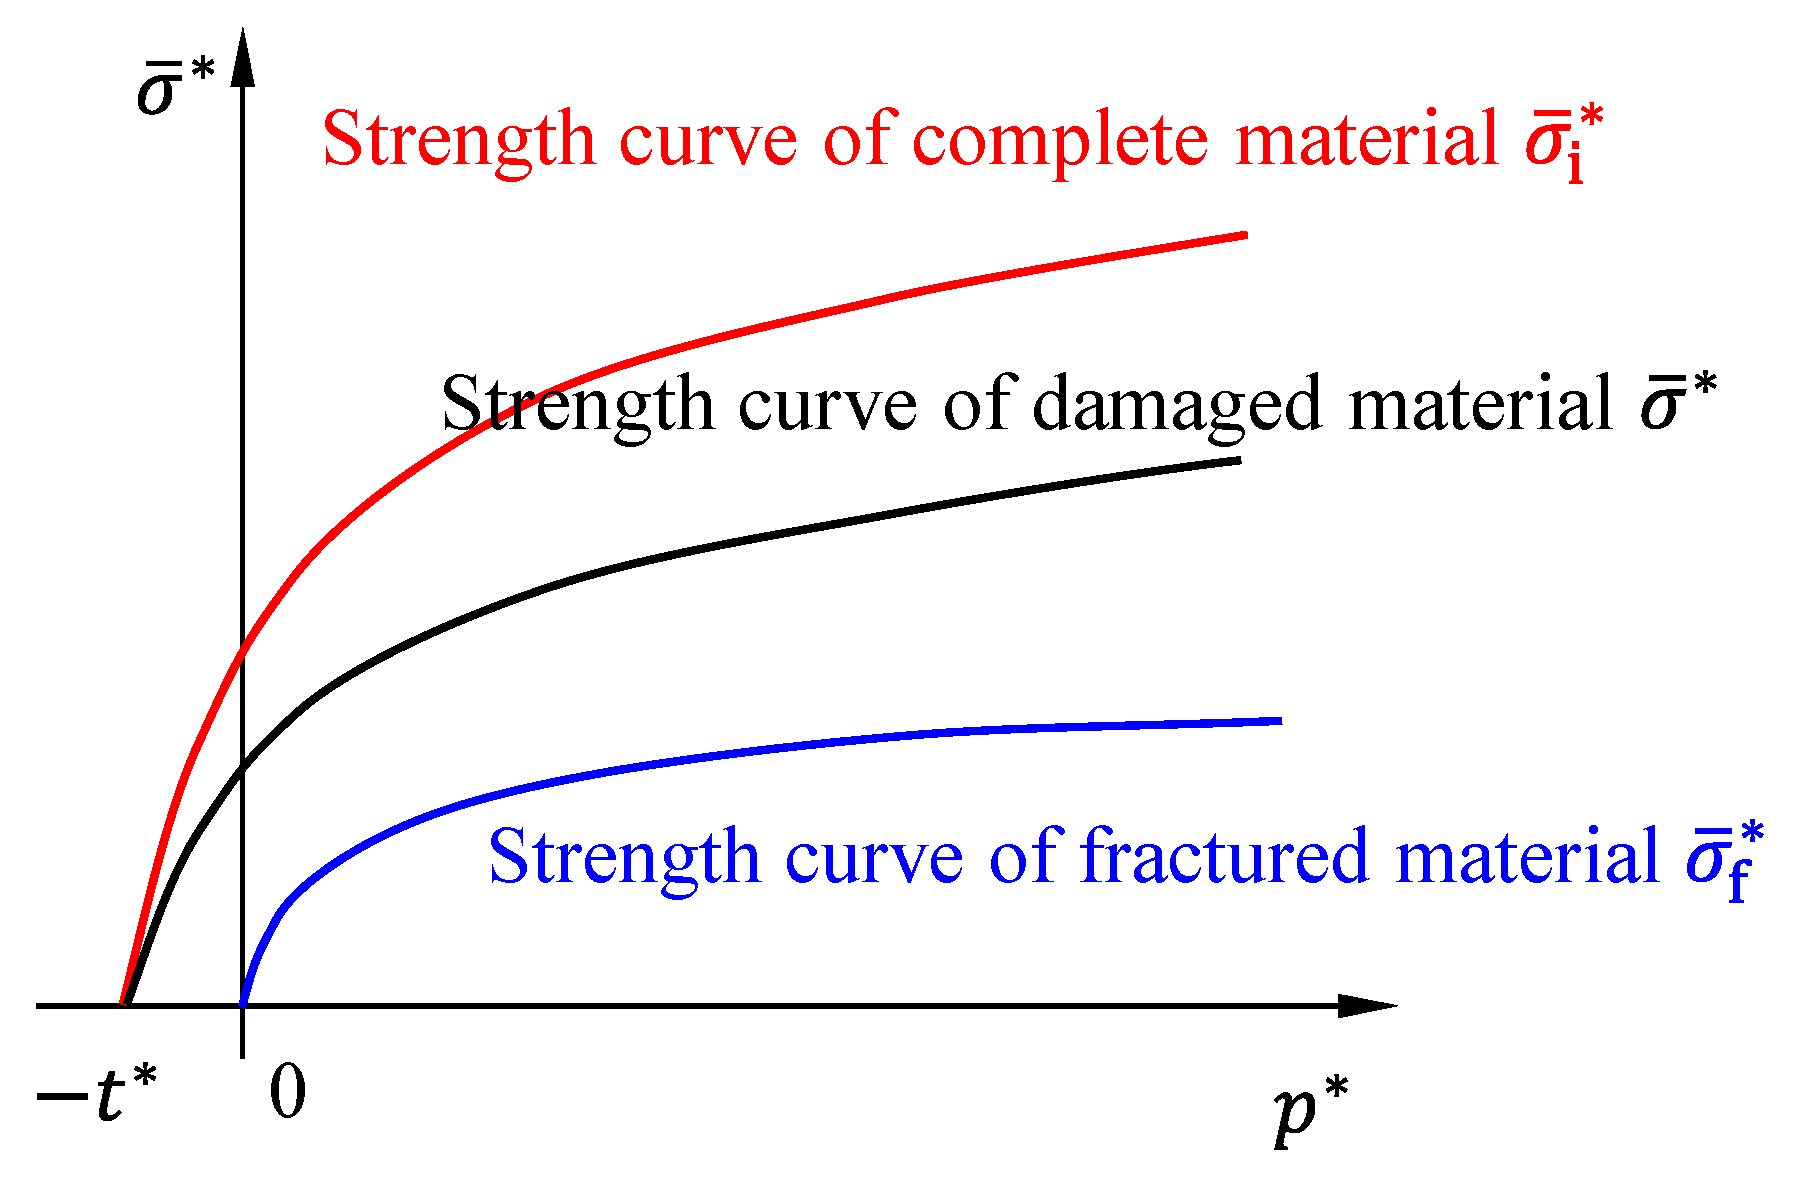
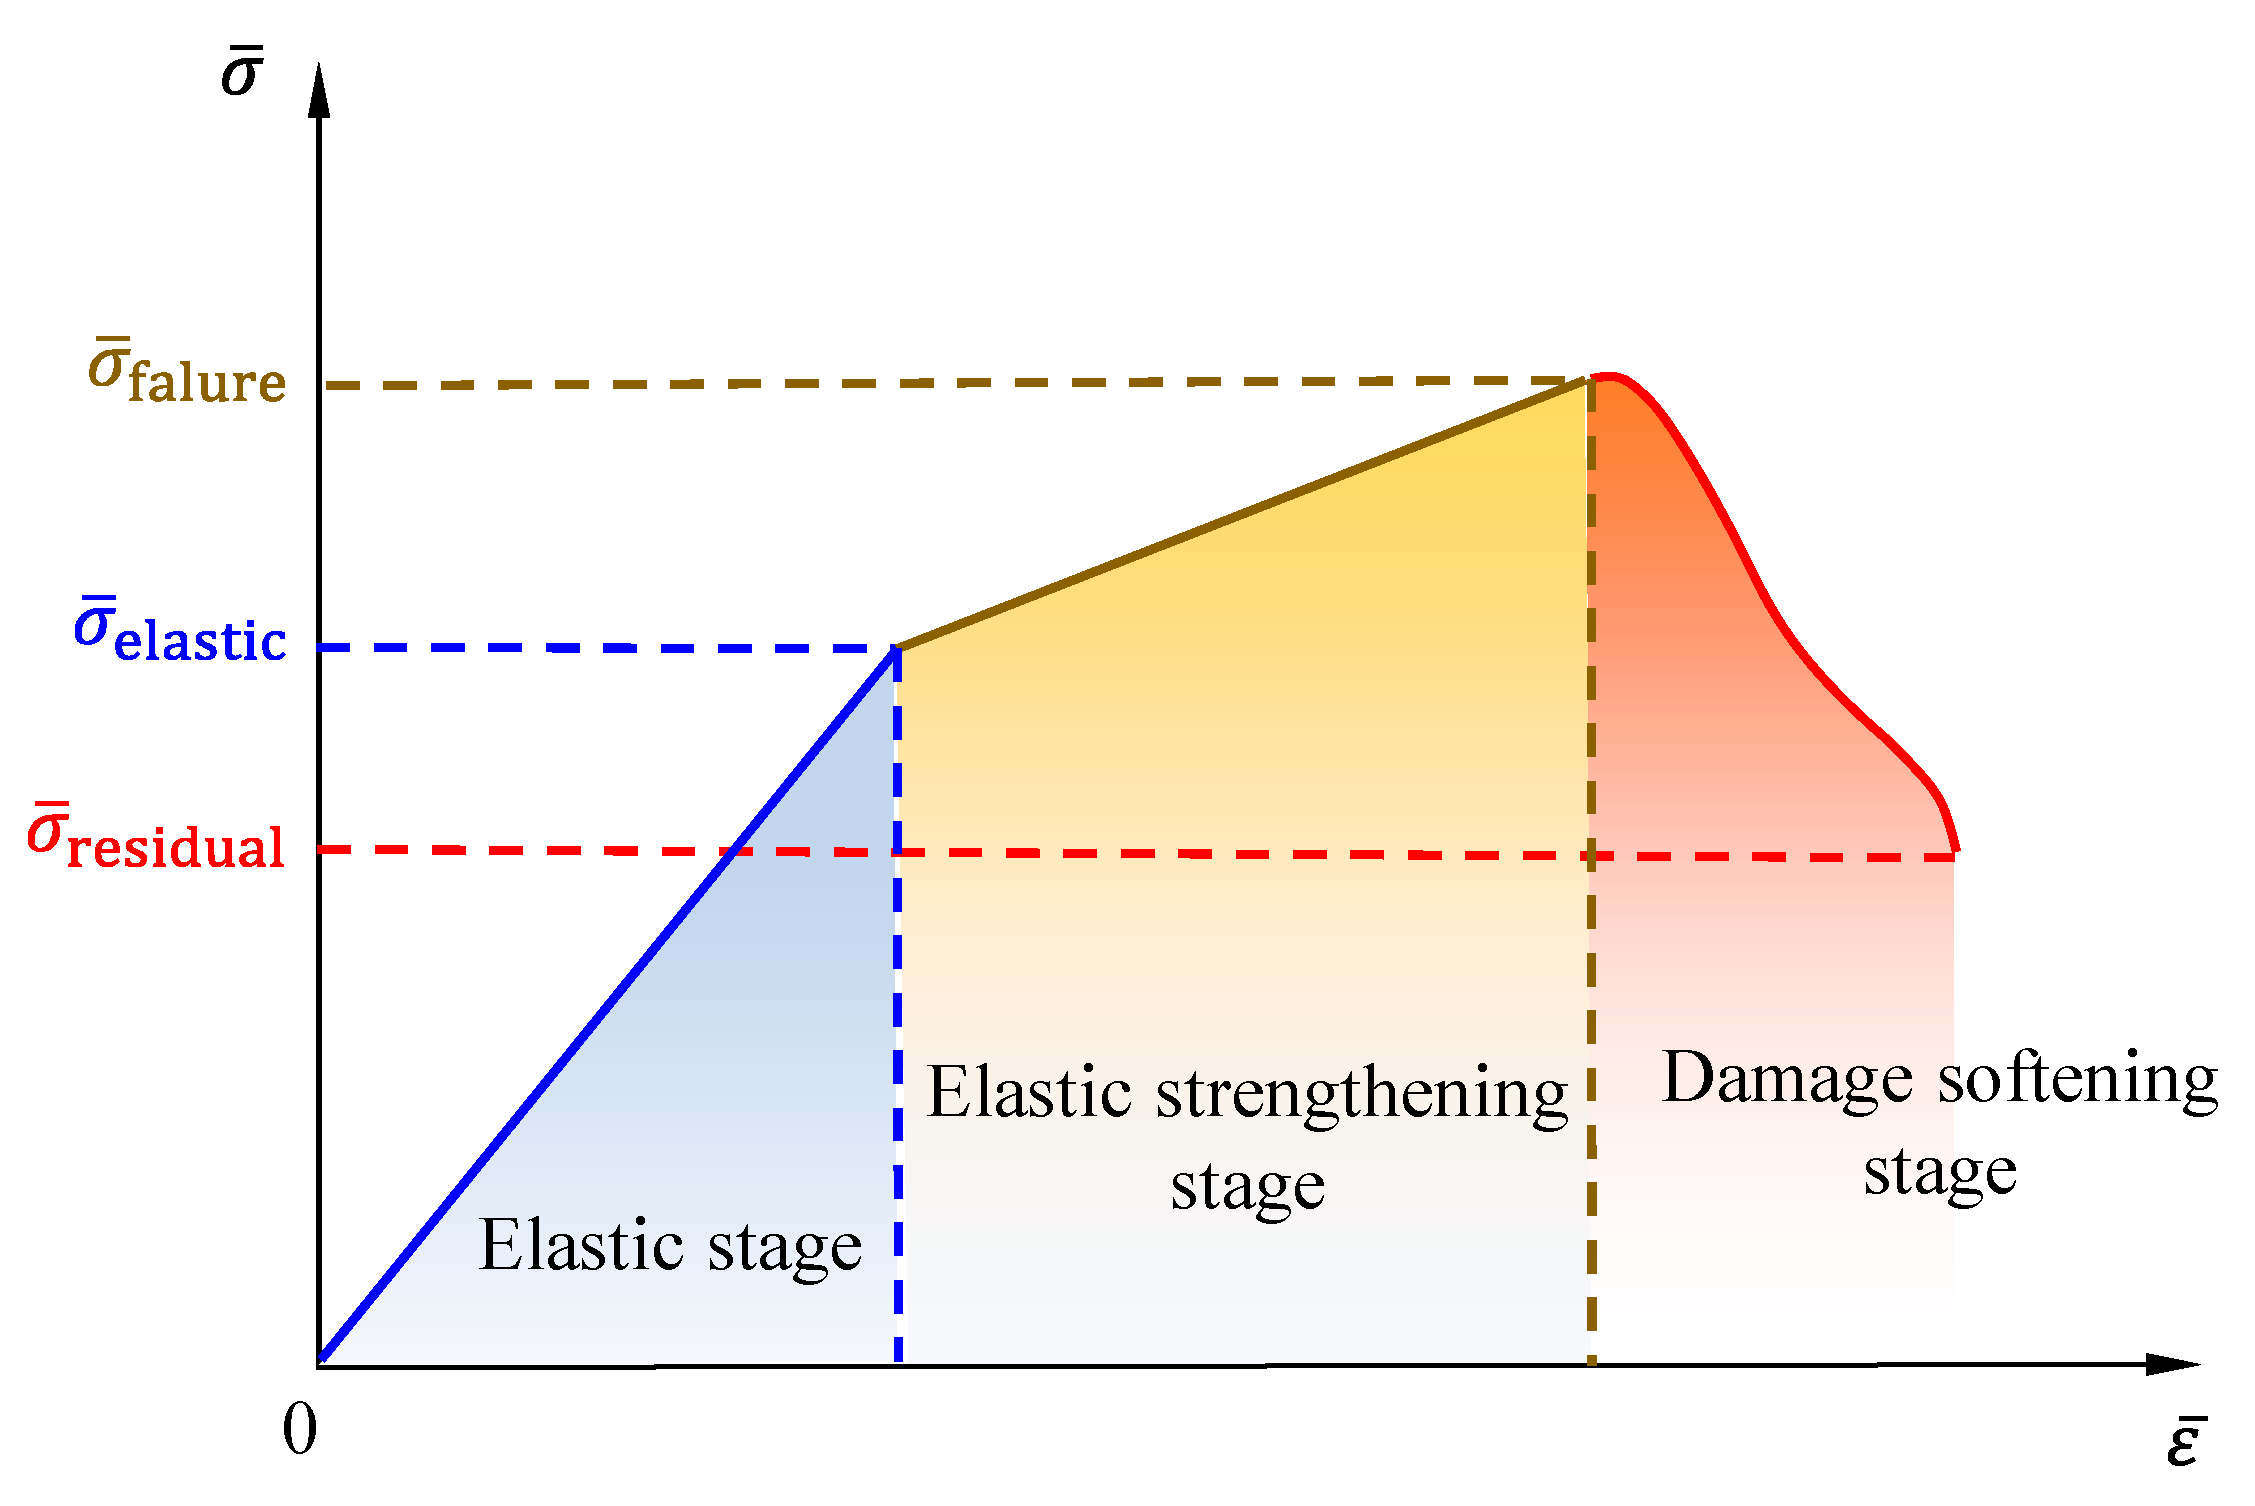
4. Cumulative Damage Theory and Numerical Model Establishment

4.1. Surrounding Rock Model

The explicit finite element software LS-DYNA19.0 is widely used for simulating explosion processes. In this study, this simulation method is applied, and the Johnson–Holmquist II (JH-2) constitutive model was used to simulate the surrounding rock of the tunnel. In the JH-2 material model, the relationship between the equivalent stresses of the integrated ( σ i * ), damaged ( σ * ), and fractured ( σ f * ) materials with a change in standardized pressure (P*) is shown in Figure 5 [21]. The relationship between the equivalent stress and damage variable is described by the function shown in Equation (2).
σ * = σ i * D σ i * σ f *
where the dimensionless number D is the damage variable. This variable can sufficiently reflect the gradient damage process when the material gradually deteriorates from the complete to the final fractured material with increasing loading.
D = Δ ε p ε f p
ε f p = d 1 p * + t * d 2
σ f * = b p * m 1 + c l n   ε ˙ * S F m a x
where Δ ε p is the increased equivalent plastic strain in the integral cycle during loading, d1 and d2 are the damage coefficients related to the material properties, and the main function of d1 is to control the rate of damage accumulation. SFmax represents the maximum normalized fracture strength of the material and ε f p is the equivalent plastic fracture strain value of the surrounding rock under the action of a constant hydrostatic pressure load p. The equation of state of the JH-2 material model is given by Equation (6):
p = k 1 μ + k 2 μ 2 + k 3 μ 3
μ = ρ ρ 0 1
where k1 is the material’s bulk modulus; k2 and k3 are coefficients related to loading pressure; μ is the volume strain rate, and it will gradually increase with the process of material damage; ρ and ρ 0 are the current density and the initial density values of the material.
The rock strata in this area are composed primarily of hard granite. Based on an engineering geological survey report and the relevant literature [35], the values of each parameter are listed in Table 2. Parameters of rock material model [36]. The G in the table is the material’s shear modulus. HEL represents the material’s elastic limit. A, N, and C are constants related to the material properties.

4.2. Concrete Model of the Pipeline

To better reflect the cumulative damage to the concrete pipelines as a result of the explosion, the Riedel–Hiermaier–Thoma (RHT) model, which includes more failure criteria, was used in this study. The p-a equation of state of the RHT model is given by Equation (8) [37].
α t = m a x 1 , m i n α 0 , m i n s t 1 + α 0 1 p c o m p p s p c o m p p c r u s h N
p c = p c o m p p c o m p p c r u s h α 1 α 0 1 1 / N
where α 0 is the initial porosity of the material, p and e, respectively, represent pressure and internal energy, p c o m p and ρ s are the pressure and density values of the material when it is compacted, p c r u s h is the critical pressure at which the material begins to crush, N is an index related to the porosity, and p c is the capping pressure.
The material model introduces three limit surface equations for the elastic limit, residual strength, and failure surfaces to describe the relationship between the elastic limit, residual strength, failure strength, and hydrostatic pressure when the material is subjected to an impact load, as shown in Figure 6. Change stage of mechanical properties of materials under impact load of RHT model [38].
The cumulative damage process of the RHT material model occurred only in the softening stage after the damage. The damage variable D in the process can be calculated by an approximate interpolation between the failure surface and participating strength surface, as shown in Equations (10) and (11).
0 D = Δ ε p ε p f a i l u r e 1
ε p f a i l u r e = D 1 p * H T L * > ε p m
where D1 is a parameter related to the damage variable, p* is the standardized equivalent pressure, ε p m is the minimum equivalent plastic strain parameter of the material, and D varies from 0 to 1, which is consistent with the damage variable of the JH-2 material model; both indicate the extent of damage to the material from the time damage sets in, to the point of complete failure.
Based on an engineering geological survey report and the relevant literature [36], the values of each parameter of the concrete RHT model are shown in Table 3—Assignment of the RHT constitutive model.

4.3. Reinforcement Skeleton Material Model and Parameters

The pipeline lining consists of a longitudinal reinforcement skeleton with a tensile strength of 335 Mpa and a stirrup with a tensile strength of 225 Mpa. To reduce the computational cost, both were simulated using the linear beam element defined by MAT_PLASTIC_KINEMATIC [39]. The material and strain rate parameters are listed in Table 4—steel skeleton material parameters.

4.4. Explosion Stress Wave Loading Theory and Simulation Method

Considering the characteristics and conditions of the research object and time savings, the loading blast pressure on the blast hole wall was used to simulate the source of the explosion [40]. The key to acquiring the blast pressure on the blast wall is mainly to determine the peak value and change the historical parameters of the blast wave load. Currently, the isentropic expansion of detonation products and the Chapman–Jouguet model are commonly used to calculate peak explosion loads [41]. Equation (12) can be used to calculate the initial average pressure Pc of the gas on the wavefront following explosive detonation.
  P c = ρ e V O D 2 2 γ + 1
where VOD represents the detonation velocity, γ represents the isentropic exponent, and ρ e represents the explosive density.
The uncoupled form of the cylindrical charge was adopted on-site. When the gas in the detonation product collides with the surrounding rock of the borehole wall, reflection superposition of the explosion wave occurs, resulting in an instantaneous increase in the pressure calculated according to Equation (13) [41].
P 0 = n ρ e V O D 2 8 d c d b 6 l c l b 3
The lc, dc, lb, and db represent the charge length, charge diameter, borehole depth, and borehole diameter, respectively. N is the proportional coefficient. The value of n is taken as 10.0 in this study.
Using the parameters of the #2 rock emulsion explosive in the study, the explosive had a density of 1000 kg/m3 and a velocity of 3600 m/s. γ = 3.0 , n = 10, d c = 32 mm, d b = 42 mm. Table 5—equivalent load of hole wall of different blast holes—lists the calculated pressure on the borehole wall for different holes, as per Equation (13).
In order to accurately replicate the effects of the explosion, a time-dependent exponential decay function was used to approximate the change in the explosion load, as shown in Figure 7—explosion stress wave pulse function curve—and given by Equation [42].
P = P 0 e α t e β t
In the given Equation, P represents the borehole wall pressure at time t, P0 is the peak pressure of the borehole, and α and β are the attenuation constants. Tr and td represent the time of the maximum load and the total time of the load, respectively.
By referring to the theoretical analysis results of Yang et al. [43] and combining them with the actual conditions, the values of these two key time parameters in this study are as follows: tr = 100 μs, td = 400 μs. In fact, the equivalent load values of different types of boreholes should be different because the peak value, rise time, and fall time of the load are related to factors such as rock properties, charge quality, and stress wave propagation distance. In order to reduce the computational cost, the equivalent explosion wave function used was appropriately simplified.

4.5. Calculation Model Design and Verification

The dimensions of the computational model were 20 m in width, 18 m in height, and 16 m in depth, as shown in Figure 8. The cut, relief, peripheral, and bottom holes were laid out on the tunnel excavation face, and the hole parameters were consistent with the actual construction. The element size of the model boundary is 30 cm, and the element size around the borehole is refined to 1 cm. The number of elements after division was more than 3.5 million. Displacement constraints were set on the two boundary surfaces before and after the excavation. To replicate the infinite domain condition, infinite domain boundary control conditions were set on the remaining four surfaces. The total calculation time of the simulated explosion using the software was set to 24,000 μs.
To ensure the accuracy of the material parameters and algorithm settings, field-test monitoring data were used for verification. The field monitoring data obtained from the alternative in situ test described in Section 3.2 is presented in Figure 4. In the numerical model, the same three blast holes were first detonated separately. The velocity response of the bottom surface of the pipeline at its nearest location was extracted and compared with the field blasting test data, as shown in Figure 9—the comparison between in situ test results and calculated results. If the same delay times as in the field are used in numerical simulations, namely MS1, MS3, and MS5, the time cost will be very high. Through trial calculation, when the delay time between two shot holes was more than 500 μs, the influence of superposition interference was found to be small. Approximately 1300 μs after the detonation, the blasting seismic wave reached the bottom of the pipeline lining. In the numerical model calculation of this study, the delay time of a single blast hole was set to 2000 μs for subsequent study calculations.
Because complex geological conditions such as joints and fissures were not considered in the numerical simulation, there was a certain error between the numerical simulation results and the measured results. The calculated PPV values in the x-, y-, and z-directions were compared with the measured PPV values, as shown in Figure 9. The comparison between in-situ test results and calculated results, with errors of 9.8%, 6.7%, and 4.9%, respectively. The relative error was less than 10%, verifying the accuracy of the numerical model. Therefore, this numerical simulation research method can be used as an alternative to study the impacts on pipelines under explosion effects.

4.6. Vibration Response of Original Non-Electric Detonator Blasting

The blast holes of the upper bench on-site were divided into five parts for detonation: H1, H2, H3, H4, H5. To reduce the vibration wave superposition effect caused by the small delay time between each part, the delay time of each part in the simulation model is set to 5000 μs according to the actual situation in the field. The initiation delay interval of 5000 μs can be set to realize the individual initiation of each borehole without affecting each other, and similar millisecond delay blasting results can be achieved as in the field test.
As shown in Figure 10, after the initiation of the cutting holes, a deep color crushing area and a crack area with long cracks appeared around the blasting holes. After the blasting holes in each part were detonated, the cracks were interlaced. In addition, it was found that the unexploded blast hole produced stress concentrations and cracks under adjacent hole blasting. After blasting the bottom holes, the entire upper bench section was blasted. There were no excessive overbreaks or underbreaks, and the blasting effect of the numerical simulation was good.
To use non-electric detonator blasting, the vibration (e) of the bottom of the pipeline (called the dangerous point) closest to the pipeline above the tunnel was extracted, as shown in Figure 11.
Figure 11 leads to the following conclusions.
(1)
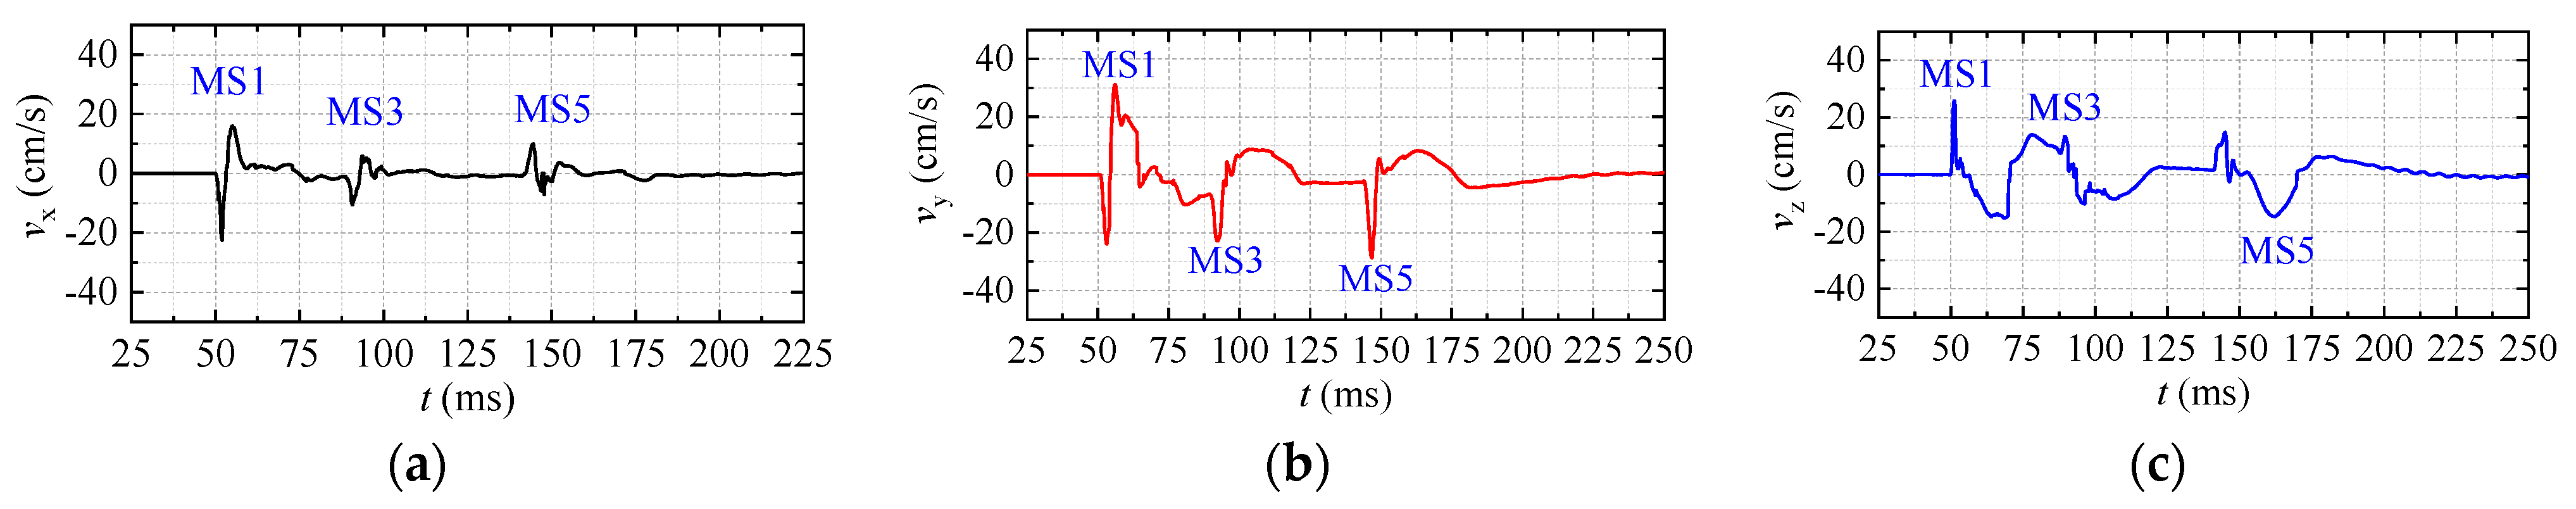
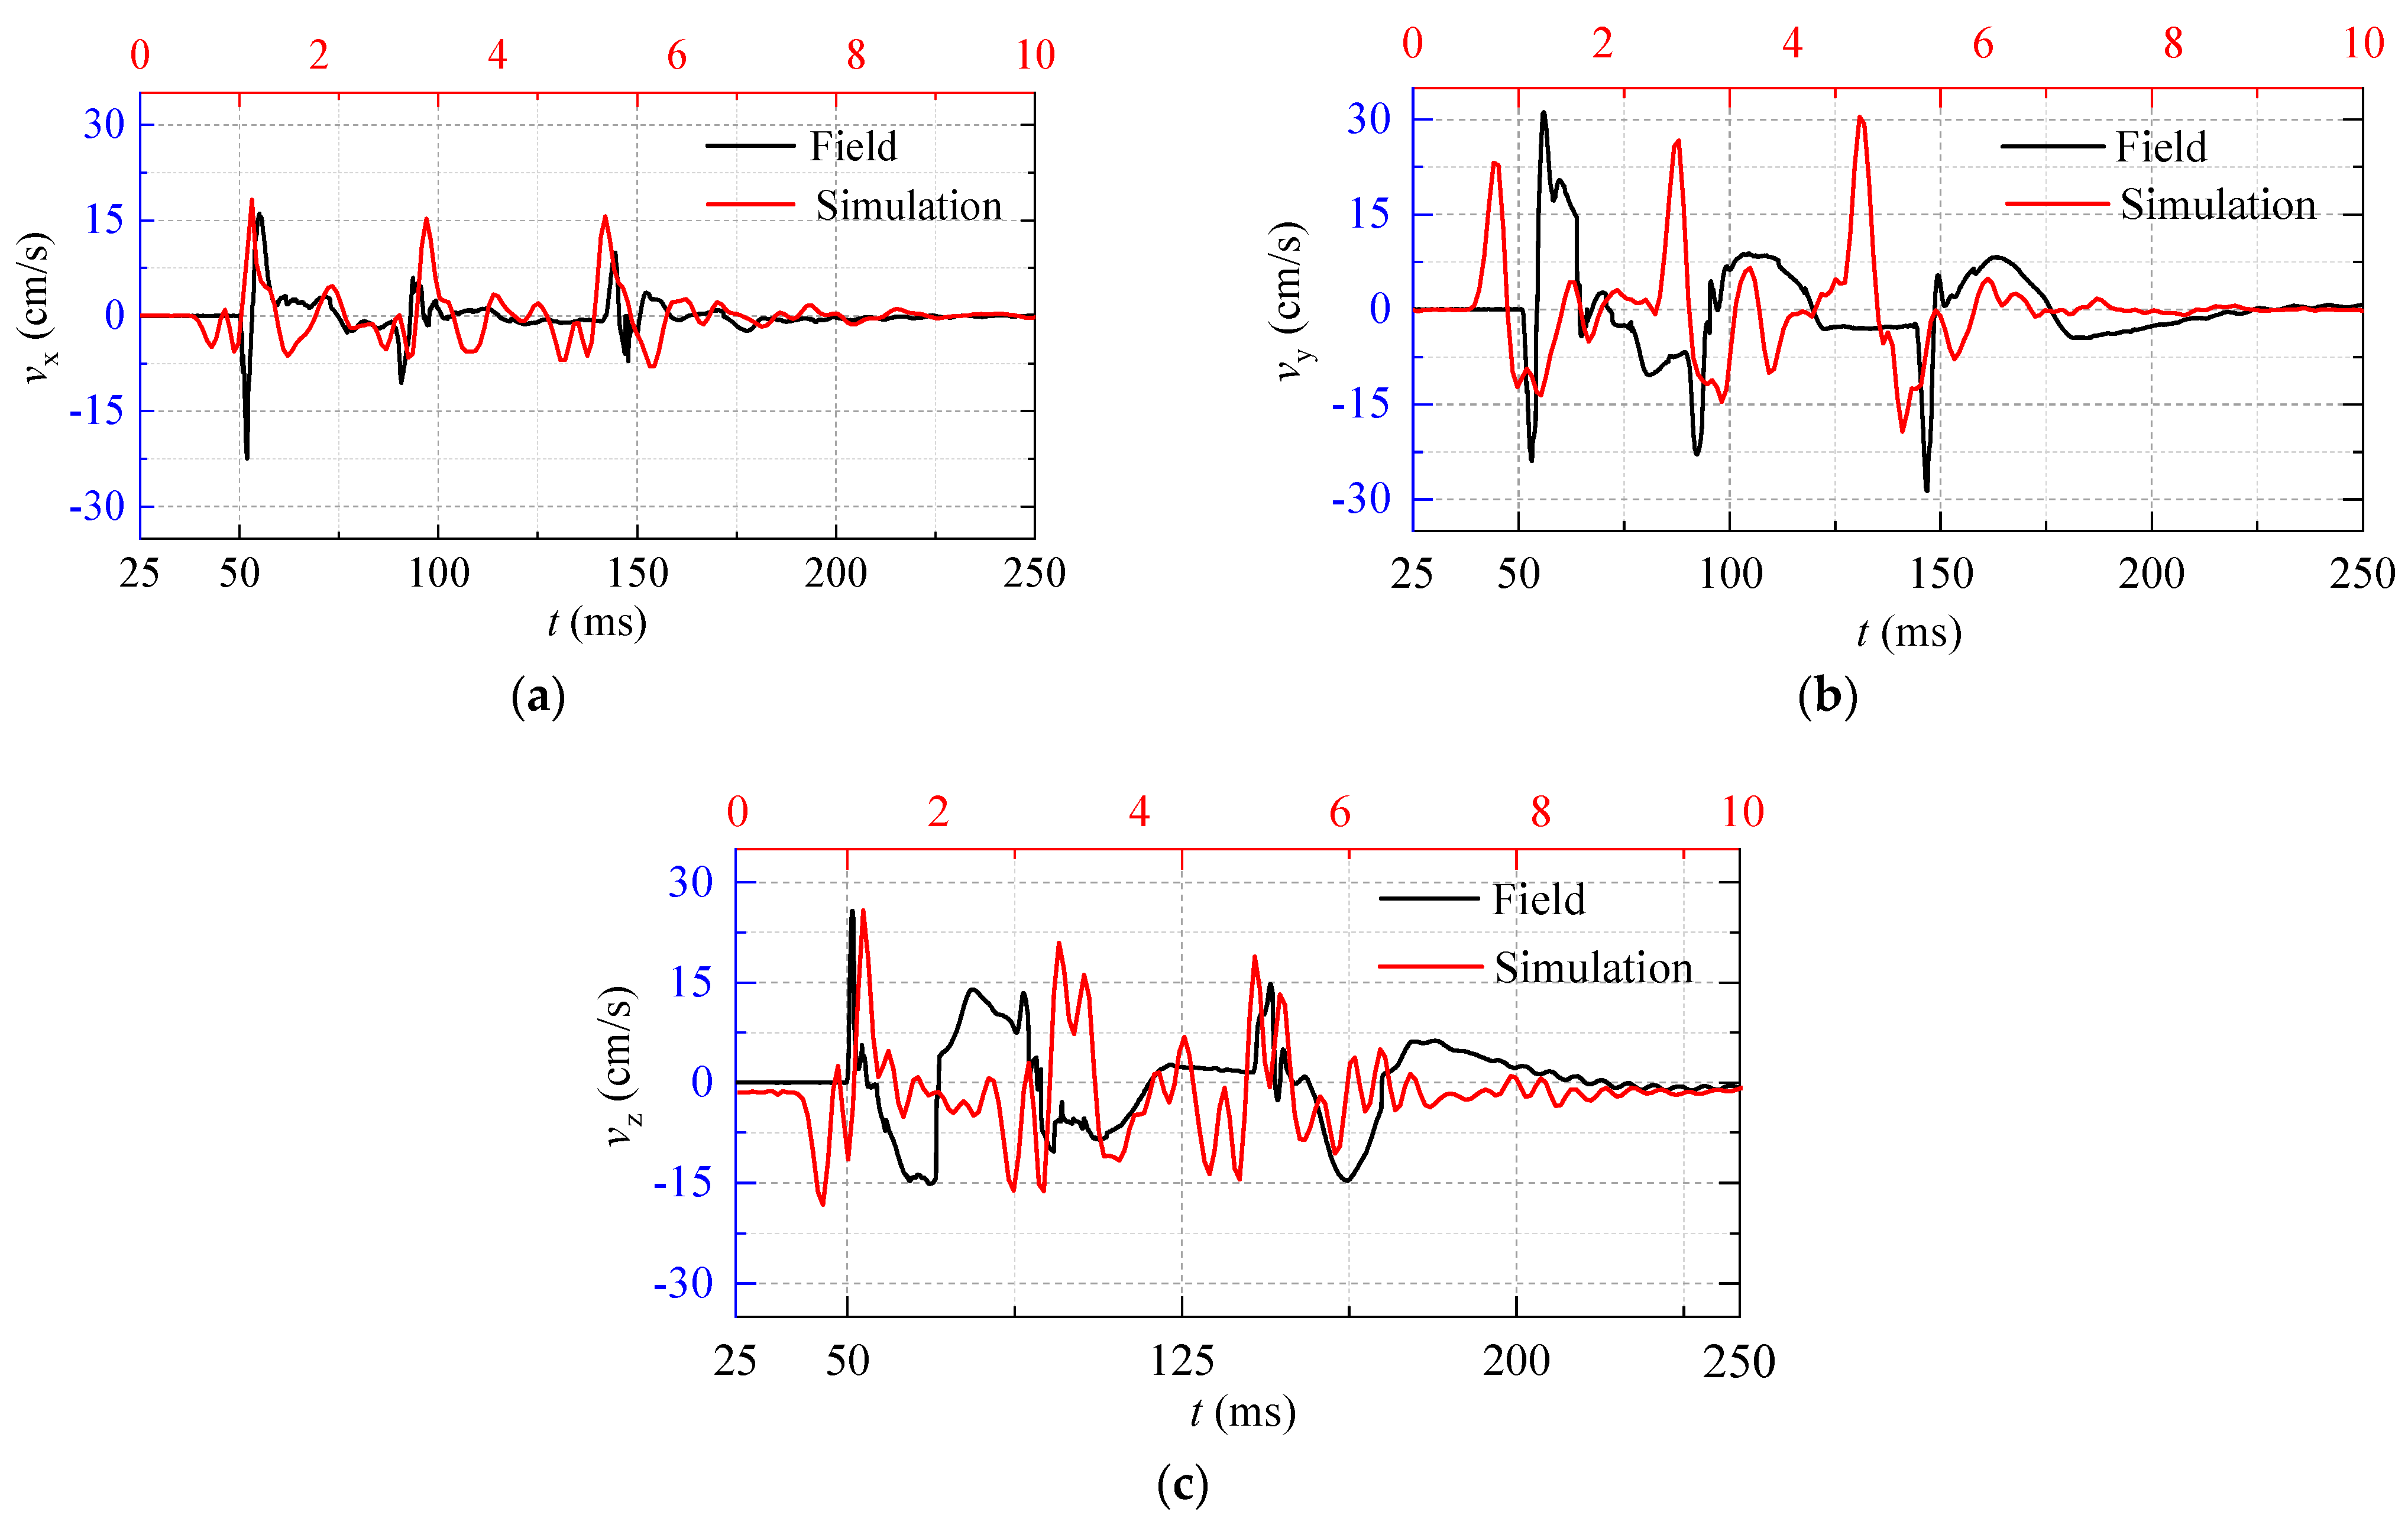
The y-direction is the vertical direction of the model, while the x- and z-directions are the horizontal directions. The vibration response in the vertical direction (with a PPV of 79.12 cm/s) was significantly higher than that in the horizontal directions (with PPVs of 28.31 cm/s and 29.98 cm/s in the x and z directions, respectively). This is mainly because the blasting seismic wave generated by the tunnel blasting propagates upward and reaches the bottom of the pipeline, causing intensive vibration of the pipeline;
(2)
From the results of the integration PPV (Figure 11d), the integration PPV of H1, H2, and H4 detonators is higher than that of H3 and H5 after detonation. At this point, the distance between the pipeline and the source of the explosion is sufficiently small, and the impact of the distance factor on the outcome far outweighs the influence of other factors. Hence, the PPV result (69.03 cm/s) caused by the blasting of peripheral holes (H4) is slightly higher than that (65.49 cm/s) caused by the blasting of cutting holes (H1);
(3)
According to the requirements of the current national standard [20] for hydraulic tunnels and other similar structures, a PPV exceeding 15 cm/s will cause damage to the structure. The maximum PPV, 79.12 cm/s, has significantly exceeded the allowable vibration velocity. Blasting using non-electric detonators will cause serious damage to the pipeline;
(4)
The vibration waveforms generated by the five-part detonations (H1H5) based on the set delay time were relatively independent, and the adjacent vibration waves were not superimposed. This indicates that the delay time setting of the blast holes in the numerical simulation is reasonable and can better reflect the actual situation on-site during blasting on construction.

5. Blasting Vibration Reduction Effect Analysis Using Electronic Detonators

5.1. The Improvement Scheme for Blasting Using Electronic Detonator

The original blasting scheme was systematically improved to reduce the damage to the upper pipeline. The specific measures were as follows:
(1)
Hole-by-hole blasting technology using electronic detonators was applied to replace the multi-hole simultaneous initiation technology using a non-electric detonator. The charge weights of the blast holes were reduced by increasing the number of blast holes and reducing their spacing and excavation footage. After optimization, the depth of the blast hole was 0.6 m, and the single-hole charge was 0.3 kg except for 0.2 kg in the peripheral hole. The total weight was 21.5 kg. The optimization design of blasting construction was achieved by using electronic detonators with a precise delay of 10 ms that can be implemented in a single hole;
(2)
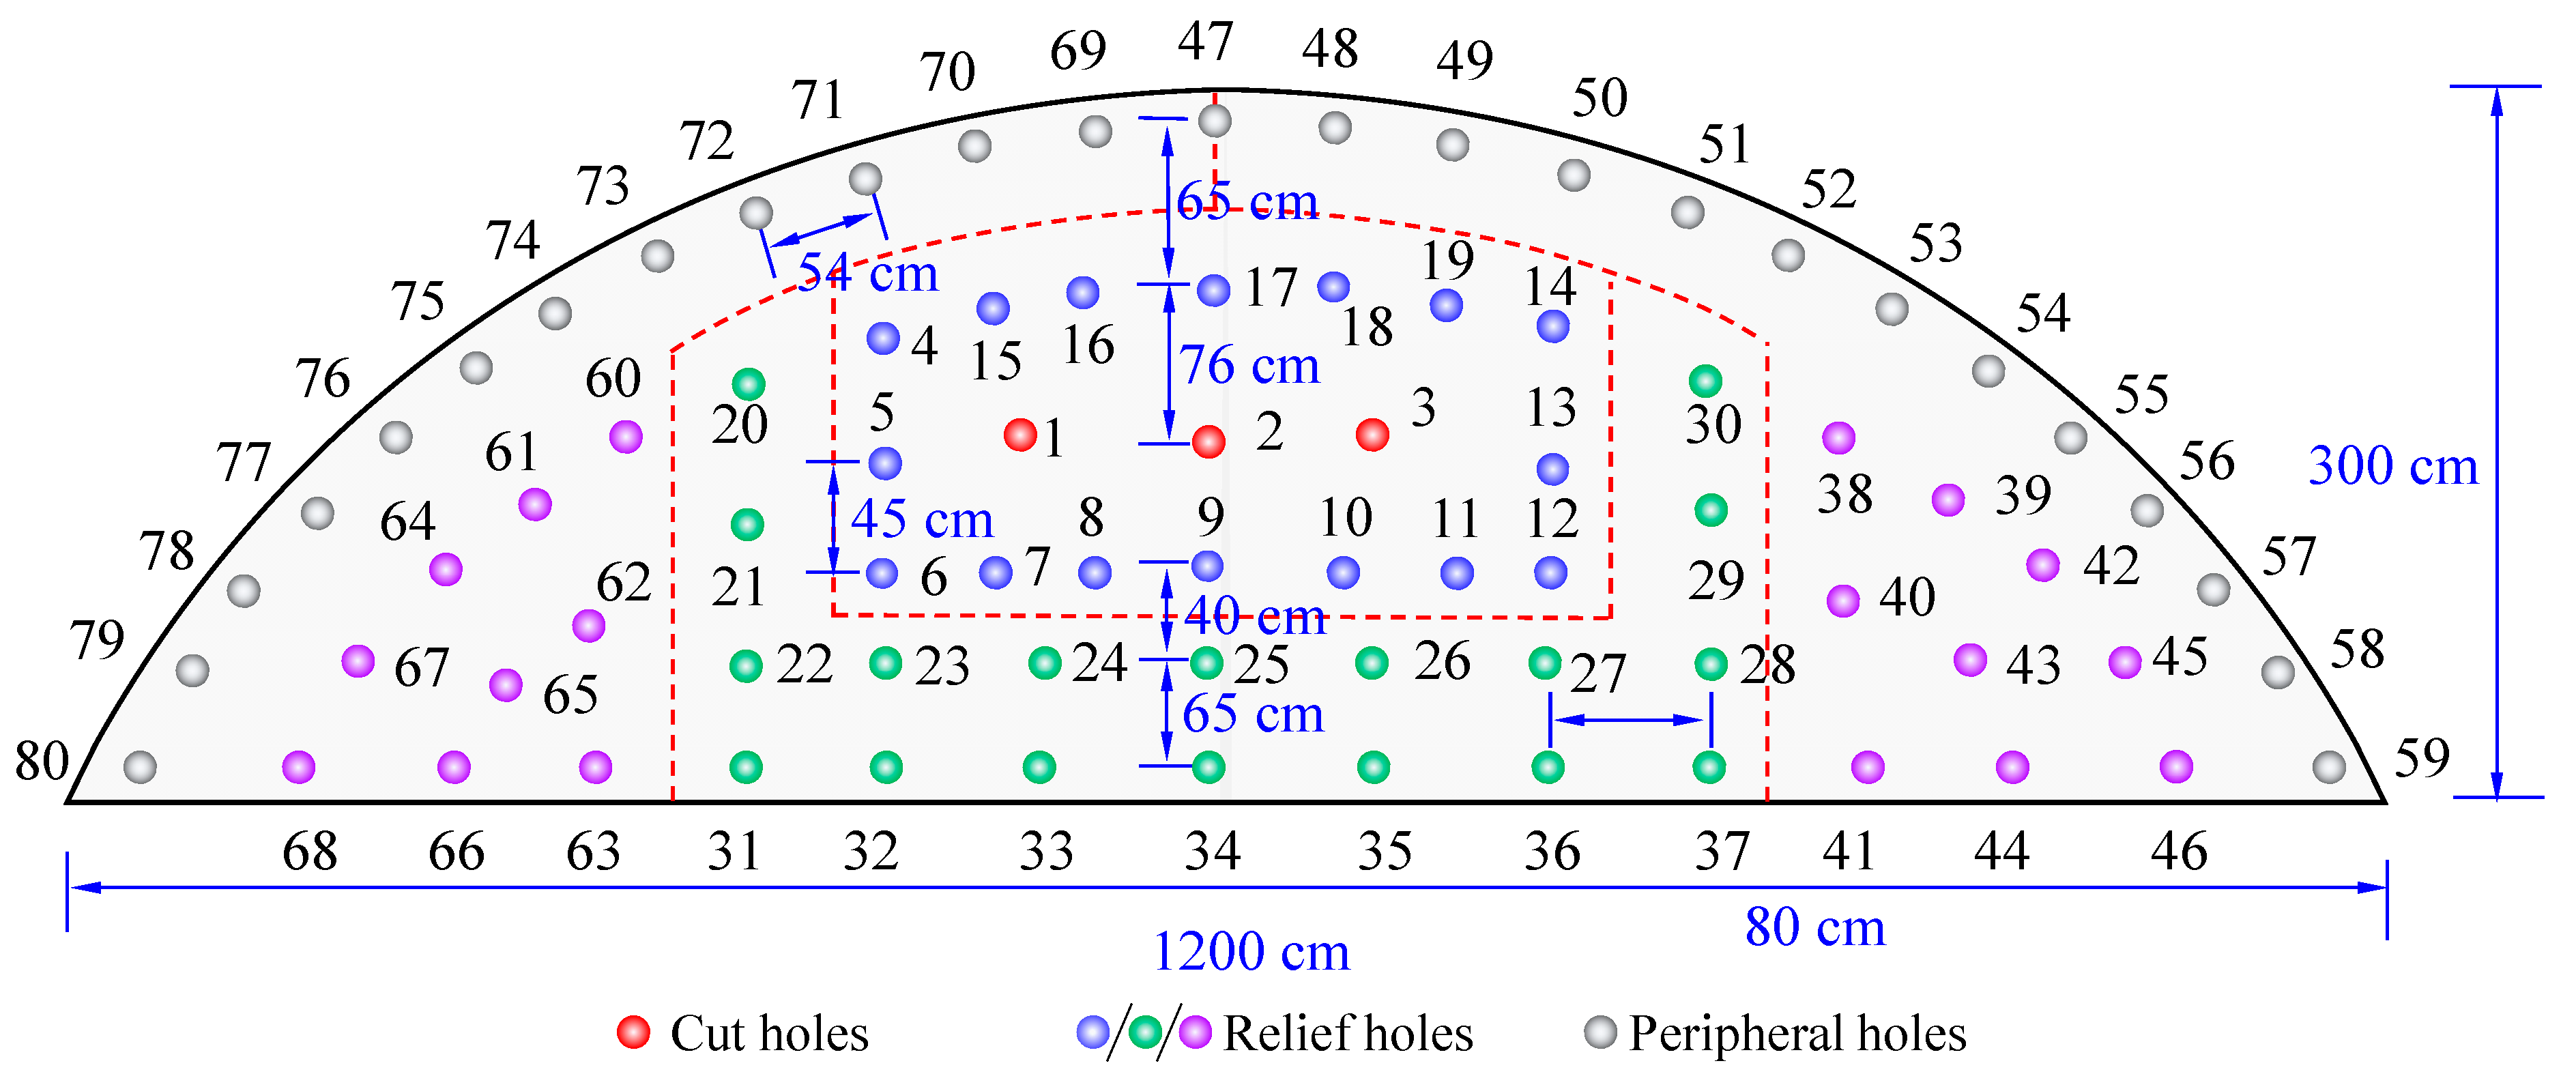
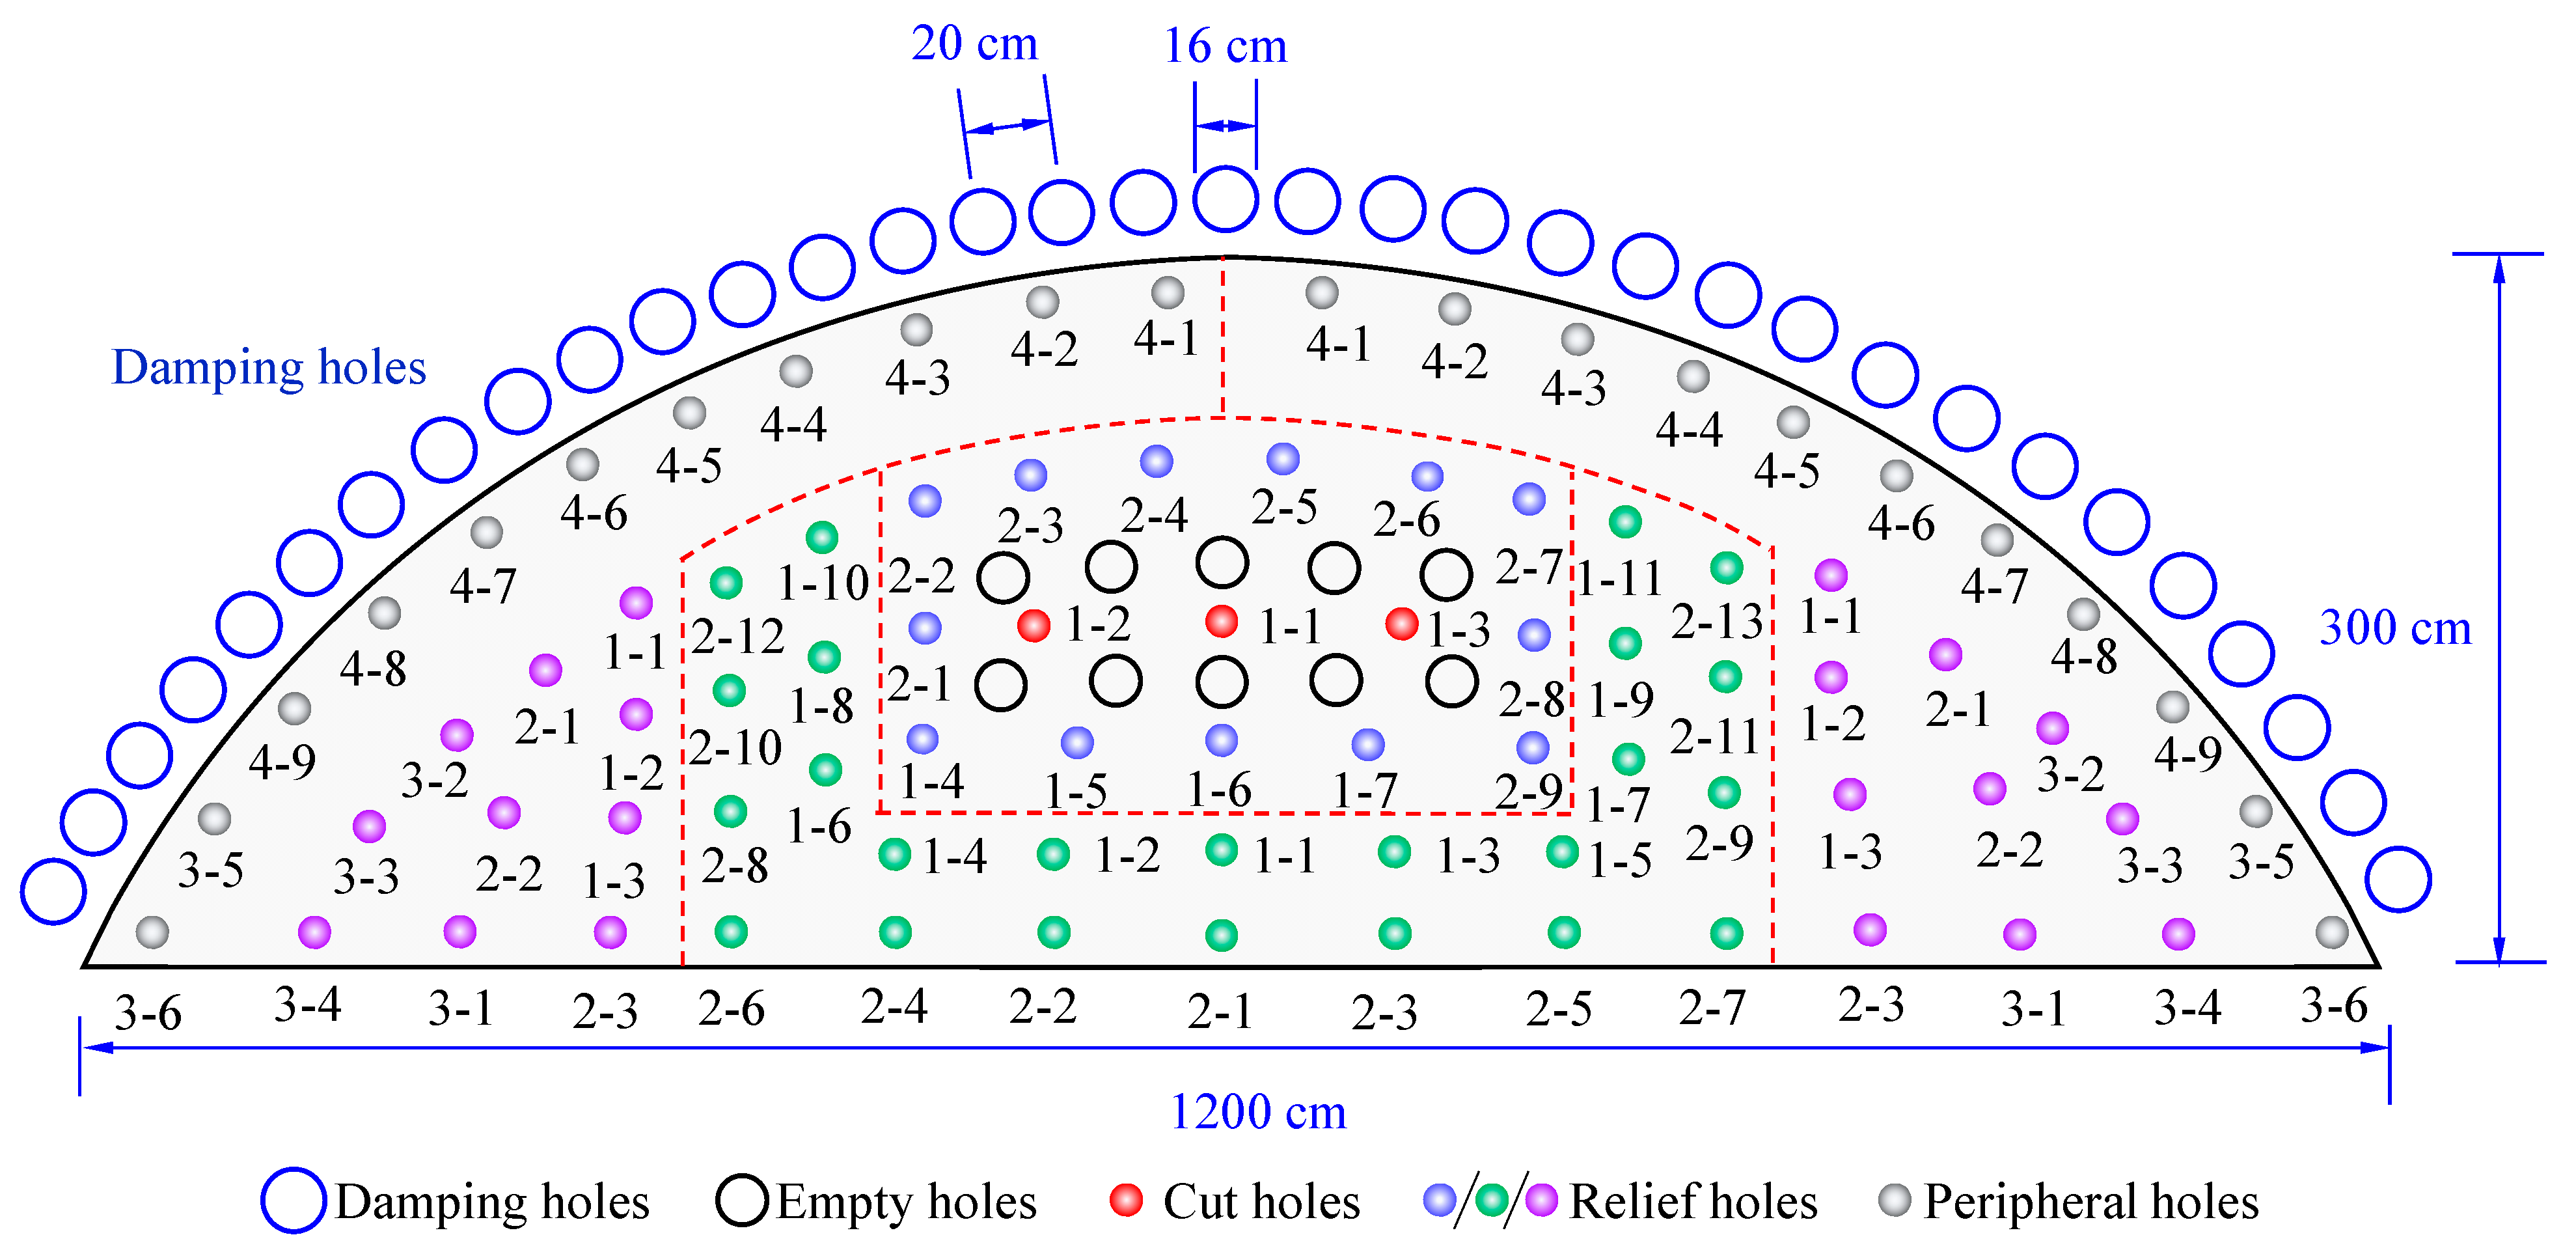
In order to make the blast area where detonation first as the free face for subsequent detonation, the upper bench is divided into four blasting zones that expand from the center to the surrounding areas. The four partitions of the blast holes are evenly distributed. Cut holes 1–19 were blasting partition I. Blast holes 20–37 were blasting partition II. Blast holes 38–59 were blasting partition III. Blast holes 60–80 were blasting partition IV. To reduce the squeezing effect of rocks on the blast holes, a certain number of empty holes are evenly distributed around the cut holes. The positions and numbers of the blast holes are shown in Figure 12. Layout of blast holes using electronic detonators.
The ignition sequence of the blast holes in this numerical model was consistent with that of the actual construction. To reduce the calculation time, the blasting holes were sequentially detonated with a time delay of 500 μs to approximately simulate the blasting effect on-site(Table 6).

5.2. Comparison of Vibration Response between Non-Electric and Electronic Detonators

5.2.1. Comparison of Vibration Response of the Dangerous Points on the Pipeline
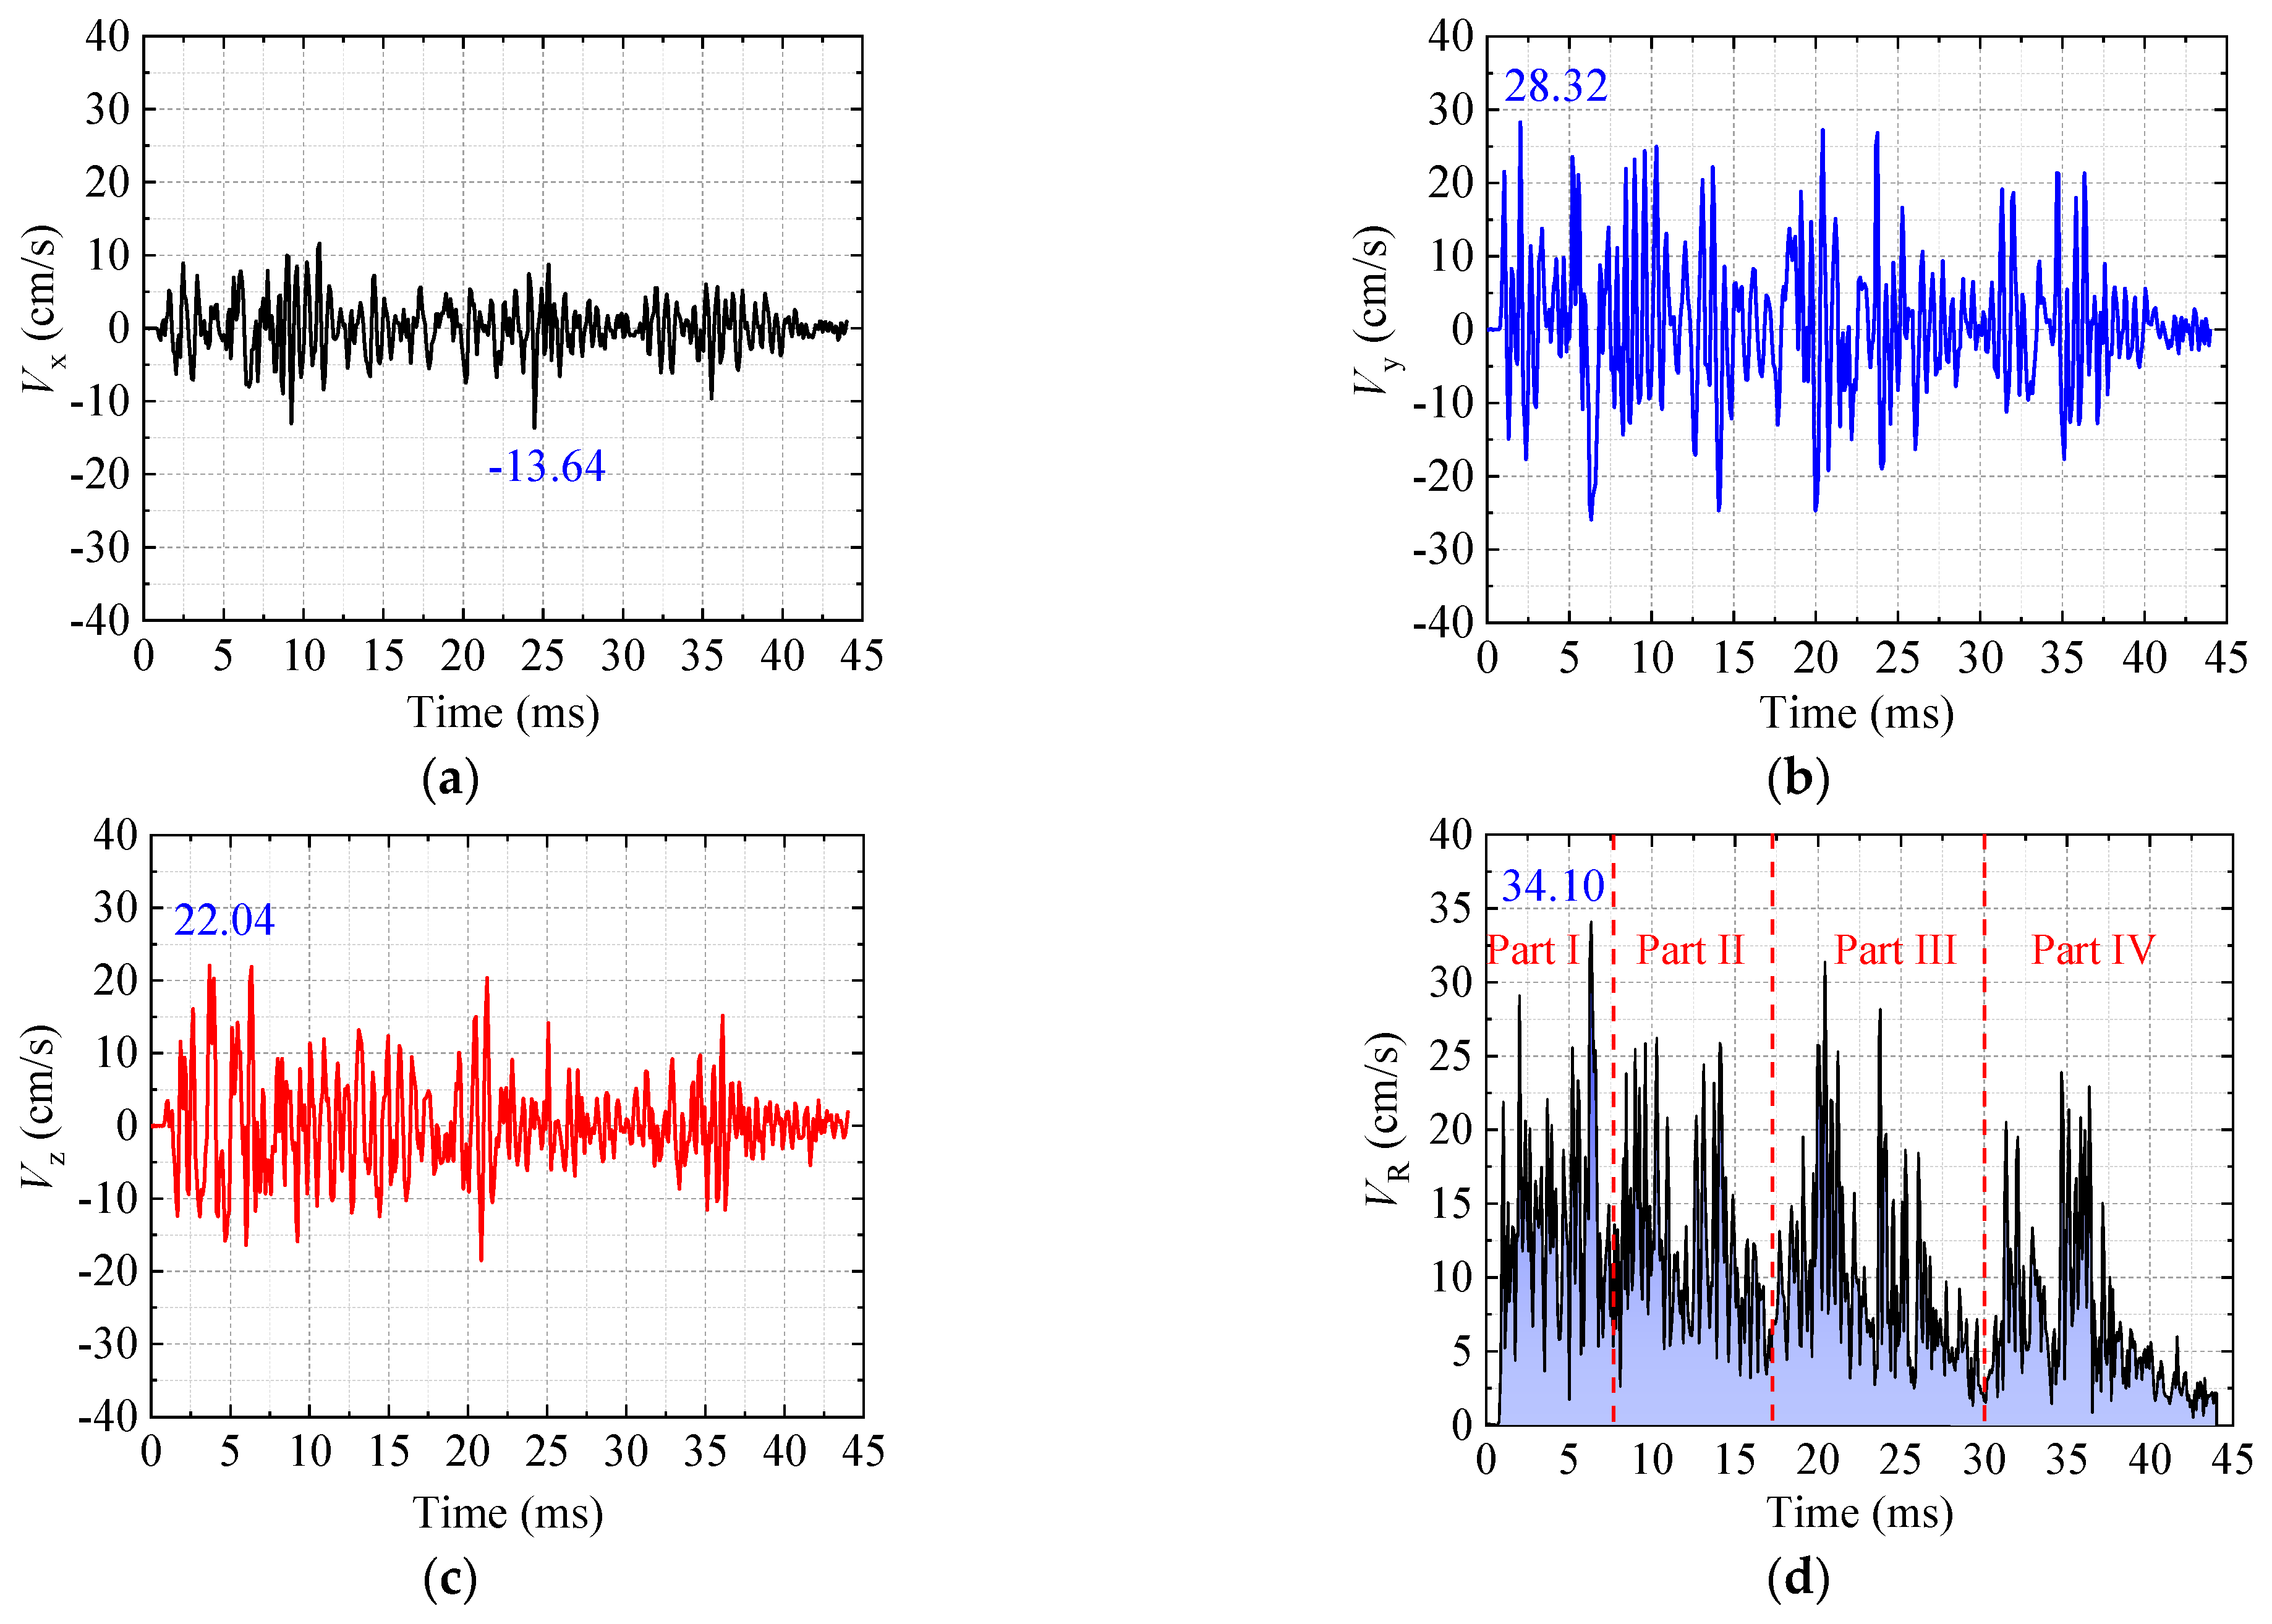
After replacing the detonation method of the blast holes with electronic detonators, the vibration response of the extracted danger points based on the calculated model is shown in Figure 13.
After observing the calculation results of changing the detonation method, the following can be noticed:
(1)
The vibration velocity in the vertical direction exceeds that in the horizontal direction. The PPV in the vertical direction and horizontal direction are 28.32 cm/s and 22.04 cm/s, respectively. After using the hole-by-hole detonation technology of electronic detonators, the maximum PPV is reduced from 79.12 cm/s to 28.32 cm/s. The vibration velocity is significantly reduced by 64.21%;
(2)
From the results of the integration PPV (Figure 13d), the integration PPV of Partitions I and III was significantly higher than those of Partitions II and IV after detonation. It is again proven that in the near range of blasting, the pipeline is significantly affected by the blast vibrations induced by the holes close to it. However, although the blast holes of Partitions III and IV were symmetrically distributed, the vibration velocity of Partition IV was lower than that of Partition III. The mainly because, after Partition III was blasted, more free surfaces were created for the blasting of Partition IV, which effectively reduced the vibration response;
(3)
According to the safety standard [20], the maximum PPV under electronic detonator blasting is 28.32 cm/s, which exceeds the safe allowable vibration velocity. Further vibration reduction measures should be implemented to ensure that the PPV meets the safety requirements;
(4)
The vibration velocity waveform caused by the hole-by-hole blasting using electronic detonators fluctuates relatively gently. However, the vibration velocity produced by the simultaneous blasting of multiple holes using a non-electric detonator fluctuates in a pulse-type manner.

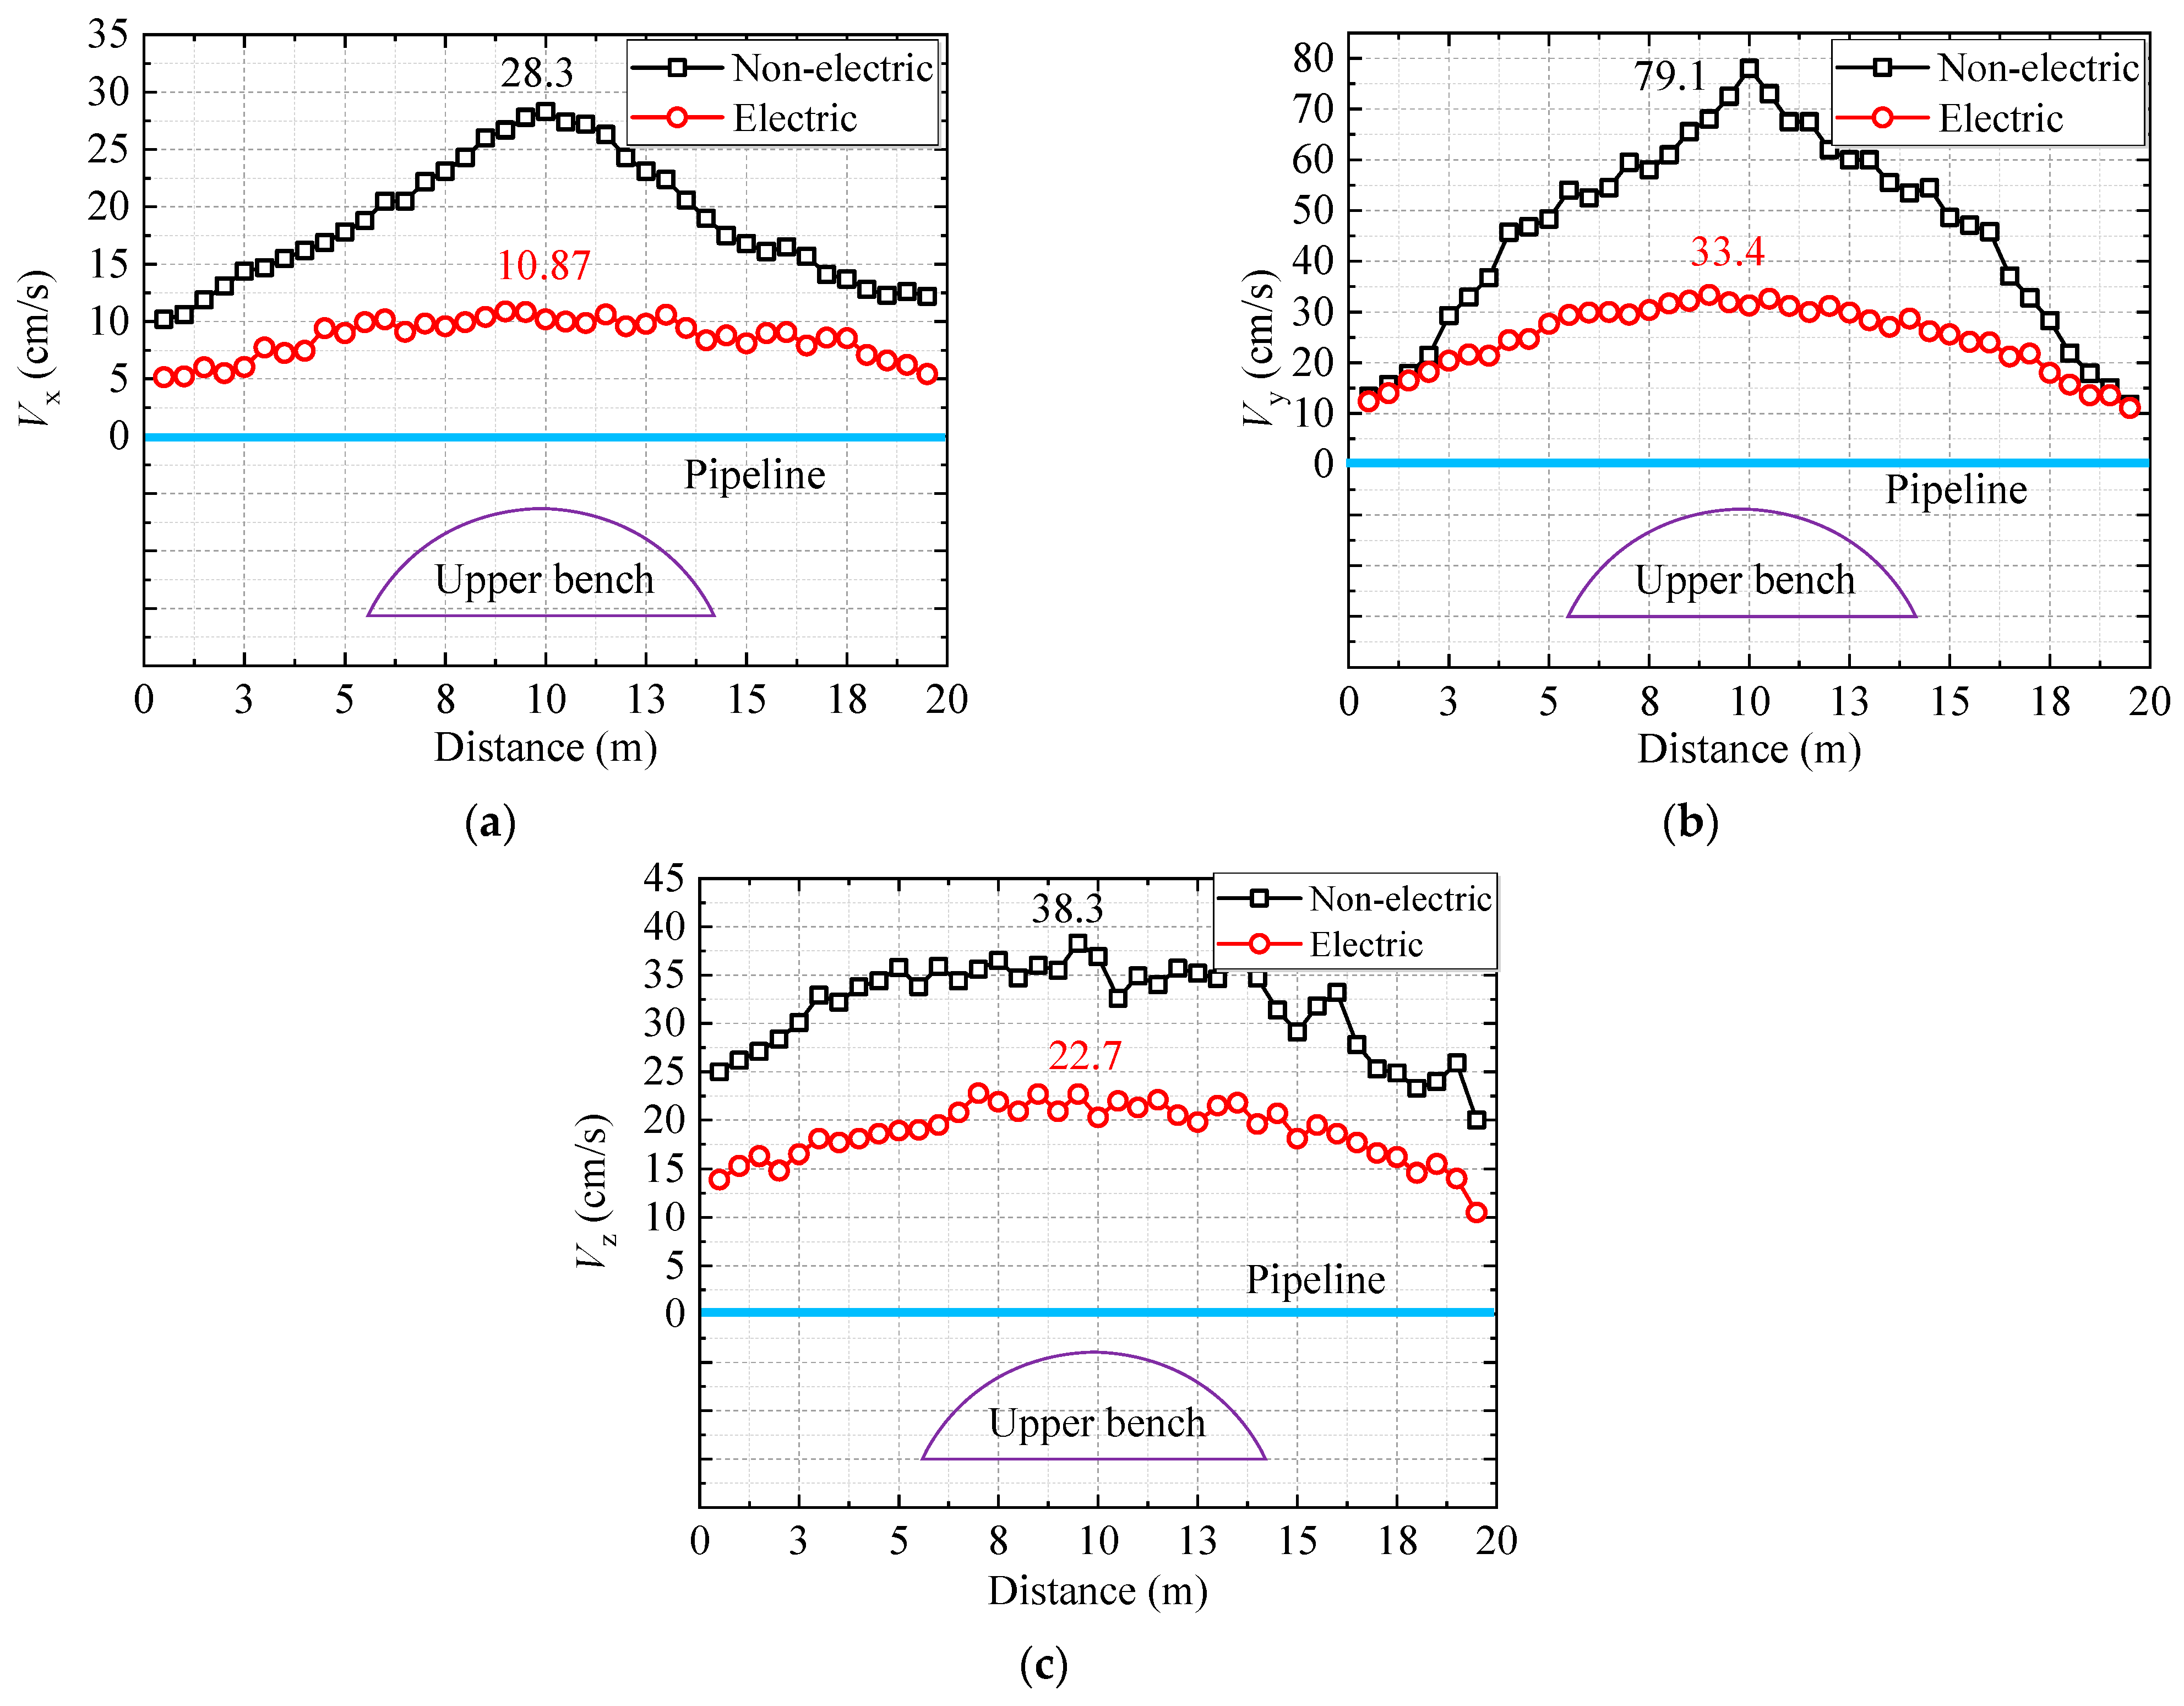
5.2.2. Comparison of Pipeline Axial PPV under Two Detonation Methods

The main focus is to observe and compare the blasting vibration response on the surface under the pipeline. The PPV values of selected elements at regular intervals are extracted for analysis.
From Figure 14, it is seen that irrespective of whether a non-electric or electronic detonator blasting technology is used, The PPV at the pipeline section closest to the blast source remains the highest; here, the pipeline is affected the most. The increase in distance from the blast source results in a rapid decrease in PPV. The rate of decay is slow in the case of electronic and rapid in the case of non-electric detonators. The main reason for this is that when non-electric detonators are used for simultaneous multi-hole blasting, a high PPV is generated at the instant of the blast that decays continuously until the next set of the blast hole is detonated. In the case of electronic detonator hole-by-hole blasting, owing to the continuous detonation of new blast holes, the blasting energy is continuously transmitted outward, resulting in a slow attenuation of the blasting vibration velocity.

5.2.3. The PPV on the Pipeline Profile under Two Detonation Methods

A comparative analysis is conducted using the profile of the pipeline section closest to the blast source. The PPV of selected elements at regular intervals is extracted and shown in Figure 15.
From Figure 15, the PPV of the closest profile caused by blasting using electronic detonators is much smaller than that caused by non-electric detonators. The PPV on the blasting side (0–180°) was significantly higher than that on the opposite side (180–360°). This is because the transmission distance of the explosive impact in a large-diameter pipeline is significantly longer than that in a small-diameter pipeline. Moreover, the hollow characteristics of the pipeline significantly attenuated these seismic waves during propagation.
The distributions of PTS (the peak tensile stress) and displacement on the closest profile of the pipeline using the two blasting schemes just above the blasting source were extracted, as shown in Figure 16. From Figure 16, it can be observed that the PTS and displacement of the cross-section caused by electronic detonator blasting are much smaller than those caused by non-electric detonator blasting. The PTS of the pipeline was reduced by 48.72% by using electronic detonators with hole-by-hole blasting. Because the pipeline is tightly constrained by the surrounding rock, the maximum displacement of the pipeline under the action of tunnel blasting only reaches 0.4 mm. Therefore, this displacement standard is unsuitable for evaluating the vibration safety of pipelines subjected to tunnel blasting.

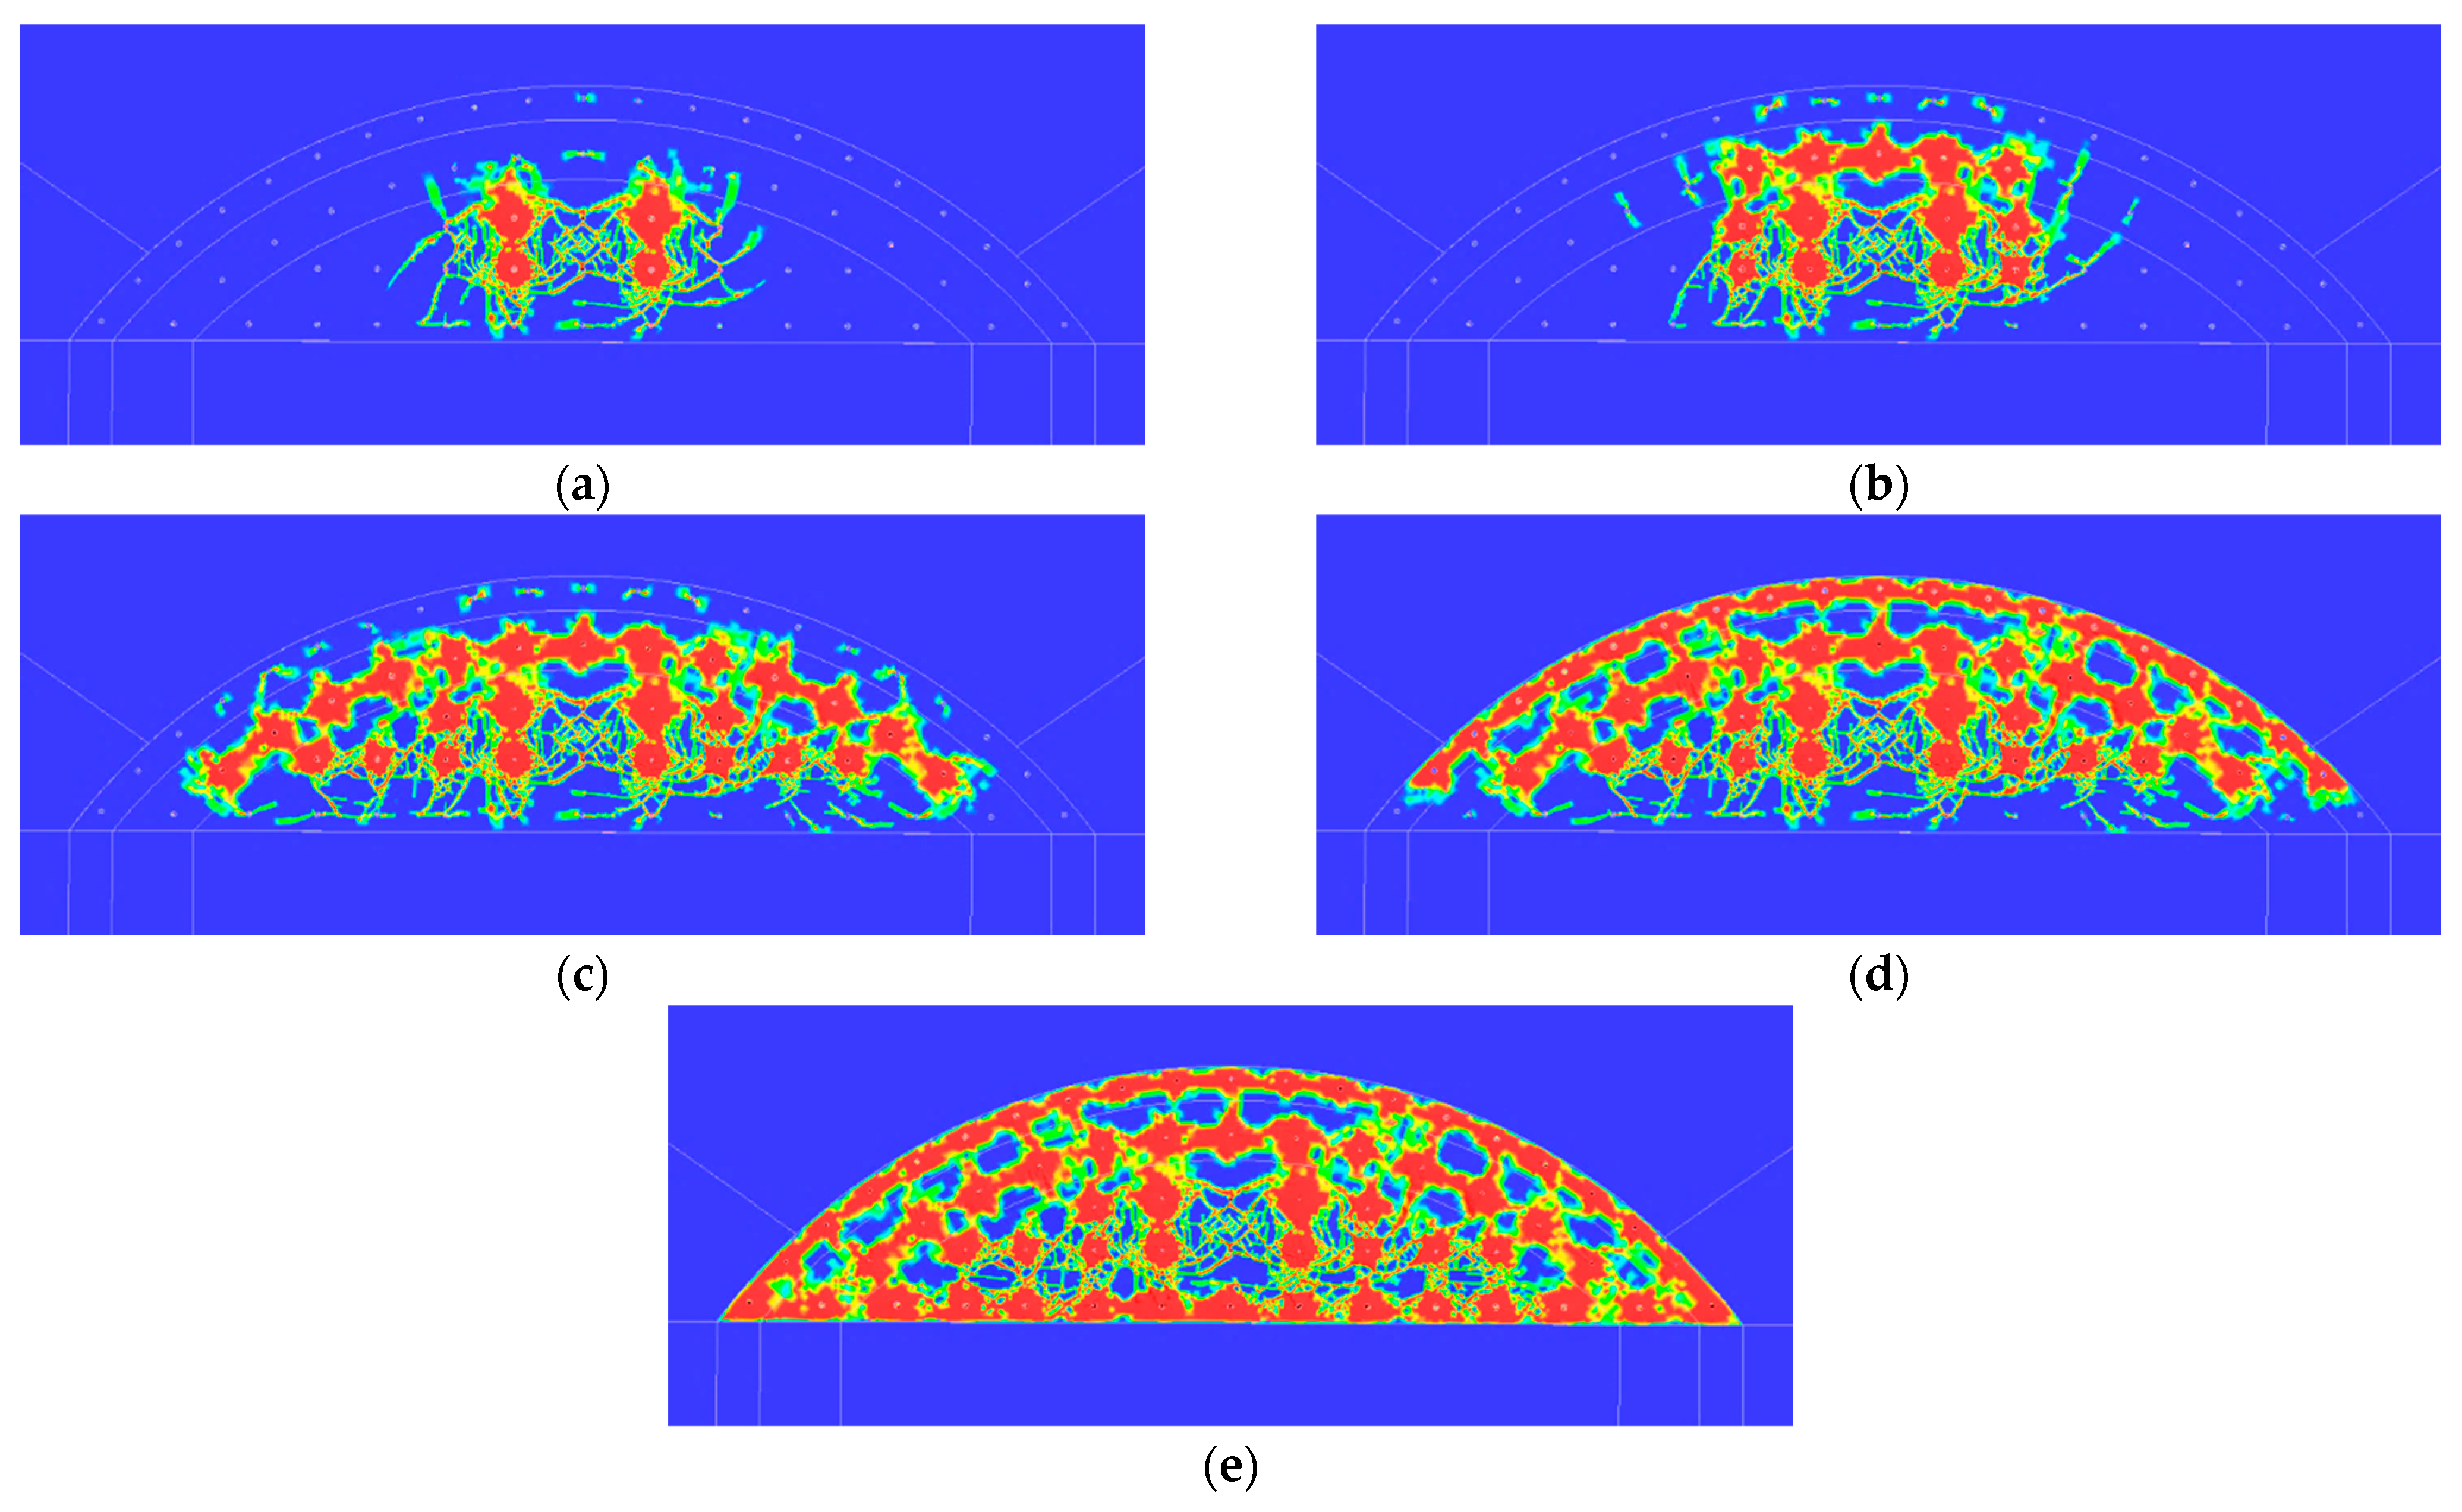
5.3. Comparison of the Cumulative Damage to the Pipeline in the Two Blasting Schemes

The cumulative damage to the pipeline in the numerical calculation was quantitatively evaluated using the damage variable D. The cumulative damage caused by the two blasting methods performed five times simultaneously is shown in Figure 17. Regardless of the damage distribution range or degree of damage to the pipeline, the damage induced by the electronic detonator blasting scheme was much smaller than that of the non-electric detonator blasting scheme.
The quantitative results of the cumulative damage range and degree of damage owing to the electronic and non-electric detonators are shown in Figure 18. Some valuable phenomena are worth discussing:
(1)
Owing to the simultaneous initiation of cut holes using non-electric detonators, damage with a width of 1.5 m was generated on the pipeline. However, for cut-hole blasting with a small amount of charge using hole-by-hole initiation technology, the damage to the pipeline owing to blasting with electronic detonators is small;
(2)
With an increase in the number of blast hole ignitions, the range of influence of the seismic wave generated by blast hole blasting gradually increases; hence, the range of damage to the pipeline, induced by the non-electric and the electronic detonator blasting, gradually expands from the center of the nearest dangerous point to the sides. When the relief holes H2 are blasted, the damage range under non-electric and electronic detonator blasting increases by 3.0 m and 2.2 m, respectively. This is mainly because the relief holes above the cutting holes were much closer to the pipeline, and the number of blast holes detonated, and the number of explosives increased significantly, resulting in a greater increase in the cumulative damage to the pipeline;
(3)
Because some of the peripheral holes were close to the pipeline, and the influence range of the blasting seismic wave generated by peripheral hole blasting was larger than that of the other holes, the cumulative damage to the pipeline increased significantly with the initiation of peripheral holes. The cumulative damage range caused by the non-electric and electronic detonator blasting increased by 9.5 m and 4.7 m, respectively;
(4)
The increase in the damage variable D is consistent with the increase in the blasting damage range under the action of different blast hole blasting. When the relief holes above the cutting hole exploded, the damage variable D increased rapidly. The damage variable D of non-electric and electronic detonators increased by 0.18 and 0.12, respectively. In both explosion scenarios, the outermost peripheral holes are closest to the pipeline, and their explosive impacts significantly increase the damage variable D. Therefore, the above results also prove that when the pipeline is in the close range of tunnel blasting, the influence of the explosive impact of relief and peripheral holes is larger than that of the cutting holes.

6. Pipeline Safety Evaluation and Vibration Reduction Solutions

6.1. Safety Evaluation of Pipeline under Blasting Vibration

The safety evaluation of pipelines under the impact of a large number of blast holes and multiple batches of blasting is extremely complicated, and no general evaluation system is available presently. Three effective safety assessment methods are proposed in this study.
(1) Safety standards for vibration velocity
According to the safety standard [20], the maximum PPV of 79.12 cm/s and 28.32 cm/s obtained under non-electric detonator and electronic detonator blasting significantly exceeded the safe allowable vibration velocity. Blasting causes serious damage to pipelines.
(2) Safety assessment of the cumulative damage variable D and range
Because the water pipeline must undertake important water supply tasks, the engineering safety importance level is high; hence, the threshold of the pipeline variable D in this study was 0.2 [44]. As shown in Figure 18, the threshold for the damage range of the pipeline is determined to be 4 m. According to the simulation results, the damage range exceeded 4 m, which does not satisfy the safety requirements.
(3) Safety evaluation of the dynamic tensile strength of the material
The tensile strength of the material will be significantly increased under high strain rate conditions [45,46]. In the calculation results, the strain rate at the danger point is close to 10−5 s−1; hence, it is advisable to adopt the dynamic tensile strength. Currently, the dynamic tensile strength of materials under transient loads cannot be directly monitored [47]. In recent years, many researchers have proposed mathematical models for the tensile enhancement coefficient of the brittle materials through the Hopkinson pressure bar test [48,49]. This test has been widely used in the field of protective structures and impact resistance [50,51]. Among these, the most widely used is the CEB tensile strength coefficient improvement model [52], as shown in Equation (15). Equation (15) is composed of two piecewise functions with a strain rate of 30 s−1 as the dividing line, and the dynamic tensile strength coefficient can be calculated using different subformulas.
γ ε ˙ = ε ˙ ε ˙ s 1.026 α s ε ˙ 30   s 1 ς s ε ˙ ε ˙ s 1 / 3 ε ˙ > 30   s 1
α s = 1 5 + 9 f c / f c o
ς s = 10 6.156 α s 2
where the quasi-static strain rate ε ˙ is 3 × 10⁻⁵s−1, f c o is 10 MPa, and f c is the quasi-static compressive strength of the material.
The pipeline material used in this study was C50 reinforced concrete with a static compressive strength of 22.4 Mpa. The transverse strain rate at the danger point was the highest; the tensile strength increase coefficient     γ ε ˙ calculated using the numerical model was 1.80, and the dynamic tensile strength was 3.29 Mpa. As shown in Figure 16, the pipeline at the blasting side (75–105°) exceeded the dynamic tensile strength; therefore, it is likely to crack.

6.2. Vibration Reduction Technology Using Empty Holes and Barrier Holes

Because the maximum PPV of 28.32 cm/s under electronic detonator blasting exceeded the safe allowable vibration velocity, in order to ensure the operational safety of the pipeline, scientific vibration reduction design should be carried out before construction. The appropriate placement of empty holes and vibration reduction holes will help achieve safe standards for PPV.
(1)
The cutting hole that is detonated first will be subjected to significant surrounding rock confinement, so it is necessary to have a vibration-reduction design for it. Placing large-diameter empty holes around the cutting hole can significantly reduce the adverse effects of surrounding rock. In this project application, ten empty holes with a diameter of 10 cm and a depth of 20 m were designed to surround the cutting holes;
(2)
To further reduce vibrations, a series of large pipe roofs were designed on the upper portion of the tunnel excavation profile. It can not only enhance the supporting effect in the middle interbedded rock layer but also has a good effect in blocking explosive impact [53]. In this application case, widely used on-site pipe roofs with a diameter of 159 mm and a length of 40 m have been used. Translation: Their spacing was designed to be relatively dense at 20 cm.
After the above design, a scientific blast-damping design scheme was formed, as shown in Figure 19.
In accordance with the above-designed damping scheme, TC-4850 wireless network velocity testers were used for tracking and monitoring during construction. The PPV of the maximum vibration direction was recorded according to a pushing distance of 1.6 m, and the monitoring result is shown in Figure 20. The maximum PPV in the monitoring result is 7.19 cm/s, which meets the standards of national safety regulations [20]. The application result can demonstrate the rationality of the above analysis and optimization design.

7. Conclusions

A comparative analysis of the vibration response and cumulative damage characteristics of a pipeline under different blasting methods using non-electric and electronic detonators was performed. The safety of the pipeline under tunnel blasting was evaluated, and a comprehensive vibration reduction technique was proposed. The key points are as follows.
(1)
Because the pipeline was located in the near range of the blasting source, it was mainly affected by the impact of the explosion of the closest holes. Through precise substitutability in-situ testing, it was found that the PPV generated by the current blasting plan would exceed the safety standard, reaching almost 30 cm/s;
(2)
Due to the spatial relationship between the pipeline and the tunnel, the vertical vibration response caused by the explosion was significantly greater than that in other directions. The maximum PPV in the vertical direction using non-electric and electronic detonators was 79.12 cm/s and 28.32 cm/s, respectively. The vibration velocity was significantly reduced by 64.21% using the hole-by-hole initiation of the electronic detonators;
(3)
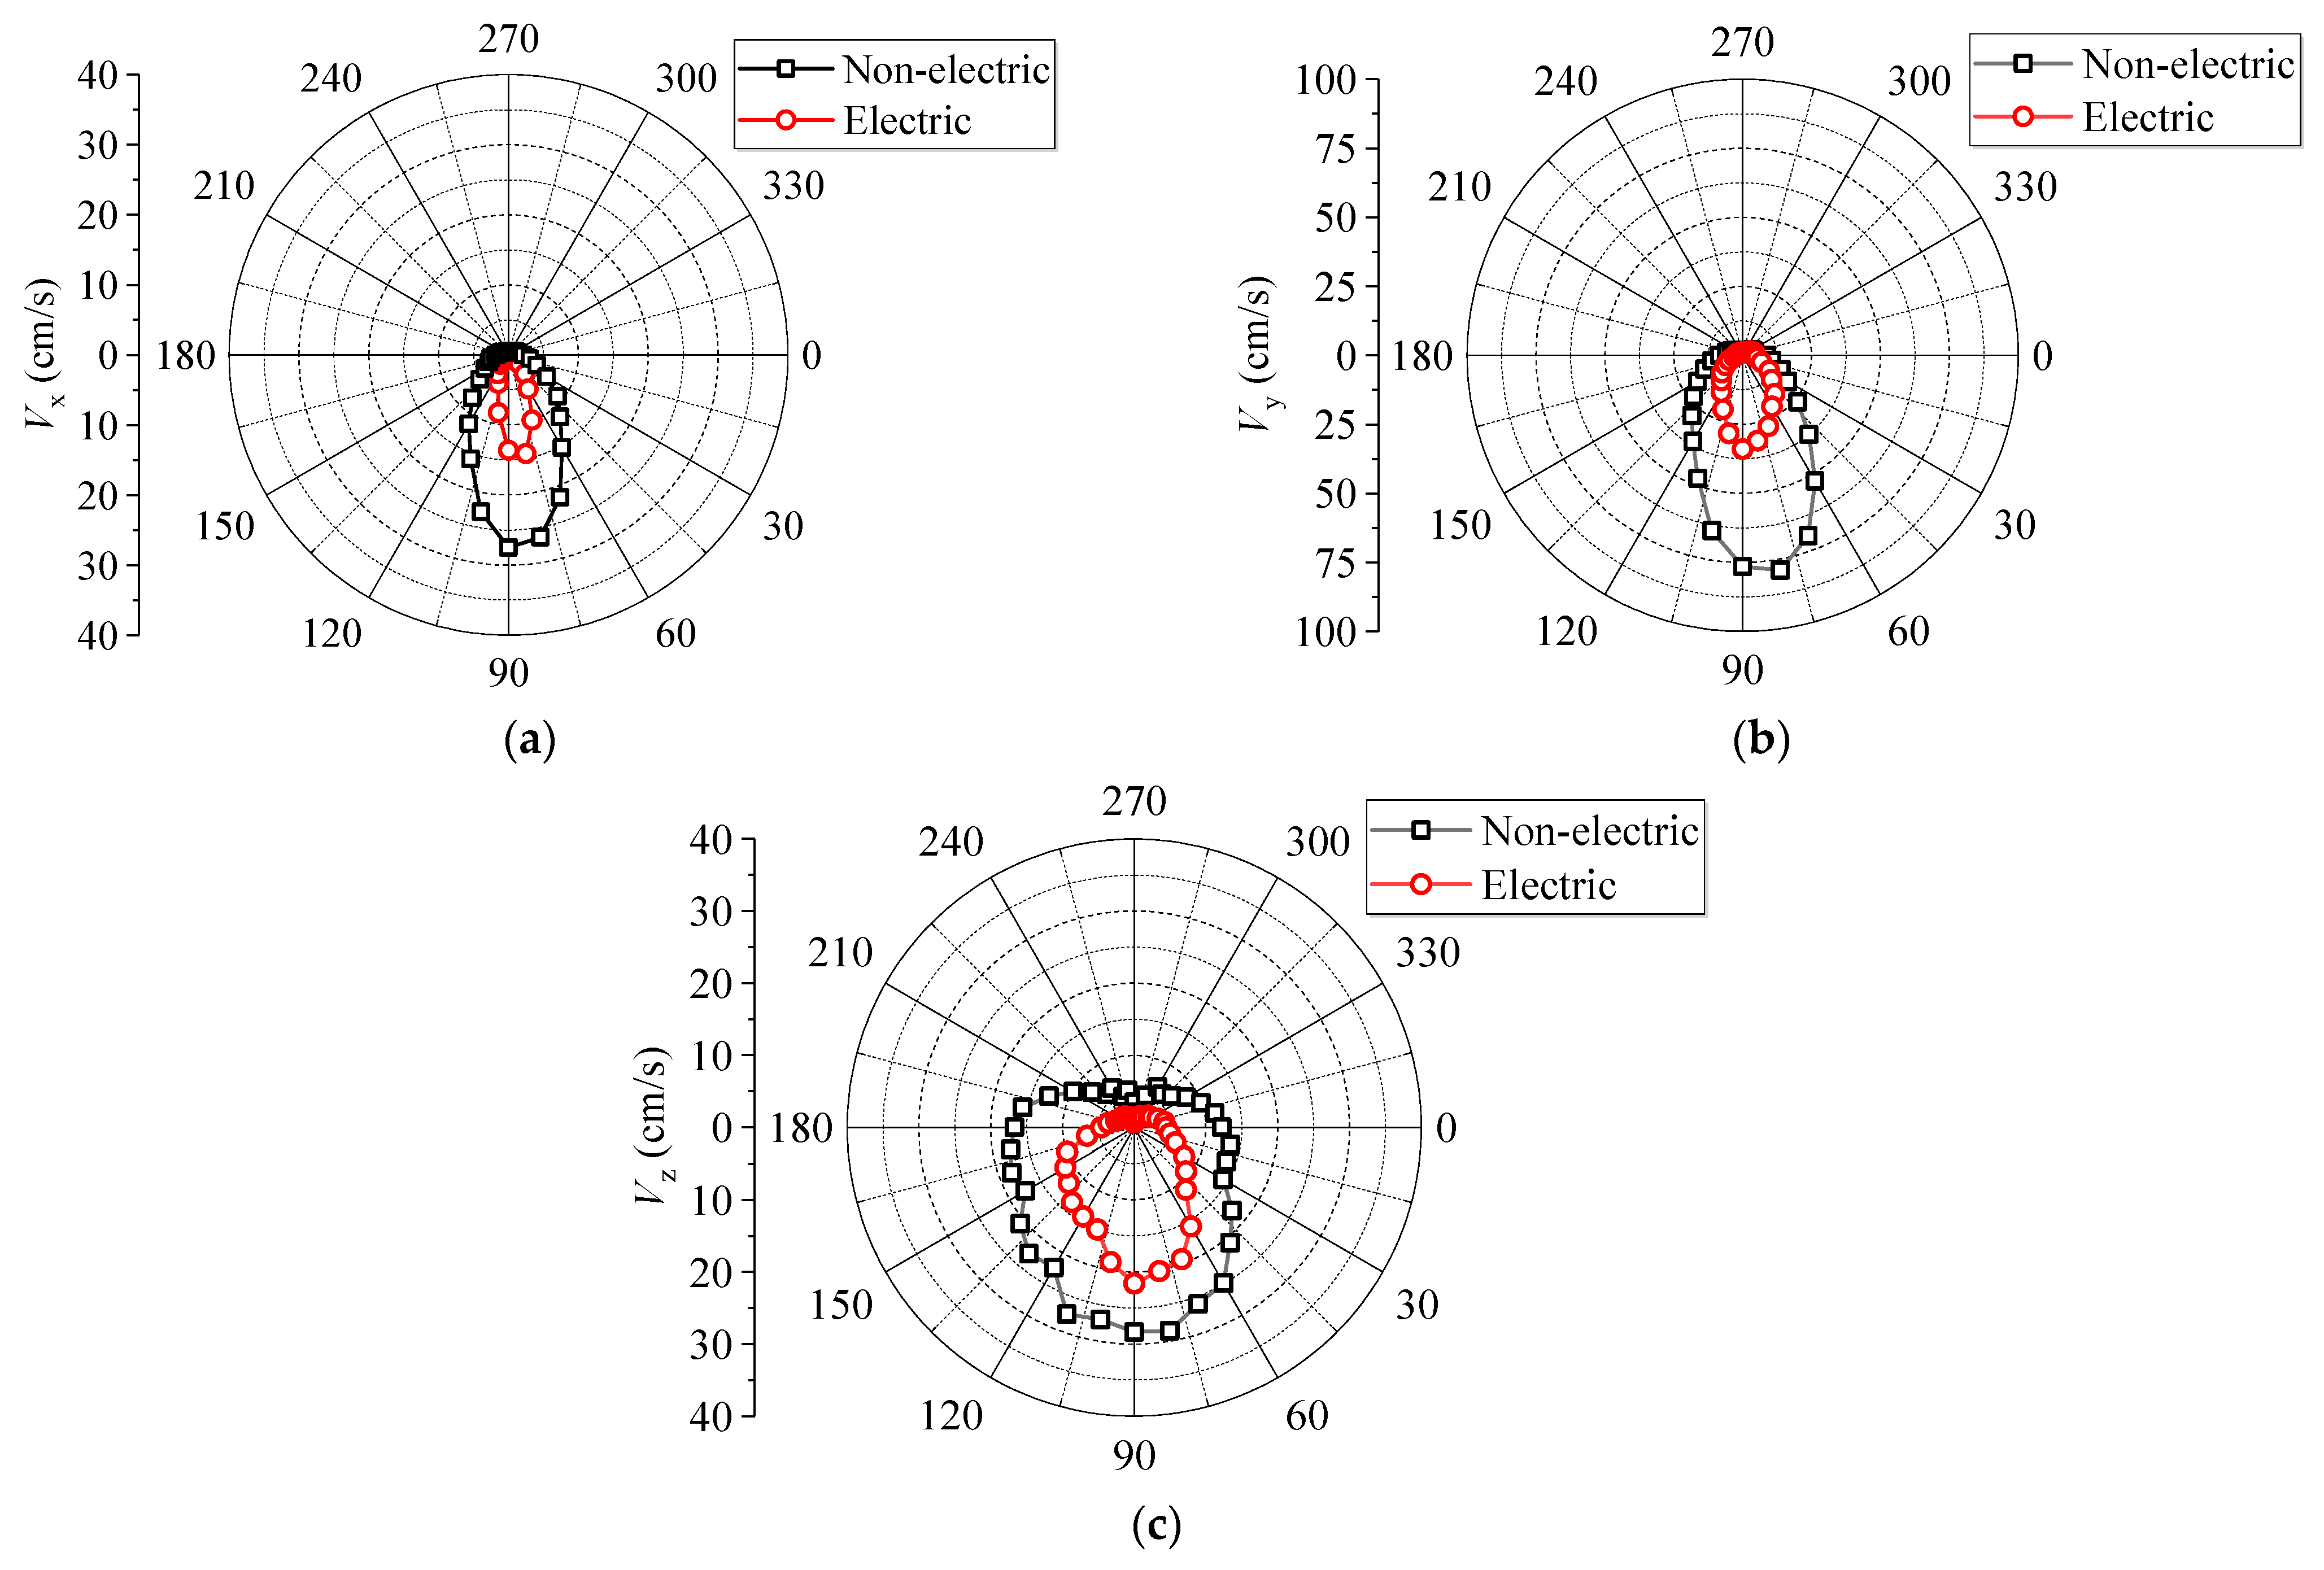
The location of the maximum PPV on the pipeline is at the bottom of the cross-section closest to the source of the explosion. Because of the large-diameter pipeline and its hollow characteristics, the PPV at the blasting side was much larger than that at the opposite side. The PPV decreased gradually as the distance along the axial extension of the pipeline from the blasting center increased, and the PPV of the electronic detonators decayed more slowly than that of the non-electric detonators. Because the maximum displacement of the pipeline was only 0.4 mm, the displacement standard was not suitable for evaluating the vibration safety of pipelines subjected to tunnel blasting;
(4)
The cumulative damage caused by the blasting of electronic detonators was less than that caused by non-electric detonators. After the nearest peripheral holes away from the pipeline detonated, the cumulative damage variable D and damage range increased rapidly, for non-electric and electronic detonator blasting increasing by 9.5 m and 4.7 m, respectively. The use of electronic detonator design can reduce the cumulative damage range by about 50.5%. The PPV, dynamic tensile strength, and cumulative damage variables were used to evaluate the safety of the pipelines. Division blasting, hole-by-hole initiation of electronic detonators, empty holes, and large pipe roofs were adopted to reduce the blasting vibration to meet safety requirements.
The conclusions of this study were mainly applicable to pipelines made of reinforced concrete and similar materials. In future research, it will be necessary to further study the cumulative damage characteristics of cast iron and steel pipes caused by blasting and the corresponding safety evaluation methods. A more in-depth subject will be discussed, that is, the greatest disaster prevention and mitigation advantages that can be obtained by using scientific electronic detonator design under different failure criteria. However, there are some limitations in this study. Firstly, in the process of scheme transformation, the key parameters such as excavation footage, number of boreholes, and single-hole charge were basically unchanged, and just the position and time of boreholes were optimized. The main purpose was to set a separate delay time for each borehole by using an electronic detonator so as to realize the comparative analysis of the calculation results under the two schemes. In addition, the cumulative damage mentioned above is caused by the initiation of blast holes with different detonator series in the same excavation footage rather than by multiple forward excavations.

Author Contributions

X.G.: Methodology, Writing—original draft. N.Y.: Software, Writing—original draft, Formal analysis. Y.Y.: Investigation, Methodology, Writing—original draft. B.X.: Software, Formal analysis. Q.Y.: Software, Validation, Data curation. All authors have read and agreed to the published version of the manuscript.

Funding

This research was supported by four grants from the State Key Laboratory of Precision Blasting and the Hubei Key Laboratory of Blasting Engineering, Jianghan University (No. PBSKL2022C06), the Shandong Natural Science Foundation of China (Project No. ZR2022ME043); the Demonstration Project of Benefiting People with Science and Technology of Qingdao, China (Grant No. 23-2-8-cspz-13-nsh).

Institutional Review Board Statement

Not applicable.

Informed Consent Statement

Not applicable.

Data Availability Statement

The original contributions presented in the study are included in the article, further inquiries can be directed to the corresponding author.

Conflicts of Interest

The authors declare that they have no competing financial interests or personal relationships that may have influenced the work reported in this study.

References

  1. Kouretzis, G.P.; Bouckovalas, G.D.; Gantes, C.J. Analytical calculation of blast-induced strains to buried pipelines. Int. J. Impact Eng. 2007, 34, 1683–1704. [Google Scholar] [CrossRef]
  2. Abedi, A.S.; Hataf, N.; Ghahramani, A. Analytical solution of the dynamic response of buried pipelines under blast wave. Int. J. Rock Mech. Min. Sci. 2016, 88, 301–306. [Google Scholar] [CrossRef]
  3. Xia, Y.Q.; Jiang, N.; Zhou, C.B.; Meng, X.Z.; Luo, X.D.; Wu, T.Y. Theoretical solution of the vibration response of the buried flexible HDPE pipe under impact load induced by rock blasting. Soil Dyn. Earthq. Eng. 2021, 146, 106743. [Google Scholar] [CrossRef]
  4. Yan, S.; Xu, Y.R.; Chang, H.Y. Numerical simulation of dynamic response of buried pipeline by ground explosion. Earth Space 2012, 1159–1166. [Google Scholar]
  5. Parviz, M.; Aminnejad, B.; Fiouz, A. Numerical Simulation of Dynamic Response of Water in Buried Pipeline under Explosion. KSCE J. Civ. Eng. 2017, 21, 2798–2806. [Google Scholar] [CrossRef]
  6. Zhao, K.; Jiang, N.; Jia, Y.S.; Yao, Y.K.; Zhu, B.; Zhou, C.B. Dynamic failure mechanism of gas pipeline with flange joint under blasting seismic wave. Explos. Shock. Waves 2021, 41, 100–115. [Google Scholar]
  7. Zhu, B.; Jiang, N.; Zhou, C.B.; Jia, Y.S.; Luo, X.D.; Wu, T.Y. Blasting seismic effect of buried cast iron pipeline in silty clay layer. J. Zhejiang Univ. 2021, 55, 500–510. [Google Scholar]
  8. Zhao, K.; Jiang, N.; Zhou, C.B.; Li, H.B.; Cai, Z.W.; Zhu, B. Dynamic behavior and failure of buried gas pipeline considering the pipe connection form subjected to blasting seismic waves. Thin-Walled Struct. 2022, 170, 108495. [Google Scholar] [CrossRef]
  9. Cao, H.Z.; Jiang, N.; Zhou, C.B.; Li, H.B.; Cai, Z.W.; Huang, Y.W. Dynamic response and safety assessment of inner-wall corroded concrete pipeline in service subjected to blasting vibration. Struct. Concr. 2023, 24, 451–467. [Google Scholar] [CrossRef]
  10. Wu, T.Y.; Jiang, N.; Zhou, C.B.; Luo, X.D.; Li, H.B.; Zhang, Y.Q. Experimental and numerical investigations on damage assessment of high-density polyethylene pipe subjected to blast loads. Eng. Fail. Anal. 2022, 131, 105856. [Google Scholar] [CrossRef]
  11. Guan, X.M.; Zhang, L.; Wang, Y.W.; Fu, H.X.; An, J.Y. Velocity and Stress Response and Damage Mechanism of Three Types Pipelines Subjected to Highway Tunnel Blasting Vibration. Eng. Fail. Anal. 2020, 118, 104840. [Google Scholar] [CrossRef]
  12. Qin, T.G.; Wu, M.Z.; Jia, L.; Xie, L.L.; Wu, L. Effects of Vibration on Adjacent Pipelines under Blasting Excavation. Appl. Sci. 2023, 13, 121. [Google Scholar] [CrossRef]
  13. Francini, R.B.; Baltz, W.N. Blasting and Construction Vibrations Near Existing Pipelines: What Are Appropriate Levels. In Proceedings of the International Pipeline Conference, Calgary, AB, Canada, 29 September–3 October 2008; Volume 48586, pp. 519–531. [Google Scholar]
  14. De, A.; Morgante, A.N.; Zimmie, T.F. Numerical and Physical Modeling of Geofoam Barriers as Protection against Effects of Surface Blast on Underground Tunnels. Geotext. Geomembr. 2016, 44, 1–12. [Google Scholar] [CrossRef]
  15. Mane, A.S.; Shete, S.; Bhuse, A. Effect of Geofoam Inclusion on Deformation Behavior of Buried Pipelines in Cohesive Soils. In Proceedings of the International Congress and Exhibition “Sustainable Civil Infrastructures: Innovative Infrastructure Geotechnology”, Moscow, Russia, 4 September 2017; pp. 20–33. [Google Scholar]
  16. Jiang, N.; Jia, Y.S.; Yao, Y.K.; Sun, J.S.; Zhu, B.; Wu, T.Y. Experimental investigation on the influence of tunnel crossing blast vibration on upper gas pipeline. Eng. Fail. Anal. 2021, 127, 105490. [Google Scholar] [CrossRef]
  17. Patnailk, G.; Rajput, A. Safety assessment of underground steel pipelines with CFRP protection against subsurface blast loading. Structures 2023, 54, 1541–1559. [Google Scholar] [CrossRef]
  18. Mahgoub, A.; Naggar, H.E. Seismic Design of Metal Arch Culverts: Design Codes vs. Full Dynamic Analysis. J. Earthqu. Eng. 2019, 25, 2231–2268. [Google Scholar] [CrossRef]
  19. Davis, C.A.; Bardet, J.P. Responses of Buried Corrugated Metal Pipes to Earthquakes. J. Geotech. Geoenviron. Eng. 2000, 126, 28–39. [Google Scholar] [CrossRef]
  20. GB6722-2014; Safety Regulations for Blasting. State Standardization Publishing House: New South Wales, Australia, 2016. (In Chinese)
  21. Jiang, N.; Zhou, C.B. Blasting vibration safety criterion for a tunnel liner structure. Tunn. Undergr. Space Technol. 2012, 32, 52–57. [Google Scholar] [CrossRef]
  22. Zhang, Z.; Zhou, C.B.; Remennikov, A.; Wu, T.Y.; Lu, S.W.; Xia, Y.Q. Dynamic response and safety control of civil air defense tunnel under excavation blasting of subway tunnel. Tunn. Undergr. Space Technol. 2021, 112, 103879. [Google Scholar] [CrossRef]
  23. Cui, Y.; Gao, Y.H.; Fang, J.; Qu, Z.; Li, Z.J.; Zhao, M.T. Research on damage assessment of buried pipelines with circular dent defects subjected to blast loading. Eng. Fail. Anal. 2024, 163, 108581. [Google Scholar] [CrossRef]
  24. Li, P.F.; Chen, Y.; Huang, J.L.; Wang, X.Y.; Liu, J.Y.; Wu, J. Design principles of prestressed anchors for tunnels considering bearing arch effect. Comput. Geotech. 2024, 163, 108473. [Google Scholar] [CrossRef]
  25. Zhu, B.; Jiang, N.; Zhou, C.B.; Luo, X.D.; Li, H.B.; Chang, X.; Xia, Y.Q. Dynamic interaction of the pipe-soil subject to underground blasting excavation vibration in an urban soil-rock stratum. Tunn. Undergr. Space Technol. 2022, 129, 104700. [Google Scholar] [CrossRef]
  26. Zhang, Y.Q.; Jiang, N.; Yao, Y.K.; Zhou, C.B.; Meng, X.Z.; Zhang, Z. Structural safety and failure analysis of buried jointed high-density polyethylene corrugated pipelines subjected to blast vibration. Eng. Fail. Anal. 2024, 163, 108473. [Google Scholar] [CrossRef]
  27. Chen, Y.; Li, P.F.; Miao, C.; Yang, L.; Cui, X.P.; Wang, S. Failure Behaviors of Anchored Rock Mass with Various Fracture Inclinations in Tunnels. Arab. J. Sci. Eng. 2024, 1–23. [Google Scholar] [CrossRef]
  28. Li, S.L.; Ling, T.L.; Liu, D.S.; Liang, S.F.; Zhang, R.; Huang, B.; Liu, K. Determination of Rock Mass Parameters for the RHT Model Based on the Hoek–Brown Criterion. Rock Mech. Rock Eng. 2023, 56, 2861–2877. [Google Scholar] [CrossRef]
  29. Li, H.B.; Xia, X.; Li, J.C.; Zhao, J.; Liu, B.; Liu, Y.Q. Rock damage control in bedrock blasting excavation for a nuclear power plant. Int. J. Rock Mech. Min. Sci. 2011, 48, 210–218. [Google Scholar]
  30. Yang, J.H.; Yao, C.; Jiang, Q.H.; Lu, W.B.; Jiang, S.H. 2D numerical analysis of rock damage induced by dynamic in-situ stress redistribution and blast loading in underground blasting excavation. Tunn. Undergr. Space Technol. 2017, 70, 221–232. [Google Scholar] [CrossRef]
  31. Yang, J.H.; Lu, W.B.; Hu, Y.G.; Chen, M. Numerical Simulation of Rock Mass Damage Evolution during Deep-Buried Tunnel Excavation by Drill and Blast. Rock Mech. Rock Eng. 2015, 48, 2045–2059. [Google Scholar] [CrossRef]
  32. Ling, T.L.; Li, S.L.; Lu, D.S.; Liang, S.F. Blasting Damage of Tunnel Rock Mass Based on Cumulative Effect. Rock Mech. Rock Eng. 2023, 56, 1679–1695. [Google Scholar] [CrossRef]
  33. Gao, Y.P.; Fu, H.X.; Ji, X.C.; Rong, X.; Ye, Z.C.; Meng, Z.W. Research and application of interlaid rock vibration law in drilling and blasting construction of small clear distance tunnel. Chin. J. Rock Mech. Eng. 2020, 39, 3440–3449. (In Chinese) [Google Scholar] [CrossRef]
  34. Guan, X.M.; Yang, N.; Zhang, W.J.; Li, M.; Liu, Z.; Wang, X.; Zhang, S. Vibration response and failure modes analysis of the temporary support structure under blasting excavation of tunnels. Eng. Fail. Anal. 2022, 136, 106188. [Google Scholar] [CrossRef]
  35. Li, Y.Z. Calibration of Constitutive Parameters of Granite JH-2 and Numerical Simulation of Damage Characteristics under Repeated Loads; Hefei University of Technology: Hefei, China, 2020. [Google Scholar]
  36. Xia, Y.Q.; Jiang, N.; Zhou, C.B.; Sun, J.S. Dynamic Response Characteristics of Water Supply Pipeline under Blasting Vibration of Underneath Tunnel. Blasting 2019, 36, 6–13+37. [Google Scholar]
  37. Herrmann, W. Constitutive equation for the dynamic compaction of ductile porous materials. J. Appl. Phys. 1969, 40, 2490–2499. [Google Scholar] [CrossRef]
  38. Nie, Z.Y. Experimental Study on RHT Model Parameters of Three Typical Rock Materials. Master’s Thesis, National University of Defense Technology, Changsha, China, 2021. [Google Scholar]
  39. Guan, X.M.; Zhang, L.; Wang, L.M.; Fu, H.X.; Yu, D.M.; Chen, G.; Ding, Y.; Jiang, W.L. Blasting vibration characteristics and safety standard of pipeline passed down by tunnel in short distance. J. Cent. South Univ. 2019, 50, 2870–2885. [Google Scholar]
  40. Yilmaz, O.; Unlu, T. Three dimensional numerical rock damage analysis under blasting load. Tunn. Undergr. Space Technol. 2013, 38, 266–278. [Google Scholar] [CrossRef]
  41. Ling, T.L. Study on Blasting Damage and Cumulative Effect of Sorrounding Rock in Excavation of Great Wall Station. Ph.D. Thesis, China University of Mining and Technology-Beijing, Beijing, China, 2019. [Google Scholar]
  42. Lu, Y.; Jin, C.Y.; Wang, Q.; Han, T.; Zhang, J.; Chen, L. Numerical study on spatial distribution of blast-induced damage zone in open-pit slope. Int. J. Rock Mech. Min. Sci. 2023, 163, 105328. [Google Scholar] [CrossRef]
  43. Yang, J.H. Coupling Effect of Blasting and Transient Release of In-Situ Stress during Deep Rock Mass Excavation; Wuhan University: Wuhan, China, 2014. [Google Scholar]
  44. Gradyt, D.E.; Kipp, M.E. Continuum modelling of explosive fracture in oil shale. Int. J. Rock Mech. Min. Sci. 1980, 17, 147–157. [Google Scholar] [CrossRef]
  45. Zhang, Q.B.; Zhao, J. A review of dynamic experimental techniques and mechanical behaviour of rock materials. Rock Mech. Rock Eng. 2014, 47, 1411–1478. [Google Scholar] [CrossRef]
  46. Hwang, Y.K.; Bolander, J.E.; Lim, Y.M. Evaluation of dynamic tensile strength of concrete using lattice-based simulations of spalling tests. Int. J. Fract. 2020, 221, 191–209. [Google Scholar] [CrossRef]
  47. Lu, Y.B.; Li, Q.M. About the dynamic uniaxial tensile strength of concrete-like materials. Int. J. Impact Eng. 2011, 38, 171–180. [Google Scholar] [CrossRef]
  48. Xu, X.B.; Jin, Z.Q.; Yu, Y.; Li, N. Impact properties of Ultra High Performance Concrete (UHPC) cured by steam curing and standard curing. Case Stud. Constr. Mater. 2022, 17, e01321. [Google Scholar] [CrossRef]
  49. Rong, Y.; Ren, H.L.; Xu, X.Z. An improved damage-plasticity material model for concrete subjected to dynamic loading. Case Stud. Constr. Mater. 2023, 19, e02568. [Google Scholar] [CrossRef]
  50. Mishra, S.; Chakraborty, T. Determination of high-strain-rate stress–strain response of granite for blast analysis of tunnels. J. Eng. Mech. 2019, 145, 04019057. [Google Scholar] [CrossRef]
  51. Chen, X.D.; Ge, L.M.; Yuan, H.T.; Zhou, J. Effect of prestatic loading on dynamic tensile strength of concrete under high strain rates. J. Mater. Civ. Eng. 2016, 28, 06016018. [Google Scholar] [CrossRef]
  52. Liu, F.; Li, Q.M. Stain-rate effects on the dynamic compressive strength of concrete-like materials under multiple stress state. Explos. Shock. Waves 2022, 42, 125–140. [Google Scholar]
  53. Guan, X.M.; Yao, Y.K.; Yang, N.; Xu, H.W.; Xin, B.C.; Li, B.Y. Analysis of factors influencing vibration reduction and design optimization of damping holes in adjacent tunnel blasting. Case Stud. Constr. Mater. 2023, 19, e02448. [Google Scholar] [CrossRef]
Figure 1. High-speed railway tunnel underneath an existing large water pipeline.
Applsci 14 09112 g001
Figure 2. Blast-hole layout of the upper bench.
Applsci 14 09112 g002
Figure 3. Design and implementation process of alternative in situ testing: (a) Diagram of the testing; (b) the operating process of testing.
Applsci 14 09112 g003
Figure 4. Vibration waveform monitored from tests. (ac) correspond to the vibration velocity in the x, y, and z directions, respectively.
Applsci 14 09112 g004
Figure 5. Relationship of different strength parameters of JH-2 material model.
Applsci 14 09112 g005
Figure 6. Change stage of mechanical properties of materials under impact load of RHT model.
Applsci 14 09112 g006
Figure 7. Explosion stress wave pulse function curve.
Applsci 14 09112 g007
Figure 8. Numerical model. (a) Size parameters and (b) grid division.
Applsci 14 09112 g008
Figure 9. The comparison between in situ test results and calculated results. (ac) are the comparison of the blasting vibration velocity extracted from the field monitoring and numerical simulation respectively.
Applsci 14 09112 g009
Figure 10. Damage and crack development of surrounding rock of upper bench after the detonation of each part using non-electric detonators: (a) Cut holes H1 detonation; (b) relief holes H2 detonation; (c) relief holes H3 detonation; (d) peripheral holes H4 detonation; (e) bottom holes H5 detonation.
Applsci 14 09112 g010
Figure 11. The (c) of the dangerous point of the pipeline using non-electric detonator blasting: (a), (bd) are the PPV of x-, y-, z-direction and integrated PPV, respectively.
Applsci 14 09112 g011aApplsci 14 09112 g011b
Figure 12. Layout of blast holes using electronic detonators.
Applsci 14 09112 g012
Figure 13. PPV of the dangerous point of the pipeline using electronic detonator blasting: (ad) are the PPV of x-, y-, z-direction and integrated PPV, respectively.
Applsci 14 09112 g013
Figure 14. The vibration response of the extracted elements at the bottom of the pipeline. (ac) are x-, y-and z-directions.
Applsci 14 09112 g014
Figure 15. The vibration response of the extracted elements at the closest profile of the pipeline. (ac) are x-, y-and z-directions.
Applsci 14 09112 g015
Figure 16. Distributions of PTS and displacement on the cross-section of the pipeline using the two blasting schemes. (a) PTS; (b) displacement.
Applsci 14 09112 g016
Figure 17. Evolution of cumulative damage in the original blasting scheme (ae) and the improved blasting scheme (a′e’) after comparing the five stages of blasting.
Applsci 14 09112 g017
Figure 18. Relationship between the cumulative damage degree of pipeline and the number of blast hole detonations.
Applsci 14 09112 g018
Figure 19. Design of blast holes and damping holes in the upper bench.
Applsci 14 09112 g019
Figure 20. Field monitoring verifies the optimization results. (a) Monitoring point location. (b) Variation in the maximum PPV in the whole process of excavation.
Applsci 14 09112 g020
Table 1. Blasting parameter design of the upper bench using non-electric detonators.
Type of HolePartHole
Number
Hole QuantityHole Depth (m)Detonator SeriesSingle-Hole Charge (kg)Explosive Charge (kg)
Cut holesH11–442.5MS10.93.6
Relief holesH25–1392.0MS30.76.3
H314–25122.0MS50.78.4
Peripheral holesH426–44192.0MS70.611.4
Bottom holesH545–59152.0MS90.812.0
Empty holesH660, 6122.5
Table 2. Parameters of rock material model.
ρ 0 (kg/m3)G (Gpa)k1 (Gpa)k2 (Gpa)k3 (Gpa)HEL (Gpa)ANC
2.46 × 10318.52.51 × 10232.0−4.5 × 1033.0 × 1039.7 × 10−30.725.0 × 10−3
BM σ F M a x * (Gpa)T/GpaD2βD1Tf (Gpa)Gf (J·m−2)
0.320.7225−5.3 × 10−20.70.55.0 × 10−33.5 × 10−270
Table 3. Assignment of the RHT constitutive model.
ρ 0
(kg/m3)
A1
(Gpa)
A2
(Gpa)
A3
(Gpa)
B0B1AGpcrush
(Gpa)
pcomp
(Gpa)
fc
(Gpa)
T1T2
2.41 × 10335.2739.5812.041.221.601.6016.70.01744.000.0235.270.00
g c * g t * βcΒt f s * f t * D2γ0ξBD1Q0BQ
0.530.900.020.0250.180.101.001.600.501.600.040.6850.010
Table 4. Steel skeleton material parameters.
Steel Type ρ 0 (g/cm−3)E (Gpa)vfy (Gpa)Src (s−1)Srp
Longitudinal bar7.852060.333540.55
Stirrup7.852060.323540.55
Table 5. Equivalent load of hole wall of different blast holes.
Type of HolePartHole
Number
Line Charge
Coefficient
Detonator SeriesEquivalent Load Pressure (Mpa)
Cut holesH11–40.70MS1193.11
Relief holesH25–130.55MS3151.74
H314–250.55MS5151.74
Peripheral holesH426–440.40MS7110.35
Bottom holesH545–590.60MS9165.53
Table 6. Blasting construction parameters using electronic detonators.
Type of HoleHole NumberPartitionHole QuantityDelay Time Range (ms)
Cut holes1–3I30–20
Relief holes4–14I1170–170
Relief holes15–19I5230–270
Relief holes20–30II110–100
Relief holes31–37II7150–220
Relief holes38–46III90–80
Peripheral holes47–59III13130–250
Relief holes60–68IV90–80
Peripheral holes69–80IV12130–240
Disclaimer/Publisher’s Note: The statements, opinions and data contained in all publications are solely those of the individual author(s) and contributor(s) and not of MDPI and/or the editor(s). MDPI and/or the editor(s) disclaim responsibility for any injury to people or property resulting from any ideas, methods, instructions or products referred to in the content.

