Article

A Comparative Study for Evaluating the Groundwater Inflow and Drainage Effect of Jinzhai Pumped Storage Power Station, China

by
Jian Wu
1,2,*,
Zhifang Zhou
2,
Hao Wang
1,
Bo Chen
1 and
Jinguo Wang
2
1
Shanghai Investigation, Design & Research Institute Co., Ltd., No. 388 Yixian Road, Shanghai 200434, China
2
School of Earth Sciences and Engineering, Hohai University, No. 8 Fochengxi Road, Nanjing 211100, China
*
Author to whom correspondence should be addressed.
Appl. Sci. 2024, 14(19), 9123; https://doi.org/10.3390/app14199123
Submission received: 12 September 2024 / Revised: 4 October 2024 / Accepted: 7 October 2024 / Published: 9 October 2024

Abstract

:
Various hydrogeological problems like groundwater inflow, water table drawdown, and water pressure redistribution may be encountered in the construction of hydraulic projects. How to accurately predict the occurrence of groundwater inflow and assess the drainage effect during construction are still challenging problems for engineering designers. Taking the Jinzhai pumped storage power station (JPSPS) of China as an example, this paper aims to use different methods to calculate the water inflow rates of an underground powerhouse and evaluate the drainage effect caused by tunnel inflow during construction. The methods consist of the analytical formulas, the site groundwater rating (SGR) method, and the Signorini type variational inequality formulation. The results show that the analytical methods considering stable water table may overestimate the water inflow rates of caverns in drained conditions, whereas the SGR method with available hydro-geological parameters obtains a qualitative hazard assessment in the preliminary phase. The numerical solutions provide more precise and reliable values of groundwater inflow considering complex geological structures and seepage control measures. Moreover, the drainage effects, including a seepage-free surface, pore water pressure redistribution, and hydraulic gradient, have been accurately evaluated using various numerical synthetic cases. Specifically, the faults intersecting on underground caverns and drainage structures significantly change the groundwater flow regime around caverns. This comparative study can not only exactly identify the capabilities of the methods for cavern inflow in drained conditions, but also can comprehensively evaluate the drainage effect during cavern construction.

1. Introduction

With the rapid economic development in China, the energy demand, especially for clean energy such as water, is continuing to increase. Over the last two decades, 27 pumped storage power stations, which are special power source that have flexible operation modes and multiple functions, have been completed, with a total installed capacity of 21.83 GW [1]. However, during the construction of these hydropower stations, it is inevitable to face the hydrogeological problems of groundwater inflow [2] and its associated environment impacts [3,4], which may lead to casualties [5], tunnel instabilities [6], water desiccation [3], and environmental degradation [7]. Therefore, the estimation of groundwater inflow and the assessment of environment impacts are necessary for the design and construction of hydraulic projects [3].
Analytical methods play an important role in the first quick estimation of water inflow from the mirror image method [8,9,10], the well theory [11,12], to the complex variable method [13,14,15]. Yet, the analytical formulas which cannot take into account the complex geological conditions may tend to over/underestimate the groundwater inflow rate. Compared with analytical formulas, numerical methods have been developed with the advancing of faster computers, which can be applied in more complicated scenarios with more reasonable results [3]. In addition, empirical methods like SGR (Site Groundwater Rating) [16], TIC (Tunnel Inflow Classification) [17], and GRS (Groundwater Seepage Rate) [18] have been presented based on lots of engineering cases in recent years, which can qualitatively and quantitatively calculate the groundwater inflow rates of underground caverns or tunnels. Consequently, a comparative study on the evaluation of groundwater inflow to tunnels or caverns is crucial for designing drainage systems [19].
Many aspects of environmental impacts (i.e., hydrochemical evolution [20], reservoir immersion and leakage [12,21], climate change [22,23], and ecosystem impacts [24]) have been reported in the existing literature considering the representations of surface water more than groundwater. However, for the tunneling or hydraulic projects, especially those with complex drainage systems, the drainage effects, including the water table drawdown and depression cone caused by groundwater inflow, have not received enough attention. Actually, the difficulty involved in solving these drainage problems is to estimate the highly nonlinear free surface and the singular seepage points, which can be generally obtained by numerical methods (e.g., the residual flow method [25], the initial flow method [26], the adjusting permeability method [27], the variational inequality method [28]). Zheng et al. [29] proposed a new variational inequality formulation of Signorini’s type combining with the finite element method (FEM), which can theoretically overcome the singularity at the seepage points and properly proscribe the boundary conditions compared with other numerical methods. Hence, the drainage galleries or underground caverns with relatively large sizes, regular shapes, and extensions can generally be explicitly modeled in the FEM and be properly addressed using the new numerical method.
The objectives of this paper are to (1) compare the different methods used for the evaluation of groundwater inflow into the underground powerhouse of Jinzhai pumped storage power station, and (2) assess the drainage effect caused by tunnel inflow during the construction. To accomplish this task, the engineering geological and hydrogeological conditions of the site are described in Section 2. Then, various methods associated with the specific application conditions are reviewed, and a comparison is made in Section 3. Finally, the drainage effects including water table drawdown, water pressure redistribution, and hydraulic gradient are analyzed in Section 4. This case study can provide references for the construction of other hydraulic projects.

2. Study Site

2.1. Description of Study Area

The Jinzhai pumped storage power station (JPSPS) is located in Jinzhai city, Anhui province, China, 205 km from Hefei city and 134 km from Luan city with convenient transportation [30], as shown in Figure 1b. The elevation of the main mountains in the project area is above 640 m, and the overall slope ranges from 5° to 25° owing to the topographic relief. The JPSPS has 1200 MW installed capacity [1], which includes four reversible pumped storage units. Moreover, it consists of an upper and lower reservoir, an underground powerhouse, and waterway systems. The normal water level, the dead water level, and the storage capacity of the upper reservoir is 593 m, 569 m, and 13.61 million m3, respectively, whereas that of the lower reservoir is 255, 225 m, and 14.69 million m3, respectively. The design dimension of the underground power house is 176.3 × 25.0 × 56.5 m (i.e., length × width × height), with an average elevation of 160 m. In addition, there are two parallel diversion tunnels with 2845.6 m length and 54 m apart, as shown in Figure 1a.

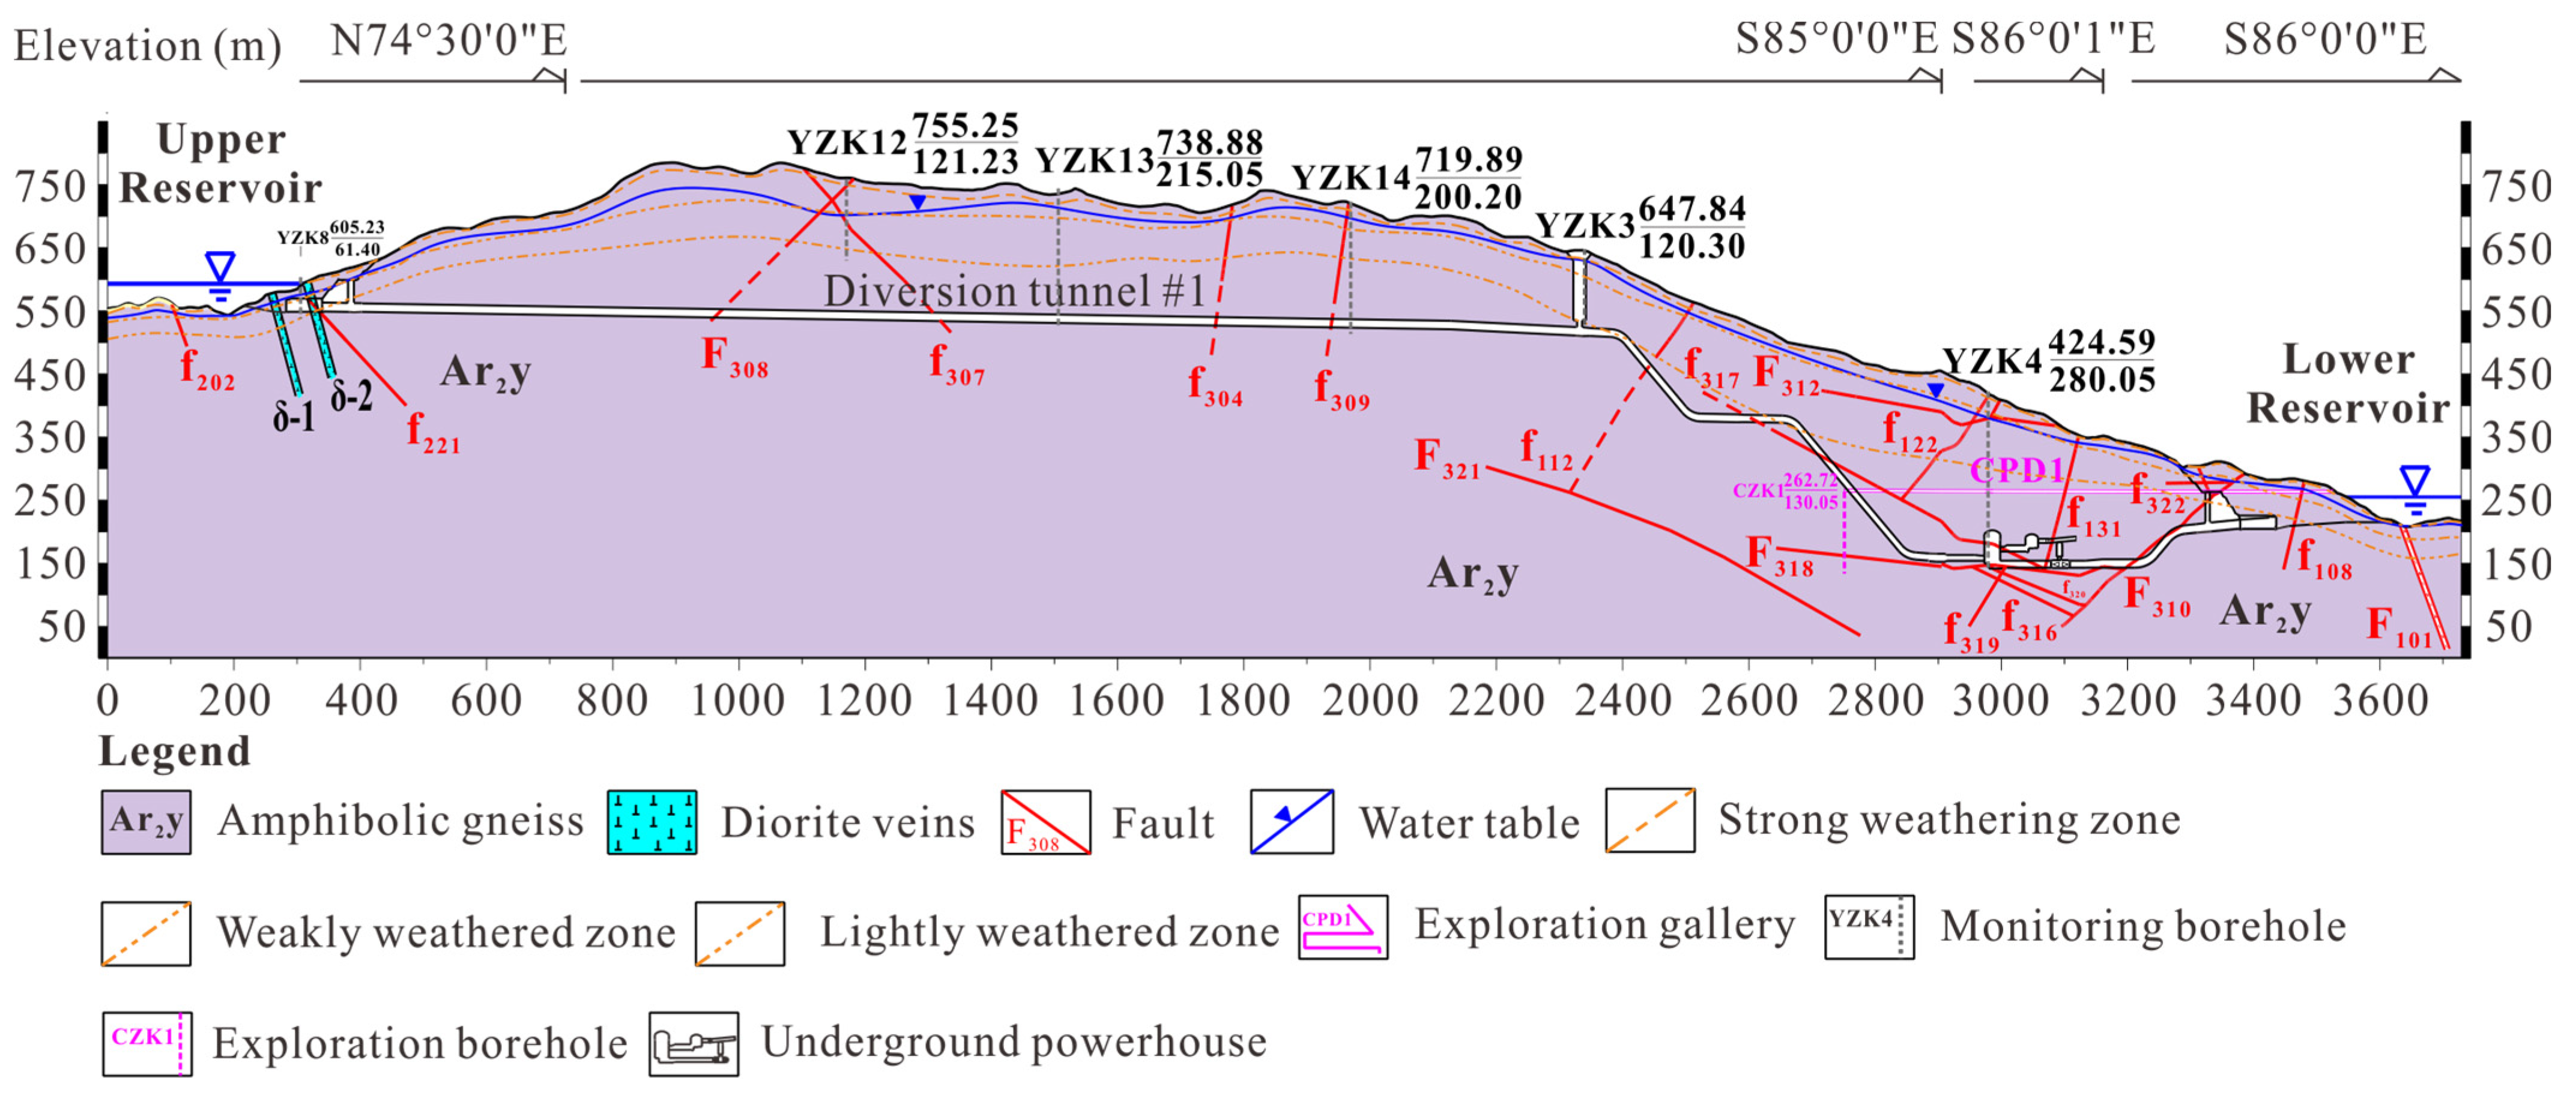
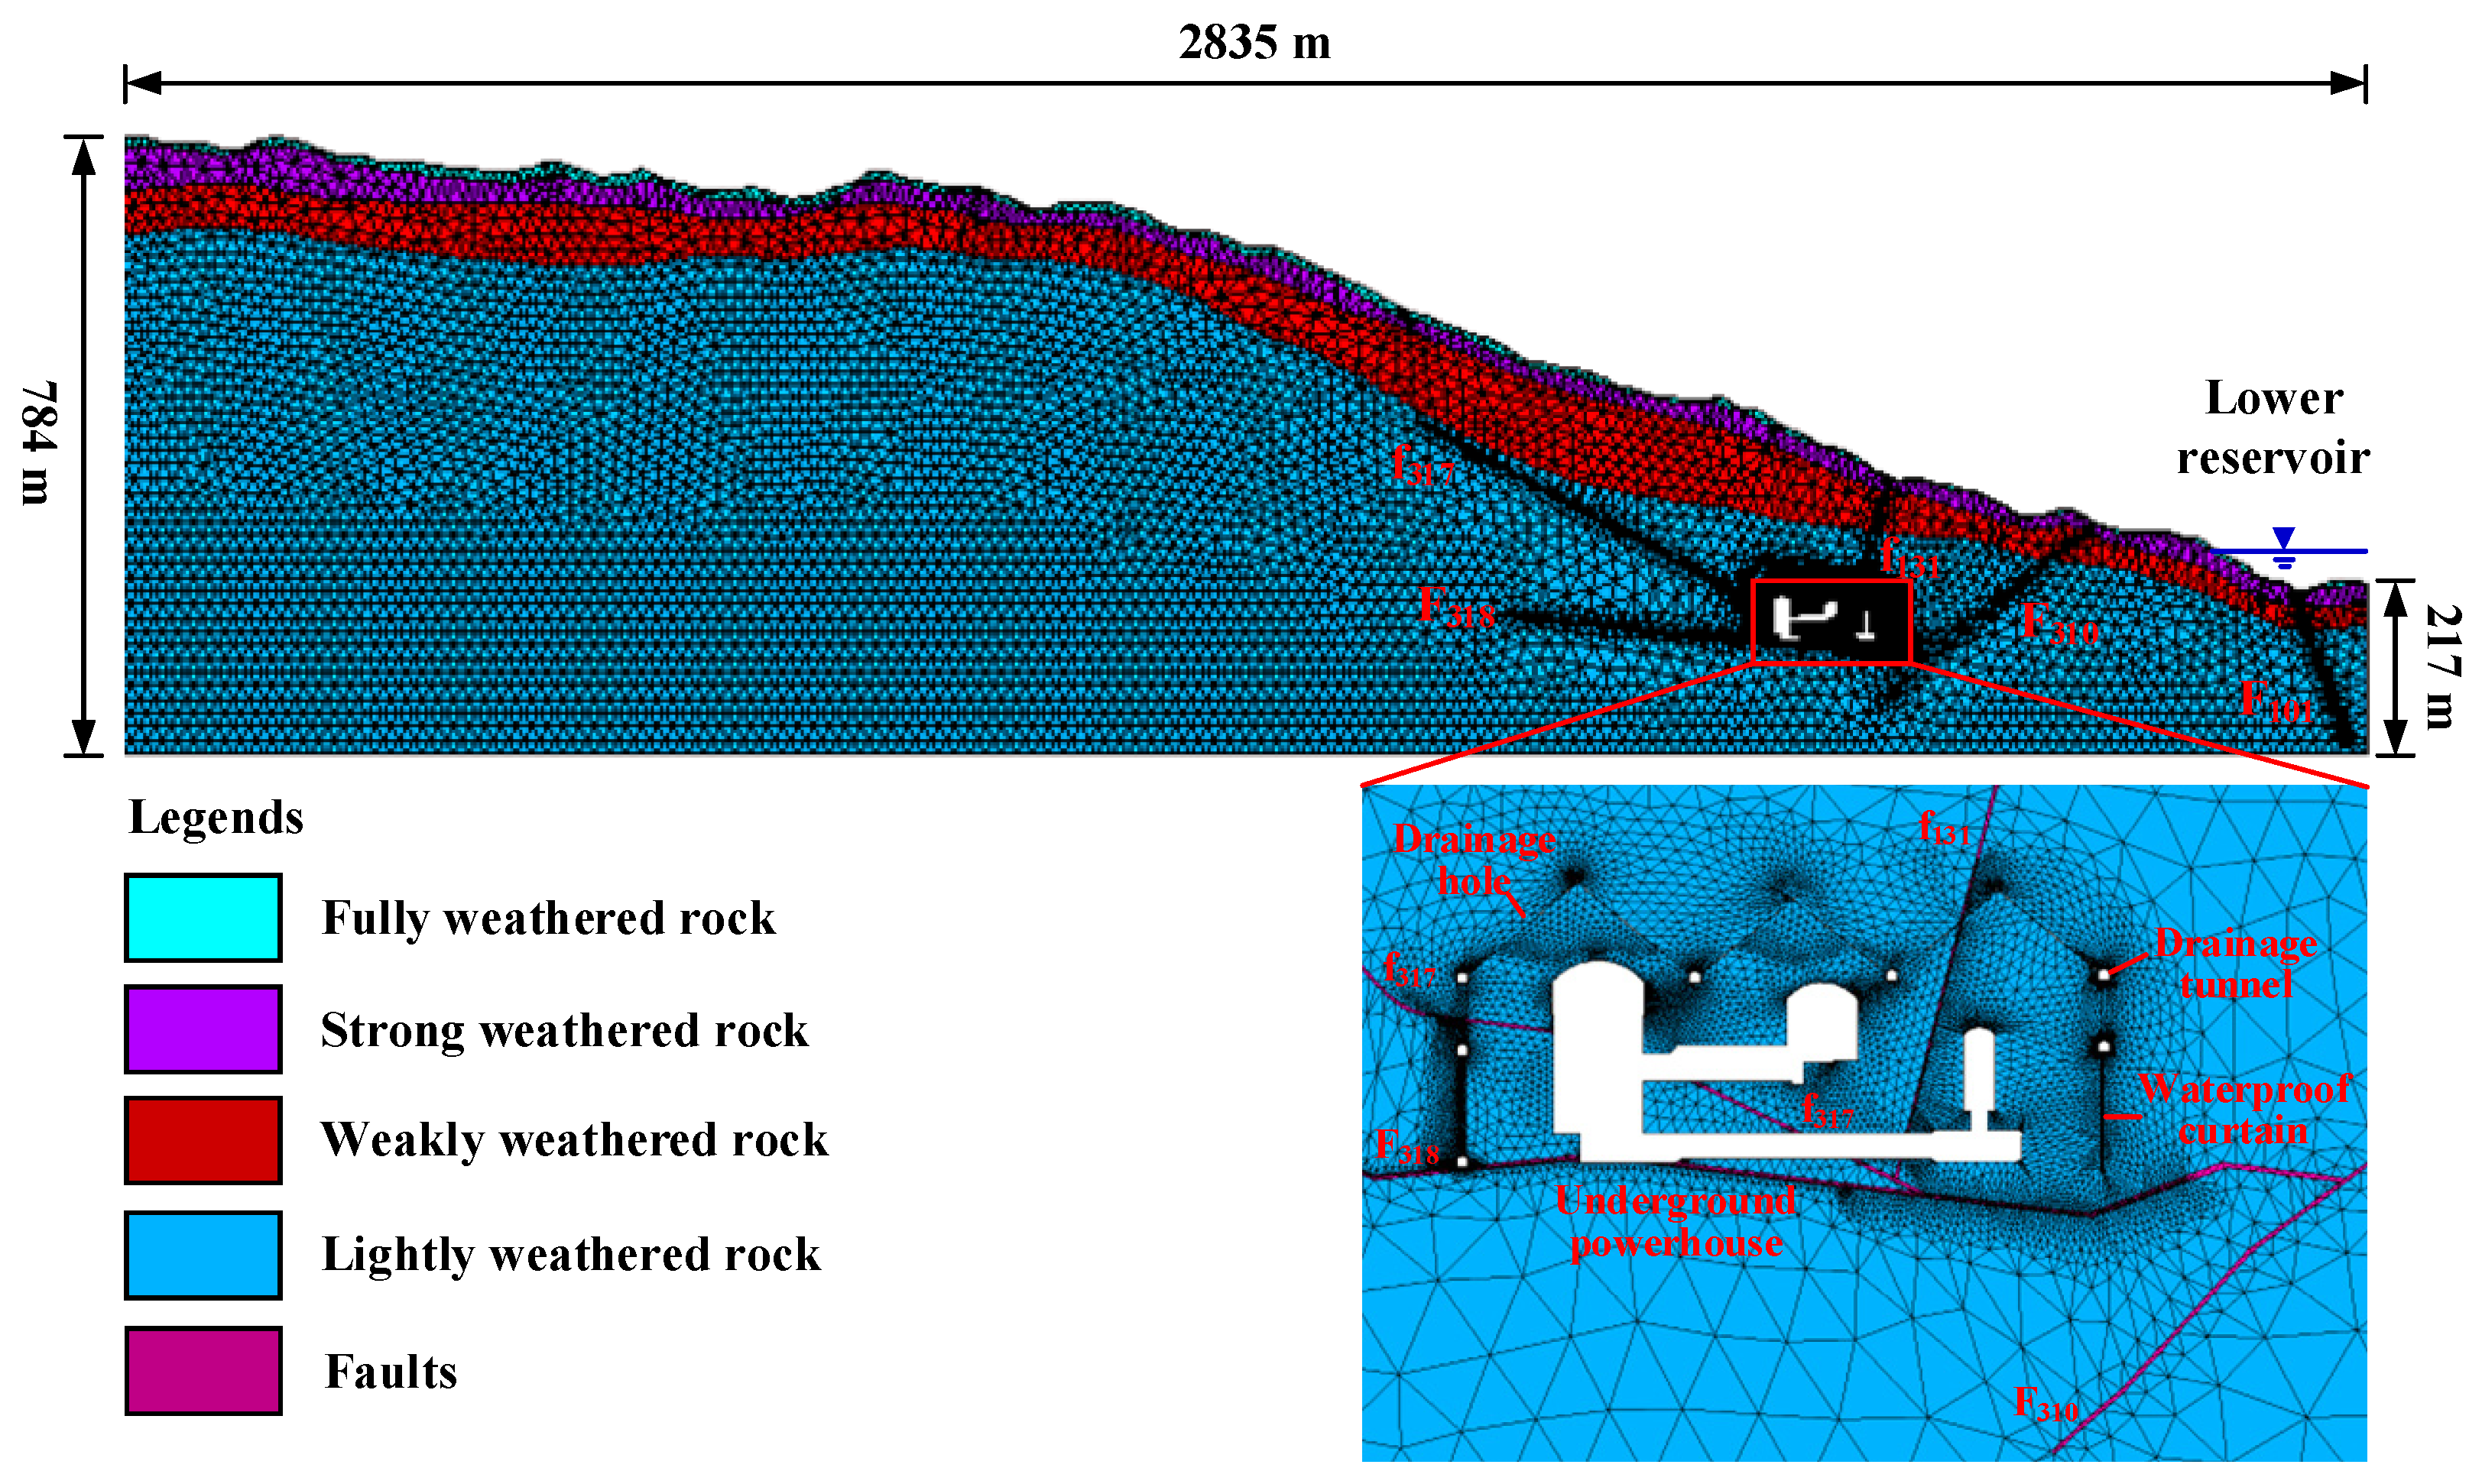
2.2. Engineering Geological Conditions

Figure 2 shows that the stratigraphic units are composed of gneiss (Ar2y), amphibolite veins in the Bengbu (ψO12(1)), diorite veins in the late Yanshan (δ), and Quaternary strata (Q). Gneiss mainly includes ergneiss, amphibolic gneiss, and mixed gneiss. The main mineral compositions of the amphibolite veins are amphibolite, pyroxene, and plagioclase, which are mainly distributed in the dam area of the lower reservoir. In addition, the composition of the diorite veins is dominated by plagioclase, followed by hornblende and a small amount of magnetite. The veins strike N45~75°E, with an average width of 5.0 m. Moreover, the Quaternary strata consist of a diluvial layer (Qal+pl), an eluvial layer (Qedl), and a colluvial deposit (Qcol+dl). The average thickness of the layers is approximately 4.0, 1.8, and 5.6 m, respectively. Additionally, the completely and strong-weathered belts are mainly distributed on the mountaintops and gentle slopes with thicknesses of 0~58.8 m. The buried depth of the weakly weathered belt ranges from 6.5 to 69.4 m, and that of the slightly weathered belt ranges from 34.4 to 146.8 m.
An exploration gallery, named CPD1, was constructed to investigate the geological conditions of the underground powerhouse. It reveals that six faults are distributed around the powerhouse, among which F318 and F321 are relatively large, with an average width of 0.7 m. The occurrence of these faults is plotted in Figure 3. Joints can be divided into four groups based on the orientation. The first group strikes N65-85E and inclines NW with a dip angle of 65°~85°. The second strikes N40-50E and inclines NW with a dip angle of 60°~75°. The third strikes N15-30E and inclines NW with a dip angle of 60°~80°. The fourth strikes N70-85W and inclines NE with a dip angle of 70°~80°. The joint spacing ranges from 0.1 to 2.0 m.

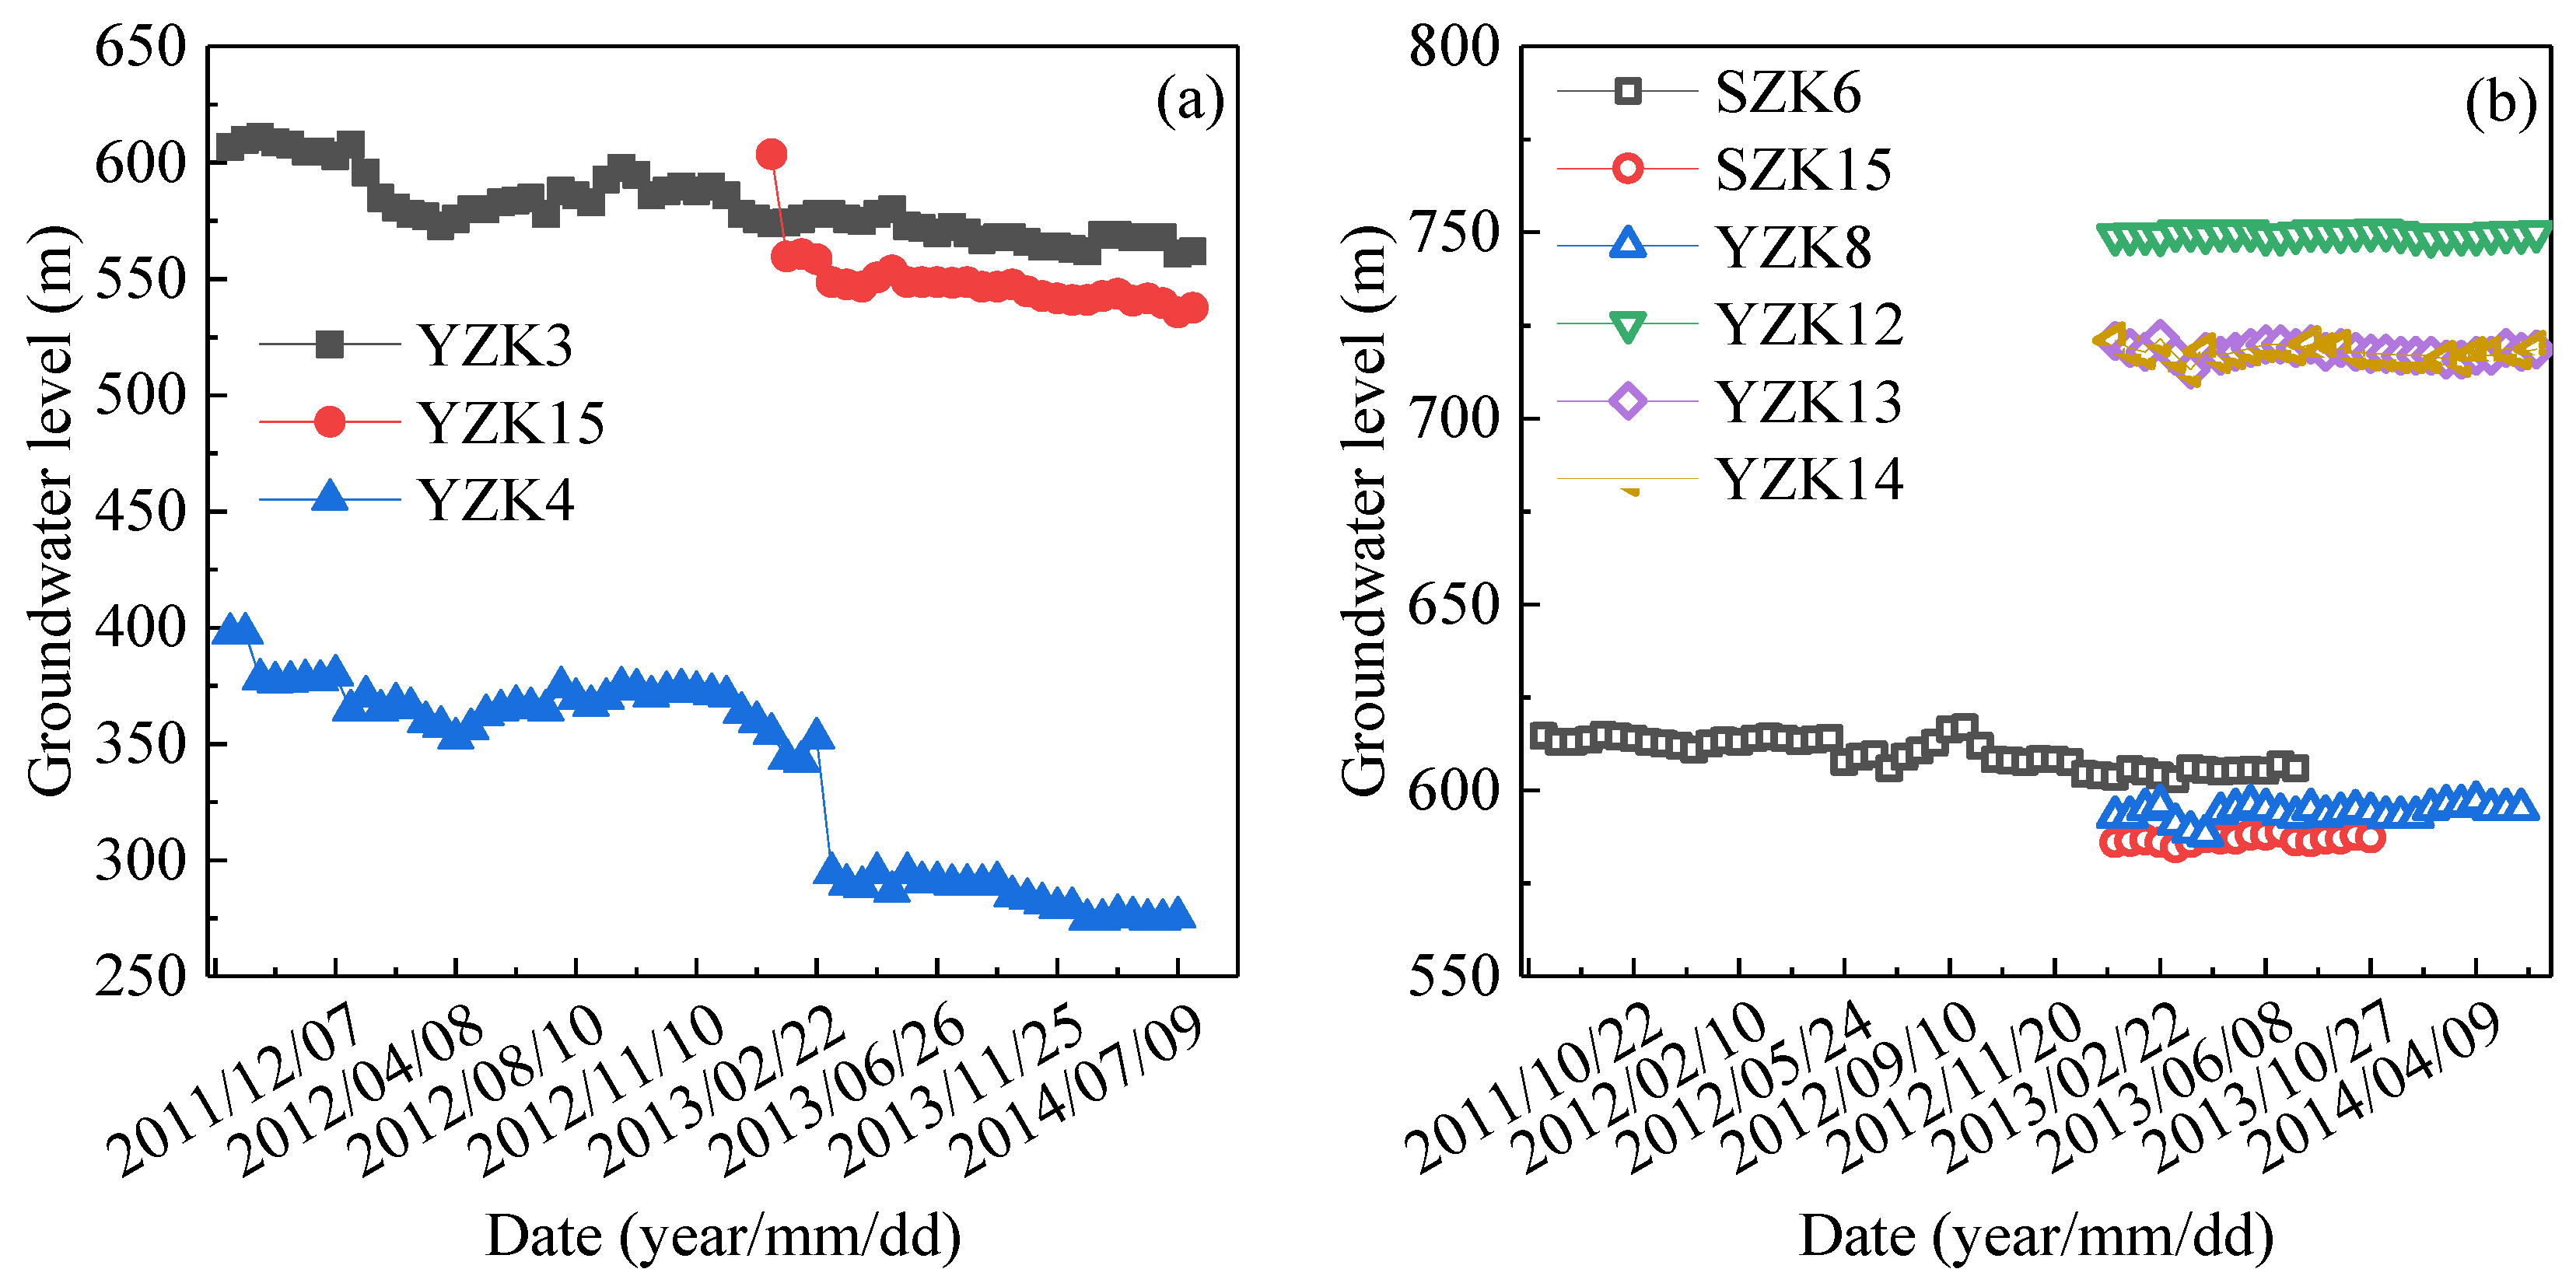
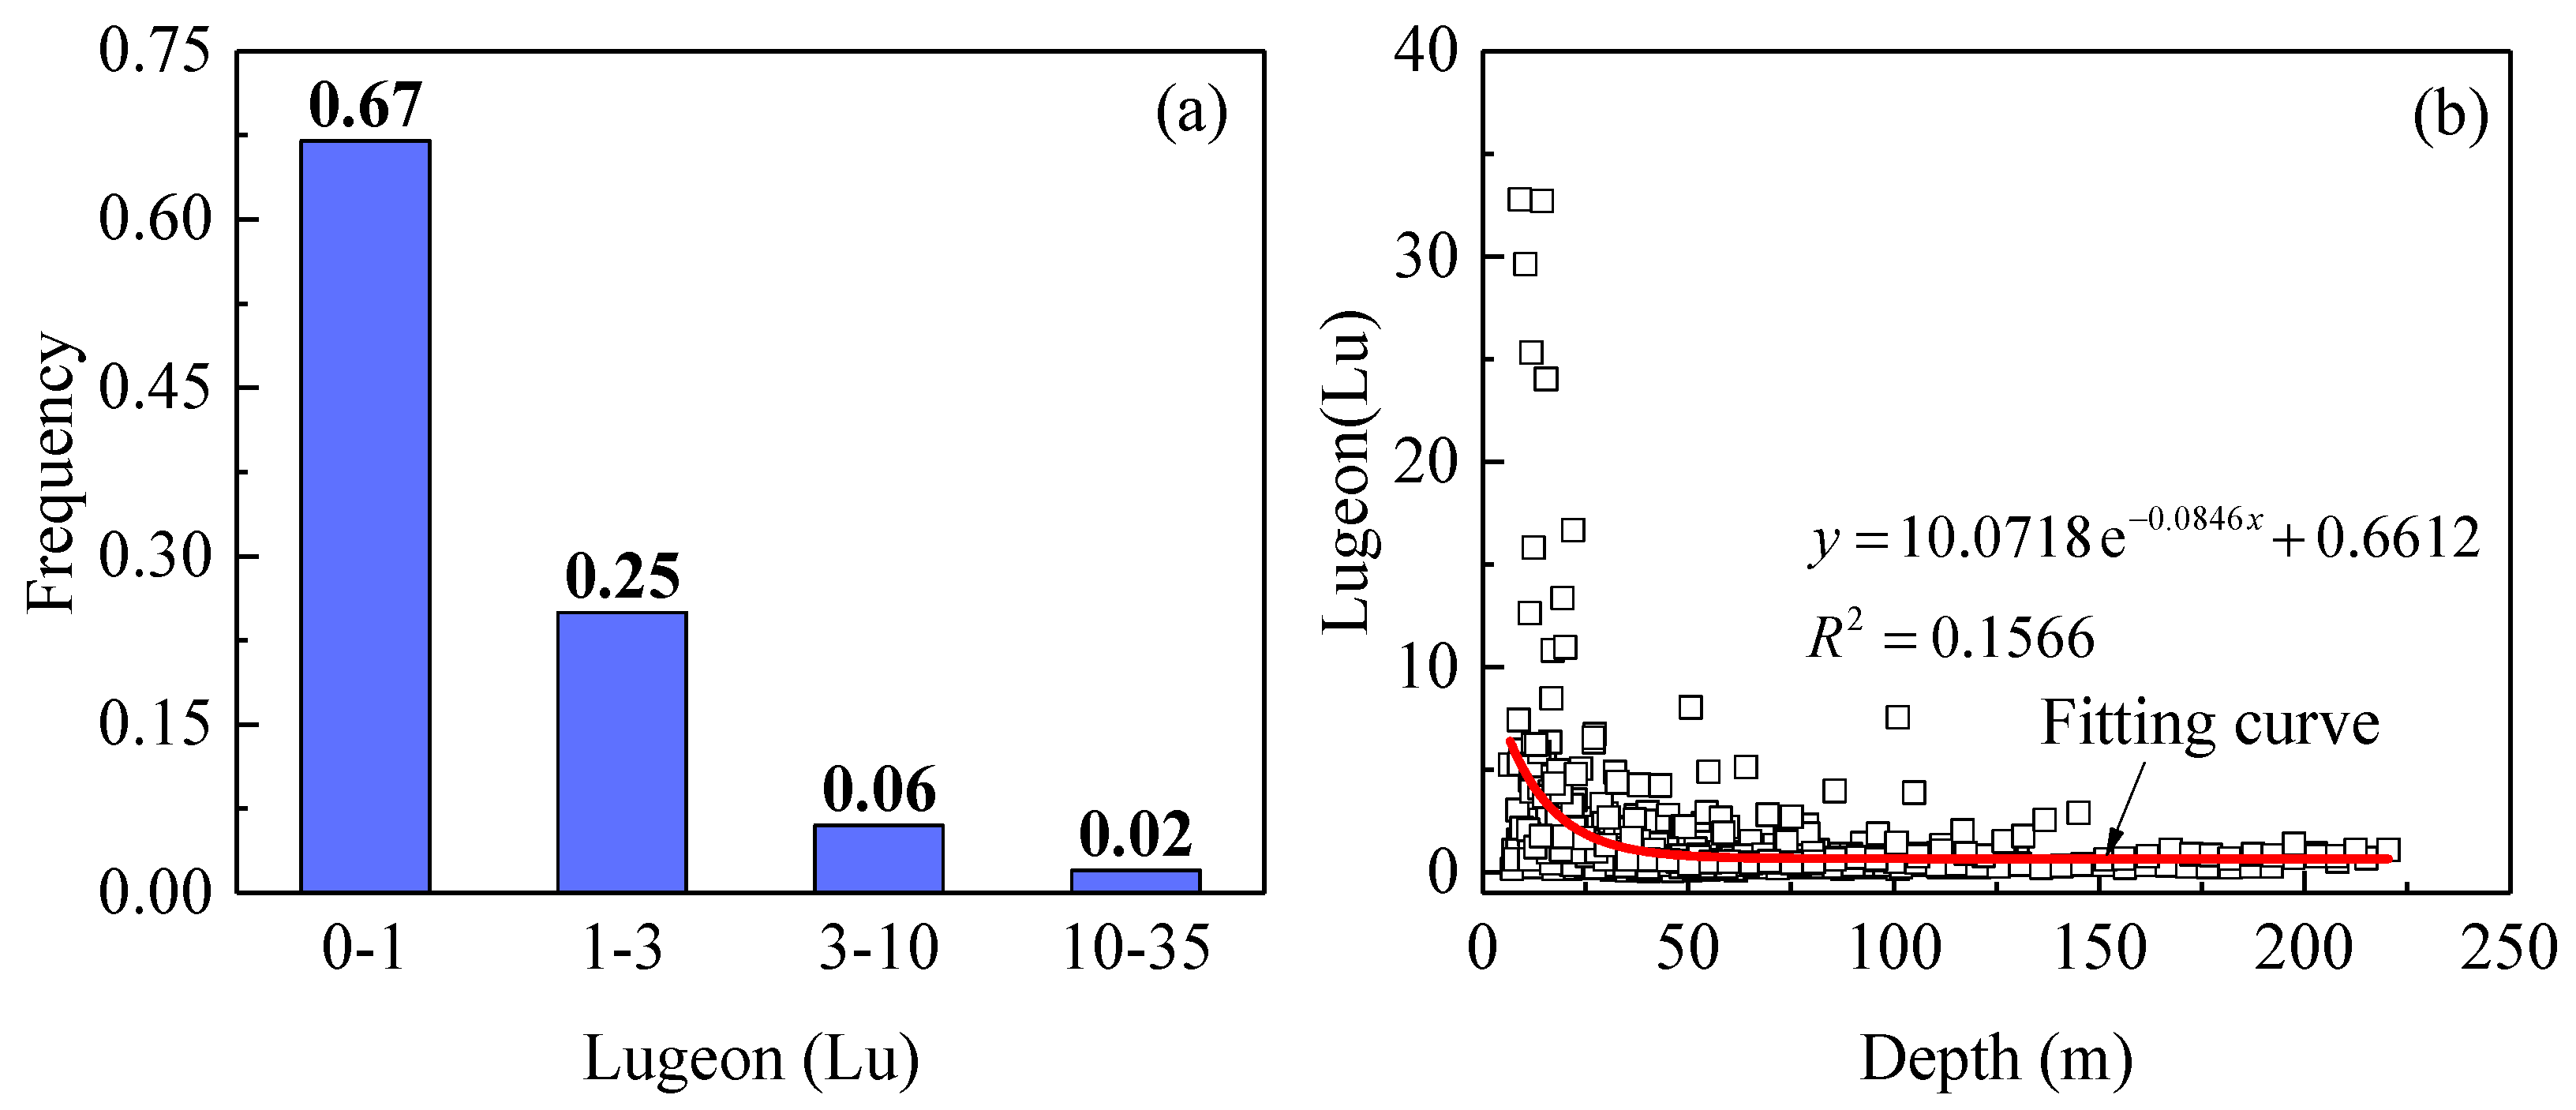
2.3. Hydrogeological Conditions

According to different media, groundwater types include pore water from the porous medium and fracture water from the fractured medium. The pore water is widely distributed in the completely weathered belt and the Quaternary loose strata like Qal+pl, Qedl, and Qcol+dl, whereas the fracture water is recharged by rainfall and surface runoff and occurs in factures and fault zones.
Nine boreholes were arranged to monitor the groundwater level in this study area, as shown in Figure 1a. The groundwater fluctuations of these boreholes during the construction of the underground powerhouse were plotted in Figure 4. It can be seen that the groundwater level of boreholes located in the upper reservoir and diversion tunnels remains almost constant. On the contrary, the groundwater level of boreholes around the underground powerhouse were subjected to an excavation-induced drawdown, with a maximum value of 122 m (YZK4). Therefore, the drainage effect on the water table drawdown of underground caverns has a significant impact on the groundwater environment.
To evaluate the hydraulic conductivity of the rock mass, Lugeon pressure tests were conducted in boreholes, drilled in the upper and lower reservoirs, the waterway system, and the exploratory gallery. The statistical distribution of the measured mean hydraulic conductivities in this project is shown in Figure 5. It can be seen that 67% of the measured values are less than 1 Lu and 33% over. Among the latter, only 2% exceed 10 Lu. Moreover, larger values are widespread at the shallow surface because of the high variability in fractures. It can be clearly seen that the measured values have the tendency to be reduced with increasing depth. In this note, the conversion of the hydraulic conductivity units is 1 Lu for 1 × 10⁻⁷ m/s and vice versa.

3. Methods

In this section, a framework that combines two groups of analytical formulas, the SGR method [16], and numerical modeling is proposed to more accurately evaluate the water inflow rates induced by cavern excavation.

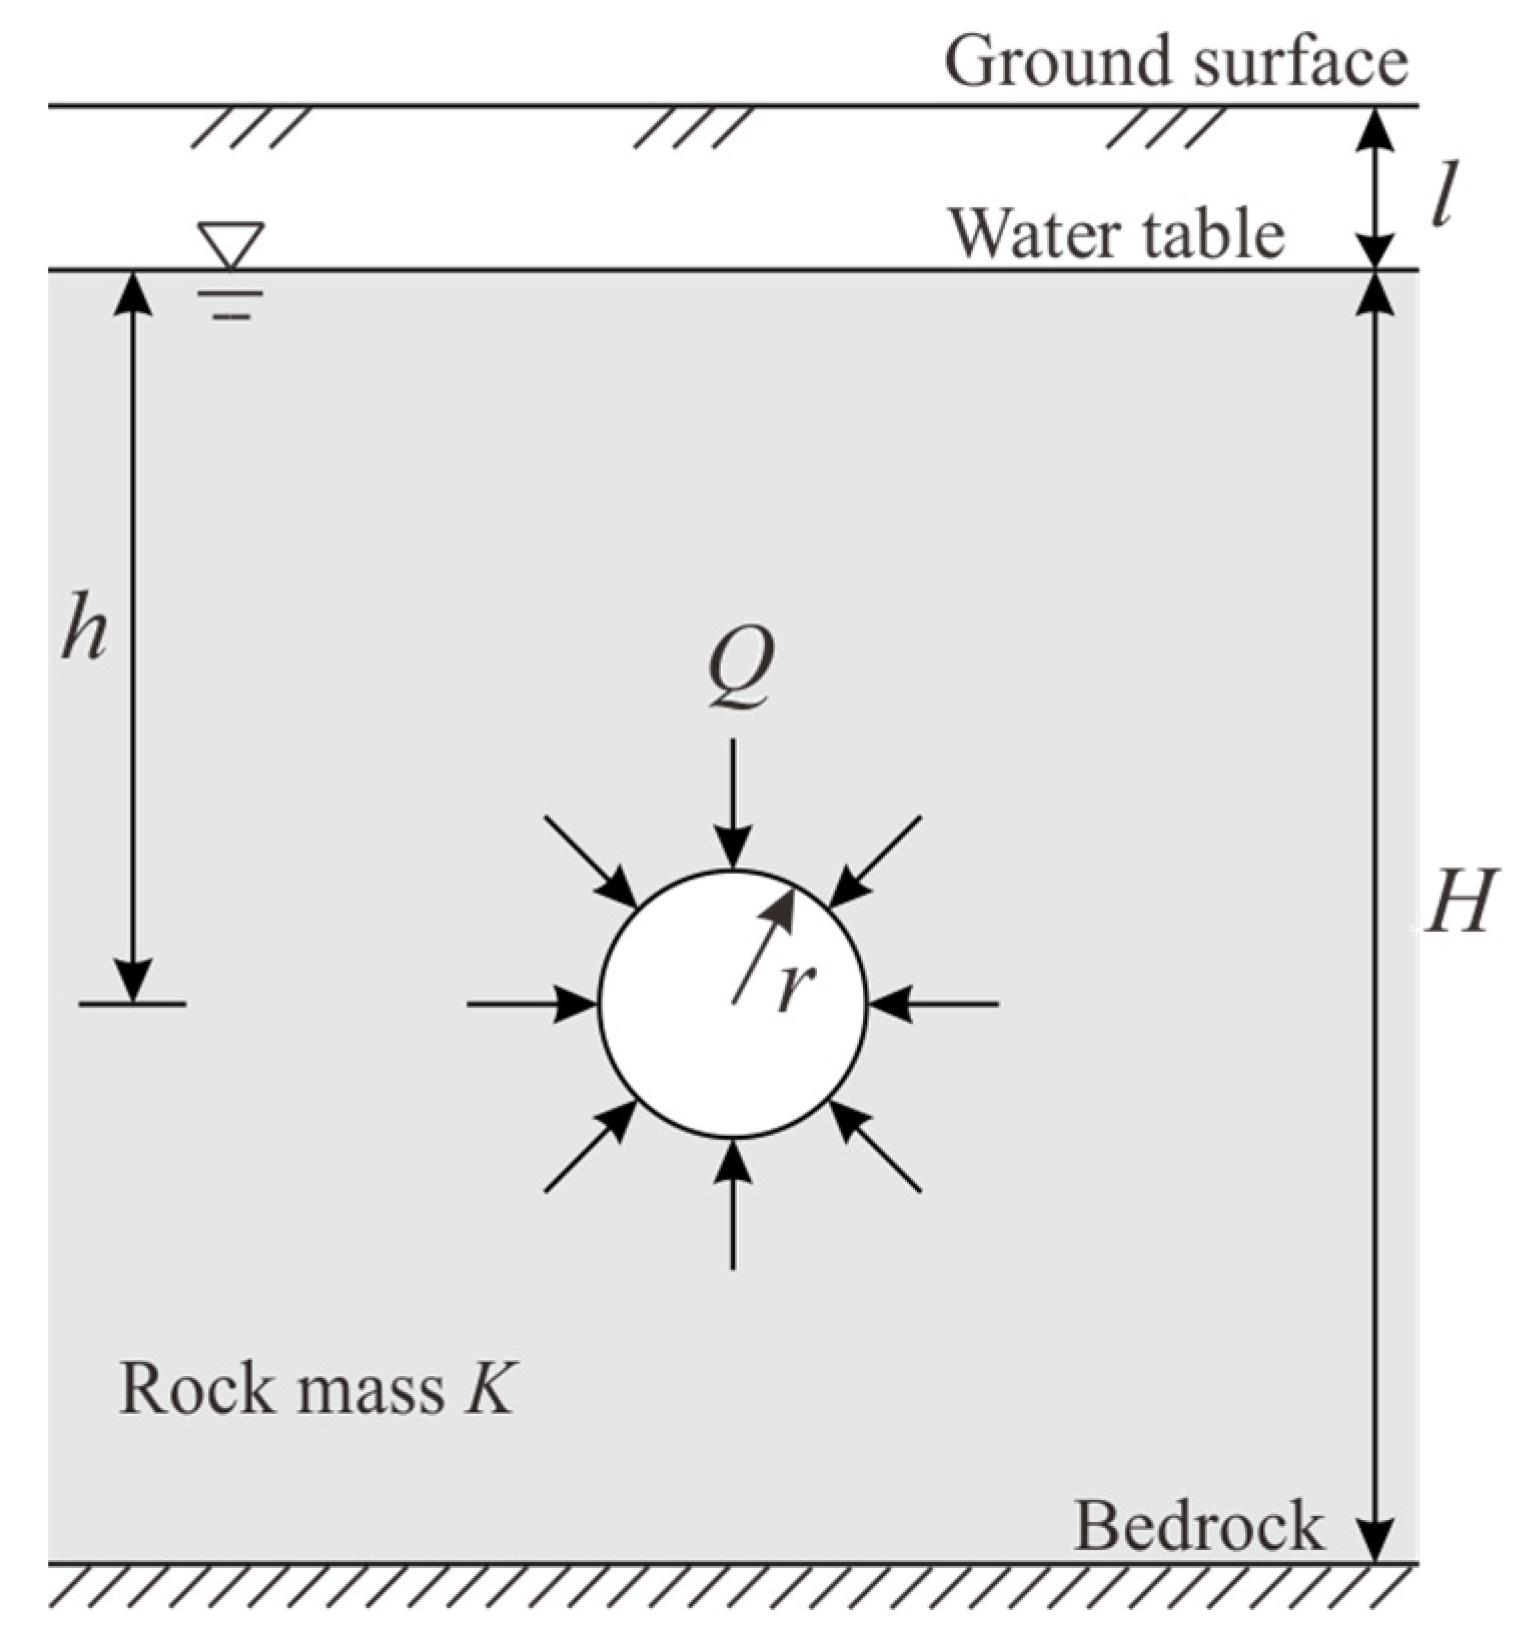
3.1. Analytical Methods

Various analytical methods for the prediction of groundwater inflow into tunnels have been developed by scientists from all over the world, which can be divided into two groups based on whether or not the drainage effect is considered. For the first group, the tunnel is assumed to be underwater or have sufficient recharge nearby, with a stable water table and ideal radial flow. Otherwise, for the second group, there is insufficient recharge to balance the amount of water flowing into an excavation; thus, the drawdown of the water table happens, and the groundwater flow is a combination of radial flow and horizontal flow because of the drainage effect. Therefore, a comparative study on the evaluation of groundwater inflow into the underground powerhouse of JPSPS is necessary by using different analytical methods. In the following sections, short descriptions of the main contributions from two types of analytical methods are outlined.

3.1.1. Analytical Methods Considering Stable Water Table

Considering a tunnel in a semi-infinite rock mass with a horizontal stable water table is shown in Figure 6:
Goodman et al. [9] proposed an equation for the prediction of steady-state radial groundwater inflow into a circular tunnel using the mirror method, with the simplified assumptions that the water level is much larger than the tunnel radius. The equation, which is mostly suitable for deep tunnels, is described as follows:
Q = 2 π K h ln 2 h / r
Lei [8] extended the Polubarinova-Kochina formula to form a new solution for two-dimensional steady state groundwater inflow into a horizontal tunnel. The proposed equation is as follows:
Q = 2 π K h ln h / r + h / r 2 1
Karlsrud [10] proposed a solution for the calculation of steady state groundwater inflow to a tunnel, based on their industrial experience. The equation is as follows:
Q = 2 π K h ln 2 h r / r
Using Fourier series and Mobius transformation, EI Tani [31] exactly solved the gravity flow, which is generated using a circular tunnel. The equation is as follows:
Q = 2 π K λ 2 1 λ 2 + 1 h ln λ
where λ = h / r h / r 2 1 .

3.1.2. Analytical Methods Considering Water Table Drawdown

Considering a tunnel in drained conditions with lowered water table, as shown in Figure 7:
Moon and Fernandez [32] adopted a lowered water level to replace the initial water level in the Goodman solution [9], so an analytical equation for the calculation of groundwater inflow into tunnels in the drained condition could be used. However, the lowered water level in the equation was only obtained by numerical calculation, which may greatly hinder the application of the formula. Subsequently, Su et al. [33] proposed a semi-analytical formula for the virtual water level, which is used to replace the lowered water level in the adjusted mirror image method, so the analytical equation was simplified and described as follows:
Q = 2 π K 0.3 ( r / h ) 0.014 r 0.22 h ln ( 2 h / r )
s = h e 1.83 r 27.31 r / h h ,   r / h < 0.1 h , r / h 0.1
EI Tani et al. [34] considered a drained tunnel in an open aquifer with a free water table and obtained two new equations for the water inflow and the water table drawdown, based on the integral method and the appropriate Green function. The equations are described as follows:
Q = 2 π K h ln 2 H π r s h π d H 1 + s h 2 π d / H sin 2 π h / H
s = Q 2 π K ln sin 2 π h / 2 H + s h 2 π x + d / 2 H sin 2 π h / 2 H + s h 2 π x d / 2 H
Wu et al. [3] proposed semi-analytical formulas for the calculation of groundwater inflow rate and water table drawdown of shallow and deep tunnels in drained conditions, based on the trench model and the image method. The formulas are shown as follows:
Q = K L r 2 h d + h 2   ( shallow   tunnel ) Q = 2 π K h ln 2 h / r   ( deep   tunnel )
s / h r = 1.3468 e 40.404 r / h + 1.1106 , r / h < 0.062 0.449 e 3 . 0583 r / h + 0.4573 , r / h 0.062
where d = a r / h + b D and h = c r / h + e h . Furthermore, a = 0.0193 r 2 0.3223 r + 0.3654 , b = 0.0017 r 2 + 0.0311 r + 0.3538 , c = 0.1371 r 2 + 2.5061 r 18.2290 , and e = 0.0060 r 2 0.1124 r + 1.3456 , referred to by Wu et al. [3].
Actually, the underground powerhouse of JPSPS is relatively regular, which can be equivalent to a well with a large radius and can be solved using the well theory. The big well method can be used to calculate the water inflow based on Dupuit’s equation [12,35], so the equations can be expressed for the unconfined aquifer and confined–unconfined aquifer, respectively:
Q = 1.366 K 2 h s s ln ( R / r ) ( Unconfined   well ) Q = 1.366 K 2 h H H 2 h s 2 ln ( R / r ) ( Confined - unconfined   well )
where R is the influence radius and can be obtained using Weber’s formula [35]:
R = 2.45 h K t / μ
where μ is the specific yield, t is the time required for the groundwater level to stabilize.

3.2. Empirical Method

Based on a large number of tunnel engineering cases, empirical methods like SGR [16], TIC [17], and GSR [18] collect and summarize various factors, including rainfall and the joint, water head, physical, and mechanical parameters of rock mass, etc., and then qualitatively and quantitatively calculate the groundwater inflow rates. Therefore, compared with those analytical methods, the calculated results of empirical methods are more in line with the geological framework of the project. However, the disadvantage is that lots of measured data must be required in the design phase, which may take a long time. In this study, the SGR method proposed by Katibeh and Aalianvari [16] is adopted to calculate the water inflow into the underground powerhouse of JPSPS. The equation for calculation of SGR factor is as follows:
SGR = S 1 + S 2 + S 3 + S 4 + S 5 × S 6 × S 7
where S1 = frequency and aperture of joints, S2 = schistosity, S3 = crashed zones, S4 = karstification, S5 = soil permeability, S6 = water head, S7 = annual precipitation. The detailed scoring of the above-mentioned parameters is well described in Katibeh and Aalianvari [16].
The magnitudes of SGR coefficients can be divided into six classes, No Risk, Low Risk, Moderate Risk, Risky, High Risk, and Critical, as shown in Table 1, which can be used to evaluate the hazards of groundwater inflow into tunnels. Once the underground caverns or tunnels are scored with large SGR coefficients using this method [16], it means that there may be a high risk of groundwater inrush. Therefore, the design of the drainage system and the selection of the drilling method should be strictly required according to the SGR coefficients.

3.3. Numerical Modelling

3.3.1. Finite-Element Model

For evaluating the seepage behaviors of underground caverns, we adopted a numerical procedure combining a Signorini-type variational inequality formulation proposed by Zheng et al. [29], which has been successfully applied to evaluate the seepage behaviors of underground caverns [36,37,38]. The partial differential equation and iterative formulation of the numerical approach are described in Zheng et al. [29], and the algorithm flow of the numerical procedure is found in Chen et al. [36]. Moreover, the finite-element numerical program was written using the MATLAB software (2023b).
Figure 8 displays a two-dimensional (2D) numerical model of an underground powerhouse with a refined triangular mesh. The left and right boundaries of the numerical model were taken as the groundwater divide and the lower reservoir, respectively, which can be assigned according to the initial groundwater level. Moreover, the top and bottom boundaries were taken to the ground surface and sea level, respectively. Four weathered belts, five faults, and seepage control structures (i.e., drainage holes, drainage tunnels, and waterproof curtain) were involved in the model, with 35,110 triangular elements and 18,541 nodes.
In the numerical simulations, the following hydrogeological assumptions were made: (1) the rock mass and the waterproof curtain are homogeneous with isotropic permeability, (2) the flow is a steady state and satisfies Darcy’s law, (3) the pore water pressure on cavern boundaries is zero. Moreover, the boundary conditions were applied: (1) the constant head boundary at the left and right boundaries, (2) the no-flow boundary at the bottom of the model, and (3) the complementary condition of Signorini’s type at the boundaries of underground powerhouse and drainage structures; see Zheng et al. [29].

3.3.2. Model Parameters and Synthetic Cases

Due to the statistical characteristics of Lugeon pressure tests, the permeabilities of different weathered zones were selected, and the specific yield was determined according to the relevant literature [12,30,39,40,41], as listed in Table 2. Five faults (i.e., F318, F310, f317, f131, and F101) were performed in the numerical model, which may affect the reservoir leakage and groundwater inflow into the underground powerhouse. The waterproof curtain was assumed to be a low-permeability medium with a thickness of 1.0 m. Four synthetic cases were designed to calculate the seepage field of underground caverns in various working conditions, as listed in Table 3. It is noteworthy to mention that when the function of seepage control structures fails in risk conditions, its permeability is equal to that of the surrounding rock mass. Moreover, the side effects of water inflow (e.g., tunnel instabilities [6], structure deformations [42], and surface settlements [43]) are not treated in this study.

4. Results and Discussion

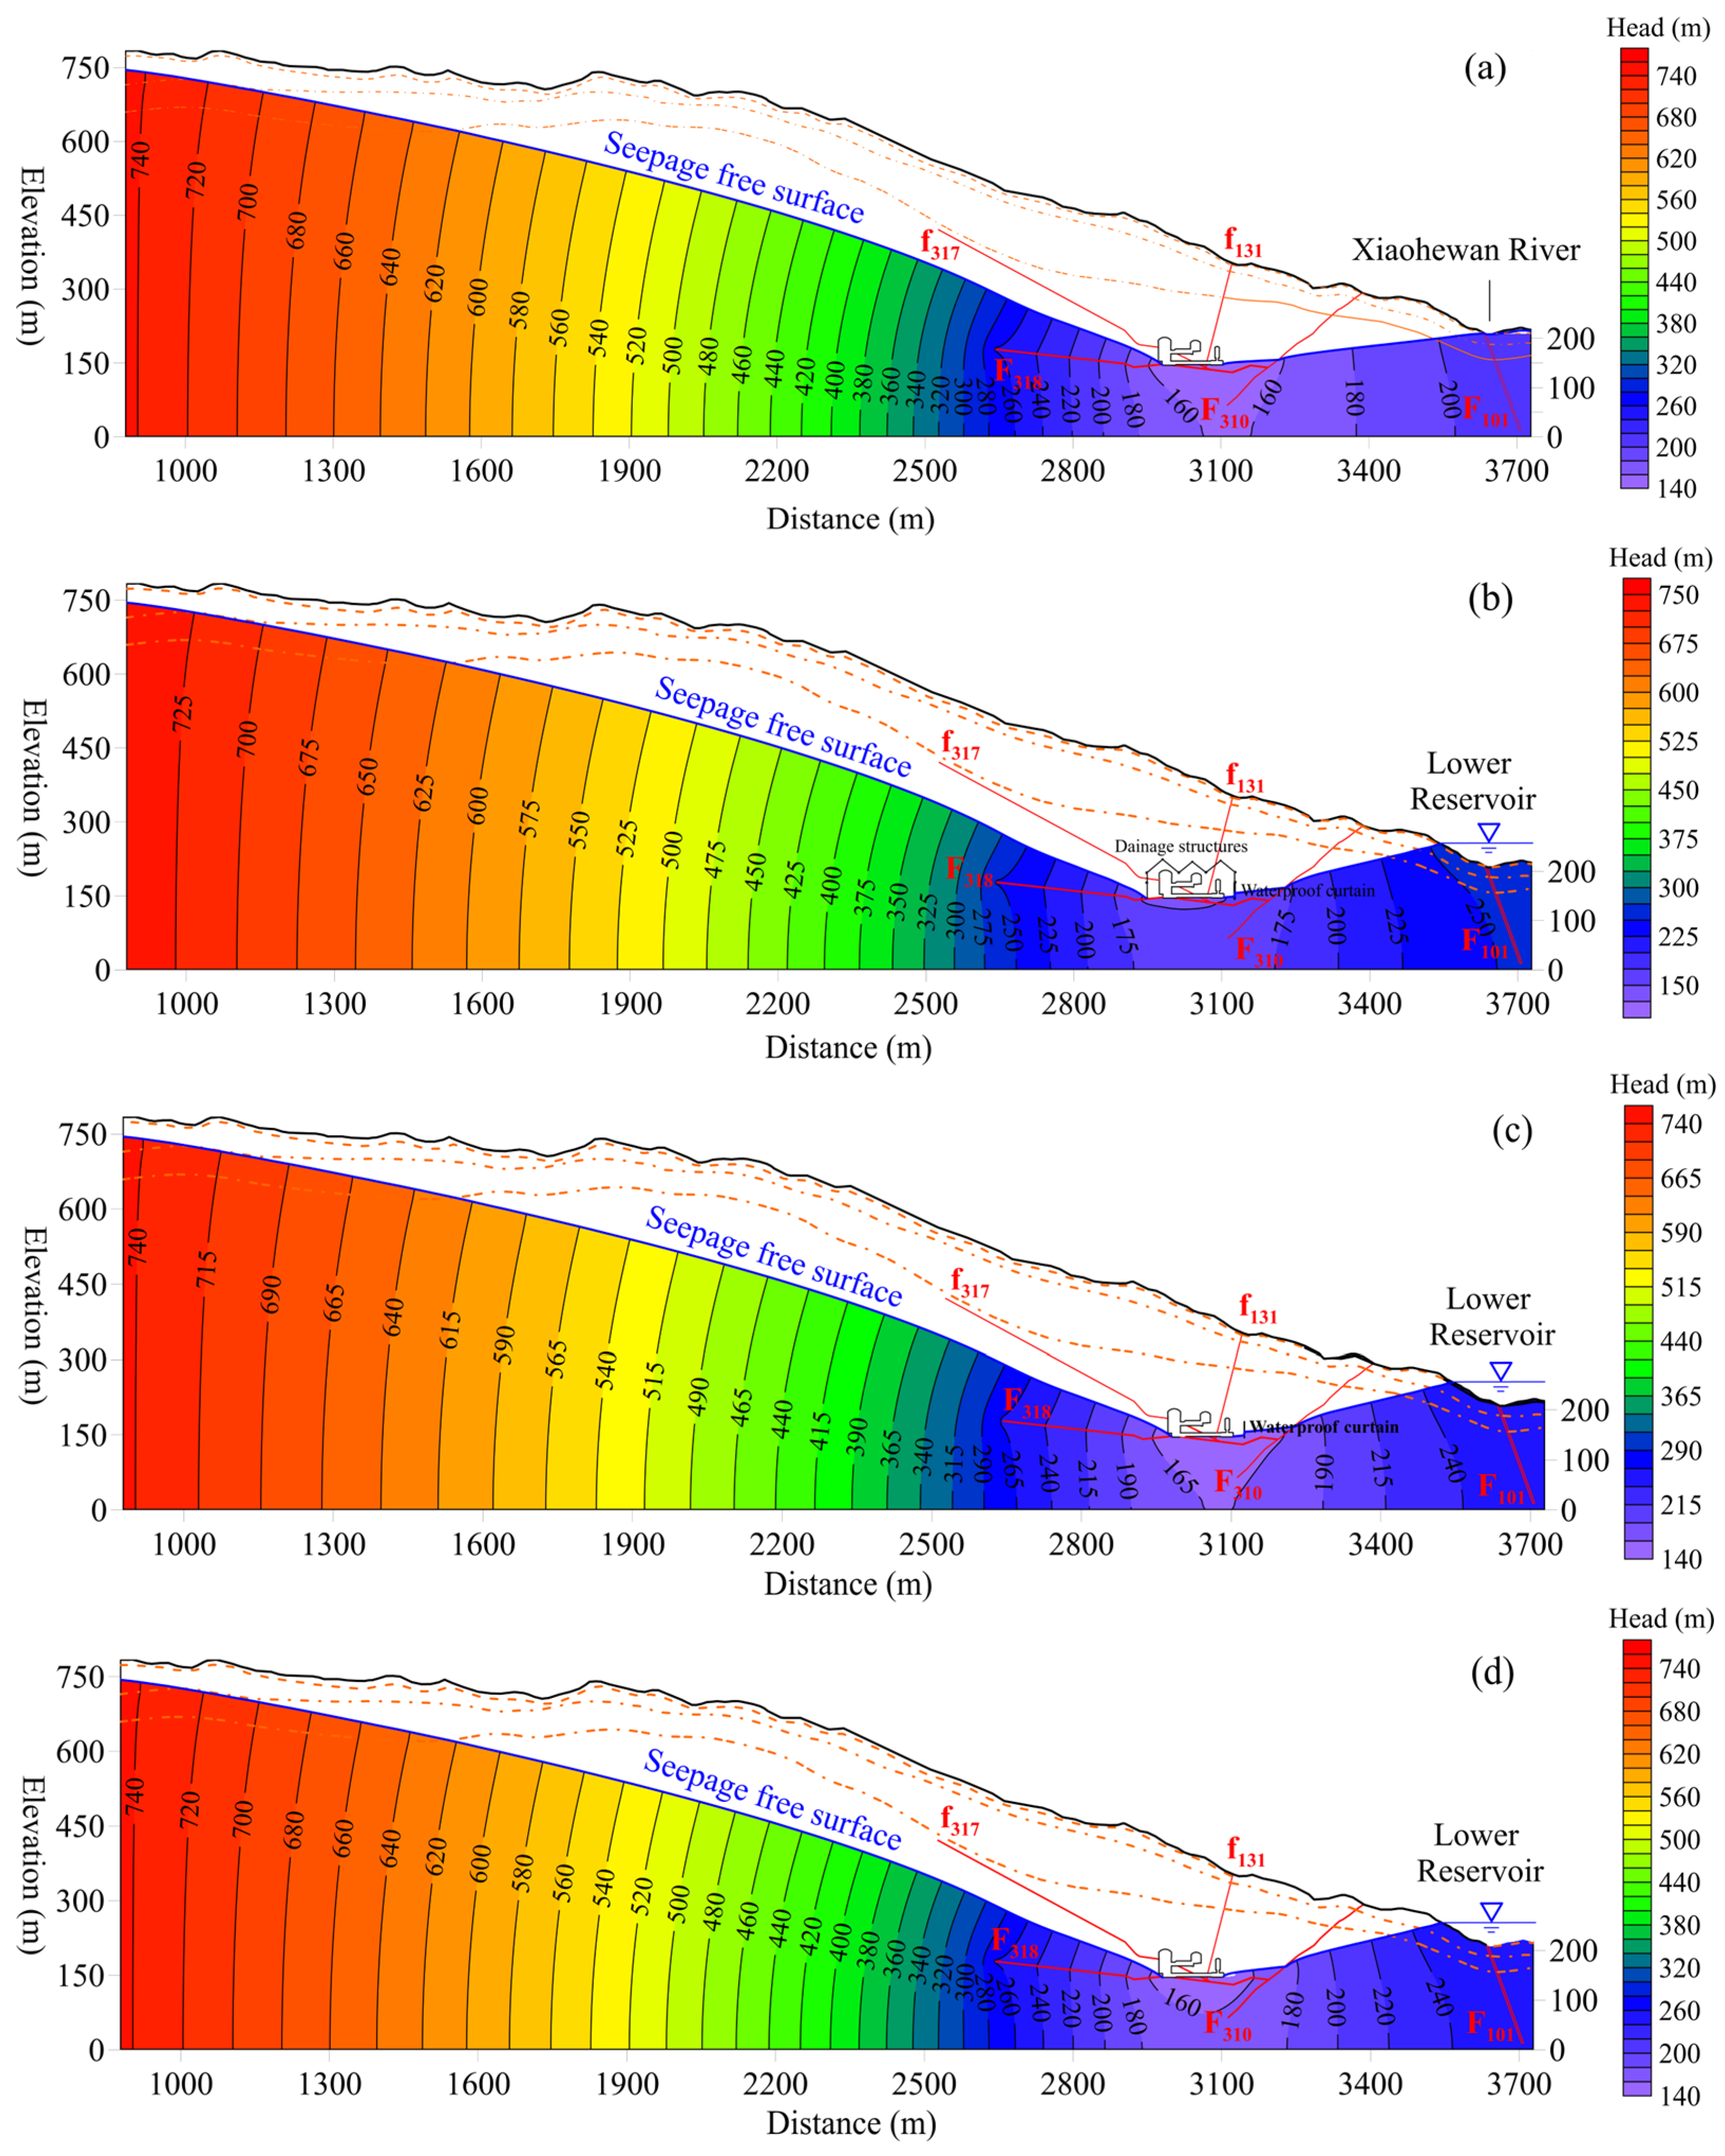
4.1. Groundwater Inflow into Underground Powerhouse

The underground powerhouse consists of three major caverns like the main and auxiliary powerhouse, main transformed cavern, and tailrace gate chamber. The geometry of these underground caverns is simplified as a circle on the vertical section for the application of analytical methods. Then, the selected parameters and calculated results of analytical methods are shown in Table 4 and Table 5, respectively. It is worth noting that in the big well method, the unconfined well formula is selected to calculate the water inflow, and t is assumed to be twenty days, referring to Su et al. [44]. Obviously, the water inflow rates calculated using the Karlsrud method [10] are the largest, while the big well method [12] leads to the smallest values. Compared to the analytical solutions considering the drainage effect, the values obtained using the analytical methods assuming a stable groundwater level are apparently larger.
The SGR coefficients of three caverns were determined by taking account joint frequency and aperture, crashed zone width, and groundwater level, as listed in Table 6. Due to the absence of karstification phenomena in the study site, S4 and S5 are assumed to be zero. Additionally, S2 is ranged from 1 to 5 regarding the degree of schistosity. S3 related to crashed zones is scored by the fault distributions, and S7 is assumed as unit because of the cavern excavation in saturated zone. Overall, the underground powerhouse is in “Low Risk” class with the SGR coefficient of 292.86. Considering the low permeable rocks, it can be claimed that the low risk in excavation is subject to the middle crash zones caused by faults (F318 and f317) and joints.
Table 7 lists the numerical results of four synthetic cases in various working conditions. Clearly, the value of water inflow rate is approximately 1230 m3/d in Case 1. Because of the function of drainage holes and tunnels, the water inflow rate of underground powerhouse in operation condition is significantly reduced to 104.47 m3/d. Conversely, the inflow rate increases from 1428.16 (Case 3) to 1519.79 m3/d (Case 4) under risk conditions, which means that the seepage control structures play a crucial role in reducing water inflow into caverns.
Figure 9 displays a comparison of water inflow rates of underground powerhouse calculated by various methods. For the analytical methods considering stable water table [7,8,9,27], the results may overestimate the inflow rates of caverns in drained conditions. On the contrary, the analytical solutions of the EI Tani and Wu formulas [3,34] considering the drainage effect show a decent fit with the numerical result of Case 1, which can verify the accuracy of this comparative study. Compared to the analytical and numerical solutions, the SGR method [16] can conduct a qualitative hazard assessment of water inflow into underground powerhouse.

4.2. Water Table Drawdown of Underground Powerhouse

Figure 10 plots the water head distributions of an underground powerhouse of four numerical cases in various working conditions. Overall, the underground caverns significantly change the water head distribution of the study site. The seepage-free surface intersects precisely on the boundaries of the main and auxiliary powerhouse and tailrace gate chamber, while the groundwater surrounding the main transformed cavern is entirely drained. After the lower reservoir impoundment, the seepage-free surface experiences a noticeable uplift. Instead, the seepage control structures lead to an increase in water table drawdown and depression cone.
Figure 11 shows a comparison between various methods and monitoring data of water table drawdown in Case 1. It can be seen that the water table drawdown is inversely proportional to the distance from the underground powerhouse. The numerical results are approximate to the proposed analytical solutions because of the similar assumptions, but there is quite difference (i.e., the minimum value 82.88%) correlating with the monitoring data. This phenomenon may be caused by the heterogeneity and anisotropy of geological structures and constructive interference. Future work needs to address the gap between research and practice.

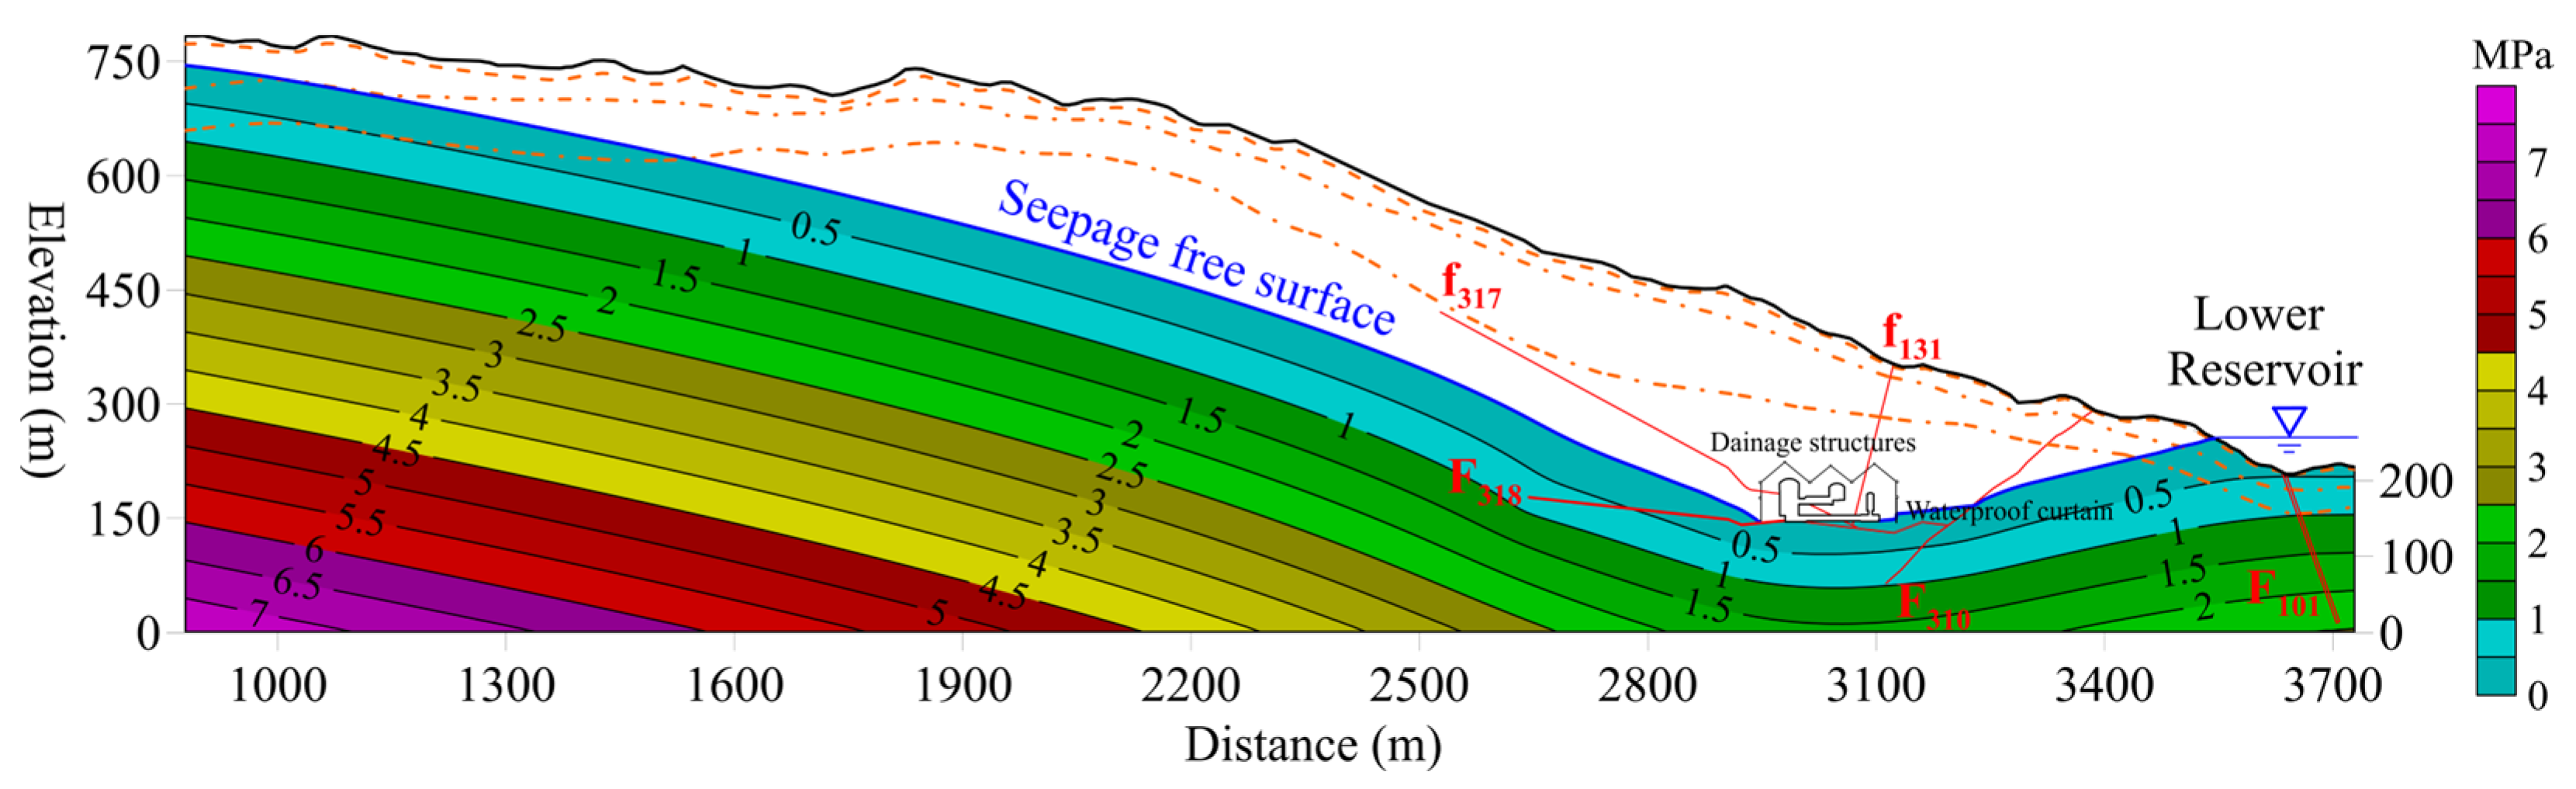
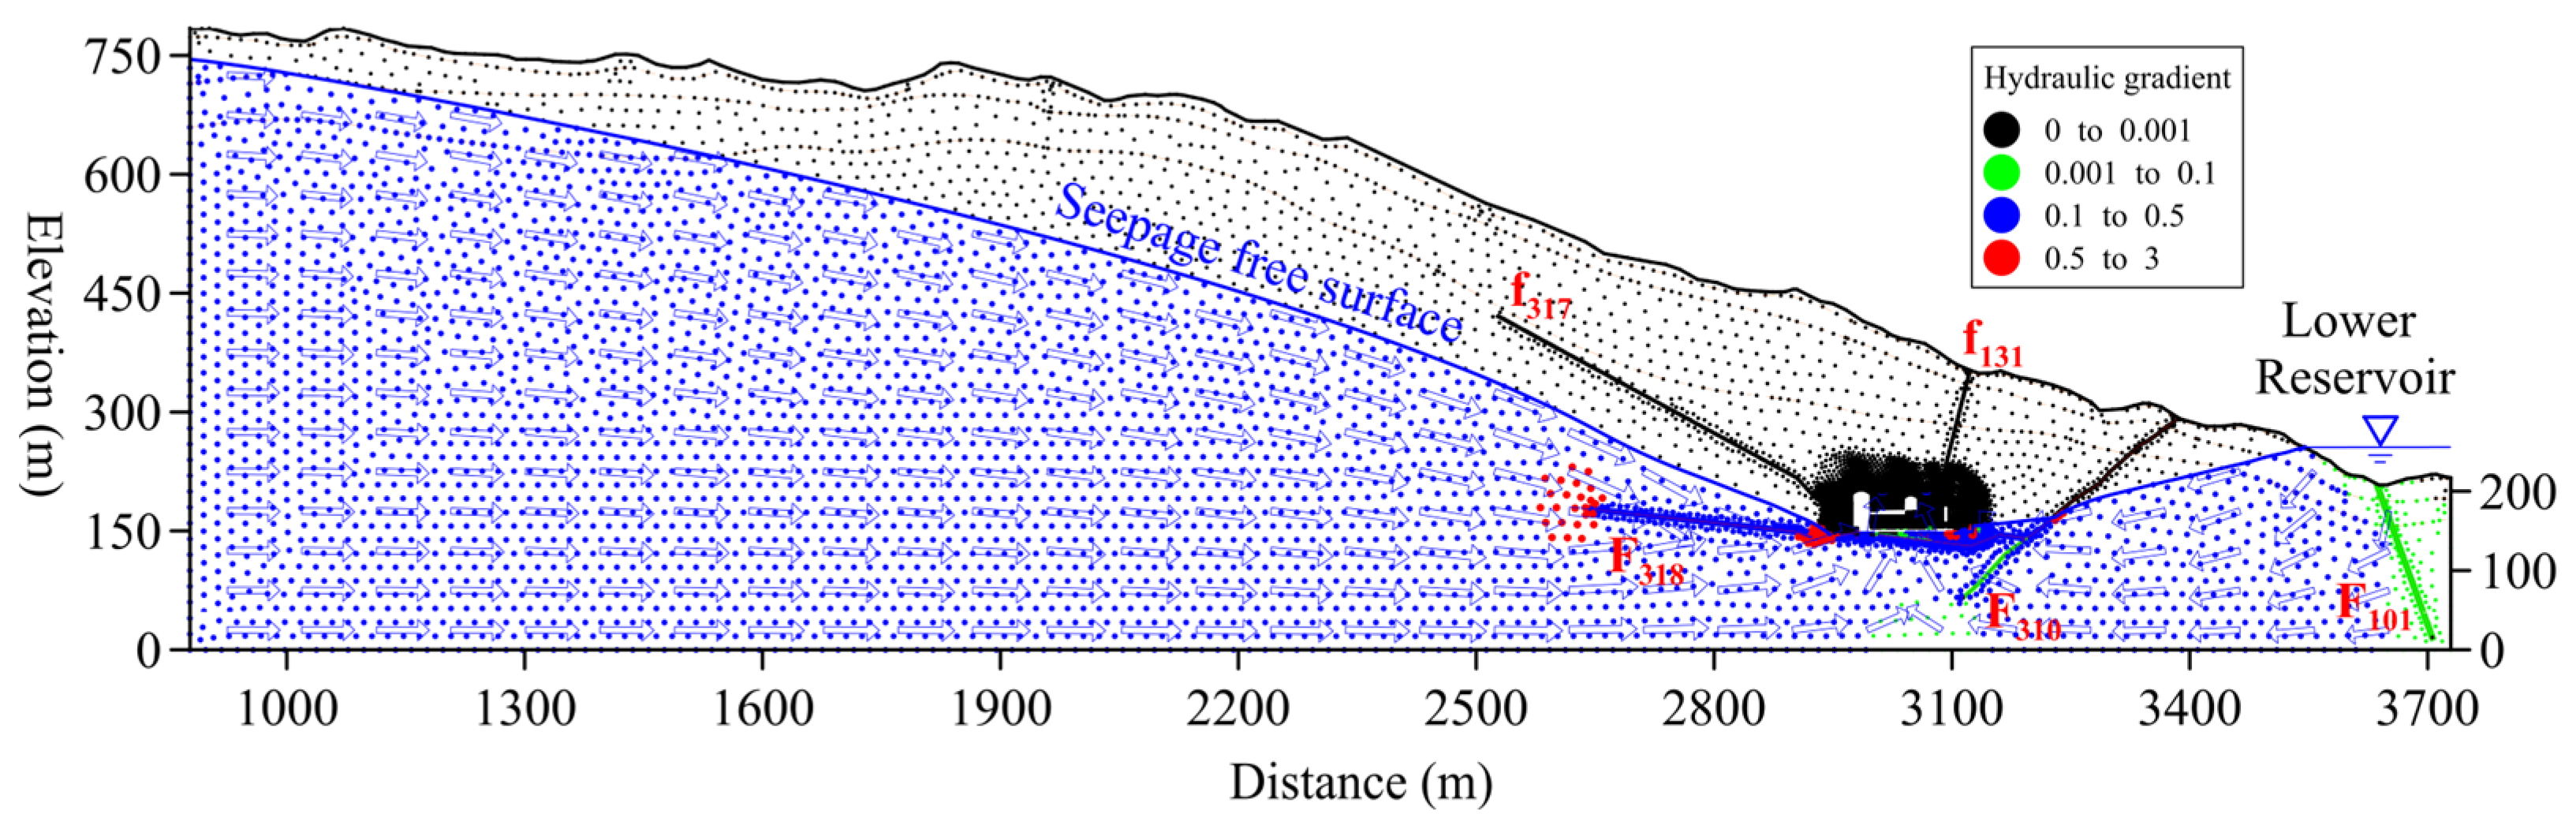
4.3. Water Pressure Redistribution and Hydraulic Gradient

Figure 12 and Figure 13 illustrate the water pressure distribution and hydraulic gradient of the underground powerhouse in numerical Case 2, respectively. Notably, the drainage holes and tunnels significantly reduce the pore water pressure in the vicinity of the underground powerhouse. The hydraulic gradient surrounding the waterproof curtain and faults (F318, f317) ranges from 0.5 to 3 due to the high relative permeability. The highly pervious faults intersecting the underground caverns provide a path for relatively high-head water, triggering large water inflow into the opening due to a high hydraulic gradient. This behavior corresponds well with field observations in the Jiayan Water Diversion Project (JWDP) tunnel, which was flooded through highly pervious features [45]. Therefore, it is necessary to take some relevant measures to prevent water inrush accidents in fault zones.

5. Conclusions

The evaluation of groundwater inflow and associated drainage effects during the construction of hydraulic projects is of great concern. In this study, a comparative study on the estimation of groundwater inflow into the underground powerhouse of the JPSPS was proposed by using three kinds of methods (i.e., analytical, empirical, and numerical methods). Furthermore, the drainage effects, including water table drawdown, water pressure redistribution, and hydraulic gradient were evaluated. The main conclusions that can be drawn from this study are as follows:
(1)
The analytical methods considering a stable water table may mostly overestimate the water inflow rates of the underground powerhouse, with an approximate value of 3000 m3/d. Conversely, the analytical results considering the drainage effect show a decent fit with the numerical solution in the excavation condition. Based on the refined numerical simulation of seepage control measures in the operation condition, the water inflow rate is significantly reduced to 104.47 m3/d. Using the SGR method, the underground powerhouse is in “Low Risk” class, with a SGR coefficient of 292.86.
(2)
The seepage-free surface intersects precisely on the boundaries of the main and auxiliary powerhouse and tailrace gate chamber, which indicates that the groundwater above these cavern roofs is completely drained. The drainage structures combined with waterproof curtain can reduce the water inflow rates, but cause an increase in the water table drawdown and depression cone. A comparison between analytical and numerical methods and monitoring data of water table drawdown can not only highlight the drainage effect but also show the complexity of the study site.
(3)
The underground caverns associated with drainage structures significantly change the pore water pressure distribution and hydraulic gradient. The seepage control measures including drainage holes and tunnels and waterproof curtain prevent groundwater from entering caverns, resulting in a decrease in hydraulic head and water pressure. However, the high relative permeability brings an increase in the inflow rates and hydraulic gradient within the faults (F318, f317). Hence, it is necessary to pay attention to the water inrush in faults during excavation.
(4)
Although the capabilities of various methods for tunnel inflow have been effectively identified and the drainage effects caused by cavern excavation have been comprehensively evaluated, the framework proposed in this study has some limitations, especially with homogeneous isotropic media, 2D numerical modeling, steady-state Dracy flow, and simplifying assumptions of analytical formulas. Therefore, the future research advances are necessary to focus on the interactive effects of heterogeneous anisotropy of fractured rock, faults, and seepage control measures on tunnel drainage using a three-dimensional transient numerical simulation.

Author Contributions

Conceptualization, J.W. (Jian Wu) and Z.Z.; methodology, J.W. (Jian Wu); software, Z.Z.; validation, J.W. (Jian Wu) and Z.Z.; formal analysis, J.W. (Jian Wu) and Z.Z.; investigation, J.W. (Jian Wu); resources, Z.Z.; writing—original draft preparation, J.W. (Jian Wu); writing—review and editing, J.W. (Jinguo Wang) and H.W.; visualization, J.W. (Jian Wu); supervision, J.W. (Jinguo Wang); project administration, H.W. and B.C.; funding acquisition, J.W. (Jian Wu). All authors have read and agreed to the published version of the manuscript.

Funding

This research was funded by the Postdoctoral Fund Project of Shanghai Investigation, Design & Research Institute Co., Ltd. (SIDRI), grant number 2024JC(831)-001, and the National Natural Science Foundation of China, grant number 91747204.

Data Availability Statement

The raw data supporting the conclusions of this article will be made available by the authors on request.

Conflicts of Interest

Authors Jian Wu, Hao Wang and Bo Chen was employed by the company Shanghai Investigation, Design & Research Institute Co., Ltd. The remaining authors declare that the research was conducted in the absence of any commercial or financial relationships that could be construed as a potential conflict of interest.

References

  1. Kong, Y.; Kong, Z.; Liu, Z.; Wei, C.; Zhang, J.; An, G. Pumped Storage Power Stations in China: The Past, the Present, and the Future. Renew. Sustain. Energy Rev. 2017, 71, 720–731. [Google Scholar] [CrossRef]
  2. Mahmoodzadeh, A.; Ghafourian, H.; Mohammed, A.H.; Rezaei, N.; Ibrahim, H.H.; Rashidi, S. Predicting Tunnel Water Inflow Using a Machine Learning-Based Solution to Improve Tunnel Construction Safety. Transp. Geotech. 2023, 40, 100978. [Google Scholar] [CrossRef]
  3. Wu, J.; Zhifang, Z.; Chao, Z. A Combined Analytical-Numerical Method for Groundwater Inflow into Circular Tunnels in Drained Conditions. Hydrogeol. J. 2021, 29, 2529–2543. [Google Scholar] [CrossRef]
  4. Gokdemir, C.; Rui, Y.; Rubin, Y.; Li, X. A Framework for Assessing Tunnel Drainage-Induced Impact on Terrestrial Vegetation. Tunn. Undergr. Sp. Technol. 2023, 132, 104917. [Google Scholar] [CrossRef]
  5. Li, S.; Gao, C.; Zhou, Z.; Li, L.; Wang, M.; Yuan, Y.; Wang, J. Analysis on the Precursor Information of Water Inrush in Karst Tunnels: A True Triaxial Model Test Study. Rock Mech. Rock Eng. 2019, 52, 373–384. [Google Scholar] [CrossRef]
  6. Hamidi, J.K.; Shahriar, K.; Rezai, B.; Rostami, J.; Bejari, H. Risk Assessment Based Selection of Rock TBM for Adverse Geological Conditions Using Fuzzy-AHP. Bull. Eng. Geol. Environ. 2010, 69, 523–532. [Google Scholar] [CrossRef]
  7. Zhou, Z.; Zhou, Z.; Xu, H.; Li, M. The Hydrochemical and Isotopic Evolution of the Surface Water and Groundwater for Impoundment in the Xiluodu Reservoir, Jinsha River, China. Sustainability 2020, 12, 5805. [Google Scholar] [CrossRef]
  8. Lei, S. An Analytical Solution for Steady Flow into a Ttonnel. Ground Water 1999, 37, 23–26. [Google Scholar] [CrossRef]
  9. Goodman, R.E.; Moye, D.G.; Schalkwyk, A.; Javandel, I. Groundwater Inflow during Tunnel Driving. Eng. Geol. 1965, 2, 39–56. [Google Scholar]
  10. Karlsrud, K. Water Control When Tunneling under Urban Areas in the Olso Region. NFF Publ. 2001, 12, 27–33. [Google Scholar]
  11. Hwang, J.; Lu, C. A Semi-Analytical Method for Analyzing the Tunnel Water Inflow. Tunn. Undergr. Sp. Technol. 2007, 22, 39–46. [Google Scholar] [CrossRef]
  12. Shen, H.; Huang, Y.; Tang, Y.; Qiu, H.; Wang, P. Impact Analysis of Karst Reservoir Construction on the Surrounding Environment: A Case Study for the Southwest of China. Water 2019, 11, 2327. [Google Scholar] [CrossRef]
  13. Verruijt, A.; Booker, J.R. Complex Variable Analysis of Mindlin’s Tunnel Problem. In Proceedings of the Developments in Theoretical Geomechanics: Proceedings of the Booker Memorial Symposium, Sydney, Australia, 16–17 November 2000; pp. 1–20. [Google Scholar]
  14. Zhang, Y.; Zhang, D.; Fang, Q.; Xiong, L.; Yu, L.; Zhou, M. Analytical Solutions of Non-Darcy Seepage of Grouted Subsea Tunnels. Tunn. Undergr. Sp. Technol. 2020, 96, 103182. [Google Scholar] [CrossRef]
  15. Huangfu, M.; Wang, M.S.; Tan, Z.S.; Wang, X.Y. Analytical Solutions for Steady Seepage into an Underwater Circular Tunnel. Tunn. Undergr. Sp. Technol. 2010, 25, 391–396. [Google Scholar] [CrossRef]
  16. Aalianvari, H.K. Development of a New Method for Tunnel Site Rating from Groundwater Hasard Point of View. J. Appl. Sci. 2009, 9, 1496–1502. [Google Scholar]
  17. Zarei, H.R.; Uromeihy, A.; Sharifzadeh, M. A New Tunnel Inflow Classification (TIC) System through Sedimentary Rock Masses. Tunn. Undergr. Sp. Technol. 2013, 34, 1–12. [Google Scholar] [CrossRef]
  18. Rasouli Maleki, M. Groundwater Seepage Rate (GSR); a New Method for Prediction of Groundwater Inflow into Jointed Rock Tunnels. Tunn. Undergr. Sp. Technol. 2018, 71, 505–517. [Google Scholar] [CrossRef]
  19. Nikvar Hassani, A.; Farhadian, H.; Katibeh, H. A Comparative Study on Evaluation of Steady-State Groundwater Inflow into a Circular Shallow Tunnel. Tunn. Undergr. Sp. Technol. 2018, 73, 15–25. [Google Scholar] [CrossRef]
  20. Mojiri-Khozani, A.; Nassery, H.R.; Nikpeyman, Y.; Abedian, H. Assessing the Impact of Koohrang III Tunnel on the Hydrogeological Settings Using Stable Isotopes and Hydrochemical Methods. Bull. Eng. Geol. Environ. 2023, 82, 219. [Google Scholar] [CrossRef]
  21. Abedian, H.; Karami, G.H.; Karimi, H. The Effect of Scale on the Water Leakage from the Reservoir and Abutment of Beheshtabad Dam. Bull. Eng. Geol. Environ. 2019, 78, 5569–5581. [Google Scholar] [CrossRef]
  22. Tran, T.; Tapas, M.R.; Do, S.K.; Etheridge, R. Investigating the Impacts of Climate Change on Hydroclimatic Extremes in the Tar-Pamlico River Basin, North Carolina. J. Environ. Manage. 2024, 363, 121375. [Google Scholar] [CrossRef] [PubMed]
  23. Tran, T.; Nguyen, B.Q. The Role of Reservoirs under the Impacts of Climate Change on the Srepok River Basin, Central Highlands of Vietnam. Front. Environ. Sci. 2023, 11, 1304845. [Google Scholar] [CrossRef]
  24. Tapas, M.R.; Etheridge, R.; Tran, T.; Finlay, C.G.; Peralta, A.L.; Bell, N.; Xu, Y.; Lakshmi, V. A Methodological Framework for Assessing Sea Level Rise Impacts on Nitrate Loading in Coastal Agricultural Watersheds Using SWAT+: A Case Study of the Tar-Pamlico River Basin, North Carolina, USA. Sci. Total Environ. 2024, 951, 175523. [Google Scholar] [CrossRef]
  25. Desai, C.S.; Li, G.C. A Residual Flow Procedure and Application for Free Surface Flow in Porous Media. Adv. Water Resour. Res. 1983, 6, 27–35. [Google Scholar] [CrossRef]
  26. Zhang, Y.; Chen, P.; Wang, L. Initial Flow Method for Seepage Analysis with Free Surface. Chinese J. Hydraul. Eng. 1988, 8, 18–26. [Google Scholar]
  27. Bathe, K.J.; Khoshgoftaar, M.R. Finite Element Free Surface Seepage Analysis without Mesh Iteration. Int. J. Numer. Anal. Methods Geomech. 1979, 3, 13–22. [Google Scholar] [CrossRef]
  28. Kikuchi, N. Seepage Flow Problems by Variational Inequalities: Theory and Approximation. Int. J. Numer. Anal. Methods Geomech. 1977, 1, 283–297. [Google Scholar] [CrossRef]
  29. Zheng, H.; Liu, D.F.; Lee, C.F.; Tham, L.G. A New Formulation of Signorini’s Type for Seepage Problems with Free Surfaces. Int. J. Numer. Methods Eng. 2005, 64, 1–16. [Google Scholar] [CrossRef]
  30. Tang, F.; Yang, J.; Li, H.N.; Liu, F.; Wang, N.; Jia, P.; Chen, Y. Field Validation of a Magnetic Sensor to Monitor Borehole Deviation during Tunnel Excavation. Materials 2018, 11, 1511. [Google Scholar] [CrossRef]
  31. El Tani, M. Circular Tunnel in a Semi-Infinite Aquifer. Tunn. Undergr. Sp. Technol. 2002, 18, 49–55. [Google Scholar] [CrossRef]
  32. Fernandez, G.; Moon, J. Excavation-Induced Hydraulic Conductivity Reduction around a Tunnel–Part 2: Verification of Proposed Method Using Numerical Modeling. Tunn. Undergr. Sp. Technol. 2010, 25, 567–574. [Google Scholar] [CrossRef]
  33. Su, K.; Zhou, Y.; Wu, H.; Shi, C.; Zhou, L. An Analytical Method for Groundwater Inflow into a Drained Circular Tunnel. Groundwater 2017, 55, 712–721. [Google Scholar] [CrossRef]
  34. El, M.; Abbas, T.; Mohamed, K.; Gholami, A. Analytic Assessment of the Water Table Drawdown, Seepage, and Back Pressure at Rudbar PSPP. Rock Mech. Rock Eng. 2019, 52, 2227–2243. [Google Scholar]
  35. NB/T 10073-2018; Specification for Engineering Geological Investigation of Pumped Storage Power Stations. National Energy Administration of the People’s Republic of China: Beijing, China, 2018; pp. 1–74.
  36. Chen, Y.; Zhou, C.; Zheng, H. A Numerical Solution to Seepage Problems with Complex Drainage Systems. Comput. Geotech. 2008, 35, 383–393. [Google Scholar] [CrossRef]
  37. Dai, Y.; Zhou, Z. Steady Seepage Simulation of Underground Oil Storage Caverns Based on Signorini Type Variational Inequality Formulation. Geosci. J. 2015, 19, 341–355. [Google Scholar] [CrossRef]
  38. Li, Y.; Chen, Y.; Jiang, Q.; Hu, R.; Zhou, C. Performance Assessment and Optimization of Seepage Control System: A Numerical Case Study for Kala Underground Powerhouse. Comput. Geotech. 2014, 55, 306–315. [Google Scholar] [CrossRef]
  39. Zhuang, C.; Zhou, Z.; Illman, W.A.; Wang, J. Geostatistical Inverse Modeling for the Characterization of Aquitard Heterogeneity Using Long-Term Multi-Extensometer Data. J. Hydrol. 2019, 578, 124024. [Google Scholar] [CrossRef]
  40. Luo, M.; Chen, J.; Jakada, H.; Li, N.; Guo, X.; Zhou, H. Identifying and Predicting Karst Water Inrush in a Deep Tunnel, South China. Eng. Geol. 2022, 305, 106716. [Google Scholar] [CrossRef]
  41. Mar, J.; Lanini, S.; Aunay, B.; Perrochet, P. Analytical Solution for Modeling Discharge into a Tunnel Drilled in a Heterogeneous Unconfined Aquifer. Groundwater 2014, 52, 597–605. [Google Scholar]
  42. Zhang, D.M.; Xie, X.C.; Zhou, M.L.; Huang, Z.K.; Zhang, D.M. An Incident of Water and Soil Gushing in a Metro Tunnel Due to High Water Pressure in Sandy Silt. Eng. Fail. Anal. 2021, 121, 105196. [Google Scholar] [CrossRef]
  43. Lv, Y.; Jiang, Y.; Hu, W.; Cao, M.; Mao, Y. A Review of the Effects of Tunnel Excavation on the Hydrology, Ecology, and Environment in Karst Areas: Current Status, Challenges, and Perspectives. J. Hydrol. 2020, 586, 124891. [Google Scholar] [CrossRef]
  44. Su, K.; Zhang, Y.J.; Chang, Z.H.; Wu, H.G.; Wang, T.; Zhou, W. Transverse Extent of Numerical Model for Deep Buried Tunnel Excavation. Tunn. Undergr. Sp. Technol. 2019, 84, 373–380. [Google Scholar] [CrossRef]
  45. Chen, Y.F.; Liao, Z.; Zhou, J.Q.; Hu, R.; Yang, Z.; Zhao, X.J.; Wu, X.L.; Yang, X.L. Non-Darcian Flow Effect on Discharge into a Tunnel in Karst Aquifers. Int. J. Rock Mech. Min. Sci. 2020, 130, 104319. [Google Scholar] [CrossRef]
Figure 1. Schematic diagram of Jinzhai pumped storage power station: (a) geological map and (b) location.
Applsci 14 09123 g001
Figure 2. Geological cross section along the diversion tunnel #1 alignment.
Applsci 14 09123 g002
Figure 3. Stereographic plot of faults and joints around the underground powerhouse. The red line represents the fault, and the black line represents the joint. The bule breakpoint line represents the axis of the underground powerhouse. The number represents the group number of the joints.
Applsci 14 09123 g003
Figure 4. Groundwater fluctuation during the construction: (a) monitoring boreholes around the underground powerhouse and (b) monitoring boreholes along with the upper reservoir and diversion tunnels.
Applsci 14 09123 g004
Figure 5. Measured hydraulic conductivity with Lugeon tests (707 tests): (a) frequency distribution of Lugeon values and (b) relationship between Lugeon values and depth.
Applsci 14 09123 g005
Figure 6. Circular tunnel with stable water table: Q, groundwater inflow; l, the depth from the ground surface; h, water head; H, the thickness of the aquifer; r, tunnel radius; K, permeability of rock mass.
Applsci 14 09123 g006
Figure 7. Circular tunnel with lowered water table in drained conditions.
Applsci 14 09123 g007
Figure 8. Two-dimensional finite-element model of underground powerhouse along the diversion tunnel #1 alignment considering different weathered zones and structures.
Applsci 14 09123 g008
Figure 9. Water inflow rates of underground powerhouse calculated by various methods [3,8,9,10,31,33,34].
Applsci 14 09123 g009
Figure 10. Water head distributions of underground powerhouse in various working conditions: (a) Case 1, (b) Case 2, (c) Case 3, and (d) Case 4.
Applsci 14 09123 g010
Figure 11. Comparison between various methods and monitoring data of water table drawdown [3,34].
Applsci 14 09123 g011
Figure 12. Water pressure distribution around the underground powerhouse in numerical Case 2.
Applsci 14 09123 g012
Figure 13. Hydraulic gradient of seepage field in numerical Case 2, and the blue arrow represents the groundwater flow direction.
Applsci 14 09123 g013
Table 1. SGR for groundwater inflow into tunnels.
SGRTunnel RatingClassProbable Conditions for Groundwater Inflow into Tunnel (L/s/m)
0–100No riskI0–0.04
100–300Low riskII0.04–0.1
300–500Moderate riskIII0.1–0.16
500–700RiskyIV0.16–0.28
700–1000High riskVQ > 0.28, inflow of groundwater and mud from crashed zones is probable
1000<CriticalVIInflow of groundwater and mud is highly probable
Table 2. Model parameters used in the numerical study.
Model
Parameters
FormationsFaultsWaterproof
Curtain
CW RockSW RockWW RockLW RockF318F310f317 f131F101
Permeability K (m/d)4.97 × 10−21.42 × 10−28.36 × 10−37.41 × 10−31.01.00.10.10.18.64 × 10−5
Thickness d (m)0~17.36.5~58.822.5~109.9156.4~668.90.71.00.50.54.01.0
Specific yield μ0.10.020.010.0010.050.050.010.010.050.0001
Note: CW = completely weathered, SW = strong weathered, WW = weakly weathered, LW = lightly weathered.
Table 3. Summary of the model design for four synthetic cases.
No.Water Head (m)Seepage Control StructuresWorking Conditions
Left BoundaryRight BoundaryDrainage HolesDrainage TunnelsWaterproof Curtain
Case 1745210NoneNoneNoneExcavation condition
Case 2745255EffectiveEffectiveEffectiveOperation condition
Case 3745255FailureFailureEffectiveRisk condition
Case 4745255FailureFailureFailureRisk condition
Note: “Failure” means that the anti-seepage function of structures has failed in risk conditions, whereas “Effective” means that the anti-seepage function of structures remains normal in operation conditions.
Table 4. Selected parameters in the analytical formulas for calculating water inflow rates.
Underground PowerhouseK (m/d)h (m)H (m)r (m)L (m)d (m)R (m)
Main and auxiliary powerhouse0.016211.46378.1921.23176.3651602.67
Main transformed cavern0.016186.96360.6111.47168.0500.1588.50
Tailrace gate chamber0.016186.95347.617.47111.0455.1577.79
Table 5. Water inflow rates and drawdown of underground powerhouse calculated using different analytical methods.
Underground PowerhouseWater Inflow Rates Q (m3/d)Drawdown s (m)
Q Goodman Q Lei Q Karlsrud Q EI   Tani Q Su Q EI   Tani Q Wu Q Big   well s EI   Tani s Wu s Big   well
Main and auxiliary powerhouse1252.721253.781274.661247.441233.97325.99330.07288.82186.50203.10122
Main transformed cavern906.24906.48914.41904.77786.50308.06480.03230.39146.31175.08122
Tailrace gate chamber533.15533.20535.91532.77454.85217.23348.19189.90146.79151.23122
Total2692.102693.462724.982684.992475.32851.281158.30709.11186.50203.10122
Table 6. Calculated SGR for underground powerhouse.
Underground Powerhouseh
(m)
λi
(1/m)
ei
(m)
CZW (m)S1S2S3S4S5S6S7SGRTunnel Rating
Main and auxiliary powerhouse211.461.980.0050.441.0321.280039.501.0170.27Low risk
Main transformed cavern186.961.110.00300.21200035.741.078.99No risk
Tailrace gate chamber186.951.180.00300.22100035.741.043.60No risk
Total///////////292.86Low risk
Note: h = water head, λi = joint frequency, ei = mean hydraulic joint aperture, CZW = crashed zone width, and the meaning of other parameters can be seen in Equation (13).
Table 7. Numerical results of four synthetic cases in various working conditions.
No.Water Inflow into Underground Powerhouse Q (m3/d/m)Water Inflow into Drainage Structures (m3/d/m)Drawdown
s (m)
Main and Auxiliary PowerhouseMain Transformed CavernTailrace Gate ChamberTotalDrainage Holes Drainage TunnelsTotal
Case 1753.150474.701227.85NoneNoneNone231.8
Case 260.48043.99104.47875.551035.681911.23234.3
Case 3820.470607.691428.16NoneNoneNone231.8
Case 4830.230689.561519.79NoneNoneNone231.8
Disclaimer/Publisher’s Note: The statements, opinions and data contained in all publications are solely those of the individual author(s) and contributor(s) and not of MDPI and/or the editor(s). MDPI and/or the editor(s) disclaim responsibility for any injury to people or property resulting from any ideas, methods, instructions or products referred to in the content.

