Featured Application
Our results demonstrate the easy and accurate control of the amount of active ingredient relative to its degradation product in waste water treatment materials containing ferrate(VI).
Abstract
Potassium ferrate(VI) (K2FeO4) as a particularly strong oxidant represents an effective and environmentally friendly waste water treatment material. When produced by anodic oxidation in highly alkaline aqueous solution, the K2FeO4 product is separated and sealed in inert plastic bags with the retention of some liquid phase with high pH. This method proved to be excellent for long-term storage at moderately low temperature (5 °C) for industrial applications. It is still imperative to check the ferrate(VI) content of the product whenever it is to be used. Fe-57 Mössbauer spectroscopy is an excellent tool for checking the ratio of ferrate(VI) to the degradation product iron(III) in a sample. For this purpose, normally the spectral areas of the corresponding subspectra are considered; however, this approximation neglects the possible differences in the corresponding Mössbauer–Lamb factors. In this work, we have successfully determined the Mössbauer–Lamb factors for the ferrate(VI) and for the most common iron(III) degradation products observed. We have found superparamagnetic behavior and low-temperature phase transformation for another iron(III) degradation product that made the determination of the Mössbauer–Lamb factors impossible in that case. The identities of a total of three different iron(III) degradation products have been confirmed.
1. Introduction
The hexavalent iron is a rather uncommon chemical state of iron; its discovery dates back to the 19th century. Its practical application has come into focus only in the last few decades, where environmental problems have made clear the necessity of the treatment of some industrial waste waters containing very stable pharmaceutical products, including some antibiotics and pain relievers, that can accumulate in natural waters. The degradation of such molecules is possible only with very aggressive chemical reactants like the strong oxidant ferrate(VI) [1,2,3,4,5,6,7,8]. Ferrate(VI) can also be used to remove the very stable cianide or even metal contaminants from waste water [9,10,11,12,13].
Several literature sources are available about ferrate technology [14,15]. Ferrate(VI) is available mostly in the form of K2FeO4. The synthesis route to produce this dark purple compound—being thermodynamically stable but sensitive to humidity and carbon dioxide in air—involves three different procedures.
It is possible to reach the oxidation state (VI) of iron by reaction with hypochlorite in highly alkaline aqueous solution (wet method). This synthesis requires chlorine gas to start with which, from the environmental point of view, is not preferred. The hypochlorite forms in the reaction of water and chlorine. The final reaction is summarized by Equation (1).
2Fe(OH)3 + 3ClO− + 4OH− = 2FeO42− + 3Cl− + 5H2O
This is normally conducted in concentrated KOH solution at controlled temperature (<30 °C), and to obtain a dry and stable final product, several steps, including washing with benzene, n-hexane, isopropanol, and diethyl ether, are needed. The dry product is reported to be found stable over a one-year period [15].
Solid-state synthesis of potassium ferrate is possible by reacting potassium superoxide and iron oxide powder. An alternative route is the reaction of iron salts with some oxidizing chlorine-containing solid in highly alkaline potash (K2CO3) [16]. Separation of pure and stable ferrate from such reaction mixtures with good yield is not simple. This is not optimal for industrial applications.
The electrochemical synthesis route of K2FeO4 is an attractive method regarding industrial production and environmental issues. For the latter one, it is crucial that there is no need to use chlorine gas in this technology. For industry, the practically one-step synthesis (not counting a simple conversion from Na-ferrate(VI) to K-ferrate(VI)) is a great advantage. In addition, from the pure (chlorine-free) ferrate, the coagulated Fe(OH)3 is the only, and a non-harmful, product of the oxidation treatment, serving as an adsorbent removing more pollutants from waste water.
The stability of potassium ferrate(VI) is important for industrial production since storage from production to selling is a straightforward necessity. The product should have long-term stability, i.e., not suffer substantial decomposition over several months. We have studied the stability of electrochemically produced potassium ferrate(VI) in our recent work using Mössbauer spectroscopy [17].
Mössbauer spectroscopy is an excellent technique for such a study since iron(VI) and the degradation product iron(III) give well-separated spectral contributions in the Mössbauer spectra. The tetraoxoferrate anion, itself as a particularly special iron species, was thoroughly investigated with several other spectroscopic methods in addition to Mössbauer spectroscopy [18]. The chemistry of other oxidation states of iron over FeIII was also studied using various methods [19,20,21,22]. Mössbauer spectroscopy was successfully used to detect these exceptional valence states of iron such as iron(IV) and iron(V) [23,24] and even up to iron(VIII) [25].
The transformation/degradation of ferrate(VI) as an effect of exposition to humid air, CO2, or some oxidation target has been studied by several groups [26,27,28,29,30,31]. The identity of the iron(III) compound degradation product is not straightforward; it can be a hydroxide, oxyhydroxide, or oxide, sometimes with very close Mössbauer parameters [32]. While the final degradation product, a stabilized iron(III) compound, can be investigated easily by several other methods, it may not be simple for some transitional iron species which may arise during electrochemical synthesis.
We found that sealing the wet product prepared by anodic oxidation (with some high pH KOH liquid film on the surface of the potassium ferrate crystals) in a high-density polyethylene (HDPE) bag and keeping it at 5 °C resulted in a long-term stability for more than one year. Room-temperature storage caused substantial degradation in weeks’ time.
In ref. [17], we reported on three different degradation intermediates that appear in the ferrate product either as a side product of the synthesis or as a result of subsequent degradation. Our quantitative analysis of the ferrate content was based on the comparison of the spectral areas representing the iron(VI) and iron(III) contributions. This is an approximation generally used in Mössbauer Spectroscopy and it disregards the possible differences in Mössbauer–Lamb factors that influence the detection efficiency. However, when an accurate analysis is targeted, one has to determine the Mössbauer–Lamb factors for the different phases.
In the case of two phases (A and B), the molar amounts of iron atoms (n) included in the phases are related as shown by Equation (2) if the respective spectral areas are measured and the Mössbauer–Lamb factors (f) are known:
If the phases contain multiple lattice sites, the weighted average of the Mössbauer–Lamb factors for each site in that particular phase and the total spectral area of the phase should be used.
The Mössbauer–Lamb factor may be calculated from a series of Mössbauer spectra recorded at many temperature points (between 85 and 270 K) using the observed temperature dependence of the spectral areas (Mössbauer effect) or the temperature dependence of the line positions (second-order Doppler shift). The calculations are normally based on the Debye model of a solid, which is rigorously valid only for monoatomic and cubic lattices. For more complex systems, the two approximations result in different Debye temperatures (the single parameter to describe lattice vibrations in the Debye model) due to the inherently different distortions from an envisaged accurate value determined from valid (more complex) theory. However, using the same type of calculation (line area or position), comparisons are feasible, especially because the differences in the Mössbauer–Lamb factors are usually small.
In this work, in order to improve the accuracy of the quantitative determination of the ferrate(VI) content in a sample, we attempted to determine the Mössbauer–Lamb factors by the measurements of the Debye temperatures for both the ferrate(VI) and the degradation product iron(III) from the temperature dependence of the spectral areas. The Mössbauer–Lamb factor depends on the Debye temperature (θD), the thermodynamical temperature (T), and the recoil energy (ER) according to the following formula [33]:
For this purpose, we have recorded a series of Mössbauer spectra in the 85–270 K range. The challenge of this study is that it is rather unpredictable which degradation product appears in a particular synthesis. The chances for the successful determination of the various Mössbauer–Lamb factors proved to be different for the different iron(III) products.
2. Materials and Methods
2.1. The Preparation of Alkali Ferrate Samples
Sodium ferrate was produced in a specially designed electrochemical cluster system [34,35,36] containing 6 electrolysis cells connected in series. Maintaining the anode’s temperature at its ideal level in each cell was made possible by the construction of the so-called temperature gradient cell [34]. A Voltcraft PS-1440 PP (Voltcraft, Düsseldorf, Germany) adjustable-voltage DC power supply was used to control the cells. Optimized cell voltage and current values [34] were used (the current was I = 32 A, and the voltage during the electrolysis varied between E = 14.0 V and E = 14.8 V). The electrolyte solution contained 45 m/m% NaOH, and the anode’s temperature was maintained at 34 °C. Each anode (geometric surface area A = 999 cm2) was constructed of white cast iron. The cell measured 5 by 20 by 30 cm.
Spectrophotometry was used to monitor the ferrate(VI) production using a Shimadzu UVmini-1240 UV-Visible Spectrophotometer (Shimadzu Scientific Instruments, Kyoto, Japan). The broad absorption peak of ferrate(VI) was observed at 506 nm [17,37].
Once electrolysis was completed, different concentrations of 50 m/m% KOH were added to the resulting Na2FeO4 solution. The precipitated potassium ferrate could be removed by filtration. Polypropylene filters with a pore size of 0.3 μm were used for pressure filtration at 4.5 bar. In this manner, solid potassium ferrate tablets weighing roughly 3 g were made. Changes in the amount of KOH applied had an impact on the production yield, but the Mössbauer measurements later revealed that the precipitate’s composition remained unchanged.
The solutions and precipitate were maintained at room temperature or lower during these procedures (about 5 °C). The wet potassium ferrate tablets were placed in high-density polyethylene (HDPE) bags and vacuum-sealed together with the polypropylene filter, which was purposefully not allowed to dry completely. The products were kept cold in a refrigerator.
2.2. Mössbauer Measurements
For the Mössbauer measurements, ca. 50 mg of wet K2FeO4 paste was gently pressed between two thin, inert rigid plastic sheets to form an absorber with a surface area of about 1.5 cm2. This absorber was immediately cooled in liquid nitrogen to prevent any decomposition of the ferrate(VI). The Mössbauer spectra were recorded with a Mössbauer spectrometer (Wissel) operated in constant acceleration mode in 512 channels. The velocity range was typically ±4 or ±12 mm/s depending on the observed species. 57Co(Rh) source was applied with an initial activity of 1.85 GBq. Calibration was performed with a standard alpha-iron absorber at room temperature, which is the reference of the isomer shifts.
The low temperature was provided by a tank-type liquid nitrogen cooled cryostat with temperature control of ±0.2 K. The low-temperature runs were conducted typically in the range 85–270 K.
2.3. DSC Measurements
The cryo differential scanning calorimetric (DSC) measurements were performed between −150 and +45 ° C in N2 atmosphere with 10 and 20 °C/min heating rate with the use of a Setaram DSC92 calorimeter and a liquid N2 cryostat (Setaram KEP Technologies, Lyon, France).
3. Results and Discussion
In our previous report [17], we showed the results of a large number (64) of measurements, each belonging to individual electrochemical synthesis batches with some variation in the synthesis conditions. We focused mostly on the purity of the product (i.e., ferrate(VI) content). Clear correlation between the synthesis parameters and the form and quantity of the degradation product iron(III) could not be found.
In this report, we studied further samples from various synthesis runs, now with every sample measured in a wide temperature range. All samples were first measured at the lowest temperature (85–90 K) to see which degradation product had actually formed. Although the duration of the Mössbauer measurements were typically 1–2 days, the low temperature saved the samples from degradation.
The iron(III) forms expected are summarized in Table 1 according to [17].

Table 1.
Mössbauer parameters of iron(III) degradation products found in freshly synthesized potassium ferrate(VI) produced by anodic oxidation of metallic iron, with suggested assignments in [17].
In these “trial and error” synthesis runs, we could confirm the formation of FeIII(1) and FeIII(2) many times. FeIII(3) was not found, but it formed in only 3 cases out of 64 in our previous work [17].
The Mössbauer spectra were first evaluated in a relatively narrow velocity range (as usual) for better velocity resolution. The ferrate(VI) spectral contribution was consequently modeled by a doublet with a small quadrupole splitting Δ = 0.12(1) mm/s. The isomer shift observed at 90 K was −0.83(1) mm/s. It should be noted that despite several reports on a singlet assigned to ferrate(VI) with a single cation (Na, K, Rb, or Cs) [23], our experience showed that noticing the small quadrupole splitting is a question of spectrum quality (statistics); therefore, despite the perfect tetrahedral structure of the FeO42− anion, there is some quadrupole splitting that must originate from the non-cubic lattice contribution in the solid potassium ferrate(VI) that has an orthorhombic unit cell (space group Pnam) [26]. This idea is supported by the reports from Dedushenko et al. [38,39], who synthesized the mixed ferrate(VI) K3Na(FeO4)2, the unit cell of which is hexagonal (space group P/3m1), and found a different quadrupole splitting of Δ = 0.21(1) mm/s.
The assignments of the degradation product iron(III) species are based on Mössbauer data. FeIII(3) must be octahedrally coordinated iron(III) on the basis of its isomer shift. The zero quadrupole splitting and the colorless nature of this compound support a very stable structure, and the extreme high pH where it exists makes it reasonable to assume that it is hexahydroxo-iron(III). The zero quadrupole splitting also suggests that it readily forms as an amorphous phase which most probably crystallizes quickly; therefore, it turns to FeIII(1) with small quadrupole splitting due to lattice contribution. This also explains why it is hard to catch the FeIII(3) species as the synthesis product. The nature of the crystalline form hosting FeIII(1) is not known. This assignment of FeIII(3) is strongly supported by the findings of Kamnev et al. [40,41,42], who reported the same species in highly alkaline electrolytes (15 M NaOH) containing FeIII.
FeIII(2) has Mössbauer parameters somewhat similar to those of lepidocrocite, but we tentatively consider this as an FeIII-oxyhydroxide or hydroxide.
The task to improve the quantitative analysis of an FeVI-FeIII system is therefore to measure the possible differences between the Debye temperatures (Mössbauer–Lamb factors at a particular thermodynamical temperature) of the ferrate(VI) and those of the FeIII(1) and FeIII(2) species.
For such an analysis, the spectral area assigned to the particular species is normalized to the baseline of the spectrum (to account for the different measurement durations) and plotted as a function of temperature. According to Equation (3), a monotonously decreasing (closely linear) function is expected with temperature, probably with some different slopes owing to the assumed different Debye temperatures for ferrate(VI) and the degradation product.
The complexity of the case is illustrated in Figure 1 with some selected spectra, where the simultaneous presence of FeIII(1) and FeIII(2) could be identified (Experiment 1). This was the only case with a noticeable combined presence of two degradation products. The evaluation of the iron(III) spectral contribution was performed with fixed quadrupole splittings for the two doublets, as given in Table 1.

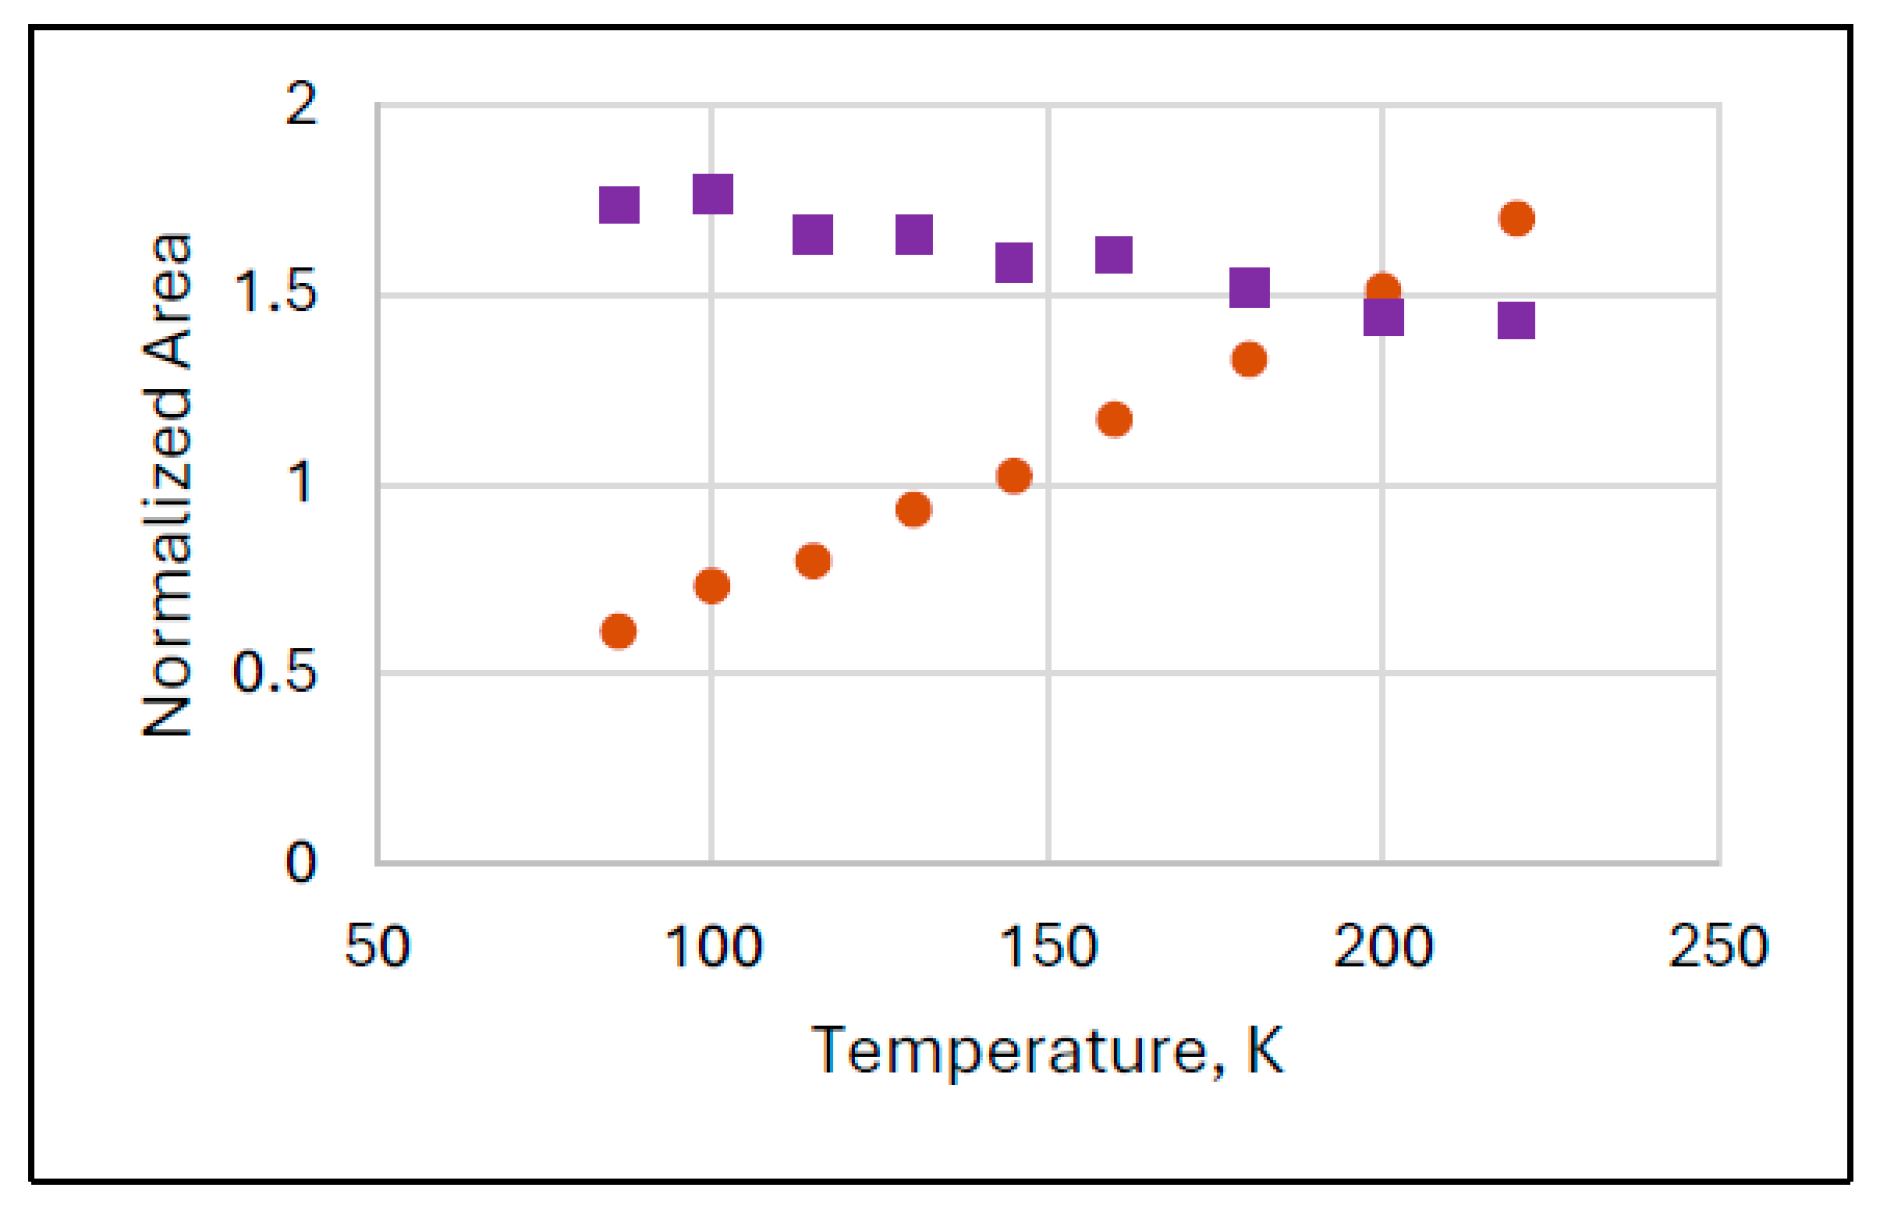
Figure 1.
Temperature variation of the normalized areas for ferrate(VI) (purple squares) and for the combination of the iron(III) degradation products FeIII(1) and FeIII(2) (orange dots) with some sample Mössbauer spectra recorded at the indicated temperatures (Experiment 1).
Despite the two different degradation products, the sum of the areas of the iron(III) components is supposed to show a monotonously decreasing line similarly to that found for the ferrate(VI) spectral area (in all experiments). However, an anomalous dependence was found as shown in Figure 1. The curve of the iron(III) species has a positive slope up to about 140 K; thus, it cannot be fitted with the Debye model.
In other experiments, we focused on cases where solely the FeIII(1) or the FeIII(2) products could be detected. Although FeIII(2) was much less abundant in our electrochemical syntheses, this is the more typical degradation product of potassium ferrate(VI) either by spontaneous degradation in humid air or in contact with CO2, or in reactions where the ferrate is used as an oxidant.
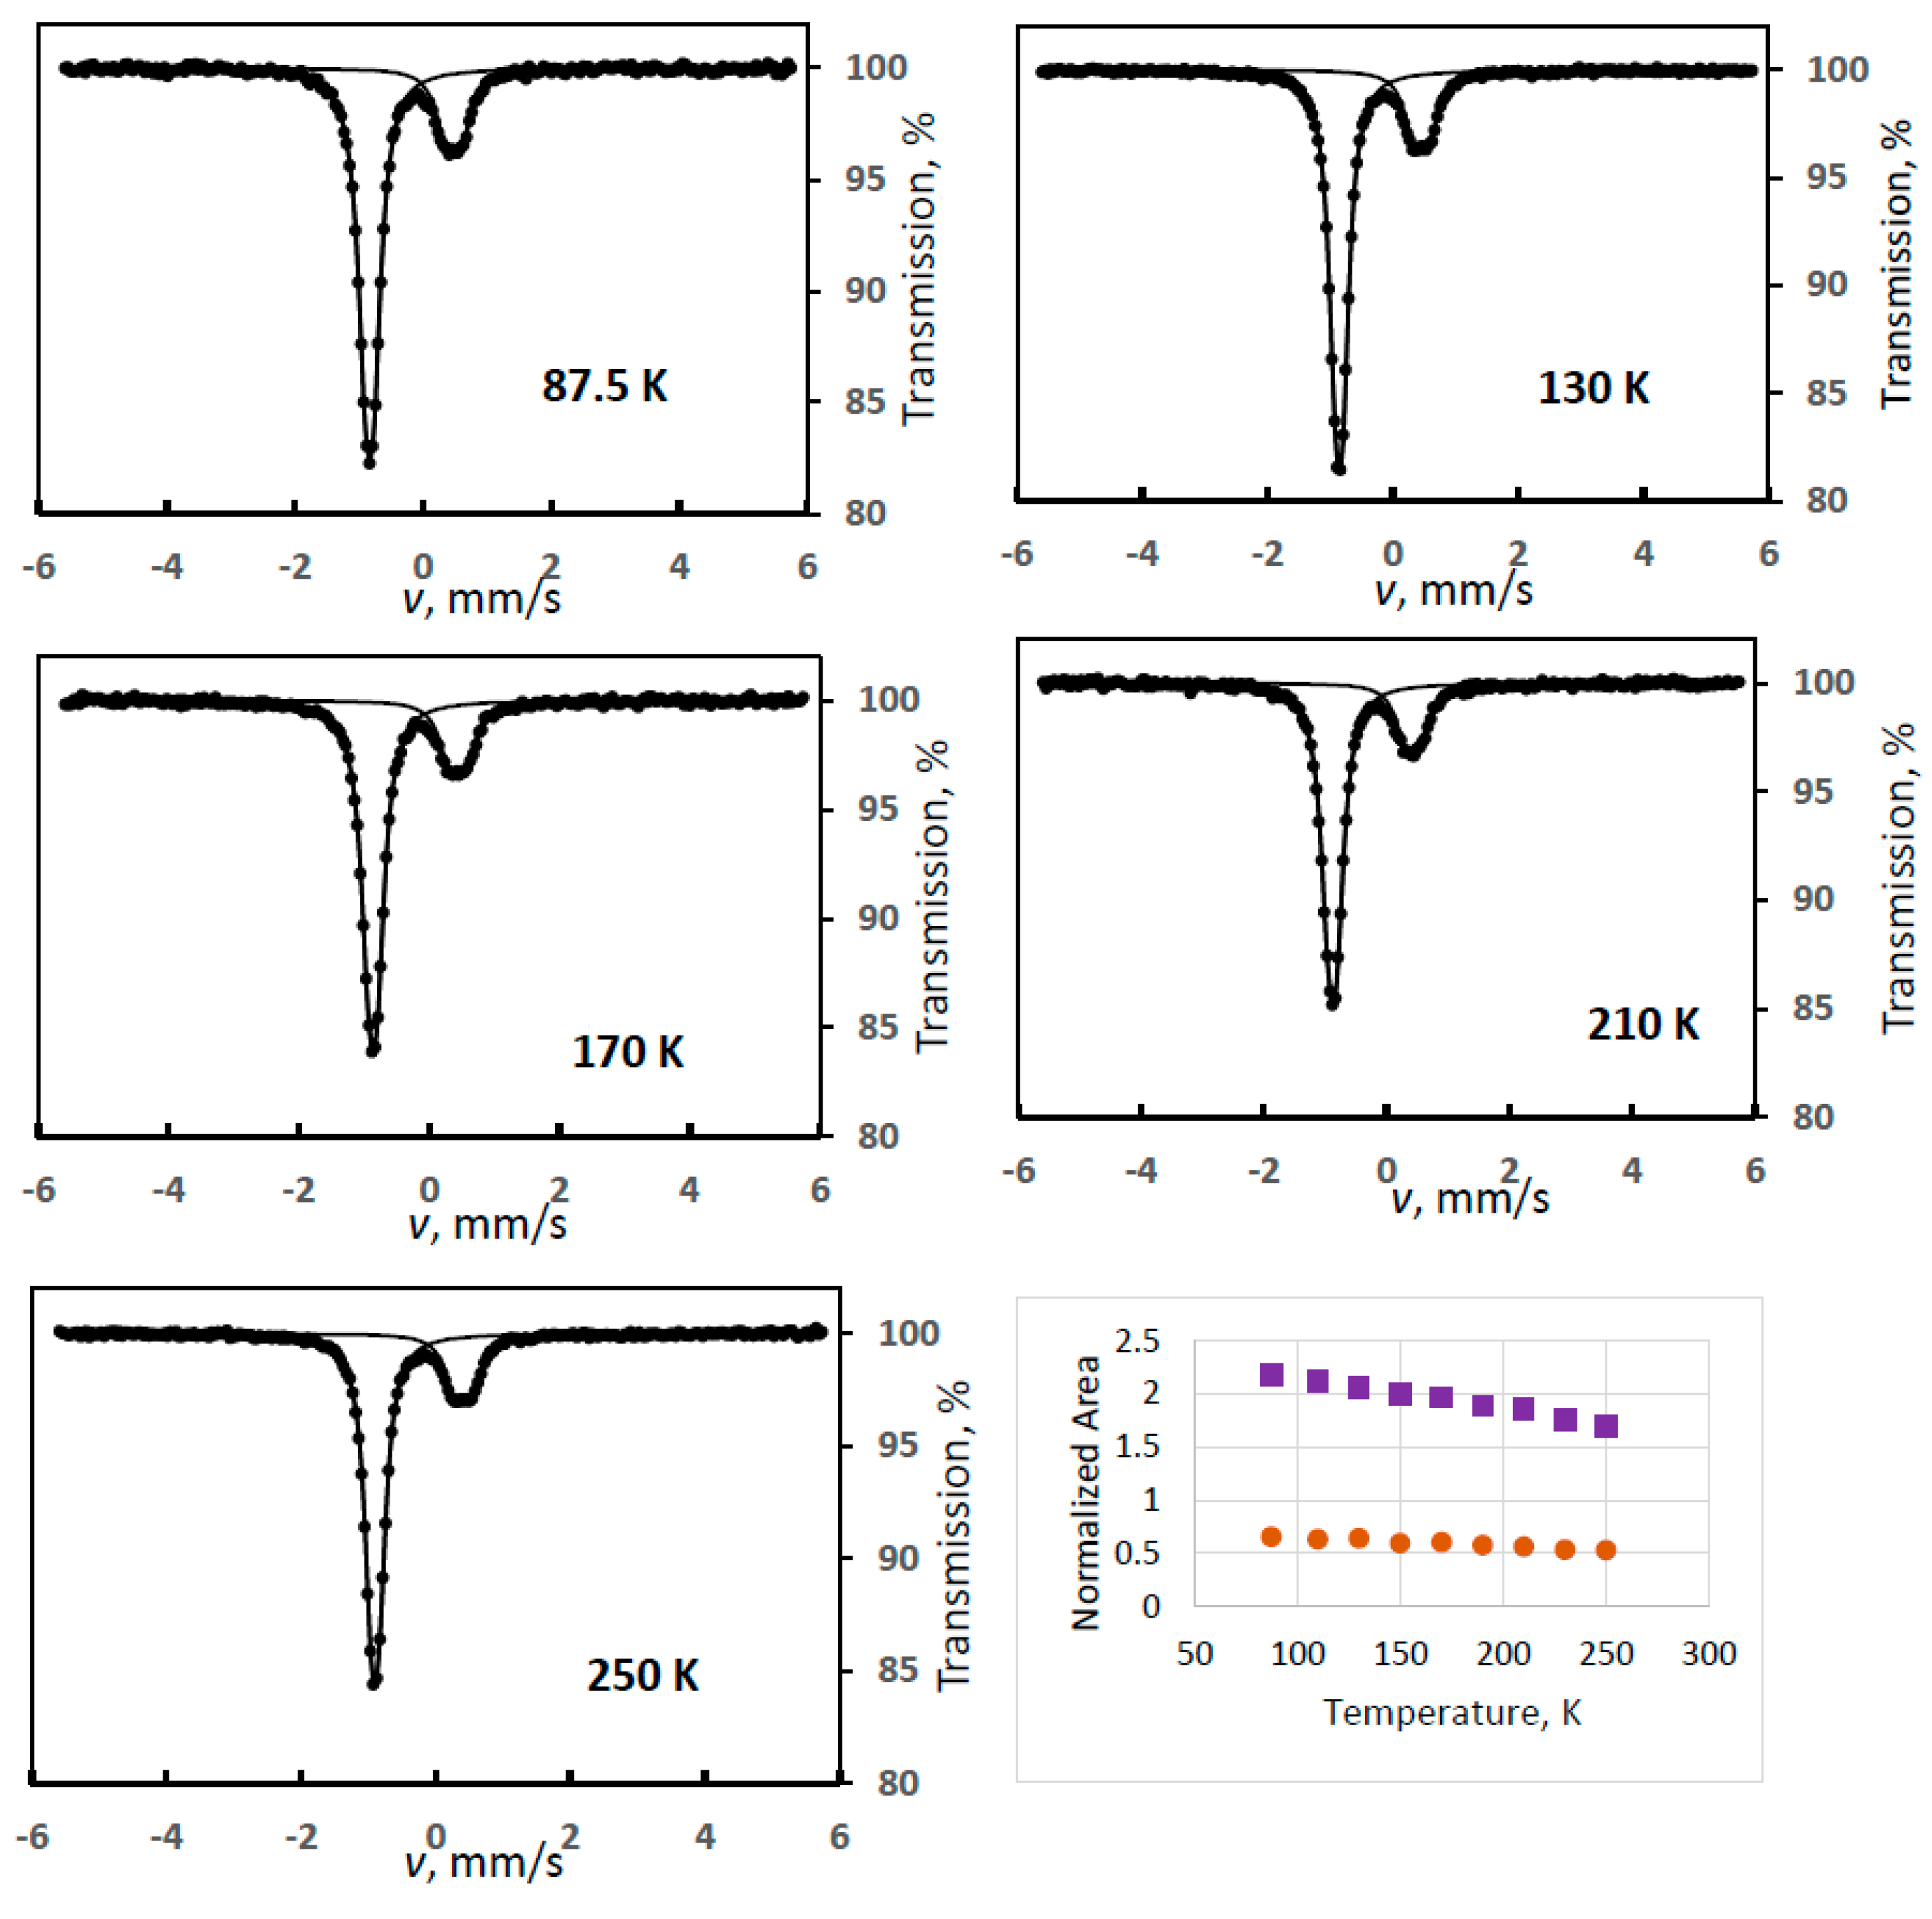
Figure 2 shows sample spectra from a series of experiments where FeIII(2) was the observed degradation product (Experiment 2), but its intensity, again, is not decreasing but is substantially increasing with temperature up to a certain temperature (170 K) as shown in the temperature variation graph in Figure 2. We note that intensity asymmetry was allowed in the spectrum evaluations for the doublet of FeIII(2) because random orientation of the crystallites could not be ensured in our sample preparation technique. This proved to be always small, but it made the line area determinations more accurate.
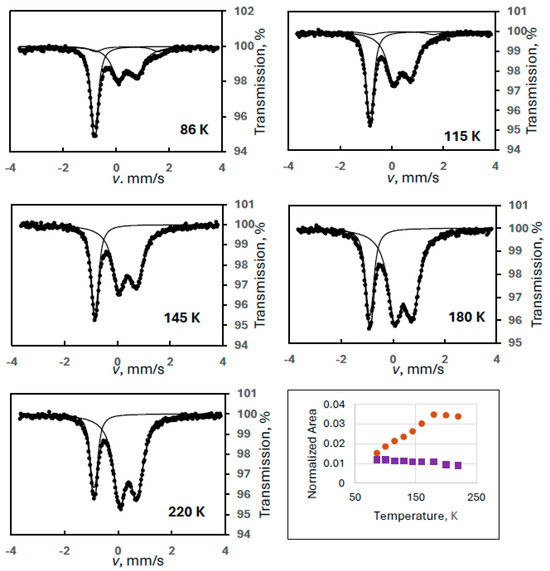
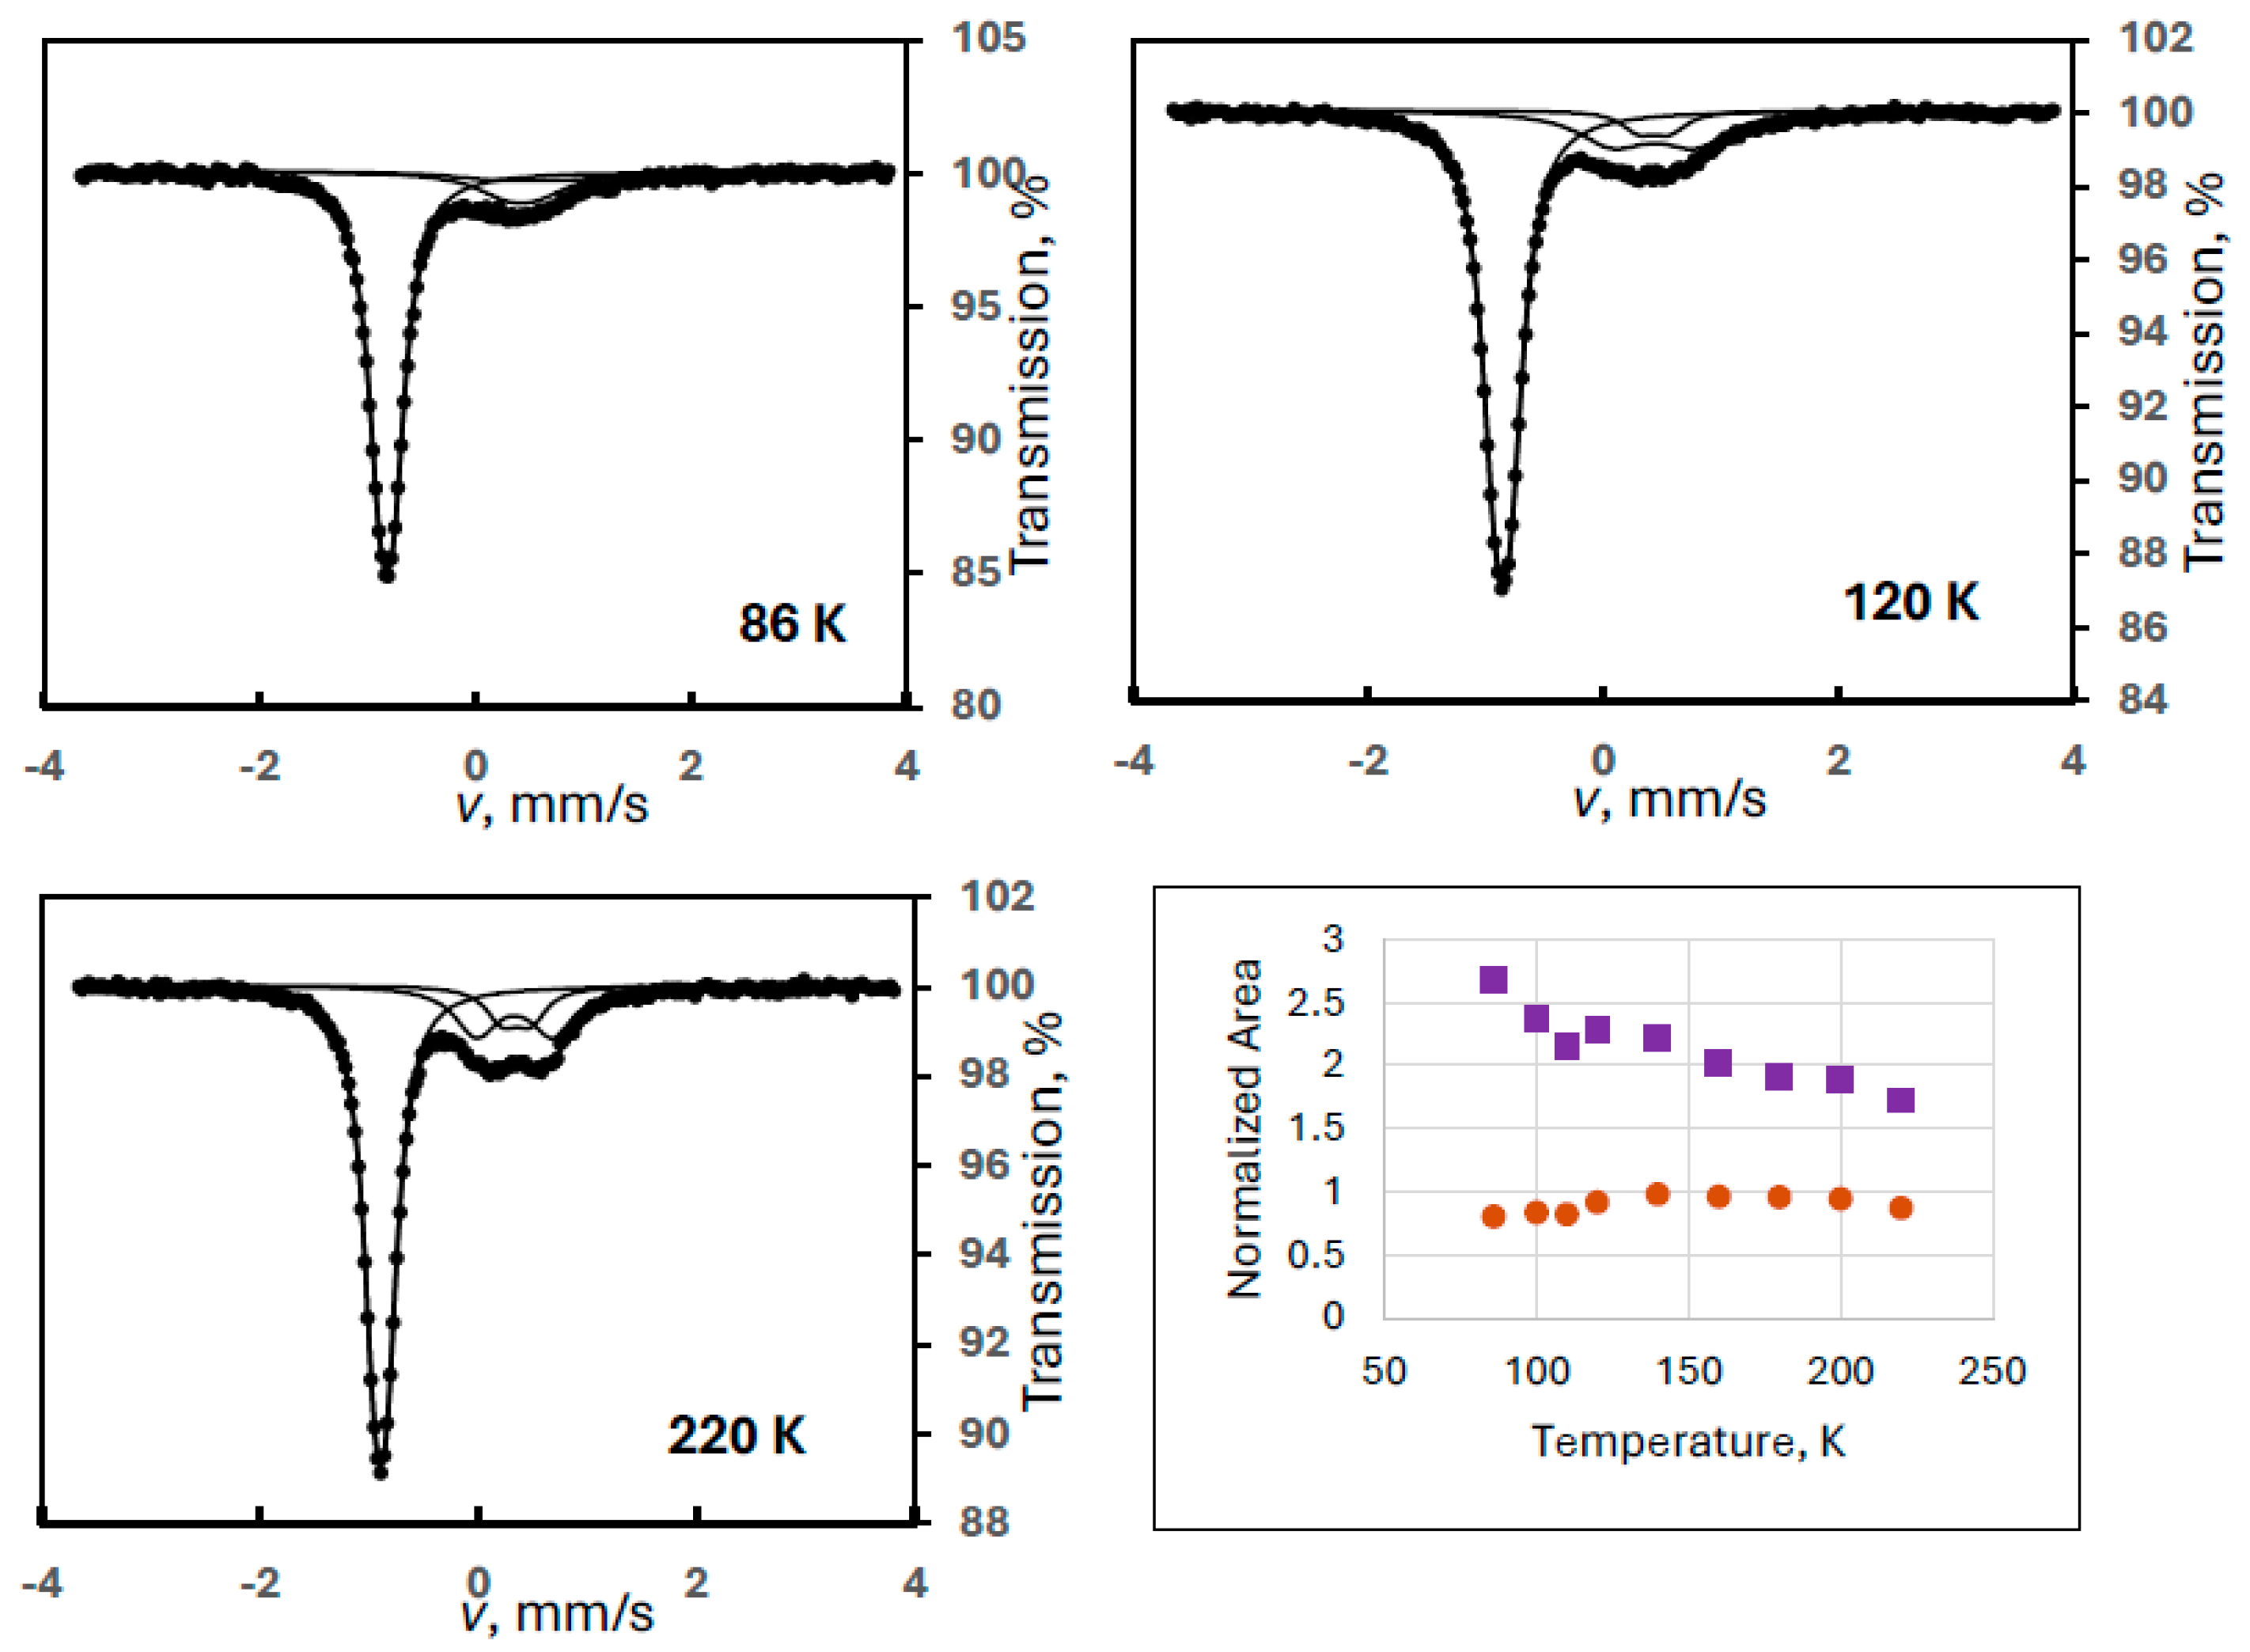
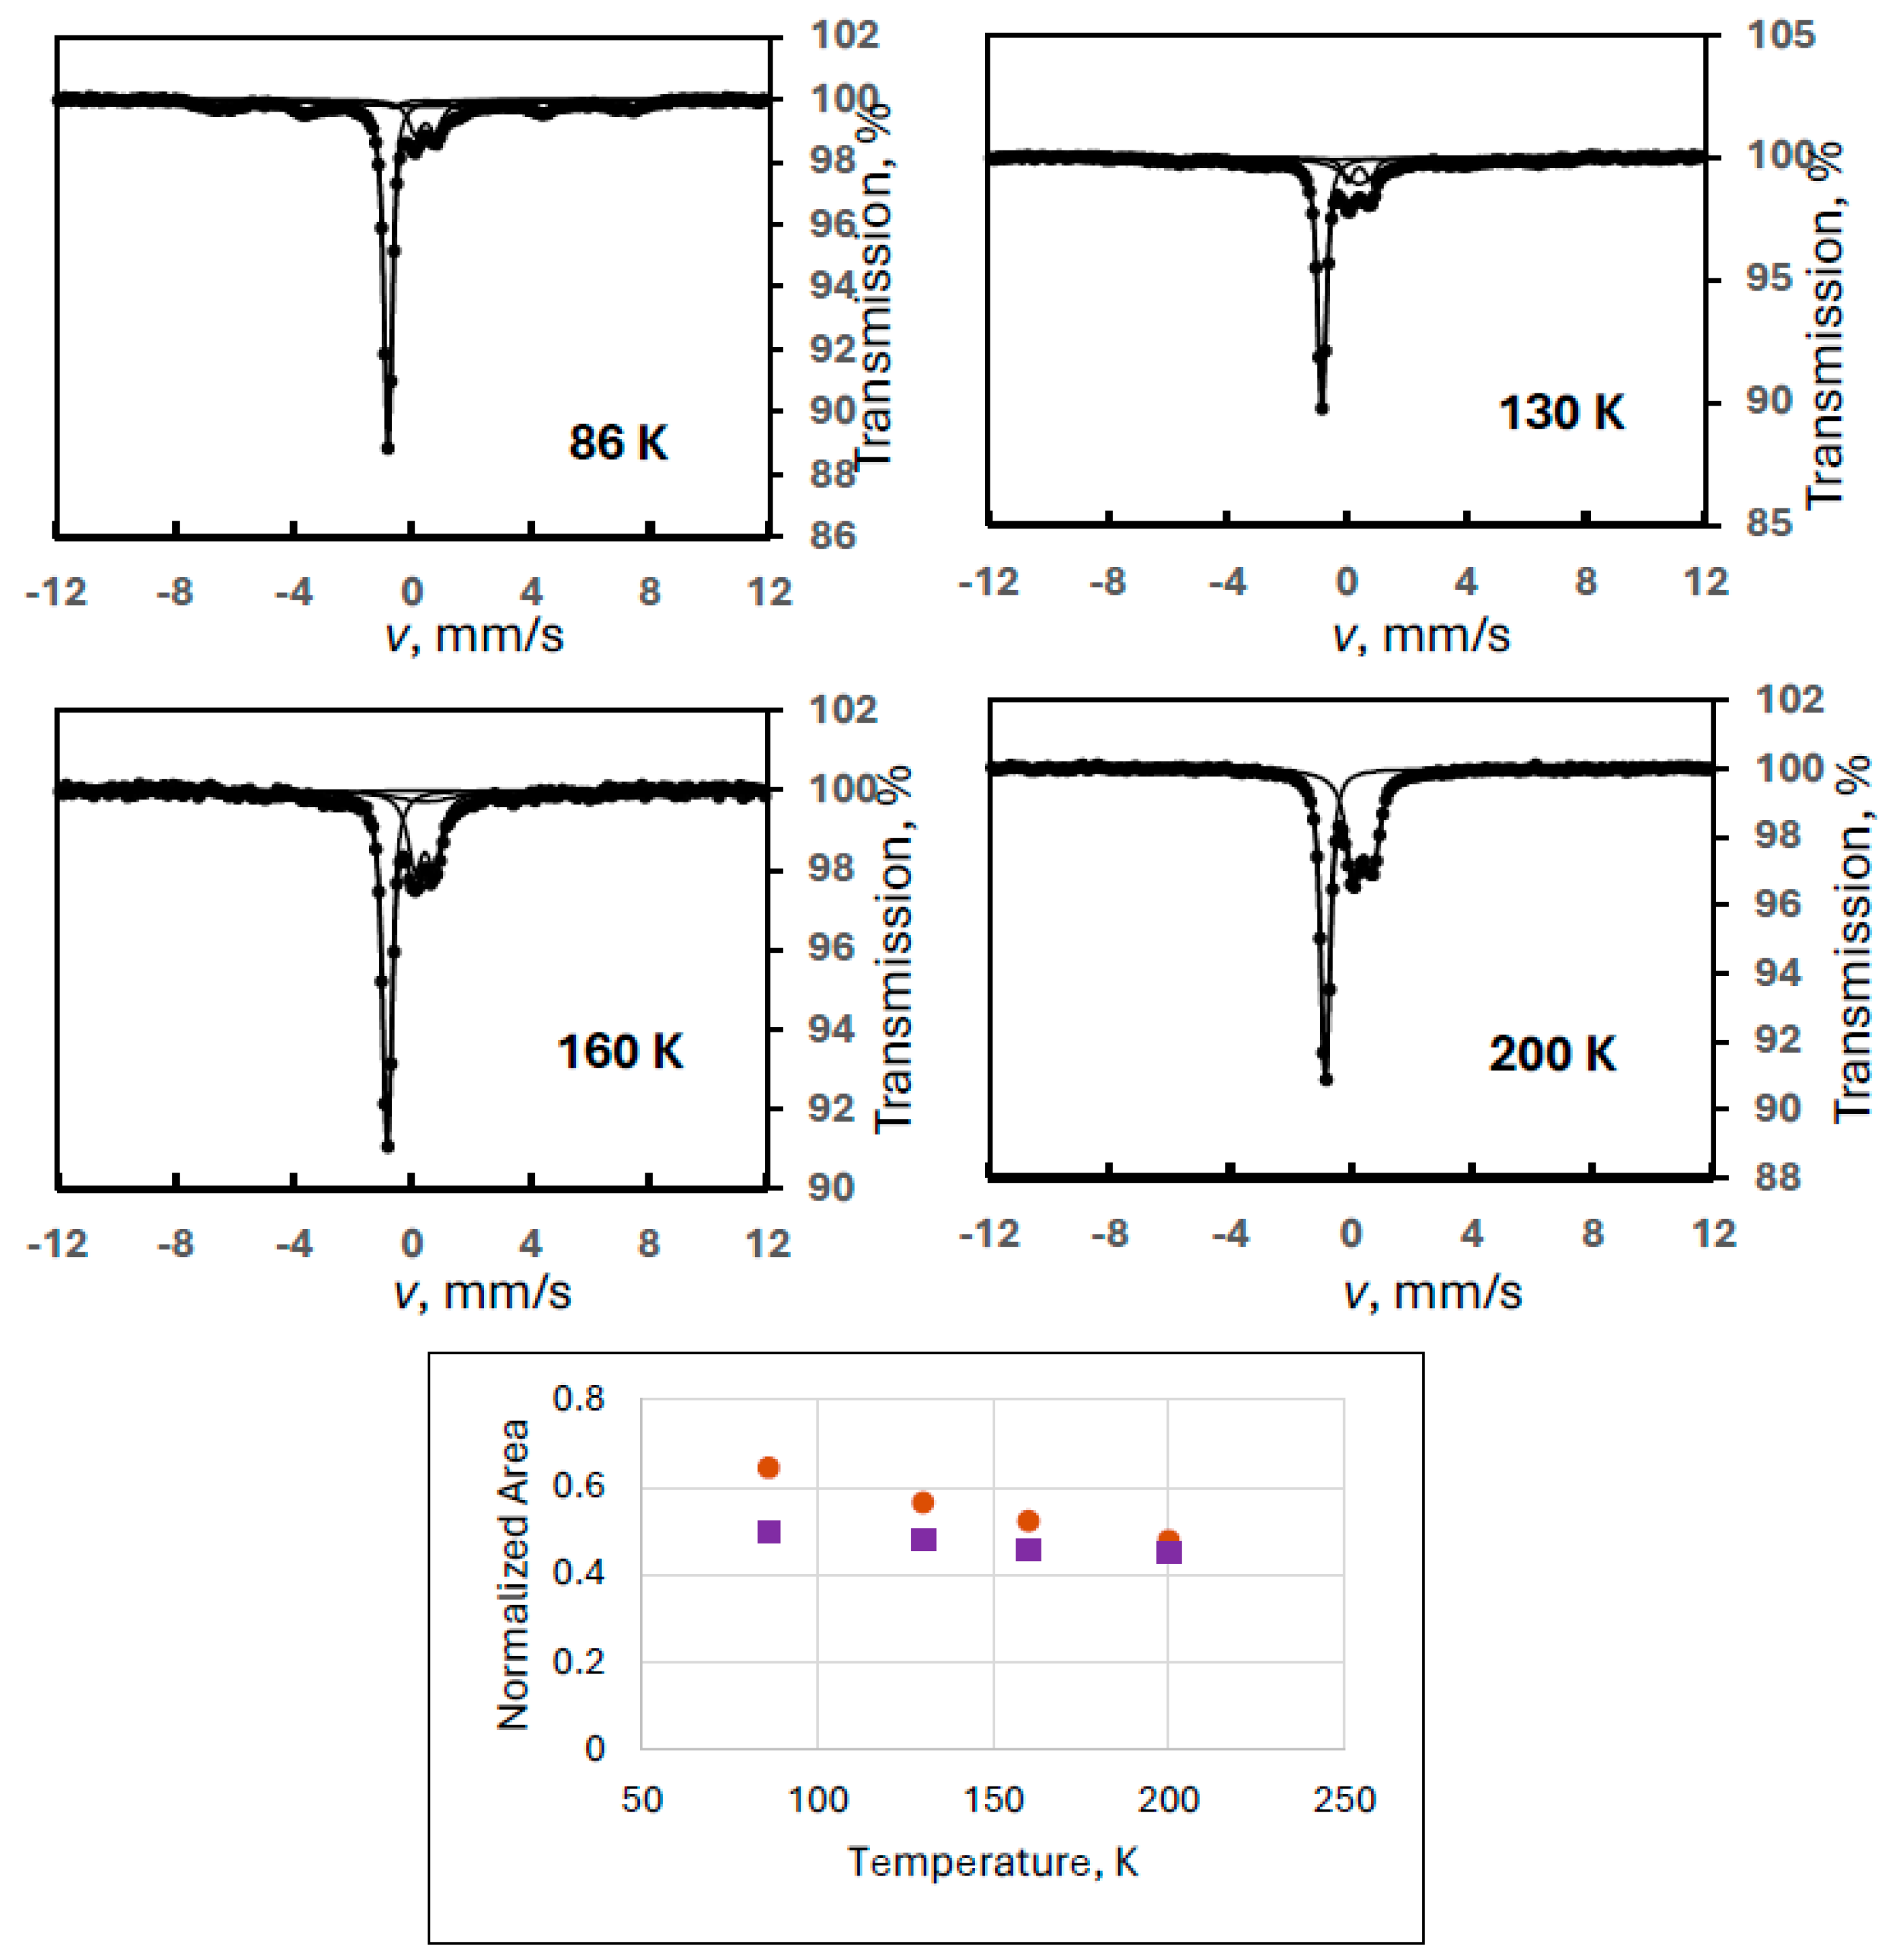
Figure 2.
Temperature variation of the normalized spectral areas for ferrate(VI) (purple squares) and for FeIII(2) (orange dots) with some sample Mössbauer spectra recorded at the indicated temperatures (Experiment 2).
Figure 3 shows the results of another series of experiments (Experiment 3) where the increase in the normalized intensity of FeIII(2) is very substantial and lasts in the whole investigated temperature range.
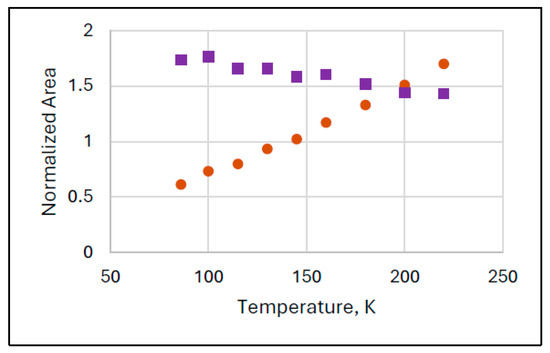
Figure 3.
Anomalous temperature variation of the spectral areas of species FeIII(2) (orange dots) in Mössbauer spectra recorded in narrow velocity range in Experiments 3. The ferrate(VI) (purple squares) behaves regularly.
This phenomenon proved to be a virtual increase in the intensity of FeIII(2) caused by the narrow velocity range applied in the measurements. Although a visual inspection of the spectra above ca. 120 K shows no irregularity, a closer inspection, especially at 86 K (Figure 2), reveals an extra component or components. (In Figure 2, the evaluation already includes an extra component which is a magnetic sextet.)
In order to check this conjecture, we repeated our measurements at four different temperatures on the sample used in Experiment 3 in a wide velocity range (Experiment 4) to see all components including the magnetically split one. The resultant spectra confirmed the presence of a sextet (Figure 4). The Mössbauer parameters for this sextet at 90 K were obtained as follows: δ = 0.41 mm/s, B = 42.6 T, 2ε = −0.04 mm/s.
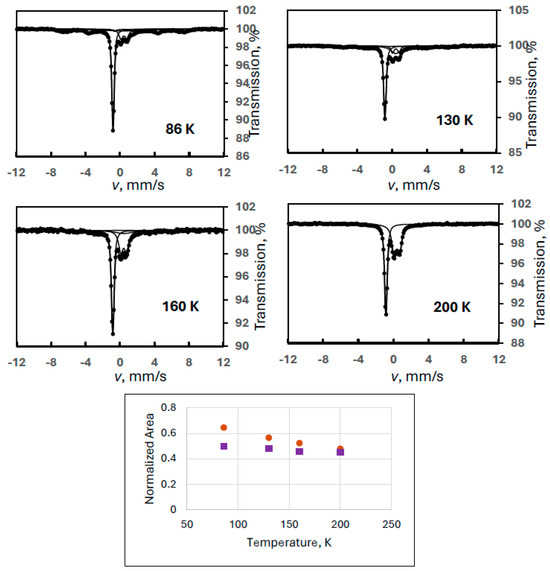
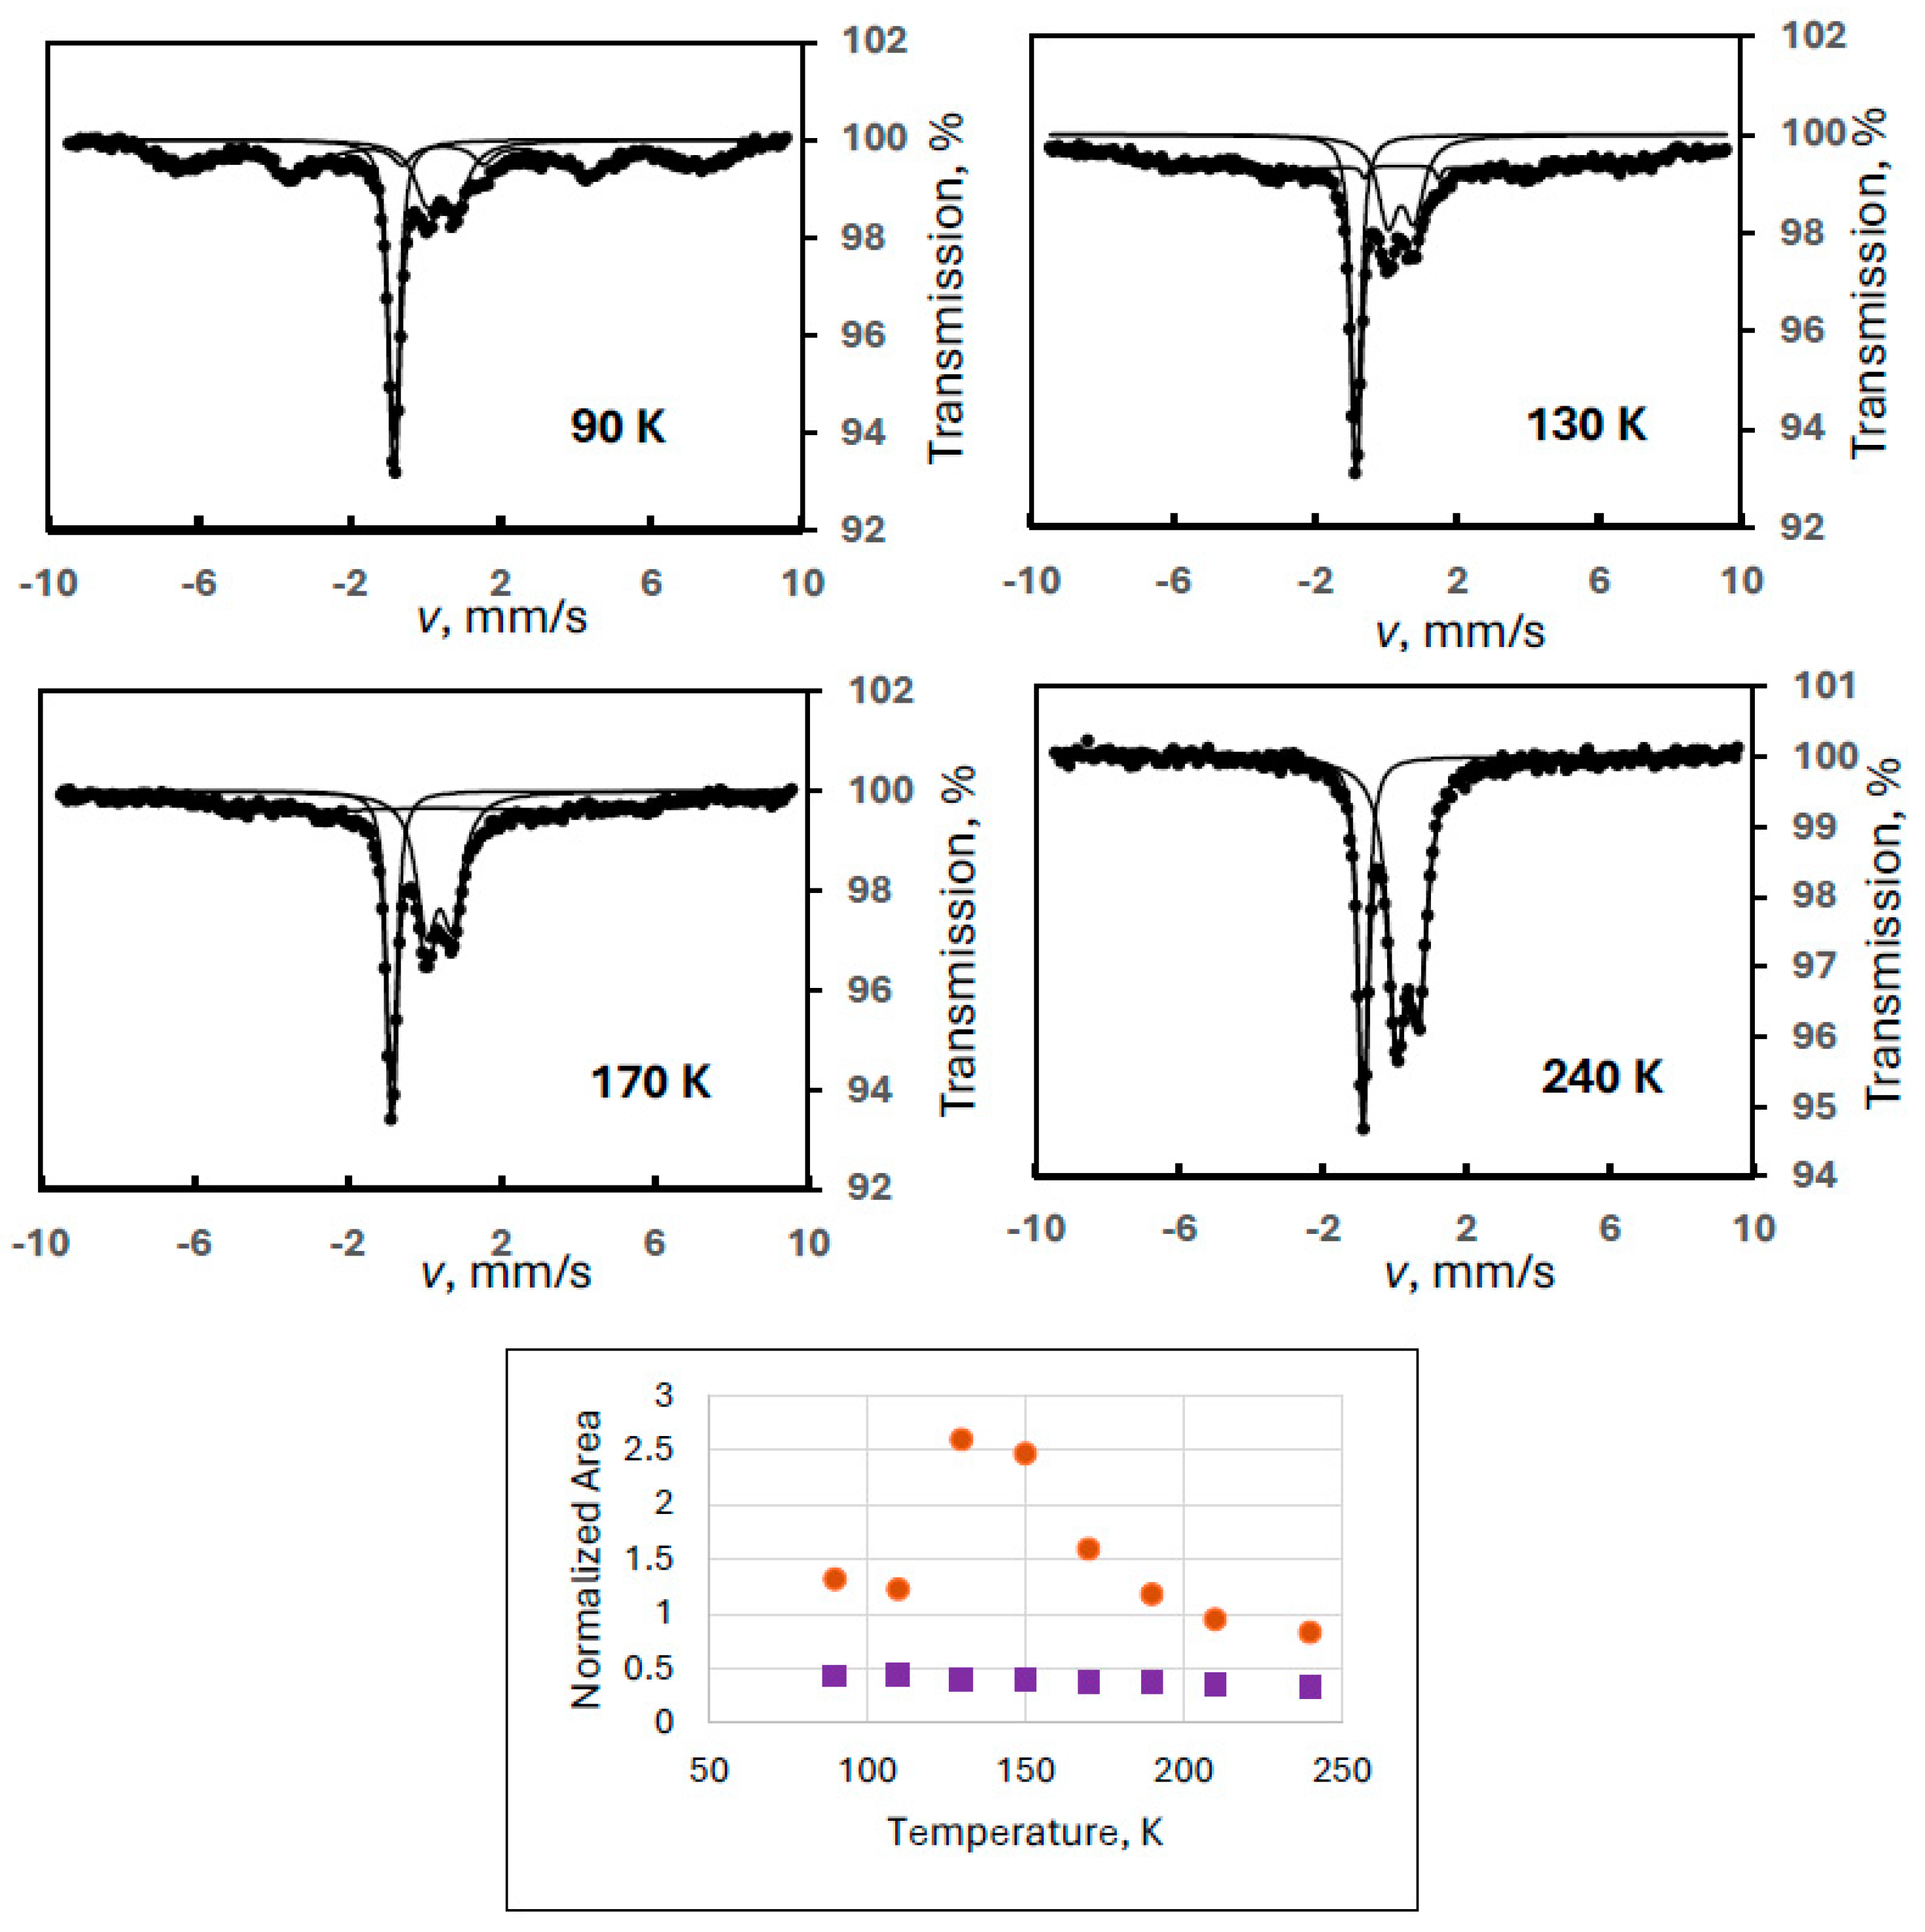
Figure 4.
Mössbauer spectra of a ferrate sample containing degradation product FeIII(2) recorded at the indicated temperatures (Experiment 4), and the temperature variation of the normalized areas for ferrate(VI) (purple squares) and FeIII(2) (orange dots), the latter meaning the sum of the areas of the sextet and the iron(III) doublet.
Evaluating the spectra with a model assuming the regular doublet for ferrate(VI) and a combination of an iron(III) doublet (i.e., that of FeIII(2)) and a sextet, the trends of the line areas as a function of temperature were found to be normal (Figure 4) if the sum of the area of the iron(III) doublet and the sextet was considered as the “real” FeIII(2). The evaluated Mössbauer parameters are shown in Table 2.
Table 2.
Mössbauer parameters found, in Experiment 4, for the ferrate(VI), and the magnetic (sextet) and superparamagnetic (doublet) components of the species FeIII(2) as a function of temperature. Isomer shifts are given relative to α-Fe at room temperature. Errors are ±1 in the last digit.
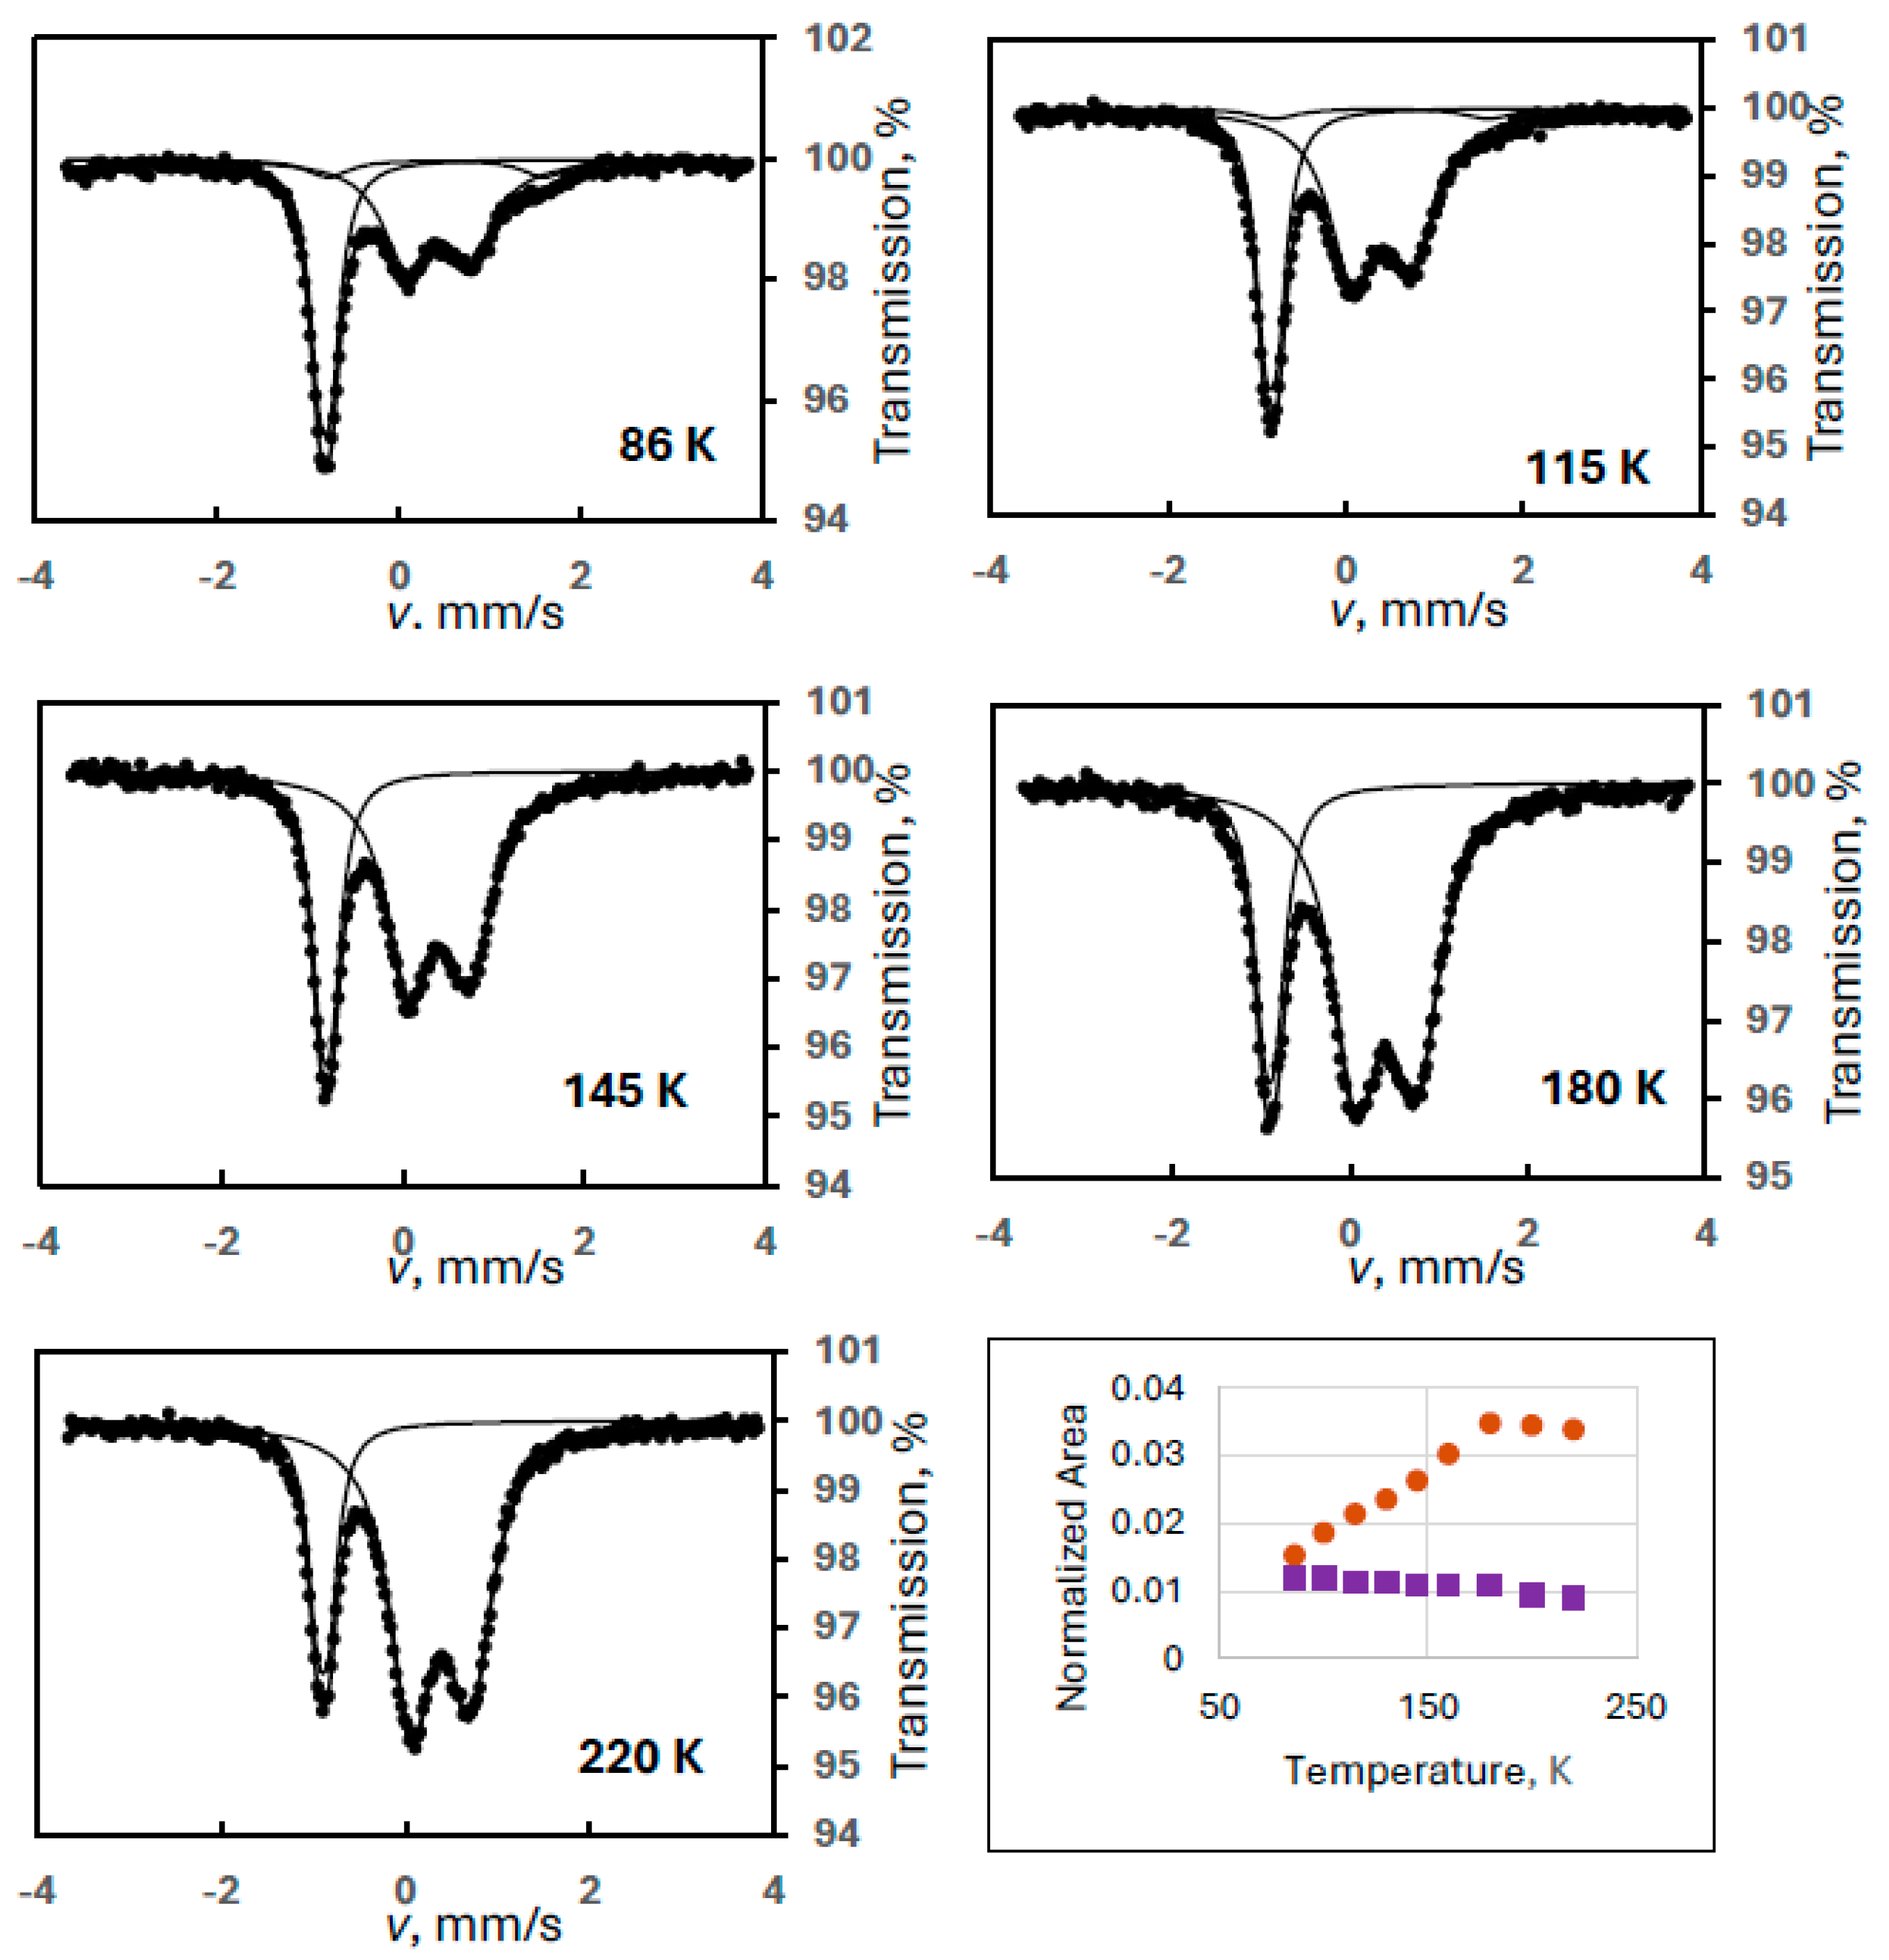
In order to reproduce this finding, another ferrate(VI) sample with a larger amount of degradation product FeIII(2) was measured in a wide velocity range at eight different temperatures (Experiment 5). Figure 5 shows sample spectra from this series together with the temperature variation of the spectral areas. It is clearly confirmed that the iron(III) doublet component is only the superparamagnetic part of the FeIII(2) species showing well-resolved magnetically split lines at 90 K. The Mössbauer parameters for this sextet at 90 K were identical to those found in the previous experiment within the experimental error range: δ = 0.46 mm/s, B = 42.3 T, 2ε = −0.03 mm/s.
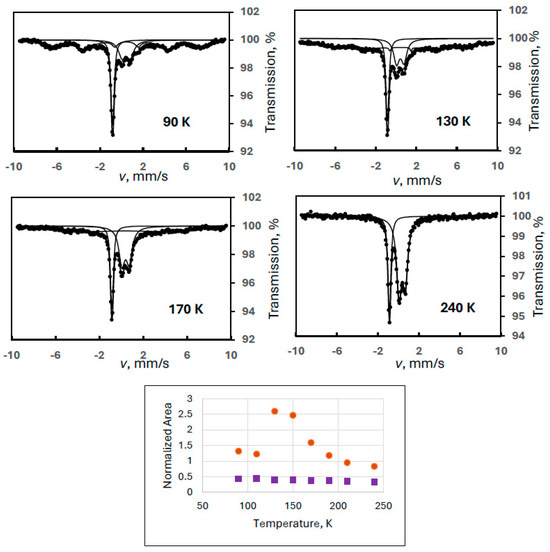
Figure 5.
Selected Mössbauer spectra of a ferrate(VI) sample with degradation product FeIII(2) recorded in wide velocity range at the indicated temperatures (Experiment 5), and the temperature variation of the normalized areas for ferrate(VI) (purple squares) and FeIII(2) (orange dots), the latter meaning the sum of the areas of the sextet and the iron(III) doublet.
Regarding the temperature variations, the spectral area for the FeIII(2) component was calculated as previously: the sum of the area of the iron(III) doublet and the sextet. It is again well demonstrated that both the sextet and the doublet can be assigned to FeIII(2) as two forms of a superparamagnetic system. In this experiment, the blocking temperature is estimated (from visual inspection of the spectra) to be around 200 K.
Let us recall the two cases depicted in Figure 2 and Figure 3 (Experiments 2 and 3). Although the sextet is not seen in the spectra due to the narrow velocity range, it can be concluded from the trend of the area curves that the blocking temperatures were around 180 K in Experiment 2 and certainly over 220 K in Experiment 3 as deduced from the onset of the normal monotonous decrease in the spectral area of the paramagnetic iron(III) doublet. This onset is expected at a temperature where there is no more magnetically split fraction left. The reason for the variation in the blocking temperatures can be the average particle size and the particle size distribution of the oxyhydroxide/hydroxide phase in the actual experiment.
The still very anomalous trend in the curve of FeIII(2) (Figure 5) is attributed to the computer evaluation procedure of the superparamagnetic system. In general, a superparamagnetic system can be easily fitted with the combination of a doublet (or singlet) and a magnetic sextet using Lorentzian line shapes (with some broadening) if the particle size distribution is even (i.e., in a highly polydisperse system). In this case, the particle size fraction of the phase that is at a transitional state between the fast relaxation limit (resulting in a doublet) and the slow relaxation limit (resulting in a sextet) is very low at any temperature. However, if there is a certain particle size with a large contribution to the distribution, then at the blocking temperature that belongs to that particle size, the spectral shape is somewhere in between a doublet and a sextet: it shows up as a very broad line stretched over an extremely wide velocity range. This results in a huge correlation between the baseline parameter and the line width of this relaxed component, and may cause overestimation of the line area.
From these experiments, it is clear that the anomaly in the temperature variation of the spectral area of the FeIII(2) doublet is caused by the superparamagnetic behavior of this phase. The non-optimal velocity range of the measurement (too narrow as compared to the large broadening) can result in this virtual phenomenon.
However, as can be seen in Figure 6, the superparamagnetism may not always cause a disturbance. In an additional synthesis, we could find a situation where a small amount of iron(III) formed (ca. 13%), first as FeIII(1) (Experiment 6, see later), and after about two weeks aging of the sample (stored in a refrigerator in the opened plastic bag) the iron(III) form was observed as FeIII(2) (Experiment 7).
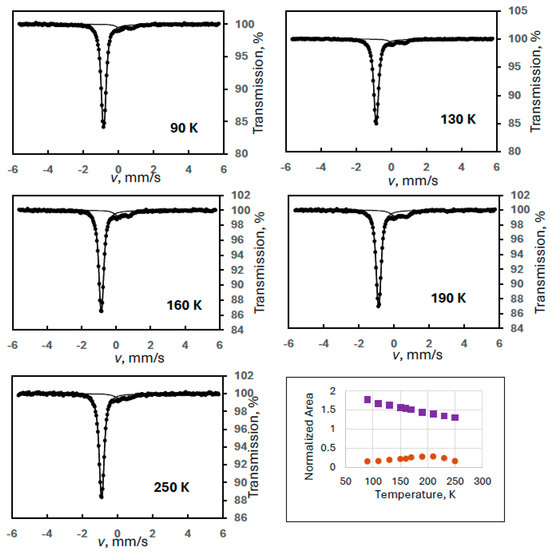
Figure 6.
Mössbauer spectra of a ferrate(VI) sample containing FeIII(2) degradation product at selected temperatures recorded in ±6 mm/s velocity range (Experiment 7), and the temperature variation of the normalized areas for ferrate(VI) (purple squares) and FeIII(2) (orange dots).
As shown in Figure 6, although the velocity range of the measurement was increased to about ±6 mm/s to see any magnetically split component while keeping a reasonably high velocity resolution, there was no sign of any sextets even at 90 K. Most probably, the small amount of the FeIII(2) phase implies small particle size resulting in a blocking temperature of the system below 90 K even for the largest particles. Thus, all FeIII(2) appears as a doublet.
Since the analysis of these spectra is not challenged by the superparamagnetic relaxation, one may expect regular behavior of the area vs. temperature curve for the FeIII(2) species (the doublet). However, the trend of the curve is still anomalous (Figure 6).
The only reasonable explanation of this finding is that a phase transformation (polymorphism) may occur somewhere in between 170 and 210 K, and the phase existing at the higher temperature has a higher Debye temperature, and, inherently, a larger Mössbauer–Lamb factor.
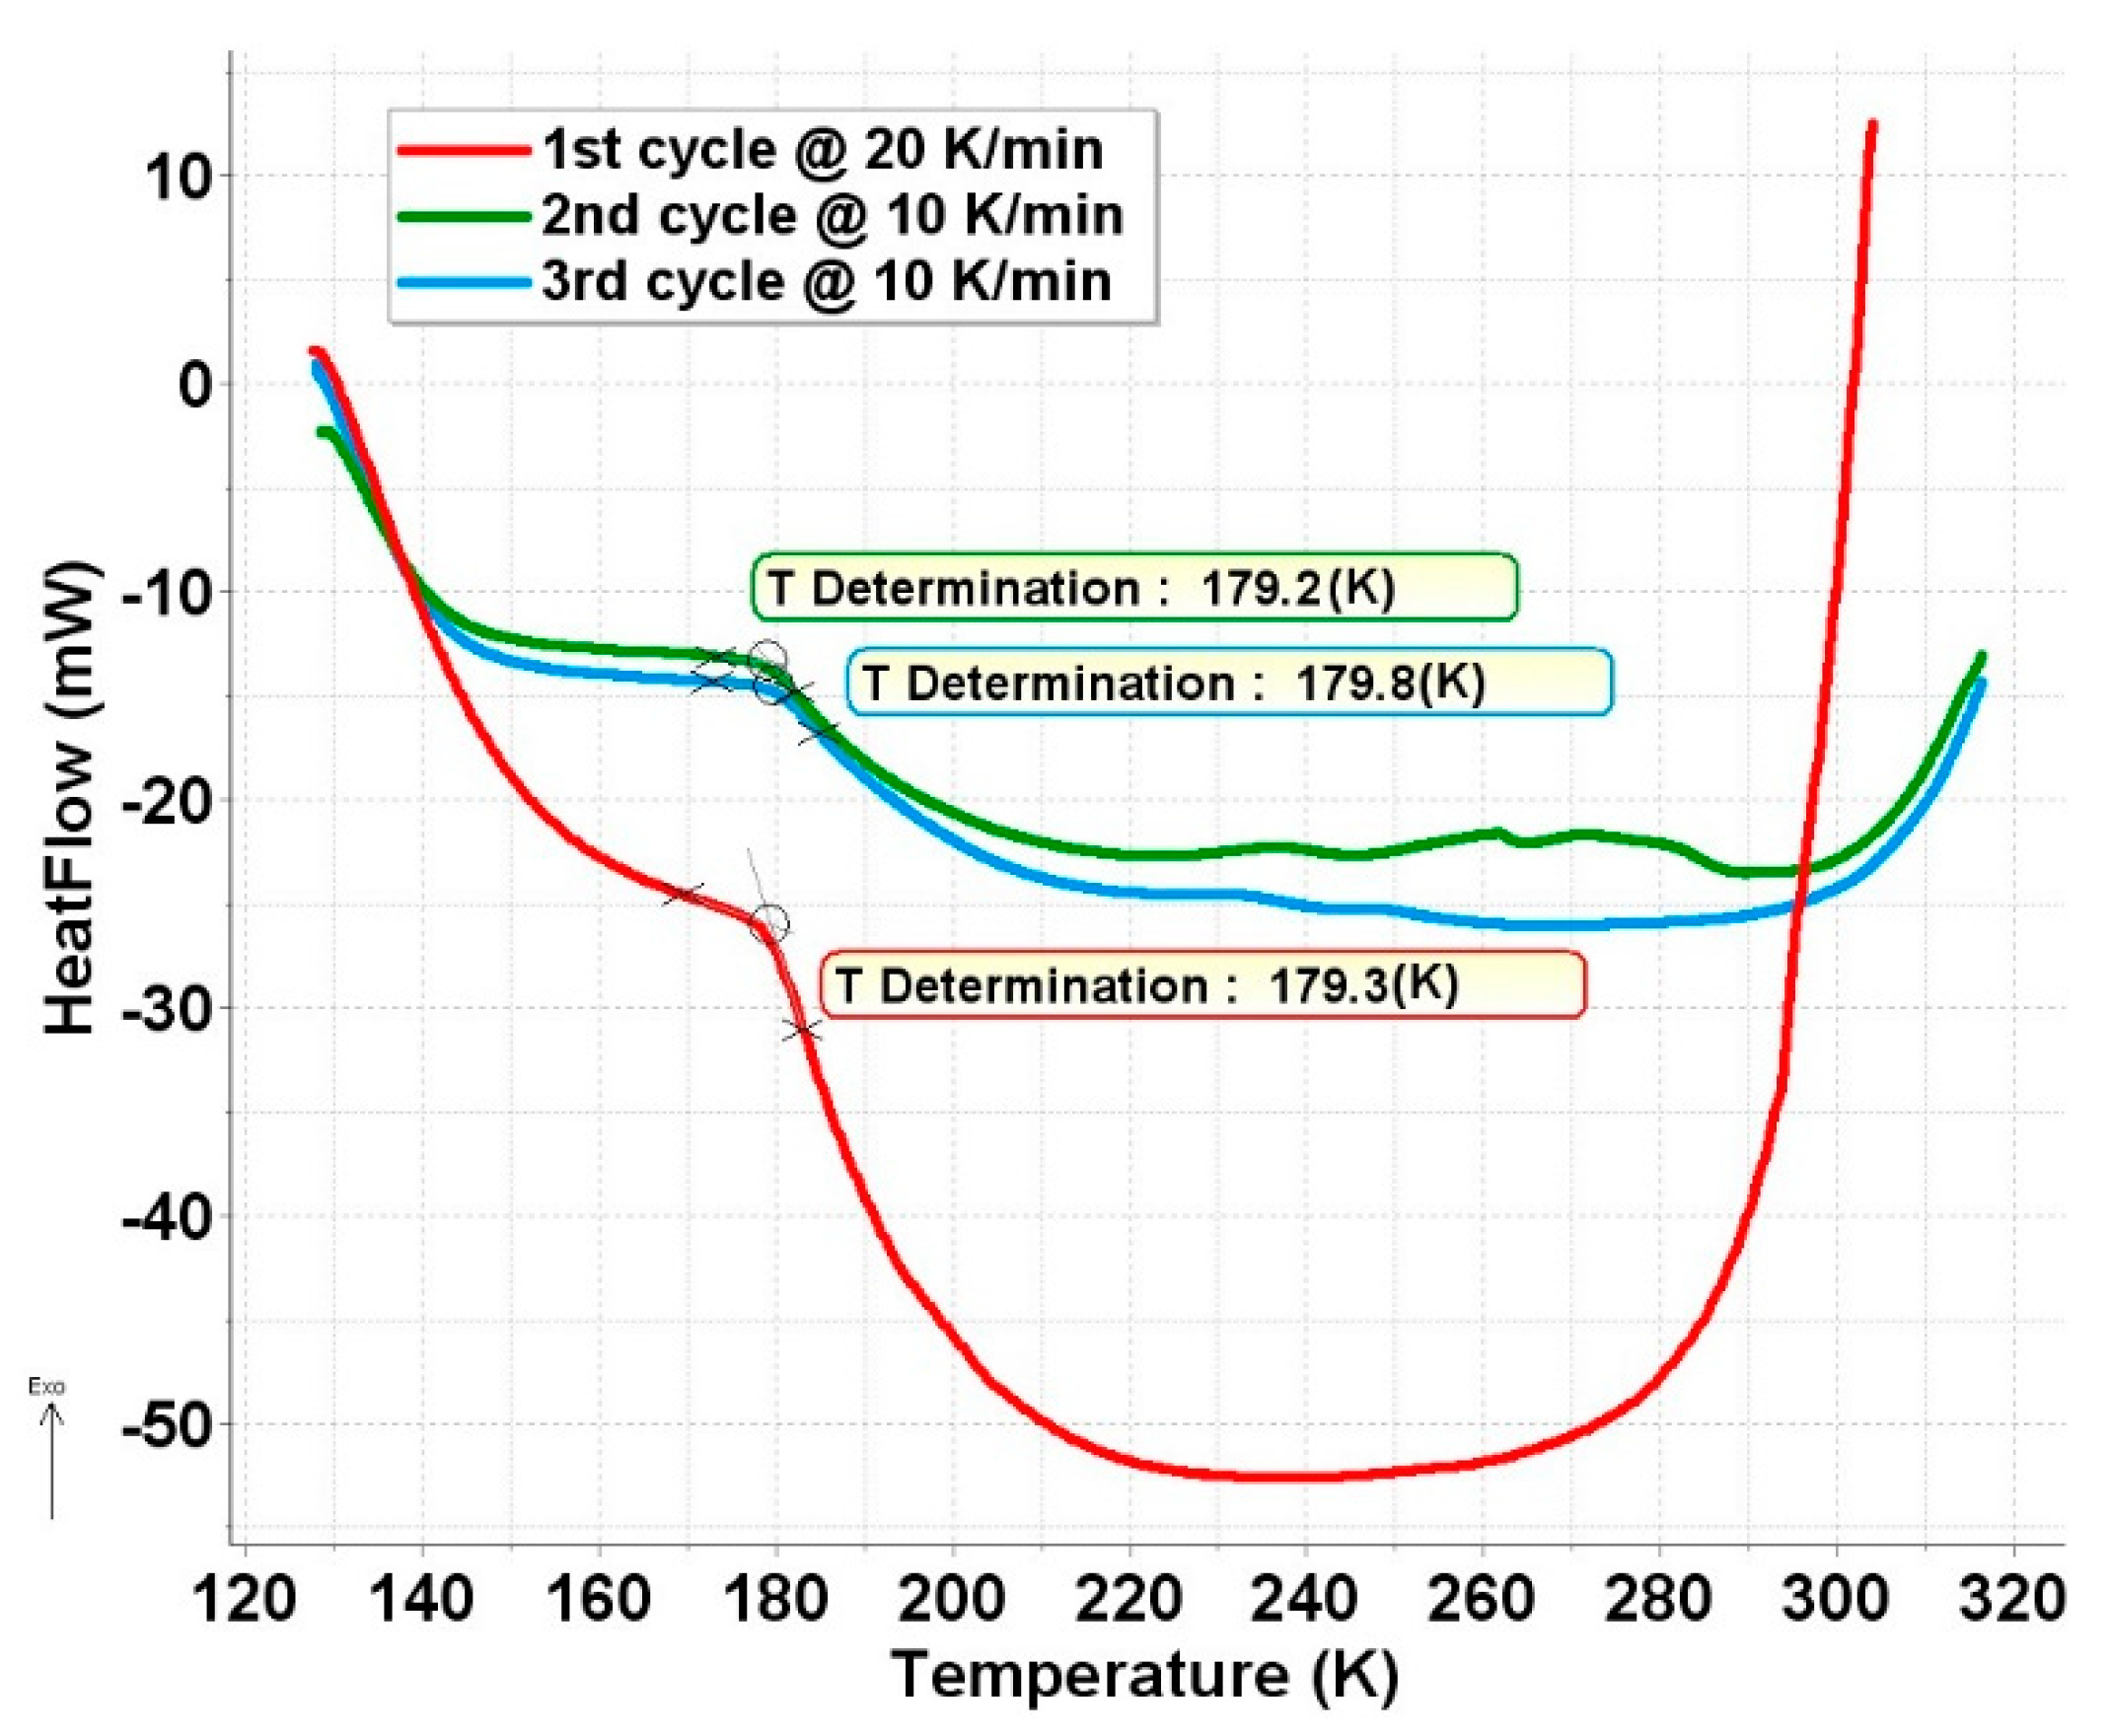
To check this idea, a low-temperature DSC measurement was performed on this sample, and it confirmed our assumption. As shown in Figure 7, a transformation occurs at around 180 K in this sample. The nature of this phase transformation is not known. Unfortunately, these ferrate samples are extremely sensitive to contact with air and humidity, or even to storage at room temperature, which makes other types of measurements like powder-XRD practically unfeasible.
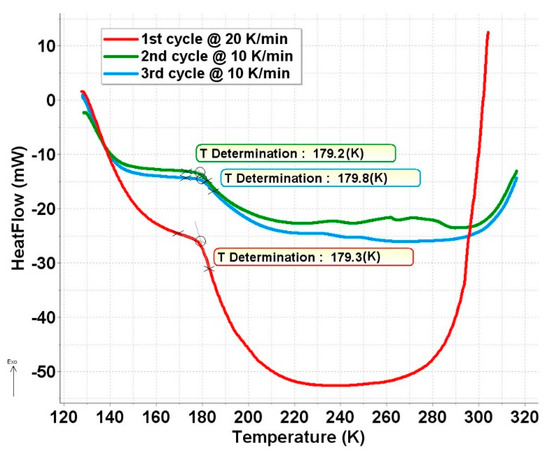
Figure 7.
Low-temperature DSC curve of a ferrate(VI) sample containing degradation product FeIII(2) in fully superparamagnetic form in the studied temperature range.
All the experimental findings on ferrate(VI) samples containing FeIII(2) show that determination of the Debye temperature for this degradation product is substantially hindered by superparamagnetic behavior and phase transformation, making this goal almost unattainable. The only hint to judge if there is any difference in the Debye temperature for ferrate(VI) and FeIII(2) is Figure 4, where the decrease in the normalized area is steeper for FeIII(2) than for ferrate(VI). According to Equation (3), this means higher ΘD for FeIII(2). Since this is based on four measurements, and from the eight experiments we performed a fairly complicated picture emerged for FeIII(2), and FeIII(2) is not the most typical iron(III) degradation product in the electrochemical synthesis of ferrate(VI), we did not pursue measuring an accurate Debye temperature for FeIII(2).
At this point, it is worthwhile discussing the identity of the species FeIII(2). As was mentioned earlier, FeIII(2) is a typical degradation product found in potassium ferrate(VI) synthesized by hypochlorite oxidation or by other means, obtaining dry K2FeO4. In humid air, this species forms as far as it may be deduced from its Mössbauer parameters. However, only the isomer shift and the quadrupole splitting (the latter with some variation in the vicinity of 0.7 mm/s) are not enough for perfect assignment of the Mössbauer doublet to one particular species because of the substantial overlap of these parameters for oxygen-coordinated iron(III). In our cases, the magnetic splitting can give more of a hint. Unfortunately, due to the superparamagnetism, it is not always observed. However, where this showed up in our present experiments, the 90 K value was stable, B=42.6 T, and the quadrupole shift was very close to zero. This is the same magnetic field and quadrupole shift we found in our previous work [17] and we attributed this to a new species (different from FeIII(2), denoted as FeIII(4), similar to lepidocrocite).
Degradation of the solid potassium ferrate was previously studied in humid air [28], and the same doublet was found with δFe = 0.34–0.39 mm/s and Δ = 0.61–0.68 mm/s at room temperature. This species was found to be magnetic below 50 K, a temperature considered as the blocking temperature of a superparamagnetic system. The magnetic field of this component below 50 K is somewhat higher than ours at 90 K by visual inspection (no data given), which is in agreement with the expected temperature variation in the internal magnetic field. On the basis of thermal measurements (temperature-dependent loss of water), it was concluded that this is iron(III)-hydroxide, Fe(OH)3. It was checked by SEM that the particle size of this phase was extremely small, explaining the superparamagnetic behavior well below 90 K.
On the basis of this comparison and the variable superparamagnetic behavior in our experiments, we can suggest that our FeIII(2) species and also FeIII(4) [17] are both Fe(OH)3. The emerging sextet component in aged samples of electrochemically produced ferrate samples [17] is due to crystal growth of Fe(OH)3 and not to a transformation to another new phase.
Let us finally note that in both cases a doublet with well-defined quadrupole splitting transforms into a sextet with practically zero quadrupole shift. It is possible if, in the magnetic phase, the angle between the principal axis of the EFG tensor and the direction of the magnetic field is the magic angle, 54.7 degrees [43]. This similarity strengthens the correspondence between the iron(III) degradation products of potassium ferrate(VI) formed in humid air and in wet potassium ferrate(VI) produced by anodic oxidation.
As was mentioned, the previous experiment was conducted on a sample aged after opening its plastic bag. The fresh sample contained the most abundant degradation product, FeIII(1) (Experiment 6), found by us in electrochemically produced ferrate(VI). The Mössbauer measurements were conducted in a wide velocity range in order to notice the presence of any magnetically split components. There was no such component observed, as shown on some selected spectra in Figure 8.
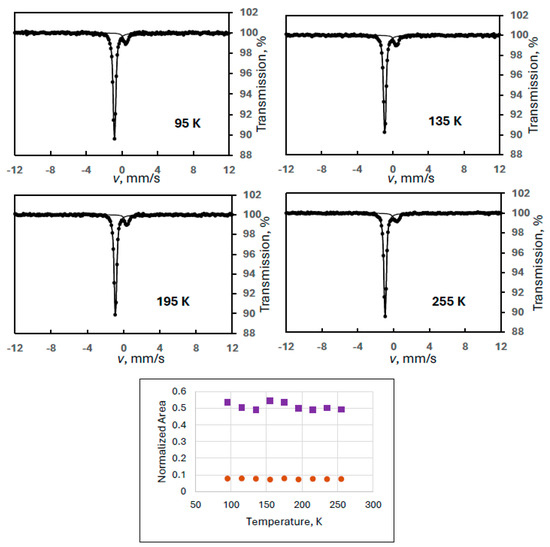
Figure 8.
Selected Mössbauer spectra of a ferrate(VI) sample containing FeIII(1) as an iron(III) degradation product, recorded in wide velocity range at the indicated temperatures (Experiment 6), together with the temperature variation of the normalized areas for ferrate(VI) (purple squares) and FeIII(1) (orange dots).
In contrast to the case of FeIII(2)-containing samples, the temperature variation of the spectral area for both components showed regular behavior. The statistical uncertainty for the ferrate(VI) is attributed to the low resolution resulting in small spectral areas. (It is considered accidental that the smaller FeIII(1) does not show this statistical variance.)
In order to confirm the regular behavior of FeIII(1), another sample was selected for detailed study where only FeIII(1) was present as a degradation product but in a larger quantity (Experiment 8). A velocity span of ±6 mm/s was set for better resolution while guaranteeing to see magnetic sextets if there were any (Figure 9).
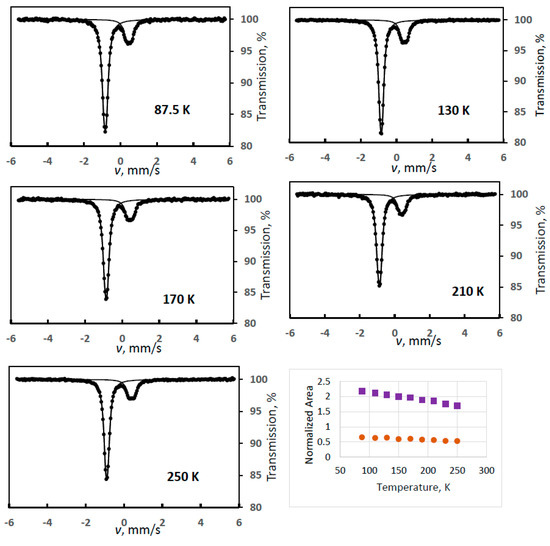
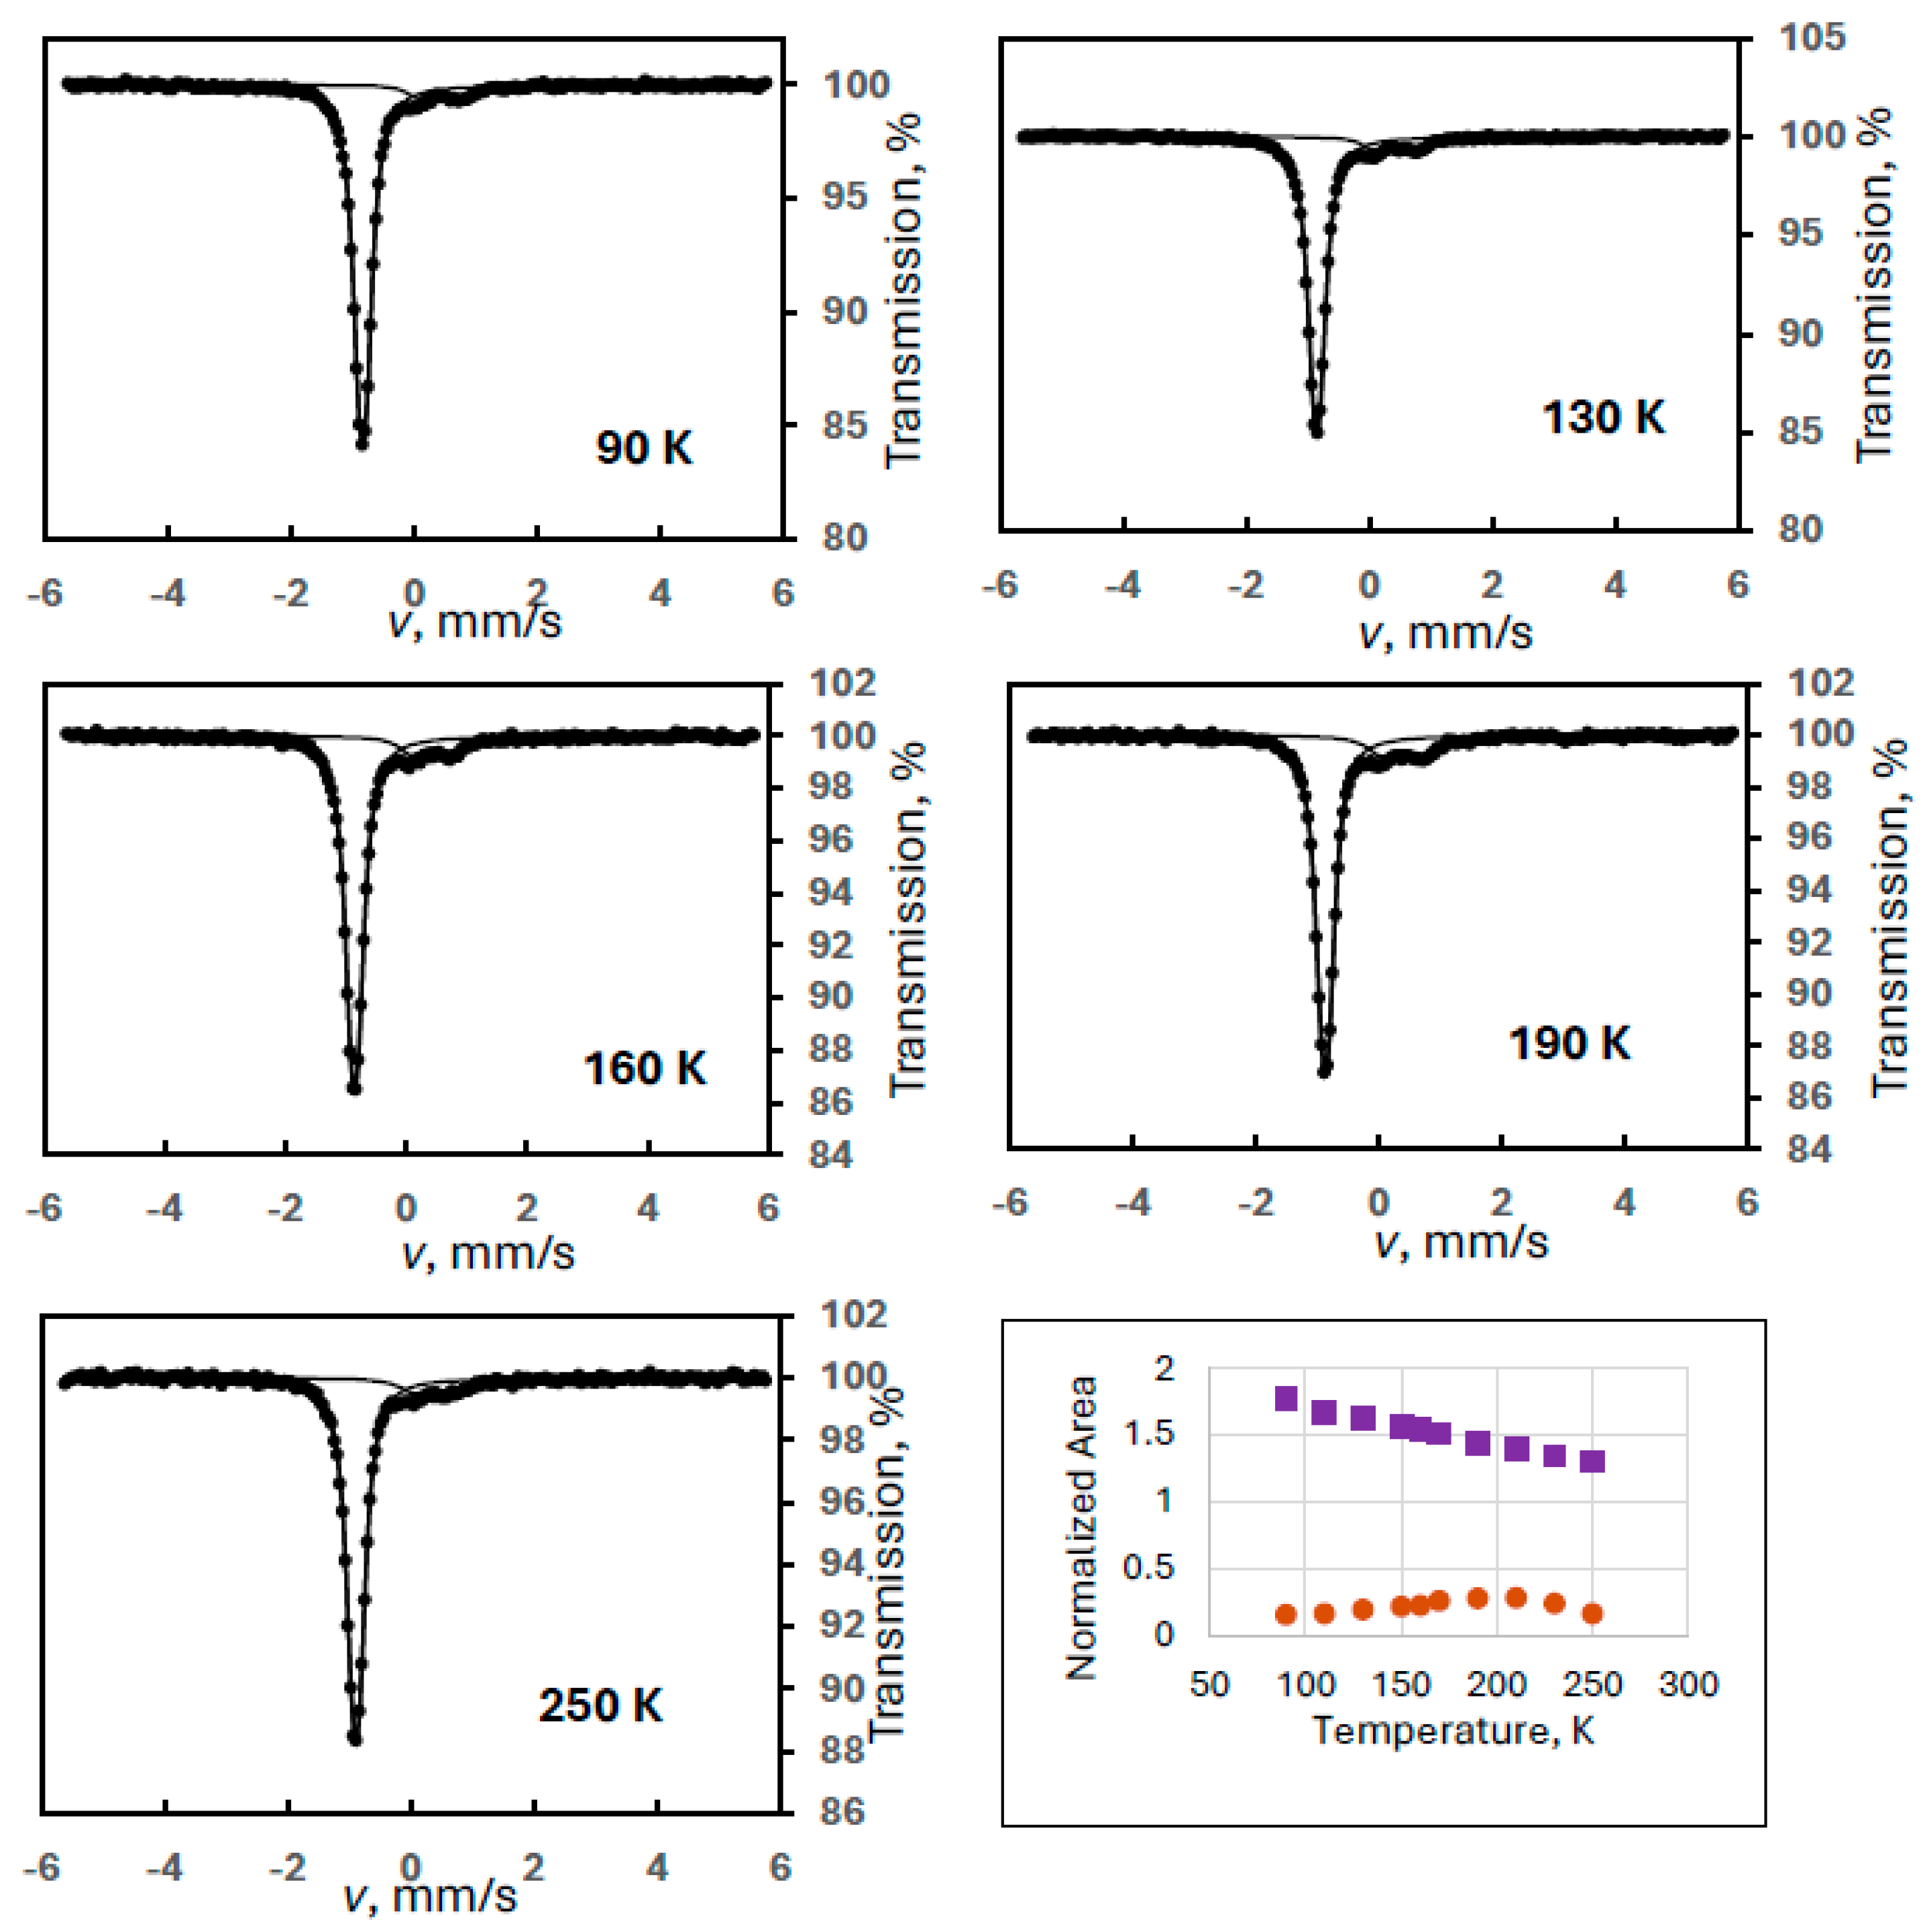
Figure 9.
Mössbauer spectra of a ferrate(VI) sample containing only FeIII(1) as a degradation product, recorded at the indicated temperatures (Experiment 8) together with the temperature variation of the normalized areas for ferrate(VI) (purple squares) and FeIII(1) (orange dots).
It is obvious that the spectra are free from any magnetic components. They constitute only the subspectra of the ferrate(VI) and its single degradation product FeIII(1). The evaluated Mössbauer parameters are shown in Table 3.
Table 3.
Mössbauer parameters found, in Experiment 8, for the ferrate(VI) and FeIII(1) species as a function of temperature. Isomer shifts are given relative to α-Fe at room temperature. Errors are ±1 in the last digit.
Plotting the normalized spectral areas as a function of temperature, both components showed regular behavior (Figure 9).
This was the first situation where calculating the Debye temperatures for the two spectral components ferrate(VI) and the iron(III) degradation product (FeIII(1)) was feasible.
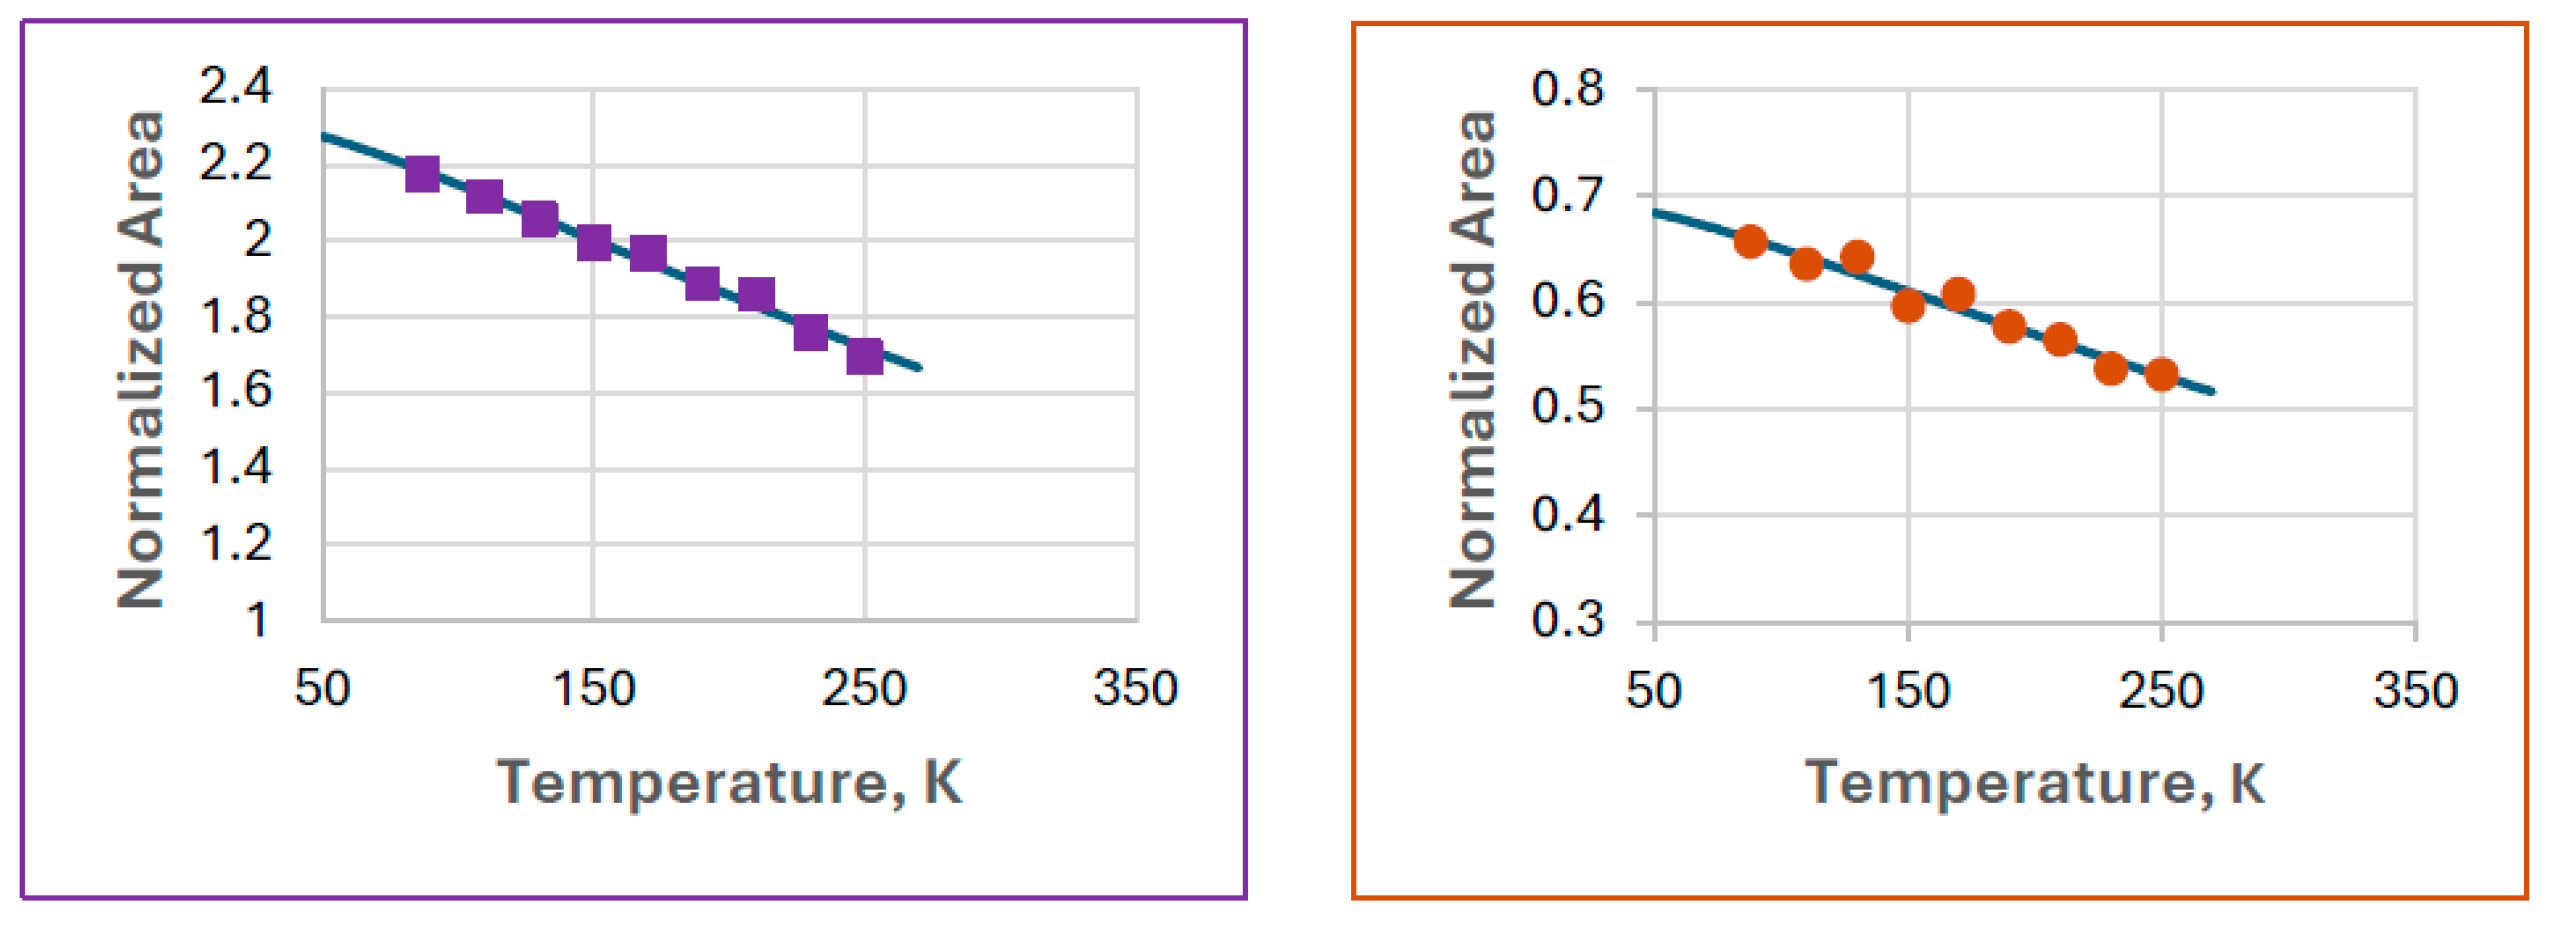
The Debye fits are shown in Figure 10.
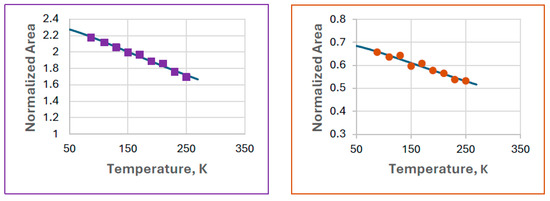
Figure 10.
Debye fits for ferrate(VI) (left) and FeIII(1) (right) observed in Experiment 8. The calculated Debye temperatures are 287(20) K and 300(63) K for ferrate(VI) and FeIII(1), respectively.
It is found that the difference in the Debye temperatures is not significant. Unfortunately, the calculated errors are high, which is due to the low spectral areas relative to the baseline. The respective Mössbauer–Lamb factors can be calculated from the Debye temperatures as shown in Table 4.
Table 4.
Mössbauer–Lamb factors (f-factors) calculated for some selected temperatures for ferrate(VI) according to Equation (2), based on ΘD = 287(20) K from Experiment 8 as well as from an average of 7 experiments (Experiments 1, 2, 3, 5, 6, 7, and 8; Exp. 4 is excluded due to only four measured temperature points), based on ΘD = 252(14) K, and for FeIII(1) based on ΘD = 300(60) K from Experiment 8.
It has to be mentioned that, as could be seen in the various experiments, the normalized spectrum area for the ferrate(VI) component was mostly regular, showing a more or less monotonous decrease with the temperature. Performing the Debye calculations for six more cases, the average Debye temperature for the ferrate(VI) was obtained as ΘD = 252(14) K, as shown in Table 2. These data confirm that neglecting the different Mössbauer–Lamb factors when measuring the molar ratio of iron in these two phases causes small error, at least at low temperature; it is comparable to the usual error of the calculation of the line areas in the Mössbauer spectra (2–3%).
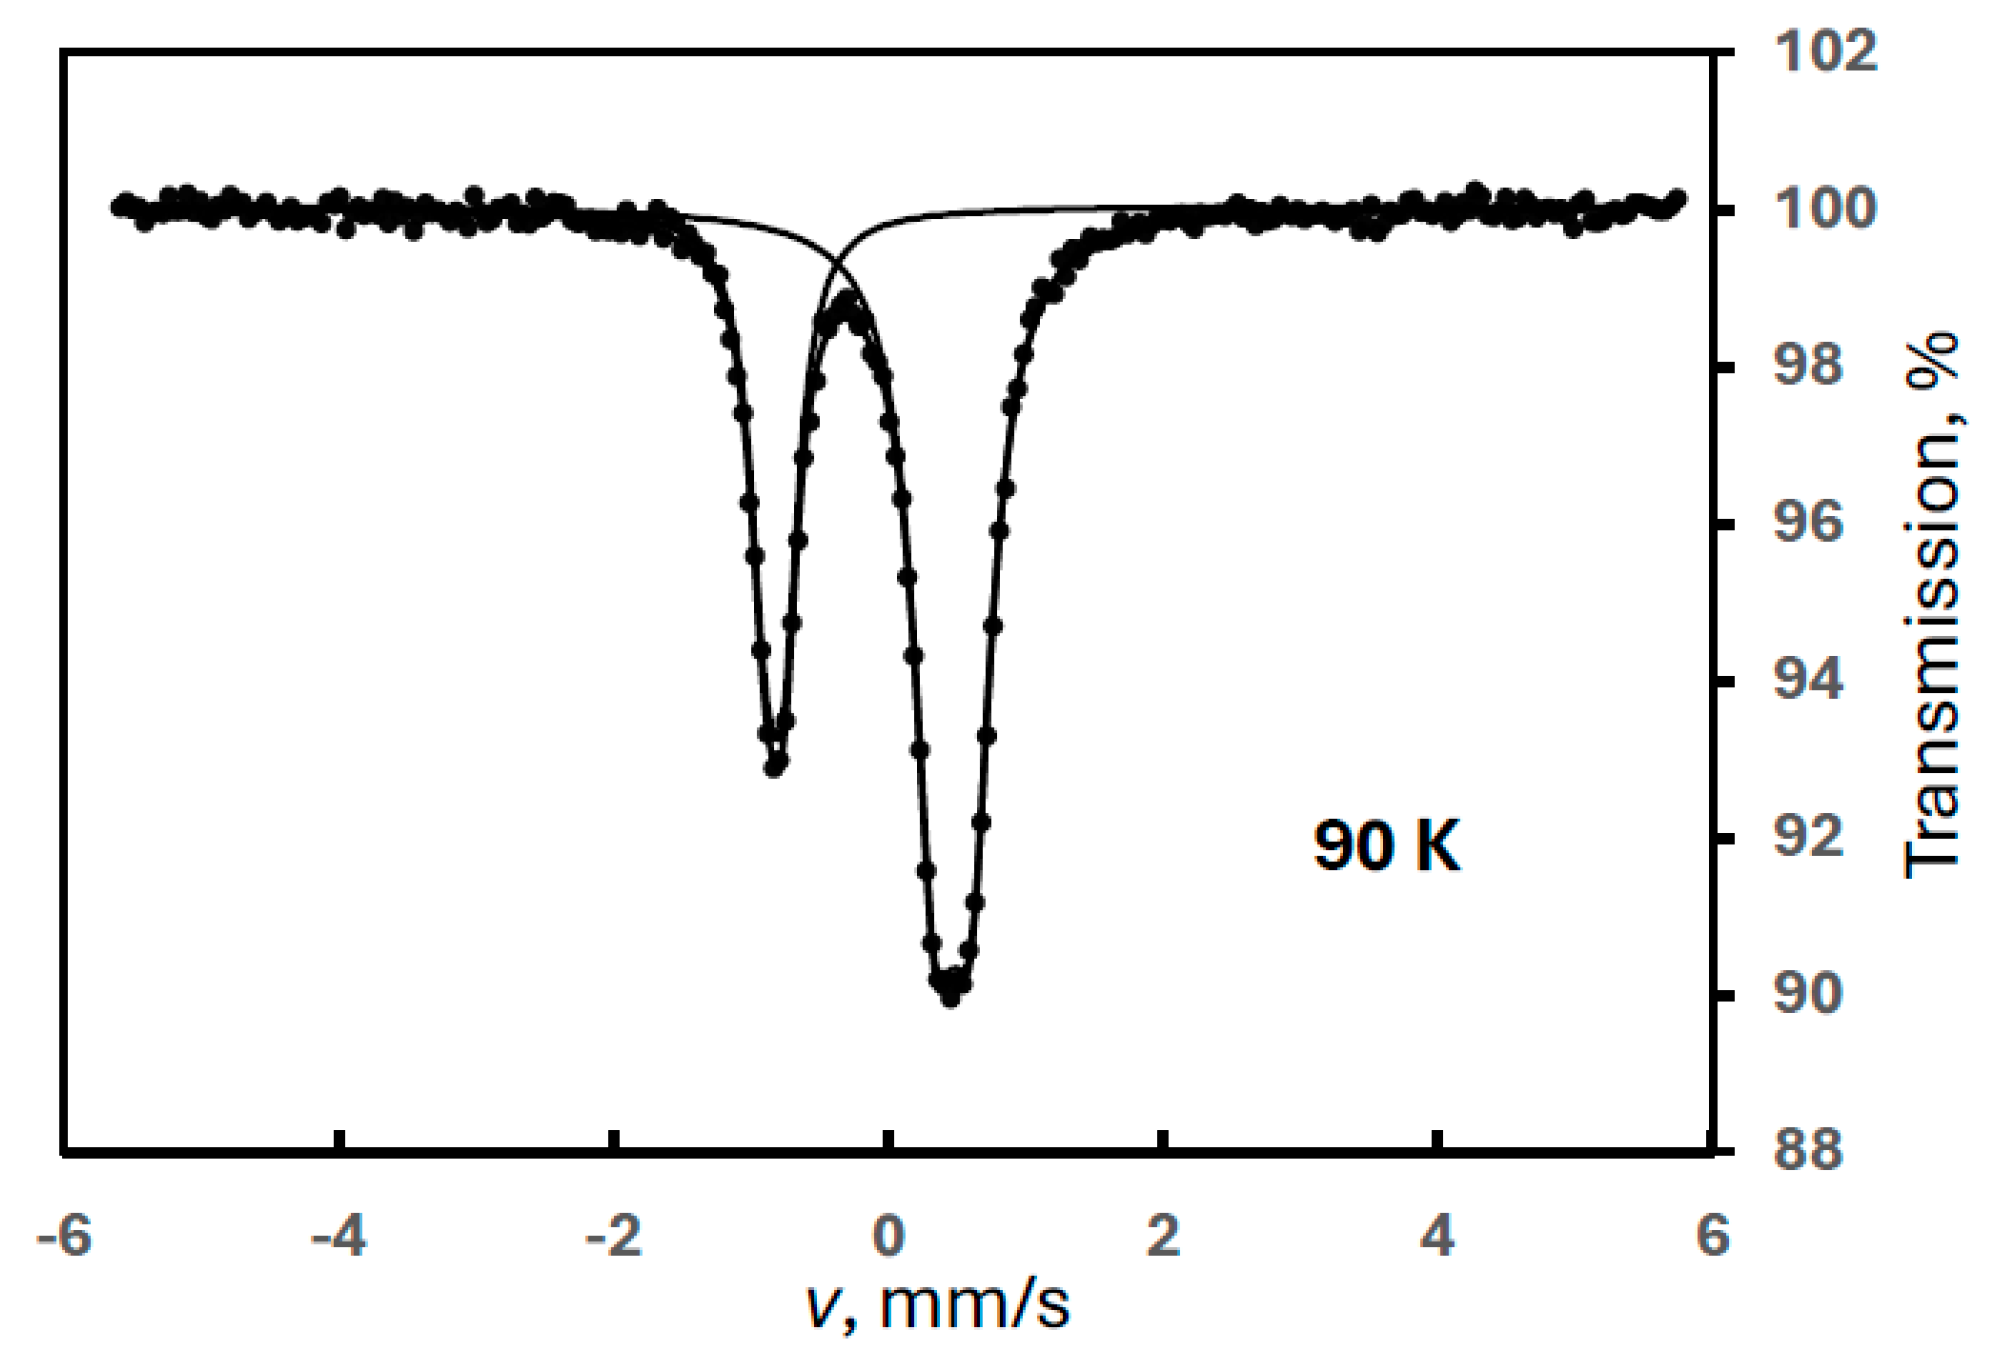
It is important to note that FeIII(1) was found later in a sample prepared after the previous experiments in a percentage as high as 70% (Figure 11)! This is a proof that FeIII(1) is a primary degradation product (its only, and presumably short-lived, precursor may be FeIII(3)), and most probably it is characteristic of the electrochemical synthesis.
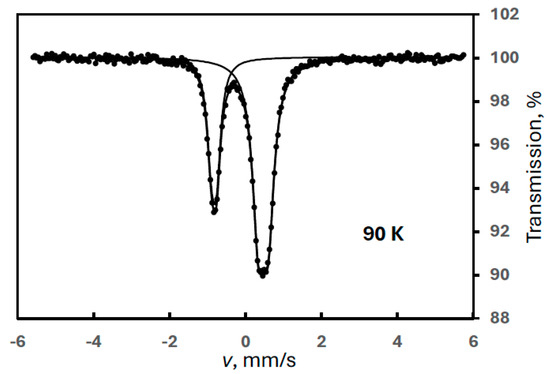
Figure 11.
Mössbauer spectrum of a ferrate(VI) sample, recorded at 90 K, containing the single FeIII(1) degradation product in a large quantity.
4. Conclusions
From the experiments performed, the following picture emerges.
We have confirmed that, out of the three different degradation products observed earlier in electrochemically produced potassium ferrate(VI), FeIII(1) and FeIII(2) form reproducibly, although rather unpredictably, in a particular synthesis. FeIII(3) was not observed in our present study. The assignments of these species are strongly supported by the following facts:
- (1)
- FeIII(1) can form in a large quantity as a single degradation product.
- (2)
- The experimental conditions during the synthesis provided a very high hydroxide concentration.
FeIII(3) is a hexahydroxo complex of iron(III), [Fe(OH)6]3−, that forms as a primary product in amorphous phase at extremely high OH−-concentrations, in practically saturated NaOH or KOH. It must be a short-lived species under crystallization conditions or a decrease in pH. At extremely high pH, this species converts into FeIII(1); this phase most probably is the potassium salt K3[Fe(OH)6]. The small quadrupole splitting observed in its Mössbauer spectrum (Δ = 0.26 mm/s) must be a lattice contribution in this crystalline phase. This phase can be considered as characteristic of the electrochemical synthesis because of the extremely high pH maintained in the anode cell.
A decrease in the pH (by dilution with water or contact with CO2) results in a transformation into FeIII(2), the most common degradation product of potassium ferrate(VI) in general. We should emphasize here that the actual experimental conditions and the possibly fast transformations of these species into each other make it almost unpredictable which degradation product would actually appear in the synthesized ferrate product. It is fairly logical to expect FeIII(1) to be the most abundant in electrochemical synthesis because a high pH is maintained in the wet product, and the samples are sealed, thereby keeping moisture and CO2 off the ferrate(VI).
We found that FeIII(2) is a common degradation product in dry potassium ferrate(VI) exposed to humid environments and in ferrate(VI) produced by anodic oxidation. On the basis of a literature comparison, it is iron(III) hydroxide, Fe(OH)3. This phase has a strong tendency to show superparamagnetism.
Regarding the quantitative determination of the ferrate(VI) and iron(III) content, we can conclude that the determination of the Debye temperature for FeIII(2) is substantially hindered by the superparamagnetic behavior of this phase with different blocking temperatures depending on the preparation and aging history of the actual sample. Further complication is caused by a phase transformation observed at around 180 K in one particular sample, which means that the Debye temperature itself is a function of temperature depending on the phase that actually exists at a particular temperature. Thus, improving the accuracy of the quantitative determination of this phase by calculating the Mössbauer–Lamb factors from the Debye temperature is not feasible for FeIII(2).
It is an important lesson to learn from these experiments that the selection of the optimal velocity range for the Mössbauer measurements is essential to see possible magnetically split spectral contributions.
The degradation product FeIII(1) proved to be unchanged in the temperature region 90–270 K, and the Debye temperature for this phase could be determined. Comparing the Debye temperatures for potassium ferrate(VI) and FeIII(1), it was found that the difference in the calculated Mössbauer–Lamb factors at low temperature is 2–5%. In a real synthesis situation where the ferrate(VI) content is in the 80–90% range, this correction is negligible, and using the spectral areas as a representation of the chemical quantities is appropriate for industrial applications.
On the basis of a large number of experiments, it is confirmed that the Mössbauer spectrum of potassium ferrate(VI) is not free of quadrupole interaction; its quadrupole splitting is 0.12(1) mm/s, originating most probably from lattice contribution (orthorhombic structure).
Author Contributions
Conceptualization, Z.H., G.G.L. and J.L.; methodology, Z.H., S.S., K.A.B. and E.K.; formal analysis, Z.H., S.S., K.A.B., E.K., D.J.N. and L.T.; investigation, Z.H., J.L., K.A.B., D.J.N., M.K. and L.T.; writing—original draft preparation, Z.H., S.S., E.K. and L.T.; writing—review and editing, Z.H., G.G.L., S.S., K.A.B., E.K., G.Z., M.K. and L.T.; visualization, Z.H., S.S. and L.T.; supervision, Z.H. and J.L.; project administration, G.G.L., G.Z. and J.L. All authors have read and agreed to the published version of the manuscript.
Funding
This work was performed in the frame of the 2018-1.1.2-KFI-2018-00123 project, implemented with the support provided by the National Research, Development and Innovation Fund of Hungary, financed under the 2018-1.1.2-KFI funding scheme. M. Kuti and G.G. Láng are thankful for grants from the National Research, Development, and Innovation Office (NKFIH, Hungary), grant nos. K129210 and VEKOP-2.3.2-16-2017-00013.
Data Availability Statement
Dataset available on request from the authors.
Acknowledgments
The authors are thankful to István Virág for writing the code “DebyeFit” for the calculation of the Debye temperatures from the series of Mössbauer spectra.
Conflicts of Interest
Authors Miklós Kuti and József Lendvai were employed by the company IMSYS Engineering Service Ltd. The remaining authors declare that the research was conducted in the absence of any commercial or financial relationships that could be construed as a potential conflict of interest.
References
- Jiang, W.; Chen, L.; Batchu, S.R.; Gardinali, P.R.; Jasa, L.; Marsalek, B.; Zboril, R.; Dionysiou, D.D.; O’Shea, K.E.; Sharma, V.K. Oxidation of microcystin-LR by ferrate(VI): Kinetics, degradation pathways, and toxicity assessments. Environ. Sci. Technol. 2014, 48, 12164–12172. [Google Scholar] [CrossRef]
- Sharma, V.K.; Kazama, F.; Hu, J.Y.; Ray, A.K. Ferrates (iron(VI) and iron(V)): Environmentally friendly oxidants and disinfectants. J. Water Health 2005, 3, 45–58. [Google Scholar] [CrossRef] [PubMed]
- Sharma, V.K. Ferrate(VI) and ferrate(V) oxidation of organic compounds: Kinetics and mechanism. Coord. Chem. Rev. 2013, 257, 495–510. [Google Scholar] [CrossRef]
- Lee, Y.; Zimmermann, S.G.; Kieu, A.T.; Von Gunten, U. Ferrate (Fe(VI)) application for municipal wastewater treatment: A novel process for simultaneous micropollutant oxidation and phosphate removal. Environ. Sci. Technol. 2009, 43, 3831–3838. [Google Scholar] [CrossRef] [PubMed]
- Lee, Y.-H.; Yu, M.-R.; Chang, Y.-Y.; Kang, S.-H.; Yang, J.-K. Oxidation of sulphide in abandoned mine tailings by ferrate. Environ. Technol. 2015, 36, 254–259. [Google Scholar] [CrossRef] [PubMed]
- Anquandah, G.A.K.; Sharma, V.K.; Knight, D.A.; Batchu, S.R.; Gardinali, P.R. Oxidation of trimethoprim by ferrate(VI):kinetics, products, and antibacterial activity. Environ. Sci. Technol. 2011, 45, 10575–10581. [Google Scholar] [CrossRef]
- Sharma, V.K.; Anquandah, G.A.K.; Nesnas, N. Kinetics of the oxidation of endocrine disruptor nonylphenol by ferrate(VI). Environ. Chem. Lett. 2008, 7, 115–119. [Google Scholar] [CrossRef]
- Ma, L.; Lam, W.W.Y.; Lo, P.-K.; Lau, K.-C.; Lau, T.-C. Ca2+-Induced Oxidation Generation by FeO42− at pH = 9–10. Angew. Chem. Int. Ed. 2016, 55, 3012–3016. Available online: https://onlinelibrary.wiley.com/doi/10.1002/anie.201510156 (accessed on 17 September 2024). [CrossRef]
- Prucek, R.; Tucek, J.; Kolarık, J.; Huskova, I.; Filip, J.; Varma, R.S.; Sharma, V.K.; Zboril, R. Ferrate(VI)-prompted removal of metals in aqueous media: Mechanistic delineation of enhanced efficiency via metal entrenchment in magnetic oxides. Environ. Sci. Technol. 2015, 49, 2319–2327. [Google Scholar] [CrossRef]
- Yngard, R.A.; Sharma, V.K.; Filip, J.; Zboril, R. Ferrate(VI) oxidation of weak-acid dissociable cyanides. Environ. Sci. Technol. 2008, 42, 3005–3010. [Google Scholar] [CrossRef]
- Sharma, V.K. Oxidation of inorganic compounds by Ferrate(VI) and Ferrate(V): One-electron and two-electron transfer steps. Environ. Sci. Technol. 2010, 44, 5148–5152. [Google Scholar] [CrossRef] [PubMed]
- Filip, J.; Yngard, R.A.; Siskova, K.; Marusak, Z.; Ettler, V.; Sajdl, P.; Sharma, V.K.; Zboril, R. Mechanisms and efficiency of the simultaneous removal of metals and cyanides by using ferrate(VI): Crucial roles of nanocrystalline iron(III) oxyhydroxides and metal carbonates. Chem.-Eur. J. 2011, 17, 10097–10105. [Google Scholar] [CrossRef] [PubMed]
- Prucek, R.; Tucek, J.; Kolarık, J.; Filip, J.; Marusak, Z.; Sharma, V.K.; Zboril, R. Ferrate(VI)-induced arsenite and arsenate removal by in situ structural incorporation into magnetic iron(III) oxide nanoparticles. Environ. Sci. Technol. 2013, 47, 3283–3292. [Google Scholar] [CrossRef]
- Sharma, V.K.; Jiang, J.-Q.; Buzek, K. (Eds.) Proceedings of the International Symposium on Innovative Ferrate(VI) Technology in Water and Waste water treatment; ICT Press, Inst. Chem. Technology: Prague, Czech Republic, 2004; ISBN 80-7080-540-4. [Google Scholar]
- Sharma, V.K. (Ed.) Ferrates: Synthesis, Properties, and Applications in Water and Wastewater Treatment. In ACS Symposium Series 985; American Chemical Society: Washington, DC, USA, 2008. [Google Scholar] [CrossRef]
- Neveux, N.; Kanari, N.; Aubertin, N.; Evrard, O. Synthesis of stabilized potassium ferrate and its applications in water treatment. In EPD Congress 1999; Mishra, B., Mishra, B., Eds.; TMS: Pittsburg, PA, USA, 1999; pp. 215–224. [Google Scholar]
- Homonnay, Z.; Kuzmann, E.; Kuti, M.; Láng, G.G.; Záray, G.; Lendvai, J. Mössbauer study of long-term stability of alkali-poor solid potassium ferrate(VI) as a potential oxidation agent for industrial wastewater treatment. Hyp. Interact. 2022, 243, 22. [Google Scholar] [CrossRef]
- Cheung, P.C.W.; Williams, D.R.; Barrett, J.; Barker, J.; Kirk, D.W. On the Origins of Some Spectroscopic Properties of “Purple Iron” (the Tetraoxoferrate(VI) Ion) and Its Pourbaix Safe-Space. Molecules 2021, 26, 5266. [Google Scholar] [CrossRef]
- Scholder, R.; von Bunsen, H.; Zeiss, W. Über Orthoferrate(IV). Z. Anorg. Allg. Chem. 1956, 283, 330–337. [Google Scholar] [CrossRef]
- Scholder, R.; Kindervater, F.; Zeiss, W. Über Metaferrate(IV). Z. Anorg. Allg. Chem. 1956, 283, 338–345. [Google Scholar] [CrossRef]
- Kokarovtseva, I.G.; Belyaev, I.N.; Semenyakova, L.V. Oxygen Compounds of Iron(VI,V,IV). Russ. Chem. Rev. 1972, 41, 929–937. [Google Scholar] [CrossRef]
- Jeannot, C.; Malaman, B.; Gerardin, R.; Oulladiaf, B. Synthesis, Crystal and Magnetic Structures of the Sodium Ferrate(IV) Na4FeO4 Studied by Neutron Diffraction and Mössbauer Techniques. J. Solid State Chem. 2002, 165, 266–277. [Google Scholar] [CrossRef]
- Sharma, V.K.; Perfiliev, Y.D.; Zboril, R.; Machala, L.; Wynter, C.I. Ferrates(IV, V, and VI): Mössbauer Spectroscopy Characterization, In Mössbauer Spectroscopy: Applications in Chemistry, Biology, and Nanotechnology; Sharma, V.K., Klingelhöfer, G., Nishida, T., Eds.; John Wiley & Sons Inc.: Hoboken, NJ, USA, 2013; pp. 505–520. [Google Scholar] [CrossRef]
- Kopelev, N.S.; Perfiliev, Y.D.; Kiselev, Y.M. Mössbauer study of sodium ferrates(IV) and (VI). J. Radioanal. Nucl. Chem. 1992, 162, 239–251. [Google Scholar] [CrossRef]
- Kopelev, N.; Perfiliev, Y.; Kiselev, Y. Mössbauer spectroscopy of iron oxocompounds in higher oxidation states. J. Radioanal. Nucl. Chem. Artic. 1992, 157, 401–414. [Google Scholar] [CrossRef]
- Machala, L.; Zboril, R.; Sharma, V.K.; Filip, J.; Schneeweiss, O.; Homonnay, Z. Mössbauer Characterization and in situ Monitoring of Thermal Decomposition of Potassium Ferrate(VI), K2FeO4 in Static Air Conditions. J. Phys. Chem. B 2007, 111, 4280–4286. Available online: https://pubs.acs.org/doi/10.1021/jp068272x (accessed on 17 September 2024). [CrossRef] [PubMed]
- Machala, L.; Zboril, R.; Sharma, V.K.; Homonnay, Z. Decomposition of Potassium Ferrate(VI) and Potassium Ferrate(III): Insitu Mössbauer Spectroscopy Approach. AIP Conf. Proc. 2008, 1070, 114–121. [Google Scholar] [CrossRef]
- Machala, L.; Zboril, R.; Sharma, V.K.; Filip, J.; Jancik, D.; Homonnay, Z. Transformation of Solid Potassium Ferrate(VI) (K2FeO4): Mechanism and Kinetic Effect of Air Humidity. Eur. J. Inorg. Chem. 2009, 2009, 1060–1067. [Google Scholar] [CrossRef]
- Sharma, V.K.; Homonnay, Z.; Siskova, K.; Machala, L.; Zboril, R. Mössbauer investigation of the reaction of ferrate(VI) with sulfamethoxazole and aniline in alkaline medium. Hyp. Interact. 2014, 224, 7–13. [Google Scholar] [CrossRef]
- Sharma, V.K.; Zboril, R. Ferryl and Ferrate Species: Mössbauer Spectroscopy Investigation. Croat. Chem. Acta 2015, 88, 363–368. [Google Scholar] [CrossRef]
- Novak, P.; Kolar, M.; Machala, L.; Siskova, K.M.; Karlicky, F.; Petr, M.; Zboril, R. Transformations of ferrates(IV,V,VI) in liquids: Mössbauer spectroscopy of frozen solutions. Phys. Chem. Chem. Phys. 2018, 20, 30247–30256. [Google Scholar] [CrossRef]
- Cornell, R.M.; Schwertmann, U. The Iron Oxides: Structure, Properties, Reactions, Occurences; Wiley-VCH Verlag GmbH & Co. KGaA: Darmstadt, Germany, 2003. [Google Scholar] [CrossRef]
- Schatz, G.; Weidinger, A. Nuclear Condensed Matter Physics: Nuclear Methods and Applications; John Wiley and Sons: Hoboken, NJ, USA, 1996. [Google Scholar]
- Láng, G.G.; Varga, J.; Záray, G.; Varga, I.P. Equipment and procedure for the preparation of sodium and potassium ferrate solutions by electrochemical method (Berendezés és eljárás nátrium-és kálium-ferrát oldatok elektrokémiai módszerrel történő előállítására), Hungarian patent, registration number 231043, case number P1600474 (2020). Szabadalmi Közlöny és Védjegyértesítő 123(2) P10-P11 (in Hungarian), 2018.
- Láng, G.G.; Varga, J.; Lendvai, J. Electrochemical cluster system for the production of ferrate/Elektrokémiai klaszter rendszer ferrát előállítására, HU Patent, registration number 0,005,559, Szabadalmi Közlöny és Védjegyértesítő 128 (4), U26-U27 (in Hungarian), 2023.
- Láng, G.G.; Varga, J.; Záray, G.; Varga, I.P. Polypropylene or polyethylene based separator or use in electrochemical cells for producing alkali metal ferrates, European patent, registration number 3983577, case number 20768089.3 (2020). J. Intellect. Prop. Off. Irel. 2023, 2494, 1820. [Google Scholar]
- Zsubrits, Á.; Kuti, M.; Fekete, É.; Ujvári, M.; Láng, G.G. Where do ferrate ions form? A dual dynamic voltammetry study. Electrochem. Commun. 2023, 156, 107587. [Google Scholar] [CrossRef]
- Dedushenko, S.K.; Perfiliev, Y.D.; Golubev, A.M.; Melnikov, P.; Corbi, P.P.; Saprykin, A.A. X-Ray and Mössbauer Study of Mixed Potassium-Sodium Ferrate (VI). In Hyperfine Interactions (C); Thomas, M.F., Williams, J.M., Gibb, T.C., Eds.; Springer: Dordrecht, The Netherlands, 2002. [Google Scholar] [CrossRef]
- Dedushenko, S.K.; Perfiliev, Y.D.; Rusakov, V.S.; Gapochka, A.M. Quadrupole interactions in tetraoxoferrates (VI). Hyp. Interact. 2013, 222, 67–72. [Google Scholar] [CrossRef]
- Kamnev, A.A.; Perfiliev, Y.D.; Angelov, V. Mössbauer study of solid phases formed in highly alkaline electrolytes containing ferric hydroxo complexes: The effect of aging. Electrochim. Acta 1995, 40, 1005–1011. [Google Scholar] [CrossRef]
- Kamnev, A.A.; Perfiliev, Y.D.; Angelov, V. Coordination symmetry of solid-phase ferric hydroxo complexes formed in strong alkali: An in situ Mössbauer study. Polyhedron 1994, 13, 2447–2450. [Google Scholar] [CrossRef]
- Kamnev, A.A.; Ezhov, B.B.; Kopelev, N.S.; Kiselev, Y.M.; Perfiliev, Y.D. Mössbauer study of ferric hydroxides and hydroxo complexes and their behaviour in alkaline electrolytes. Electrochim. Acta 1991, 36, 1253–1257. [Google Scholar] [CrossRef]
- Greenwood, N.N.; Gibb, T.C. Mössbauer Spectroscopy; Chapman and Hall: London, UK, 1971. [Google Scholar]

Disclaimer/Publisher’s Note: The statements, opinions and data contained in all publications are solely those of the individual author(s) and contributor(s) and not of MDPI and/or the editor(s). MDPI and/or the editor(s) disclaim responsibility for any injury to people or property resulting from any ideas, methods, instructions or products referred to in the content. |
© 2024 by the authors. Licensee MDPI, Basel, Switzerland. This article is an open access article distributed under the terms and conditions of the Creative Commons Attribution (CC BY) license (https://creativecommons.org/licenses/by/4.0/).