Article

Physicochemical Properties and Nutritional Relevance of Rice Beverages Available on the Market

by
Katarzyna Najman
1,
Paulina Ponikowska
1,
Anna Sadowska
1,*,
Ewelina Hallmann
1,2,
Grażyna Wasiak-Zys
1,
Franciszek Świderski
1 and
Krzysztof Buczak
3
1
Department of Functional and Organic Food, Institute of Human Nutrition Sciences, Warsaw University of Life Sciences, Nowoursynowska 159c, 02-776 Warsaw, Poland
2
Bioeconomy Research Institute, Agriculture Academy, Vytautas Magnus University, Donelaicio 58, 44248 Kaunas, Lithuania
3
Department of Surgery, Faculty of Veterinary Medicine, Wroclaw University of Environmental and Life Science, Pl. Grunwadzki 51, 50-366 Wroclaw, Poland
*
Author to whom correspondence should be addressed.
Appl. Sci. 2024, 14(19), 9150; https://doi.org/10.3390/app14199150
Submission received: 19 June 2024 / Revised: 22 September 2024 / Accepted: 30 September 2024 / Published: 9 October 2024
(This article belongs to the Section Applied Biosciences and Bioengineering)

Abstract

:
Recently, more consumers have reached for plant-based milk substitutes, mainly for health, dietary, and flavour reasons. This study aimed to evaluate the physicochemical and bioactive properties and sensory profile of 10 selected rice drinks available on the EU market. Assessment of the physicochemical characteristics included measurement of soluble solids, pH, osmolality, foaming properties and colour parameters. Analysis of bioactive compounds involved the determination of polyphenolic compounds and antioxidant activity. Based on the manufacturer’s data, the composition and nutritional value of the above-mentioned beverages were also analysed in this study. The tested beverages were characterised by a low fat content of 0.6–1.3 g/100 mL, derived mainly from added sunflower oil, but are a good source of energy (energy value of 37–55 kcal/100 mL), derived mainly from naturally occurring carbohydrates whose content ranged from 8.0–11.0 g/100 mL. The protein content of all rice drinks was shallow, not exceeding 0.5 g/100 mL. Of the ten rice drinks analysed, in only two were vitamins B12 and D added (0.38 μg/100 mL and 0.75 μg/100 mL, respectively) and in only three was calcium (120 mg/100 mL) added. In evaluating the physicochemical characteristics, the drinks showed a pH close to neutral (mean 6.85 ± 0.01). The average soluble solids content was about 11%, which was determined by the carbohydrate content. The osmolality of the beverages averaged 324.73 ± 70.17 mOsm/kg H2O, with four beverages classifiable as hypertonic ones (osmolality > 330 mOsm/kg H2O), three as isotonic ones (with osmolality between 270–330 mOsm/kg H2O), and three as hypotonic beverages (osmolality < 270 mOsm/kg H2O). Only two rice drinks evaluated in this study showed foaming properties. The high whiteness index (81.79 ± 2.55) indicated high white colour saturation of the tested beverages. The rice drinks were characterised by a relatively diverse sensory quality regarding aroma and flavour notes. The overall sensory quality was rated highest for the beverages with the highest sugar content. The tested beverages were characterised by a low content of total polyphenols (average 1.40 ± 0.62 mg GAE/100 mL) and relatively high antioxidant activity (average 418.33 ± 59.65 µM TEAC/100 mL). Based on the research conducted and the analysis of the manufacturer’s data, it can be concluded that the rice drinks studied in this paper can be included in the daily diet, providing a rehydrating beverage that shows free radical-neutralizing properties and provides carbohydrates. At the same time, it should be highlighted that the studied drinks have a low nutritional value and cannot be recommended as milk substitutes due to low protein levels and lack of milk-specific vitamins and minerals.

1. Introduction

Milk is a complete nutritional product consisting of proteins, fats, sugars, and minerals essential for health. However, it is not a food assimilated by every person and is therefore often excluded from the diet. According to the literature, the main reasons for consumers replacing milk with plant-based beverages are allergies (to cow’s milk proteins), food intolerances (lactose), the declaration of plant-based diets, and the perception of these products as health-beneficial milk alternatives (e.g., by people suffering from hypercholesterolemia) [1]. Several studies highlight the possibility of including plant-based beverages as a sustainability product. According to Tukker et al. (2011) [2], replacing 0.25 kg of milk with the same amount of organic soy beverage can save 0.25 kg of CO2 equivalent per capita per day [1].
Regardless of the reasons for consuming plant-based beverages, they are mostly considered milk alternatives and are compared with this group of products [1]. Milk is a natural source of many nutrients, such as high-quality protein, calcium, phosphorus, potassium, zinc, and vitamins A, D, and B. Vegetable beverages, even those very similar in composition to cow’s milk, differ in nutritional value [3], contain lower protein content, provide only a portion of the essential amino acids, and often do not contain added vitamins and minerals found in milk (enrichment with calcium and vitamins B12, A and D is used occasionally). Due to differences in raw material composition, plant-based beverages often exhibit high sweetness from using sweeteners to improve palatability [4]. The nutritional profile of milk substitutes depends not only on the origin of the plant’s raw material but also on the production process and the degree of enrichment [5]. In the case of plant-based beverages not enriched in minerals and vitamins, their consumption can lead to nutritional deficiencies and, thus, the need for dietary supplementation of essential deficient components [6]. Therefore, these beverages cannot be a complete replacement for cow’s milk. They can supplement or expand the diet with nutrients and bioactive compounds. These beverages are a source of specific bioactive compounds specific to the particular raw material. For example, soy beverages contain isoflavones and phytosterols that lower cholesterol [7]; oat beverage has the protective effect of beta-glucan, which lowers blood cholesterol [8]; almond beverage contains arabinose with probiotic properties [9], and coconut beverage contains lauric acid, which supports immunity and brain development [10]. Plant-based beverages containing no lactose or cholesterol also have a lower energy value than cow’s milk. For those who are replacing milk with plant-based beverages, it should be essential to choose the product not only in terms of the raw material from which it is made but also in terms of the optimal content of nutrients characteristic of milk [11] so that as much as possible the product can supplement the diet with the ingredients present in milk. Plant-based beverages are products whose presence in the diet is worth considering, but this should be conducted with a full knowledge of their advantages and disadvantages. Any milk alternative can be part of a well-balanced diet if the individual nutritional needs of the body are considered, as well as the variety of habitually consumed meals.
Given the growing consumer demand for plant-based beverages, developing new products is essential in today’s economy. Food manufacturers, meeting consumer expectations and market needs, are developing the production of plant-based beverages made from rice, almonds, soy, coconut, oats, or nuts, among others [12,13]. These beverages are liquids obtained by crushing plant material and subjecting it to homogenisation, ultimately leading to disintegration and uniformity of particle size so that the final product resembles milk in appearance and consistency [14]. However, these beverages have a specific aroma and flavour profile, depending on the raw material used in production [15]. Rice drink is one of the most hypoallergenic dairy-free beverages. It can be an alternative for people with allergies to soy or almonds [16,17]. It is rich in carbohydrates (23–27 g/100 mL), while proteins and fats are in small amounts (0–2 g/100 mL and 2–2.64 g/100 mL, respectively). As a result of the processing processes that lead to the breakdown of carbohydrates into sugars, this drink is characterised by a sweet taste [18]. It contains antioxidants such as tocopherol, tocotrienols, γ-oryzanol, and phenolic compounds. These substances protect against chronic cardiovascular diseases, have anti-cancer effects, and help suppress free radicals [19]. The majority of rice drink producers utilize a basic formula comprising water, ground rice, vegetable oil (such as sunflower or rapeseed), and salt as the primary ingredients. The initial step in the industrial production of rice drinks is the full or partial milling of the rice grains. Partial milling entails the removal of the husk, yielding brown rice. In contrast, full milling, which involves the removal of the husk, germ, and bran, results in white rice. While milling the grain can result in an optimal texture, the process also results in the loss of valuable components, including protein, fiber, vitamins, and minerals [20]. Subsequently, the milled rice is combined with water and then filtered (in order to eliminate excessively coarse particles). Subsequently, the beverage is treated with enzymes to partially break down the starch and facilitate slurry formation. Once the optimal viscosity has been reached, additional ingredients, including oil, vitamins, salt, minerals, stabilizers, sweeteners, and flavourings may be incorporated into the resulting mass. The final step is the homogenisation process, which results in the formation of a creamy, stable emulsion of the rice drink [21].
In light of the growing interest in plant-based beverages as cow’s milk substitutes and the increasing diversity of such products on the market, this study aimed to characterize the composition and nutritional value, evaluate the physicochemical and sensory parameters, and assess the total polyphenol content and antioxidant properties of 10 selected rice beverages currently available in the EU.

2. Materials and Methods

2.1. Materials

The research material used in this study consisted of 10 rice drinks from various producers available on the EU market, each in 3 replicates. Table 1 below summarises all the market products used in this study, considering their elemental composition (as declared by the manufacturer).

2.2. Methods

2.2.1. Analysis of the Composition and Nutritional Value of Rice Drink

This analysis was carried out based on the manufacturers’ data on the labels of the studied beverages.

2.2.2. Physicochemical Properties of Rice Drinks

pH

The pH was determined using a potentiometric method using a pH meter (Elmetron CP-511 pH-meter, Zabrze, Poland). Approximately 20 mL of each of the rice beverages under testing was transferred into separate 50 mL glass beakers, the pH-meter probe was immersed, and once the result stabilised, the pH value was read at approximately 20 °C. Measurements were taken three times for each beverage sample tested.

Soluble Solids Content

The soluble solids content was measured using an Abbe refractometer using the refractometric method described in PN-EN 12143:2000 [22], which is based on the measurement of the refractive index of the test material. After thorough mixing, a small amount of each of the tested rice drinks was transferred with a glass dipstick to a refractometer prism, spread, closed, illuminated, and the soluble solids content (expressed in %) was read off the sugar scale at approximately 20 °C. Measurements were taken three times for each sample.

Osmolality

Osmolality determination was carried out using an osmometer (Osmometer Kri-oskop 800CL, TridentMed, Warsaw, Poland) to measure the crystallisation temperature of the subcooled solution. After mixing, 100 µL of each of the tested rice beverages was taken into plastic osmometer tubes, placed in a measuring head with a thermistor, and inserted into a cooling chamber. Once the specified subcooling temperature was reached and crystallisation was initiated, the heat of crystallisation released from the sample was automatically calculated and displayed as mOsm/kg H2O. Measurements were taken three times for each beverage sample tested.

Foaming Properties and Stability of the Foam Produced

In a plastic measuring cup, 100 g of rice drink was weighed on an analytical balance and mixed for 5 min with a kitchen mixer on the highest speed to produce foam. Immediately after whisking, the volume of foam formed was read in cm3. The samples were left at a temperature of about 20 °C for 30 min to determine the stability of the foam, after which the retained volume was read (mL). The foaming properties and foam stability of each of the rice beverages tested were determined in triplicate.

2.2.3. Sensory Evaluation

A detailed sensory characterisation of the rice drinks was carried out using the Quantitative Descriptive Profile (QDP) method according to Stone and Sidel (1985) [23], using the analytical procedure described in the PN-EN ISO 13299:2016-05 [24]. According to this procedure, members of the evaluation team, in a preliminary procedure, familiarised themselves with the samples and individually characterised the unit distinctions of texture, smell, and flavour of the samples. All evaluators discussed these distinguishing characteristics to obtain a uniform understanding of them, and their definitions and terminology were agreed upon. For the profile analysis of the rice drinks, 17 quality attributes were selected, the intensity of which was expressed in conventional units [a.u.]. Each sample was analysed in two independent repetitions by ten experts, and the basis for the average results was 20 unit evaluations. Sensory evaluation of the samples using the profile method was carried out by a 10-member team of evaluators qualified as evaluators–experts according to PN-EN ISO 8586:2014-03 [25] and with appropriate methodological preparation (theoretical and practical) in sensory methods. Unit samples of 30 mL were placed in pre-prepared and coded plastic containers and then covered with lids. Sample sets for each assessor were coded individually and presented in a random order. Each assessor received five samples assessed in two independent sessions in the profile assessment.

2.2.4. L*a*b* Colour Measurements and White Index (WI)

Colour was measured at approximately 20 °C using a colourimeter (Konica Minolta CR-400, Konica Minolta, BSP, Tokyo, Japan). After thorough mixing, approximately 10 mL of each of the tested rice beverages was transferred to a glass measuring pan (60 mm diameter); the pan was placed on the tip of the measuring head, and after measurement, the results were read out for the three parameters of the CIE Lab colorimetric colour space model (L-brightness, +a-red, −a-green, +b-yellow, −b-blue). Measurements were taken in triplicate for each beverage sample tested. The whiteness index (WI) for all rice beverages was calculated from the ground L*a*b* measurement results using the following formula: WI = (ΔL2 + Δa2 + Δb2) × 0.5 [26].

2.2.5. Total Polyphenol Content

The determination was performed spectrophotometrically using the Folin-Ciocalteu reagent [27]. After thorough mixing, 3.0 mL of each of the tested rice beverages was taken into 50 mL flasks, then 2.5 mL of Folin-Ciocalteu reagent and 5.0 mL of 20% sodium carbonate were added, topped up with distilled water to the mark, and then incubated at approximately 20 °C without light for 60 min. After incubation, the absorbance of the samples was measured at λ = 750 nm in a spectrophotometer (Helios Gamma 9423 UVG 1000E UV-VIS Spectrophotometer, Thermo Spectronic, Waltham, MA, USA). The results, after taking into account the dilutions used, were expressed in mg GAE/100 mL (GAE—Gallic Acid Equivalent), based on the calibration curve for the standard substance (i.e., gallic acid; y = 2.1297x + 0.1314, R2 = 0.9997). The determination was carried out in triplicate for each beverage sample tested.

2.2.6. Antioxidant Activity

The determination was carried out using a spectrophotometric method using ABTS-+ cation radicals [28]. To determine the antioxidant activity, 1.5 mL of (appropriately diluted with PBS solution) each of the rice drinks was measured into 10 mL glass tubes, 3.0 mL of ABTS+ radical solution was added, incubated at approximately 20 °C for 6 min, and the absorbance of the samples was measured at λ = 734 nm in a spectrophotometer (Helios Gamma 9423 UVG 1000E UV-VIS Spectrophotometer, Thermo Spectronic, Waltham, MA, USA). The results, after taking into account the dilutions used and based on the calibration curve for the standard substance (i.e., Trolox; y = −5.6017x + 0.7134, R2 = 0.9998), were expressed in µM TEAC/100 mL (TEAC—Trolox Equivalent Antioxidant Capacity). The determination was carried out in triplicate for each beverage sample tested.

2.2.7. Statistical Methods

Statistical analysis of the results (one-way ANOVA, post-hoc test, Duncan’s test) was performed using the statistical software TIBICO Statistica (version 13.3, TIBCO Software Inc, Palo Alto, CA, USA). Differences at p < 0.05 were considered statistically significant. Principal Component Analysis (PCA) was used to assess the similarities and differences in the sensory characteristics of tested rice beverages (ANALSENS NT software, CogITos, Sopot, Poland).

3. Results

3.1. Analysis of the Composition and Nutritional Value of the Tested Rice Drinks

Analysis of the composition and nutritional value of the studied rice drinks were based on the manufacturer’s declarations on the labels of the studied products and the available literature. The results obtained are presented in Table 2. The rice drinks consisted of a rice base (water and 11–17% rice), sunflower oil, table salt in drink RB_4, and sea salt in the other drinks. The analysed rice drinks varied in rice content, with the highest percentage of this ingredient in drink RB_7 (17%) and the lowest in drink RB_4 (11%). The same content was reported in a study by Fructuoso et al. (2021) [4].
The tested rice drinks had a similar, reasonably low energy values (37–54 kcal/100 mL). A similar energy value, amounting to an average of 55.5 ± 8.4 kcal/100 mL, was demonstrated by Pérez-Rodríguez et al. (2023) [29] for 21 analysed products of this type. Similarly, Giugliano et al. (2023) [30] showed the energy value of rice milk at 47 kcal/100 g. According to the literature, rice drinks have a low, although varied, energy value, ranging from 24.21 ± 0.94 kcal/100 g to 62.71 ± 0.79 kcal/100 g [31]. These authors showed significant differences in the energy value of rice drinks depending on the type of raw material used for their production (white, black, red rice) or the heat treatment used (pasteurisation/sterilisation), which significantly reduced the energy value of rice drinks [31].
The energy value of the drinks was mainly derived from naturally occurring carbohydrates, which ranged from 8.0–11.0 g/100 mL. A study by Chalupka-Krebzdak et al. (2018) [32] on analysing the composition of essential nutrients in rice drinks showed a similar carbohydrate content of approximately 9.2 g/100 mL. The relatively high content of these components is mainly due to the starch and other sugars contained in the rice grains [32]. In addition, in the study by Giugliano et al. (2023) [30], rice drinks had a similar carbohydrate content (9.17 g/100 g), which mainly consisted of sugars (5.28 g/100 g), such as sucrose, glucose, fructose, lactose, maltose, and galactose. Pérez-Rodríguez et al. (2023) [29] showed a similar carbohydrate content (11.2 ± 1.8 g/100 mL), which mainly consisted of sugars (6.0 ± 1.6 g/100 mL). Da Silva et al. (2023) [31] found significant differences in the content of these nutrients (from 4.43 ± 0.42 g/100 g to 12.52 ± 0.02 g/100 g), depending on the type of rice used in the production of the drink and the thermal test used.
The analysed beverages were characterised by a low fat content of 0.6–1.3 g/100 mL, derived mainly from added sunflower oil. In the available literature, similar fat contents can be found in rice drinks, ranging from 0.83 g/100 mL to 2.64 g/100 mL, mainly resulting from the addition of different oils (mostly sunflower oil) [12,30,31,32].
The protein content of all rice drinks was shallow, not exceeding 0.5 g/100 mL. The low protein content of <2% in rice beverages is primarily related to the low proportion of rice in these beverages (11–17%) and their production process, during which there is a high loss of various nutrients (including protein, fibre, vitamins and minerals) naturally present in the hull, germ, and bran and removed during grain purification [20]. The studied beverages had a shallow dietary fibre content (0.1 to 0.3 g/100 mL). The available literature confirms the data for the rice drinks analysed in this study [29,30,31].
In the study by Pérez-Rodríguez et al. (2023) [29], the protein contents in the 21 analysed rice drinks were, on average, 0.36 ± 0.20 g/100 mL; an even lower amount of these nutrients was recorded by Giugliano et al. (2023) [30], amounting to 0.028 g/100 g. In turn, Da Silva et al. (2023) [31] showed a significantly higher protein content in rice drinks, depending on the type of raw material and the heat treatment processes used. The lowest content of this nutrient was found in drinks obtained from red rice (from 1.14 ± 0.11 g/100 to 1.19 ± 0.01 g/100 g), was higher (from 1.48 ± 0.03 to 1.52 ± 0.02 g/100 g) for white rice, and the highest for drinks obtained from black rice, ranging from 1.69 ± 0.09 to 1.75 ± 0.00 g/100 g.
According to the literature, the fibre content in rice drinks is usually approximately 0.3 g/100 g of product [30] or 0.34 ± 0.25 g/100 mL [31]. Other authors report that rice drinks contain little or no fibre [6]. Da Silva et al. (2023) [31] showed that half of the 21 commercial rice drinks analysed in their work did not contain fibre. Similarly to the low protein content, the negligible or complete lack of dietary fibre in these drinks results from the purification of rice grains during the production of this type of drink [20,30,31].
Of the ten analysed rice drinks, only two contained added vitamins B12 and D (0.38 μg/100 mL and 0.75 μg/100 mL, respectively) and three contained calcium (120 mg/100 mL). Other authors also report that rice drinks are very often fortified with vitamins (e.g., B12, D, A, E) and minerals (e.g., calcium, potassium, phosphorus) in such quantities that they contain similar levels of these components to cow’s milk [21,30,31].
Chalupa-Krebzdak et al. (2018) [32] showed that the calcium content of the tested rice beverage was 118 mg/100 mL, i.e., very similar to the calcium content of the RB_1, RB_4, and RB_5 drinks studied in this work (120 mg/100 mL). According to Giugliano et al. (2023) [30], the calcium content in rice drinks is approximately 118 mg/100 g, while in the research of Da Silva et al. (2023) [31] the content of this ingredient for 21 analysed market products was on average 108.00 ± 26.8 mg/100 mL. On the other hand, in the study performed by different authors determining the nutrient profile of various rice drinks, it was found that these drinks contained an average of 0.3 mg vit. B12/100 mL, 3.0 mg vit. E/100 mL, 60 μg vit. A/100 mL, and 2.5 μg vit. D/100 mL [11]. According to Giugliano et al. (2023) [30] and Sakkas et al. (2020) [33], there is a wide range of products on the market, commonly referred to as plant milk substitutes; however, to achieve vitamin and mineral profile similar to that in cow’s milk, these ingredients are added to some plant-based drinks during their production process.
In summary, it can be seen that the analysed market drinks are similar in composition to those studied in the work of other authors. They are characterised by a low nutritional value and are significantly different from milk, even though many consumers consider these drinks as a substitute for milk. Rice drinks are high in carbohydrates but contain no other nutrients or are not bioactive at a nutritionally relevant level. They should not be recommended as a substitute for milk. The enrichment of these drinks with vitamins and minerals is highly advisable.

3.2. Physico-Chemical Parameters of the Tested Rice Drinks

3.2.1. pH, Soluble Solids Content, and Osmolality

The rice drinks tested in this study showed a pH close to neutral (ranging from 6.3 to 7.4). The results obtained are confirmed by the studies of other authors, who reported similar pH values in rice drinks ranging from 5.21 to 6.10 [13]. In the study by da Silva et al. (2023) [24], the authors obtained slightly higher values for this parameter (depending on the type of rice used for the production of plant drinks), ranging from 5.94 ± 0.01 to 6.22 ± 0.01 (for white rice), from 6.17 ±0.01 to 6.25 ± 0.01 (for black rice) and the highest for red rice (from 6.22 ± 0.01 to 6.27 ± 0.01). Nevertheless, these values remained similar to the results obtained in this study.
Cow’s milk has a pH of 6.5 to 6.7 [34], so the pH values of the tested beverages were similar to that of cow’s milk. Determining variables such as the pH of milk or its plant-based substitutes is an important factor in determining, among other things, the growth of microorganisms in food. In addition, pH also improves protein extraction, which occurs more quickly and efficiently in a slightly acidic environment [35]. The pH value in the vegetable beverages could have been influenced by the base composition, the additives used in the industrial production of these beverages, and the production methods of these products [20].
The tested rice drinks had similar soluble solids content, ranging from approx. 9% to 13%. The main factor determining the soluble solids content of the studied rice drinks was the content of sugars and carbohydrates; the rice drinks RB_8, RB_7 and RB_3, with the highest soluble solids content (average 12.44 ± 0.30%), was also characterised by a high content of carbohydrates (average 11.00 ± 0.00 g/100 mL), including sugars (average 5.67 ± 1.15 g/100 mL). In addition, it is noteworthy that beverage RB_8, characterised significantly (p < 0.05) by the highest soluble solids content (12.67 ± 0.29%), was also characterised by the highest percentage of rice content at 15%. In contrast, the rice content of beverage RB_10, with significantly the lowest total extract content (8.67 ± 0.29%), was 12%. The results of our study were confirmed in the study of Aydar et al. (2020) [20], where a soluble solids content of 12.9% was obtained for the tested rice beverage. In turn, da Silva et al. (2023) [12], in their research on rice drinks produced based on various types of rice, showed a much lower content of soluble solids, i.e., 0.4 ± 0.05% (for white rice), 0.8 ± 0.05% (for black rice), and 0.9 ± 0.05% (for red rice), with no impact of the pasteurisation used in the tests on this parameter.
The osmolality of the tested drinks averaged 324.73 ± 70.17 mOsm/kg H2O, showing significant (p < 0.05) variation in this parameter (Table 3). The highest osmolality was recorded for drinks RB_6 and RB_8 (average 423.83 ± 6.49 mOsm/kg H2O) and was significantly lower in drinks RB_7 and RB_4 (average 363.33 ± 2.16 mOsm/kg H2O) or drinks RB_3, RB_9, and RB_2 (average 317.89 ± 9.31 mOsm/kg H2O). The drink with the significantly (p < 0.05) lowest osmolality was RB_10 (193.33 ± 1.53 mOsm/kg H2O). Thus, some of the tested beverages with osmolality > 330 mOsm/kg H2O can be classified as hypertonic. These beverages contained a high amount of carbohydrates (average 10.65 ± 0.70 g/100 mL), which probably influenced their higher osmolality level. The remaining drinks, on the other hand, with osmolality < 270 mOsm/kg H2O, can be classified as hypotonic ones. They have a lower osmolality than body fluids and can therefore be used to rehydrate the body effectively [36]. There are no data in the available literature on the osmolality of rice drinks. Osmolality depends on the concentration and activity of solute molecules and the concentration and activity of water molecules. Factors affecting the osmolality of beverages are mainly the carbohydrates and minerals present, such as sodium, magnesium, potassium, calcium, and chloride ions [36,37]. The osmolality of all body fluids of the human body in the physiological state is the same and is approximately 295 mOsm/kg H2O [38]. Osmolality can be an essential indicator for determining the suitability of beverages for body hydration [36,37]. The osmolality of commercially available isotonic beverages that efficiently and rapidly rehydrate the body averaged 288.67 mOsm/kg H2O, which was a lower value compared to the average osmolality for all rice beverages studied in this paper (324.73 mOsm/kgH2O).

3.2.2. Foaming Properties and Foam Stability of the Studied Rice Drinks

Of the rice beverages analysed in this study, only two drinks, RB_4 and RB_5, exhibited foaming properties. Beverage RB_4 had slightly higher foaming properties (216.67 ± 2.77 mL/100 g) than beverage RB_5 (200.00 ± 5.00 mL/100 g), but the produced foam from RB_4 was characterised by approximately 11% lower stability 10 min after whisking. In the RB_5 rice beverage, a stabiliser, gellan gum, was added, which may have contributed to better foam stability. According to the literature, thickening agents are added to beverages to modify texture characteristics, mainly mouthfeel, improve their strength, and reduce gravitational separation [13]. The other tested rice drinks did not exhibit foaming properties or the foam appeared, then lost stability and disappeared with the cessation of the whisking process. The rice drinks tested were characterised by a trace protein content, not exceeding 0.5 g/100 mL, and therefore could not provide foaming capacity in these drinks. There are no data in the literature on the foaming properties of rice drinks. Factors influencing the foaming ability of proteins present in different dispersion systems can include the respective amino acid composition of the proteins, pH, ionic strength and foam generation temperature. The surface charge, related to the pH, ionic environment, and solubility of the proteins, also plays a key role in foam formation and stabilisation [13,39].

3.2.3. Colour Parameters of the Studied Rice Drinks

Based on the tests conducted, significant (p < 0.05) differences were found in all colour parameters in the CIE L*a*b* colour space of each of the rice drinks tested (Table 4). Comparing the colour parameter L*, describing brightness, it can be seen that all the beverages were characterised by very high brightness, ranging from about 75 to 85. The colour parameters a* relating to red (+a*) and green (−a*) tones differed significantly in the rice beverages tested; nevertheless, all the beverages were characterised by a colour shift towards red tones. The beverages tested in this study also showed positive values for the parameter b*, meaning that a colour shift towards yellow characterized them.
There are little data in the available literature on the colour parameters in the CIE L*a*b* colour space of rice drinks. Da Silva et al. (2023) [31] showed the brightness of commercial rice drinks at 77.35 ± 0.13, which is close to the results obtained in this work. Similar values for this parameter were demonstrated by the same authors for rice drinks based on white rice (from 83.61 ± 0.46 to 84.59 ± 0.53). In turn, the rice drinks they produced from red rice were characterised by significantly lower values of the L* parameter (from 51.40 ± 0.57 to 61.67 ± 0.16), while the products based on black rice were significantly the darkest (from 28.11 ± 0.23 to 30.19 ± 0.58).
All rice drinks tested in this study were characterised by positive values of the a* parameter, which ranged from 3.14 ± 0.03 to 6.87 ± 0.06. According to the literature, commercial rice drinks had a much lower value of this parameter (2.09 ± 0.20) [31]. Regarding rice drinks made from white rice, Da Silva et al., 2023 [31] showed negative values (from −1.44 ± 0.03 to −2.14 ± 0.08), indicating a greater colour shift towards shades of green. In turn, drinks obtained by the same authors based on black and red rice were characterised by a more significant colour shift towards shades of red, obtaining a* parameter values ranging from 7.05 ± 0.14 to 10.37 ± 0.34 and from 12.03 ± 0.16 to 13.81 ± 0.17, respectively [31].
In the research conducted in this study, rice drinks were characterised by b* parameter values ranging from 13.87 ± 0.26 to 19.89 ± 0.12, which was confirmed by other studies. For commercial rice drinks, this parameter averaged 16.34 ± 0.07. In the case of rice drinks made from different types of rice, drinks made from white (from 2.92 ± 0.18 to 4.12 ± 0.06) and black (from 0.94 ± 0.05 to 0.95 ± 0.10) rice were characterised by much lower values for this parameter compared to results obtained in this work. Similar b* parameter values characterized rice drinks based on red rice to those obtained in this study (from 11.67 ± 0.18 to 14.24 ± 0.25) [31]. The authors explained the change in colour of various rice drinks with the degradation of compounds present in the raw material under the influence of the technological processes used [31]. Moreover, other authors have shown that in the case of red rice, both during storage and during various types of technological processing, significant colour changes occur, resulting from the oxidative degradation of proanthocyanidins present in the grain [40].
Some authors investigated colour in other beverages; for example, Jeske et al. (2019) [41], analysing the effect of homogenisation and heat treatment on the appearance of a lentil beverage, showed that the beverage had a naturally pinkish colour, which was attributed to the anthocyanins found in lentils. However, under the heat treatment used by the authors, the intensity of the pink colour was reduced, which was associated with the chemical degradation of the anthocyanins at high temperatures. Milk substitutes are relatively low-viscosity beverages, and the textural properties of these products are determined primarily by the particles present (e.g., fat droplets or plant tissue fragments), as well as the additives used, including thickening or stabilising substances [15], so it can be concluded that the resulting colour profiles of the rice drinks studied in this work, and determined by the L*a*b* colour space, were the result of the elemental composition of these products.
Based on the measurements obtained for the colour parameters L*, a* and b*, the whiteness index (WI) was calculated (Table 4). The results show a high whiteness saturation of the tested beverages. This index averaged 81.79 ± 2.55. Significant (p < 0.05) differences in this parameter were found between the individual rice drinks. The beverage with the significantly lowest whiteness index was RB_4 (77.82 ± 0.06). Higher values were recorded for beverages RB_5, RB_10, and RB_3, as well as in beverages RB_7, RB_6, and RB_1. The beverages with the highest whiteness index values were RB_8 and RB_2, which did not differ in the value of this parameter. In contrast, the highest (p < 0.05) whiteness index among all the tested rice beverages was found in the beverage RB_9, reaching WI values of 86.20 ± 0.18. Based on the analysis of the results obtained, it can be concluded that the whiteness index values obtained were most influenced by the parameter L* among the measured colour parameters. In the available literature, few studies on the whiteness index in rice drinks were found. Still, the authors investigated the influence of raw material and processing stage on the whiteness index in organic vegetable drinks. Jeske et al., (2017) [42] showed similar but slightly lower whiteness indices for beverages made from rice (66.49), quinoa (71.35), and brown rice (63.47) than those obtained in the present study, which, as for the individual parameters characterising the colour profile in the L*a*b* colour space, was influenced by the raw materials used in the production of the beverages, their percentage share in the beverage base composition, the processing method, or the additives used, such as colouring agents, emulsifiers, stabilisers, or thickeners [43]. In a study performed by the same authors, the whiteness indices for different plant-based beverages ranged from 51.73 (for macadamia beverage) through 56.31 (for hazelnut beverage), 60.21 (for oat beverage), 65.57 (for cashew nut drink), 67.36 (for almond drink), 67.75 (for coconut drink), 68.49 (for hemp drink), to 71.35 (for quinoa drink) or 72.17 (for soy drink) [42]. As reported in the literature, various plant-based beverages are characterised by significantly less white colour intensity compared to cow’s milk, and the colour differences are probably due to differences in the size and concentration of any particles present, as well as the type and level of any colouring agents [13,42]. Very often, the WI whiteness index of vegetable beverages is compared to cow’s milk [3]. In a study by Jaske et al., (2017) [42], the WI index for bovine milk was 81.89, so the rice drinks studied in this paper had a very similar, almost identical WI index, averaging 81.79 ± 2.55, which for consumers who prefer the white colour of plant-based milk substitutes would undoubtedly be a great advantage. In addition, in the process of producing plant-based beverages as milk substitutes, the whiteness index of the beverages can be increased, e.g., by reducing the particle size of the colloidal systems through various homogenisation methods (e.g., ultrasonic or high-pressure), which in turn lead to an increase in the intensity of light scattering and result in significant colour brightening/fading. The production process of plant-based beverages as milk substitutes can therefore be guided so that the resulting product meets expectations and consumer preferences as far as possible in terms of colour, density, viscosity, or other consistency characteristics [43,44].

3.3. Bioactive Properties of the Tested Rice Drinks

3.3.1. Polyphenol Content

The studied beverages were characterised by a relatively low content of total polyphenols, ranging from 0.59 ± 0.03 to 2.81 ± 0.03 mg GAE/100 mL, with statistically significant (p < 0.05) differences between the analysed beverages in terms of this parameter (Figure 1). The beverage RB_10 (0.59 ± 0.03 mg GAE/100 mL) had the lowest total polyphenol content, while the beverages RB_6 (0.79 ± 0.04 mg GAE/100 mL), RB_7 (1.03 ± 0.03 mg GAE/100 mL), or RB_2 (1.14 ± 0.02 mg GAE/100 mL) were significantly higher. Among the rice beverages tested in this study, the highest total polyphenol content was found in RB_5, with a polyphenol content of 2.81 ± 0.0 mg GAE/100 mL.
There are little data in the available literature for the content of total polyphenols in rice drinks. In the case of rice drinks obtained from white rice, the content of these bioactive ingredients was similar to the results obtained in our studies and amounted to less than 10 mg GAE/100 g of drink. In the case of rice drinks obtained from red and black rice, the content of total polyphenols was significantly higher, reaching approximately 40 mg GAE/100 g and 100 mg GAE/100 g, respectively, which the authors explained by significant differences in the content of these bioactive ingredients in the raw materials used to produce the drinks, i.e., white rice (less than 20 mg GAE/100 g), red rice (approx. 120 mg GAE/100 g), and black rice (just over 120 mg GAE/100 g). These authors also found slight differences in the concentration of total polyphenols in unpasteurised and pasteurized drinks (a slight decrease in total polyphenols content in pasteurized products) [31]. More information can be found in the literature for the content of these bioactive compounds in other plant-based beverages used as milk substitutes. Aydar et al. (2020) [20] showed the highest content of total polyphenolic compounds in a hazelnut beverage (130.42 mg GAE/100 mL), and a much lower content in a soy beverage (8.79 mg GAE/100 mL) or in an almond beverage (0.12 mg GAE/100 mL). Comparing these results with those of our study, it can be concluded that the content of polyphenolic compounds in the rice drinks studied was most similar to the almond drink, as it averaged 1.40 ± 0.62 mg GAE/100 mL for all the products analysed in the study. The authors also examined the content of polyphenolic components in the respective raw materials used to make the plant beverages and showed that the content of these bioactive components was significantly higher in the fresh material; for hazelnut it was 226 mg GAE/100 g, for soy 94.10–116.70 mg/100 g, and for almond 95.28 mg GAE/100 g. Although a high content of phenolic compounds characterized the fresh plant material, the processing of the respective raw materials resulted in a significant reduction of these bioactive components in the final products [20]. Studies by other authors also confirm that nuts and cereals, which are rich in protein, dietary fibre, fatty acids, and vitamins or phytonutrients, contain significantly more of these bioactive components than plant-based milk substitutes. For example, hazelnut’s total phenolic compound content was reduced by about 42% when a milk substitute was produced from raw hazelnuts because the bioactive components were lost during processing [45]. Another reason for decreased total phenolic compounds observed in most plant-based dairy products may be the lower amounts of hydrophilic phenols [46]. According to the literature, the most minor loss in polyphenol content is caused by the microbial processes, thus plant-based beverages are increasingly produced using these processes [47].
Thus, the low content of polyphenolic components found in the rice beverages studied was most likely due to the processing procedures used during beverage manufacture, including dehulling, soaking in water (providing swelling), blanching (reducing initial microbial load and inactivating lipoxygenase), cooking (glugging), filtration, sterilisation (extending shelf life and maintaining quality), or homogenisation, used to increase the physical stability of the final products [20,31].

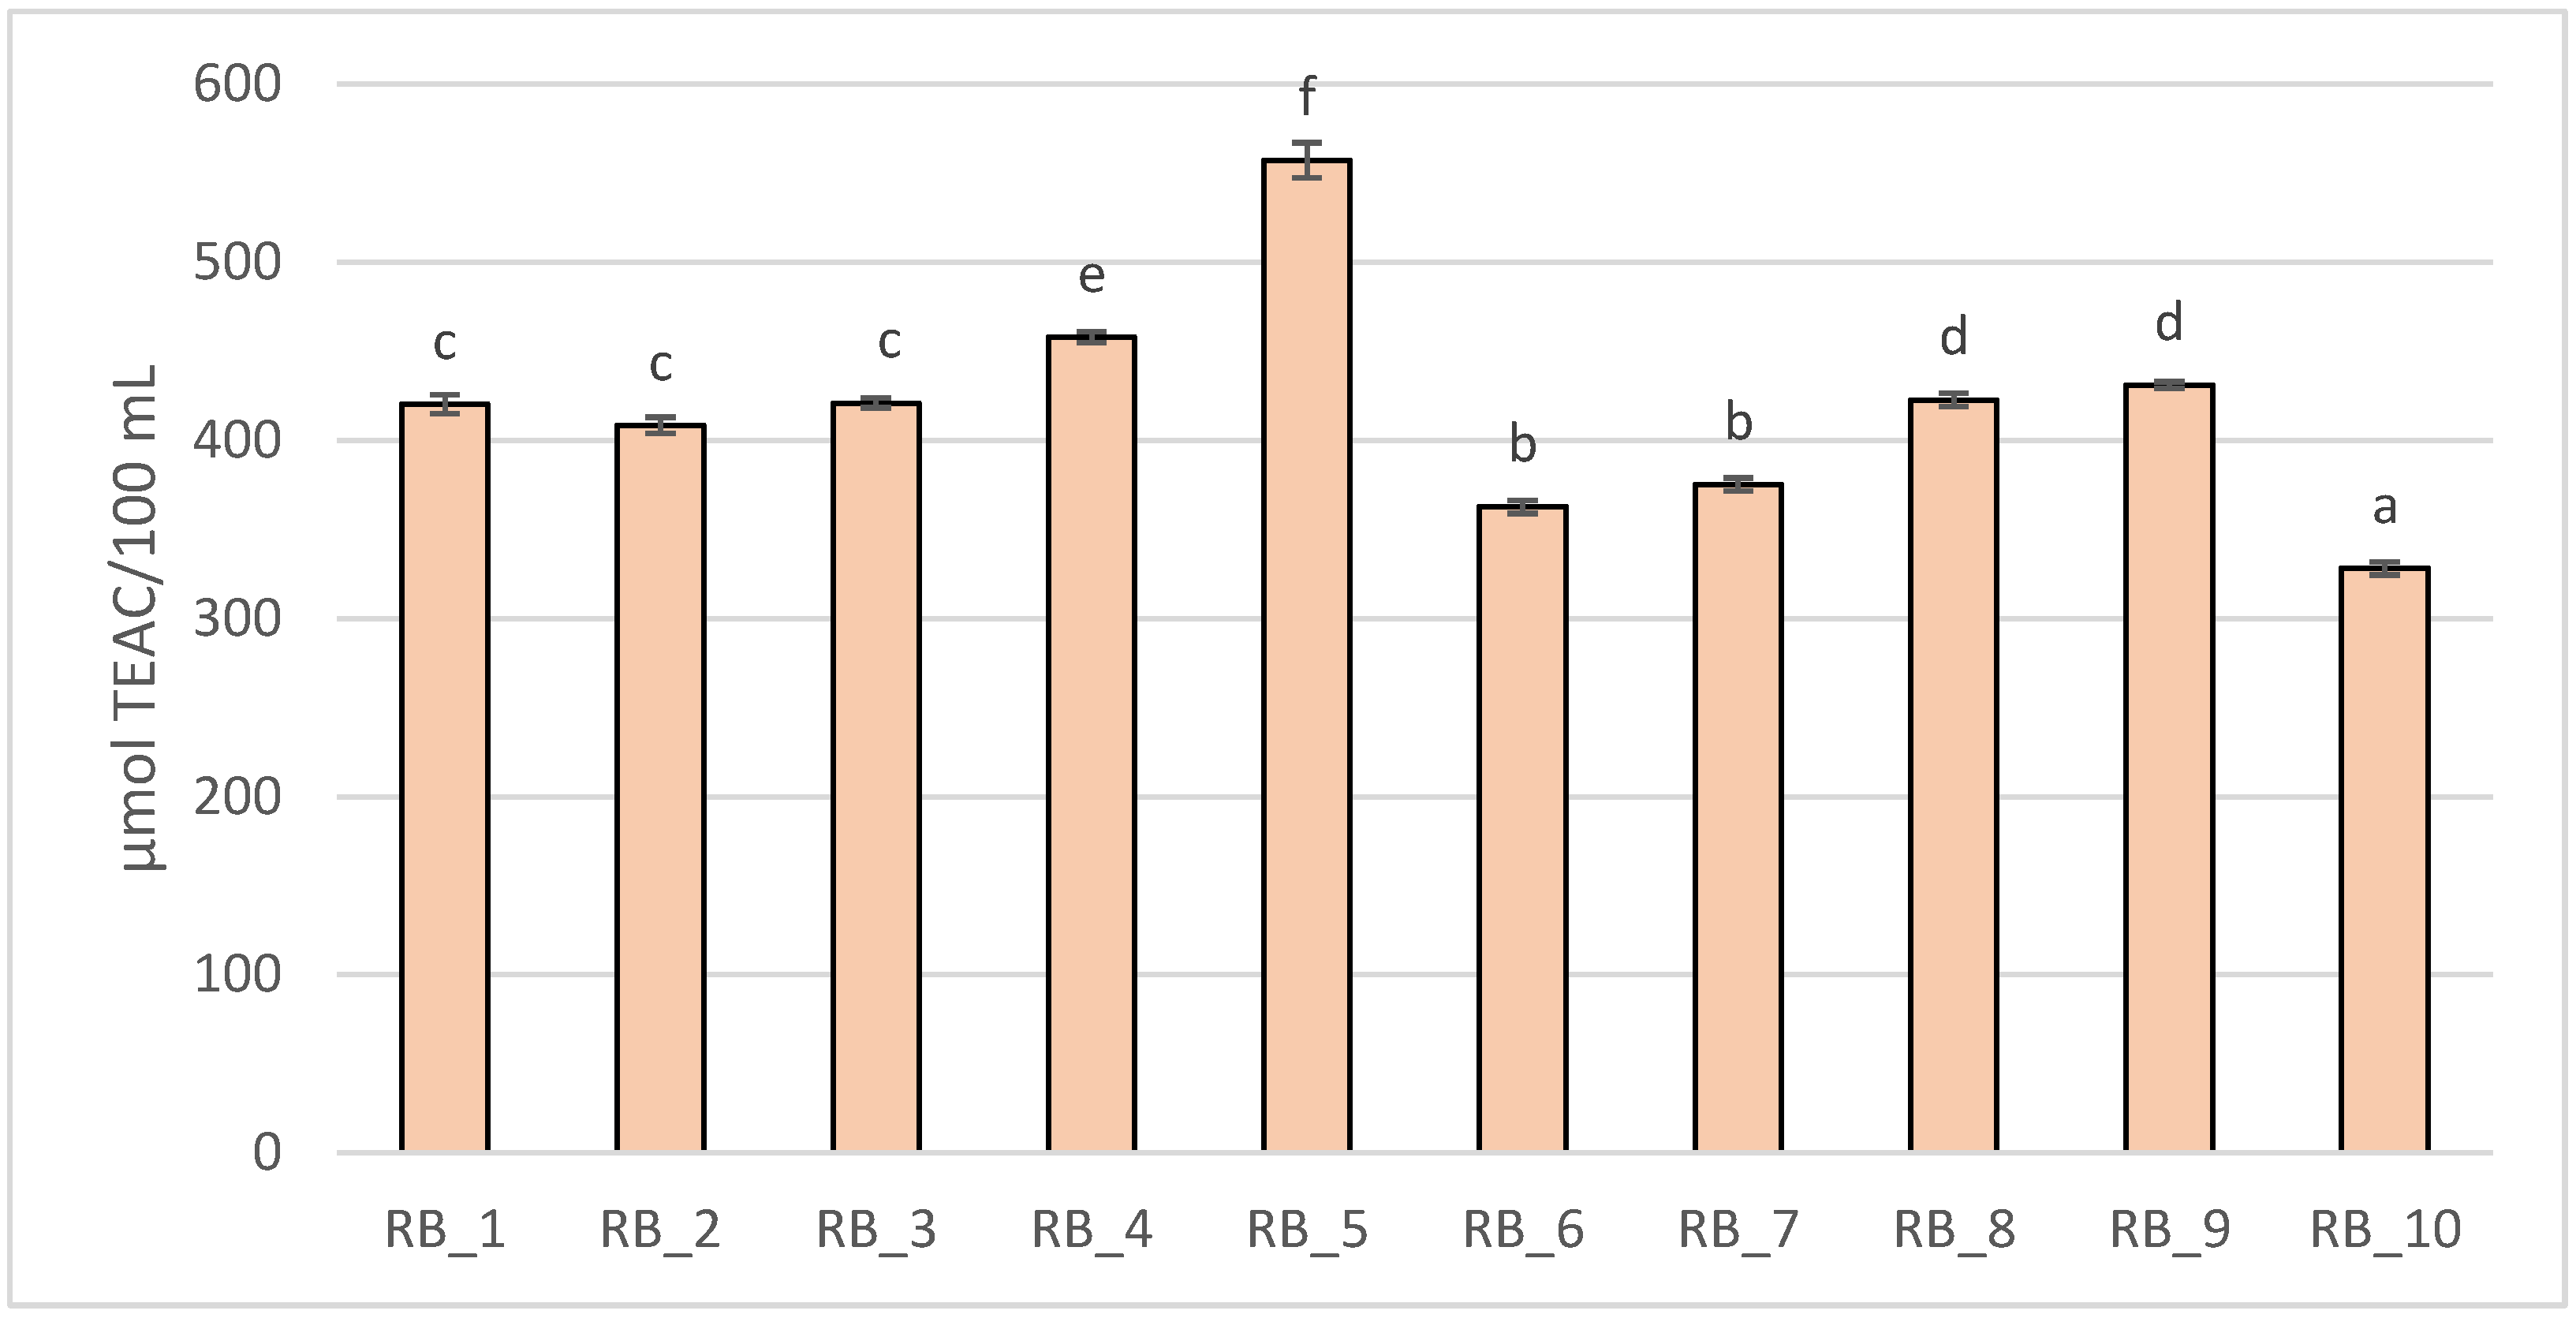
3.3.2. Antioxidant Properties

All rice drinks had relatively high antioxidant activity (Figure 2), with statistically significant (p < 0.05) differences between them. The lowest antioxidant activity was found in drink RB_10 (328.00 ± 3.72 µM TEAC/100 mL), while it was significantly highest for drink RB_5 (557.09 ± 9.83 µM TEAC/100 mL). There are few studies in the literature on the antioxidant activity of rice beverages, and the existing ones are mainly concerned with comparing the antioxidant potential of plant-based milk substitutes with the raw material from which they are made. Nevertheless, da Silva et al. (2023) [31] showed similar antioxidant activity in rice drinks, depending on the type of raw material used to produce this plant drink. The lowest antioxidant activity, measured by the ability to deactivate ABTS cation radicals, was demonstrated for drinks obtained from white rice (approximately 200 µM TEAC/100 g), significantly higher in the case of red rice (250 µM TEAC/100 g), and the highest for a drink based on black rice (250 µM TEAC/100 g). Aydar et al. (2020) [20] compared the antioxidant activity of almonds, hazelnuts, sesame, soya, and rice, among others, and the corresponding plant-based milk substitutes. The use of a different analytical procedure (total DPPH radical scavenging capacity) (DPPH-2,2-diphenyl-1-picrylhydrazyl) also poses difficulties in relating and comparing the results of these authors with our findings for rice drinks. The authors showed substantial differences in the antioxidant activity of plant raw materials and their processing products (plant beverages). For example, the antioxidant activity of fresh almonds was 642, 28 μmoL TEAC/g, hazelnuts 56 mg/mL, and sesame 8.88–44.21 μg/mL, while it was drastically reduced in the plant-based milk substitutes made from them (to 2.00; 50.47, and 19.30% DPPH, respectively). In addition, for rice, these authors showed an analogous (decreasing) trend; while the fresh material showed an antioxidant activity of 0.0012 mg/mL, the rice drink obtained from it retained an antioxidant capacity of 34.95% [20]. A study by Alasalvar and Bolling (2015) [45] also confirms such a relationship. As shown by these authors, as a result of the nut processing used, mainly related to peeling the nuts, the antioxidant activity of the plant-based milk substitute from hazelnuts decreased to about 10% compared to the fresh raw material. Other authors, also explaining the decrease in polyphenolic components in plant-based milk substitutes as a reduction in hydrophilic phenols during the processing of fresh plant-based raw materials, stated that while in the raw material these compounds are present in the form of both hydrophobic and hydrophilic molecules, where plant-based milk products retain mainly hydrophilic molecules, which are then usually present in bound form (e.g., as glucosides). As highlighted by the authors, bound antioxidants (mainly glucosides) show much lower antioxidant activity than free ones, which may also explain the drastic reduction in their antioxidant capacity [46].

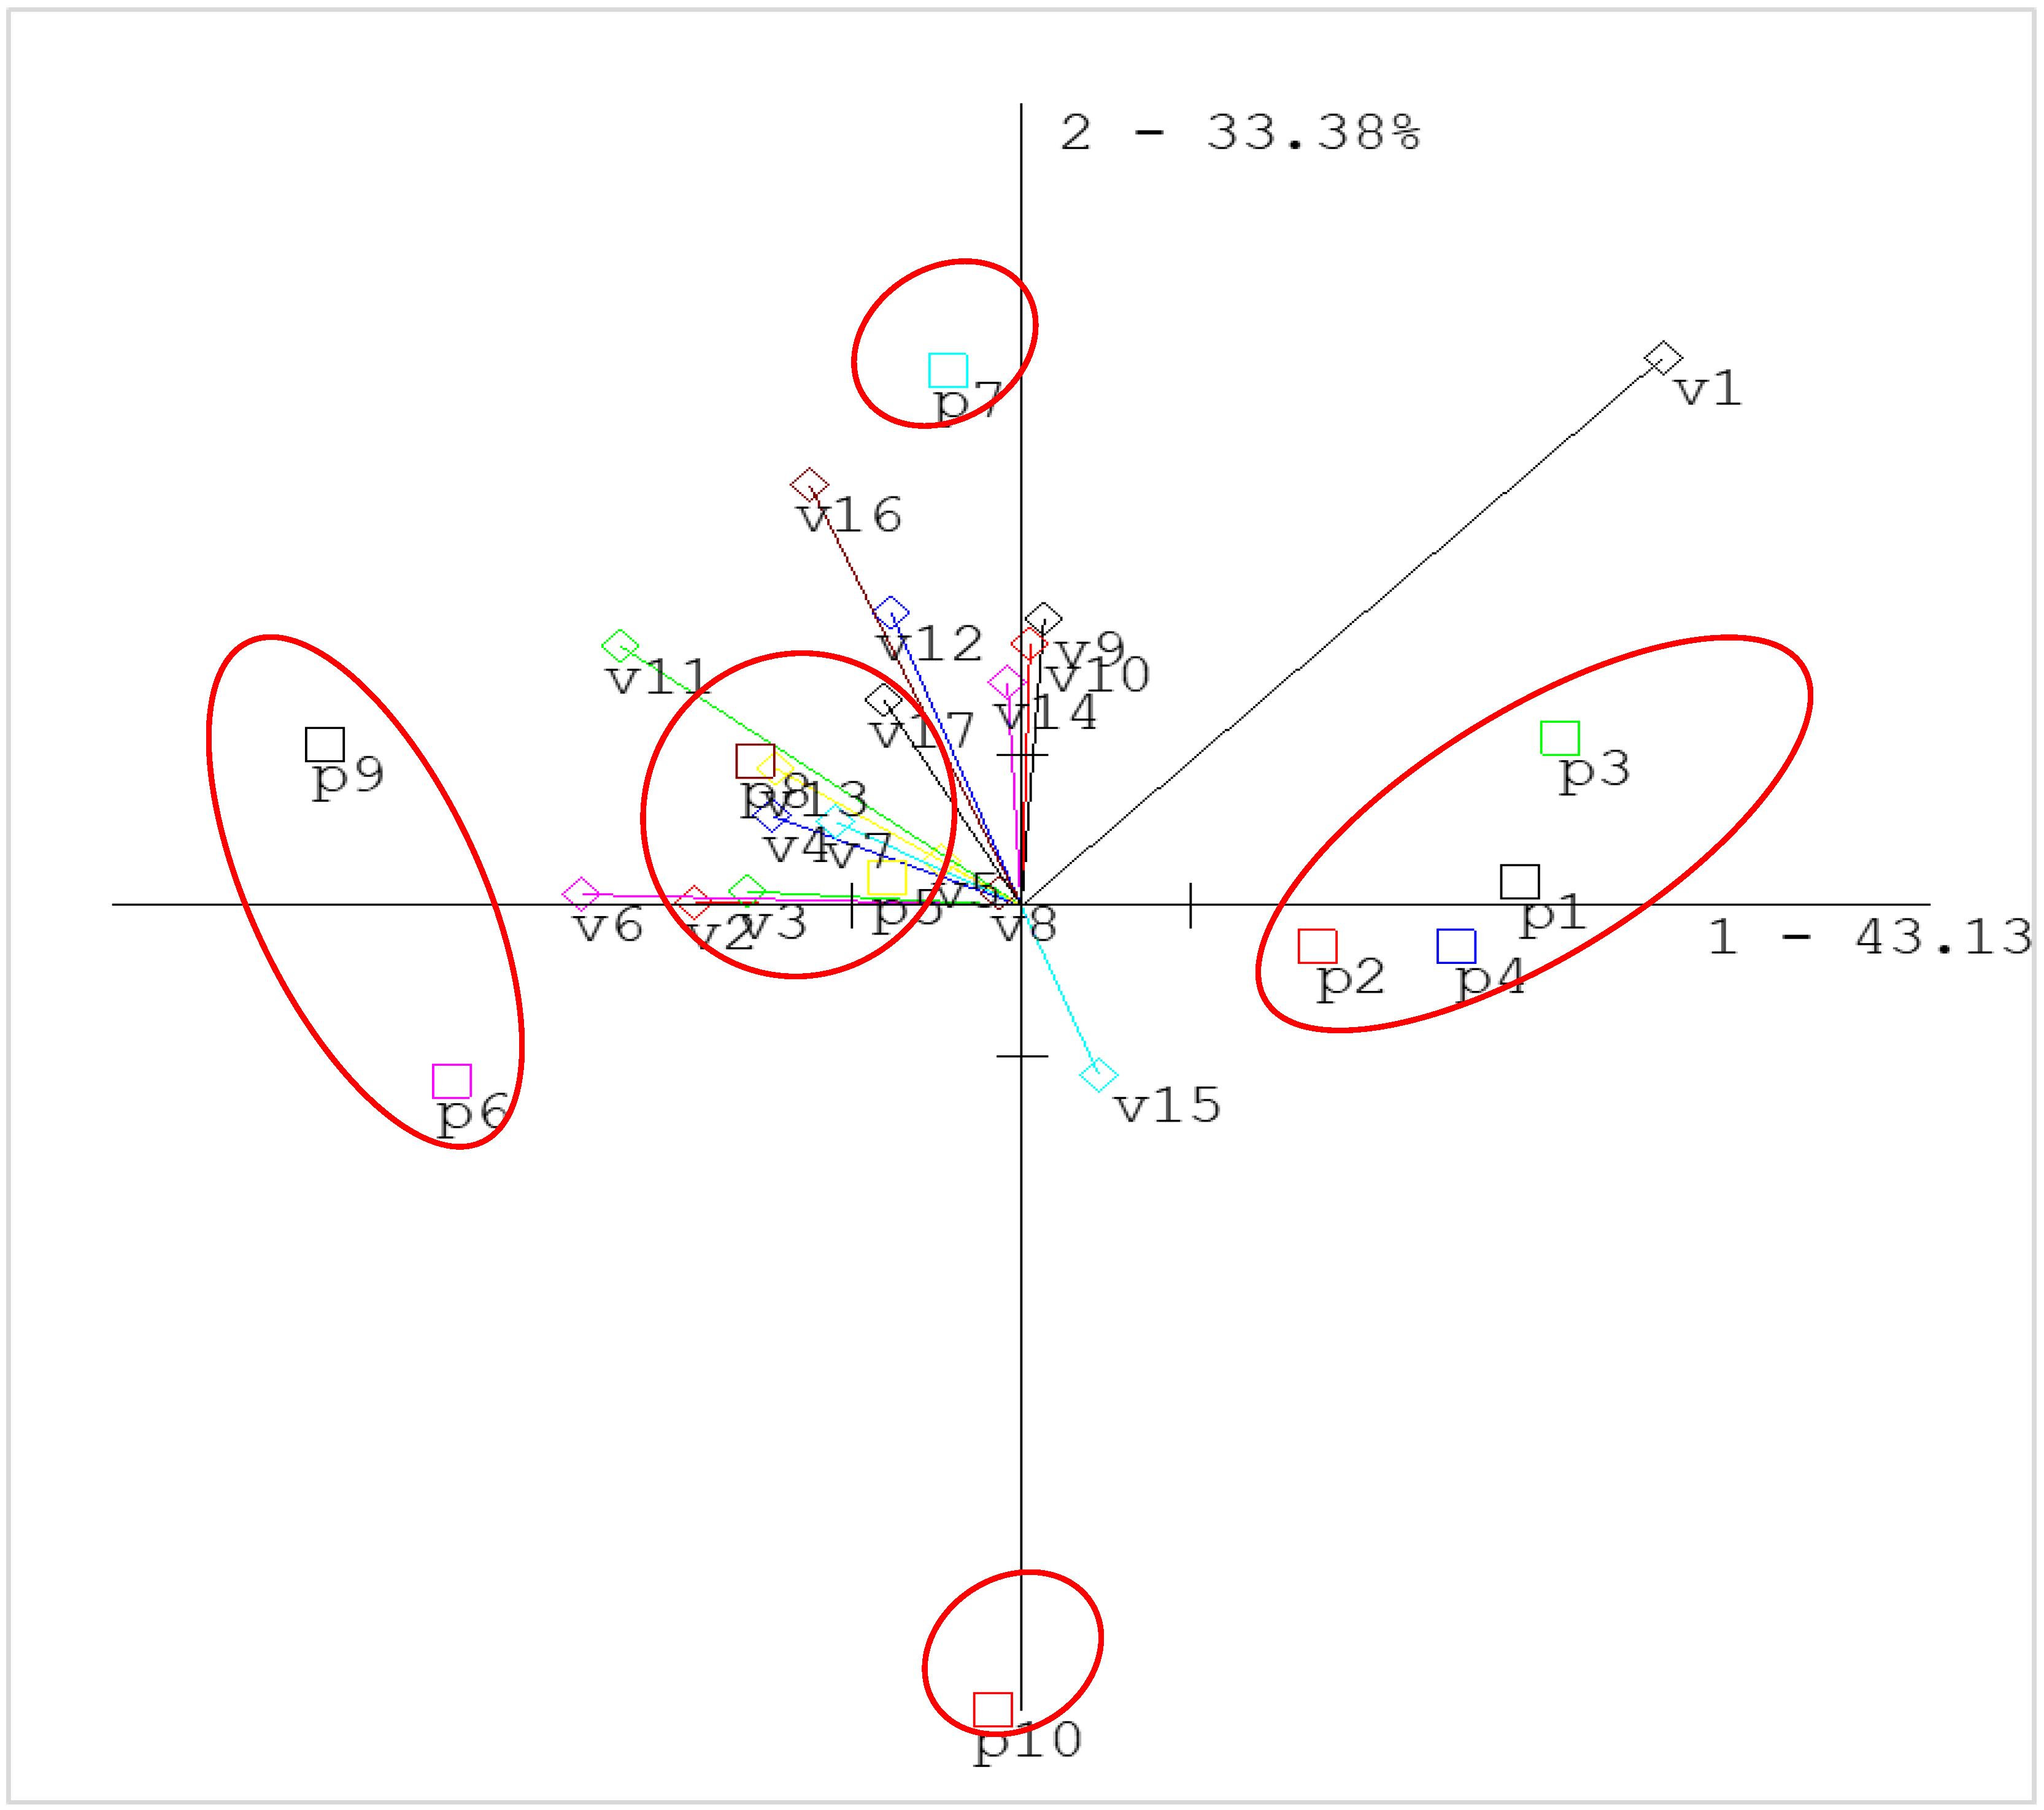
3.4. Sensory Analysis of the Tested Rice Drinks

The sensory profiles of the tested rice beverages, as carried out by a qualified team of experts, are given in Table 5. The experts evaluated the tested beverages for such distinguishing characteristics as colour, overall smell intensity, smell (sweet, dairy vanilla, rice, fat, or other), density, viscosity, taste (sweetness), flavour (dairy, rice, fat, or different), “body” (the complex interaction of flavour characteristics), and overall sensory quality.
The tested samples differed in terms of colour, with the RB_10 rice drink and RB_9 drink showing the lightest colour (scores of 1.16 IU and 1.91 IU, respectively), while the RB_4 and RB_5 drinks showed darker colour (5.30 IU and 6.54 IU, respectively). Beverages RB_2 and RB_9 were the most intense in terms of smell, which may have been related to sensing the sweet smell at a high level. Rice and fatty smells were most noticeable in the RB_2 beverage (4.56 units and 2.37 units, respectively). The RB_5 rice drink showed the most noticeable vanilla smell (2.15 IU). The RB_4 beverage had the highest density and viscosity (3.09 IU and 2.90 IU, respectively). The lowest density (1.01 IU) was shown by the RB_10 rice drink, which at the same time had the lowest viscosity (1.07 IU), which could be due to the low fat content of this drink.
The RB_8 and RB_6 rice drinks were the sweetest (scores of 5.82 and 5.85 IU), while the RB_10 and RB_1 drinks showed the most minor sweetness (scores of 2.79 and 2.82 IU). The RB_9 beverage had a rice flavour (5.00 IU) at the highest level among all the beverages evaluated, while the RB_4 beverage had a dairy flavour (4.24 IU). The most complete flavour characteristics were attributed to the RB_4 and RB_9 beverages, which thus translated into a high overall sensory quality for these beverages at 5.54 IU and 5.60 IU, respectively. The lowest overall sensory quality was demonstrated by the RB_10 beverage (3.97 IU), which may have been due to the lowest fat and carbohydrate content in this beverage.
Figure 3 shows the relationship (PCA) between the tested beverage samples and their sensory profile. This projection illustrates the distribution of sensory quality discriminants on a plane formed by two factors responsible for 76.51% of the samples’ variability (factor p1—43.13% and factor p2—33.38%). In other words, the projection shown is a picture of the correlation of the evaluated sensory attributes described in Table 5 for the two factors: p1 and p2. Based on the obtained correlations, it can be concluded that the tested beverages differed in terms of the sensory attributes evaluated. Beverages RB_1, RB_3, RB_5, and RB_7 differed from the other beverages being assessed in terms of the taste of others (indicated most often by evaluators as caramel). In contrast, the RB_8 and RB_6 beverages stood out from the others regarding overall smell intensity. These samples showed more intense notes given to most smells than the other evaluated beverages. Beverage RB_4 stood out for having the most intense “body”, while beverages RB_2 and RB_9 had the most intense rice smell.
A limitation of the research conducted in this study is the evaluation of selected quality characteristics of only one type of vegetable beverages, i.e., rice beverages. It would be very valuable to carry out comparative studies on a wider group of vegetable beverages obtained from different raw materials, which the authors of this work are currently doing.

4. Conclusions

The market rice drinks studied in this paper are products with low protein content (<0.5%). They contain mainly starchy carbohydrates at a reasonably high level (8–11%), which translates into the osmolality of the beverages oscillating in the range of 193–427 mOsm/kg H2O, resulting in classifications as hypo-, iso- or moderately hyper-tonic liquids, which can therefore be used for adequate hydration. All rice drinks analysed in the study contained sunflower oil, which slightly increased their fat content by 0.6–1.3%. Of the ten rice beverages analysed, in only two was there an addition of vitamin B12 and D. In comparison, three beverages contained a calcium supplement at a level similar to that in milk. In evaluating physicochemical characteristics, the rice drinks showed a pH close to neutral and close to the pH value of cow’s milk. The tested beverages showed poor foaming properties due to their low protein content. The high whiteness index, which was calculated based on instrumental colour measurement in the L*a*b* colour space, testified to the high whiteness saturation of the tested products, which was significantly different from milk. Rice beverages were characterised by a low polyphenol content but relatively high antioxidant activity. They were characterised by a rather low and varied sensory quality. The most dominant flavours and aromas were rice and caramel. The overall sensory quality, which is the harmonisation of all evaluated parameters, was highest for beverages with the highest level of sugars. Based on our research and analysis of the available literature, it can be concluded that the rice beverages studied in this paper can be included in the daily diet, providing a rehydrating beverage that exhibits free radical levelling properties. These beverages were characterised by low nutritional value, influenced by the technological process. These beverages cannot be recommended as milk substitutes due to their low levels of protein and lack of the vitamins and minerals typical of milk.

Author Contributions

Conceptualization, K.N. and P.P.; methodology, K.N., A.S., and G.W.-Z.; formal analysis, P.P., K.N., E.H., and G.W.-Z.; data curation, P.P. and K.N. writing—original draft preparation, A.S. and K.B.; writing—review and editing, F.Ś. and E.H.; visualization, K.B. All authors have read and agreed to the published version of the manuscript.

Funding

This research was prepared as part of the statutory activity of the Department of Functional and Ecological Food, Warsaw University of Life Sciences.

Institutional Review Board Statement

Not applicable.

Informed Consent Statement

Not applicable.

Data Availability Statement

The data presented in this study are available on request from the corresponding authors.

Conflicts of Interest

The authors declare no conflicts of interest.

References

  1. Zaremba, A.; Jędrusek-Golińska, A.; Kobus-Cisowska, J.; Szymandera-Buszka, K. Zachowania konsumentów wobec napojów roślinnych jako alternatywy mleka. Zagadnienia Doradz. Rol. 2023, 111, 60–79. [Google Scholar]
  2. Tukker, A.; Goldbohm, R.A.; de Koning, A.; Verheijden, M.; Kleijn, R.; Wolf, O.; Pérez-Domínguez, I.; Rueda-Cantuche, J.M. Environmental Impacts of Changes to Healthier Diets in Europe. Ecol. Econ. 2011, 70, 1776–1788. [Google Scholar] [CrossRef]
  3. Hoffmann, M.; Kostyra, E. Jakość sensoryczna i wartość odżywcza wegańskich substytutów mleka krowiego. Postępy Tech. Przetwórstwa Spożywczego 2015, 1, 52–57. [Google Scholar]
  4. Fructuoso, I.; Romao, B.; Han, H.; Raposo, A.; Ariza-Montes, A.; Araya-Castillo, L.; Zandonadi, R.P. An overview on nutritional aspects of plant-based beverages used as substitutes for cow’s milk. Nutrients 2021, 13, 2650. [Google Scholar] [CrossRef]
  5. Bridgesm, M. Moo-ove over, cow’s milk: The rise of plant-based dairy lternatives. Nutr. Issues Gastroenterol. 2018, 171, 20–27. [Google Scholar]
  6. Sethi, S.; Tyagi, S.K.; Anurag, R.K. Plant-based milk alternatives an emerging segment of functional beverages: A review. J. Food Sci. Technol. 2016, 53, 3408–3423. [Google Scholar] [CrossRef]
  7. Singh, B.P.; Yadav, D.; Vij, S. Soybean Bioactive Molecules: Current Trend and Future Prospective. In Bioactive Molecules in Food: Reference Series in Phytochemistry; Mérillon, J.M., Ramawat, K., Eds.; Springer: Cham, Switzerland, 2017; pp. 1–29. [Google Scholar] [CrossRef]
  8. Wolever, T.M.S.; Rahn, M.; Dioum, E.; Spruill, S.E.; Ezatagha, A.; Campbell, J.E.; Jenkins, A.L.; Chu, Y. An Oat β-Glucan Beverage Reduces LDL Cholesterol and Cardiovascular Disease Risk in Men and Women with Borderline High Cholesterol: A Double-Blind, Randomized, Controlled Clinical Trial. J. Nutr. 2021, 151, 2655–2666. [Google Scholar] [CrossRef] [PubMed]
  9. Balbino, S.; Cvitković, D.; Skendrović, H.; Dragović-Uzelac, V. Optimisation of Almond-Based Dairy-Free Milk Alternative Formulation Fortified with Myrtle, Bay Leaf and Fennel Extracts. Food Technol. Biotechnol. 2023, 61, 378–388. [Google Scholar] [CrossRef]
  10. Siriphanich, J.; Saradhuldhat, P.; Romphophak, T.; Krisanapook, K.; Pathaveerat, S.; Tongchitpakdee, S. Coconut (Cocos nucifera L.). In Woodhead Publishing Series in Food Science, Technology and Nutrition, Postharvest Biology and Technology of Tropical and Subtropical Fruits; Yahia, E.M., Ed.; Woodhead Publishing: Sawston, UK, 2011; pp. 8–35. [Google Scholar] [CrossRef]
  11. Mäkinen, O.E.; Wanhalinna, V.; Zannini, E.; Arendt, E.K. Foods for Special Dietary Needs: Non-dairy Plant-based Milk Substitutes and Fermented Dairy-type Products. Crit. Rev. Food Sci. Nutr. 2016, 56, 339–349. [Google Scholar] [CrossRef]
  12. Silva, A.R.A.; Silva, M.M.N.; Ribeiro, B.D. Health issues and technological aspects of plant-based alternative milk. Food Res. Int. 2020, 131, 108972. [Google Scholar] [CrossRef]
  13. McClements, D.J.; Newman, E.; McClements, I.F. Plant-based milks: A review of the science underpinning their design, fabrication and performance. Compr. Rev. Food Sci. Food Saf. 2019, 18, 2047–2067. [Google Scholar] [CrossRef] [PubMed]
  14. Scholz-Ahrens, K.E.; Ahrens, F.; Barth, C.A. Nutritional and health attributes of milk and milk imitations. Eur. J. Nutr. 2020, 59, 1436–6215. [Google Scholar] [CrossRef] [PubMed]
  15. Grossmann, L.; Kinchla, A.J.; Nolden, A.; Mc Clements, D.J. Standardized methods for testing the quality attributes of plant-based foods: Milk and cream alternatives. Compr. Rev. Food Sci. Food Saf. 2021, 20, 2206–2233. [Google Scholar] [CrossRef] [PubMed]
  16. Verduci, E.; D’Elios, S.; Cerrato, L.; Comberiati, P.; Calvani, M.; Palazzo, S.; Martelli, A.; Landi, M.; Trikamjee, T.; Peroni, D.G. Cow’s milk substitutes for children: Nutritional aspects of milk from different mammalian species, special formula and plant-based beverages. Nutrients 2019, 11, 2072–6643. [Google Scholar] [CrossRef]
  17. Atwaa, E.H.; Elmaadawy, A.A.; Awaad, E.A. Production of Fruit Flavored Probiotic Rice Milk Beverage. J. Food Dairy Sci. 2019, 10, 453–458. [Google Scholar] [CrossRef]
  18. Vanga, S.K.; Raghavan, V. How well do plant based alternatives fare nutritionally compared to cow’s milk? J. Food Sci. Tech. 2018, 55, 10–20. [Google Scholar] [CrossRef]
  19. Esa, N.M.; Ling, T.B.; Peng, L.S. By-products of rice processing: An overview of health benefits and applications. Rice Res. 2013, 1, 1. [Google Scholar]
  20. Aydar, E.F.; Tutuncu, S.; Ozcelik, B. Plant-based milk substitutes: Bioactive compounds, conventional and novel processes, bioavailability studies, and health effects. J. Funct. Foods 2020, 70, 103975. [Google Scholar] [CrossRef]
  21. Lamothe, M.; Rivero-Mendoza, D.; Wendy, J.D. Plant-based milks: Rice. Food Sci. Hum. Nutr. 2020, 5, 1–4. [Google Scholar] [CrossRef]
  22. Polska Norma PN-EN 12143:2000; Oznaczanie zawartości substancji rozpuszczalnych—Metoda refraktometryczna. Polski Komitet Normalizacyjny. Wydział Wydawnictw Normalizacyjnych: Warsaw, Poland, 2000.
  23. Stone, H.; Sidel, J.L. Sensory Evaluation Practices; Academic Press: Orlando, FL, USA, 1985. [Google Scholar]
  24. Polska Norma PN-EN ISO 13299:2016-05; Analiza sensoryczna—Metodyka—Ogólne wytyczne ustalania profilu sensorycznego. Analiza Żywności. Polski Komitet Normalizacyjny. Wydział Wydawnictw Normalizacyjnych: Warsaw, Poland, 2016.
  25. Polska Norma PN-EN ISO 8586:2014-03; Analiza sensoryczna—Ogólne wytyczne wyboru, szkolenia i monitorowania wybranych oceniających i ekspertów oceny sensorycznej. Analiza Żywności. Polski Komitet Normalizacyjny. Wydział Wydawnictw Normalizacyjnych: Warsaw, Poland, 2014.
  26. Dobrzańska, A.; Cais-Sokolińska, D. Ocena przydatności systemów pomiaru barwy do badań preparatów białek mleka i serwatki. Apar. Badaw. Dydakt. 2014, 3, 267–272. [Google Scholar]
  27. Singleton, V.L.; Rossi, J.A., Jr. Colorimetry of total phenolics with phosphomolybdic acid reagents. Am. J. Enol. Vitic. 1965, 16, 144–158. [Google Scholar] [CrossRef]
  28. Re, R.; Pellegrini, N.; Proteggente, A.; Pannala, A.; Yang, M.; Rice-Evans, C. Antioxidant activity applying an improved ABTS radical cation decolorization assay. Free Radic. Biol. Med. 1999, 26, 1231–1237. [Google Scholar] [CrossRef] [PubMed]
  29. Pérez-Rodríguez, M.L.; Serrano-Carretero, A.; García-Herrera, P.; Cámara-Hurtado, M.; Sánchez-Mata, M.C. Plant-based beverages as milk alternatives? Nutritional and functional approach through food labelling. Int. Food Res. 2023, 173, 113244. [Google Scholar] [CrossRef] [PubMed]
  30. Giugliano, R.; Musolino, N.; Ciccotelli, V.; Ferraris, C.; Savio, V.; Vivaldi, B.; Ercolini Bianchi, D.M.; Decastelli, L. Soy, Rice and oat drinks: Investigating chemical and biological safety in plant-based milk alternatives. Nutrients 2023, 15, 2258. [Google Scholar] [CrossRef] [PubMed]
  31. Da Silva, L.R.; Velasco, J.I.; Matta Fakhouri, F.M. Use of rice on the development of plant-based milk with antioxidant properties: From raw material to residue. LWT-Food Sci. Technol. 2023, 173, 114271. [Google Scholar] [CrossRef]
  32. Chalupa-Krebzdak, S.; Long, C.J.; Bohrer, B.M. Nutrient density and nutritional value of milk and plant-based milk alternatives. Int. Dairy J. 2018, 87, 84–92. [Google Scholar] [CrossRef]
  33. Sakkas, H.; Bozidis, P.; Touzios, C.; Kolios, D.; Athanasiou, G.; Athanasopoulou, E.; Gerou, I.; Gartzonika, C. Nutritional status and the influence of the vegan diet on the gut microbiota and human health. Medicina 2020, 56, 88. [Google Scholar] [CrossRef]
  34. Tulashie, S.K.; Amenakpor, J.; Atisey, S.; Odai, R.; Akpari, E.E.A. Production of coconut milk: A sustainable alternative plant based milk. Case Stud. Chem. Environ. Eng. 2022, 6, 100206. [Google Scholar] [CrossRef]
  35. Rincon, L.; Botelho, R.B.A.; de Alencar, E.R. Development of novel plant-based milk based on chickpea and coconut. LWT 2020, 128, 109479. [Google Scholar] [CrossRef]
  36. Pérez-Castillo, Í.M.; Williams, J.A.; López-Chicharro, J.; Mihic, N.; Rueda, R.; Bouzamondo, H.; Horswill, C.A. Compositional aspects of beverages designed to promote hydration before, during, and after exercise: Concepts revisited. Nutrients 2024, 16, 17. [Google Scholar] [CrossRef]
  37. Sadowska, A.; Świderski, F.; Rakowska, R.; Waszkiewicz-Robak, B.; Żebrowska-Krasuska, M.; Dybkowska, E. Beverage osmolality as a marker for maintaining appropriate body hydration. Rocz. Państwowego Zakładu Hig. 2017, 68, 167–173. [Google Scholar]
  38. Faria, D.K.; Mendes, M.E.; Sumita, N.M. The measurement of serum osmolality and its application to clinical practice and laboratory: Literature Review. J. Bras. Patol. Med. Lab. 2017, 53, 38–45. [Google Scholar] [CrossRef]
  39. Amaglianim, L.; Silva, J.V.C.; Saffon, M.; Dombrowski, J. On the foaming properties of plant proteins: Current status and future opportunities. Trends Food Sci. Tech. 2021, 118 Pt A, 261–272. [Google Scholar] [CrossRef]
  40. Hayashi, S.; Yanase, E. A study on the color deepening in red rice during storage. Food Chem. 2016, 199, 457–462. [Google Scholar] [CrossRef] [PubMed]
  41. Jeske, S.; Bez, J.; Arendt, E.K.; Zannini, E. Formation, stability and sensory characteristics af a lentil-based milk substitute as affected by homogenisation and pasteurisation. Eur. Food Res. Technol. 2019, 245, 1519–1531. [Google Scholar] [CrossRef]
  42. Jeske, S.; Zannini, E.; Arendt, E.K. Evaluation of physicochemical and glycaemic properties of commercial plant-based milk substitutes. Plant Foods Hum. Nutr. 2017, 72, 26–33. [Google Scholar] [CrossRef]
  43. McClements, D.J. Colloidal basis of emulsion color. Curr. Opin. Colloid Interface Sci. 2002, 7, 451–455. [Google Scholar] [CrossRef]
  44. McClements, D.J. Theoretical prediction of emulsion color. Adv. Colloid Interface Sci. 2002, 97, 63–89. [Google Scholar] [CrossRef]
  45. Alasalvar, C.; Bolling, B.W. Review of nut phytochemicals, fat-soluble bioactives, antioxidant components and health effects. Br. J. Nutr. 2015, 113, 68–78. [Google Scholar] [CrossRef]
  46. Fitrotin, U.; Utami, T.; Hastuti, P.; Santoso, U. Antioxidant properties of fermented sesame milk using Lactobacillus plantarum Dad 13. Int. J. Biol. Sci. 2015, 4, 56–61. [Google Scholar]
  47. Grajek, W. Zmiany potencjału przeciwutleniającego surowców roślinnych w procesach przetwórczych i w czasie trawienia. Żywność 2003, 4, 26–35. [Google Scholar]
Figure 1. The total polyphenol content of tested rice drinks (arithmetic mean ± standard deviation; a–i—mean values in bars marked with different letters differ significantly (p < 0.05)).
Applsci 14 09150 g001
Figure 2. Antioxidant activity of the tested rice beverages (arithmetic mean ± standard deviation; a–f—mean values in bars marked with different letters differ significantly (p < 0.05)).
Applsci 14 09150 g002
Figure 3. Graph of differences and similarities of the studied rice drinks. v1—colour, v2—general smell intensity, v3—sweet smell, v4—milk smell, v5—vanilla smell, v6—rice smell, v7—fat smell, v8—other (caramel) smell, v9—density, v10—viscosity, v11—sweet taste, v12—milk flavour, v13—rice flavour, v14—fat flavour, and v15—other flavour (indicated most often by evaluators as caramel), v16—“body”, v17—overall sensory quality, p1–p10—tested rice drinks, red circles indicate groups of rice beverage samples tested that are similar in terms of similar sensory attributes.
Applsci 14 09150 g003
Table 1. Overview of tested rice drinks.
Beverage Code Beverage Ingredients
RB_1water, rice (12%), sunflower oil, tricalcium phosphate, maltodextrin, sea salt, stabiliser (gellan gum), vitamins (B12, D2), and acidity regulator (potassium phosphates)
RB_2water, rice (14%), sunflower oil, and sea salt
RB_3water, rice (14%), sunflower oil, and sea salt
RB_4water, rice (11%), sunflower oil, calcium carbonate, and salt
RB_5water, rice (12.5%), sunflower oil, calcium carbonate, vegetable fibre, stabilisers: gellan gum, sea salt, and vitamins (D, B12)
RB_6water, rice, sunflower oil, sea salt, and an acidity regulator: calcium carbonate
RB_7water, rice (17%), sunflower oil, and sea salt
RB_8water, rice (15%), sunflower oil, and sea salt
RB_9water, rice (14.4%), sunflower oil, sea salt, and natural vanilla flavouring
RB_10water, rice (12%), cold-pressed sunflower oil, and sea salt
Table 2. The energy value and nutrient content of the tested rice drinks.
Energy and Nutritional ValueRB_1RB_2RB_3RB_4RB_5RB_6RB_7RB_8RB_9RB_10
Energy valuekcal/100 mL47505554505054545237
kJ/100 mL200212229230209211229228221158
Fatg/100 mL1.01.11.01.01.31.31.01.00.90.6
of which s. f. a.*0.10.10.10.10.20.20.10.10.0<0.1
Carbohydratesg/100 mL9.59.911.011.09.29.611.011.011.08.0
of which sugars3.37.17.56.04.33.55.05.07.84.0
Proteing/100 mL0.1<0.5<0.50.20.1<0.1<0.50.30.0<0.5
Saltg/100 mL0.090.080.10.10.120.060.10.070.10.08
Fiberg/100 mL0.0<0.5<0.50.30.30.0<0.50.10.0<0.5
Vitamin B12 μg/100 mL0.38---0.38-----
Vitamin Dμg/100 mL0.75---0.75-----
Calciummg/100 mL120--120-120----
s. f. a.*—saturated fatty acids.
Table 3. Physical parameters of the tested rice beverages.
Beverage CodepHSoluble Solids [%]Osmolality mOsm/kg H2O
RB_17.43 ± 0.01 h10.67 ± 0.29 b260.67 ± 1.53 b
RB_26.70 ± 0.03 d12.17 ± 0.29 d306.00 ± 1.00 c
RB_36.97 ± 0.01 f12.33 ± 0.29 d326.00 ± 1.00 c
RB_47.26 ± 0.01 g11.33 ± 0.29 c360.67 ± 1.53 d
RB_56.93 ± 0.01 e10.17 ± 0.29 b267.33 ± 2.52 b
RB_66.66 ± 0.01 c10.17 ± 0.29 b427.67 ± 6.51 e
RB_76.96 ± 0.01 f12.33 ± 0.29 d364.00 ± 1.00 d
RB_86.59 ± 0.01 b12.67 ± 0.29 d420.00 ± 4.36 e
RB_96.66 ± 0.01 c11.17 ± 0.29 c321.67 ± 3.51 c
RB_106.32 ± 0.01 a8.67 ± 0.29 a193.33 ± 1.53 a
Mean values ± standard deviation with different letters (a–h) in the same column differ significantly (Duncan’s test, p < 0.05).
Table 4. Colour parameters of the tested beverages and their whiteness index.
Beverage CodeL* a*b*White Index (WI)
RB_180.29 ± 0.02 f3.14 ± 0.03 a17.46 ± 0.49 d82.23 ± 0.09 e
RB_283.39 ± 0.01 h5.89 ± 0.01 e13.87 ± 0.26 a84.74 ± 0.04 f
RB_378.41 ± 0.06 c5.94 ± 0.04 e17.35 ± 0.18 d80.53 ± 0.09 c
RB_475.14 ± 0.10 a3.72 ± 0.01 b19.89 ± 0.12 f77.82 ± 0.06 a
RB_576.26 ± 0.15 b6.34 ± 0.04 f19.84 ± 0.57 f79.06 ± 0.29 b
RB_679.79 ± 0.20 e3.89 ± 0.01 c17.57 ± 0.42 d81.80 ± 0.29 d
RB_778.99 ± 0.41 d5.30 ± 0.06 d18.58 ± 0.47 e81.32 ± 0.50 d
RB_882.47 ± 0.47 g6.25 ± 0.09 f15.86 ± 0.20 c84.22 ± 0.50 f
RB_984.87 ± 0.12 i3.89 ± 0.10 c14.59 ± 0.40 b86.20 ± 0.18 g
RB_1078.11 ± 0.11 c6.87 ± 0.06 g16.06 ± 0.09 c80.03 ± 0.12 c
Mean values ± standard deviation with different letters (a–i) in the same column differ significantly (Duncan’s test, p < 0.05).
Table 5. Sensory evaluation of the tested rice drinks.
Sensory DistinctionsRB_1RB_2RB_3RB_4RB_5RB_6RB_7RB_8RB_9RB_10
Colour4.652.244.765.306.543.534.783.391.911.16
S.* sweet1.292.691.982.531.872.511.652.003.342.43
S. milky0.992.101.72.801.222.030.761.622.411.81
S. vanilla0.811.841.671.962.151.310.630.981.761.56
S. rice1.874.562.162.712.253.361.842.973.992.56
S. fatty1.172.371.372.361.552.011.161.222.141.50
S. other (caramel)0.000.400.000.000.380.270.440.850.210.00
Overall smell intensity2.744.732.633.733.653.962.713.384.603.76
Density2.571.541.783.092.462.232.011.632.711.01
Viscosity2.611.811.732.902.512.402.462.312.791.07
T.* sweetness2.825.744.554.993.445.864.525.825.132.79
F.* milky3.32.813.474.242.533.242.433.474.011.89
F. rice3.174.693.664.363.983.533.113.945.003.23
F. fatty2.872.842.423.163.052.972.472.512.801.50
F. other (caramel)0.691.712.161.271.951.531.610.480.772.40
“Body”4.133.743.55.793.885.064.004.385.712.70
Overall sensory quality4.924.834.755.544.385.374.534.745.603.97
S.*—smell; T.*—taste; F.*—flavour.
Disclaimer/Publisher’s Note: The statements, opinions and data contained in all publications are solely those of the individual author(s) and contributor(s) and not of MDPI and/or the editor(s). MDPI and/or the editor(s) disclaim responsibility for any injury to people or property resulting from any ideas, methods, instructions or products referred to in the content.

