Article

Biomechanical Characterization of Abdominal Aortic Aneurysm: The Rupture Mechanism

1
Department of Biomedical Engineering and Science, Florida Institute of Technology, Melbourne, FL 32901, USA
2
Department of Surgery, University of Nebraska Medical Center, Omaha, NE 68198, USA
*
Authors to whom correspondence should be addressed.
Appl. Sci. 2024, 14(2), 613; https://doi.org/10.3390/app14020613
Submission received: 11 December 2023 / Revised: 29 December 2023 / Accepted: 5 January 2024 / Published: 11 January 2024
(This article belongs to the Section Biomedical Engineering)

Abstract

:
In this work, a four-week-old male C57Bl/6 mouse model of abdominal aortic aneurysm (AAA) was developed to examine the AAA rupture mechanism. Immunofluorescence staining was adopted for quantifying the degradation of elastin, and Picrosirius Red staining was adopted for evaluating the density of collagen. Atomic force microscopy with two probe tip sizes of 5 µm and 20 nm was adopted for mechanical characterization of the AAA. The microstructure changes and stiffness changes in both AAA samples and controlled samples were inspected. The degradation of elastin, wall thickening, formation of micro vessels, and increased density of collagen were observed in the AAA samples. The AAA samples also exhibited fragmented texture from AFM scanning. The histogram of stiffness measurements of the AAA samples with a 20 nm tip demonstrated two unique peak frequencies of stiffness intervals (0–10 kPa and 40–50 kPa). The stiffer regions were correlated with the increased density of collagen, as shown in the immunofluorescence images. The softer regions, combined with the fragmented texture, could be the key index contributing to the initiation and propagation of AAA rupture. Overall, the AAA group showed a higher stiffness than the control group (50.77 ± 62.4 kPa vs. 40.6 ± 51.86 kPa). The findings from this work may help in explaining ruptures in small AAA (<5.5 mm), which account for ten percent of all AAA ruptures. Additionally, the observations in this study may help develop early detection methods and innovative treatments for AAA.

1. Introduction

Abdominal aortic aneurysm (AAA) is a progressive, inflammatory disease of the infrarenal aorta leading to irreversible aortic dilation. The consequences of AAA rupture can be severe and life-threatening [1,2,3]. AAA diameter has been widely acknowledged as a risk factor of AAA rupture [4]. AAA with a diameter exceeding 5.5 cm is commonly recommended for intervention [5]. This risk factor has raised questions. For example, Kontopodis et al. reported that 60% of AAA cases with a diameter greater than 5 cm did not rupture, while 13% of AAA cases with a diameter less than 5 cm experienced ruptures; more reliable rupture risk markers are needed [6]. In addition, the mechanism of rupture in small AAA, which accounts for 10% of AAA rupture, is still not clear [7]. Various studies have looked into other potential factors, including wall thickness, stiffness, genetic variation, intraluminal thrombus, hemodynamics, and annual growth rate of the AAA [4,8,9,10,11,12,13,14,15]. Shum et al. measured the ruptured human aneurysms showing thickened aortic walls in 1.78 ± 0.39 mm, while the unruptured ones were in 1.48 ± 0.22 mm [16]. Raghavan et al. also determined the variation in human AAA wall thickness from rupture sites as low as 0.23 mm to the calcified site in 4.26 mm (median = 1.48 mm) [17]. Even though no better risk factors have been identified, it is commonly recognized that the progression of AAA is linked to substantial changes in the microarchitecture of the aortic wall and the loss of mechanical integrity, specifically the progression of AAA-induced fragmentation of elastin fibers, elastin degradation, loss of proper functioning of the smooth muscle cells, and the resulting deposition of collagen concentration for repairing/compensating the damaged aortic wall [18,19]. The newly deposited collagen fibers are typically distributed in a random manner, which might disrupt their intended functionality [20]. An imbalance between collagen degradation and collagen synthesis could lead to catabolic conditions, which might contribute to AAA rupture [18,21].
The increased wall stiffness has been quantified in AAA patients utilizing pulse wave velocity measurement [22]. But the way mechanical property changes contribute to AAA rupture is still not clear. One study using uniaxial tensile test has shown that different regions of the AAA have different yield stress, and that lower yield stress may result in the initiation of AAA rupture [23]. Another study has shown that ruptured AAA samples are not weaker than unruptured ones in terms of global failure stress and failure strain [24]. Both studies indicate the necessity of the micromechanical characterization of the AAA. Lindeman et al. determined the microstructure of AAA through histology and confocal microscopy, and further quantified the mechanical properties of AAA with atomic force microscopy (AFM) [20]. The study has shown that the microstructure of the AAA tissue led to different mechanical properties, and further mechanical failure. The microstructure of AAA and the heterogeneous mechanical behaviors need to be further exploited for better understanding the mechanism of AAA rupture.
The goal of this work is to identify the AAA rupture prediction using combined histological analysis and micromechanical characterizations. The relationship between aortic wall microstructure and its stiffness in both AAA samples and controlled ones, both of which are obtained from four-week-old male C57Bl/6 mice, are quantified. The degradation of elastin, density of collagen, and morphology changes in the AAA wall will be inspected with histological analysis. Mechanical characterization will be conducted with AFM indentation.

2. Material and Methods

2.1. Mouse Model of AAA

The animal study protocol was approved by the Institutional Animal Care and Use Committee (IACUC) of the University of Nebraska Medical Center (protocol code: 17-074-08-FC and date of approval: 17 June 2020). The study utilized 9 male C57Bl/6 mice, aged four weeks, 5 mice for elastase-induced AAA formation, and 4 mice for control. Anesthesia and laparotomy were applied to mice for isolating the abdominal aorta (between the bifurcation of the iliac artery and renal artery). Briefly, 5 µL porcine pancreatic elastase (60 U/mL) was typically applied to the infrarenal aorta for five minutes. Mice serving as AAA controls were treated with heat-inactivated porcine pancreatic elastase. Immediately following elastase exposure, 0.9% sterile saline was applied to rinse the aorta and the incision was closed. After four weeks, the mice were processed with repeated laparotomy, and the aortas were dissected and measured. Then, the dissected aorta tissues were collected for AFM and histological studies.

2.2. Aorta Sample Preparation

The aorta extracted from each mouse was kept in a 1.5 mL Eppendorf tube with 1 mL 85% glycerin [25]. The tubes with aorta samples were stored in a −80 °C fridge before sectioning. The aorta segments were immersed in optimal cutting temperature (OCT) compound (Tissue-Tek, Torrance, CA, USA) and frozen in a −20 °C fridge for cryosectioning. Aorta samples were cut into sections of 10 um thickness using a Leica cryostat (Leica, Wetzlar, Germany), and then fixed in 4% paraformaldehyde. Aorta sections were attached on FrostPlus slides (Epredia, Kalamazoo, MI, USA) without surface corrugation and stored in a −20 °C fridge. Before the AFM indentation test, sections were stored at room temperature to thaw the section for 10 min, and then submerged in 1× phosphoric buffer solution (PBS) for 30 min to dissolve the OCT compound.

2.3. Histological and Immunofluorescence Analysis

All biological and chemical supplies applied to histological and immunofluorescence analysis were purchased from Fisher Scientific (Pittsburgh, PA, USA), except for a Picrosirius Red staining kit from Polysciences Inc. (Warrington, PA, USA), and all antibodies were from Abcam (Cambridge, MA, USA).
Immunofluorescence staining was performed as in a previous study [26]. Cell nuclei were stained with mounting medium with 4′,6-diamino-2-phenylindole dihydrochloride (DAPI). Primary antibodies were used for staining the tissues to investigate cell phenotype by detecting the extracellular matrix (ECM) component collagen type I and elastin, and an Alexa 633-conjugated secondary antibody was utilized. Aorta sections set as negative controls were not applied with primary antibody, and positive controls were other tissue types (e.g., small intestine for collagen type I and kidney for elastin) processed with the same immunofluorescence staining with aorta samples. Images were taken with a Zeiss Axio Observer A.1 fluorescent microscope (Thornwood, NY, USA) and ImagePro Software (ImagePro Plus 7.0). Conduits from n = 3 sections per treatment were applied for immunofluorescence analysis.
Picrosirius Red was used for staining collagen bundles [27] to determine the amount and organization of collagen in the walls and lumen of the aortas. Sections in different conditions were stained with Picrosirius Red F3BA based on the instructions provided by the manufacturer, followed by a dehydrating and mounting process. Picrosirius Red-stained samples were imaged with bright field microscopy. Three sections were used for each condition of AAA or control aorta (n = 3).

2.4. AFM Indentation Test

Aorta stiffness measurement was conducted by AFM, JPK Force Robot 300 (JPK Instruments, Berlin, Germany). Aorta sections on slides were tested in 1× phosphate-buffered saline (PBS) solution. An SAA-SPH-5µm probe (Bruker, Leipzig, Germany) (0.25 N/m spring constant, 8 kHz frequency, 5 µm spherical tip radius) was used for obtaining the average Young’s modulus of the aorta sections. In total, five sections from the five AAA mice models and four sections from the four control healthy mice were obtained, respectively, for an AFM indentation test with the SAA-SPH-5µm probe. The scanned regions were determined using an integrated Axio Observer inverted microscope (Carl Zeiss, Göttingen, Germany), as shown in Figure 1a. One section was obtained for the AFM test from each AAA and healthy mouse model. Two regions of interest were selected at the aorta medial layer from each section with 10 × 10 µm2, 8 × 8 indentation points represented in Figure 1b. In total, 593 force curves were obtained from the indentation points on AAA, and 441 force curves were obtained from healthy aorta to assess the aorta local stiffness.
An MLCT-C probe (Bruker, Germany) (0.01 N/m spring constant, 4 kHz frequency, 20 nm tip curvature radius) was adopted for acquiring stiffness maps and corresponding histograms of aorta section. One section from one of the five AAA mice models and one section from one of the four control mice were obtained for an AFM indentation test with a 20 nm tip MLCT-C probe. The region of interest included two randomly selected 15 × 15 µm2 scanning regions with 16 × 16 indentation points, and one randomly selected 15 × 15 µm2 region with 20 × 20 indentation points at AAA and control aorta media, respectively. In total 802 force curves were collected from the indentation points on AAA, and 836 force curves were collected from healthy aorta to obtain aortic local stiffness.

2.5. Data Processing

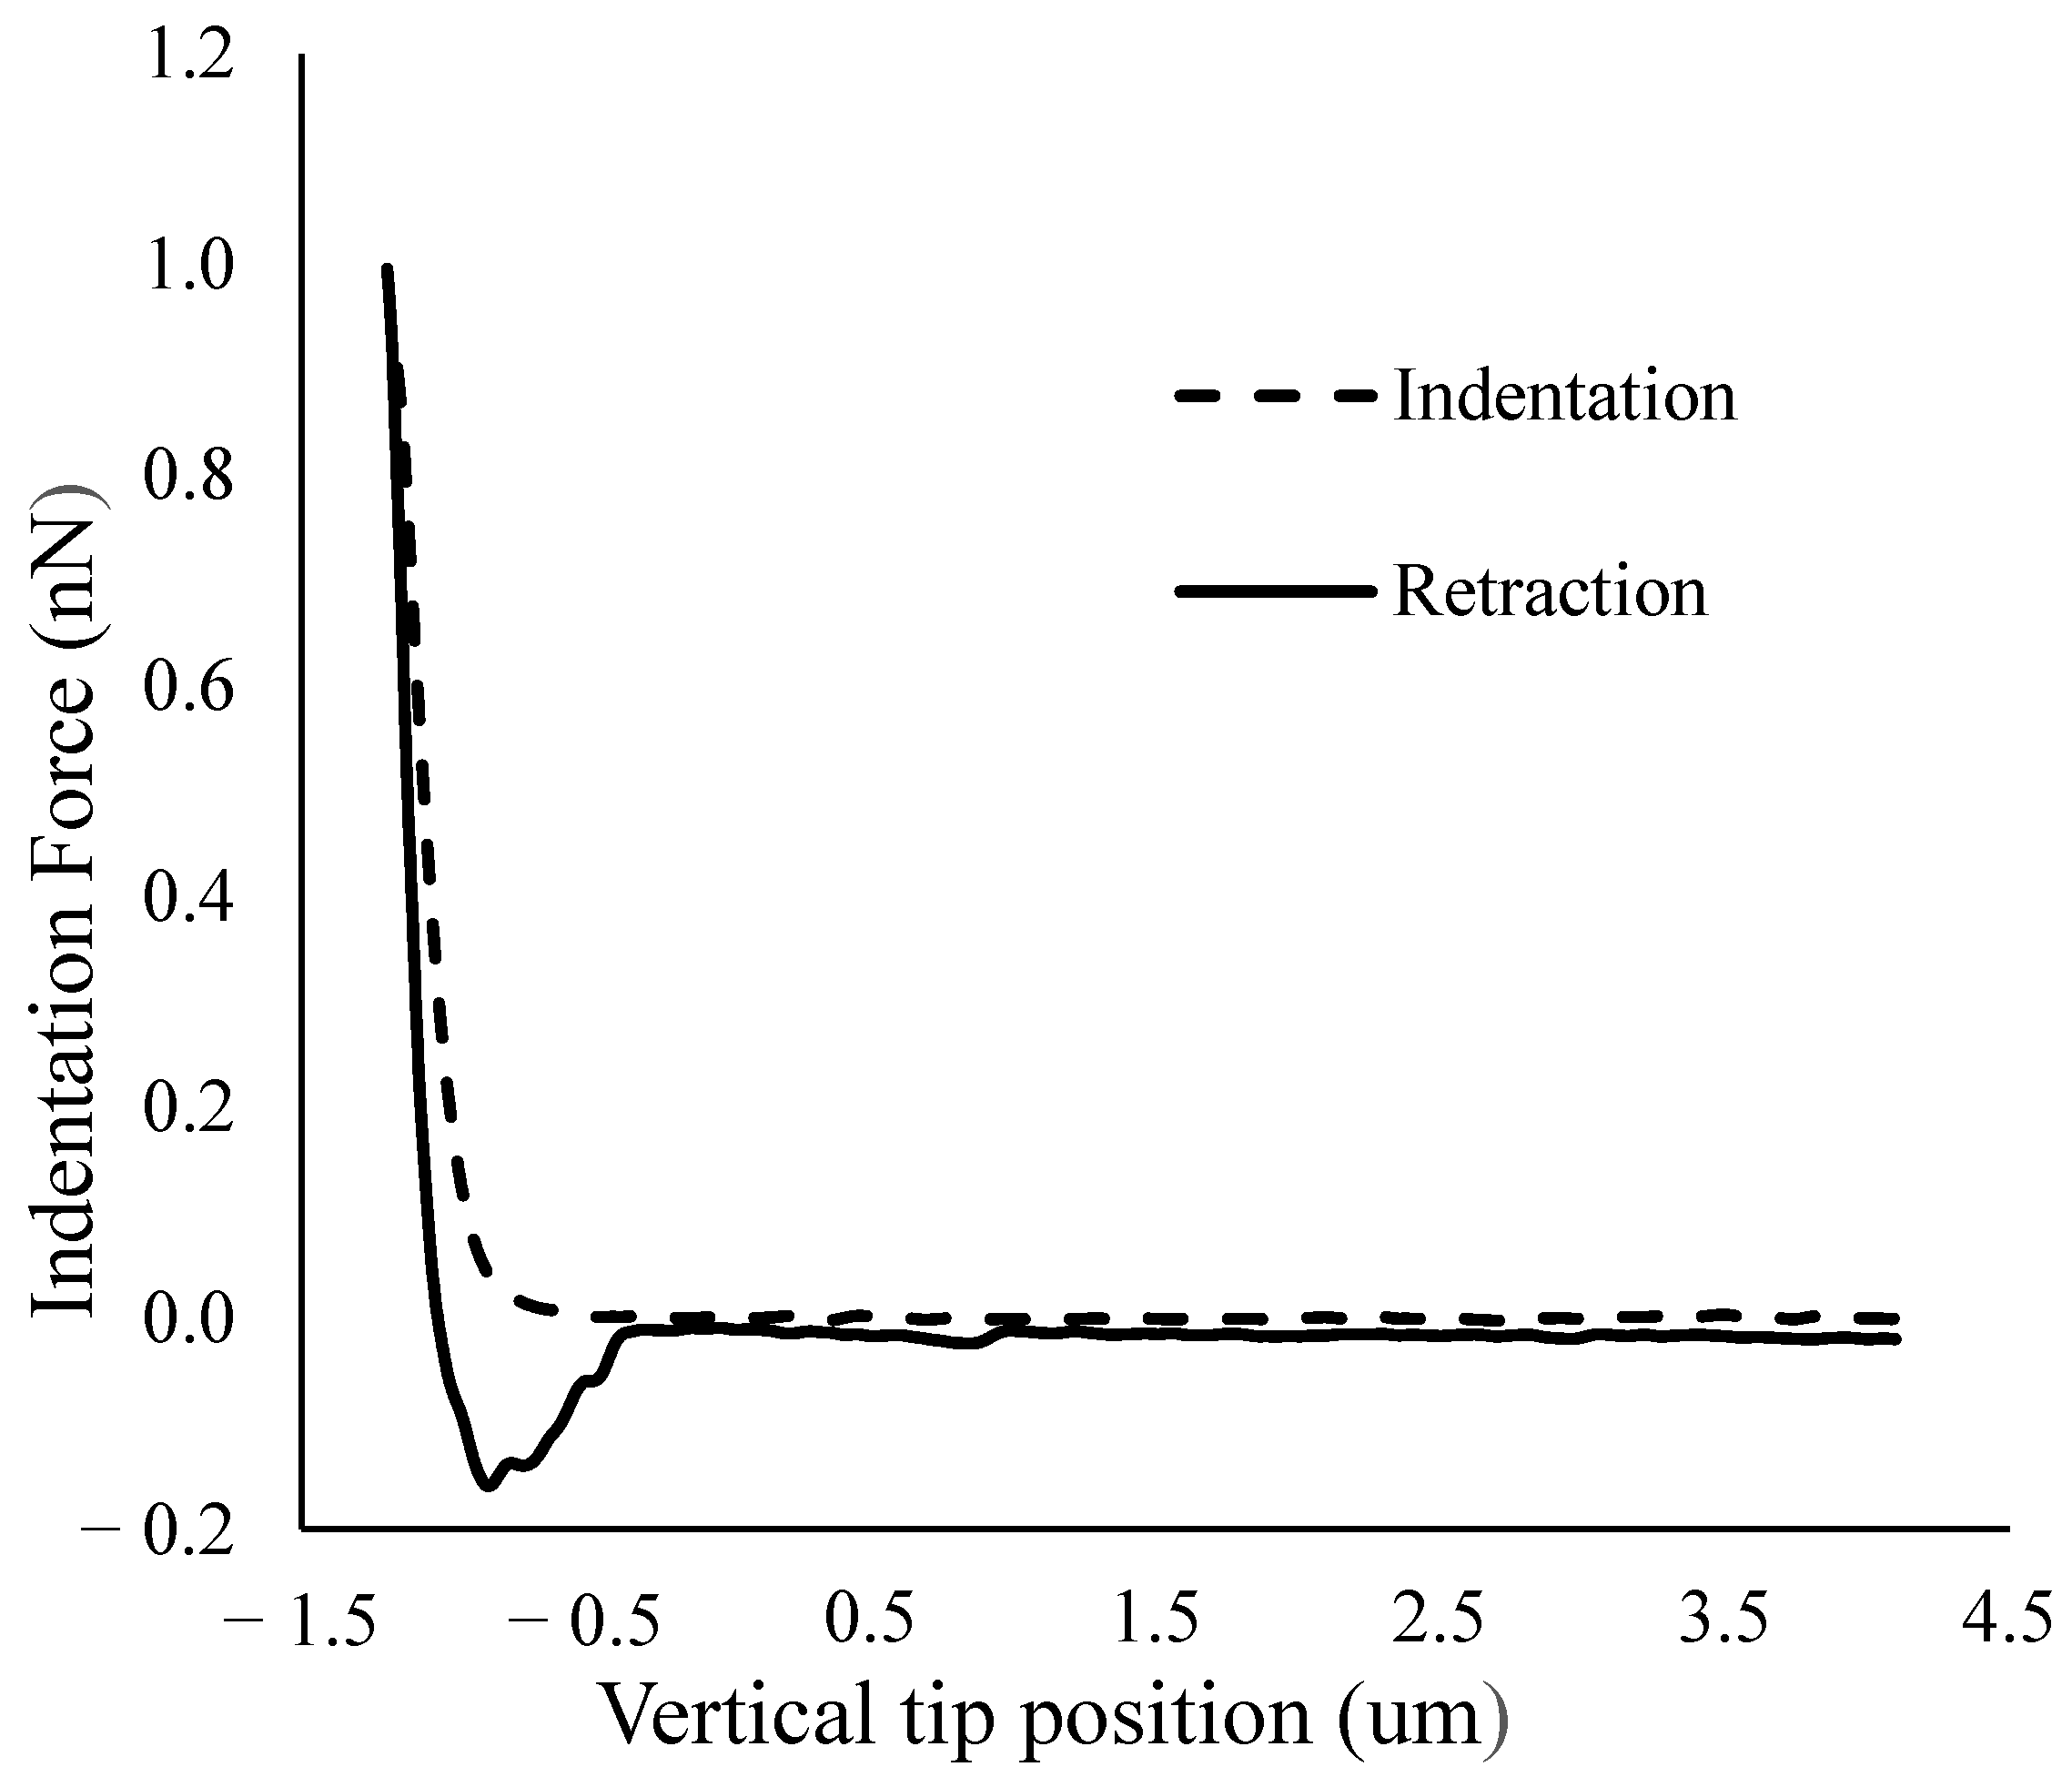
All force curves were post-processed by curve fitting with the Hertz model (Equation (1)) to evaluate Young’s modulus, where F is the indentation force, E is the Young’s modulus, c (Equation (2)) is a constant composed of ν (a Poisson ratio of 0.5 for the aorta), R (the tip radius, which is 5 µm for the SAA-SPH-5µm probe, and 20 nm for the MLCT-C probe), and ẟ (the indentation depth). The representative force–displacement curve is shown in Figure 2, where the indentation force curve (dash line) was applied for curve-fitting.
F s p h e r e   = E · c = 4 E 3 ( 1 v 2 ) R δ 3 2
c = 4 3 ( 1 v 2 ) R δ 3 2

2.6. Statistical Method

Aorta stiffness was presented as mean ± SD, as shown in the bar chart. The elastic modulus fitted from all force–displacement curves in the region of interest were averaged, resulting in a final stiffness. The stiffness measurements for all the regions of interest were further averaged for each aorta condition. The normality was calculated using a two-sample unequal variance T test to represent the average Young’s modulus differences of the medial layer. Statistically significant differences between the AAA arteries and healthy arteries were studied.

3. Results

3.1. Histological Analysis

The histological analyses of the AAA groups and control groups, using immunofluorescence staining and Picrosirius Red staining, are shown in Figure 3. The elastase treatment effectively induced AAA, represented by the enlargement of the lumen area and the degeneration of elastin (some elastic lamellae residuals were observed, but they were very minimal). The AAA groups showed a thicker vessel wall and higher collagen density (darker red color) in the medial layer compared with the control group (Figure 3c). In addition, microvessels (Figure 3c,d, marked with black arrows) were observed in both the medial and adventitial layers in AAA group, while they were only observed in the adventitial layer in the control group.

3.2. Micromechanical Properties of the Mice Artery

Stiffness maps of the media layer in the AAA group and the control group are shown in Figure 4. Both the AAA and control groups clearly showed two phases, which we assumed to be collagen and elastin, respectively. The AAA group showed discontinuities in the stiffness map, as the yellow dashed lines show the boundaries in Figure 4a,b. As a contrast, the control group showed a strip pattern of collagen and elastin (Figure 4c,d). The fragmented pattern in the AAA group and the striped pattern in the control group are consistent with the observations of inverted microscopy. The orientation of the elastin stripes in the stiffness maps was also consistent with observations made using an inverted microscope. The width of the elastin stripes was 2–5 µm, as quantified with the inverted microscope.
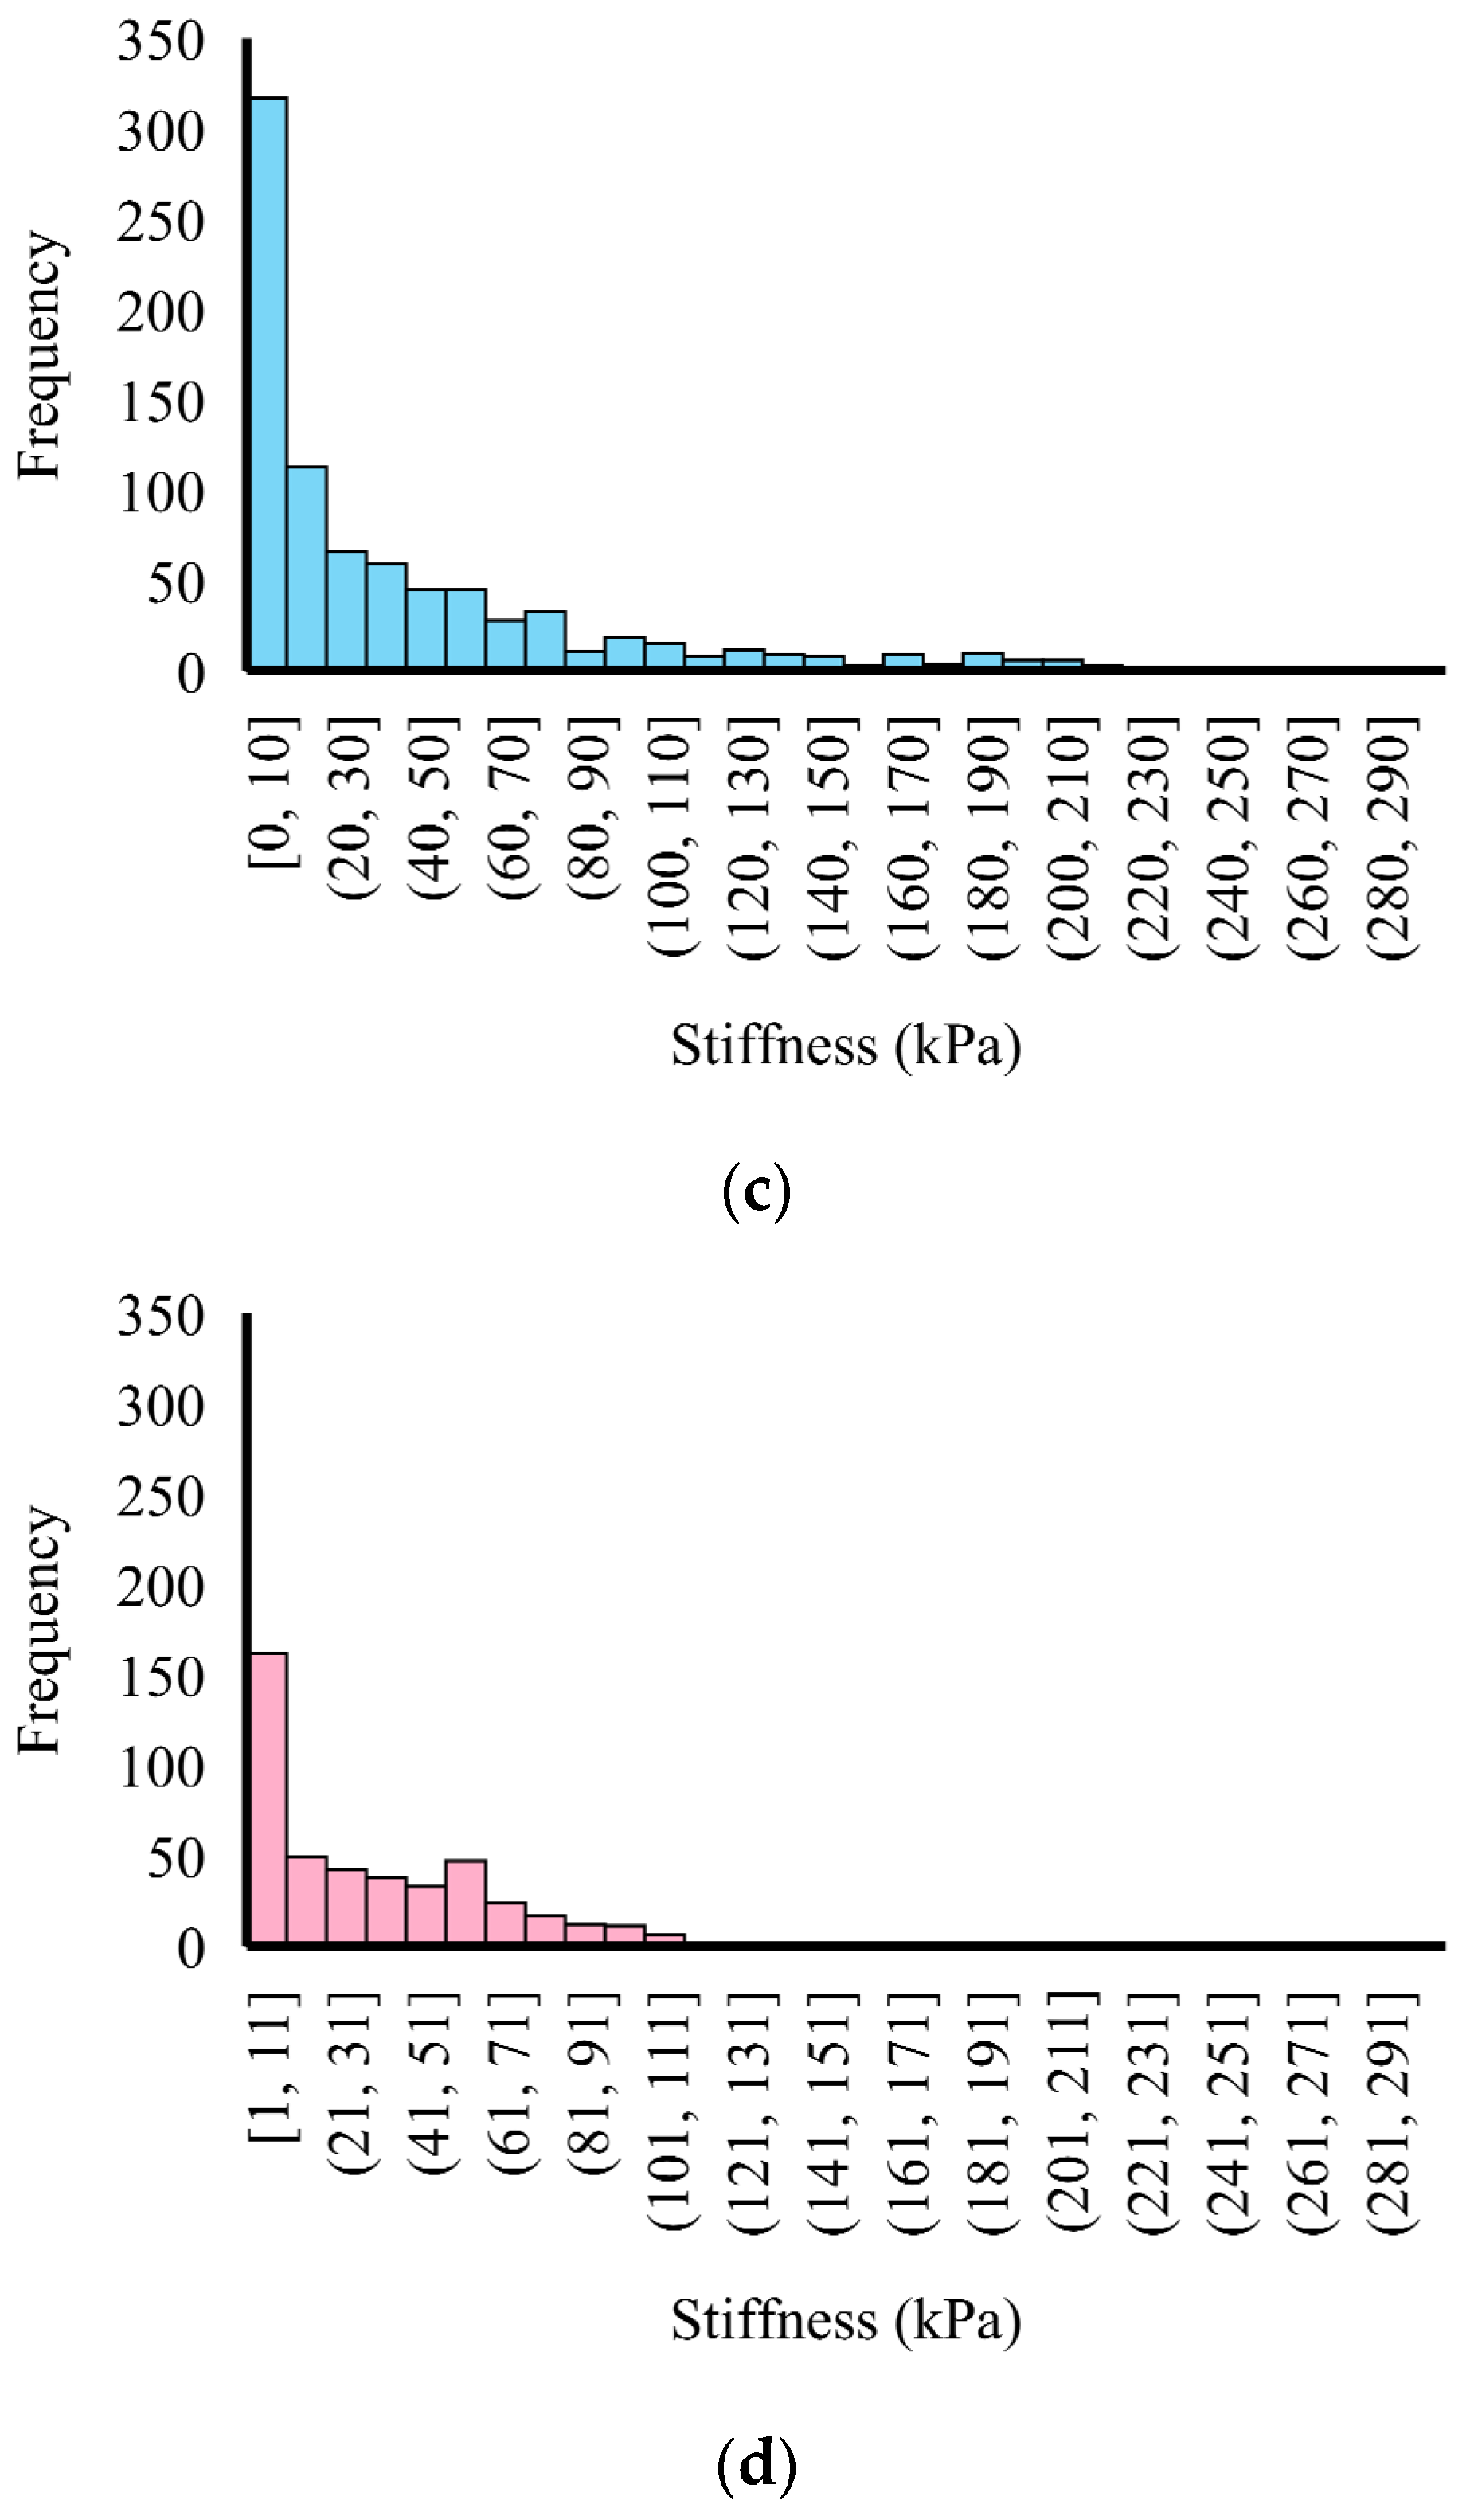
Histograms from AFM scanning with two different probe sizes for the AAA group and control group are shown in Figure 5. Both the AAA group and the control group, tested with the probe tip size of 20 nm, showed a larger range of stiffness than the probe size of 5 µm. This is because the larger probe size showed relative higher averaged values due to the larger indent area, and thus the relatively low and high stiffnesses of individual fibrils were omitted. The differences in histograms detected by different probe sizes indicated that the aortas are highly heterogeneous, no matter if they were from the AAA group or the control group. The AAA group showed a peak frequency in the interval of 40–50 kPa for both probe sizes, which is not observed in the control group. This peak frequency at a high stiffness interval indicates the increased stiffness of AAA due to the increased density of collagen. Although the inverted microscopy for the control group showed separate elastin and collagen phases, this group showed quite a similar histogram with two different probe sizes.
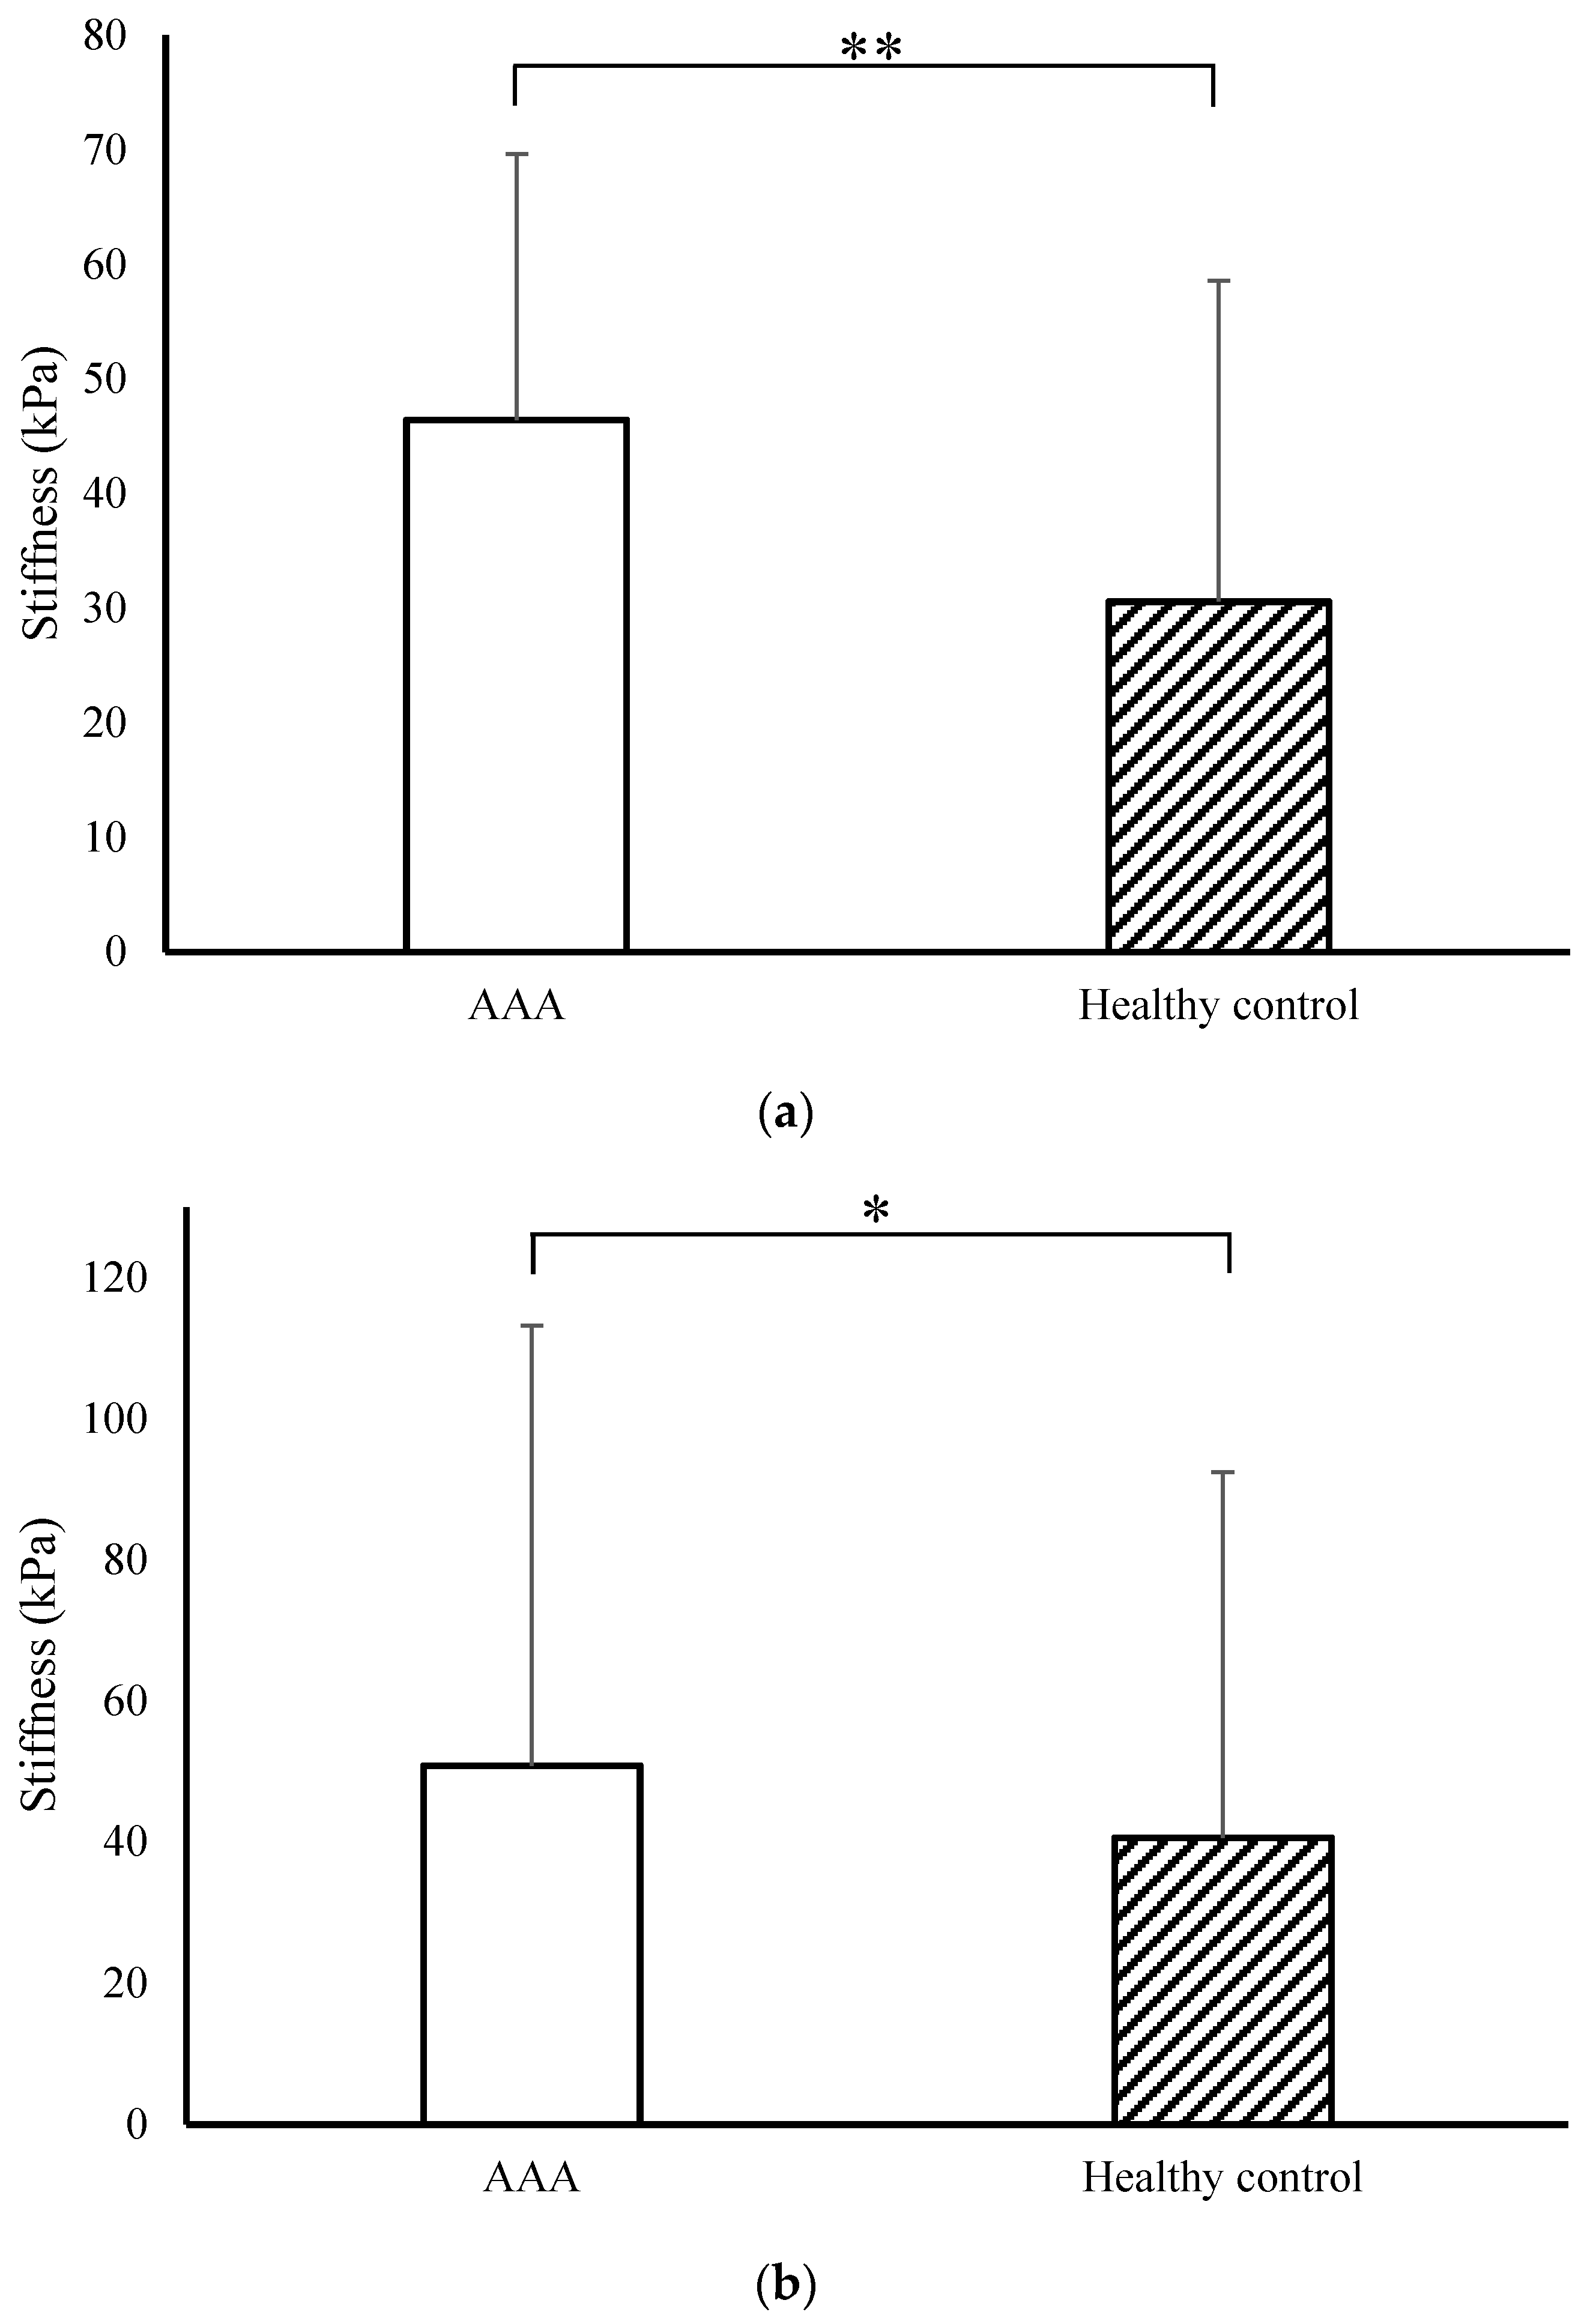
The Young’s modulus of the AAA group and the control group, in terms of averaged values of different scanning sites and with different probe sizes, are presented in Figure 6. In total, 1395 indentation curves for AAA groups and 1277 indentation curves for the control group were tested. The AAA group showed a significant higher stiffness than the control group, and the results were consistent with different probe sizes (46.42 ± 23.18 kPa vs. 30.58 ± 28.01 kPa for a probe size of 5 µm, 50.77 ± 62.4 kPa vs. 40.6 ± 51.86 kPa for a probe size of 20 nm). The probe size of 20 nm showed a larger standard deviation for both the AAA group and control groups, as expected, as shown by the larger stiffness ranges observed in the histograms in Figure 5.

4. Discussion

The mechanical characterization of AAA at the micro-length scale is essential for disease management, especially the prediction of AAA rupture. In this work, the microstructures and mechanical properties of AAA were quantified using AFM, along with histology analysis. The AAA samples were dissected from the elastase-treated mouse AAA model. It is clear from AFM scanning that the control group has aligned texture, while the AAA group has a fragmented texture. The heterogeneity of AAA was investigated with two AFM probe tip sizes of 5 µm and 20 nm. From tip size of 20 nm, the histogram of the stiffnesses clearly shows two frequency peaks in the AAA group, which was not observed in the control group. The AAA group showed a significant higher stiffness than the control group with a tip size of 5 µm. The two frequency peaks in the AAA group with the 20 nm probe indicate that the weak region may contribute to the initiation and propagation of AAA rupture.
Our mouse AAA model was successfully developed using elastase treatment, as shown in our histological analysis. The enlargement of the lumen, degradation of the elastin, increased density of collagen, and formation of microvessels were clearly observed in AAA samples. Xue et al. have shown a detailed surgical procedure to maintain a stable AAA growth rate by directly applying the porcine pancreatic elastase to the adventitia layer of the artery [28]. Another study has shown that a chronic AAA model could be induced with the combination of β-aminopropionitrile (BAPN) administration and periaortic elastase, which demonstrated persistent long-term aneurysm growth, thrombus formation, and spontaneous rupture [29]. In our AAA model, a complete degradation of elastin lamellae was observed in the artery, with minimal local residual elastin observed. Additionally, the thickening of the artery wall and microvessels’ formation were observed in this work, which is consistent with the documented studies [30,31]. Although quite a few studies have shown the decline of the wall thickness during AAA progression [32], wall thickening and microvessel formation at the initial stage of AAA have not been sufficiently studied. The thickening process might be result from the endocytic regulation of growth factors against AAA [31], which has been described as “good intentions to try and make more smooth muscle, but actually it makes the problem worse” [33]. This wall thickening and microvessel formation at the initial stage of AAA may provide a window into understanding the initiation of AAA for the development of an early method of detection and treatment.
Rupture prediction is essential for AAA management, including the decision to undertake elective repair of AAA [34]. Current surgery decisions are based on an AAA maximum diameter of 5.5 mm [5]. A retrospective study on massive untreated large AAA in patients has shown that the risk of death from causes other than AAA was higher than the risk of death from rupture [35]. On the other hand, the rupture rate of the small AAA (size < 5.5 mm) appears to be between less than 1.61 per 100 person years [36], and accounts for 10% of AAA rupture [7]. These observations indicate a dire need to improve rupture prediction for small AAA, and to rethink the mechanism of rupture in large AAA. It is well acknowledged, based on the Laplace formula σh = PD/2t, that a larger AAA size (D) correlates with high hoop stress (σh) in the vessel wall for a certain blood pressure P and wall thickness t. However, this formula is not sufficient for the complicated rupture prediction. Some studies have shown that wall characterization through factors such as the metabolism, calcification, intraluminal thrombus, and compliance has the potential to predict the AAA growth and further rupture [37].
It has been widely accepted that the mechanical properties of AAA are essential for rupture prediction. Uniaxial tensile tests have shown that different regions of AAA have different yield stress/strain, and the lower values may contribute to AAA rupture [23]. However, another comparative study has shown that ruptured AAAs were not found to be weaker on average than unruptured ones [24]. Microstructure characterization using AFM herein provides more additional mechanical details of AAA. We observed fragmented texture and heterogeneous stiffness in the AAA samples. Higher stiffness was attributed to the high density of collagen, while weaker regions with lower stiffness were attributed to the formation of microvessels and regions between fragments. This weak region was speculated to be associated with a higher risk of AAA rupture initiation and propagation. Higher stiffness with a fragmented texture does not guarantee a higher toughness or larger fracture strain. This study emphasizes microstructure changes in the prediction of small AAA rupture, a scenario in which AAA diameter does not play a significant role. Microstructure changes may also help explain the significantly different risks of AAA rupture between genders [38]. According to this research, the criterion for elective AAA repair could be further enhanced by considering microstructural changes and histological changes such as the formation of microvessels and fragmented texture.
Several limitations in this study need to be mentioned. First is the sample size; the five AAA mice and four control mice led to large variability in the testing datasets. It is expected that a larger sample size may mitigate unstable quantifications. Additionally, our samples were harvested exactly after 4 weeks. Considering dynamic AAA progression within the microstructure, and the morphological changes, more time points are needed to capture AAA progression. Furthermore, co-registration between the AFM scanning and the histological images could be enhanced and thus lead to more precise quantification of each component.

5. Conclusions

In conclusion, in this work, we successfully induced AAA in a mouse model. Mechanical characterization and histological analysis of AAA were conducted. Lumen enlargement, wall thickening, degradation of elastin, formation of microvessels, and increased density of collagen were observed in this work. The AAA sample showed a fragmented texture and higher stiffness. AFM scanning with a nanometer tip can reveal the microstructure heterogeneity, i.e., weak and strong regions, in the AAA sample. The fragmented texture and weak regions are speculated to contribute to rupture initiation and propagation in small AAA, a scenario in which AAA diameter has a limited effect. Wall thickening and formation of microvessels may occur at the initial stage of AAA, and may provide the opportunity for early detection and innovative treatment of AAA. These findings provide some insight into AAA progression and the mechanism of vessel rupture.

Author Contributions

Conceptualization, P.D., W.X. and L.G.; Methodology, P.D. and L.G.; Formal analysis, Y.Z. and A.I.D.; Investigation, Y.Z., A.I.D. and M.S.; Writing—original draft, Y.Z., A.I.D. and P.D.; Writing—review & editing, W.X., C.A.B. and L.G.; Supervision, P.D., C.A.B. and L.G.; Project administration, L.G.; Funding acquisition, L.G. All authors have read and agreed to the published version of the manuscript.

Funding

This research received no external funding.

Institutional Review Board Statement

The animal study protocol was approved by the Institutional Animal Care and Use Committee (IACUC) of the University of Nebraska Medical Center (protocol code: 17-074-08-FC and date of approval: 17 June 2020).

Informed Consent Statement

Not applicable.

Data Availability Statement

The raw data supporting the conclusions of this article will be made available by the authors on request.

Conflicts of Interest

The authors declare no conflict of interest.

References

  1. Guo, M.H.; Appoo, J.J.; Saczkowski, R.; Smith, H.N.; Ouzounian, M.; Gregory, A.J.; Herget, E.J.; Boodhwani, M. Association of Mortality and Acute Aortic Events With Ascending Aortic Aneurysm: A Systematic Review and Meta-Analysis. JAMA Netw. Open 2018, 1, e181281. [Google Scholar] [CrossRef] [PubMed]
  2. O’Donnell, T.F.X.; Landon, B.E.; Schermerhorn, M.L. AAA Screening Should Be Expanded. Circulation 2019, 140, 889–890. [Google Scholar] [CrossRef] [PubMed]
  3. Al-Balah, A.; Goodall, R.; Salciccioli, J.D.; Marshall, D.C.; Shalhoub, J. Mortality from Abdominal Aortic Aneurysm: Trends in European Union 15+ Countries from 1990 to 2017. J. Br. Surg. 2020, 107, 1459–1467. [Google Scholar] [CrossRef] [PubMed]
  4. Groeneveld, M.E.; Meekel, J.P.; Rubinstein, S.M.; Merkestein, L.R.; Tangelder, G.J.; Wisselink, W.; Truijers, M.; Yeung, K.K. Systematic Review of Circulating, Biomechanical, and Genetic Markers for the Prediction of Abdominal Aortic Aneurysm Growth and Rupture. J. Am. Heart Assoc. 2018, 7, e007791. [Google Scholar] [CrossRef] [PubMed]
  5. Lederle, F.A.; Johnson, G.R.; Wilson, S.E.; Ballard, D.J.; Jordan, J.; William, D.; Blebea, J.; Littooy, F.N.; Freischlag, J.A.; Bandyk, D.; et al. Rupture Rate of Large Abdominal Aortic Aneurysms in Patients Refusing or Unfit for Elective Repair. JAMA 2002, 287, 2968–2972. [Google Scholar] [CrossRef]
  6. Kontopodis, N.; Pantidis, D.; Dedes, A.; Daskalakis, N.; Ioannou, C.V. The—Not So—Solid 5.5 Cm Threshold for Abdominal Aortic Aneurysm Repair: Facts, Misinterpretations, and Future Directions. Front. Surg. 2016, 3, 1. [Google Scholar] [CrossRef]
  7. Bellamkonda, K.S.; Nassiri, N.; Sadeghi, M.M.; Zhang, Y.; Guzman, R.J.; Ochoa Chaar, C.I. Characteristics and Outcomes of Small Abdominal Aortic Aneurysm Rupture in the American College of Surgeons National Surgical Quality Improvement Program Database. J. Vasc. Surg. 2021, 74, 729–737. [Google Scholar] [CrossRef]
  8. Barrett, H.E.; Cunnane, E.M.; Hidayat, H.; O’Brien, J.M.; Moloney, M.A.; Kavanagh, E.G.; Walsh, M.T. On the Influence of Wall Calcification and Intraluminal Thrombus on Prediction of Abdominal Aortic Aneurysm Rupture. J. Vasc. Surg. 2018, 67, 1234–1246.e2. [Google Scholar] [CrossRef] [PubMed]
  9. Di Martino, E.S.; Bohra, A.; Vande Geest, J.P.; Gupta, N.; Makaroun, M.S.; Vorp, D.A. Biomechanical Properties of Ruptured versus Electively Repaired Abdominal Aortic Aneurysm Wall Tissue. J. Vasc. Surg. 2006, 43, 570–576. [Google Scholar] [CrossRef]
  10. Vorp, D.A. Biomechanics of abdominal aortic aneurysm. J. Biomech. 2007, 40, 1887–1902. [Google Scholar] [CrossRef] [PubMed]
  11. Pape, L.A.; Tsai, T.T.; Isselbacher, E.M.; Oh, J.K.; O’Gara, P.T.; Evangelista, A.; Fattori, R.; Meinhardt, G.; Trimarchi, S.; Bossone, E.; et al. Aortic Diameter ≥5.5 Cm Is Not a Good Predictor of Type A Aortic Dissection: Observations From the International Registry of Acute Aortic Dissection (IRAD). Circulation 2007, 116, 1120–1127. [Google Scholar] [CrossRef]
  12. Dale, M.A.; Suh, M.K.; Zhao, S.; Meisinger, T.; Gu, L.; Swier, V.J.; Agrawal, D.K.; Greiner, T.C.; Carson, J.S.; Baxter, B.T.; et al. Background Differences in Baseline and Stimulated MMP Levels Influence Abdominal Aortic Aneurysm Susceptibility. Atherosclerosis 2015, 243, 621–629. [Google Scholar] [CrossRef]
  13. Zhao, S.; Li, W.; Gu, L. Biomechanical Prediction of Abdominal Aortic Aneurysm Rupture Risk: Sensitivity Analysis. J. Biomed. Sci. Eng. 2012, 5, 664–671. [Google Scholar] [CrossRef]
  14. Chen, H.; Bi, Y.; Ju, S.; Gu, L.; Zhu, X.; Han, X. Hemodynamics and Pathology of an Enlarging Abdominal Aortic Aneurysm Model in Rabbits. PLoS ONE 2018, 13, e0205366. [Google Scholar] [CrossRef] [PubMed]
  15. Lin, S.; Han, X.; Bi, Y.; Ju, S.; Gu, L. Fluid-Structure Interaction in Abdominal Aortic Aneurysm: Effect of Modeling Techniques. BioMed Res. Int. 2017, 2017, 7023078. [Google Scholar] [CrossRef] [PubMed]
  16. Shum, J.; DiMartino, E.S.; Goldhammer, A.; Goldman, D.H.; Acker, L.C.; Patel, G.; Ng, J.H.; Martufi, G.; Finol, E.A. Semiautomatic Vessel Wall Detection and Quantification of Wall Thickness in Computed Tomography Images of Human Abdominal Aortic Aneurysms. Med. Phys. 2010, 37, 638–648. [Google Scholar] [CrossRef] [PubMed]
  17. Raghavan, M.L.; Kratzberg, J.; Castro De Tolosa, E.M.; Hanaoka, M.M.; Walker, P.; Da Silva, E.S. Regional Distribution of Wall Thickness and Failure Properties of Human Abdominal Aortic Aneurysm. J. Biomech. 2006, 39, 3010–3016. [Google Scholar] [CrossRef]
  18. Sakalihasan, N.; Limet, R.; Defawe, O.D. Abdominal Aortic Aneurysm. Lancet 2005, 365, 1577–1589. [Google Scholar] [CrossRef]
  19. Bhamidipati, C.M.; Mehta, G.S.; Lu, G.; Moehle, C.W.; Barbery, C.; DiMusto, P.D.; Laser, A.; Kron, I.L.; Upchurch, G.R.; Ailawadi, G. Development of a Novel Murine Model of Aortic Aneurysms Using Peri-Adventitial Elastase. Surgery 2012, 152, 238–246. [Google Scholar] [CrossRef]
  20. Lindeman, J.H.N.; Ashcroft, B.A.; Beenakker, J.-W.M.; Van Es, M.; Koekkoek, N.B.R.; Prins, F.A.; Tielemans, J.F.; Abdul-Hussien, H.; Bank, R.A.; Oosterkamp, T.H. Distinct Defects in Collagen Microarchitecture Underlie Vessel-Wall Failure in Advanced Abdominal Aneurysms and Aneurysms in Marfan Syndrome. Proc. Natl. Acad. Sci. USA 2010, 107, 862–865. [Google Scholar] [CrossRef]
  21. Thompson, R.W.; Geraghty, P.J.; Lee, J.K. Abdominal Aortic Aneurysms: Basic Mechanisms and Clinical Implications. Curr. Probl. Surg. 2002, 39, 110–230. [Google Scholar] [CrossRef]
  22. Durmus, I.; Kazaz, Z.; Altun, G.; Cansu, A. Augmentation Index and Aortic Pulse Wave Velocity in Patients with Abdominal Aortic Aneurysms. Int. J. Clin. Exp. Med. 2014, 7, 421–425. [Google Scholar] [PubMed]
  23. Thubrikar, J.; Labrosse, M.; Robic, F. Mechanical Properties of Abdominal Aortic Aneurysm Wall. J. Med. Eng. Technol. 2001, 25, 133–142. [Google Scholar]
  24. Raghavan, M.L.; Hanaoka, M.M.; Kratzberg, J.A.; Higuchi, M.D.L.; Da Silva, E.S. Biomechanical Failure Properties and Microstructural Content of Ruptured and Unruptured Abdominal Aortic Aneurysms. J. Biomech. 2011, 44, 2501–2507. [Google Scholar] [CrossRef] [PubMed]
  25. Fahner, P.J.; Idu, M.M.; Van Gulik, T.M.; Van Wijk, B.; Van Der Wal, A.C.; Legemate, D.A. Glycerol-Preserved Arterial Allografts Evaluated in the Infrarenal Rat Aorta. Eur. Surg. Res. 2009, 42, 78–86. [Google Scholar] [CrossRef]
  26. Shojaee, M.; Sameti, M.; Vuppuluri, K.; Ziff, M.; Carriero, A.; Bashur, C.A. Design and Characterization of a Porous Pouch to Prevent Peritoneal Adhesions during in Vivo Vascular Graft Maturation. J. Mech. Behav. Biomed. Mater. 2020, 102, 103461. [Google Scholar] [CrossRef]
  27. Lattouf, R.; Younes, R.; Lutomski, D.; Naaman, N.; Godeau, G.; Senni, K.; Changotade, S. Picrosirius Red Staining: A Useful Tool to Appraise Collagen Networks in Normal and Pathological Tissues. J. Histochem. Cytochem. 2014, 62, 751–758. [Google Scholar] [CrossRef]
  28. Xue, C.; Zhao, G.; Zhao, Y.; Chen, Y.E.; Zhang, J. Mouse Abdominal Aortic Aneurysm Model Induced by Perivascular Application of Elastase. J. Vis. Exp. 2022, 180, e63608. [Google Scholar]
  29. Lu, G.; Su, G.; Davis, J.P.; Schaheen, B.; Downs, E.; Roy, R.J.; Ailawadi, G.; Upchurch, G.R. A Novel Chronic Advanced Stage Abdominal Aortic Aneurysm Murine Model. J. Vasc. Surg. 2017, 66, 232–242.e4. [Google Scholar] [CrossRef]
  30. Liu, X.; Qu, C.; Zhang, Y.; Fang, J.; Teng, L.; Shen, C. Perfusion Pressure of Elastase Impacts the Formation Ratio and Diameters of Abdominal Aortic Aneurysms in Rats. Exp. Ther. Med. 2023, 25, 190. [Google Scholar] [CrossRef]
  31. Munshaw, S.; Bruche, S.; Redpath, A.N.; Jones, A.; Patel, J.; Dubé, K.N.; Lee, R.; Hester, S.S.; Davies, R.; Neal, G.; et al. Thymosin β4 Protects against Aortic Aneurysm via Endocytic Regulation of Growth Factor Signaling. J. Clin. Investig. 2021, 131, e127884. [Google Scholar] [CrossRef]
  32. Wołoszko, T.; Skórski, M.; Kwasiborski, P.; Kmin, E.; Gałązka, Z.; Pogorzelski, R. Influence of Selective Biochemical and Morphological Agents on Natural History of Aneurysm of Abdominal Aorta Development. Med. Sci. Monit. 2016, 22, 431–437. [Google Scholar] [CrossRef] [PubMed]
  33. New Target Identified to Develop Treatment for Abdominal Aortic Aneurysm|University of Oxford. Available online: https://www.ox.ac.uk/news/science-blog/new-target-identified-develop-treatment-abdominal-aortic-aneurysm (accessed on 21 October 2023).
  34. Darling, R.C.; Messina, C.R.; Brewster, D.C.; Ottinger, L.W. Autopsy Study of Unoperated Abdominal Aortic Aneurysms. The Case for Early Resection. Circulation 1977, 56 (Suppl. 3), II161–II164. [Google Scholar] [PubMed]
  35. Parkinson, F.; Ferguson, S.; Lewis, P.; Williams, I.M.; Twine, C.P. Rupture Rates of Untreated Large Abdominal Aortic Aneurysms in Patients Unfit for Elective Repair. J. Vasc. Surg. 2015, 61, 1606–1612. [Google Scholar] [CrossRef] [PubMed]
  36. Powell, J.T.; Gotensparre, S.M.; Sweeting, M.J.; Brown, L.C.; Fowkes, F.G.R.; Thompson, S.G. Rupture Rates of Small Abdominal Aortic Aneurysms: A Systematic Review of the Literature. Eur. J. Vasc. Endovasc. Surg. 2011, 41, 2–10. [Google Scholar] [CrossRef]
  37. Vermeulen, J.J.M.; Meijer, M.; de Vries, F.B.G.; Reijnen, M.M.P.J.; Holewijn, S.; Thijssen, D.H.J. A Systematic Review Summarizing Local Vascular Characteristics of Aneurysm Wall to Predict for Progression and Rupture Risk of Abdominal Aortic Aneurysms. J. Vasc. Surg. 2023, 77, 288–298.e2. [Google Scholar] [CrossRef]
  38. Malayala, S.V.; Raza, A.; Vanaparthy, R. Gender-Based Differences in Abdominal Aortic Aneurysm Rupture: A Retrospective Study. J. Clin. Med. Res. 2020, 12, 794–802. [Google Scholar] [CrossRef]
Figure 1. (a) Inverted microscope image of AAA section, indicating two AFM scanning regions. (b) Graphic representation of the scanning region (10 × 10 µm2) with 64 indentation points (scale bar: 50 um).
Applsci 14 00613 g001
Figure 2. Representative force–displacement curve.
Applsci 14 00613 g002
Figure 3. Immunofluorescence staining of (a) AAA and (b) healthy control aorta (blue: cell nuclei and red: elastin). The green channel is autofluorescence with increased brightness and contrast to visualize the artery. Picrosirius Red staining of (c) AAA and (d) healthy control aorta. (Scale bar is 100 µm, black arrows refer to the micro vessels).
Applsci 14 00613 g003
Figure 4. Stiffness maps of the (a) AAA tested region (15 × 15 µm2, 16 × 16 indentation points); (b) AAA tested region (15 × 15 µm2, 20 × 20 indentation points); (c) healthy control aorta tested region (15 × 15 µm2, 16 × 16 indentation points); and (d) healthy control aorta tested region (15 × 15 µm2, 20 × 20 indentation points).
Applsci 14 00613 g004
Figure 5. Histogram of stiffness data of (a) AAA tested with a 20 nm probe; (b) AAA tested with a 5 µm probe; (c) healthy aorta tested with a 20 nm probe; and (d) healthy aorta tested with a 5 µm probe.
Applsci 14 00613 g005aApplsci 14 00613 g005b
Figure 6. (a) Average Young’s modulus of AAA and healthy control artery conducted with a 5 µm probe. Asterisks (**) represent a significant difference between the groups’ p-value < 0.01 significance level T test. (b) Average Young’s modulus of AAA and healthy control artery conducted with a 20 nm probe. Asterisk (*) represents a significant difference between groups’ p-value < 0.05 significance level T test.
Applsci 14 00613 g006
Disclaimer/Publisher’s Note: The statements, opinions and data contained in all publications are solely those of the individual author(s) and contributor(s) and not of MDPI and/or the editor(s). MDPI and/or the editor(s) disclaim responsibility for any injury to people or property resulting from any ideas, methods, instructions or products referred to in the content.