1. Introduction
At the global level, following large financial scandals, the attention of public opinion has been directed towards auditors, who have been found responsible, to a lesser or greater extent, for the reported frauds [
1]. The relevance of this topic derives from the identification of the ways in which managerial decisions can be made more efficient, based on information from financial reports, in order to ensure their quality and correctness. This is extremely important information in a constantly changing economic environment. There is a need for transparency and ethics in business in order to reduce information asymmetry and for principles of corporate governance to determine the presence and continuous training of experts so as to prevent and combat financial fraud. To face these new challenges, the United States of America has developed a new profession, the fraud auditor, or certified fraud examiner, whose main role is to prevent and detect financial fraud with the aim of reducing the consequences regarding the number of illegal financial documents. As part of their mission, the fraud auditor has their own working methods (standards, methods, tools, principles) so that they can ultimately express their opinion on the existence or non-existence of fraud, the associated risks and the damage that it can produce.
The concept of financial fraud represents illegal acts that seek to distort economic realities in a deliberate manner, misappropriate monetary assets or falsify documents in order to obtain certain undue benefits [
2]. Therefore, the International Standard on Auditing 240 (ISA 240) recognizes only two types of fraud: fraudulent reporting and misappropriation of assets. To combat these, a new professional association was established in the United States, the Association of Certified Fraud Examiners (ACFE), which aims to provide services in the form of fraud audit missions, a methodological approach through which auditors will issue a document comprising a professional, objective and independent opinion on the presence or absence of fraud within the audited entities.
In ISA 240, it is emphasized that preventing and detecting fraud is primarily the responsibility of those in charge of governance and management. When conducting an audit in accordance with an ISA, the auditor has a duty to provide reasonable assurance that the financial statements are free from fraudulent activity. It is important to note that the “expectation gap” issue is commonly analyzed in audits of financial statements or audit tasks. However, given the changes in international standards and the introduction of the concept of “assurance tasks”, it is necessary to consider the various types of tasks that authorized auditors may perform during the audit process.
The issue of the “expectation gap” is often not thoroughly examined in relation to other tasks due to their unique nature. However, it is crucial to investigate this issue considering the various engagement portfolios that currently fall under the published International Standards for Quality Control, Audits, Limited Reviews, Other Assurance Engagements and Related Services, which includes audits of historical financial information, limited reviews of historical financial information, assurance engagements other than audits or reviews of historical financial information, and related services. Conversely, certain types of consulting or advisory services fall outside the regulation of IAASB standards. Therefore, we recognize the need for a comprehensive study of the expectation gap that considers the full scope of tasks performed by certified auditors. This gap has been acknowledged since the 1970s and has been extensively studied by both academics and professionals. Its components were initially proposed by Porter [
3,
4] and were further analyzed by others [
5,
6].
Activity is carried out in an objective and independent manner by anti-fraud experts, to detect or prevent criminal acts of an economic nature at the level of an entity [
2]. In short, ACFE’s mission is to reduce the incidence of fraud and economic crimes committed by white collar workers and to support its members in detecting and inhibiting these illegal acts [
7]. The process of carrying out such a mission, which can be structured in well-defined stages, includes establishing an anti-fraud policy (at the official level, as well as by establishing responsibility grids), detecting and evaluating risks (through established controls and key indicators), integrating prevention and detection devices, and, finally, designing an oversight process (to audit and collect evidence on the compliance and functionality of anti-fraud policies) [
7].
Serious violations include administrative misconduct, employee misconduct, negligence, willful misconduct and other unlawful conduct, and, finally, intentional but not fraudulent misrepresentation or other unlawful misrepresentation [
8]. The act of using deception/inaccuracy to gain an illegal advantage defines fraud. A series of well-documented surveys indicate an increase in the incidence and value of fraud against entities [
9,
10,
11]. In addition to the financial cost to victims, the cost of fraud includes the financial costs of lawsuits against auditors who fail to detect fraud, as well as damage to the confidence of the accounting profession. In addition to all of this, a key approach to the study of fraud should be to highlight diversity as well as to improve the quality of accounting reporting in order to deter the commission of financial statement fraud [
12].
Thus, the link between International Standards on Auditing and Fraud Risk Assessment (FRA), outlined in paragraph 4of ISA 240 [
13], indicates that the three elements of Donald Cressey’s fraud triangle theory [
14] must be incorporated into an audit plan in most cases of professional fraud.
If the two types of fraud mentioned above, misappropriation of assets and fraudulent reporting, are important for auditors, ISA 240, point 3 and ISA 320, point 3 also indicate corruption and misrepresentation. Some requirements and enforcement materials reflect the extent of public interest in certain entities, referred to as public interest entities because they have a large number and a varied range of stakeholders. Factors to consider include the nature of the business, such as whether it holds assets in a fiduciary capacity for a large number of stakeholders; size; and number of employees [
15].
Jackson and Stent (2010) state that common financial crimes in developed and developing countries include asset embezzlement, financial statement fraud and corruption [
16]. Seven key principles are included in the ISA laws and regulations that apply to forensic and traditional auditors when assessing fraud risk and gathering persuasive evidence. In addition to the above, Eze and Okoye (2019) argue that auditors are not adequately trained to detect, assess, and identify theft, corruption, and accounting manipulation because they rely on their judgment and make estimates, and fraud detection is not their main purpose [
17]. Thus, all entities are encouraged to use forensic audit services as a strategic tool by which to combat all types of financial and economic crimes. Forensic auditors are involved in different types of investigations and use different strategies and procedures to question specific investigations. Otherwise, audit and accounting entities (independent auditors) must provide extraordinary services in addition to mandatory audits [
18].
Crain et al. (2019) have found that auditors face significant challenges when detecting, preventing, and responding to fraud [
19]. Thus, they conclude that forensic auditing is a more appropriate response to this scourge because forensic auditors’ dictions and strategies never assume that the client complies with International Financial Reporting Standards (IFRS) and accounting policies and procedures, or that the audit will result in the discovery of fraud.
Based on our preceding statements, we, as authors of this scientific approach, have contributed by assessing the fraud risk associated with a financial profile. This achievement leads to the prevention and detection of potentially fraudulent activities through the identification of signal elements using the red flags technique, as illustrated in the case study.
After analyzing the factors mentioned above, it is important to note that financial indicators play a significant role in detecting fraud during an audit. These indicators act as red flags and signal the presence of fraudulent activity, allowing for timely detection [
20]. Red flags can be identified through various means, such as analyzing annual financial statements and calculating indicators of liquidity, solvency, profitability, and structure. Quantitative methods can provide valuable insights into the risk and fraud mechanisms at play. It is crucial for entities to disclose the possibility of financial fraud and continuously raise awareness to prevent potential risks, including the latest fraud schemes. Additionally, having a crisis management strategy in place is essential when dealing with any crisis situation. This should include a structured response protocol and a specific action plan tailored to the situation at hand, in order to minimize potential financial losses and reputational damage.
2. Materials and Methods
The specialized literature and professional standards indicate that, to form an opinion, the auditor must document and substantiate each conclusion by gathering sufficient and appropriate audit evidence. According to ISA 500, audit evidence is defined as those factors that can support the auditor’s judgment when issuing a qualified opinion and, in addition, when making decisions. Sufficiency of evidence is determined precisely from the necessary quantity (number) and available validity to support an opinion, and adequacy defines the quality and value as a probative element (to be justified and to integrate the intended purpose) [
21]. In terms of the method of obtaining evidence, evidence can be obtained either from direct observations of the analyzed phenomena and processes, from checks or investigations, from confirmations received from third parties, or by performing analytical procedures. Analytical procedures, as described in ISA 520 (Analytical Procedures), are defined as a series of comparisons based on financial and non-financial indicators, used to establish certain significant deviations between the financial data proposed by the entity and those of the auditor or the branch of activity to which the audited entity belongs, from a previous or forecasted period [
21].
Within the fraud audit mission, financial indicators are associated with the concept of “red flags” (red flags or signals of the presence of fraud). These are elements assimilated to fraud fingerprints and will signal the presence and manifestation of fraudulent acts, the detection of which is the aim of the audit mission [
2].
Red flags serve as warnings or indications that a company’s financial reports or statements may be problematic, indicating risks of economic or financial information manipulation. To mitigate risk, different activity levels and geographical areas must be considered [
22]. The term “red flags” is a metaphor, commonly used to signify concerns or warning signs in a particular situation, such as business or investments. These flags can alert investors and analysts about a company’s future financial health and economic troubles. However, there are no universal standards for identifying red flags, as it depends on the analytical method used by the investor, analyst, or economist. Red flags can be found in quarterly financial statements and may require additional research and analysis to recognize. It is advisable to review triennial reports to make informed investment decisions [
23].
In most cases, red flags derive from the annual financial statements of the audited entities. Calculations of the financial indicators of liquidity, solvency, profitability and structure, and their analysis, based on quantitative methods, can significantly contribute to obtaining an idea about the associated risk and the fraud mechanism. Among the financial and non-financial signals of the presence of fraud at the level of reporting, one can note the following: anomalies in accounting, a rapid and unreasonable increase in commercial margins, unusual profits, defects in the control system, and the remunerative dependence of executive managers on the financial performance of the entity and hence a motivation to maintain an attractive stock market price of the company’s shares [
2].
In terms of asset fraud, financial and non-financial fraud signals refer to unusual decreases in the firm’s bank deposits, significant differences between reported cash and cash equivalent accounts and confirmations sent by banks, the frequency with which rounding of account amounts is used, the unusual increase in expenses regarding goods sold, unjustified values of the structure and liquidity ratios, and the occurrence of extraordinary expenses [
2]. Based on the quality diagnostics of financial reporting, it will be possible to analyze and identify possible errors committed at the level of reporting.
In this context, there is a pressing need to introduce innovative fraud theories that consolidate various fraud models and risk factors contributing to fraudulent activities. This will enable external auditors and forensic practitioners to conduct thorough fraud risk assessments. Extensive research suggests that identifying and responding to risk factors is key to helping auditors detect, deter, prevent, and investigate financial statement fraud. In this section, we will explore the risk factors associated with financial statement fraud, a major concern in the accounting industry [
18].
Other researchers have correlated significant fraud risk factors with notable fraud risk indicators [
24]. Comprehending the fundamental elements shaping fraud provides forensic auditors with valuable insights into the underlying causes of its occurrence. The problem of fraud has been, is, and will always be, a commendable issue of debate for specialists and researchers in the field. By analyzing problems related to the risk of fraud from previous periods, especially concerning the current economy, these specialists have been able to reach a multitude of conclusions that are beneficial for audit professionals.
In one relevant study, fraud is determined as likely to occur when three factors align: pressure, opportunity, and rationalization [
25]. In the case of fraudsters, an opportunity arises when they can exploit a position of power or when internal controls and monitoring are insufficient. As argued by other researchers, this can lead to a belief that the chances of being caught are low [
26].
One researcher notes that the fraud triangle theory can provide insight into fraud risk factors, but that it may not be entirely applicable today [
27]. This is because the model is almost half a century old and considerable social changes have been observed over the years. Furthermore, other studies contend that this model is inadequate in explaining the contemporary reasons for fraud in today’s business environment, as the pressure and rationalization elements have become difficult to observe [
26,
28].
The concept of the fraud diamond theory was initially presented in 2004 [
29] as an extended version of the fraud triangle theory from 1953 [
25]. However, we have found other researchers that have also argued that many fraud cases would not have occurred if fraudsters had not committed the crime [
26]. It has been argued that an individual’s personality traits and ability would have an impact on the likelihood of fraud.
According to the results of one study, arrogance denotes an individual’s belief in their superiority and entitlement, leading them to ignore internal controls [
30]. When incorporated into the fraud triangle, this concept expands into the new fraud theory, which consists of five components: pressure, opportunity, rationalization, ability, and arrogance. This theory considers all of the crucial factors that contribute to fraudulent behavior. One of Romania’s biggest challenges in fiscal policy and regulation is the lack of cohesion between these laws. Additionally, the laws themselves are often unclear and lack proper guidance for implementation. This creates opportunities for both financial auditors and user entities to evade tax laws and avoid fulfilling their financial obligations. Unfortunately, this can lead to fraudulent activities and the falsification of financial reports. The impact of these risks can have far-reaching consequences, including social inequality, a lack of trust in public authority, and a general distrust of those responsible for governing. To combat these issues, policies should be put in place that assess existing and potential risks, provide specific measures for the prevention, detection, investigation, and prosecution of fraud, and allocate clear responsibilities for implementation and monitoring [
31].
Management should also adopt a formal anti-fraud policy or statement, which outlines strategies for developing an anti-fraud culture and mechanisms for reporting suspected fraud. While red signals alert managers of potential issues, they are only an indication and require additional checks to confirm or deny potential fraud.
The topic of fraud has become increasingly important today and has been the subject of many reports and studies [
15,
32,
33]. Occupational fraud, which involves the intentional misuse or misapplication of an organization’s resources for personal gain, is a particularly concerning type of fraud, as defined by international institutions [
31].
Numerous challenges and obstacles confront technology’s ability to prevent financial crime and ensure compliance. These include a high rate of false positives, incomplete data from unstructured sources, a lack of analytical insight, and outdated rule-based detection methods. Additionally, delayed warning mechanisms can contribute to an increase in fraudulent activity. To address these concerns, data on previously detected fraud can be incorporated into the analysis, revealing patterns and trading techniques and leading to better decision-making that reduces both fraud and false positives [
34].
Employee misconduct can lead to significant losses for an organization. Any employee, regardless of their position, has the potential to commit fraud if they possess a strong understanding of the business and have the power to override established protocols [
35]. Employee fraud in financial institutions is a major contributor to global banking crises. A number of relevant studies have noted that fraud within financial institutions is diverse, ranging from employee and consumer fraud to corporate and individual fraud, as well as accounting and transactional fraud [
36,
37].
According to a 2018 study, occupational fraud can be classified into two types: management fraud and employee fraud [
38]. Previous research has also indicated that no company is impervious to employee fraud, which may entail falsifying financial records to mislead stakeholders and potentially impact stock prices, executive compensation, and loan conditions [
39]. Fraudulent behavior among employees can take many shapes and occur at any level of an organization, but departments responsible for purchasing and procurement may be especially susceptible [
40]. This type of misconduct has been a major factor in causing global banking crises. In 2019, another study pointed out the challenges organizations face in preventing fraud due to the non-shareable nature of certain financial pressures and rationalizations that contribute to fraudulent behavior [
41]. It is crucial for organizations to eliminate opportunities for fraud to minimize the risk of such misconduct.
According to a 2021 study, there is a clear connection between fraud and the capabilities of those who commit it [
42]. Additional research has shown that there is a positive correlation between elements of the fraud pentagon model and fraud risk ratings but a negative correlation between streamlining and fraud risk ratings [
43]. Furthermore, some authors have discovered that robust governance policies can effectively reduce the risk of fraud [
44]. Several studies have demonstrated a correlation between identifying high-risk areas and reducing the likelihood of fraud, while other research has produced mixed results [
45,
46]. Additionally, there is evidence that the elements of the “fraud triangle” can have a negative impact on the occurrence of fraudulent activity [
47]. Effective internal controls, which are a key component of corporate governance, can help entities prevent and detect fraud [
48].
The auditor is aware that management has a unique ability to engage in fraudulent activities by manipulating accounting records and producing fraudulent financial statements, all while avoiding controls that appear to be effective. This risk exists in all entities, although the degree of risk may vary. These fraudulent actions pose a material risk of misstatement in financial statements, which can be intentional or unintentional. Asset embezzlement, which often involves small amounts stolen by employees, can also be committed by management who are better equipped to conceal their actions [
49].
As part of this approach, the financial auditor has a series of indicators (financial ratios) that will signal these errors, inconsistencies or speculations that are made and then embellished by accounting artifices regarding the nature of manipulating sales, operating expenses, and the level of assets, liabilities and capital owned [
50]. In this sense, the analysis of the balance sheet through the system of financial indicators provides information on the relative composition of the property and the contribution of capital to the financing of the enterprise, as well as the analysis of the profit and loss account, provides information on previous and current performance and for estimating the future results of the company [
51].
Identifying and assessing risks is a crucial component of risk management for any entity. Establishing risk culture, limits, and early warning signs for violations is equally important. Monitoring and supervising activities that may pose risks, proposing risk mitigation actions, and reporting to designated authorities is the next step. In addition, entities can promote good corporate governance by implementing ethical practices and cultivating risk awareness [
52].
3. Research Methodology
This article promotes the auditing and detection of the risk of fraud by using the “red flags” method through a contextual approach to the increasingly assiduous need to present working practices of some managers and to make publicly known, permanently, their entire activity, ethics, and responsibility in business. This to reduce information asymmetries and encourage principles of corporate governance that dictate the need for the presence and continuous training of professionals who are able to prevent and eradicate financial fraud. The present research consists of an empirical study, for the period 2018–2022, based on the financial indicators of a corporate IT entity producing “Intelligent Business Tools for Management”.
The decision taken is based on the fact that this entity uses its own information systems, with or without a significant impact on the quality of accounting information, which have an extremely important role in managing the risk of fraud. Through their activity, these systems make available the produced instruments to a large number of entities and ensure their ongoing efforts to prevent, detect and react to fraud and professional misconduct by designing, implementing and evaluating applicable programs and controls. The data collection is carried out from financial and sustainability reports that have been made public by the entity in question. The processing and interpretation of these data are undertaken according to the related variables and calculation formulas, presented in
Table 1, by the authors of this scientific approach based on their professional experience. To achieve the research objectives of the study, a positivist approach was used [
53], which is a logical model [
54], carried out with the help of economic models for the factor analysis of multiple correspondences and the assessment of the risk of fraud in the financial audit mission. Factorial analysis of multiple correspondences is a complex mathematical technique that is part of the group of tools for quality management, established by Japanese scholars under the name matrix data analysis. The factor analysis diagram allows one to give a visual representation of the correlations between multiple variables and make it possible to visualize, on a plane, what is happening in a space with n dimensions. Thus, robust correlation (non-parametric correlation) is used to detect monotonic relationships between variables, e.g., when one variable increases only when the other increases, or decreases only when the other increases, but not necessarily in a linear manner.
Drawing from the challenges highlighted in specialized literature surrounding the analysis and evaluation of fraud risk in financial audit missions, a set of comprehensive and practical testing and verification studies are recommended. Given the significance of financial indicators, including factors such as structure, profitability, solvency, and liquidity, in identifying errors in financial statements, we suggest leveraging this information to gauge the potential for fraud related to the examined entity. At the same time, we state that the variables are certain, obtained as a result of the conversion of continuous numerical variables, into certain variables, reserved for the analyzed financial rates. The conversion involves obtaining categories, based on the intervals defining the values for a given continuous numerical variable. The conversion of continuous variables and derived categories was undertaken by coding, considering the ranges indicated in
Table 1.
Based on a sample of financial indicators of a corporate entity that includes fraudulent and non-fraudulent elements, we sought to test the general hypothesis about the possibility of obtaining the financial profile of a fraudulent entity by analyzing predetermined financial ratios.
In order to understand the significance of financial reports in the present scientific endeavor we analyze their usefulness, auditing, and presentation of asset fraud signals. The present study is an empirical one, based on the financial indicators of a corporate IT entity producing “Intelligent Business Tools for Management”, for the period 2018–2022. This is a company that offers IT software, maintenance services and technical support for businesses. Its object of activity falls under CAEN code 6201: Activities to create custom software (customer-oriented software).
The basic principles of the company are to continuously develop new products at the highest standards; to provide correct, accurate and up-to-date information that facilitates the understanding and interpretation of data, the identification of trends and the realization of analyzes within entities; and to solve important business needs of clients in a way that delights them, makes their work easier and forms the basis for solving the problems they face in the activity they carry out. The goal pursued by users is to improve performance and to make strategic decisions in order to optimize operations and achieve better results in the segment of the market of which they are a part. However, in order to highlight some characteristics of the fraud risk profile, obtained on the basis of financial ratios, the work methodology requires that these data be compared with each other to prove the performance of the analyzed entity. To this end we examine the years from which the best financial results were recorded.
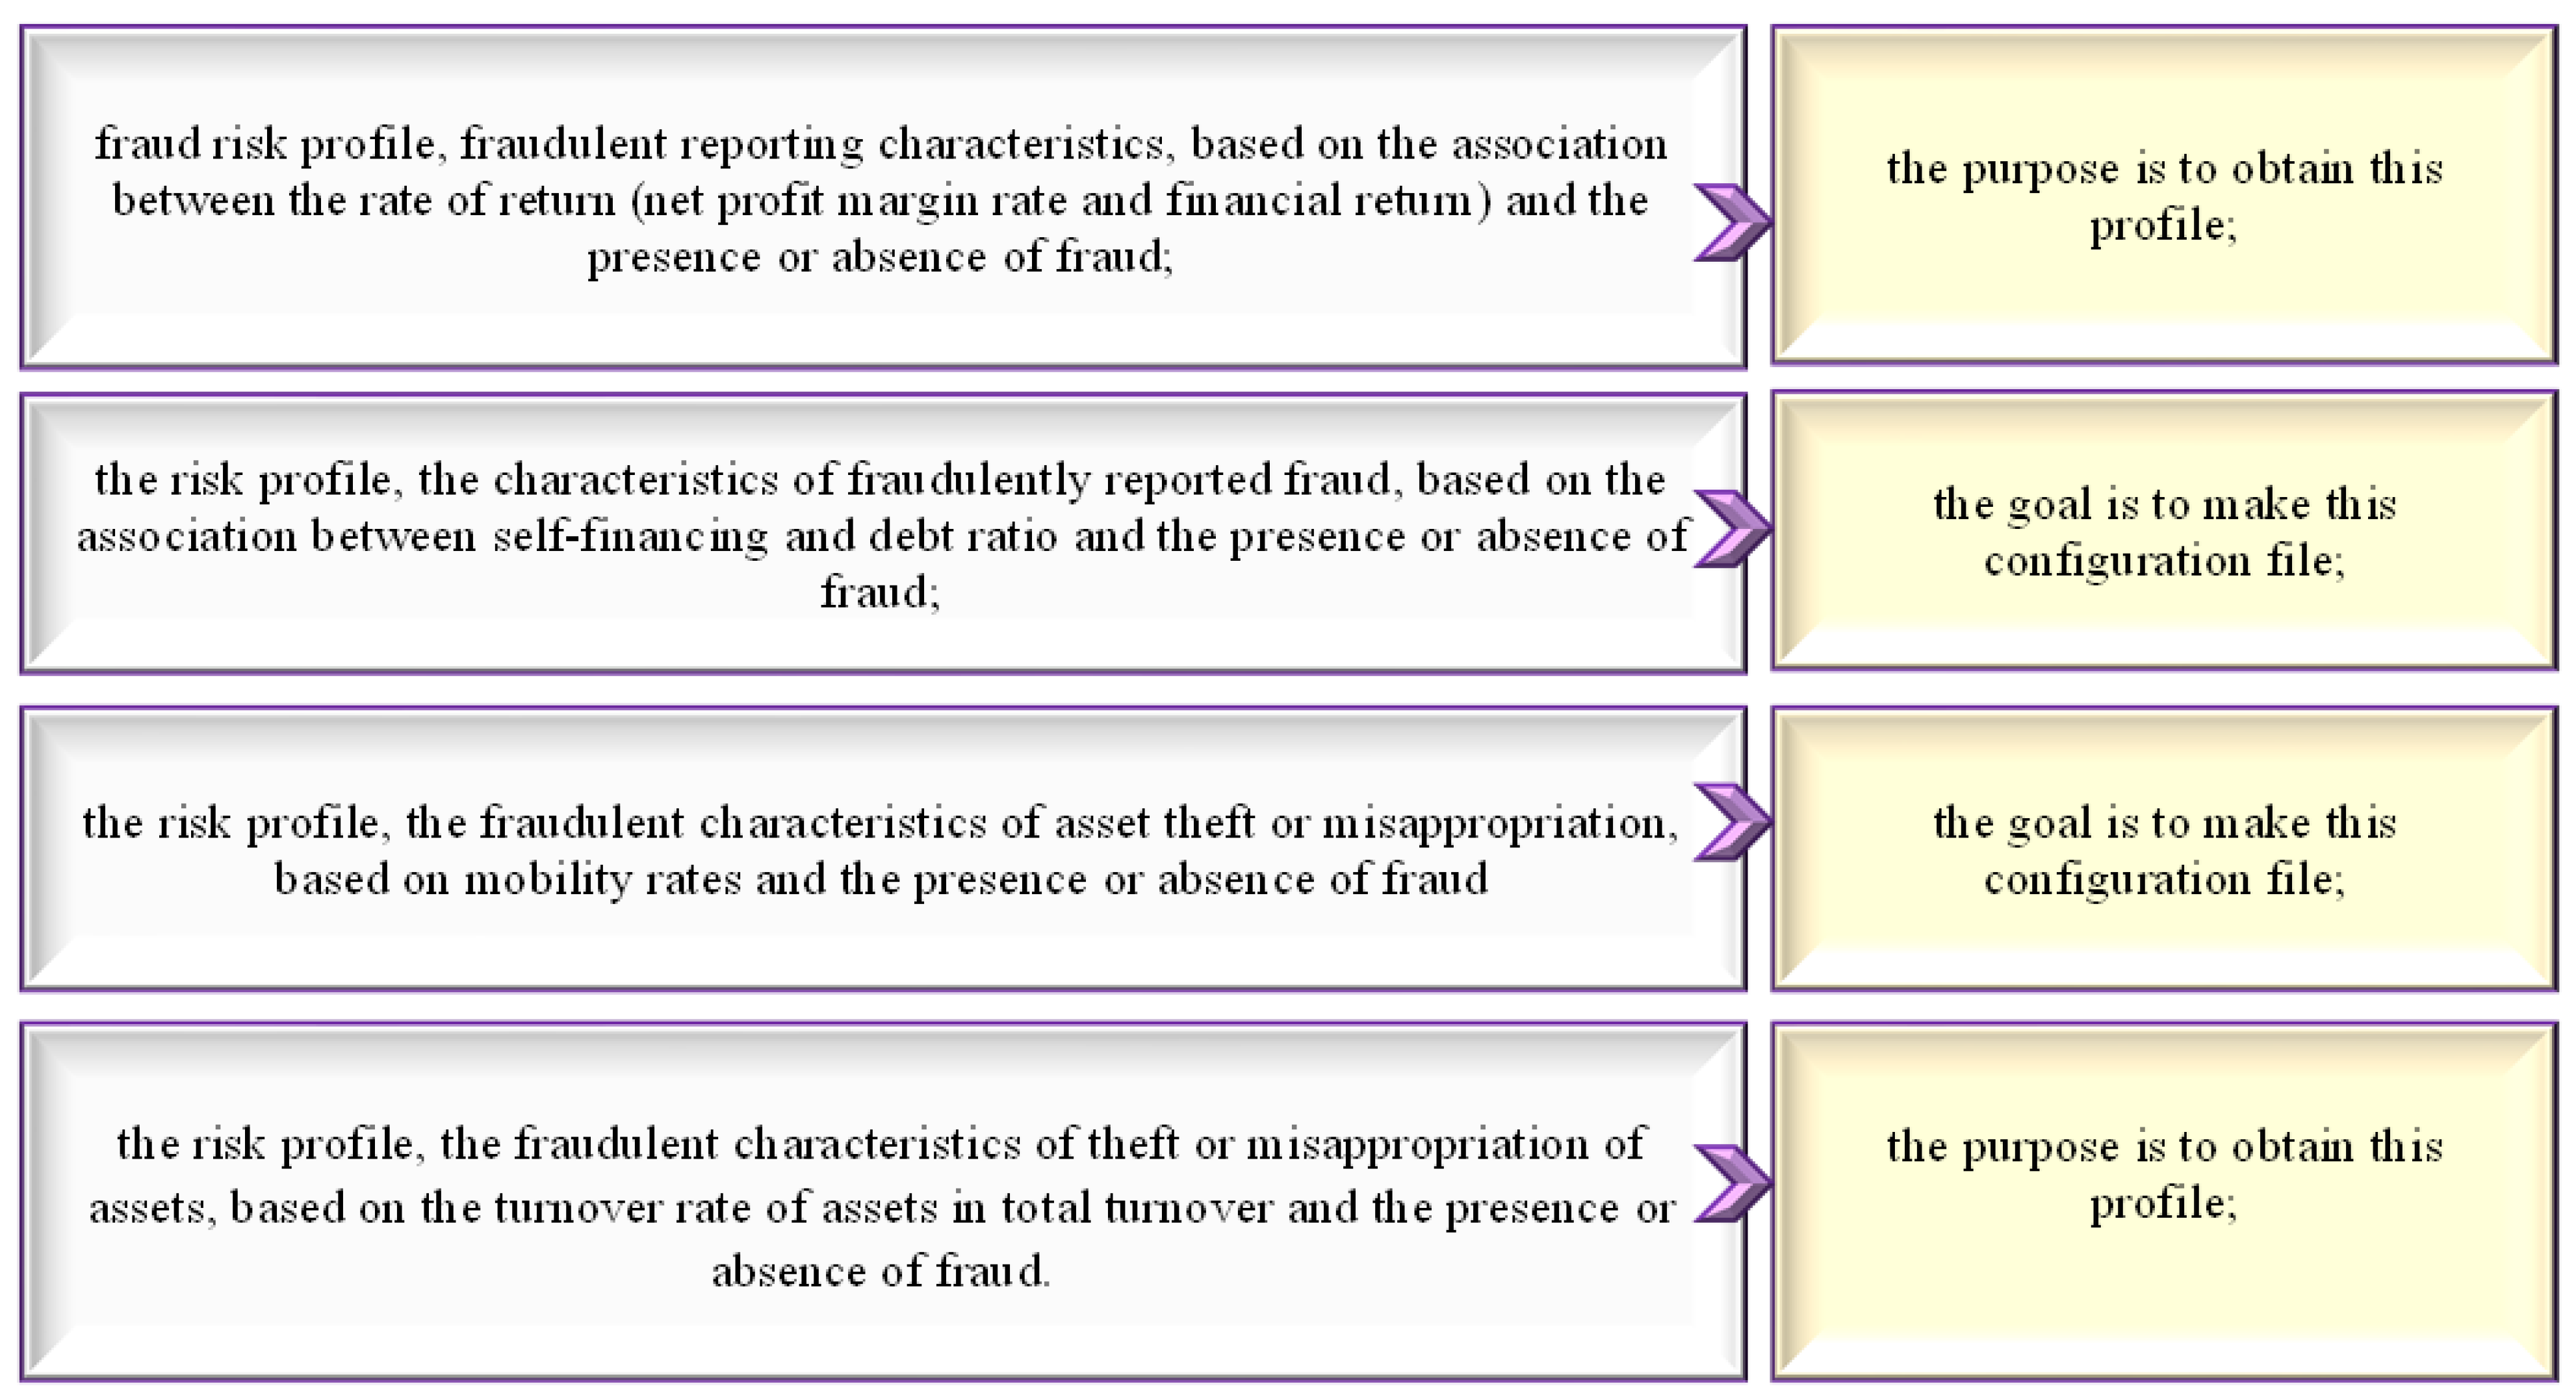
The method can be applied to a sample of n individuals, on the values recorded for a series of m associated variables, based on which the profile of an individual from a certain period or group can be obtained, following the study of the associations between the analyzed variables. This method summarizes the initial information by studying the associations between the variables, highlighted by a scatter diagram built on a system of factorial axes ranked in descending order, according to their importance in explaining the total variance of the diagram. Knowing the significance of the financial ratios analyzed in the present study and their usefulness in signaling the existence of fraud on assets and on reporting, we propose to test the following hypotheses, formulated based on experimental data (
Figure 1).
In
Figure 2, the necessary indicators are presented for the categories of variables that must be audited in order to identify fraud risks. First developed in France by J. P. Benzécri, and then Lebart, L., Piron, M., and Morineau, A., factor analysis of multiple correspondences is a multivariate analysis method for studying associations between three or more nominal variables. This is a generalized variant of factor analysis of correspondences [
55,
56].
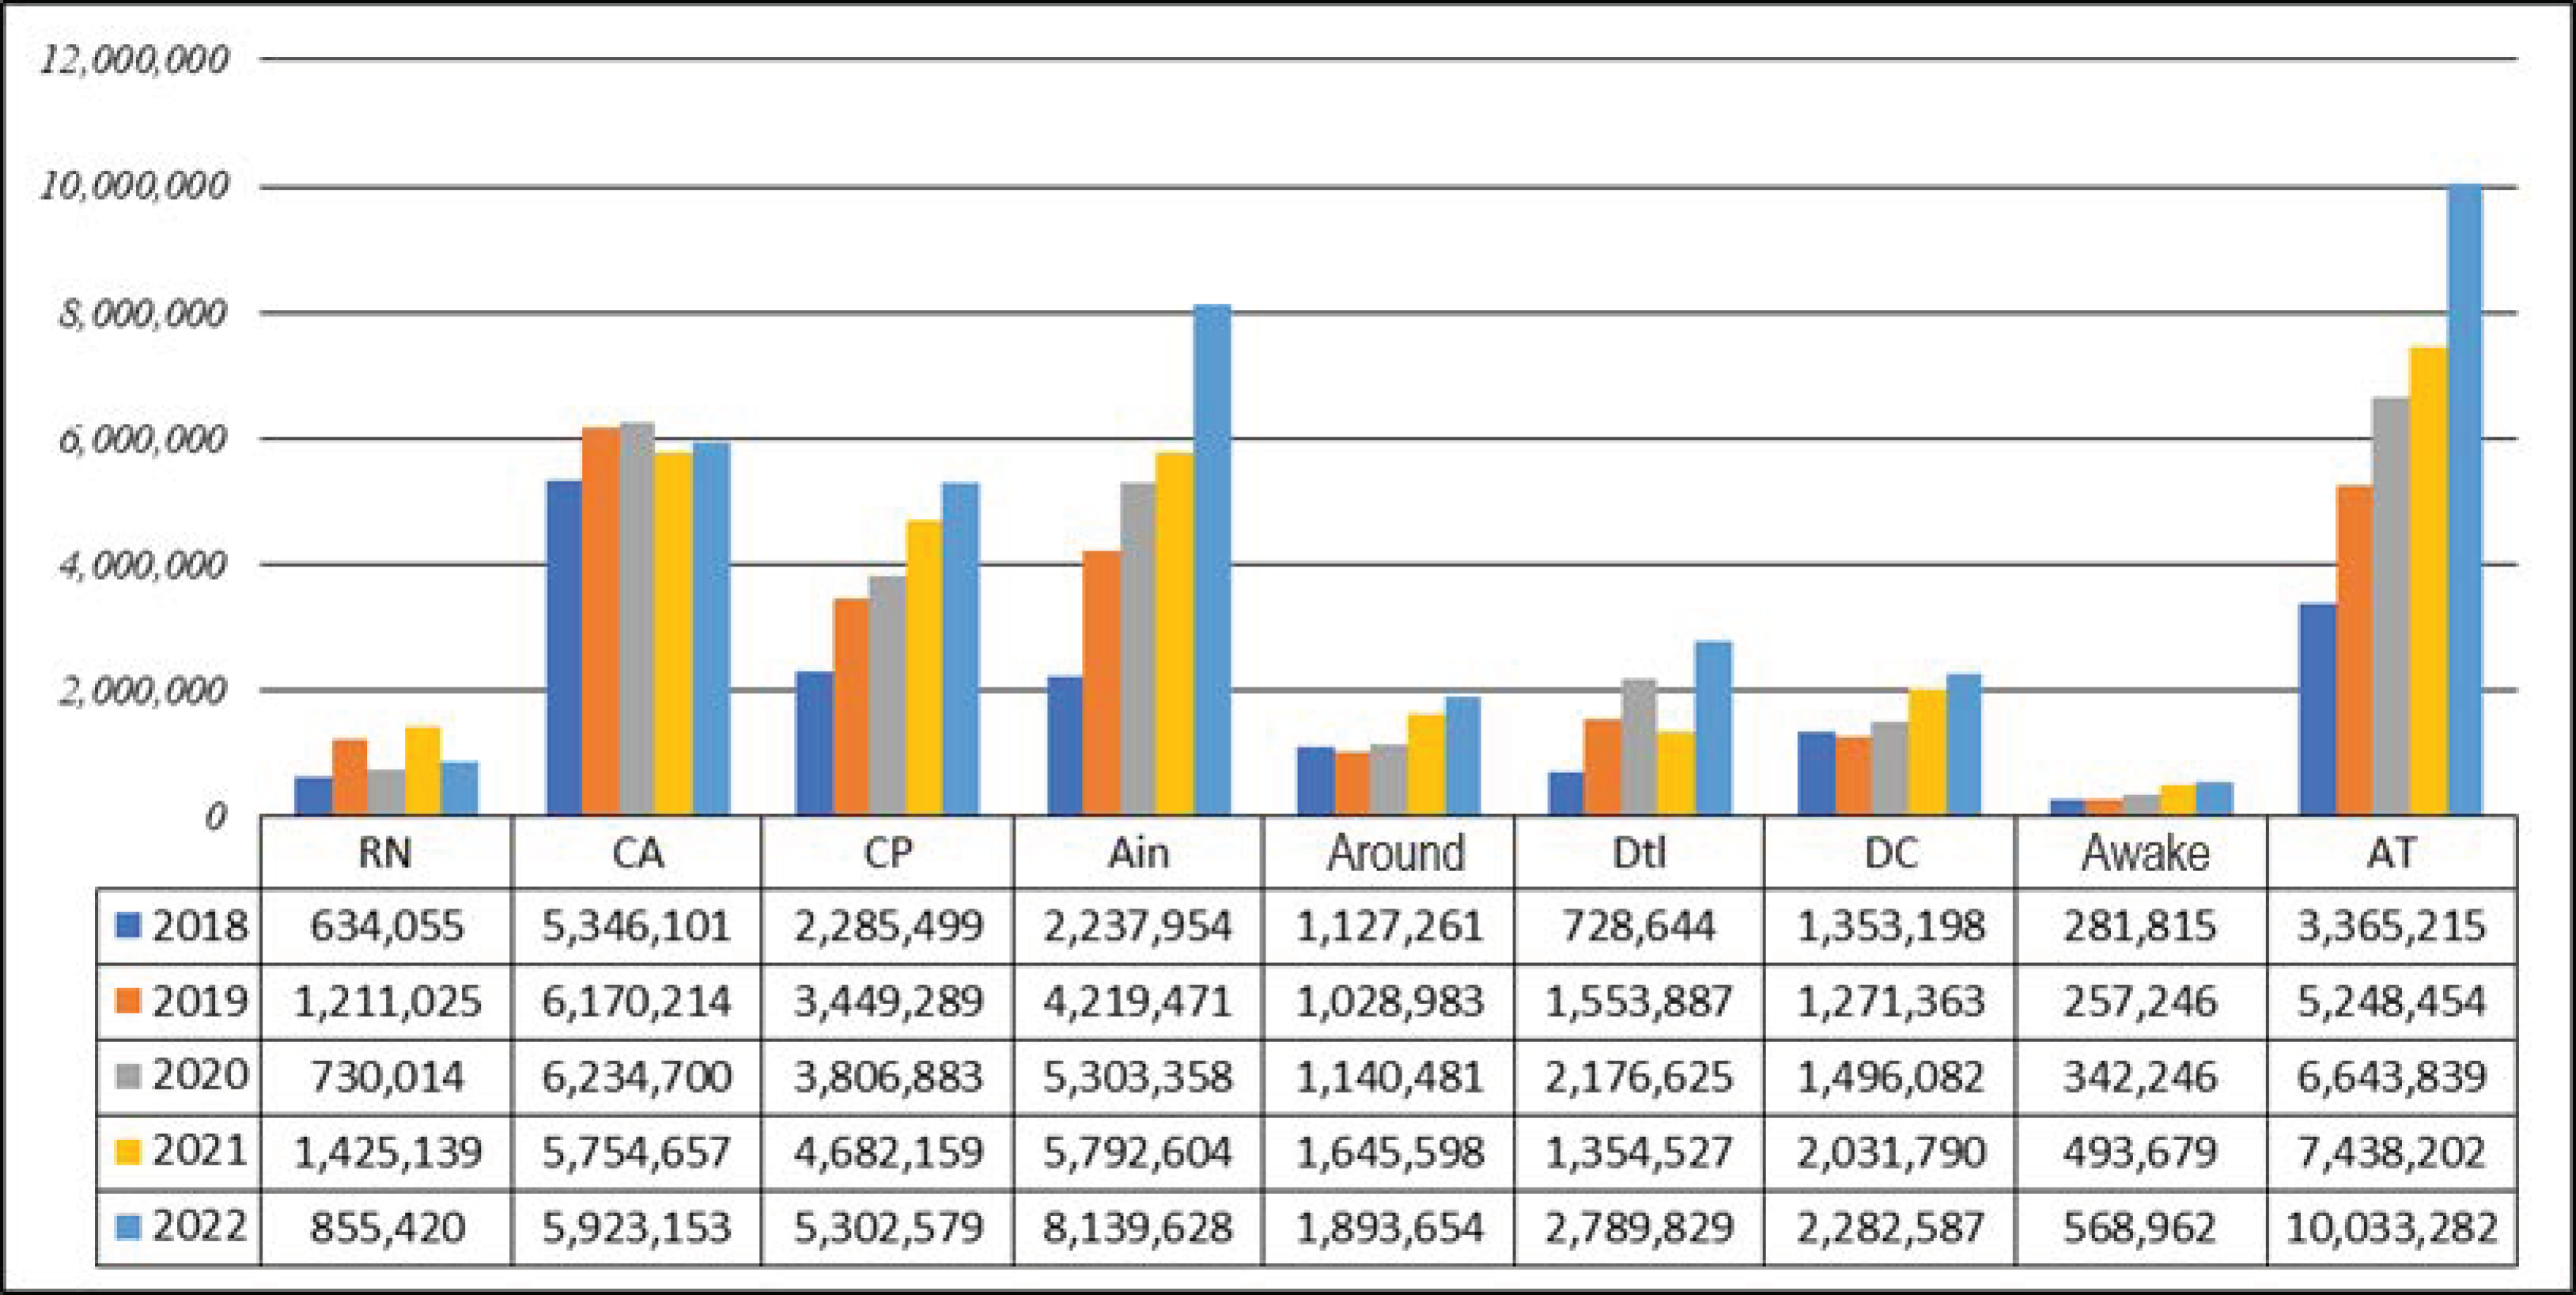
The financial indicators in
Figure 2 represent the results obtained by the analyzed entity for the mentioned period, and the bases of their processing are the variables in
Table 1.
Table 1.
The categories of analyzed variables.
Table 1.
The categories of analyzed variables.
| Symbol | Variables | Method of
Calculation | Risk Level Framing Limits |
|---|
| Rmn | Net margin rate | Net result/turnover | (−∞; 0.1) Rmn low; (0.1; 0.25) Rmn medium; (0.25; +∞) Rmn high. |
| Rf | Financial profitability | Net result/equity | (−∞; 0.33) Rf low; (0.33; 0.66) Rf medium; (0.66; +∞) Rf high. |
| Rai | The rate of self-financing of fixed assets | Equity/net fixed assets | (−∞; 0.25) Rai low; (0.25; 0.75) Rai medium; (0.75; +∞) Rmn high. |
| Rfei | The rate of external financing of fixed assets | Long-term liabilities/net fixed assets | (0; 0.5) Rfei low; (0.5; 1) Rfei medium; (1; +∞) Rmn high. |
| Rît | Term debt rate | Long-term liabilities/equity | (−∞;0) U (1;+∞) Rît high; (0; 0.5)Rît low; (0.5; 1) Rît medium. |
| Rlg | General liquidity ratio | Current assets/current liabilities | (0; 66) Rlg low; (0.66; 1) Rlg medium; (1; +∞ Rlg high. |
| Rli | Immediate liquidity rate | Treasury assets/current liabilities | (−∞; 0.25) Rli low; (0.25; 0.5) Rli medium; (0.5; +∞) Rli high. |
| Rat | Total asset rate (treasury uses) | Treasury assets/total assets | (−∞; 0.05) Rat low; (0.05; 0.1) Rat medium; (0.1; +∞) Rat high. |
| Vrac | Current assets turnover rate | Turnover/current assets | (0; 1) Vrac low; (1; 2) Vrac medium; (2; +∞) Vrac high. |
The variables used to achieve the research objectives were achieved by validating the hypotheses formulated on the basis of experimental data. It should be noted that these variables are indisputable, obtained following the conversion (transformation of continuous numerical variables into indisputable discrete variables) of the analyzed financial ratios. The conversion involves obtaining the categories of variables, based on the intervals of defining values for a given continuous numerical variable. The conversion of continuous variables (obtaining the categories) was achieved by recoding them, considering the intervals specified in
Table 1.
These meet the conditions of the multivariate analysis method, for the study of chains between several nominal variables, a generalized variant that extends the scope of the factorial analysis of correspondences [
55,
58].
4. Results
The application of multiple correspondence factor analysis (AFCM) takes into account the nature of the analyzed financial indicators and, therefore, we proposed dividing them into four categories: profitability indicators (Rmn and Rf), financing and liability indicators (Rai, Rfei, Rît), liquidity indicators. (Rlg, Rli, Rat) and the operational activity report (Vrac). The results obtained following the application of AFCM to the data in
Table 2, which are the bases of this scientific study, allowed the generation of graphs regarding the association between the proposed financial rates (red flags) and the presence or absence of fraud.
These associations are necessary to determine the fraud risk of a financial profile, helping to prevent and combat fraud. At the same time, these associations are necessary to determine a financial profile of the risk of fraud, useful in preventing and combating fraud through the audit trails that the signal elements can indicate. Regarding the correlation between profitability and the presence or absence of fraud, it can be observed, at the level of the analyzed indicators, how an entity suffers from financial fraud (theft of assets or fraudulent financial reporting) when it records low rates of financial profitability and profitability net margins.
The results obtained, based on the calculations performed and on the financial indicators in
Table 1, illustrate the results obtained in the next figures, which are presented and explained in detail.
In
Figure 3, the nature of the values of these rates may be due either to the declaration of an undersized net result, in order to escape certain tax charges (see the case of Rf and Rmn), or to the declaration of an oversized turnover in relation to the activity carried out. These declarations would be made precisely to mislead shareholders in terms of the entity’s solvency and its ability to continue its activity in a foreseeable time horizon without going into insolvency or a suffering a significant reduction in activity (see the Rmn case). These signal elements can contribute to the identification of audit tracks with reference to the application of international financial reporting standards (IAS-IFRS), financial statement presentation (IAS 1), income tax calculation (IAS 12), revenue recognition and recording (IAS 18) and earnings per share (IAS 33).
The level of association between funding rates, self-financing rates, and the presence or absence of fraud indicates how the entities affected by fraud had average and above-average term debt rates in the data sample analyzed. Adopting a funding policy based on external resources undermines the resources themselves, but the credibility of the reported information must also be assessed. In the case of the association between the chosen financing method and the presence or absence of fraud, it can be observed how fraudulent entities use several financing strategies (only on own resources and/or only on external resources). Entities applying anti-fraud strategies maintain a balance between borrowed/external resources and own resources (
Figure 4).
In
Figure 4, recording external financing/self-financing ratio values that differ significantly from the average can be a clear signal of the presence of financial fraud. Thus, the main IAS-IFRS, which will form the basis of the analysis of these audit trails, refer to the accounting and valuation of tangible assets (IFRS 16), the registration of financial leasing contracts (IFRS 17), the accounting of government subsidies (IFRS). 20), the nature of borrowing costs (IFRS 23), and the valuation and recording of intangible assets (IFRS 38).
An analysis of the association between liquidity indicators and the manifestation of financial fraud at the level of the analyzed sample leads us to the following results: during the analyzed period, the entity registered average values of the general liquidity indicator. This may be due to an unbalanced ratio of current assets to current liabilities (
Figure 5).
Though the large volume of current assets will lead to the coverage of current external resources (increasing the level of liquidity), it may actually lead to the theft of current assets by the entity. These indicators therefore lead to an analysis of the nature of current assets (inventories, customer accounts or cash and bank accounts) to assess the entity’s susceptibility to fraud risk related to asset theft. Therefore, an increase in the speed of the rotation of current assets based on the turnover of stocks and finished products will lead to operational efficiency (in terms of collecting receivables from customers) and an increase based on treasury assets will lead to the entity’s tendency to defraud (or to embezzle funds). In this case, the auditor must analyze the audit trails identified in the standards and also consider the methods chosen for inventory accounting (IAS 2) and depreciation of assets (IAS 36), cash flow statements (IAS 7) and income registered totals (IAS 2, IAS 18), the type of current assets (nature and structure), and accounting methods and their recognition and management. An analysis of current asset structure can be undertaken by studying cash flow ratios and cash flow utilization. In this case, one can see how the defrauded entity has a high value of treasury assets in relation to short-term loans and general assets, which leads to the predisposition of the entity to expose itself to the risk of defrauding assets. The main IAS-IFRS standards that will form the basis of the audit trail analysis regarding liquidity levels concern inventories (IAS 2), depreciation (IAS 36) and the statement of cash flows (IAS 7).
Analyzing the activity of operating operations, through the association between the speed of rotation of current assets and the presence or absence of fraud, one can observe how a fraudulent entity records above-average values of this indicator, which in turn leads to an increase in the efficiency of operational activities (increase in stock turnover that leads to an increase in customer receipts and to oversized values of the turnover and implicitly to higher values of the accounting result). In addition, the auditor must analyze the nature of current assets (inventory, receivables or treasury items, cash and bank accounts) to assess the entity’s fraud risk in terms of asset theft. Therefore, the increase in the speed of rotation of current assets based on the turnover of stocks and finished products leads to operational efficiency (if receivables from customers will also be collected), and an increase based on treasury assets makes the entity prone to the risk of fraud, as can be seen from the results obtained in the present scientific study (
Figure 6).
In this case, the auditor must analyze the audit trails identified in the standards, also considering the methods chosen for inventory accounting (IAS 2) and depreciation of assets (IAS 36), cash flow statements (IAS 7) and recorded total income (IAS 7, IAS 18).
Various risks, including business, financial, and economic risks, can have a notable adverse effect on dividend payments and other areas. Our analysis, as shown in
Figure 3,
Figure 4,
Figure 5 and
Figure 6, suggests a linear robustness that does not necessitate additional tests or alternative estimation procedures. Furthermore, we have found that risk has a statistically significant negative impact on payment policies and exploitation activities [
59].
While some risks may be unforeseeable, they should not be overlooked. Instead, managers should allocate separate budget lines for unexpected situations and create reserves. Essentially, they should prepare for rainy days.
Risk management is a continuous, cyclical process, and the results obtained must be regularly monitored. Changes in context or new information can render the original assessment outdated.
As part of the auditing process, it is important for specialized studies to be consulted to determine the nature of debts, including associated costs, and the use of foreign resources. The accuracy of reported equity must also be evaluated. By analyzing the financing method used and the existence of fraud, it is possible to draw relevant conclusions about the entity’s financial situation. In this case, the presence of financial fraud can be signaled by financing/self-financing rate values that differ from the norm. For instance, a high Rai (self-financing rate of fixed assets) and a low Rfei (rate of external financing of fixed assets) may indicate fraud. The trend lines presented in
Figure 4 for Rai, Rfei, and Rît (total debt ratio) show an exponential or representative relationship for the analyzed financial indicators, which indicates a linear relationship between the independent and dependent variables.
After comparing these results to similar studies involving food trading activity, where low levels indicate fraud (Rai) and average levels indicate non-fraud (Rfei), the trend lines for the analyzed financial indicators show an exponential or representative pattern. Additionally, there is a linear relationship between the independent and dependent variables, indicating that entities affected by fraud had higher than average rates of term debt in the data sample. This extended working method, along with investigative tools, can provide a new solution to the challenge of fraud in the accounting profession. The use of statistical methods in financial and fraud auditing, as well as their interconnections with financial analysis and accounting, can lead to a broader and more sophisticated direction of research, including a more extensive range of indicators by which to accurately assess entity performance.
5. Conclusions
Identifying and quantifying the impact of qualitative factors on the risk of fraud is an effective way to prevent or detect acts of economic crime. In accordance with the validation of the working hypotheses of this scientific approach, the level of the study shows, through empirical records, that the object of activity of an entity can constitute a factor that can determine the occurrence of fraud.
Based on the results obtained from our scientific approach and the validation of the proposed hypothesis (that there is a significant relationship between the rates proposed by the analysis and the presence or absence of financial fraud), the purpose of this study was fulfilled by identifying the financial profile of the risk of fraud. This feature is useful for auditors in financial audit operations, especially fraud audit operations, when testing the presence of fraud at the level of audited entities. Finally, this feature can also be used for programs of prevention and control for sensitive areas that may generate fraud in entities vulnerable to fraud risks.
While analyzing “red flags” and combating financial signals may be seen as a daunting task, it is an essential part of an audit trail that helps fraud auditors detect and prevent culprits. If left unchecked, fraudulent actions can have a negative impact on an entity’s profits, profitability, and overall sustainability. To perfect decision-making models, it is crucial to have access to reliable information and to continually adapt to new dynamics and factors. The cost of obtaining and preserving this information must also be taken into consideration, as well as the time available for decision-making. By gathering and utilizing relevant information, entities can make informed decisions that maximize benefits and ensure long-term success.
This information is primarily intended for those making decisions about new product development and future marketing campaigns, which rely heavily on the power of information. However, when it comes to investors and other stakeholders, providing every possible detail and value is not necessary. Instead, they may prefer a clear overview of trends and perspectives that are relevant to their needs.
In today’s world, where investors balance short-term financial results with long-term economic entity goals, it is crucial for businesses to prioritize their performance. The decision-making process is at the heart of management activities and affects all functions, as is the integration of the entity into the competitive environment and its ability to navigate economic crises. High-quality decision-making also leads to reduced costs, efficient use of funds, increased profits, and more.
In conclusion, the role of financial analysis and factor analysis in the study of fraud from the perspective of causes and caused effects can lead an auditor to identify areas with a high risk of fraud. Another important element of the profile is the establishment of links between financial red flag indicators and International Financial Reporting Standards, indicating accounting rules and areas where financial manipulations can be made. Given the current economic situation, characterized by financial scandals, accounting manipulations, and the collapse of financial markets, financial corruption is the main factor responsible for the negative effects of financial crises.
One potential avenue for future research is to conduct a comparative analysis of red flags in this topic or in related topics across various industries or countries. Additionally, further investigation into identifying potential fraud or major financial risks through the analysis of “red flags” in company financial reports, as well as studies exploring how investor reactions to these signals impact investment decisions, could be valuable. Finally, evaluating the efficacy of financial education and training in recognizing and managing “red flags” in investment contexts may also be worth exploring.
Therefore, through its investigative tools as well as its work process, the field of accounting fraud is the accounting professional’s response to this new challenge (fraud) and can be considered as a form of pain reliever. Finally, the use of graphical/statistical techniques in financial accounting for fraud and the connection between financial analysis and accounting can open new research directions. This relatively new field proposes an analysis of economic–financial phenomena from financial accounting based on specific indicators.

