Article

Least-Cost-Path and Closest Facility Analysis for Generating District Heating Networks on a Communal Level

Department of Geodesy and Geoinformatics, Faculty of Geoengineering, Mining and Geology, Wroclaw University of Science and Technology, ul. Na Grobli 15, 50-421 Wroclaw, Poland
*
Author to whom correspondence should be addressed.
Appl. Sci. 2024, 14(2), 763; https://doi.org/10.3390/app14020763
Submission received: 9 November 2023 / Revised: 3 January 2024 / Accepted: 5 January 2024 / Published: 16 January 2024
(This article belongs to the Section Earth Sciences)

Abstract

:
Due to an urgent need to reduce the fast-progressing climate changes, a rapid, standardized and replicable solution for the infrastructure restructuring of the heat demand coverage of buildings at the district and city levels must be developed. As more and more communities in Europe, especially in Germany, are obligated to have plans for coverage of the heat demand, city planners and energy agencies seek a tool that will help them to design the first drafts of heating network routes, which can supply whole districts and cities with renewable energy. ArcGIS Pro Tools like Least-Cost-Path Analysis (LCPA) and Closest Facility (CF) allow us to find the shortest and “cheapest” way between the heat source and heat consumers in the analyzed areas. Starting from the community level, through the district, county, voivodeship and whole-country levels, the replication of the methods for generating district heating (DH) network infrastructure can be achieved. The proposed LCPA- and CF-based methods help to design the most suitable and efficient DH networks in the analyzed areas. As only a few open-source data inputs, like street networks and building footprints, are needed, the methods can be implemented in all communities in the country of Poland. In this paper, one example of one community in Wroclaw county, called Siechnice, and its surroundings is presented.

1. Introduction

In order to achieve the EU’s ambitious energy efficiency targets “https://energy.ec.europa.eu/topics/energy-efficiency/energy-efficiency-targets-directive-and-rules/energy-efficiency-directive_en (accessed on 8 November 2023)”, like the reduction of greenhouse gas emissions by at least 55% (compared to 1990) by 2030, more and more countries are developing and will be obligated to develop appropriate strategies. Six different strategies have been recently proposed for the EU energy system in the European Commission’s report, Energy Roadmap 2050 [1]. None of these strategies involve large-scale implementation of district heating in order to achieve the 80% reduction in annual greenhouse gas emissions by 2050 [2], even if this happens to be one of the main effective ways to achieve the EU targets. Expanding district heating will help to utilize local renewable resources more effectively, as, e.g., the Dutch examples show [3].
The expected need for the far-reaching restructuring of the heat supply infrastructure poses great challenges for many municipalities and system operators. In particular, a question arises as to how the necessary supply infrastructure can be built intelligently? Furthermore, regarding the future-oriented manner and a high level of acceptance, how can it be integrated into the existing urban infrastructure, which has often grown over several generations? In this respect, covering the heat demand through district heating (DH) networks has proven to be a good and effective solution [4]. The increasing heat consumption of the buildings and the connection of new neighborhoods to the heating network call for heating pipes to be installed in a way that minimizes their costs and preserve landscapes. A municipal heat supply with climate-friendly heating networks that are fed by renewable energies has many advantages: for the neighborhood, the municipality and the private households [5]. District heating is one of the best solutions for the decarbonization of the heat sector in urban areas [6].
The use of innovative system infrastructure enables the intelligent interaction of energy saving, efficiency increase and the potential-optimized use of renewable energies. Unfortunately, there is as yet no solution approach for the consistent, systematic analysis of the heat supply and demand and their linkage, taking into account the interaction with electricity generation. With reference to this unsolved problem, the aim of this study was to develop a standardized method for the rapid and precise assessment of the potential of heating networks to plan the cost-efficient coverage of the existing heat demand.
Based on the demand for development resulting from the, e.g., 2030 Agenda for Sustainable Development (goals: 7, 11, 12 and 13) (https://www.un.org.pl/ (accessed on 8 November 2023), the municipalities began to implement new climate protection and energy concepts, the integral element of which was a sustainable heat supply. In this context, Germany even went a bit further, where with the Amendment of Climate Protection Act (KSG BW), the state of Baden-Wuerttemberg offers all municipalities the opportunity to create and update a municipal heating plan;the large districts and cities should have submitted a heat plan by 31 December 2023 [7]. This amendment defines Municipal Heat Planning as a strategic planning process with the goal of a climate-neutral heat supply by the year 2050. The preparation of municipal heat plans is part of this process. The central step in the preparation of such a plan, regulated under § 7c paragraph 2 KSG BW [8], is the development of a scenario for covering the future heat demand with renewable energies to achieve a climate-neutral heat supply. This includes a spatially resolved description of the future supply structure required for this in 2050, with an interim target for 2030. This is achieved by identifying suitable areas for heat networks and individual supply. As the chief of the Climate Protection and Energy Baden-Wurttemberg says, “Heating networks can provide system services for an integrated and sustainable energy system, which is why they are considered to play a central role in the transformation of the heat transition” [9]. Addressing this comment, Germany, with its 11,700 communities, which will all be obligated in the future to have such plans, started to work on developing an appropriate strategy in order to solve this problem. Without having fast and widely applicable automatic tools, the achievement of this target would be quite impossible. Therefore, the work done within this paper happens to be very necessary and urgent, with a view to the fast-coming radical changes in the energy policy.
Also in Poland, the so-called studies of spatial development documents specifying the municipality spatial conditions are available and consider also, like in case of the Wroclaw City, the energy issues (https://gis.um.wroc.pl/imap/?locale=pl&gui=classic&sessionID=2776588, accessed on 8 November 2023), e.g., the heating pipes available and potential areas for renewable energy supply. District heating in Poland is facing many challenges in order to achieve the decarbonization of the DH sector. In the largest cities of Poland, like Warsaw, Cracow, Poznan, Łodz and Wroclaw, there are DH networks available. The DH system in Wroclaw is concentrated in the Wroclaw Heat and Power Plant Group Cogeneration JSCo and consists of SHP Wrocław, CHP Czechnice and CHP Zawidawie [10]. The direction of transformation of the entire heating sector in Poland is described in two basic documents, which are the National Energy and Climate Plan for 2021–2030 (KPEiK) [11] and in the Poland’s Energy Policy until 2040 (PEP2040) [12]. The documents emphasize good air quality, which makes it necessary to transform heating. One of the assumptions of the Polish goals is that approximately 1.5 million new dwellings will be incorporated into the heating network by 2030. How it should be achieved is until now not defined. Therefore, also in Poland, the methodology developed in this study will be useful in order to develop the strategic DH planning. According to the report [13], the plan for the restructuring and modernization of the heating sector in Poland should start with smaller towns, where the risk of losing their existing sources of heat supply can cause the worsening of air quality. Replacing DH with individual heat sources would cause the difficulty to comply with environmental standards. Therefore, there is a need to review smaller DH systems in terms of cost-effectiveness and especially with regard to finding pathways for their expansion and transformation. Hereby, if a DH network is indicated in the local development plan, the connection of existing and newly constructed buildings to it should be encouraged by regulations. Now, the heating sector faces difficulties with the regulation of the spatial planning of the cities. The rules for the construction of new heating pipelines are very time-consuming and expensive. This is a further barrier to the development of DH, which can be limited only to those parts of cities that are already equipped with DH networks. The expansion of existing DH to new city parts can be limited. In Poland, there exists also a problem of closing down small existing DH networks because of financial issues. This would cause the need for individual dwellings to find other simple solutions for their heat supply, which are not really environmentally friendly ones and can contribute to an increase in the smog problem and a negative impact on human health. From an environmental point of view, it is better to supply buildings with central generating unit, which can be controlled with regard to emission standards, than a lot of small heat sources.
Considering the seventh objective of the document Energy Policy of Poland until 2040 [12], it is very important that the energy planning start at the level of communes and regions with regard to rational energy management, improving air quality and using local potential. Hereby, the document suggests to use a nationwide heat map as a useful tool to facilitate the planning for covering the heat demand. In the study described in this paper, only the first stage of the energy planning will be analyzed, without consideration of the heat demand. This will be performed in the further following work.
The above-mentioned document [12] emphasizes also the obligation for consumers to connect to the energy-efficient district heating system, if such a system is available in the closest distance. Only in the case that consumers use more green solutions is this obligation not actual.
Although the effectiveness of local heating plans has been proven in many international studies, their development for whole municipalities is complex and in operational practice only possible by applying a standardized and tailor-made methodology that has not been available so far. The method proposed in this paper tries to solve this problem by using a “standardized-replicable” method, which means that the same method can be used for different spatial levels. Starting from the community level, through the district, county and voivodeship levels, the generation of heating network infrastructure for the whole country of Poland using the same replicable method can be achieved. Going one step further, it is also possible to try to replicate this method in other European countries in the future.
Techniques for the routing of power lines or heat pipes have evolved over the years, and today, Geographic Information Systems (GIS) approaches allow designers to easily identify the most suitable routes [4,14]. Until now, there is no appropriate method developed yet, which would generate a first rough draft of potential DH networks in a fast, suitable, practicable and especially standardized way in order to implement it on a wider scale. The methods developed within a German project [15] are mostly based on the ArcGIS route procedure, which is really time-consuming and rather manual. Therefore, there is a need for a more automated and faster but still reliable method that can sufficiently estimate the length and position of the heating pipes as part of the strategic heating planning and before the execution planning. This should help in the further step of estimating the economic site of the district heating planning by calculating the heat distribution costs as a function of various parameters, such as the connection rate and the availability of local renewable energy sources.
As a response to the above-mentioned need, the work done within this paper focuses on the development of an easy-to-use and widely applicable tool for an automated planning process for the district heating supply. This goal is to be achieved through the development of an innovative, GIS-based, transdisciplinary methodology for generating district heating networks using the available spatial analysis functions, like Least-Cost-Path Analysis (LCPA) and Closest Facility (CF). Both of these tools allow finding the shortest and “cheapest” way between the heat source and heat consumers in the analyzed areas. The LCPA approach has been effectively used for the routing of power lines to minimize environmental impacts [14], as well as human and technical related constraints [16]. Other notable applications include analysis of alternative highway routes [17] maritime movement [18,19] and air traffic [20]. Often, Analytical Hierarchy Process-based multicriteria analysis is employed to determine the weights of cost surfaces [21,22], whereas a description and discussion of the least-cost-path modeling concepts and algorithms have been presented in [23,24,25]. The approach is based on the findings from an earlier project [15], but the methods presented in this paper are newly devised. Compared to the method from the above-mentioned project, the methods shown in this paper are more easy-to-use ones, as they are running in an automatic way.
Additionally, the method presented in this paper offers the possibility for further optimizations and development within the project funded by the National Science Centre, Poland. The optimization can be based, e.g., on the consideration of further criteria by generating the cost surface using the LCPA method, e.g., slope of the terrain or land-use value. The optimization of the CF method can be in order to reduce the time proceeding the model.
The issue proposed here has still unfilled holes. This is the first rough development of the method helping communities to plan the coverage of their heat demand. Further works regarding the development of the method, its implementation as well as its validation are needed in the future.

2. Materials and Methods
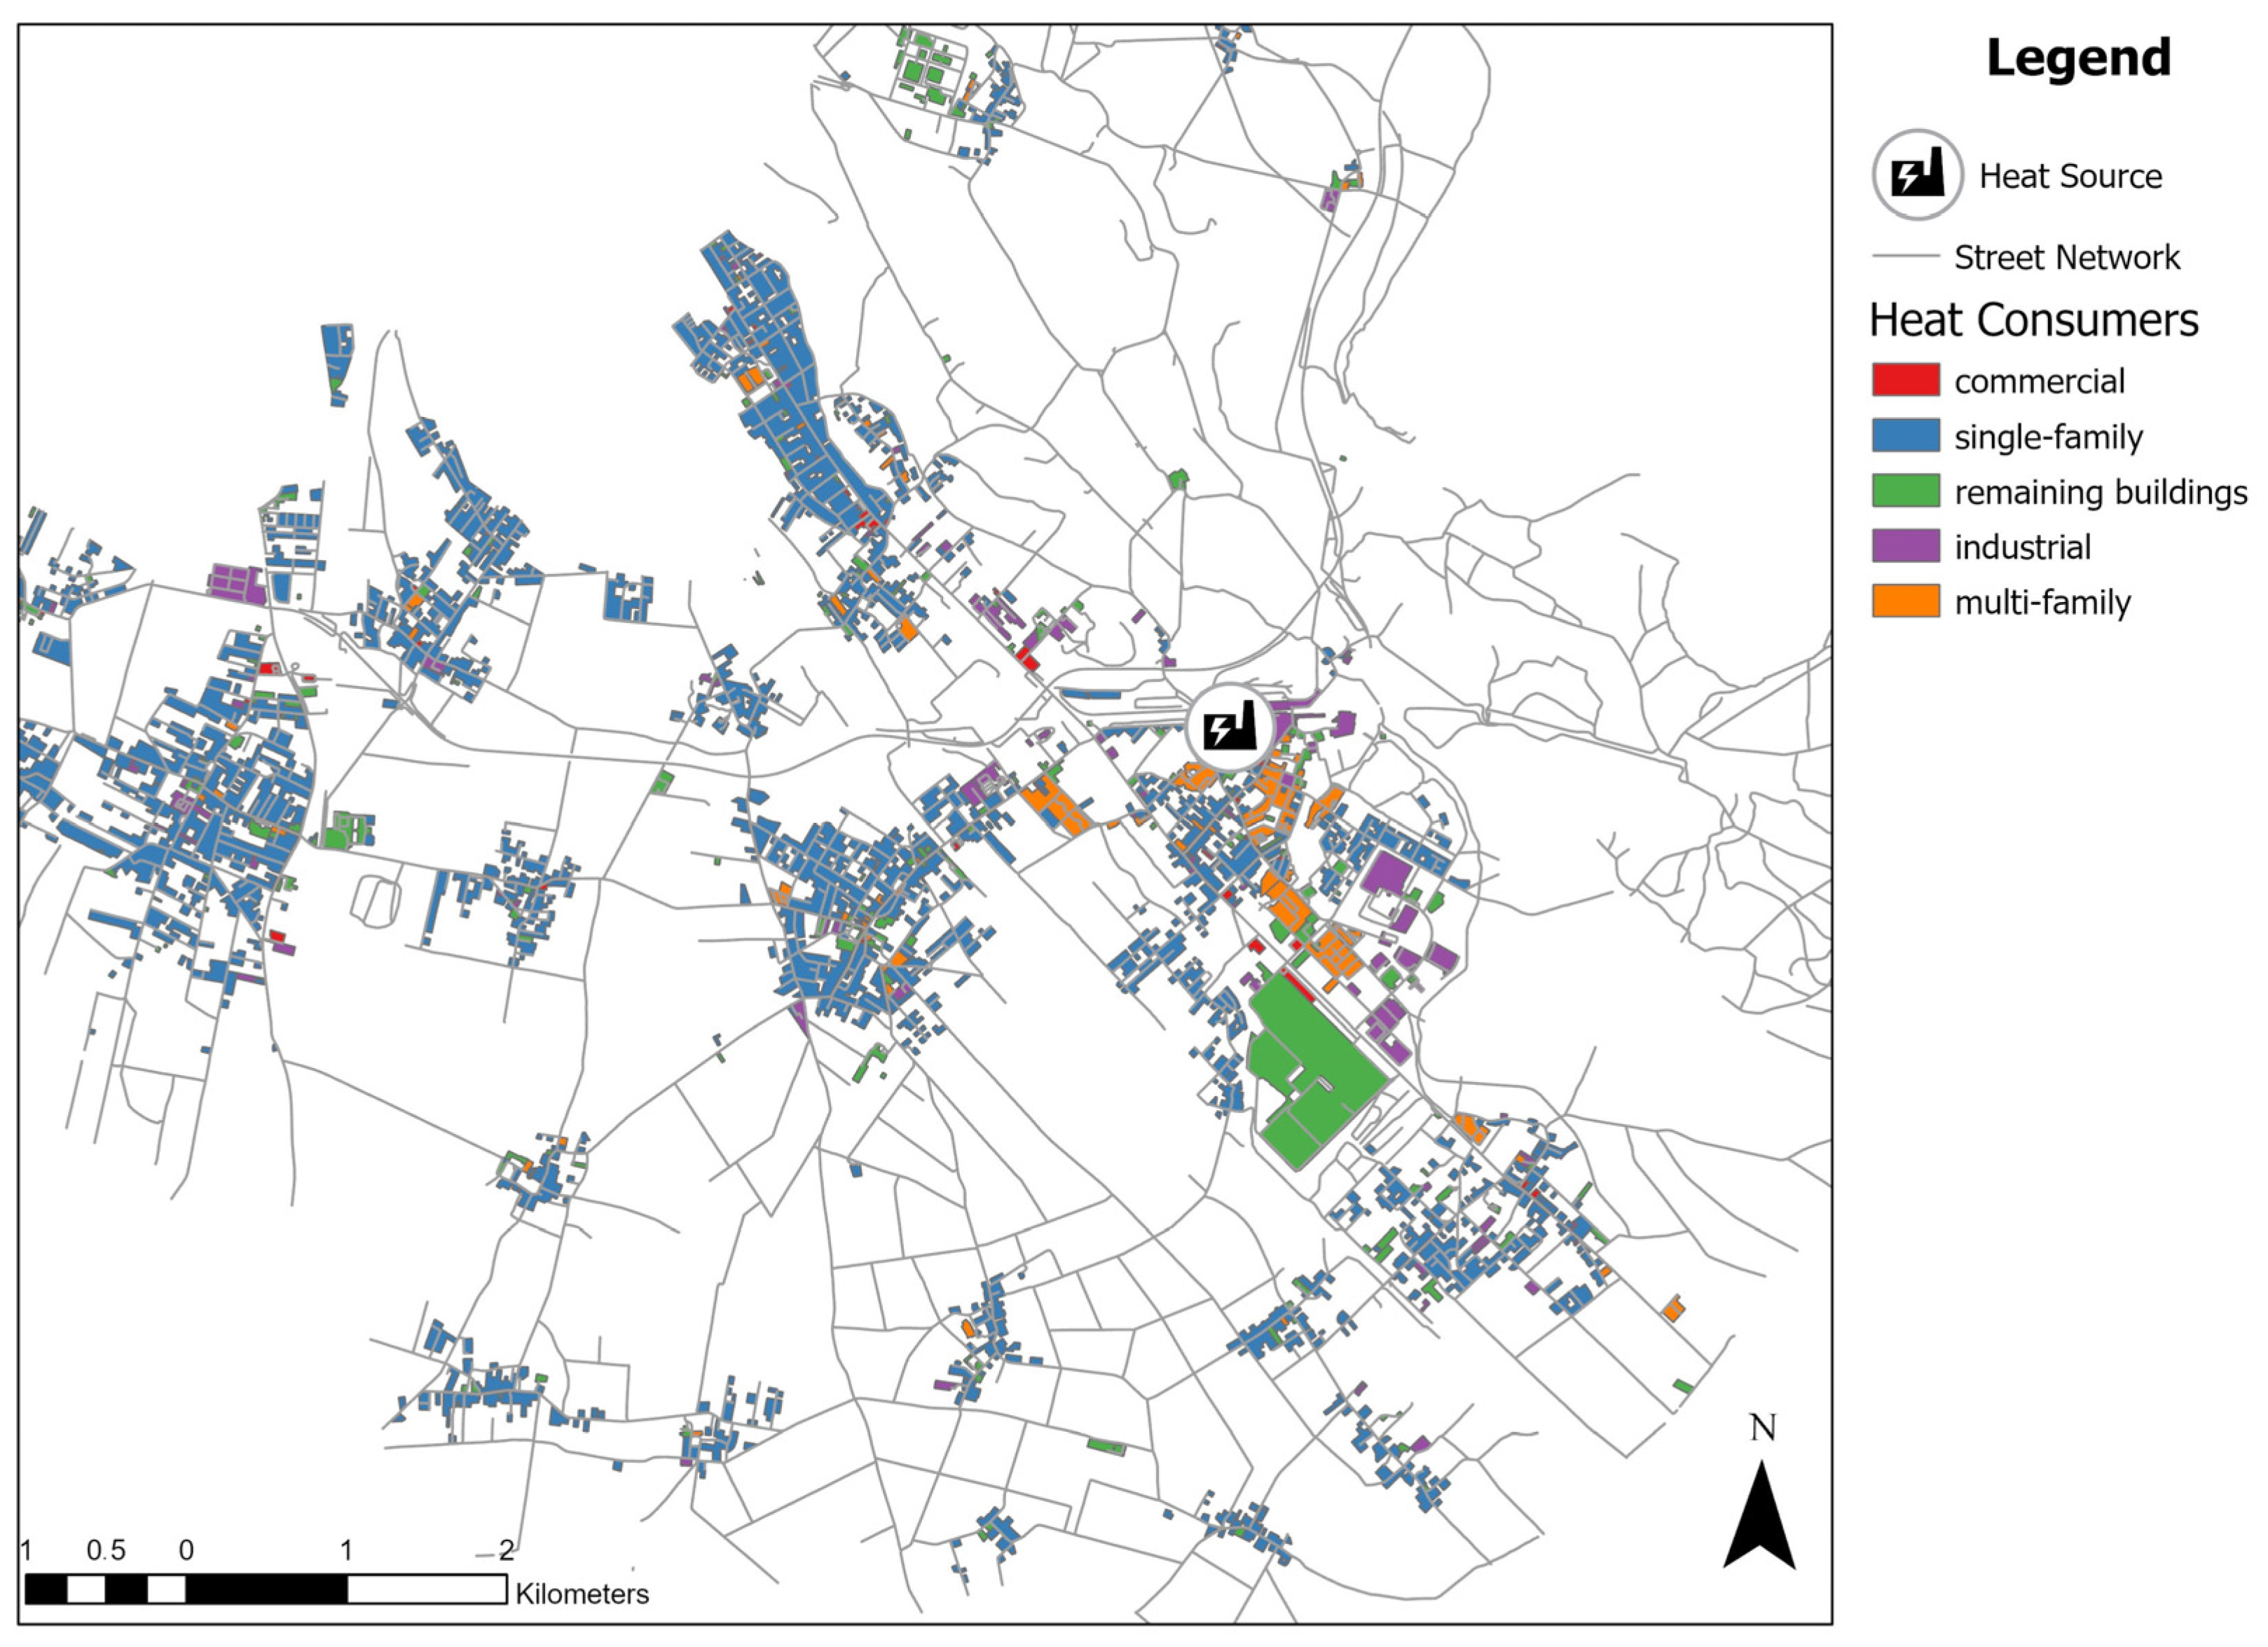
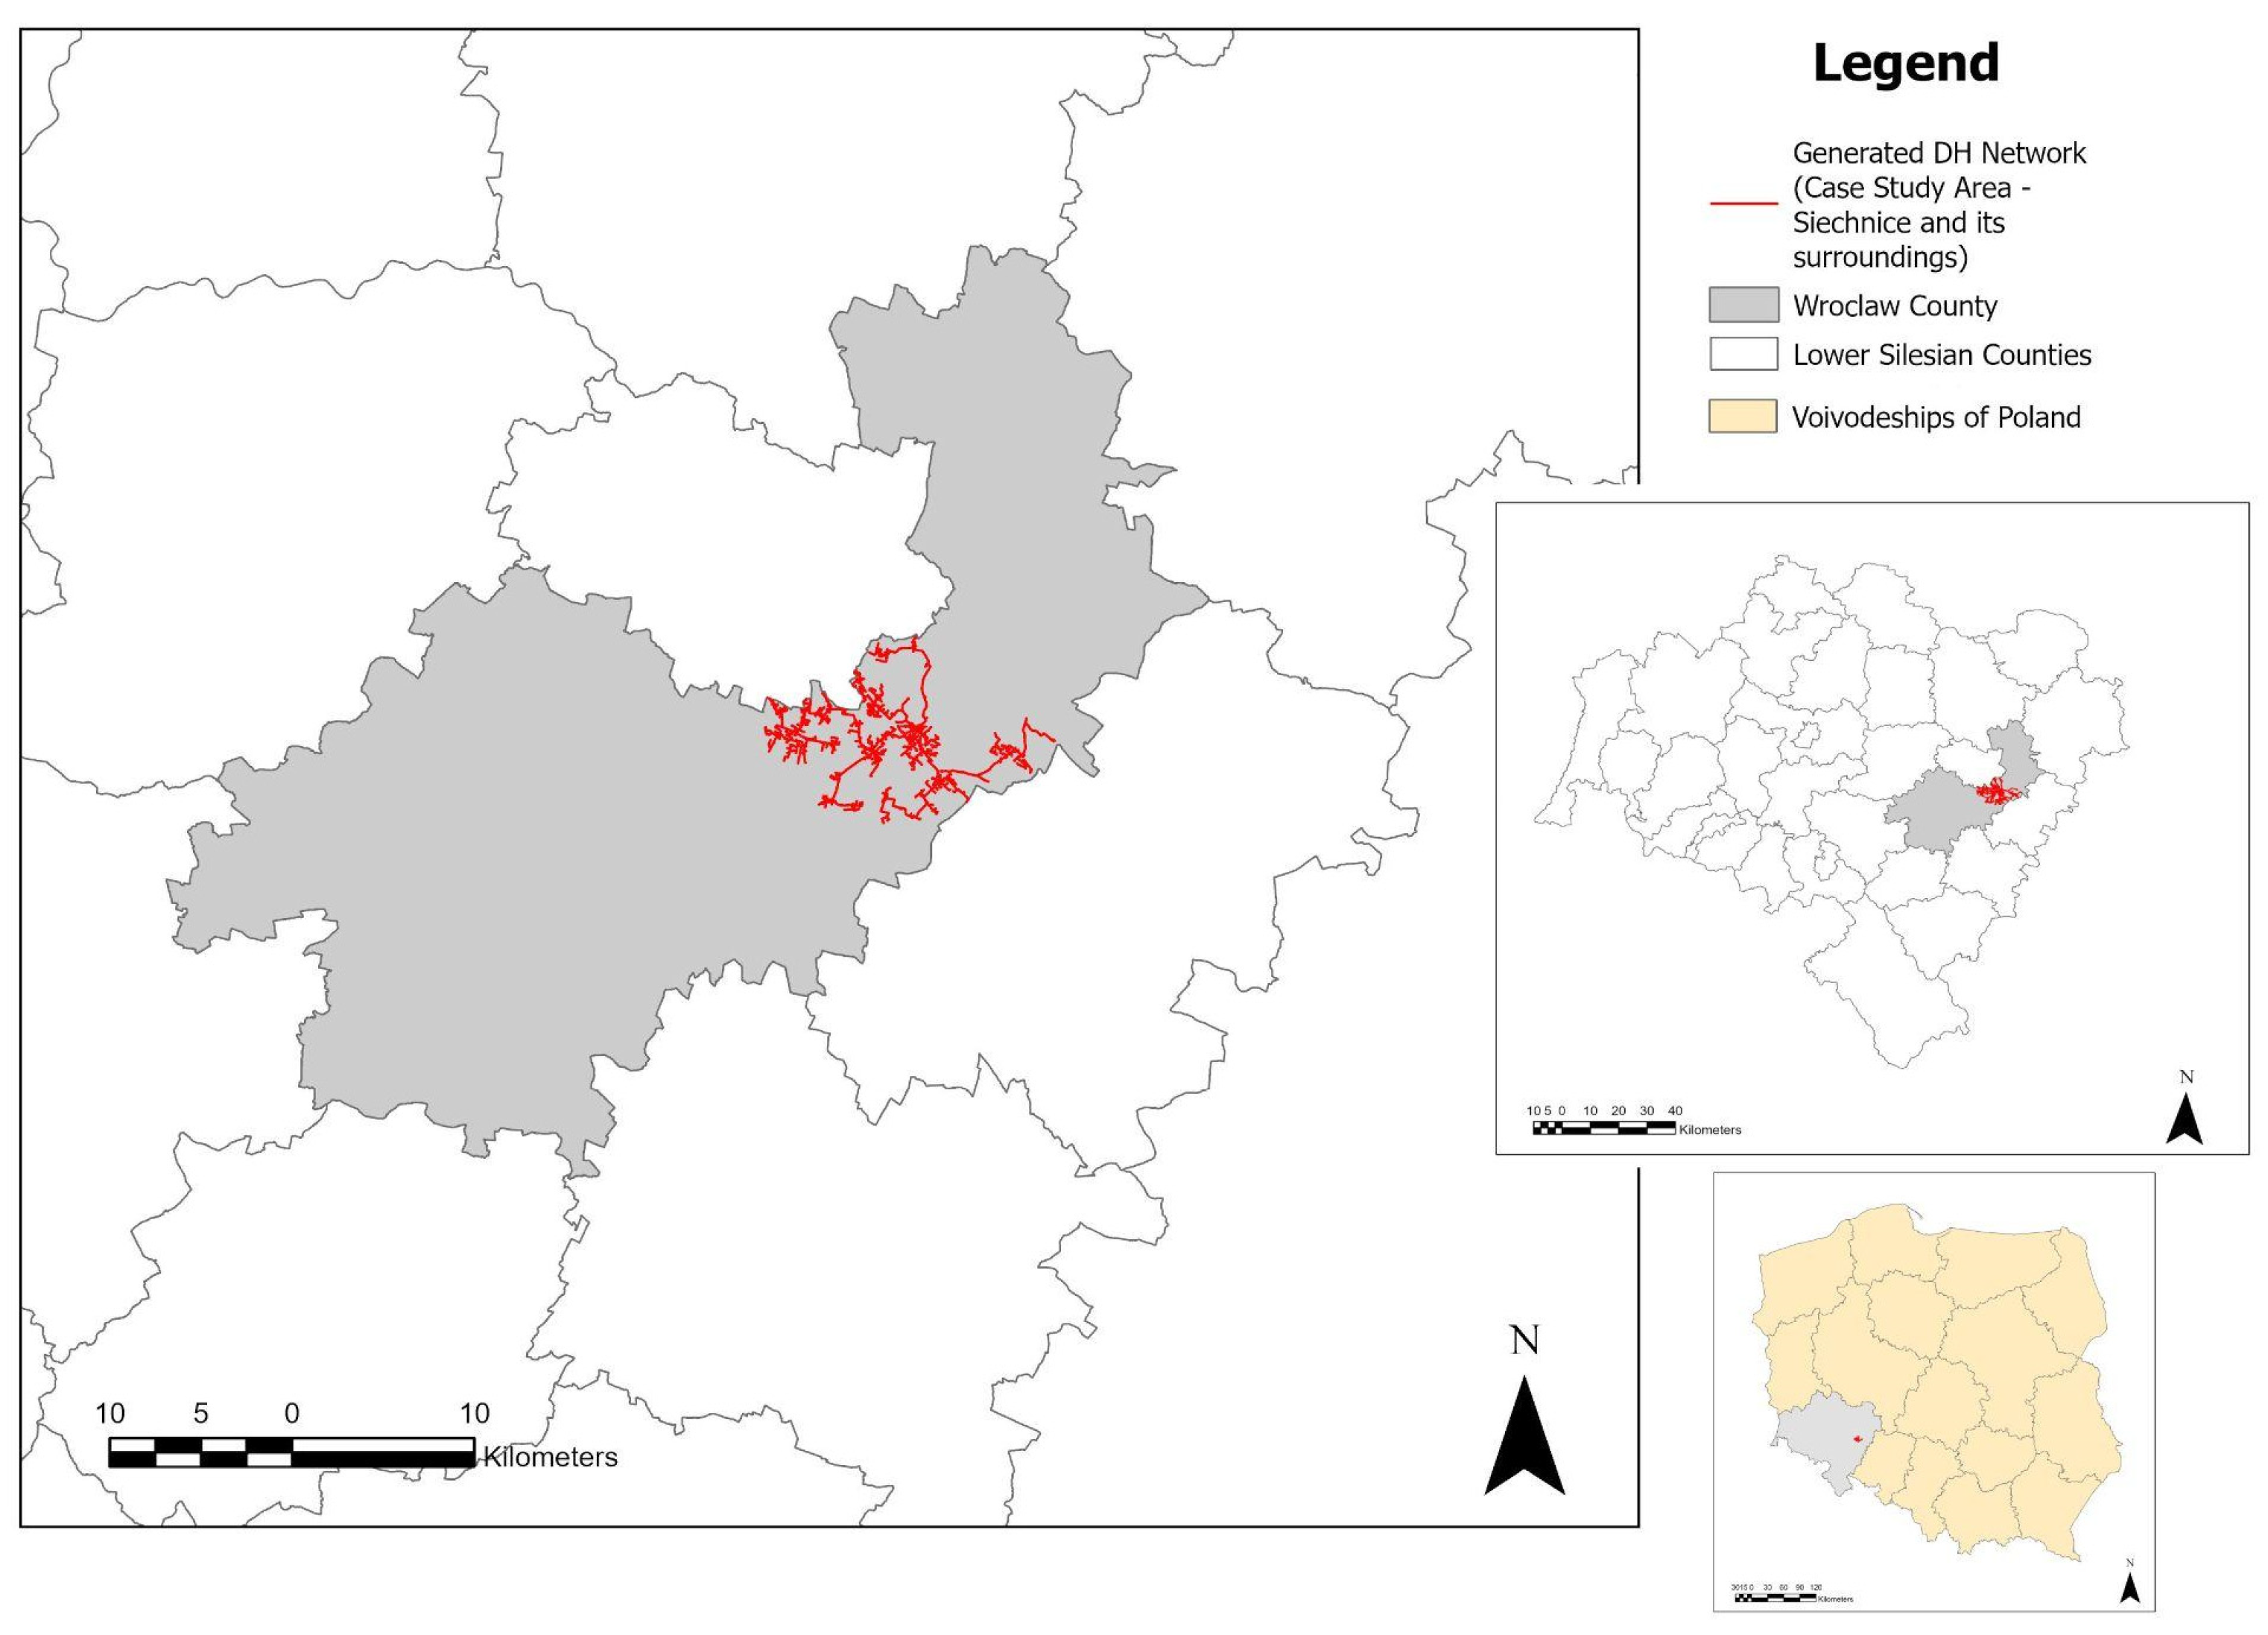
The methods described in this paper make it possible to generate district heating (DH) routes based on openly available data sources, like street networks and building footprints. The approach considers one important criterion to identify the most suitable route for the potential district heating network, which is the distance between the heat source and each of the heat consumers or the distance between the heat consumer and the closest heat consumer. Firstly, LCPA is used to generate a Cost Distance Surface (CDS), which calculates the least accumulative cost distance for each cell from or to the least-cost source over a cost surface [24,25]. This raster effectively illustrates the cost distance from the heat source for each considered cell within it. Then, using this CDS, a most suitable route based on the street network is generated. The method is tested on one simple example area, and then implemented in one of the communities in Wroclaw county, called Siechnice, and its surroundings. As a result, a consistent DH network for the mentioned community is generated. As the DH network generated using the LCPA method has one important weak point, another method using the Closest Facility tool is tested. Hereby, using an iterative process, the shortest route between each of the heat consumers and another closest heat consumer is additionally considered. As a result of this method, a more efficient DH network is generated, with the possibility of its replication for further communities, counties, voivodeships and finally, for the whole country in the study, Poland. The replication in other European countries is also possible to achieve in the future, as the method considers only the distance between the heat source and heat consumers and needs as input only open-source data.

2.1. Study Areas

The test area is a small anonymous area, which deals only for the test purpose.
The study area is one of the communities within Wroclaw county in the Lower Silesian Voivodeship and is called Siechnice. The study area is placed on the south border of Wroclaw City.
The study area analyzed in this paper considers also the surroundings of the community Siechnice, which are Święta Katarzyna, Żerniki Wrocławskie, Zacharzyce, Iwiny, Groblice, Łukaszowice, and Mokry Dwór, see Figure 1
The study area seen in the Figure 1 is supplied by the Czechnica CHP plant—a combined heat and power plant with an achievable electrical capacity of 100 MWe and thermal capacity of 247 MWt.

2.2. Materials

Taking into account the target of generating a district heating network in a rapid, automatic and reliable manner, the following general criteria seen in Table 1 and Table 2 are considered.
The data material (building footprints, street network) are taken from the available open-source data (Geoportal.gov.pl) (accessed on 1 September 2023) for one example test area and a study area. The location of the heat source is set as a reliable point location. All the data shown in Figure 2 and Figure 3 will be used for the development and testing of the methodology.
Figure 3 presents the data input taken into account for the DH network generation in the study area. Even if at this stage of DH planning, it does not matter what kind of heat consumers there are, because we assume that 100% heat consumers will be connected into the DH network, the division of the heat consumers into different groups should show what kind of heat consumers are available in the study area.
The target of this paper is the first draft estimation of the route length without detailed network planning and therefore without the dimensioning of heating pipes, which is dependent on the different heat demands of the heat consumers. At this stage, called “strategic heat planning”, the heat demands of different heat consumers do not play a role. The following implementation planning, which will be performed in the further works of the authors, will also consider the energy issue.

2.3. Methods

In order to achieve the replicability of the proposed method, the following scheme, as seen in Figure 4, is developed. Using this scheme, a progressive replication of the method for generating heating network pipes can be possible. Starting from the community level and implementing the method tested on a selected study area, the possibility for its replication in further communities in Wroclaw county is given. Further on, after the estimation of the heating pipes in each community of a Wroclaw county, the county level would be covered, and then the same with the replication to the voivodeship level (all counties of, e.g., Lower Silesian Voivodeship will cover the whole mentioned voivodeship). Finally, having district heating networks generated for all the voivodeships of Poland, the whole country would be covered with the potential district heating networks.

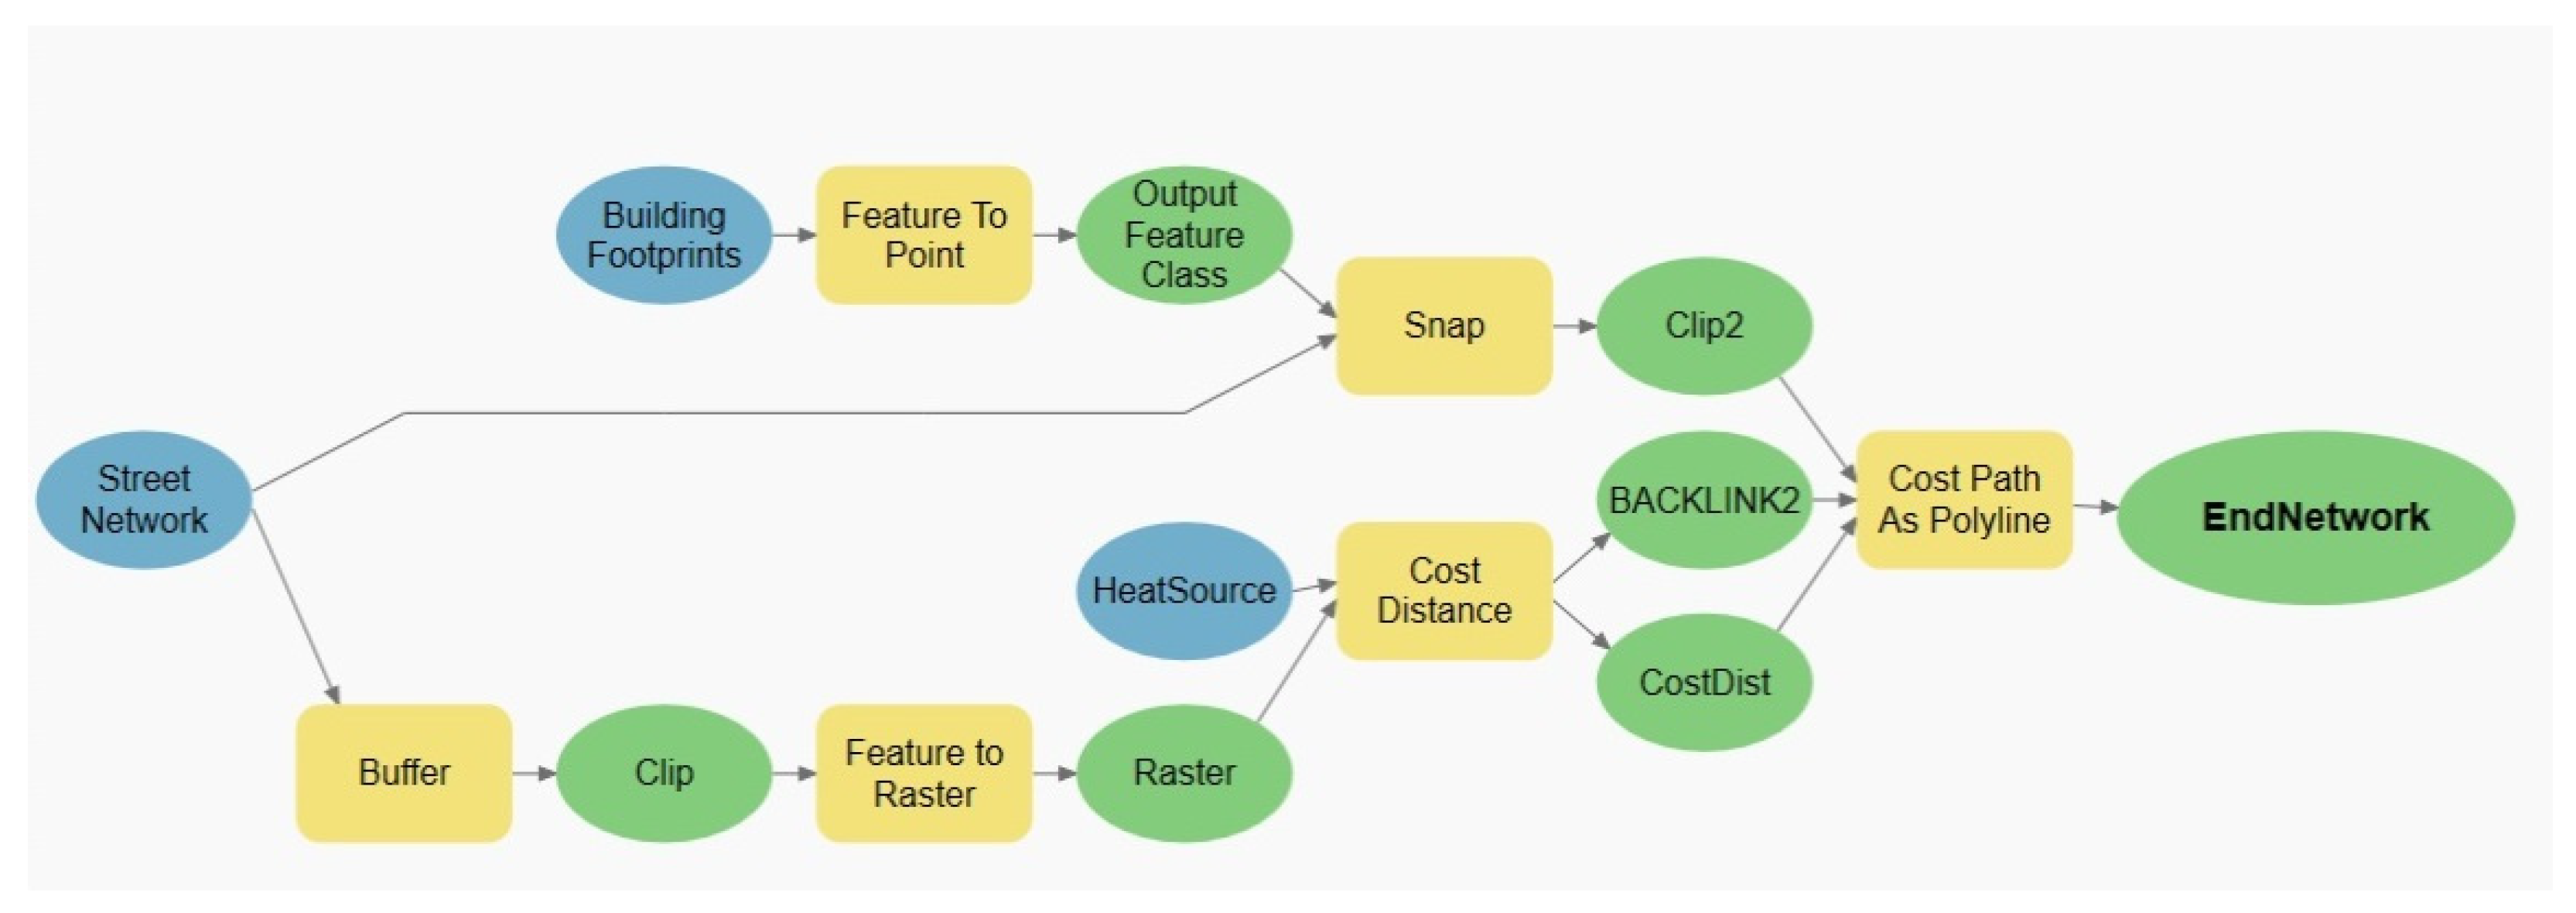
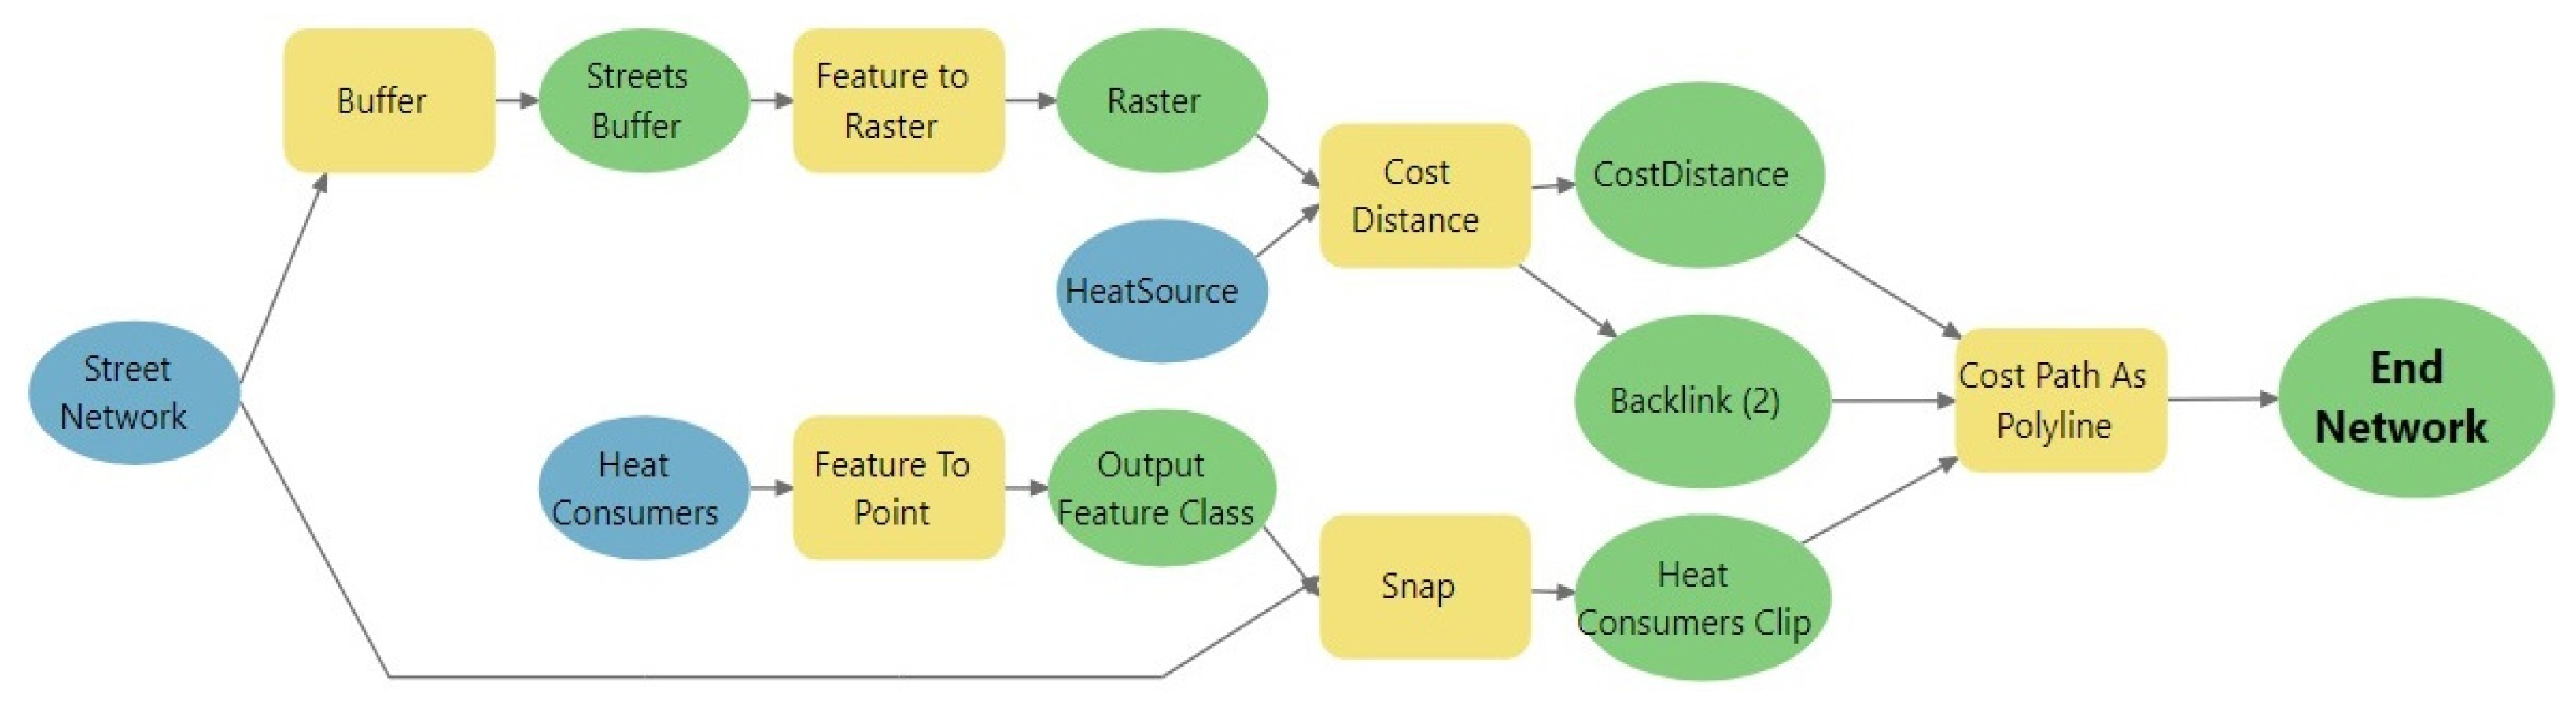
2.3.1. Least-Cost-Path Method

The method uses the Least-Cost-Path Analysis (LCPA) tool, implemented in the software ArcGIS Pro [26], to generate the shortest route between the heat source and each of the heat consumers. The methodology uses a two-step approach, which are the streets as the first step and the buildings (heat consumers) as the second one. The method described below was firstly tested on an example test area in order to implement it in a real study area (community of Siechnice and its surroundings) later on.
Step 1, considers the streets: In the first step, a buffer zone of 2 m is generated around the street network of the analyzed test area. Secondly, a polygon of the streets must be transferred into a raster format in order to be able to perform the next steps. In the third step, a Cost Distance tool is used, which calculates the least accumulative cost distance for each cell from or to the least-cost source over a cost surface. This raster effectively illustrates the cost distance from the heat source for each considered cell within it.
Step 2, considers the buildings: Firstly, a Feature to Point tool is used to generate the centroids of each of the buildings. Next, a tool called Snap is involved using a parameter of the distance set as high to make sure that each of the buildings is dropped on the nearest street available.
As a final result, a Cost Path is generated, which represents a targeted district heating network. Here, a tool called Cost Path as Polyline is used in order to do this. The input data for this tool is as follows:
-
Raster of feature destination data (result of Step 2);
-
Input cost distance (result of Step 1);
-
Backlink raster (from Step 1);
-
Path type (best cell), matched to each point representing a building (Version 1).
Since the idea is that the lines are not stratified to each point of the building but only generally run the network to all endpoints (so that there are not as many network endpoints as there are buildings), a further step of selecting only the network endpoints is needed (path line, Version 2).
In the final step, again the tool called “Cost Path to Polyline” is used, but this time the layer that represents only the endpoints is used as input. This results in a simplified network, which does not consist of so many endpoints as before. The following steps are shown in Figure 5, where a workflow of the methodology is implemented in an automated model using the ArcGIS Pro Model Builder application.

2.3.2. Closest Facility Method

The concept underlying this model, as shown in Figure 6, is to determine the most efficient routes for a heat network. The model, developed in ArcGIS Pro, employs an iterative process using Closest Facility network analysis and a “while” iterator. After establishing a Network Dataset based on the streets within the researched city, it becomes possible to generate a Closest Facility layer associated with it. This layer is then updated with “Incidents” serving as our Heat Source and “Facilities” representing the buildings to be connected to the heating network. Subsequently, the algorithm resolves the “Closest Facility”, generating routes from each heat consumer to its nearest heat source based on the distance through the street network. From the resulting “routes” layer, the route with the minimum length must be exported and appended to the “Solution-Heat Network” layer. Following this, the “Facilities” already linked by the heat network need to be moved to the “Incidents” layer, and the entire analysis must be reiterated. The “while” iterator is linked to the number of rows in the “Facilities” layer and terminates when it is empty.

3. Results

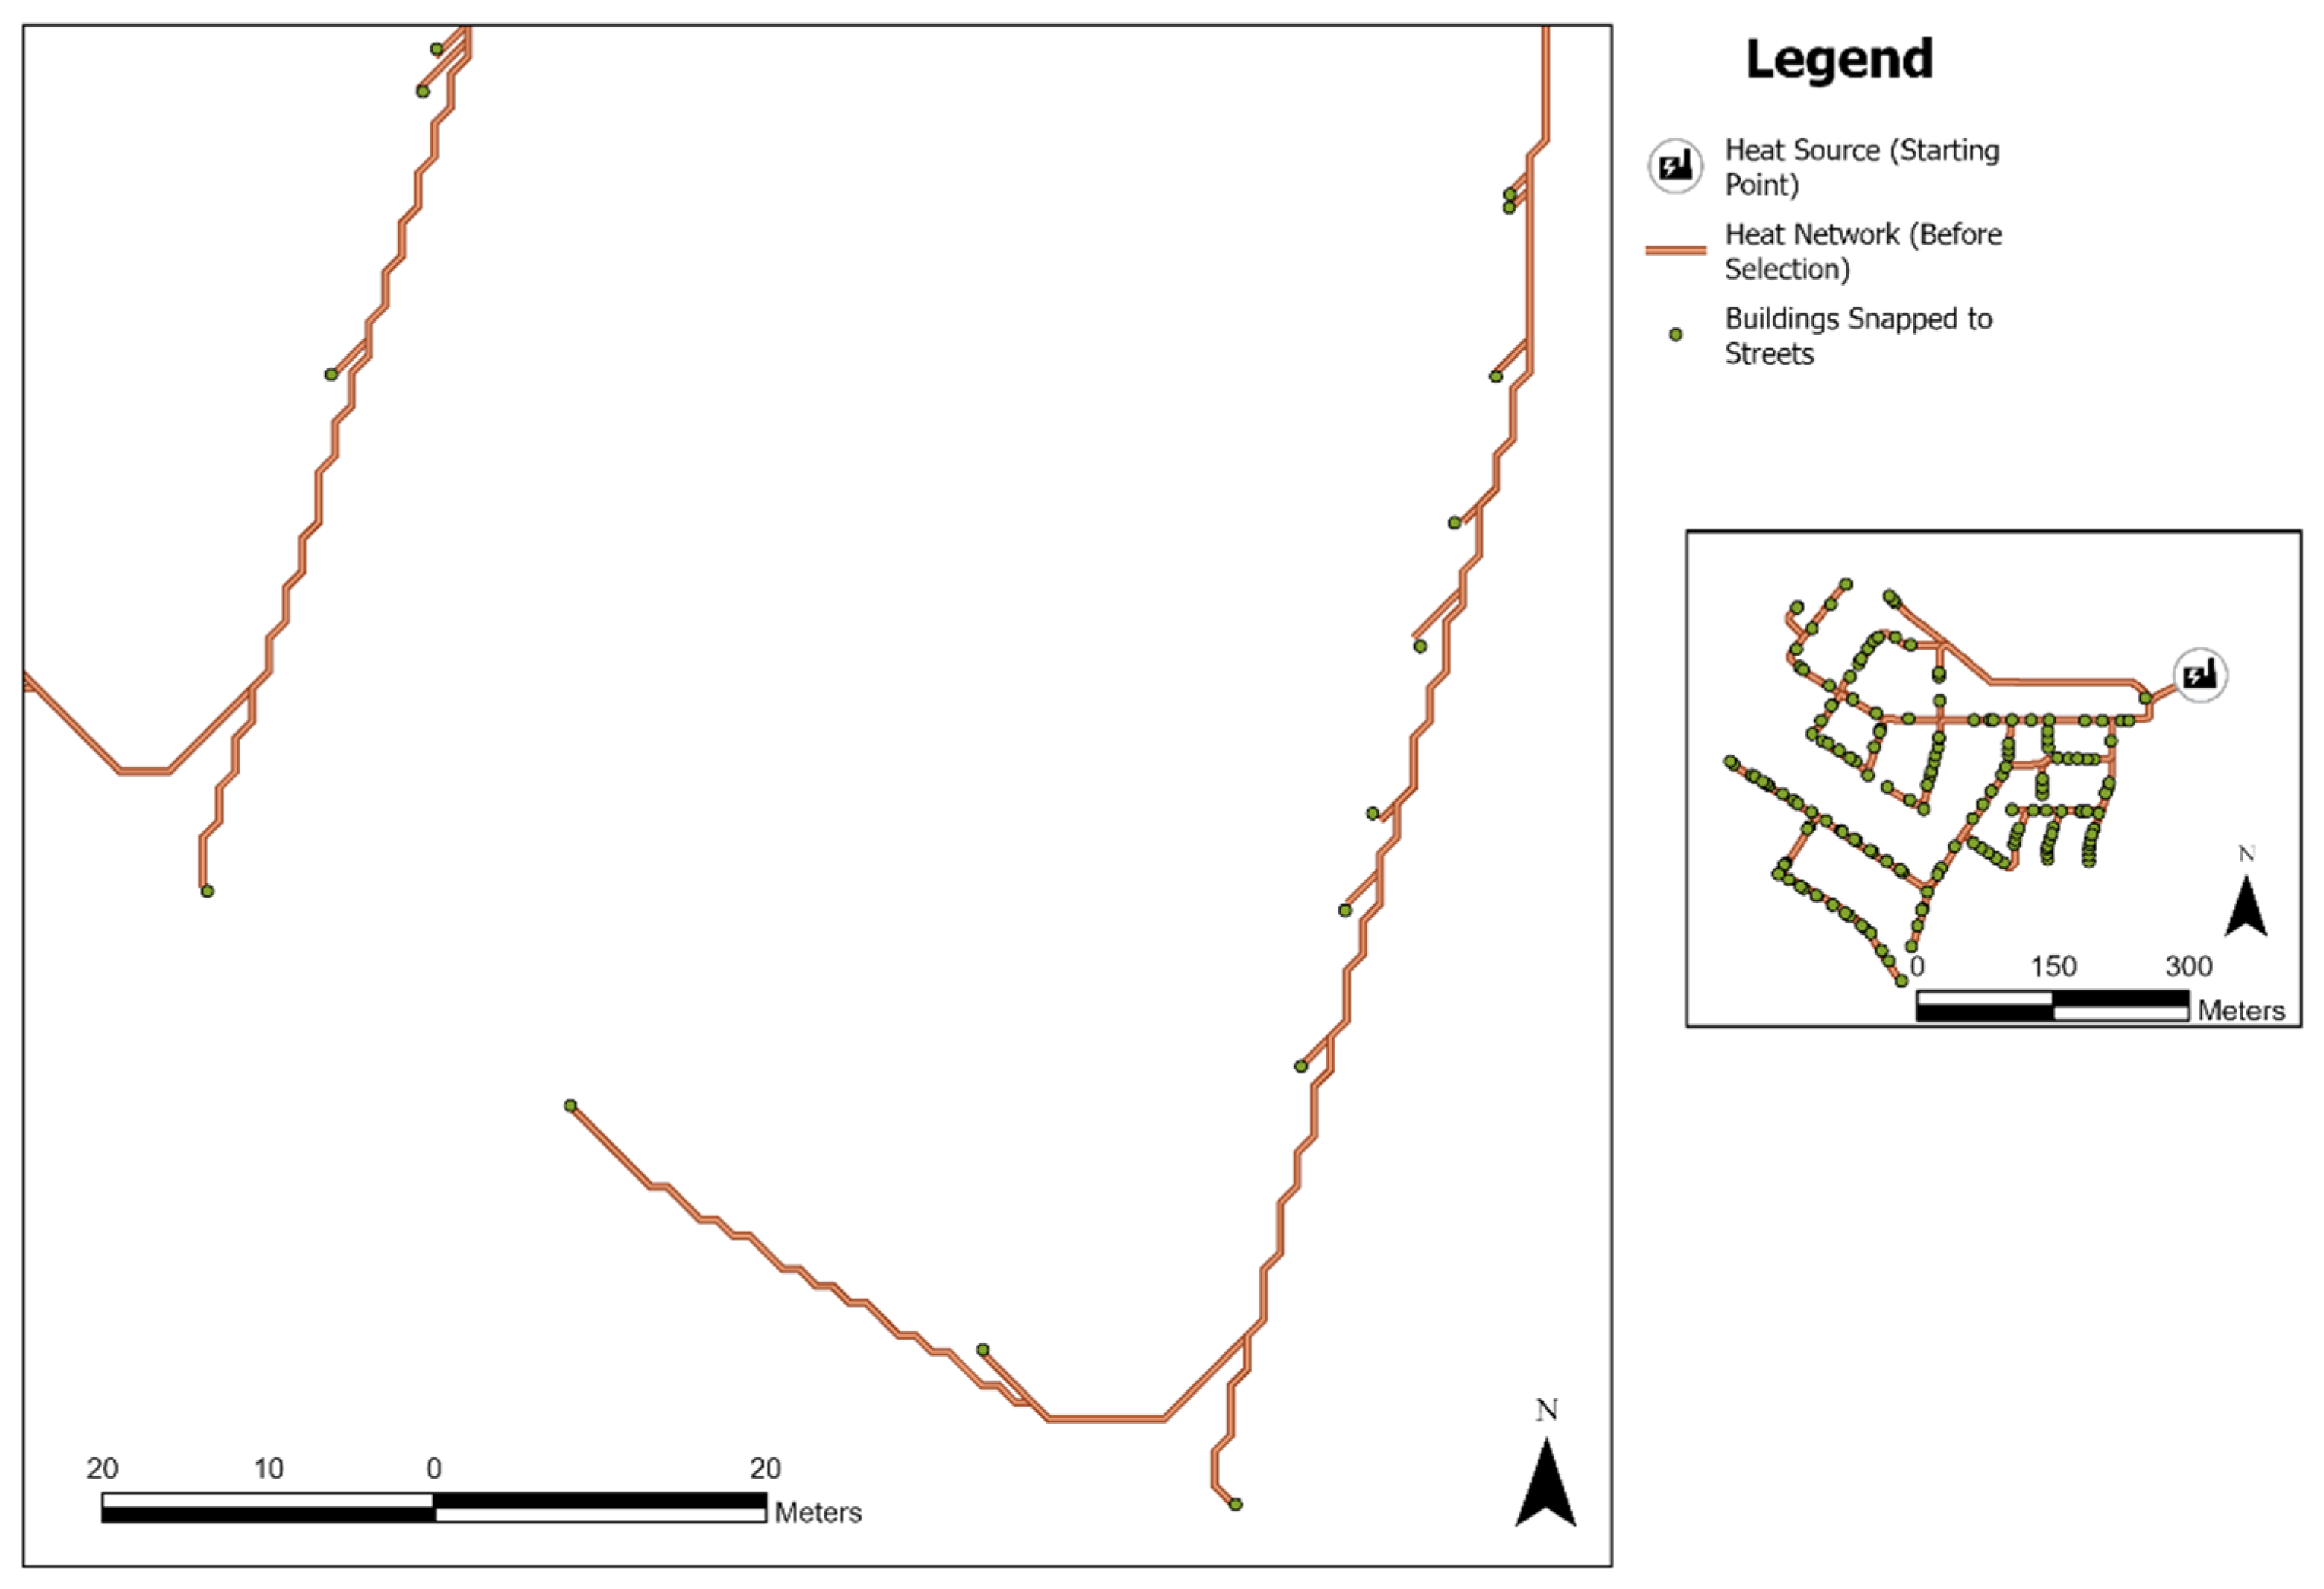
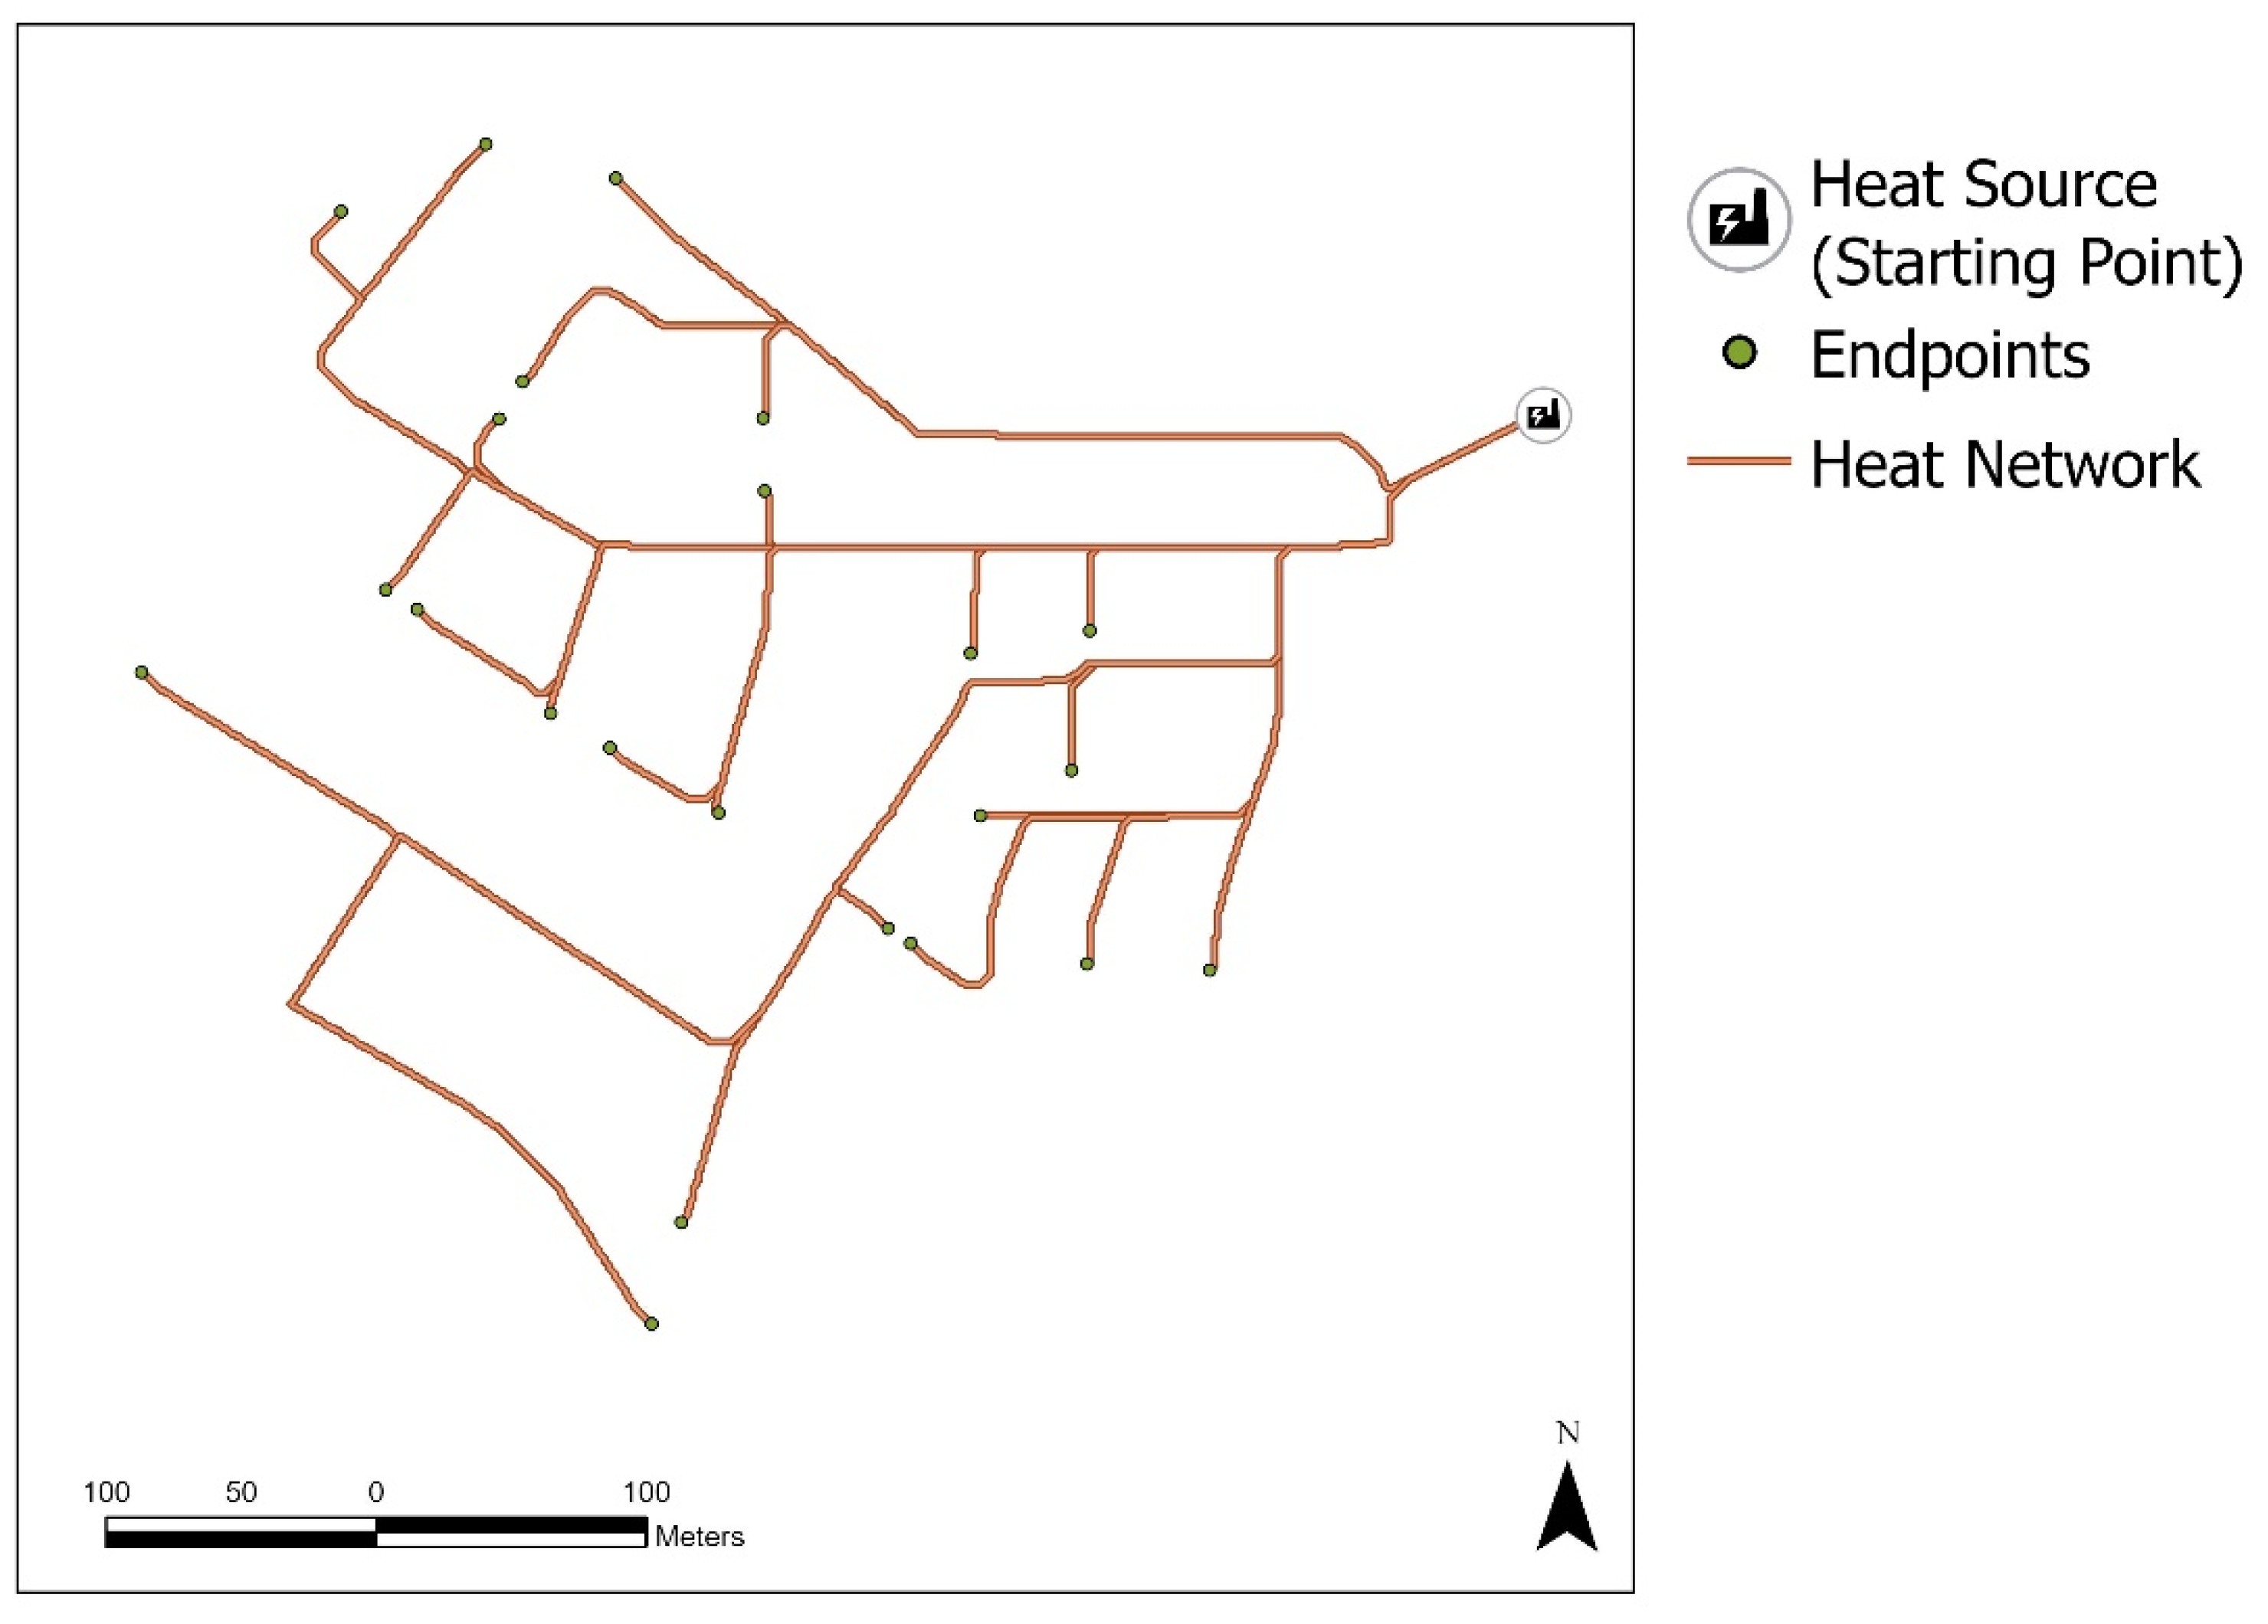
3.1. Least-Cost-Path Analysis for the Test Area

As mentioned in the methodology, the development of the method for generating heating networks on the basis of street networks happened in a few steps. The first one involved matching the path line to each point (centroid) representing a building. Figure 7 provides a close-up view of a part of the network’s branches to reveal its real structure.
In the next step, the path line, as seen in the Figure 7, was optimized in order to run the network while taking into account all the network endpoints. Hereby, a path line Version 1 was generated. Figure 8 depicts the outcome of the automated analysis steps in the test area.
In order to prevent branching out to each of the buildings and obtain only a generalized network structure, it was necessary to select the edge buildings for analysis and repeat it. The result is shown in Figure 9 as path line Version 2.
Figure 10 shows the final result of the proposed LCPA. The result is the generated district heating network for the small analyzed test area. The generated DH network begins from the starting point, which is the heat source, and follows each of the heat consumers along the available street network.
Looking at the heating network generated for the test area, we can observe that it was generated appropriately considering our assumptions. This means that we decided to plot the network according to street network, starting from the heat source as the starting point and following to each of the end points, which are the heat consumers. Another really important issue when generating the DH route is that it should not have closing spaces like, e.g., circle or rectangle spaces. The DH generated should map out the shape of a tree.
Cost Distance Surface (CDS)
As mentioned in the above, the methodology generated in the first step a Cost Distance Surface (CDS), which calculates the least accumulative cost distance for each cell from or to the least-cost source over a cost surface. In Figure 11, a CDS for the selected study area is shown.
The raster shown above illustrates effectively the cost distance from the heat source (starting point) for each considered cell within it, considering only the distance in [m] from the heat source to each cell of the street network.
Generated Heating Network
The next steps for generating the heating network on the basis of the CDS were described in detail and visualized using the example of the test area in the previous sections of this paper. The same method was also used for the selected study area. The outcome of it, which is the DH network, is shown in Figure 12.
Analyzing Figure 12, there is one important weak point by generating heating pipes using the LCPA method. This is due to the fact that the method presented in this paper generates some redundant (duplicate) heating pipes routes. This is caused by the fact that the method considers only the distance between the heat source and end points (heat consumers) each time the heating pipe is generated.
One example of the weak point is shown in Figure 13 in the black box, where two heating pipes were generated even though only one would be enough to connect all the heat consumers placed in this area. The other one could be removed, as done using red lines in the Figure 13.
This weak point results from the fact that each time the heating pipe is generated, it takes into consideration the distance between the heat source and the end point of the heat consumers, and not the shortest distance between the target not connected end point and the end point almost connected in case there is a street network available.

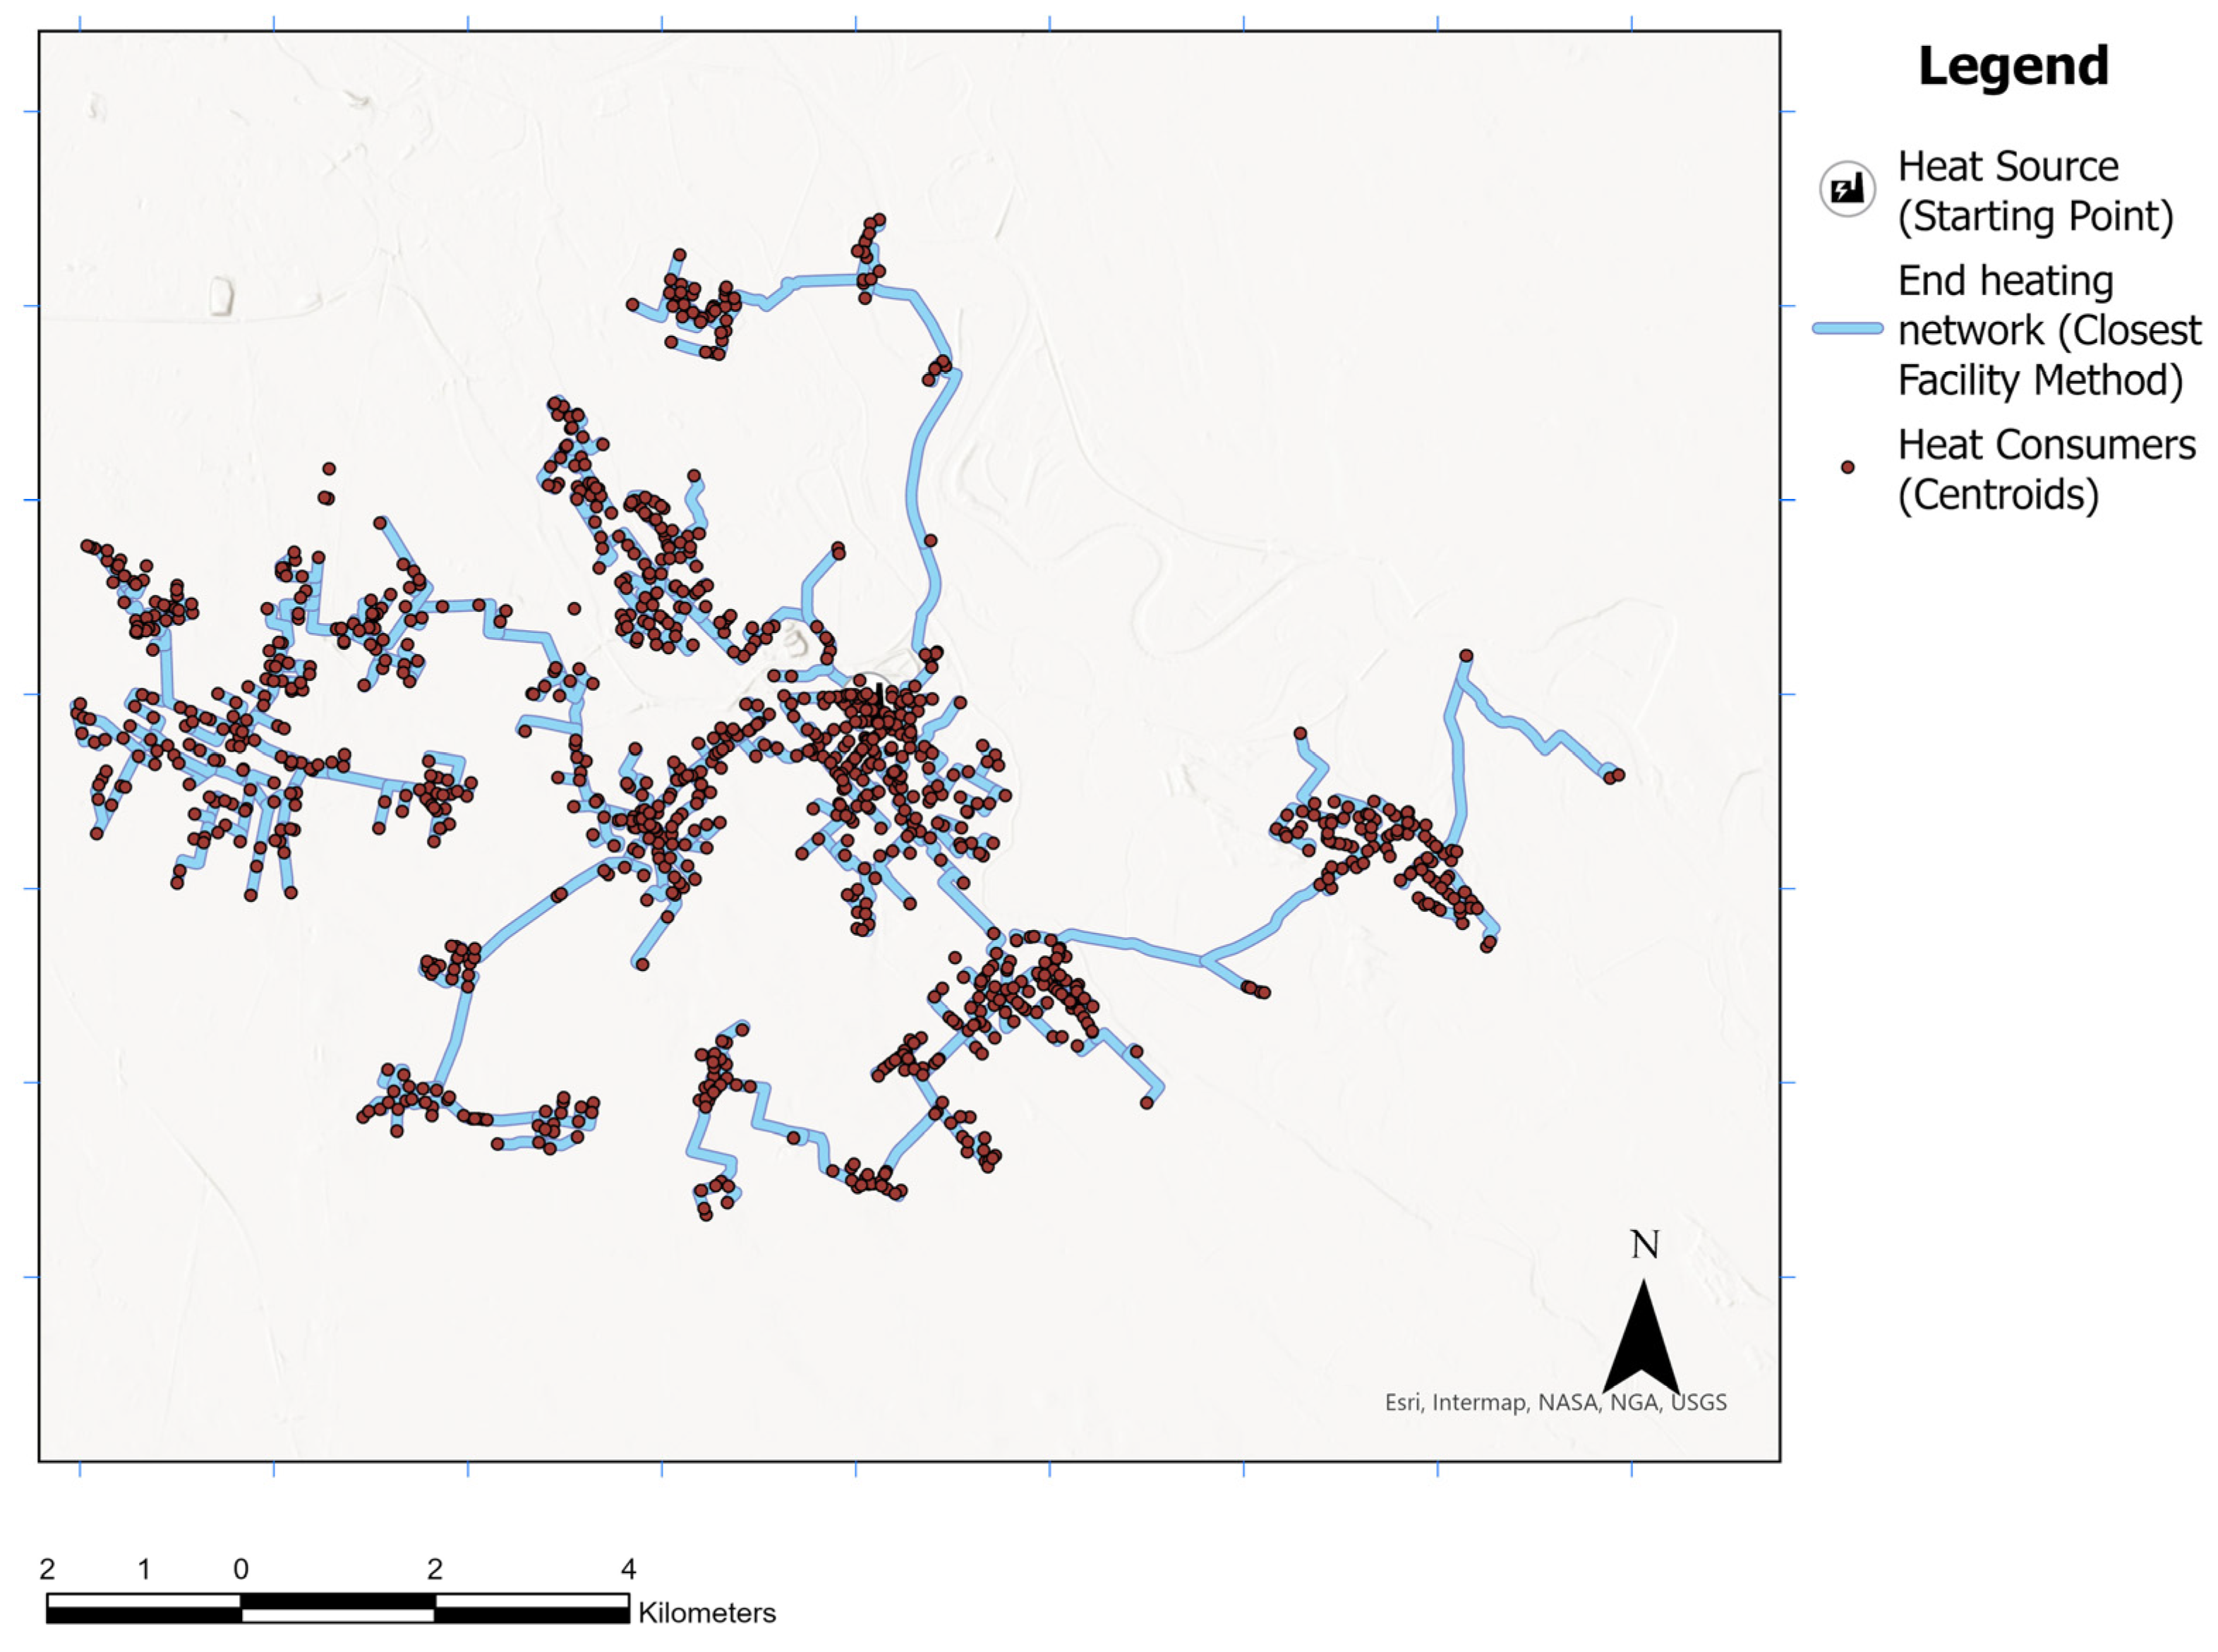
3.2. Closest Facility Analysis

Following the LCPA method, an additional method using Closest Facility Analysis was developed. The final result coming from this method is shown in Figure 14.
Analyzing the result of the Closest Facility method, as shown in the figure above, we can observe a better, more efficient (less heating pipes than in the case of Figure 13) DH network to have been generated.

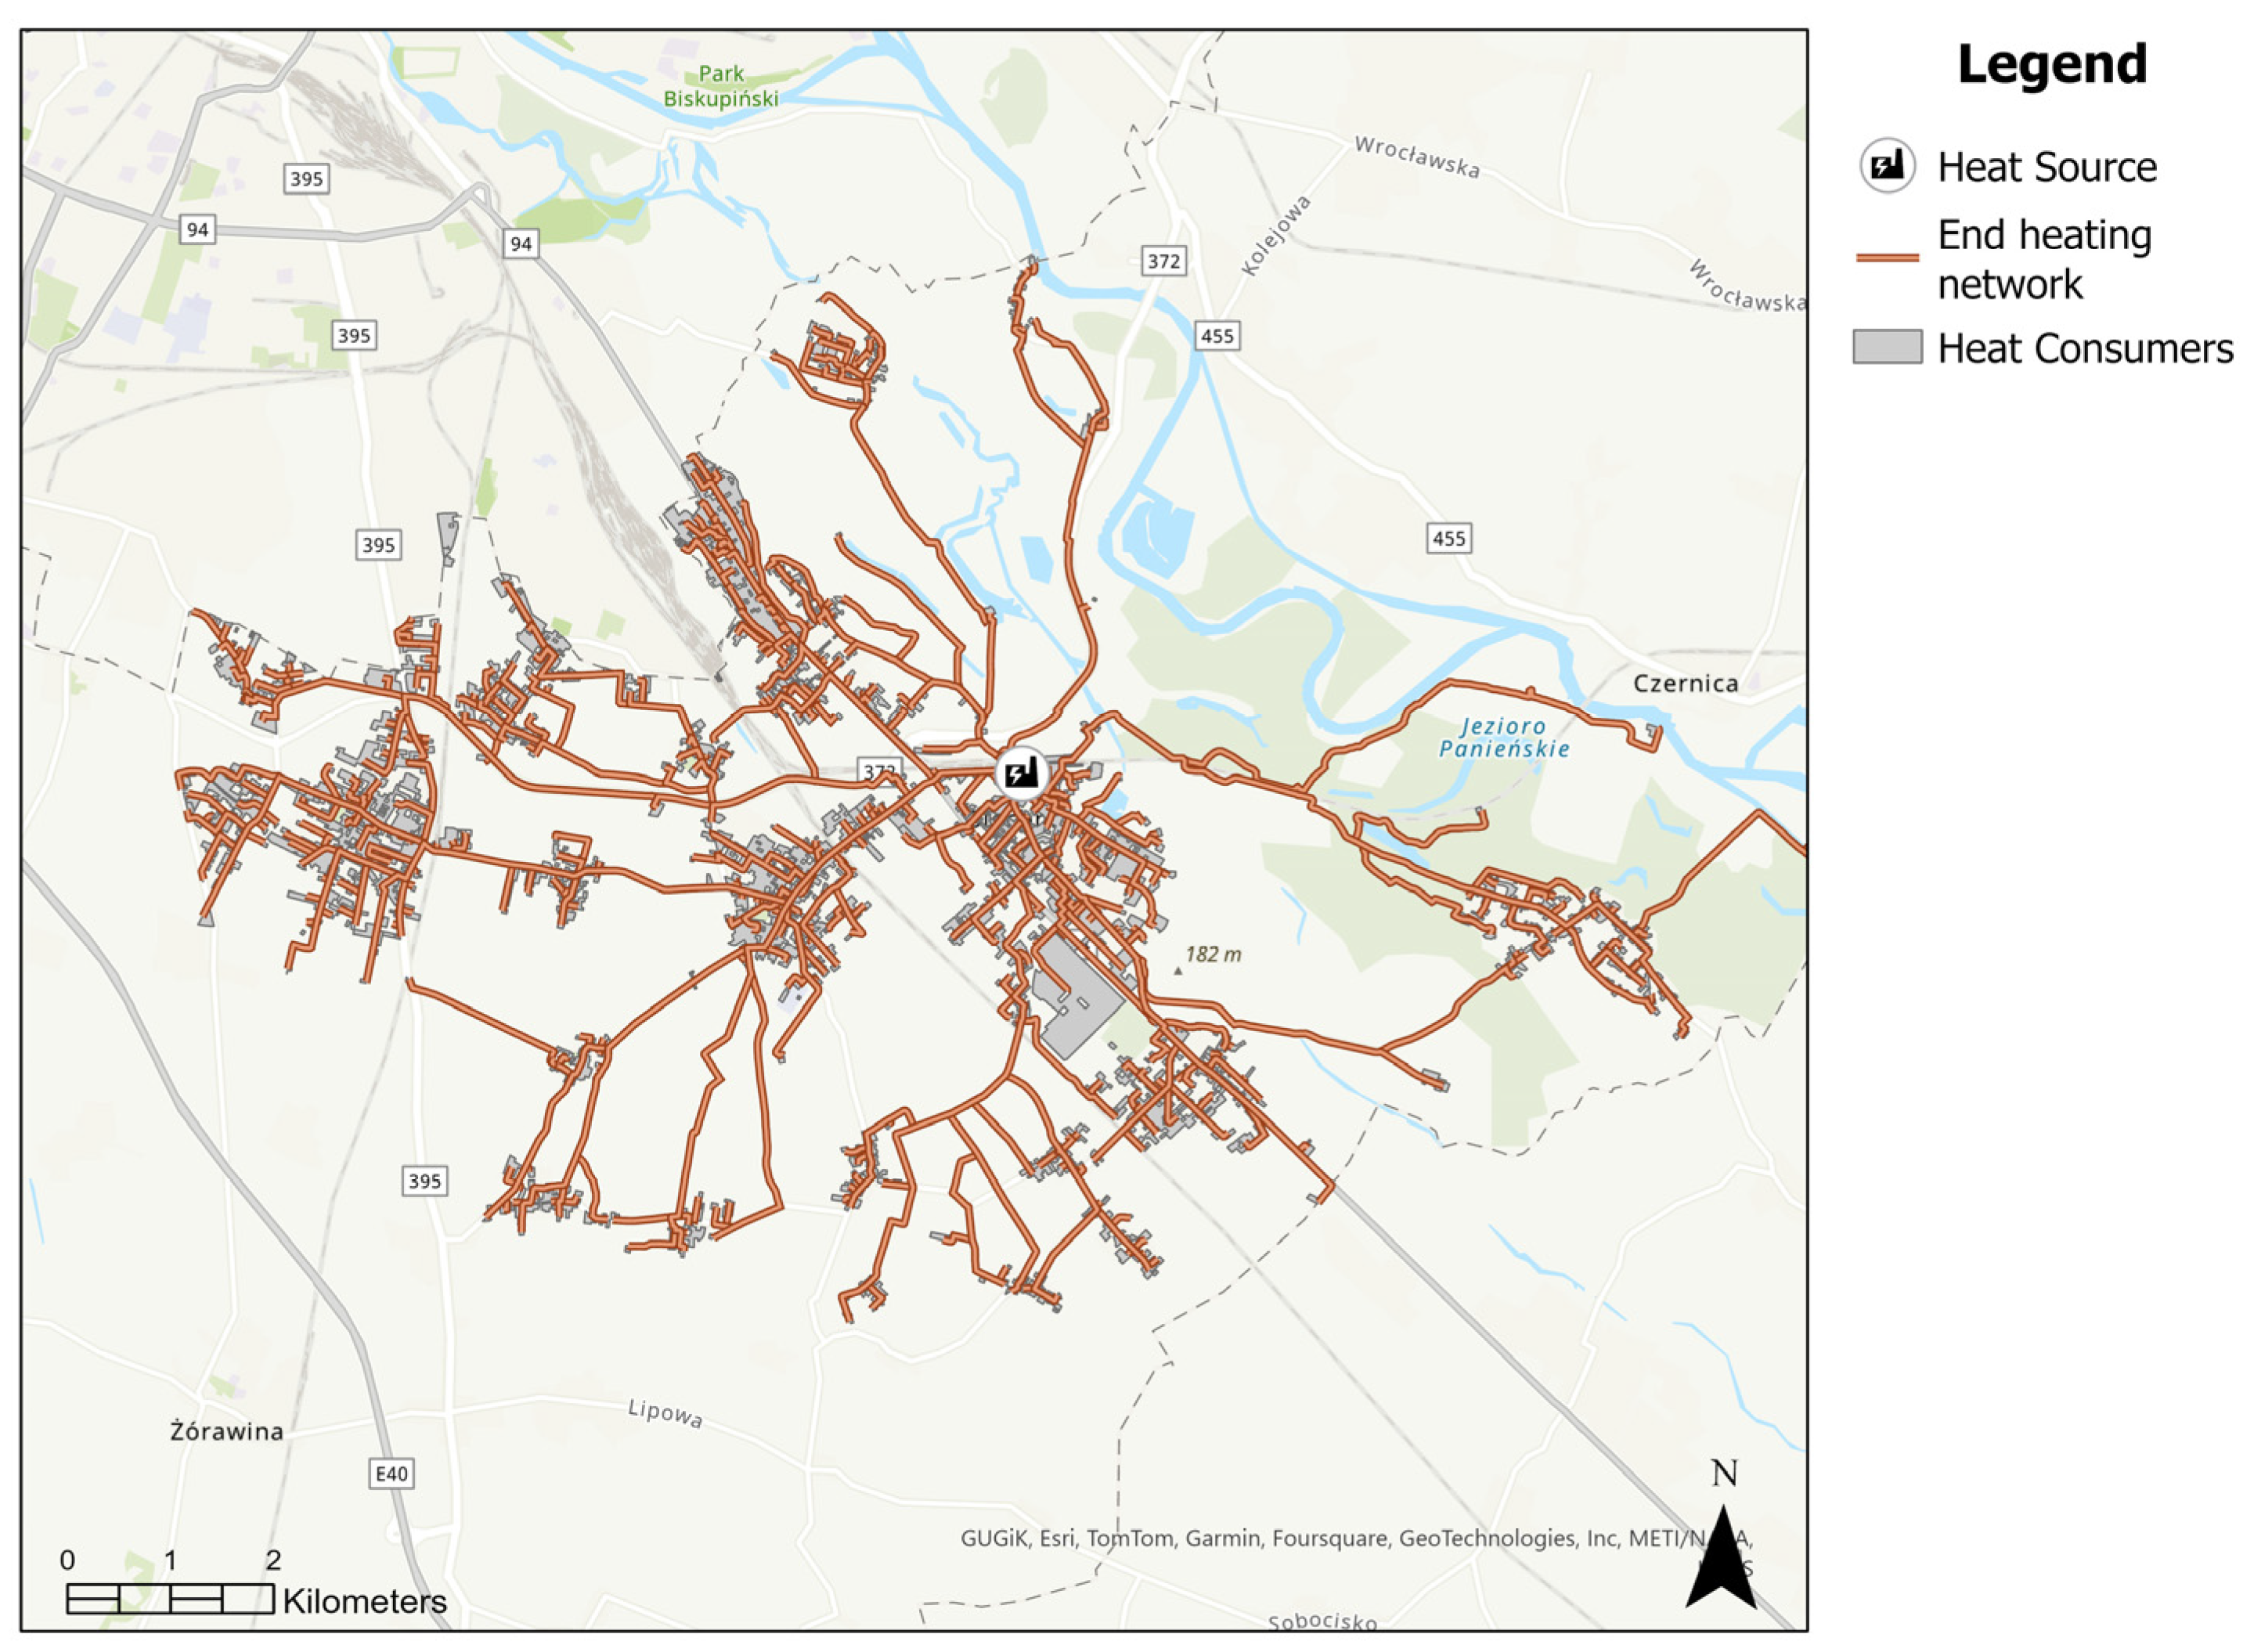
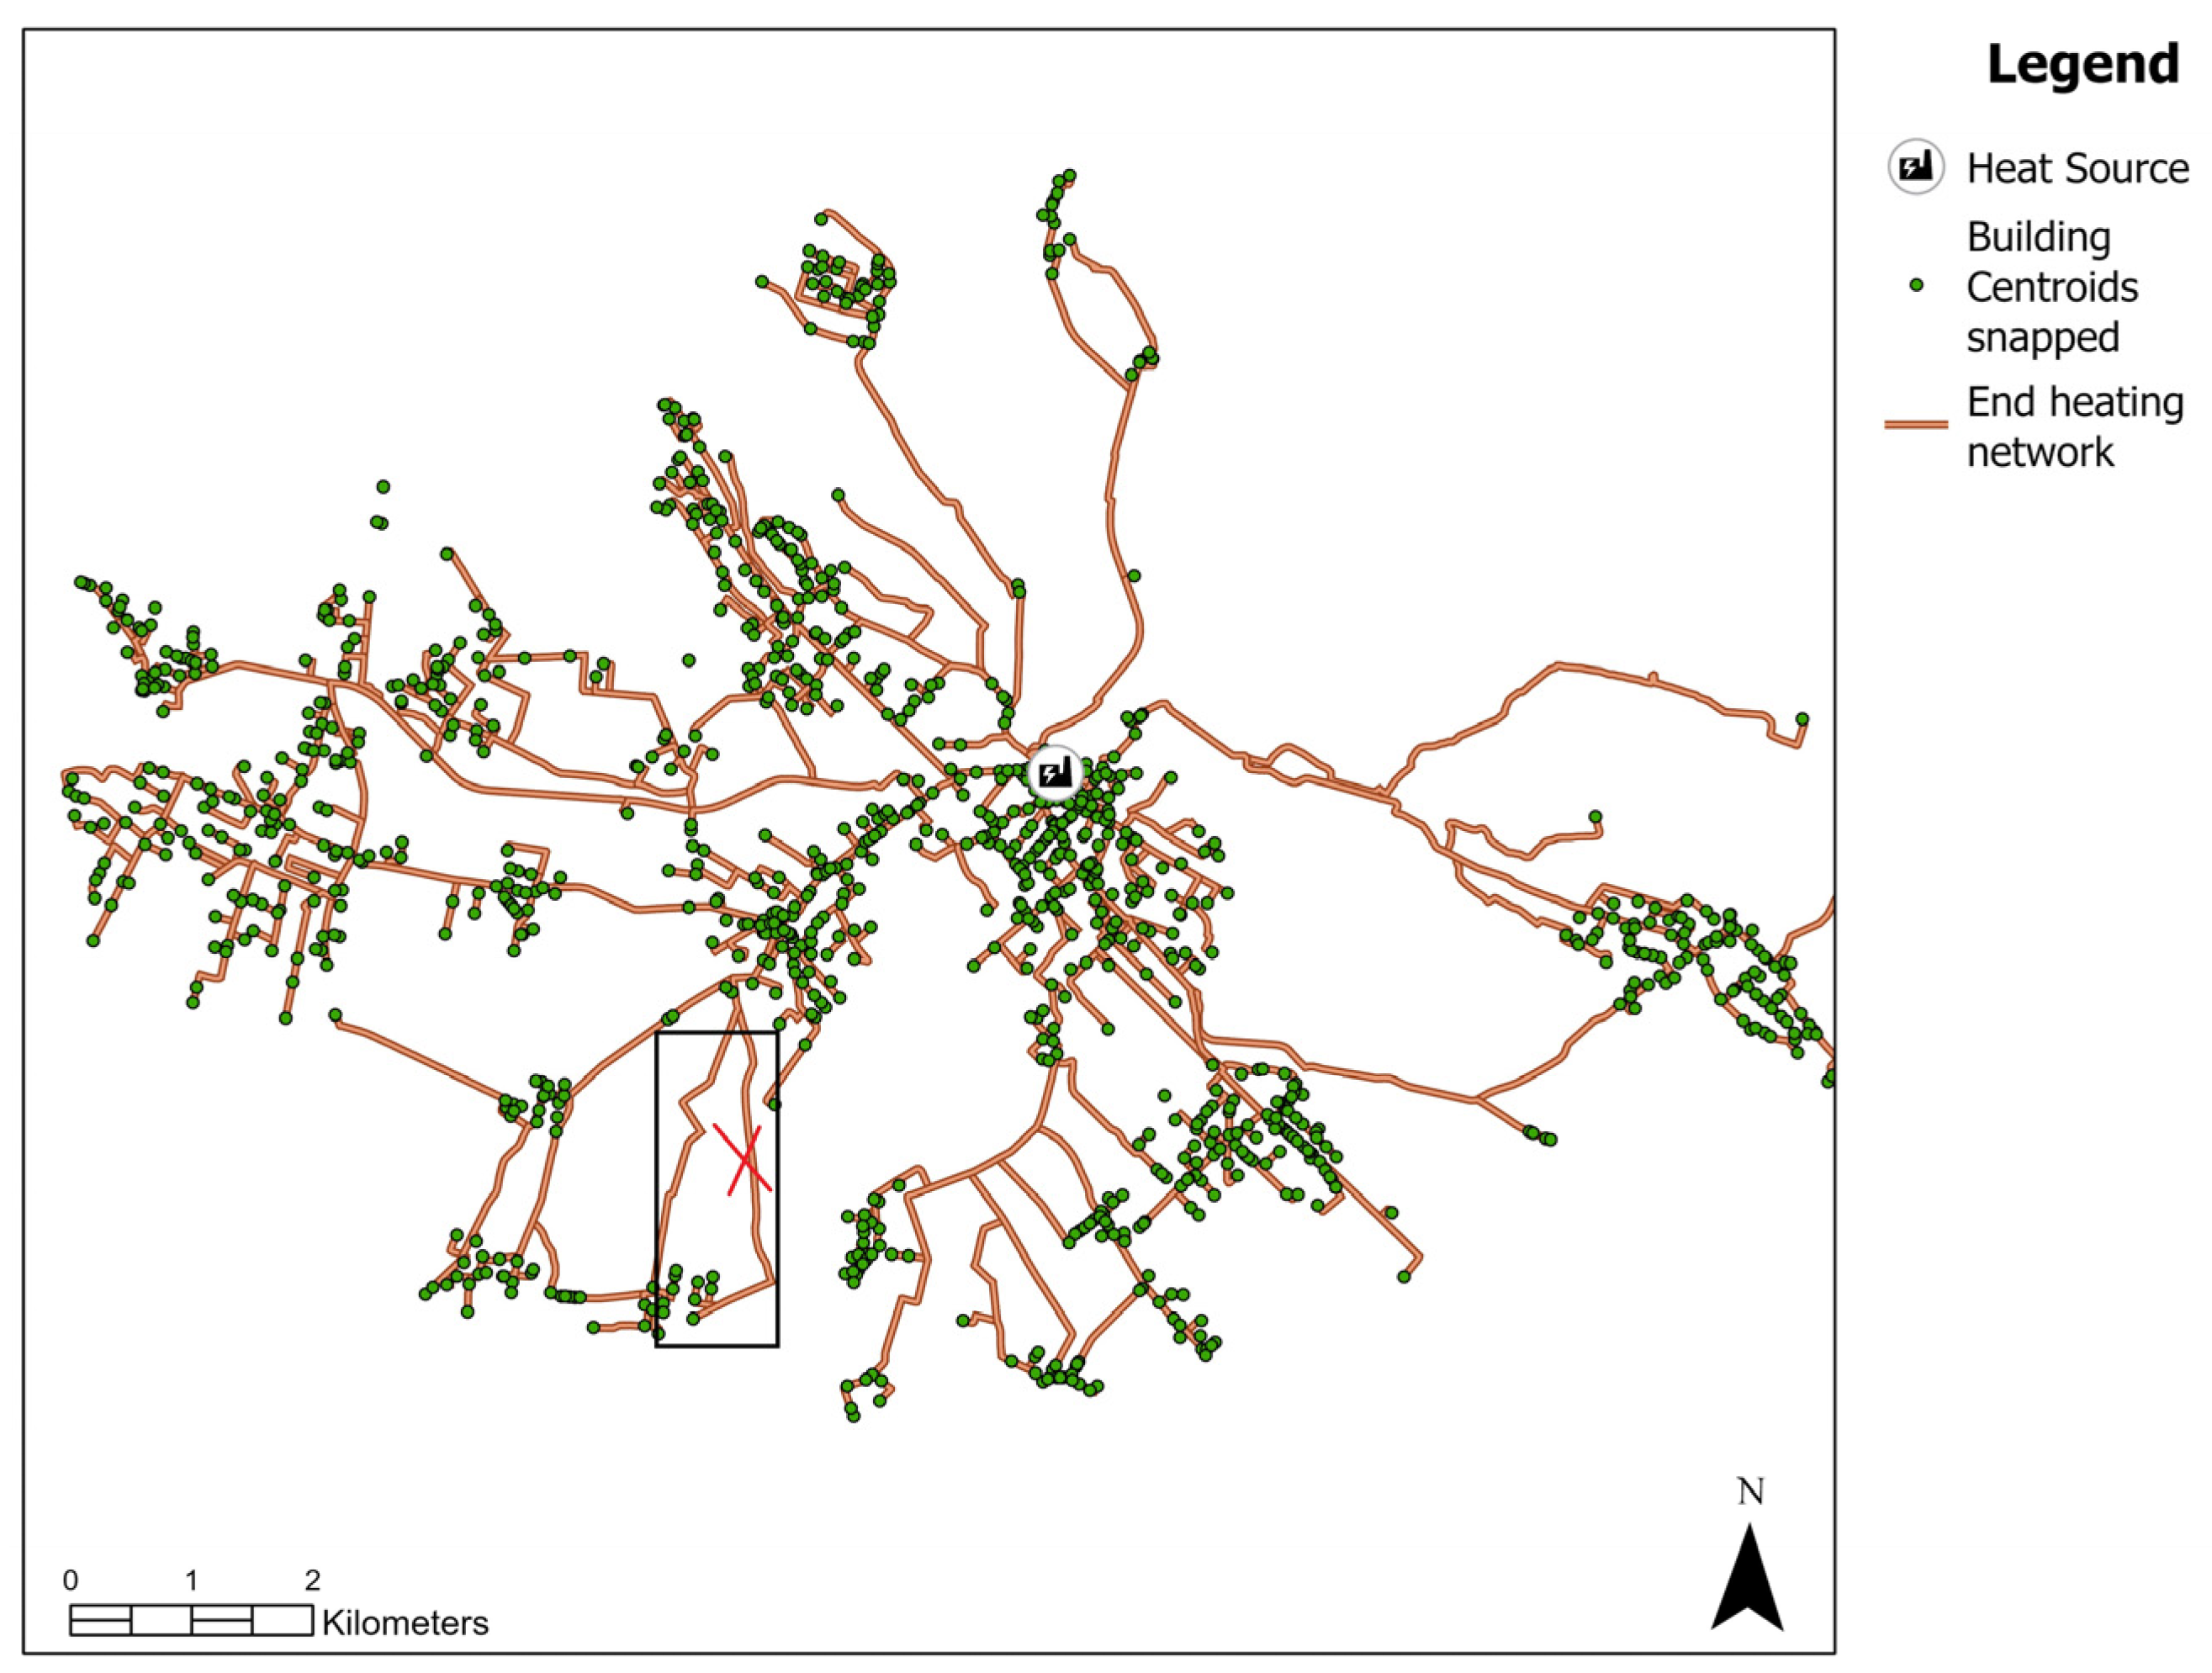
3.3. Replication on Different Communal Levels

One of the main important targets of the proposed method is the achievement of its replicability at higher levels than the community level. In Figure 4, the scheme of the replication procedure proposed in this paper is shown. Following this scheme, the method for generating DH networks, as tested on the selected study area, should be implemented in other communities in Wroclaw county. Figure 15 presents the area of the whole Wroclaw county, showing also the generated district heating network for the study area. We can see that the generated heating network for the study area is only a small part of the whole county. Therefore, the target in further work would be the implementation of the method in other communities in order to cover the whole of Wroclaw county. This should be a good example for other Polish communities in order to encourage them to connect more and more houses to the existing or potential DH networks.

4. Discussion

In order to speed up the process of decarbonization, some countries in Europe, like e.g., Denmark and Germany, introduced regulations regarding the coverage of the heat demand on a wider scale. Germany, as one of the leaders in this topic, obligates all its communities to have heating plans for coverage of the heat demand by 2050, as described in the Introduction. The strategy and methods to achieve this target are not solved until now, and there is a urgent need for doing this in a rapid and efficient manner. Although the previous works, especially through our German neighbors, show that the generation of potential heating networks using the GIS methodology is possible and provides reliable results, there is still great potential for the optimization of these techniques and methods. The investigations carried out within this study indicate that automatization of this process with reliable results is possible in a very easy and fast manner, as the proposed method is based on very few input data.
The LCPA method tested and presented in this paper shows very good results in the case of a small test area, generating the end heating network appropriately. This means that the network was generated along the street network without closing spaces and connects all heat consumers. Based only on this small example, it could be supposed that this method is good enough to achieve the target of this work, which is the generation of potential heating networks in a very automatic manner at different spatial levels. Showing in the results from the selected study area, one important week point occurs due to the generation of some unnecessary heat pipes.
Summarizing, the LCPA-based heating pipe routing method proposed in this paper uses a simple and nevertheless efficient and easily automated way to generate heating networks on the basis of very few input data, as they are the building footprints and the street network, which are available open-source for all communities in the European Union under the Inspire Directive [27]. In addition, volunteered geographic information (VGI) data sources such as the Open Street Map in case public data are not openly available.
Furthermore, this method is very easy to use and takes only few minutes of computation time, and it is therefore suitable for use for the first general estimation of potential DH networks at different even higher (like the whole voivodeship) levels.
In order to avoid generating unnecessary heating pipes, a better method using a Closest Facility tool was developed and implemented in a Model Builder of the ArcGIS Pro environment. This method requires more computational time: for the selected study area, it took 5 h for 1127 connections, which involves 220 connections/hour but generates a more efficient (as many pipes as needed) DH network.
The limitations of the current study are as follows:
-
The proposed method deals only with the first rough generation of DH networks without considering the energy issue.
-
The computation time is rather high (220 connections/hour) in the case of the Closest Facility method.
Further directions of this study would be the development of a tool for dimensioning the heating pipes on the basis of the available heat demand data of individual heat consumers in order to consider the energy issue and perform the economic analysis.

5. Conclusions

In this paper, a workflow for the automatized and easy-to-use generation of DH networks on the basis of very few input data is proposed. The methodology considers reliable street networks and building footprints in order to draw first rough potential heating networks in analyzed areas. The methodology was first verified in a very small test area, which enabled proof that the model works appropriately. Then, the model was implemented in a selected study area of Wroclaw county, the Siechnice commune, and its surroundings to check if the implementation procedure on a wider scale than a small community is possible due to the target of achieving the replicability of this method at higher administrative division levels. A further and wider target is to transfer this methodology in other countries in Europe, especially Germany, where an urgent need for such applications exists due to achieving climate-neutrality regarding the heat supply.
The findings of this study can be summarized in the following points:
-
An easy-to-use and accurate method on the basis of very few open-source data input is possible with reliable computation time (LCPA method: few minutes; Closest Facility method: 220 connections/hour).
-
The DH networks generated using both methods are reliable, as they are based on real street networks and considers real building footprints.
-
The drawing of the first potential DH networks using an LCPA method on a smaller spatial level is very appropriate: in the case of higher spatial levels, a weak point occurs due to the fact that some redundant (duplicate) heating pipes routes are generated.
-
A solution to work around this weak point was found using another so-called Closest Facility method, even if this method takes more computation time.
Even if both methods have some restrictions, they can both be used and implemented in the Municipal Heat Planning at the first stage, called Strategic District Heating Planning. The stage of implementation as well as validation must be assessed in further works. These further developments will be focused on the following:
(1)
Analysis of the open-source heat demand or even available heat consumption data for each of the heat consumers integrated in the DH network due to proceeding with dimensioning of the generated heat pipelines of the DH networks.
(2)
Development of an additional option to generate the house connections between the main heat pipes and the heat consumers.
(3)
Development of an automatic tool/model for performing the dimensioning of DH pipes.
(4)
Enhancement of the model to perform the first cost-effective analysis on the basis of the line density and effective width for district heating (example procedure in [28]).
(5)
Implementation of the model for the fully automatic generation of potential DH networks at different spatial levels.

Author Contributions

Conceptualization, A.S. and J.B.; methodology, A.S., J.M. and J.B.; validation, A.S. and J.M.; writing—original draft preparation, A.S. and J.B.; writing—review and editing, A.S.; visualization, A.S.; supervision, J.B.; project administration, A.S.; funding acquisition, A.S. All authors have read and agreed to the published version of the manuscript.

Funding

This research was funded in part by the National Science Centre, Poland (grant number: 02NW/0010/23). For the purpose of open access, the authors have applied a CC-BY public copyright license to any Author Accepted Manuscript (AAM) version arising from the submission.

Data Availability Statement

Data used in this paper are taken from Geoportal.gov.pl (assessed on 1 September 2023).

Acknowledgments

The authors wish to thank their German colleagues from the KEA Klimaschutz-und Energie Agentur Baden-Württemberg GmbH (eng. Climate Protection and Energy Agency Baden-Württemberg GmbH) as well as other partners in the ANSWER Kommunal project for their input considering the existing German regulations in the field of Municipal Heat Planning.

Conflicts of Interest

The authors declare no conflicts of interest.

References

  1. European Commission. Energy. Roadmap 2050. Impact Assessment and Scenario Analysis. Available online: https://energy.ec.europa.eu/system/files/2014-10/roadmap2050_ia_20120430_en_0.pdf (accessed on 8 November 2023).
  2. Connolly, D.; Lund, H.; Mathiesen, B.V.; Werner, S.; Möller, B.; Persson, U. Heat Roadmap Europe: Combining district heating with heat savings to decarbonize the EU energy system. Energy Policy 2014, 65, 475–489. [Google Scholar] [CrossRef]
  3. Danish Energy Agency. Technology Data—Energy Plants for Electricity and District Heating Generation; Danish Energy Agency: Copenhagen, Denmark, 2016. [Google Scholar]
  4. Persson, U.; Bernad, M.; Eva, C. sEEnergies D4.5—District Heating Investment Costs and Allocation of Local Resources for EU28 in 2030 and 2050; Zenodo: Geneva, Switzerland, 2021. [Google Scholar]
  5. BMWK—Heating Networks: Connecting to the Future. Available online: https://www.energiewechsel.de (accessed on 8 November 2023).
  6. Frederiksen, S.; Werner, S. District Heating and Cooling, 1st ed.; Studentlitteratur: Lund, Sweden, 2013; Available online: http://urn.kb.se/resolve?urn=urn:nbn:se:hh:diva-23973 (accessed on 8 November 2023).
  7. Klimaschutz- und Klimawandelanpassungsgesetz Baden-Württemberg: Ministerium für Umwelt, Klima und Energiewirtschaft Baden-Württemberg. Available online: https://um.baden-wuerttemberg.de/de/klima/klimaschutz-in-bw/klimaschutz-und-klimawandelanpassungsgesetz-baden-wuerttemberg (accessed on 8 November 2023).
  8. Baden-Württemberg Climate Protection Act; EN_KSG BW_End Version; Ministry of the Environment, Climate Protection and Energy Sector Baden-Württemberg: Stuttgart, Germany, 2013.
  9. Kienzlen. Bedeutung von Wärmenetzen für die Energiewenden; KEA Klimaschutz- und Energieagentur Baden-Württemberg GmbH: Stuttgart, Germany, 2014. [Google Scholar]
  10. Talarek, K.; Garbowski, T. Challenges for district heating in Poland. Discov. Energy 2023, 3, 5. [Google Scholar] [CrossRef]
  11. Krajowy Plan na Rzecz Energii i Klimatu na Lata 2021–2030 (KPEiK)/The National Energy and Climate Plan for the Years 2021–2030. 2019. Available online: https://www.gov.pl/web/aktywa-panstwowe/krajowy-plan-na-rzecz-energii-i-klimatu-na-lata-2021-2030-przekazanydo-ke (accessed on 8 November 2023).
  12. Polityka Energetyczna Polski do 2040 r./Poland’s Energy Policy until 2040 (PEP2040); Ministry of Climate and Environment: Warsaw, Poland, 2022. Available online: https://isap.sejm.gov.pl/isap.nsf/DocDetails.xsp?id=WMP20210000264 (accessed on 8 November 2023).
  13. Report “Ostatni Dzwonek dla Ciepłownictwa w Polsce”. Available online: www.forum-energii.eu (accessed on 8 November 2023).
  14. Bagli, S.; Geneletti, D.; Orsi, F. Routing of power lines through least-cost path analysis and multicriteria evaluation to minimise environmental impacts. Environ. Impact Assess. Rev. 2011, 31, 234–239. [Google Scholar] [CrossRef]
  15. Project ANSWER Kommunal—Entwicklung Eines Standardisierten Analyse- und Ergebnisrasters für Wärmepläne zur Umsetzung der Energiewende im Kommunalen Bereich (eng.: Development of a Standardized Analysis and Results Grid for Heat Plans for the Implementation of the Energy Transition in the Municipal Sector); Research Report (FKZ 03ET4050A); KEA Klimaschutz- und Energieagentur Baden-Württemberg GmbH: Karlsruhe, Germany, 2022.
  16. Lin, S.; Mathew, S.; Rasam, A.R.A. Least Cost Path Analysis for Electrical Transmission Route Suitability. In Proceedings of the 3rd International Conference on the Built Environment and Engineering (IConBEE), Putrajaya, Malaysia, 17–19 October 2022; Volume 2881. [Google Scholar] [CrossRef]
  17. Effat, H.A.; Hassan, O.A. Designing and evaluation of three alternatives highway routes using the Analytical Hierarchy Process and the least-cost path analysis, application in Sinai Peninsula, Egypt. Egypt. J. Remote Sens. Space Sci. 2013, 16, 141–151. [Google Scholar] [CrossRef]
  18. Gustas, R.; Supernant, K. Least cost path analysis of early maritime movement on the Pacific Northwest Coast. J. Archaeol. Sci. 2017, 78, 40–56. [Google Scholar] [CrossRef]
  19. Siljander, M.; Venäläinen, E.; Goerlandt, F.; Pellikka, P. GIS-based cost distance modelling to support strategic maritime search and rescue planning: A feasibility study. Appl. Geogr. 2015, 57, 54–70. [Google Scholar] [CrossRef]
  20. Dudás, G.; Boros, L.; Pál, V.; Pernyész, P. Mapping cost distance using air traffic data. J. Maps 2016, 12, 695–700. [Google Scholar] [CrossRef]
  21. Saaty, T.L. The Analytic Hierarchy Process; McGraw-Hill: New York, NY, USA, 1980. [Google Scholar]
  22. Saaty, R.W. The analytic hierarchy process-what it is and how it is used. Math Model 1987, 9, 161–176. [Google Scholar] [CrossRef]
  23. Etherington, T.R. Least-Cost Modelling and Landscape Ecology: Concepts, Applications, and Opportunities. Curr. Landsc. Ecol. Rep. 2016, 1, 40–53. [Google Scholar] [CrossRef]
  24. Etherington, A.; Penelope Holland, T.R.E. Least-cost path length versus accumulated-cost as connectivity measures. Landsc. Ecol. 2013, 28, 1223–1229. [Google Scholar] [CrossRef]
  25. Tang, Q.; Dou, W. An Effective Method for Computing the Least-Cost Path Using a Multi-Resolution Raster Cost Surface Model. ISPRS Int. J. Geo-Inf. 2023, 12, 287. [Google Scholar] [CrossRef]
  26. ArcGIS Pro Software. Available online: https://pro.arcgis.com/en/pro-app/latest/tool-reference/spatial-analyst/creating-the-least-cost-path.htm (accessed on 8 November 2023).
  27. Directive 2007/2/EC of the European Parliament and of the Council of 14 March 2007 Establishing an Infrastructure for Spatial Information in the European Community (INSPIRE) 14 March 2007. Available online: https://knowledge-base.inspire.ec.europa.eu/index_en (accessed on 8 November 2023).
  28. Sanchez-Garcia, L.; Persson, U.; Averfalk, H. Understanding effective width for district heating. Energy 2023, 277, 127427. [Google Scholar] [CrossRef]
Figure 1. Map of the selected study area.
Applsci 14 00763 g001
Figure 2. Data material used for the methodology (test area).
Applsci 14 00763 g002
Figure 3. Data material used for the methodology (case study area—community of Siechnice).
Applsci 14 00763 g003
Figure 4. Scheme of the “standardized-replication” method of district heating planning.
Applsci 14 00763 g004
Figure 5. Workflow of the LCPA method generated using ArcGIS Pro Model Builder.
Applsci 14 00763 g005
Figure 6. Workflow of the Closest Facility method generated using ArcGIS Pro Model Builder.
Applsci 14 00763 g006
Figure 7. Selection of network branches for the test area.
Applsci 14 00763 g007
Figure 8. Simplified network for the test area: Version 1.
Applsci 14 00763 g008
Figure 9. Final network for the test area: Version 2.
Applsci 14 00763 g009
Figure 10. Final heating network generated for the test area.
Applsci 14 00763 g010
Figure 11. Cost Distance Surface (CDS) for the selected study area.
Applsci 14 00763 g011
Figure 12. End heating network for the study area, generated using the LCPA method.
Applsci 14 00763 g012
Figure 13. A snapshot of a weak point of the LCPA method.
Applsci 14 00763 g013
Figure 14. Final heating network for the study area, generated using the Closest Facility method.
Applsci 14 00763 g014
Figure 15. DH network in the study area as part of Wroclaw county.
Applsci 14 00763 g015
Table 1. General information concerning the study area.
DataCase Study Area
Area15.65 km2
Population7410 (2017)
Table 2. General criteria considered in the development of the methodology.
CriteriaTest Area + Case Study Area
Data inputStreet network
Building footprints
Location heat source
Heat flowDistribution along the reliable street network
Direction from the starting point (heat source) to the endpoints (buildings as heat consumers)
Disclaimer/Publisher’s Note: The statements, opinions and data contained in all publications are solely those of the individual author(s) and contributor(s) and not of MDPI and/or the editor(s). MDPI and/or the editor(s) disclaim responsibility for any injury to people or property resulting from any ideas, methods, instructions or products referred to in the content.

