Abstract
The profound impact of deep learning technology is poised to revolutionize various industries, marking the fourth industrial revolution. Thus, we combined efficiency and productivity research (data envelopment analysis, DEA), artificial intelligence and deep learning (artificial neural networks, ANN), a system integrating DEA and ANNs, and simultaneous longitudinal research (time series) to determine comprehensive research trends and create relevant applications. We addressed mega-sports events’ performance assessment systems that predict the efficiency of nations participating in the Asian Games from 1990 to 2023 and analyzed the outcomes, applying them to practical issues of national sports policies and development. Performance assessment systems to diagnose, plan, monitor, and revise the impact of implementing measures in Asian nations represent a step forward. The PAS findings point out future research recommendations by addressing national sports policies and development issues, transforming the predictions of performance assessment systems in mega-sports events into practical management recommendations. In this way, the system for enhanced predictive analytics developed in the study can rapidly analyze large, medium, and small datasets, reveal insights that humans may overlook, and refine the likelihood of predicting future events with greater precision and accuracy.
1. Introduction
There have been diversified perspectives in the performance of efficiency analysis of nations participating in mega-sports events that lead to certain academic research outcomes (Table 1). For example, proper resource allocation can be utilized to create optimal exercise performance. Sports science applications have become a means for real-time monitoring of sports performance across nations; such applications have practical value for developing and promoting sports, despite needing further integration of various sports science concepts and technologies to build comprehensive performance assessment systems to establish more efficient management. Lozano et al. [1] were the first to utilize data envelopment analysis (DEA) to analyze the efficiency of nations participating in the Olympic Games. Their study chose gross national product (GNP) and population as two input factors and gold, silver, and bronze medals as three output factors. They employed the VRS output-oriented DEA method to calculate the efficiency of nations participating in the 2000 Sydney Olympics, conducting sensitivity analysis to obtain the α = β = 2 ratio; The results have been computed using α = β = 2, i.e., one gold medal is worth at least two silver medals, and one silver at least two bronze medals [1].

Table 1.
The summaries of efficiency analysis of nations participating in mega-sports events.
Data envelopment analysis is a useful tool for measuring the relative efficiencies of participating nations in the Olympic Games [17]. While obtaining a summary of the evolution of efficiency, productivity, and analysis of medals in major sporting events, it was discovered that the characteristics of fixed-sum outputs (FSO) using an input-oriented approach [9] were considered. Another method, introduced implicitly considering FSO, was proposed by Lins et al. [2] through an integrated output model known as zero-sum gains (ZSG). ZSG considers integration as a single output (weighted sum of gold, silver, and bronze medals) and predicts the performance of each decision-making unit (DMU) by assuming that other DMUs adopt specific input reduction strategies, which was the efficiency analysis model used in their study. Subsequently, Bi et al. [20] expanded the ZSG DEA model to include multiple outputs. Bouzidis and Karagiannis [21] argued that the ZSG efficiency scores by Lins et al. [2] could not be used to genuinely compare DMUs. Hence, they proposed an alternative performance indicator consistent with FSO constraints, emphasizing output interdependence, which required a centralized DEA or standard DEA model to explicitly impose FSO constraints, demanding fixed total numbers of different medals. Yang et al. [22] employed the equilibrium efficient frontier (EEF) explicitly considering FSO constraints, but they needed to consider common sets of weights (CSW) while computing the EEF, resulting in efficiency evaluations without a common platform. Subsequently, Yang et al. [23] simultaneously utilized FSO constraints and CSW using the generalized equilibrium efficient frontier (GEEF) to address this issue. Additionally, Li et al. [16] extended GEEF to a two-stage network DEA configuration similar to Li et al. [24]. Lozano and Villa [18] pointed out that the ZSG and GEEF methods did not consider the completeness of output indicators for the Olympic Games or calculate output targets. Instead, these approaches solely calculated efficiency scores and rankings. Thus, they proposed a multi-objective centralized DEA approach capable of fairly computing DMUs compliant with FSO constraints.
Wu et al. [25] investigated the efficiency and quality of banking services, giving more attention to performance analysis. They utilized data envelopment analysis and artificial neural networks (ANNs) to measure the relative efficiency of branches of Canadian banks. The measurement results were compared with conventional DEA outcomes. They found that ANNs could be applied for short-term performance prediction, and both sets of results could be mutually compared to provide suggestions for bank branches to enhance their performance. Emrouznejad and Shale [26] regarded data envelopment analysis as one of the most widely used methods for measuring the efficiency and productivity of decision-making units (DMUs). However, they highlighted the substantial computational resources required for DEA, particularly in datasets with numerous inputs/outputs. The study proposed neural network back-propagation data envelopment analysis to address the challenges posed by large-scale datasets. Additionally, the study argued that the computational demands of neural networks for memory and central processing unit (CPU) time are significantly lower than those of traditional DEA methods, making it a valuable tool for measuring the performance of large datasets. The study further applied back-propagation neural network data envelopment analysis to five large datasets and compared the results with traditional DEA outcomes. Wu [6] introduced a hybrid model using data envelopment analysis, decision trees (DT), and ANNs to explore procurement management and assess supplier performance. Their model consisted of two modules. Module one applied DEA to classify suppliers into effective and ineffective clusters based on efficiency scores. Module two utilized enterprise performance-related data to train the DT and ANN models, applying the well-trained decision models to new suppliers. The study results validated the effectiveness of combining DEA and ANNs in classifying results and predicting accuracy. Hanafizadeh et al. [27] studied the efficiency of mutual funds (MFs), which has been a topic of interest for investors in advanced financial markets. Data envelopment analysis proved to be one of the most widely used methods for measuring DMU efficiency and productivity. However, they highlighted the significant computational resources required for DEA in datasets with numerous inputs/outputs. The study employed neural network back-propagation DEA to measure mutual fund efficiency, which demonstrated that the computational demands for memory and CPU time are much lower than those of traditional DEA. Misiunas et al. [28] proposed deploying DEA to preprocess the data to remove outliers as a healthcare analytic methodology, preserve monotonicity, and reduce the dataset used to train the ANN. A DEA-ANN proved that the accuracy of the ANN can be maintained while the size of the training dataset is significantly reduced. Revuelta et al. [29] combined data envelopment analysis and an ANN model to predict the progression of severe COVID-19 with 96.3% accuracy. The DEA-ANN was validated to classify patient progression through analysis values obtained during hospital checks, outperforming competitive models such as logistic regression (65.5%) and random forests (44.8%).
The sports industry demonstrates immense potential for improving the national economy, guiding societal consumption, and adjusting industrial structures. Utilizing ANNs in predictive models within the sports culture industry has been validated for both efficiency and accuracy in growth forecasting within the current landscape [30]. Therefore, from a predictive perspective, integrating methods such as artificial intelligence (AI), deep learning, and ANNs has become a distinct research direction for predictive analysis and trend tracking. Some related directions and recommendations include those of Memmert and Perl [31], who explored the use of AI in creative analysis for football and ice hockey games and advocated for the construction of training explanatory models based on the super compensation theory, thereby demonstrating the broader potential application of ANNs in future studies. Loeffelholz et al. [32] applied ANNs to predict NBA game outcomes, achieving a 77.43% probability accuracy for predicting the winning team and surpassing expert predictions at 68.67%, thus validating the feasibility of the model. Vagenas and Vlachokyriakou [33] studied factors influencing Olympic Games medals, emphasizing the advantage of ANNs over methods such as the least squares method and weighted least squares method for Olympic Games medal prediction. Lin and Chen [34] discussed matching events in professional baseball leagues, suggesting ANNs as a prospective research topic and direction. Hassan et al. [35] investigated the use of ANNs in handball tactical training and measurement, suggesting the optimal shooting distance to be 0.49 (0.2) meters, validating the applicability of ANNs in assessing handball tactical training and similar team sports. Tümer and Koçer [36] explored the use of ANNs to predict the rankings of volleyball teams, achieving a 98% accurate prediction of the ideal team victory, thus confirming the model’s accuracy. Sudin et al. [37] researched AI’s role in predicting track cycling athletes’ real-time future performance and found that the neural system predicted finishing times with an average error of ±13.6% compared to actual times, thus validating the feasibility of the prediction system. Barron et al. [38] explored using ANNs to identify and analyze talent in professional football players, confirming that ANNs are effective and influential tools for identifying and predicting talent among football athletes and that they warrant widespread application. Karg et al. [39] discussed the consumption decisions of audiences holding professional sports season tickets, suggesting that tools such as ANNs could enhance regression analysis-based results. Papic et al. [40] studied improvements in swimmers’ speed and motion analysis, concluding that ANNs can effectively be used for sports image and biomechanical analysis, as well as real-time feedback for sports performance applications. Zhou [41] found that accurate prediction of sporting performance is not only beneficial for athletes but also contributes to guiding sports development. Traditional forecasting methods encompass time series, analogy, regression analysis, and other analytical methods. A proposed sports performance prediction model based on deep learning addresses the current model’s low prediction accuracy. Furthermore, deep learning models have proven more accurate in predicting sports performance than traditional methods, excelling in convergence and robustness.
Loureiro et al. [42] presented a comprehensive performance assessment system (PAS) for diagnosis and decision support about measures to improve water and energy efficiency in collective irrigation systems. Afterward, the PAS was applied to the diagnosis and prioritization of alternatives to enhance the efficiency of a gravity system. A PAS is a crucial component that should be recognized because it requires a comprehensive range of performance management practices to effectively achieve the intended goals [43]. An assessment of future performance was carried out for each probable scenario that considers the impact of internal factors [42]. Tsolas et al. [44] applied the performance measurement framework as a PAS and stated that it may enhance the decision-making process for bank branch efficiency improvement. Avenues for future study included deploying the proposed model into the cloud-based service to assist the decision-makers in making informed or guided decisions. Ren and Liu [45] proposed a systematic and scientific efficiency evaluation, as the PAS concept is a prerequisite for optimizing and improving the level of public sports services in China. In a public sports service system, performance evaluation is an essential component that can improve the quality of public sports service and enhance the efficiency of the public sports service. Lin et al. [19] assessed the efficiency of nations in mega-sports events and recommended establishing a monitoring system for participation results, which would maximize a nation’s athletic performance by formulating participation policies, defining training strategies, and allocating national resources in sports.
This study adopts a “predictive” perspective, integrating machine learning, deep learning, and ANNs. Predictive analysis and trend tracking have emerged as clear research directions, establishing a PAS system predicting the efficiency of Asian nations participating in mega-sports events, which is a significant contribution to the enhancement of future sports science and further research issues in the sports industry. The primary purpose of this study is to explore the efficiency management model and prediction issues of national participation in the Asian Games, employing methods such as efficiency and productivity analysis (DEA), ANNs (AI and deep learning), DEA combined with ANNs, and longitudinal studies (time series), which include analyzing methodologies from AI, management sciences, and decision analysis. We prove the approach involves collecting not only large amounts but also small and medium amounts of data, interfacing with databases, progressing from assessing efficiency and productivity to performing trend analysis, and, ultimately, making predictions for future research suggestions. Furthermore, we point out future research recommendations by addressing national sports policies and development issues, transforming the predictions of performance assessment systems in mega-sports events into practical management recommendations. In this way, the study contributes to the synergy of academia and practical applications, expanding the diversity of research topics.
2. Materials and Methods
2.1. Data Envelopment Analysis—Artificial Neural Networks
Emrouznejad and Shale [26] explored the most popular ANN algorithm, the back-propagation algorithm, which was proposed in the 1980s [46]. A back-propagation algorithm performs learning on a multilayer feed-forward neural network. The multilayer DEA-ANN used for measuring the efficiency of DMUs in Figure 1 has two hidden layers and one output layer, which is referred to as a three-layer neural network. The network is feed-forward in that none of the weights cycle back to an input or output unit of a previous layer. It is fully connected because every unit provides input to each unit in the following forward layer.
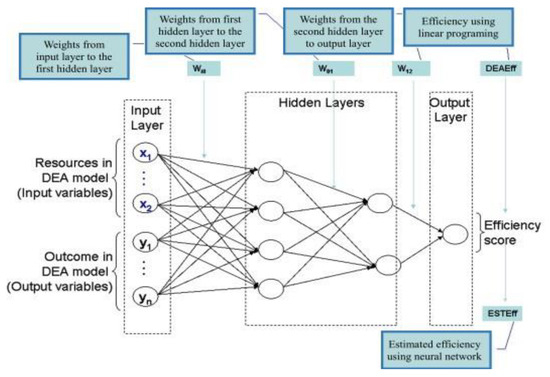
Figure 1.
Back-propagation DEA [26].
Before training can begin in any neural network, the user must decide on the network topology by specifying the number of variables in the input layer, the number of hidden layers (if more than one), the number of variables in each hidden layer, and the number of variables in the output layer. In the DEA-ANN, resources and outcomes used in the corresponding DEA model are variables in the input layer, and the DEA efficiency score is the only variable in the output layer. The DEA-ANN back-propagation algorithm has been used for measuring the efficiency of sets of DMUs, and the results indicate that the DEA-ANN prediction for efficiency score appears to be a reasonable estimate for most DMUs. An analysis of error shows that the larger the dataset is, the more minor the error [26].
2.2. Back-Propagation DEA Algorithm
The back-propagation DEA learns by iteratively processing a raining sample, comparing the network’s prediction of efficiency scores for each sample of DMUs with actual known efficiency scores. For each training sample, the weights are modified to minimize the mean squared error between the network’s prediction and actual efficiency score, as obtained in a conventional DEA model [26]. These modifications are made in the “backward” direction from the output layer, through each hidden layer down to the first hidden layer as a back-propagation, and the algorithm for the efficiency prediction for Asian nations in the study is summarized as follows (Algorithm 1):
| Algorithm 1: Back-propagation DEA algorithm |
 |
2.3. Confusion Matrix
A confusion matrix is a table used in machine learning to evaluate the performance of a classification algorithm. It summarizes the performance of a classification model by displaying the number of true positive, true negative, false positive, and false negative predictions [47,48]. The breakdown of the terms used in a confusion matrix is as follows:
True positive (TP): the number of instances correctly predicted as positive.
True negative (TN): the number of instances correctly predicted as negative.
False positive (FP): the number of instances incorrectly predicted as positive (type I error).
False negative (FN): the number of instances incorrectly predicted as negative (type II error).
The confusion matrix is often represented in tabular form:
| Actual Positive | Actual Negative | |
| Predicted Positive | TP | FP |
| Predicted Negative | FN | TN |
From this matrix, various metrics can be calculated to assess the performance of a classification model, including the following:
Accuracy = (TP + TN)/(TP + TN + FP + FN)
Precision (positive predictive value) = TP/(TP + FP)
Recall (sensitivity or true positive rate) = TP/(TP + FN)
F1 score = 2 × (Precision × Recall)/(Precision + Recall)
These metrics provide a more nuanced understanding of a classification model’s performance, especially in imbalanced class distribution scenarios.
2.4. Data Collection
- (1)
- Data collection, data processing, and coding were conducted using Eviews 7.0 software, and the predictive analysis was carried out for a total of 14 nations or regions participating from the 11th Asian Games in Beijing in 1990 to the 19th Asian Games in Hangzhou in 2023, excluding nations that did not win any medals (Table 2).
- (2)
- The BCC output-oriented model was utilized to explore efficiency analysis (using DEA-Solver Pro 7.0 software) for historical Asian Games from the 11th Asian Games in Beijing in 1990 to the 18th Asian Games in Jakarta in 2018 for participating Asian nations.
- (3)
- A neural network simulation software (NeuralWorks Professional II/PLUS), was used to predict the efficiency of participating nations and their athletic performance at the 19th Asian Games in Hangzhou in 2023.
Table 2.
Asian Games participating nations from 1951 to 2023.
Table 2.
Asian Games participating nations from 1951 to 2023.
| No. | Nation | Participating Years |
|---|---|---|
| 1 | Afghanistan | 51, 54, 58, 62, 66, 74, 82, 90, 94, 02, 06, 10, 14, 18, 23 |
| 2 | Bahrain | 74, 78, 82, 86, 90, 94, 98, 02, 06, 10, 14, 18, 23 |
| 3 | Bangladesh | 78, 82, 86, 90, 94, 98, 02, 06, 10, 14, 18, 23 |
| 4 | Bhutan | 86, 90, 94, 98, 02, 06, 10, 14, 18, 23 |
| 5 | Brunei | 90, 94, 98, 02, 06, 10, 14, 18, 23 |
| 6 | Cambodia | 54, 58, 62, 70, 74, 94, 98, 02, 06, 10, 14, 18, 23 |
| 7 | China | 74, 78, 82, 86, 90, 94, 98, 02, 06, 10, 14, 18, 23 |
| 8 | Chinese Taipei | 54, 58, 66, 70, 90, 94, 98, 02, 06, 10, 14, 18, 23 |
| 9 | Hong Kong | 54, 58, 62, 66, 70, 74, 78, 82, 86, 90, 94, 98, 02, 06, 10, 14, 18, 23 |
| 10 | India | 51, 54, 58, 62, 66, 70, 74, 78, 82, 86, 90, 94, 98, 02, 06, 10, 14, 18, 23 |
| 11 | Indonesia | 51, 54, 58, 62, 66, 70, 74, 78, 82, 86, 90, 94, 98, 02, 06, 10, 14, 18 |
| 12 | Iran | 51,58,66, 70, 74, 82, 86, 90, 94, 98, 02, 06, 10, 14, 18, 23 |
| 13 | Iraq | 74, 78, 82, 86, 06, 10, 14, 18, 23 |
| 14 | Israel | 54, 58, 66, 70, 74 |
| 15 | Japan | 51, 54, 58, 62, 66, 70, 74, 78, 82, 86, 90, 94, 98, 02, 06, 10, 14, 18, 23 |
| 16 | Jordan | 86, 94, 98, 02, 06, 10, 14, 18, 23 |
| 17 | Kazakhstan | 94, 98, 02, 06, 10, 14, 18, 23 |
| 18 | Korea | 18, 23 |
| 19 | Kuwait | 74, 78, 82, 86, 90, 94, 98, 02, 06, 10, 14, 18, 23 |
| 20 | Kyrgyzstan | 94, 98, 02, 06, 10, 14, 18, 23 |
| 21 | Laos | 74, 82, 90, 94, 98, 02, 06, 10, 14, 18, 23 |
| 22 | Lebanon | 78, 82, 86, 90, 94, 98, 02, 06, 10, 14, 18, 23 |
| 23 | Macau | 90, 94, 98, 02, 06, 10, 14, 18, 23 |
| 24 | Malaysia | 54, 58, 62, 66, 70, 74, 78, 82, 86, 90, 94, 98, 02, 06, 10, 14, 18, 23 |
| 25 | Maldives | 82, 86, 90, 94, 98, 02, 06, 10, 14, 18, 23 |
| 26 | Mongolia | 74, 78, 8290, 94, 98, 02, 06, 10, 14, 18, 23 |
| 27 | Myanmar | 51, 54, 58, 62, 66, 70, 74, 78, 8290, 94, 98, 02, 06, 10, 14, 18, 23 |
| 28 | Nepal | 51,58,66, 70, 74, 78, 82, 86, 90, 94, 98, 02, 06, 10, 14, 18, 23 |
| 29 | North Borneo | 54, 58, 62 |
| 30 | North Korea | 74, 78, 82,90,98, 02, 06, 10, 14, 18, 23 |
| 31 | North Yemen | 82, 86 |
| 32 | Oman | 82, 86, 90, 94, 98, 02, 06, 10, 14, 18, 23 |
| 33 | Pakistan | 54, 58, 62, 66, 70, 74, 78, 82, 86, 90, 94, 98, 02, 06, 10, 14, 18, 23 |
| 34 | Palestine | 90, 94, 98, 02, 06, 10, 14, 18, 23 |
| 35 | Philippines | 51, 54, 58, 62, 66, 70, 74, 78, 82, 86, 90, 94, 98, 02, 06, 10, 14, 18, 23 |
| 36 | Qatar | 78, 82, 86, 90, 94, 98, 02, 06, 10, 14, 18, 23 |
| 37 | Sarawak | 62 |
| 38 | Saudi Arabia | 78, 82, 86, 90, 942, 06, 10, 14, 18, 23 |
| 39 | Singapore | 51, 54, 58, 62, 66, 70, 74, 78, 82, 86, 90, 94, 98, 02, 06, 10, 14, 18, 23 |
| 40 | South Korea | 54, 58, 62, 66, 70, 74, 78, 82, 86, 90, 94, 98, 02, 06, 10, 14, 18, 23 |
| 41 | South Yemen | 82 |
| 42 | Sri Lanka | 51, 54, 58, 62, 66, 70, 74, 78, 82, 86, 90, 94, 98, 02, 06, 10, 14, 18, 23 |
| 43 | Syria | 78, 82, 90, 94, 98, 02, 06, 10, 14, 18, 23 |
| 44 | Tajikistan | 94, 98, 02, 06, 10, 14, 18, 23 |
| 45 | Thailand | 51, 54, 58, 62, 66, 70, 74, 78, 82, 86, 90, 94, 98, 02, 06, 10, 14, 18, 23 |
| 46 | Timor-Leste | 02, 06, 10, 14, 18, 23 |
| 47 | Turkmenistan | 94, 98, 02, 06, 10, 14, 18, 23 |
| 48 | United Arab Emirates | 78, 82, 86, 90, 94, 98, 02, 06, 10, 14, 18, 23 |
| 49 | Uzbekistan | 94, 98, 02, 06, 10, 14, 18, 23 |
| 50 | Vietnam | 54, 58, 62, 66, 70, 74, 82, 90, 94, 98, 02, 06, 10, 14, 18, 23 |
| 51 | Yemen | 90, 94, 98, 02, 06, 10, 14, 18, 23 |
51 = 1951; 03 = 2023; Nations (with Italic) = nations or regions participating from the 1990 Asian Games in Beijing to the 2023 Asian Games in Hangzhou.
2.5. Operational Definitions
- (1)
- Population: The number of people in a nation or region, indicating demographic strength. The larger the population is, the higher the proportion of talented individuals in various sports, leading to victory. Conversely, when two nations achieve the same number of medals, the one with a smaller population is likely more efficient [2].
- (2)
- Gross domestic product (GDP): All economic activities within a nation, regardless of who owns the production assets. For instance, if a foreign company establishes a subsidiary in the United States and even repatriates profits to its parent company in another nation, those profits are still part of the United States GDP [3]. A higher GDP signifies more substantial national economic power, indicating that wealthier nations can provide better public sports facilities, and sports professionals are more likely to receive social support [2,47].
- (3)
- Athletes: Athletes representing various Asian nations participate in the Asian Games.
- (4)
- Zero-sum game (ZSG): Lins et al. [2] proposed that the traditional ranking based on gold, silver, and bronze medals constitutes a lexicographic multicriteria approach, leading to the overvaluation of gold medals. This results in nations that have not won gold but have silver and bronze being significantly ranked lower, creating a situation in which the overall sporting prowess of a nation is not accurately represented. The original data envelopment analysis model allows decision units to choose the weights of various output categories freely [49]. In this study, assigning higher weights to silver or bronze medals than gold could distort the findings. To avoid this scenario, Lins et al. [2] integrated output to create a single output to reduce bias and achieve a more accurate assessment, serving as the calculation model for the relative efficiency of the integrated output. Through mathematical derivation, the calculation formula is as follows: single output = 0.5814 × Gold+ 0.2437 × Silver+ 0.1749 × Bronze.
- (5)
- Efficiency: This study considers the input and output items of Asian nations related to the Asian Games, measuring the efficiency values obtained by each nation.
3. Results
Fifty-one nations participated in the Asian Games from 1951 to 2023, excluding nations that were absent from any of the Asian Games or did not win any medals, and a total of fourteen Asian nations or regions participated from the 11th Asian Games in Beijing in 1990 to the 19th Asian Games in Hangzhou in 2023.
Due to space constraints, we demonstrate samples for inputs and outputs of Chinese Taipei from the 1990 to the 2022 Asian Games. This study’s DEA-ANN model set five input layers (GDP, population, athletes, ZSG, efficiency) and one output layer as medals won (Table 3).
Table 3.
Example for inputs and outputs of Chinese Taipei from the 1990 to 2022 Asian Games.
The descriptive statistics of inputs and outputs for 14 Asian nations in the 2023 Asian Games are presented in this study. The data analysis covers nine Asian Games, totaling 126 data points. Table 4 displays data for five input layers, including maximum, minimum, mean, and standard deviation.
Table 4.
Descriptive statistics of 14 Asian nations’ input and output in the 2023 Asian Games.
The data mentioned above were incorporated into the DEA-ANN model in this study. We present the medals earned, predict medal outcomes, and present accuracy metrics for gold, silver, bronze, and total medals across 14 nations in the 2023 Asian Games. Following conventional medal rankings, the quantity of gold medals holds paramount significance. The results indicate in Table 5 that China, India, Chinese Taipei, the Philippines, and Singapore, among the other nine nations (Japan, South Korea, Iran, Thailand, Hong Kong, Malaysia, Qatar, Mongolia, and Macau), exceeded the predicted performance in that the actual number of gold medals is greater than that of silver medals, which is more significant than bronze medals, leading to an upward trend in their participation efficiency. Conversely, the efficiency of the remaining nine nations exhibited a declining trend. Overall, the accuracy rates for gold, silver, bronze, and total medals were 0.900, 0.880, 0.987, and 0.938, respectively. AI predictions should align with the trend, which indicates the ideal performance for a nation to achieve. Furthermore, correctly and effectively leveraging national resources for mega-sports events is an objective for which each Asian nation must strive.
Table 5.
Medals won, medal prediction, and accuracy of 14 nations in the 2023 Asian Games.
The confusion matrix, which combines predicted versus actual class examples, is central to the algorithm performance evaluation. The Asian nations’ prediction results must fit the decision threshold to reach the confusion matrix. To determine whether the predictions for gold, silver, bronze, and total medals won are ideal, we can evaluate them based on different needs and contexts [47,48]. The following are some possible considerations (Figure 2):
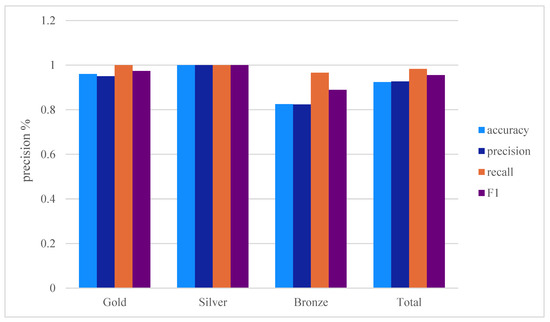
Figure 2.
The 2023 Asian game medal prediction results of confusion matrix.
- (1)
- Accuracy: The prediction accuracy for gold, silver, bronze, and total medals won ranges between 0.825 and 1.000, with the lowest accuracy for bronze medals at 0.825. Higher accuracy is generally considered ideal, depending on the specific application context.
- (2)
- Precision: Precision indicates the accuracy of optimistic predictions. Prediction precision for gold, silver, bronze, and overall medals ranges between 0.824 and 1.000, varying depending on the type of medal. Higher precision is crucial to ensure prediction accuracy, while low precision might lead to misjudgments.
- (3)
- Recall: Recall represents the proportion of correct predictions among positives. Prediction recall for gold, silver, bronze, and overall medals ranges from 0.966 to 1.000. Higher recall is essential to capture all genuine medals, while low recall might result in missing some actual medals.
- (4)
- F1 score: The F1 score is the harmonic mean of precision and recall, offering a combined assessment of these two metrics. The F1 score ranges between 0.889 and 1.000, contingent on the specific types of medals. Higher F1 scores are generally considered ideal because they consider precision and recall.
Based on the provided data, the prediction results for gold, silver, bronze, and overall medals exhibit varying degrees of ideality.
As Nxumalo et al. [43] mentioned, a performance assessment system provides a comprehensive range of Asian game performance management to effectively achieve the intended goals of Asian nations in this study (Figure 3), excluding the steps of starting PAS and stopping PAS. There are seven steps, and the details are described as follows:
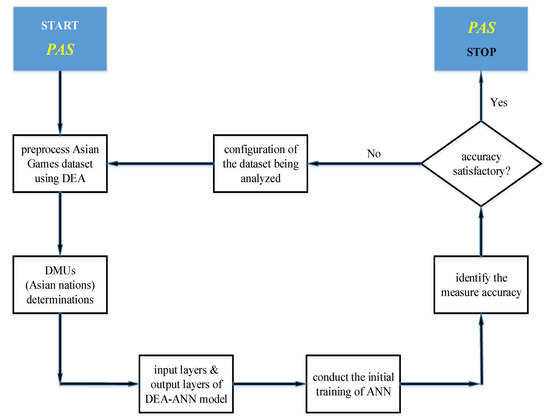
Figure 3.
The Asian Games performance assessment system.
- (1)
- Preprocess the Asian Games dataset using DEA: set inputs and outputs and evaluate Asian nations’ efficiency from the 1990 to the 2022 Asian Games.
- (2)
- Determine the DMUs of Asian nations: fifty-one nations participated from the 1951 to 2023 Asian Games, excluding those that were absent from any of the 1990 to 2023 Asian Games or did not win any medals, and a total of fourteen Asian nations were involved.
- (3)
- Set the DEA-ANN model’s input and output layers: five input layers (GDP, population, athletes, ZSG, efficiency) and one output layer as medals won were set in this model.
- (4)
- Conduct the initial training of ANN: showcase the predictions of the medals earned for gold, silver, bronze, and total medals across 14 nations in the 2023 Asian Games.
- (5)
- Identify the measurement accuracy: determine that the confusion matrix reveals and fits the accuracy, precision, recall, and F1 score.
- (6)
- Assess whether the accuracy is satisfactory: if predictions fit, verify whether actual medals surpass predictions and PAS stops; if predictions do not fit, go to dataset configuration.
- (7)
- Perform configuration of the dataset being analyzed: start the previous six steps over again.
Moreover, creating a system performance assessment for diagnosis, planning, monitoring, and revising the impact of implementing measures in the Asian nations constitutes a step forward. These approaches have rarely been applied to the different stages of the planning process or types of collective systems for comparative analysis [42].
4. Discussion
Contemporary predictive analytics leverages machine learning, deep learning, and artificial neural network technologies to enhance predictions. These enhanced predictive analytics can rapidly analyze large volumes of data and reveal insights that humans may overlook, and such insights may increase the likelihood of predicting future events with greater precision and accuracy. Integrating data envelopment analysis (DEA) and artificial neural networks (ANN) serves three primary purposes. (1) The optimization process established by the DEA can identify the analytical performance of each Asian nation concerning every relevant variable under consideration. (2) The corresponding slack values are used to design indicators that highlight the relative performance of each Asian nation while simultaneously considering multiple outputs. Standard ANN models are often constrained by having a single output variable distributed across different categories, although slightly more complex combination environments can be defined. (3) The obtained variables can be retroactively applied to and utilized in ANN prediction results.
Research trends and applications encompass the topics of efficiency and productivity (DEA), artificial neural networks (AI and deep learning), the integration of DEA and an ANN, and simultaneous longitudinal research (time series) and form a comprehensive landscape of the contemporary field. We explore the development focus of big data, including big data in sports, and discuss research and applications in the context of Asian nations participating in the Asian Games. In today’s context, big data serves as a tool for data processing and shapes a research trend and direction. This evolution enables data analysis to transition from merely understanding history to predicting the future, creating a new context and management paradigm.
AI is more than a trend, and prediction is not its only purpose; in the comparative analysis of the Asian Games, the objective of Asian nations is to grasp advantages for strategic positioning proactively. China, India, Chinese Taipei, the Philippines, and Singapore exceeded the predicted performance, leading to an upward trend in Asian game participation efficiency. China, as the host nation, excelled in creating outstanding achievements; India achieved a historic milestone with a total of 107 medals; Chinese Taipei matched its best-ever performance in terms of gold medals; the Philippines maintained its best performance since the 1990 Asian Games with four gold medals; and Singapore exceeded expectations in both gold and silver medal counts. On the other hand, the actual medal counts for the remaining nine nations were lower than the predicted values, which could be attributed to the allocation of resources at different levels of mega-sports events, including the Olympic Games. Additionally, sports achievements did not reach the desired level, possibly influenced by a lack of economic and political resources to drive national sports development. Consequently, the development of national sports still requires improvement.
A higher GDP signifies more substantial national economic power, indicating that wealthier nations can provide better public sports facilities, and in such nations, sports professionals are more likely to receive social support [2,3]. Noland and Stahler [50] investigated the uniqueness of Asian nations in the Olympic Games and reached four main conclusions. Their key observations were the better performance of Northeast Asian nations, the superior performance of female athletes over males in Asia, the significant impact of state support (including the influence of communism and the use of performance-enhancing drugs on competition), and the influence of economic power (noting that comparatively poorer Asian nations tend to lag in athletic performance). Vagenas and Vlachokyriakou [33] studied and forecasted the performance of 75 nations that won medals in the 2004 Athens Olympic Games. They revealed that winning Olympic medals depends on the combined potential of population, wealth, growth rate, unemployment, former hosting experience, and social-sport expenditures. The size of the team was also identified as a crucial influencing factor. More populated and wealthier nations tend to produce larger Olympic teams, which leads to winning more medals.
Hematinezhad et al. [51] utilized an ANN to predict the success of nations in the Asian Games by incorporating macropolitical, economic, social, and cultural variables. The study, spanning the years 1970 to 2006, constructed a model using variables such as urban population, education expenditures, age structure, GDP real growth rate, GDP per capita, unemployment rate, population, inflation average, current account balance, life expectancy at birth, and merchandise trade. Their model was then tested with 2010 data to predict the number of gold medals nations would win. The correlation coefficient between the predicted and actual rankings was 86%. Success in Asian sports has become increasingly crucial for numerous nations. Despite the growing financial investments in sports by many nations to compete internationally, no clear evidence indicates how sports variables influence international sports success.
Artificial neural network applications in the sports industry and sports management have garnered significant attention. Neural network technology has been widely used in industrial and commercial applications, broadly categorized into pattern classification, prediction and financial analysis, control, and optimization [52]. Additionally, AI technology is extensively employed in the sports industry, focusing on three major industry segments: (1) Application in the North American regional sports industry, including computer vision, emerging gaming equipment, and connected devices. (2) Utilizing AI to realize benefits in improving sports planning, enhancing sports information, meeting fan/player demands, and increasing sports accuracy. (3) Effectively enhancing goals through AI, encompassing improved sports regulations, periodic AI data reviews, detection and mitigation of fraud cases, increased transparency and accountability, event-specific training, enhanced athlete performance, AI-assisted coaching, automatic video highlights, optimized coaching guidance, computer-assisted referee vision, and intelligent ticketing [53]. Furthermore, the sports industry demonstrates significant potential in improving national economies, guiding social consumption patterns, and reshaping industry structures. Using neural network-based predictive models in the sports industry has been validated for predicting growth with demonstrated efficiency and accuracy [30].
Asian nations must first select a performance assessment system before investing in mega-sports events to integrate PAS with environmental, social, and governance (ESG). Thus, it is essential to identify issues to evaluate a nation’s sports promotion comprehensively and follow this with strategic planning, goal setting, progress monitoring, and proactive improvement. The recommended steps are: (1) Form an understanding of ESG: Nations need a clear understanding of the definition, values, and importance of the ESG Sustainable Development Goals. They should confirm the overall planning and development of ESG for the nation. (2) Assess the current situation: Nations should evaluate the current state of the national sports environment, considering environmental, social, and governance aspects, which involves understanding strengths, weaknesses, and challenges. (3) Set goals and indicators: Nations should establish clear, measurable ESG goals, considering recommendations from impartial and objective entities (such as third-party organizations). They should also develop concrete plans and strategies, measurable indicators, and mechanisms for tracking and evaluation. (4) Implement the plan: Nations need to actively implement the plan by carrying out specific measures and actions in environmental, social, and governance aspects that align with core national policies. (5) Monitor and report: Nations should regularly monitor and evaluate their ESG performance. Additionally, they should periodically report their progress and implementation outcomes to impartial and objective organizations.
5. Conclusions
The significant contribution of this study is to establish a PAS system predicting the efficiency of Asian nations participating in mega-sports events. Analyzing the results aligns with the practical issues of national sports policies and the operation and development of the sports industry. This approach provides insights and development possibilities for national sports policy formulation as a point of reference. Based on the results of the Asian nations’ PAS with the ESG concept of mega-sports events in the study, to establish more appropriate practical applications for national sports policy, experts in sports management should identify the meso-level factors of elite sports policies leading to success in international competitions, such as “financial support”, “governance”, “participation”, “talent identification”, “athletic career support”, “training facilities”, “coaching development”, and “scientific research” [54]. Based on national differences and the eight factors above, Asian nations formulate distinct sports policies to enhance efficiency in mega-sports events. Particularly noteworthy is the remarkable success of their female athletes, considering Asia’s initial failure to include women athletes and the relatively low status of women in many Asian countries [19,50]. Additionally, the positive influence of host nations [4,12,17,19] and the distinctive development of featured and dominant sports [19] are equally crucial factors that Asian nations cannot overlook. The literature suggests that integrating the performance and advancement of female athletes, the influence of host nations, and the development of featured sports can contribute to formulating specialized and professional sports policies, ultimately fostering the expansion of national sports development and effectiveness.
From the practical applications, Asian nations formulate different sports policies based on their performance in mega-sports events. Taking Chinese Taipei as an example, based on the prediction results of the performance assessment system (PAS) and considering the upgrade performance and upward trends of Chinese Taipei in this study, the Chinese Taipei Sports Administration has initiated the “Golden Plan” for the 2028 Olympic Games to assistant elite athletes and teams to pursue better performance and, in addition, advance entire performance in Asian Games.
The ANN-based methods have been applied successfully in many fields and are usually effective for large amounts of data. The DEA-ANN back-propagation algorithm has been used to measure the efficiency of a set of DMUs, and the result indicates that the DEA-ANN prediction for efficiency score appears to be a reasonable estimate for most DMUs [26]. An analysis of error shows that the larger the dataset, the smaller the error. Several computational intelligence techniques have been proposed to overcome learning limitations from small- and medium-sized datasets [55,56]. We approved the competitive fluctuations in the efficiency prediction of Asian nations’ mega-sports events, in which small- and medium-sized datasets are performing only as receiving and adopting regulatory bodies. The limitation of the study is that the conceptual framework and analysis considered a suitable quantification condition where other factors such as GDP, population, team size (athletes), medal weights calculation (ZSG), efficiency, and medals won are supportive. However, qualitative data and indicators were not considered in this study. Future research suggestions include investigating techniques that can improve the performance of artificial neural networks as proposed in retraining neural networks or deep learning frameworks applied to dynamically changing conditions.
Following the previous studies, we aim to establish a linkage between the DEA method and artificial neural networks, and we propose an alternative way that combines DEA with ANN algorithms to predict the DEA efficiency of new DMUs to an Asian Games performance assessment system. A substantial body of literature validates the ideal outcomes of using DEA for performance assessment in mega-sports events. However, this study is the first publication to integrate DEA and ANNs, offering possibilities and research directions for the theoretical development of DEA-ANN models in the performance management of mega-sports events. We present an advanced performance assessment system for sports science by combining ANNs with performance analysis. This system addresses advanced performance management issues and provides a positive point of reference for the decision-making process to improve national efficiency in the context of nations participating in mega-sports events.
Author Contributions
Conceptualization, W.-B.L., C.-C.Y. and H.-T.P.; methodology, W.-B.L.; software, W.-B.L. and C.-C.Y.; data curation, W.-B.L. and C.-C.Y.; writing—original draft preparation, W.-B.L. and C.-C.Y.; writing—review and editing, C.-C.Y. and H.-T.P. All authors have read and agreed to the published version of the manuscript.
Funding
This research was funded by the Ministry of Science and Technology of Taiwan, grant number MOST 111-2410-H-119-003-; NSTC 112-2410-H-119-005-MY2.
Institutional Review Board Statement
Not applicable.
Informed Consent Statement
Not applicable.
Data Availability Statement
The raw data supporting the conclusions of this article can be made available by the authors without undue reservation.
Conflicts of Interest
The authors declare no conflicts of interest.
References
- Lozano, S.; Villa, G.; Guerrero, F.; Cortés, P. Measuring the performance of nations at the Summer Olympics using data envelopment analysis. J. Oper. Res. Soc. 2002, 53, 501–511. [Google Scholar] [CrossRef]
- Lins, M.P.E.; Gomes, E.G.; de Mello, J.C.C.B.S.; de Mello, A.J.R.S. Olympic ranking based on a zero sum gains DEA model. Eur. J. Oper. Res. 2003, 148, 312–322. [Google Scholar] [CrossRef]
- Churilov, L.; Flitman, A. Towards fair ranking of Olympics achievements: The case of Sydney 2000. Comput. Oper. Res. 2006, 33, 2057–2082. [Google Scholar] [CrossRef]
- Lin, W.-B. A study of Chinese Taipei’s performance evaluation since its return to the Asian Games. Sports Exerc. Res. 2007, 9, 29–40. [Google Scholar] [CrossRef]
- Li, Y.; Liang, L.; Chen, Y.; Morita, H. Models for measuring and benchmarking Olympics achievements. Omega 2008, 36, 933–940. [Google Scholar] [CrossRef]
- Wu, D. Supplier selection: A hybrid model using DEA, decision tree and neural network. Expert Syst. Appl. 2009, 36, 9105–9112. [Google Scholar] [CrossRef]
- Zhang, D.; Li, X.; Meng, W.; Liu, W. Measuring the performance of nations at the Olympic Games using DEA models with different preferences. J. Oper. Res. Soc. 2009, 60, 983–990. [Google Scholar] [CrossRef]
- Wu, J.; Zhou, Z.; Liang, L. Measuring the performance of nations at Beijing Summer Olympics using integer-valued DEA model. J. Sports Econ. 2010, 11, 549–566. [Google Scholar] [CrossRef]
- Mello, J.C.C.B.S.D.; Angulo-Meza, L.; Lacerda, F.G. A DEA model with a non discritionary variablefor olympic evaluation. Pesqui. Oper. 2012, 32, 21–30. [Google Scholar] [CrossRef][Green Version]
- Azizi, H.; Wang, Y.-M. Improved DEA models for measuring interval efficiencies of decision-making units. Measurement 2013, 46, 1325–1332. [Google Scholar] [CrossRef]
- Lei, X.; Li, Y.; Xie, Q.; Liang, L. Measuring Olympics achievements based on a parallel DEA approach. Ann. Oper. Res. 2015, 226, 379–396. [Google Scholar] [CrossRef]
- Lin, W.-B. An application of the metafrontier and technical gap ratio in sport. Phys. Educ. J. 2015, 48, 383–398. [Google Scholar] [CrossRef]
- Calzada-Infante, L.; Lozano, S. Analysing Olympic Games through dominance networks. Phys. A Stat. Mech. Appl. 2016, 462, 1215–1230. [Google Scholar] [CrossRef]
- Jablonsky, J. Ranking of countries in sporting events using two-stage data envelopment analysis models: A case of Summer Olympic Games 2016. Cent. Eur. J. Oper. Res. 2018, 26, 951–966. [Google Scholar] [CrossRef]
- Flegl, M.; Andrade, L.A. Measuring countries’ performance at the Summer Olympic Games in Rio 2016. Opsearch 2018, 55, 823–846. [Google Scholar] [CrossRef]
- Li, F.; Hopkins, W.G.; Lipinska, P. Population, economic and geographic predictors of nations’ medal tallies at the Pyeongchang and Tokyo Olympics and Paralympics. Front. Sports Act. Living 2022, 4, 931817. [Google Scholar] [CrossRef]
- Sekitani, K.; Zhao, Y. Performance benchmarking of achievements in the Olympics: An application of Data Envelopment Analysis with restricted multipliers. Eur. J. Oper. Res. 2021, 294, 1202–1212. [Google Scholar] [CrossRef]
- Lozano, S.; Villa, G. Multiobjective centralized DEA approach to Tokyo 2020 Olympic Games. Ann. Oper. Res. 2023, 322, 879–919. [Google Scholar] [CrossRef]
- Lin, W.-B.; Lin, S.-H.; Huang, H.-F.; Chen, M.-Y. Asian nations’ metafrontier analysis and strategic performance management in mega sports events. Phys. Educ. J. 2023, 56, 35–60. [Google Scholar] [CrossRef]
- Bi, G.; Feng, C.; Ding, J.; Liang, L.; Chu, F. The linear formulation of the ZSG-DEA models with different production technologies. J. Oper. Res. Soc. 2014, 65, 1202–1211. [Google Scholar] [CrossRef]
- Bouzidis, T.; Karagiannis, G. An alternative ranking of DMUs performance for the ZSG-DEA model. Socio-Econ. Plan. Sci. 2022, 81, 101179. [Google Scholar] [CrossRef]
- Yang, F.; Wu, D.D.; Liang, L.; O’Neill, L. Competition strategy and efficiency evaluation for decision making units with fixed-sum outputs. Eur. J. Oper. Res. 2011, 212, 560–569. [Google Scholar] [CrossRef]
- Yang, M.; Li, Y.J.; Liang, L. A generalized equilibrium efficient frontier data envelopment analysis approach for evaluating DMUs with fixed-sum outputs. Eur. J. Oper. Res. 2015, 246, 209–217. [Google Scholar] [CrossRef]
- Li, Y.; Lei, X.; Dai, Q.; Liang, L. Performance evaluation of participating nations at the 2012 London Summer Olympics by a two-stage data envelopment analysis. Eur. J. Oper. Res. 2015, 243, 964–973. [Google Scholar] [CrossRef]
- Wu, D.; Yang, Z.; Liang, L. Using DEA-neural network approach to evaluate branch efficiency of a large Canadian bank. Expert Syst. Appl. 2006, 31, 108–115. [Google Scholar] [CrossRef]
- Emrouznejad, A.; Shale, E. A combined neural network and DEA for measuring efficiency of large scale datasets. Comput. Ind. Eng. 2009, 56, 249–254. [Google Scholar] [CrossRef]
- Hanafizadeh, P.; Khedmatgozar, H.R.; Emrouznejad, A.; Derakhshan, M. Neural network DEA for measuring the efficiency of mutual funds. Int. J. Appl. Decis. Sci. 2014, 7, 255–269. [Google Scholar] [CrossRef]
- Misiunas, N.; Oztekin, A.; Chen, Y.; Chandra, K. DEANN: A healthcare analytic methodology of data envelopment analysis and artificial neural networks for the prediction of organ recipient functional status. Omega 2016, 58, 46–54. [Google Scholar] [CrossRef]
- Revuelta, I.; Santos-Arteaga, F.J.; Montagud-Marrahi, E.; Ventura-Aguiar, P.; Di Caprio, D.; Cofan, F.; Cucchiari, D.; Torregrosa, V.; Piñeiro, G.J.; Esforzado, N.; et al. A hybrid data envelopment analysis-artificial neural network prediction model for COVID-19 severity in transplant recipients. Artif. Intell. Rev. 2021, 54, 4653–4684. [Google Scholar] [CrossRef]
- Yang, K. The construction of sports culture industry growth forecast model based on big data. Pers. Ubiquitous Comput. 2020, 24, 5–17. [Google Scholar] [CrossRef]
- Memmert, D.; Perl, J. Game creativity analysis using neural networks. J. Sports Sci. 2009, 27, 139–149. [Google Scholar] [CrossRef]
- Loeffelholz, B.; Bednar, E.; Bauer, K.W. Predicting NBA games using neural networks. J. Quant. Anal. Sports 2009, 5, 1–17. [Google Scholar] [CrossRef]
- Vagenas, G.; Vlachokyriakou, E. Olympic medals and demo-economic factors: Novel predictors, the ex-host effect, the exact role of team size, and the “population-GDP” model revisited. Sport Manag. Rev. 2012, 15, 211–217. [Google Scholar] [CrossRef]
- Lin, W.-B.; Chen, M.-Y. A study of efficiency monitoring systems for match-fixing players in the Chinese Professional Baseball League. Eur. Sport Manag. Q 2015, 15, 301–322. [Google Scholar] [CrossRef]
- Hassan, A.; Schrapf, N.; Tilp, M. The prediction of action positions in team handball by non-linear hybrid neural networks. Int. J. Perform. Anal. Sport 2017, 17, 293–302. [Google Scholar] [CrossRef]
- Tümer, A.E.; Koçer, S. Prediction of team league’s rankings in volleyball by artificial neural network method. Int. J. Perform. Anal. Sport 2017, 17, 202–211. [Google Scholar] [CrossRef]
- Sudin, S.; Shakaff, A.Y.M.; Zakaria, A.; Salleh, A.F.; Kamarudin, L.M.; Azmi, N.; Ahmad Saad, F.S. Real-time track cycling performance prediction using ANFIS system. Int. J. Perform. Anal. Sport 2018, 18, 806–822. [Google Scholar] [CrossRef]
- Barron, D.; Ball, G.; Robins, M.; Sunderland, C. Identifying playing talent in professional football using artificial neural networks. J. Sports Sci. 2020, 38, 1211–1220. [Google Scholar] [CrossRef]
- Karg, A.; Nguyen, J.; McDonald, H. Understanding season ticket holder attendance decisions. J. Sport Manag. 2021, 35, 239–253. [Google Scholar] [CrossRef]
- Papic, C.; Sanders, R.H.; Naemi, R.; Elipot, M.; Andersen, J. Improving data acquisition speed and accuracy in sport using neural networks. J. Sports Sci. 2021, 39, 513–522. [Google Scholar] [CrossRef]
- Zhou, Q. Sports achievement prediction and influencing factors analysis combined with deep learning model. Sci. Program. 2022, 2022, 3547703. [Google Scholar] [CrossRef]
- Loureiro, D.; Beceiro, P.; Moreira, M.; Arranja, C.; Cordeiro, D.; Alegre, H. A comprehensive performance assessment system for diagnosis and decision-support to improve water and energy efficiency and its demonstration in Portuguese collective irrigation systems. Agric. Water Manag. 2023, 275, 107998. [Google Scholar] [CrossRef]
- Nxumalo, N.; Goudge, J.; Gilson, L.; Eyles, J. Performance management in times of change: Experiences of implementing a performance assessment system in a district in South Africa. Int. J. Equity Health 2018, 17, 141. [Google Scholar] [CrossRef]
- Tsolas, I.E.; Charles, V.; Gherman, T. Supporting better practice benchmarking: A DEA-ANN approach to bank branch performance assessment. Expert Syst. Appl. 2020, 160, 113599. [Google Scholar] [CrossRef]
- Ren, P.; Liu, Z. Efficiency evaluation of china’s public sports services: A three-stage DEA model. Int. J. Environ. Res. Public Health 2021, 18, 10597. [Google Scholar] [CrossRef] [PubMed]
- Rumelhart, D.E.; Hinton, G.E.; Williams, R.J. Learning representations by back-propagating errors. Nature 1986, 323, 533–536. [Google Scholar] [CrossRef]
- Deng, X.; Liu, Q.; Deng, Y.; Mahadevan, S. An improved method to construct basic probability assignment based on the confusion matrix for classification problem. Inf. Sci. 2016, 340, 250–261. [Google Scholar] [CrossRef]
- Ahmad, Z.; Shahid Khan, A.; Wai Shiang, C.; Abdullah, J.; Ahmad, F. Network intrusion detection system: A systematic study of machine learning and deep learning approaches. Trans. Emerg. Telecommun. Technol. 2021, 32, e4150. [Google Scholar] [CrossRef]
- Cooper, W.W.; Seiford, L.M.; Tone, K. Data Envelopment Analysis—A Comprehensive Text with Models, Applications, References and DEA-Solver Software; Springer Science and Business Media, Inc.: New York, NY, USA, 2007. [Google Scholar]
- Noland, M.; Stahler, K. Asian participation and performance at the Olympic Games. Asian Econ. Policy Rev. 2016, 11, 70–90. [Google Scholar] [CrossRef]
- Hematinezhad, M.; Gholizadeh, M.H.; Ramezaniyan, M.; Shafiee, S.; Zahedi, A.G. Predicting the success of nations in Asian games using neural network. Sport Sci. Pract. Asp. 2011, 8, 33–42. [Google Scholar]
- Widrow, B.; Rumelhart, D.E.; Lehr, M.A. Neural networks: Applications in industry, business and science. Commun. ACM 1994, 37, 93–105. [Google Scholar] [CrossRef]
- Nadikattu, R.R. Implementation of new ways of artificial intelligence in sports. J. Xidian Univ. 2020, 14, 5983–5997. [Google Scholar] [CrossRef]
- Nassif, N.; Raspaud, M. National Success in Elite Sport: Exploring the Factors That Lead to Success; Palgrave Macmillan: London, UK, 2023. [Google Scholar]
- Andonie, R. Extreme Data Mining: Inference from Small Datasets. Int. J. Comput. Commun. Control. 2010, 3, 280–291. [Google Scholar] [CrossRef]
- Khan, A.A.; Laghari, A.A.; Li, P.; Dootio, M.A.; Karim, S. The collaborative role of blockchain, artificial intelligence, and industrial internet of things in digitalization of small and medium-size enterprises. Sci. Rep. 2023, 13, 1656. [Google Scholar] [CrossRef]
Disclaimer/Publisher’s Note: The statements, opinions and data contained in all publications are solely those of the individual author(s) and contributor(s) and not of MDPI and/or the editor(s). MDPI and/or the editor(s) disclaim responsibility for any injury to people or property resulting from any ideas, methods, instructions or products referred to in the content. |
© 2024 by the authors. Licensee MDPI, Basel, Switzerland. This article is an open access article distributed under the terms and conditions of the Creative Commons Attribution (CC BY) license (https://creativecommons.org/licenses/by/4.0/).