Article

A Study on the Relationship between Urban Spatial Structure Evolution and Ecological Efficiency in Shandong Province

School of Surveying and Geo-Informatics, Shandong Jianzhu University, Jinan 250101, China
*
Author to whom correspondence should be addressed.
Appl. Sci. 2024, 14(2), 818; https://doi.org/10.3390/app14020818
Submission received: 3 November 2023 / Revised: 15 January 2024 / Accepted: 15 January 2024 / Published: 18 January 2024

Abstract

:
Strengthening the construction of ecological civilization is an inevitable requirement for promoting high-quality economic and social development. It is of great significance to study the evolutionary trend and relationship between urban spatial structure and ecological efficiency to promote high-quality social development. Taking Shandong Province as an example, this paper obtains data on urban factors such as points of interest, night light, number of employed people at the end of the year and water supply; uses Anselin Local Moran’s I index to identify urban centers; analyzes the distribution form characteristics and agglomeration degree of urban space; and studies the spatial distribution characteristics and causes of differences in ecological efficiency based on the Super-SBM DEA model with undesirable output. The results show that all cities in Shandong Province show an inverse S-shaped circle decreasing trend, Laiwu city has the highest compactness (compactness index is 2.96), and Tai ‘an city has the lowest compactness index of 0.04. The level of eco-efficiency in Shandong Province is “low in the west and high in the east”, and the difference in eco-efficiency between regions is increasing year by year. Urban compactness has a “first increasing and then decreasing” effect on eco-efficiency. Technological innovation and industrial structure narrow the spatial difference in eco-efficiency, and the level of economic development expands it to a certain extent. This study aims to fill the gaps in existing research. By analyzing data on the evolution of urban spatial structure and resource consumption, it will reveal the trends of changes in the urban spatial structure of Shandong Province and study the impact of these changes on ecological benefits.

1. Introduction

With the acceleration of urbanization, urban ecology is inevitably damaged to different degrees [1]. As an important province in the eastern coastal region of China, Shandong Province, its urban spatial structure has experienced rapid development while facing a series of challenges [2,3]. Over the past decades, Shandong Province has made remarkable achievements in urbanization. The expansion of cities and the emergence of new urban centers have led to profound changes in the urban spatial structure [4,5,6,7]. However, such changes are often accompanied by problems such as irrational land use, traffic congestion, and environmental pollution [8,9,10]. Against this background, this paper explores the interaction between urban planning and ecological environment and analyzes the impact of ecological efficiency on urban spatial structure by studying the evolution of urban spatial structure in Shandong Province.
How to effectively quantitatively characterize the spatial structure of cities and urban agglomerations has always been a challenge for geographers. Many studies have been conducted to characterize the spatial structure of cities from different perspectives, Remote sensing imagery is widely used in this regard [11,12,13,14], mostly focusing on the patch scale [15,16]. Different scholars have studied the urban spatial structure from different perspectives and explored the changes in the urban spatial structure with the development of urbanization [17,18,19]. Zhu et al. studied the evolution of the spatial structure of the Yangtze River Delta urban agglomeration from the perspective of urban expansion and found the evolution law of the urban agglomeration structure from multicenter to single-center and multigroup to multicenter and multigroup [20]. Based on remote sensing data and urban life entity theory, Wu Jinqun et al. found that there are large differences in urban development in the Beijing–Tianjin–Hebei region, and Beijing and Tianjin have become the two major growth centers [21]. Li Jiao et al. used fractal theory to explore the impact of high-speed rail on the reconstruction of western urban agglomerations [22]. Feng Lan et al. used night light data to study the evolution of urban agglomerations in China from single-center to multicenter and the main driving factors in the process [23]. Based on the luminous data of Luojia No. 1 and OSM road data, Wang Yaping et al. estimated the building density of Chenggong District in Kunming [24]. Cao Shisong et al. performed a comparative analysis of the spatial patterns of different cities [25]. Yang Jincheng et al. measured the economic quality of economic cities in the Guangdong–Hong Kong–Macao Greater Bay Area and analyzed the spatial linkage characteristics of cities [26]. Based on night light data, Zheng Wensheng et al. analyzed the multifractal characteristics of the urban spatial structure in the middle reaches of the Yangtze River at different scales [27]. Wu Dan et al. analyzed the relationship between cities in China’s three major coastal urban agglomerations based on the gravity model [28]. Research on the spatial structure of cities also has different focuses at different research levels. At the national level, it is believed that the evolution of urban spatial structure is moving towards agglomeration and polycentricity [29,30]; at the provincial and city cluster level, there are more relevant studies, which focus on the spatial structure of cities and city clusters in economically developed regions and the factors and influences that play a role in them, as well as comparative studies on different urban spatial structures [9,10].
The urban spatial structure represents the distribution of human, material, financial, and other factors in the city, which also play an important role in changes in the ecological environment [31]. In 1990, German scholars Schaltegger and Sturm proposed the concept of eco-efficiency. The so-called “eco-efficiency” refers to the provision of goods and services to meet human needs and improve the quality of life at the same time, so that the ecological impact and resource intensity are gradually reduced to a level consistent with the carrying capacity of the earth. The assessment of urban eco-efficiency is one of the important indicators of sustainable urban development and one of the key tasks to promote the construction of ecological civilization. Currently, the research on eco-efficiency can be summarized in the following aspects: From the research content, it mainly includes the construction of the eco-efficiency index system [32], the evaluation of eco-efficiency [33], and the exploration of eco-efficiency regional differentiation factors [34]. In terms of research scale, it mainly includes the discussion of macro-level eco-efficiency of the country [34], province [35], watershed [36], city cluster [37] and other macro-level eco-efficiency, as well as meso-level eco-efficiency of agriculture [34], industry [38], and tourism [39]. Yuxi Liu et al., studied the relationship between the spatial structure and water ecological footprint of urban agglomeration by taking the water consumption of urban agglomeration as their research object [40]. In relevant studies on urban health and sustainable development, carbon emissions have been widely used as an indicator of urban green economic development [41,42]. Wang Shijin et al., analyzed the relationship between the urban ecological environment and spatial structure from the perspective of urban pollution [43]. Teng Fei et al., analyzed the spatial–temporal coupling relationship between regional carbon revenue and urban spatial form in the Yangtze River Delta urban agglomeration by using carbon emissions data [44]. Zhang Zhuoqun et al., studied the carbon emissions of Chinese cities and found that China’s carbon emissions intensity has a downward trend; the emissions intensity presents a spatial pattern of “low in the south and high in the north”, and the differences among different regions tend to expand [45]. Guo Shanshan analyzed the coupling coordination between ecosystem health and urbanization in the Yellow River Basin from the perspective of resource consumption [46]. In general, research on the coupling of urban spatial structure and ecological environment presents a diversified research trend [47].
Although there have been a number of studies focusing on the evolution of urban spatial structure and eco-efficiency in Shandong Province, there are still research gaps. First, most of the existing studies have focused on a single city or a small area, lacking a comprehensive analysis of the evolution of urban spatial structure across the whole of Shandong Province. Second, for the relationship between the evolution of urban spatial structure and eco-efficiency, existing studies mainly focus on qualitative descriptions and case studies, and they lack systematic quantitative analysis and in-depth understanding.
Therefore, this study aims to fill this research gap by exploring in depth the evolution of urban spatial structure and its response to eco-efficiency in Shandong Province through the integrated use of spatial analysis methods, theories, and methods of urban economics and ecological economics. Specifically, this study will analyze the trend of the evolution of urban spatial structure in Shandong Province in terms of urban spatial pattern, changes in compactness, and resource consumption, and explore the impact of these changes on eco-efficiency. Through this study, we will provide decision support and policy recommendations for the sustainable development of cities in Shandong Province and promote the coordinated development of urban spatial structure optimization and ecological environmental protection.
The main objectives of the study include the following:
(a)
To conduct an in-depth study on the relationship between urban spatial structure and eco-efficiency by selecting multi-source data from Shandong Province, such as nighttime lights (VIIRS), points of interest, and urban water consumption;
(b)
Apply the local Moran’s index method to identify the city center and use the concentric ring gradient method to divide the city into concentric zones. Utilize the inverse S function to fit the spatial distribution of the city and analyze its agglomeration characteristics;
(c)
Measure the urban eco-efficiency based on the non-expected super-efficiency SBM model and study the spatial distribution characteristics of urban eco-efficiency;
(d)
To further analyze the relationship between urban spatial structure and eco-efficiency and its influencing factors.
By realizing the above research objectives, we can have a more comprehensive understanding of the association between urban spatial structure and eco-efficiency in Shandong Province. This will provide an important basis for the formulation of policies and decisions to promote sustainable development, help to promote high-quality economic and social development, improve resource utilization efficiency, and ultimately achieve the goal of building an ecological civilization.

2. Study Area and Data Sources
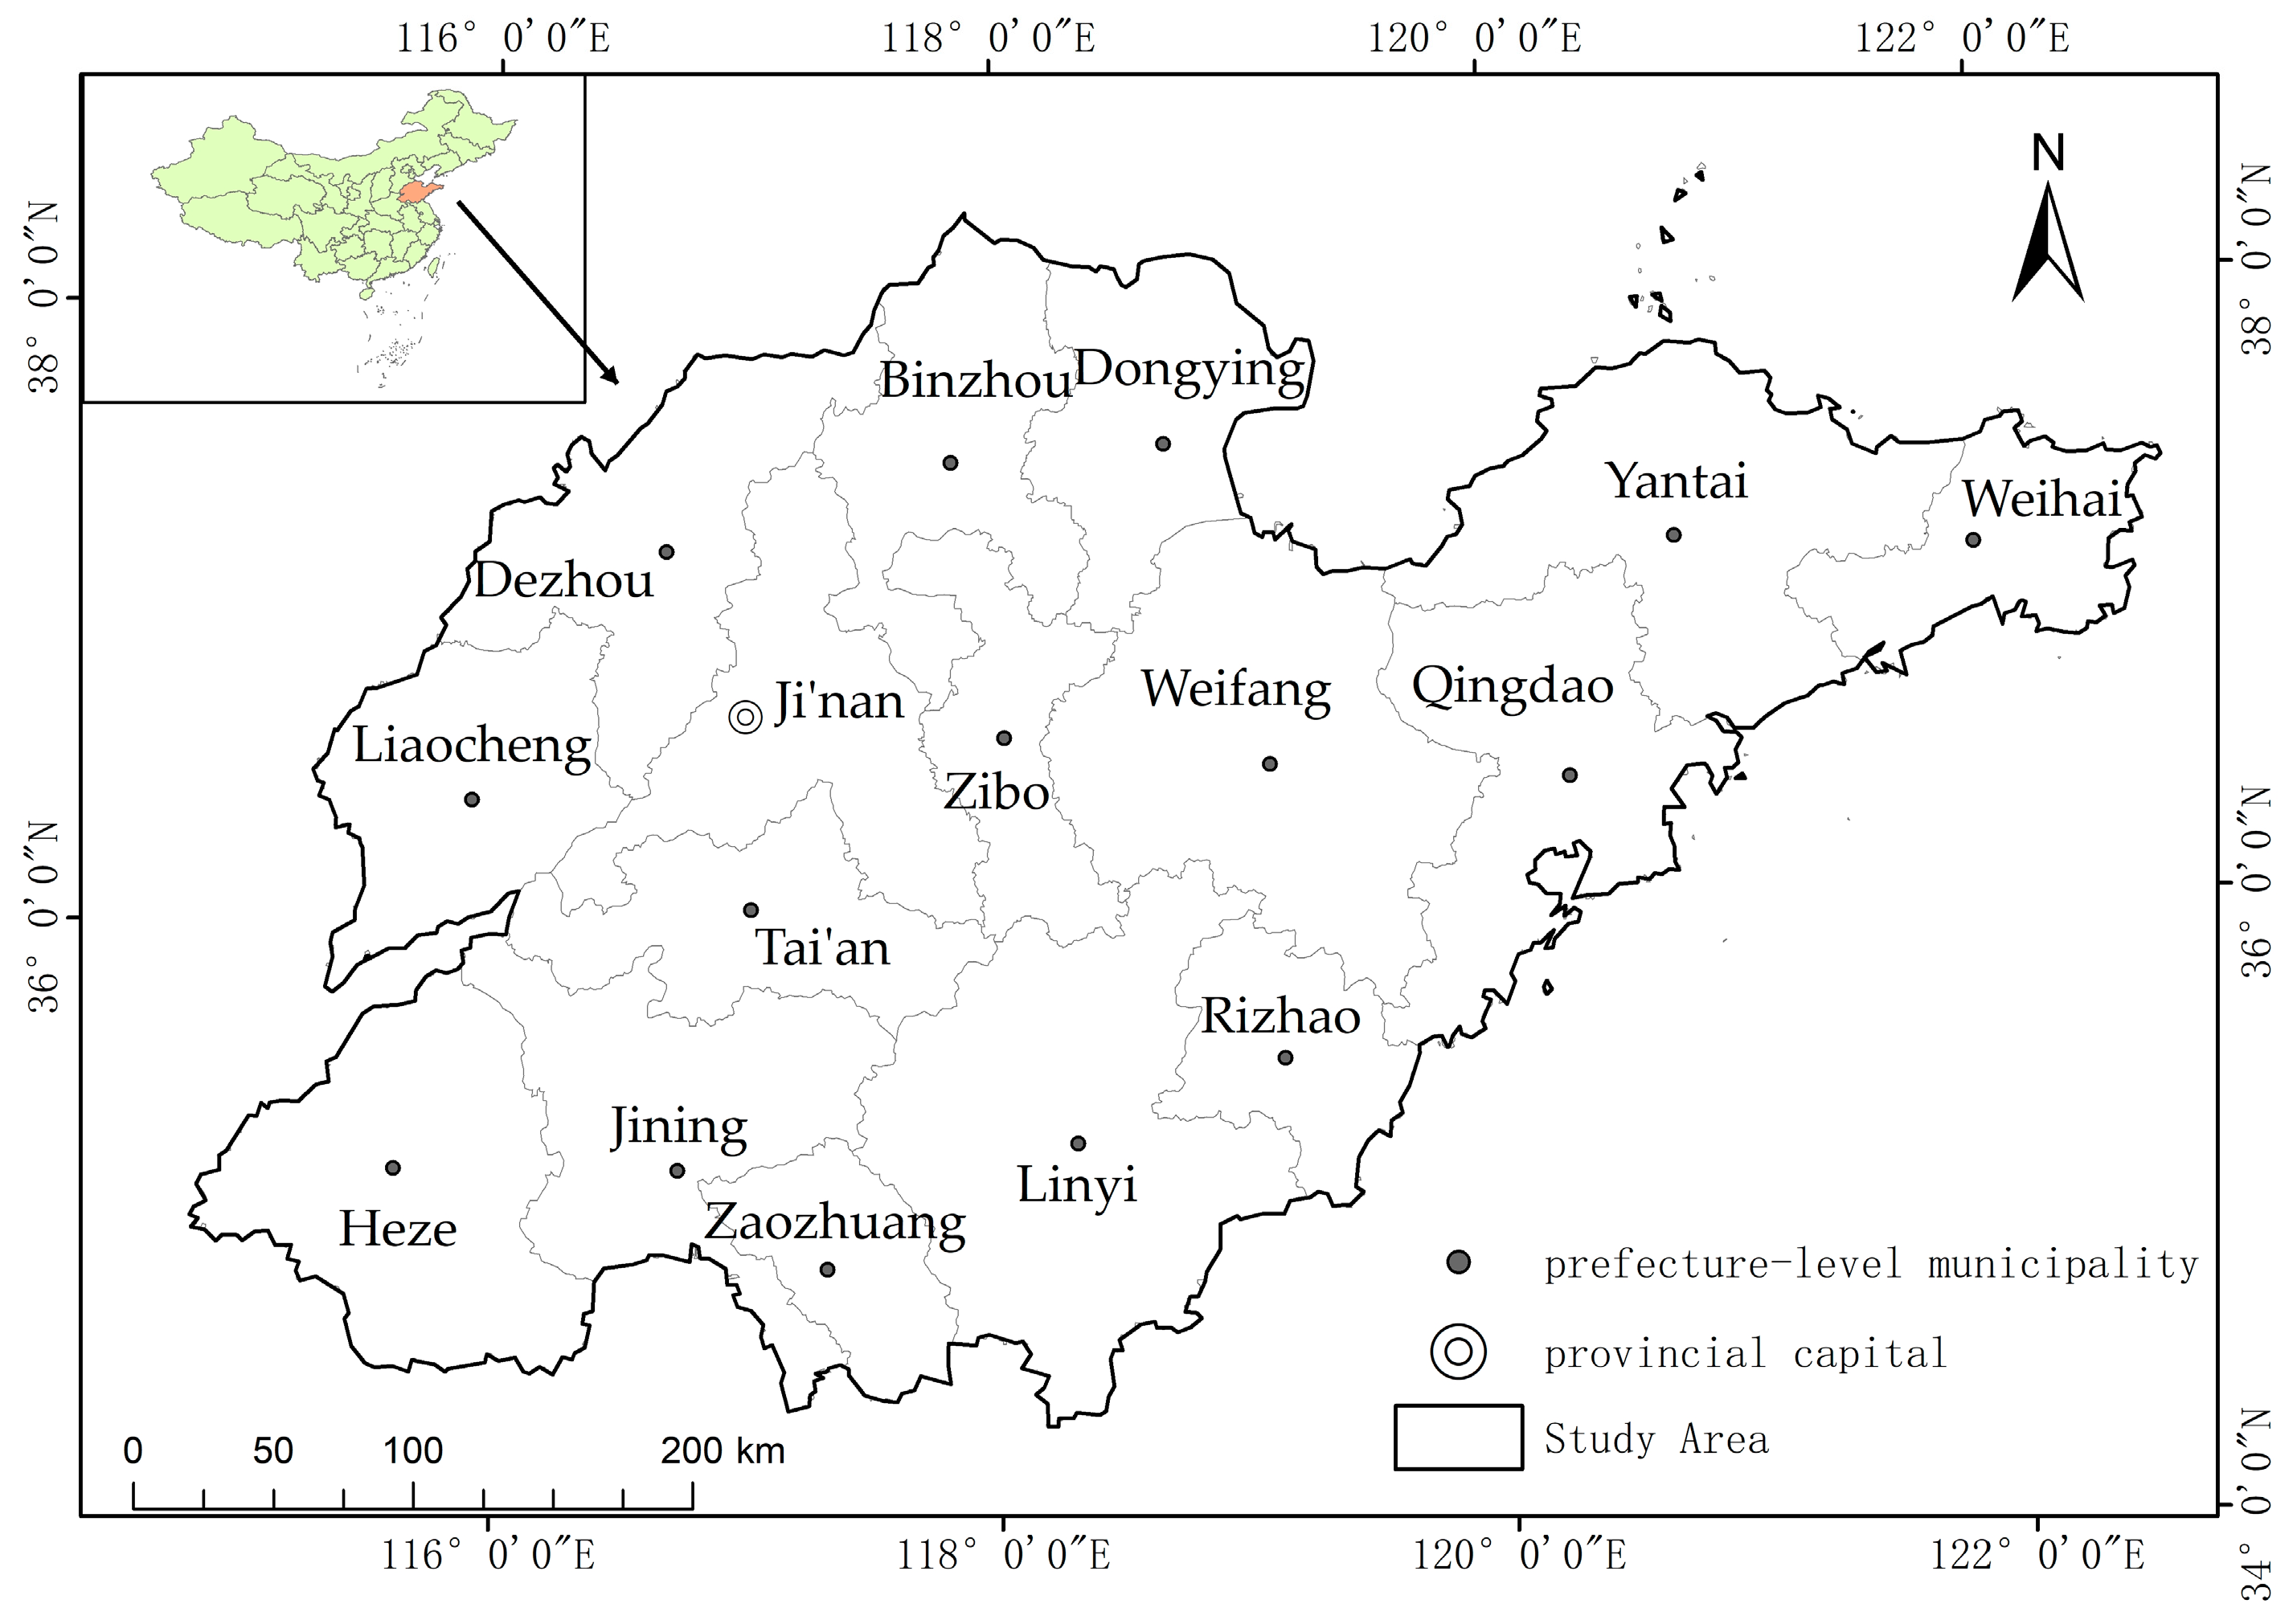
2.1. Study Area

Shandong Province is located on the eastern coast of China between latitudes 34°22.9′–38°24.01′ N and longitudes 114°47.5′–122°42.3′ E (Figure 1), bordering four provinces, Hebei, Henan, Anhui, and Jiangsu. Shandong Province governs 16 prefecture-level cities, totaling 57 municipal districts, 27 county-level cities, and 53 counties, for a total of 137 county-level administrative districts. The central region of Shandong Province is mountainous, low-lying and flat in the southwest and northwest, and has gradual hills and valleys in the east. The terrain is predominantly mountainous and hilly, with the Shandong Peninsula in the east, the North China Plain in the west and north, and mountains and hills in the south-central part.

2.2. Selection of Indicators and Data Sources

2.2.1. Selection of Indicators

Eco-efficiency reflects the transformation of input factors such as capital, labor, energy, and land into expected indicators related to economic growth and non-expected indicators such as pollutant emissions [48]. Chuanhui et al., selected human capital, industrial structure, import and export dependence, economic growth level, urbanization rate, and FDI level as input indicators [49]. Zhang Cuixia et al., selected energy, materials, equipment, R&D, and services of various production systems as input indicators, and waste and product benefit data and other manufacturing system-related data as output data [50]. Ying Liu et al. selected input indicators including labor, capital, land, energy, and water resources; expected indicators were economic output and general public budget revenue; and wastewater, waste gas, and solid discharge were taken as non-expected output [51].
In the data calculation, the input indicators selected in this study include labor force, energy, land, and water resources. The labor force is represented by the number of employed people in each city at the end of the year, the energy is represented by the electricity consumption of the whole society, the water resource is represented by the water supply of the whole city, and the land is approximately represented by the urban construction land. The expected output is the GDP deflator of each city. With reference to Zhang Zhuoqun’s practice [45], the year 2003 of the study area is taken as the base period for deflating. Considering that industrial wastewater is the main pollutant discharged in cities [52], industrial wastewater is introduced as an undesirable indicator, and SO2 discharged by various cities is introduced as an undesirable indicator to reflect air pollution.
In terms of influencing factors, with reference to existing research results [53,54], Bimonte et al. found an inverted U-shaped relationship between per capita income and per capita land consumption using a panel quadratic log function regression model [55], and Lee et al., found an inverted U-shaped or N-shaped relationship between per capita GDP and sulfur dioxide and wastewater emissions using panel quadratic and cubic function fixed effects models [56]. Therefore, the level of economic development (logarithm of per capita GDP), industrial structure (proportion of output value of tertiary industry in GDP), cultural and educational level (proportion of education expenditure in GDP), and scientific and technological development level (proportion of scientific research expenditure in GDP) were selected as influencing factors to explain the time evolution law and spatial distribution of ecological efficiency in the process of urban development. The data features and unit information are shown in Table 1.

2.2.2. Data Sources

The data in this study are divided into two categories: one is spatial data (POI data, night light data, administrative district vector data), and the other is attribute data (various input indicators, expected output indicators, non-expected output indicators, influencing factors). POI data are obtained according to the API interface provided by Amap, which mainly includes 9 categories: accommodation services, catering services, road ancillary facilities, companies, scenic spots, science, education and cultural services, healthcare services, financial insurance services, government agencies, and social organizations. Night lights use VIIRS data (https://eogdata.mines.edu/products/vnl/) (accessed on 30 June 2023) (attribute data source “SHAN DONG STATISTICAL YEARBOOKISBN”).

3. Research Methodology

3.1. Data Preprocessing

Preprocessing of nighttime light data: The data were projected as equal-area conic projections and resampled to a resolution of 1 km. In order to ensure the accuracy and continuity of the data, the data were self-corrected by assigning the part of the luminance value less than 0 to 0, so that the highest luminance value of the data in the previous year was not higher than the highest luminance value of the following year, and the background noise was removed.
POI data preprocessing: 5 km was selected as the search radius, and kernel density was processed for POI data.

3.2. Data Fusion

Previous studies have confirmed that the coupling relationship between POI data and nighttime lighting data is better, and many scholars have studied the urban spatial structure based on the fusion data of POI and nighttime lighting [57]. In this study, the data fusion is based on the theory that the gray value of nighttime lighting and the numerical weight of POI kernel density are the same to construct the NPP&POI composite index [58]. Fei Li et al., constructed the PLANUI based on the same idea to fuse the POI and nighttime lighting data, and then fused them together [57]. The averaging method was utilized to eliminate the noise effect of nighttime lighting data to improve the problem of missing urban information of weak light signals [59]. Based on the fusion of POI and nighttime lighting data, Meng Yingying et al. constructed a comprehensive NPP&POI index based on the averaging method, which not only retains the continuous advantage of using nighttime remote sensing to identify the results but also reduces the “saturation” and “spillover” effects [59]. In order to prevent too many 0 values from appearing in the study of urban spatial structure and affecting the results of the study, the DN values of nuclear density data and nighttime lighting data are added on the basis of the NPP&POI composite index constructed by Meng Yingying. It retains the advantage of the original form to retain the characteristics of various types of data and also meets the needs of this study.
P O I N T L = P i + N i + P i * N i
POINTL is a composite index of POI and nighttime lighting data; Pi is the value of POI kernel density in year i; Ni is the value of NPP nighttime lighting luminance at point i.

3.3. City Center Identification

The center of a city is the area of the city with the highest population concentration and the highest population density, and in general, the center of a city represents the main center of economic development of the city. The Moran index has been widely used in the study of urban spatial structure due to its ability to respond to the geographic correlation within the geographic space [60], which proves the good feasibility of this method, and is often used to detect the central area in the city [61]. In this paper, Anselin local Moran’s I (LMI) is selected to detect the city center in Shandong Province with the following formula:
I i = Z i S 2 j = 1 n w i j Z j
where Ii represents the local Moran index for the ith region, n is the total number of all spatial units in the study area, wij is the spatial weight value, Zi = yi y ¯ , and S2 is the variance of all samples. To identify segments with positive LMI values for statistical significance, a Z score is introduced, which is the square root of the arithmetic mean of the standardized values of each unit of the totality squared with its mean deviation. The introduction of the Z score resulted in statistics with similar values of Ii. The LMI variables were POI, nighttime lights, migration data, and their fused raster values.

3.4. Inverse S-Equation

Jiao et al. proposed an inverse S-shaped function in 2015 to fit all cities in the sample using nonlinear least squares fitting using impervious surface data from 28 cities in China [62]. Some scholars also used other different types of data to fit the inverse S function, which also verified the inverse S law proposed by Jiao et al. [63]. Yu Jing proposed the compactness index to describe the compactness of the spatial distribution of urban elements based on the inverse S equation, which proved the feasibility of the method [64]. Therefore, this study uses this inverse S equation to fit and analyze the circular density distribution of each city in Shandong Province. The equation is as follows:
f ( r ) = 1 c 1 + e α ( ( 2 r / D ) 1 ) + c
where f(r) denotes the density of urban elements, r denotes the distance of urban elements to the city center, e is a natural constant, and c denotes the density of urban elements at the edge of the city, where α and D represent the characteristics of the decay curve of urban elements from the center outward, α denotes the parameter that responds to the slope of the inverse S-shaped function curve, and D is the distance from the edge of the city to the center.
The urban areas are divided according to the fitted to-be-determined coefficients, with area r1 denoting the central area, area r1–r2 denoting the urban core, area r2–r3 denoting the urban near-urban area, and area beyond r3 denoting the urban outer-urban area.
r 1 = D 2 ( 1.316957 α + 1 )
r 2 = D 2
r 3 = D 2 ( 1.316957 α + 1 )
Deriving the compactness indicator K from the inverse S-shaped function characterizes the degree of compactness of the urban space from the city center to the city periphery.
K = 1 1 2 ( 1 r 3 r 2 D )

3.5. The Super-SBM DEA Model with Undesirable Output

Modern production methods have not only increased labor productivity but also produced abundant and inexpensive manufactured goods to improve people’s standard of living. Industrial production also inevitably generates a large amount of pollutants such as wastewater, exhaust gas, and waste residue (undesired outputs). In this study, the eco-efficiency of each city is calculated using the Super-SBM DEA model with undesirable output via the data envelopment analysis (DEA) method. The DEA model does not need to set a specific function model and can evaluate the efficiency of decision-making units with multiple inputs and multiple outputs. The traditional DEA model is mainly based on radial and angular considerations, which requires inputs and outputs to be improved in the same proportion and does not measure the feasibility of slack variables, overestimating the decision-making efficiency units. The super-efficient SBM model based on non-expected output corrects the problem that the radial model does not include slack variables for the inefficiency measurements, and reaches the frontier with the shortest path so that the decision-making unit can reach the most efficient frontier surface at the least cost [45]. Several scholars have utilized this method to measure eco-efficiency, thus justifying the methodology of this study [40].
ρ = min 1 + 1 m i = 1 m s i x x i 0 1 1 s 1 + s 2 ( k = 1 s 1 s k y y k 0 + l = 1 s 2 s l z z l 0 )
x i 0 j = 1 , 0 n λ j x j s i x , i
y k 0 j = 1 , 0 n λ j y j + s k y , k
z i 0 j = 1 , 0 n λ j z j + s l z , l
1 1 s 1 + s 2 ( k = 1 s 1 s k y y k 0 + l = 1 s 2 s l z z l 0 ) > 0
s i x 0 , s k y 0 , s l z 0 , λ j 0 , i , j , k , l
Suppose there are n decision units, each of which contains three elements: inputs, desired outputs, and undesired outputs, represented by three vectors (X, Y, and Z), where xi0, yi0, and zi0 are the values of inputs, desired outputs, and undesired outputs of the ith decision unit, respectively, and sx, sy, and sb are the slack values of inputs, desired outputs, and undesired outputs and are the weight vectors. ρ is the objective function, and ρ = 1, i.e., sx = 0, sy = 0, and sz = 0, means the decision unit is valid; if ρ < 1, it means the decision unit is nonvalid and there is room for improvement.

3.6. Gini Coefficient

The Gini coefficient and its related indicators are used to analyze the differences in the spatial distribution of eco-efficiency in Shandong Province, including the overall difference G, the contribution of intraregional differences Gw, the contribution of interregional differences Gnb, and the contribution of hypervariable density Gt, which are used to express the magnitude of the intraregional differences, the interregional differences, and the synergistic contribution of the regions to the eco-efficiency of cities in Shandong Province, respectively. The averaging of the above indicators reflects the relative differences within the study area, as shown in the following formula.
G = j = 1 I h = 1 I i = 1 n j r = 1 n h y j i y h r 2 n 2 y ¯
G w = j = 1 k G j j p j s j
G n b = j = 2 I h = 1 j 1 G j h ( p j s h + p h s j ) D j h
G t = j = 2 I h = 1 j 1 G j h ( p j s h + p h s j ) ( 1 D j h )
I denotes the number of division years in Shandong Province as follows: nj and nh denote the number of cities within the j(h) region; yji and yhr denote the eco-efficiency value of any city within the j(h) region; n denotes the number of cities; and y ¯ denotes the average value of eco-efficiency of cities in Shandong Province. Gjj denotes the Gini coefficient of region j, Pj = nj/n, Sj = nj Y ¯ j/n Y ¯ ; Gjh denotes the Gini coefficient between regions j and h; and Djh is the relative impact of eco-efficiency between regions j and h.

3.7. Quantile Regression

To meet the needs of this study and to investigate the differences in the degree of influence of each influencing factor on eco-efficiency in cities in Shandong Province, the quantile regression model was selected. Quantile regression is a modeling method for estimating the linear relationship between a set of regression variables X and the quantiles of the explanatory variables Y. It is able to describe the full picture of the conditional distribution of the explanatory variables more comprehensively than just analyzing the conditional expectations of the explanatory variables, and it can also analyze how the explanatory variables affect the medians and quartiles of the explanatory variables. Estimates of regression coefficients at different quartiles are often different, i.e., the explanatory variables affect different levels of the explanatory variables differently.
Q u a n t q ( Y t X i t ) = β q X i t + μ t
where Yt is the urban eco-efficiency in year t; q is the quantile. In this study, quartiles start = 0.2, end = 0.8, and interval = 0.1. Xit denotes the ith explanatory variable in year t; βq is the vector of coefficients corresponding to the quantile q; and µt is the randomized disturbance term.

4. Results

4.1. Analysis of Urban Spatial Structure in Shandong Province

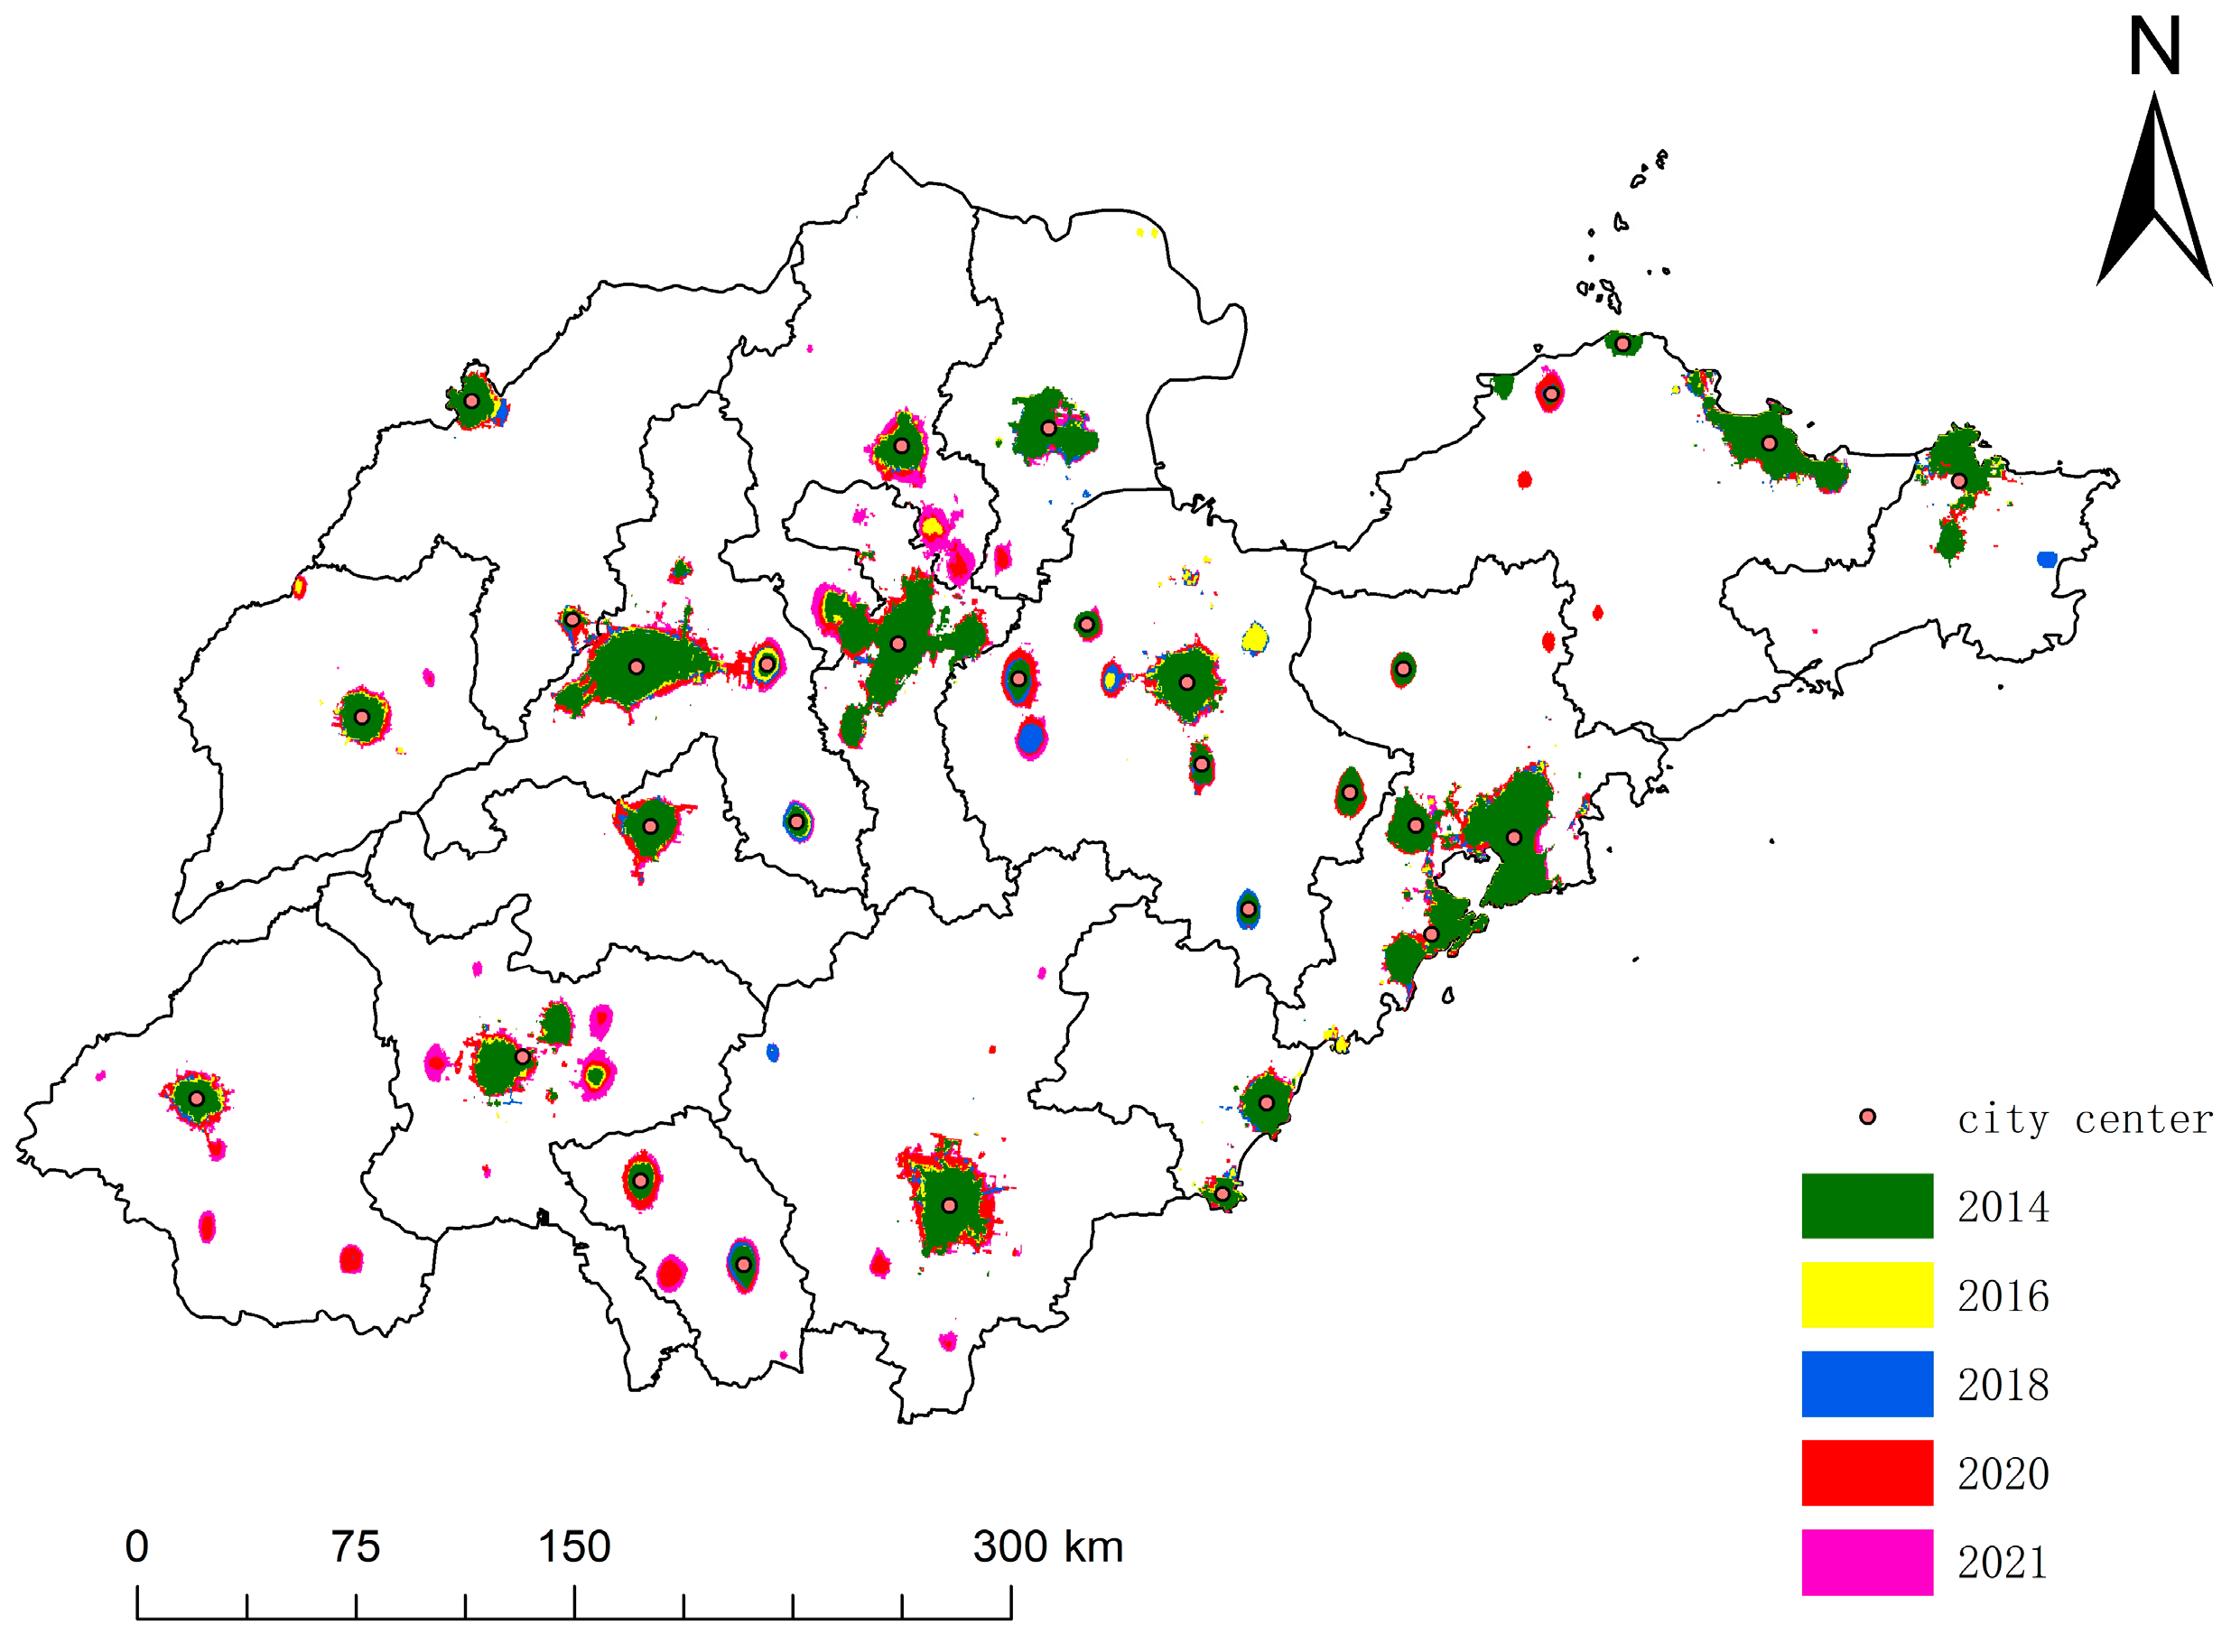
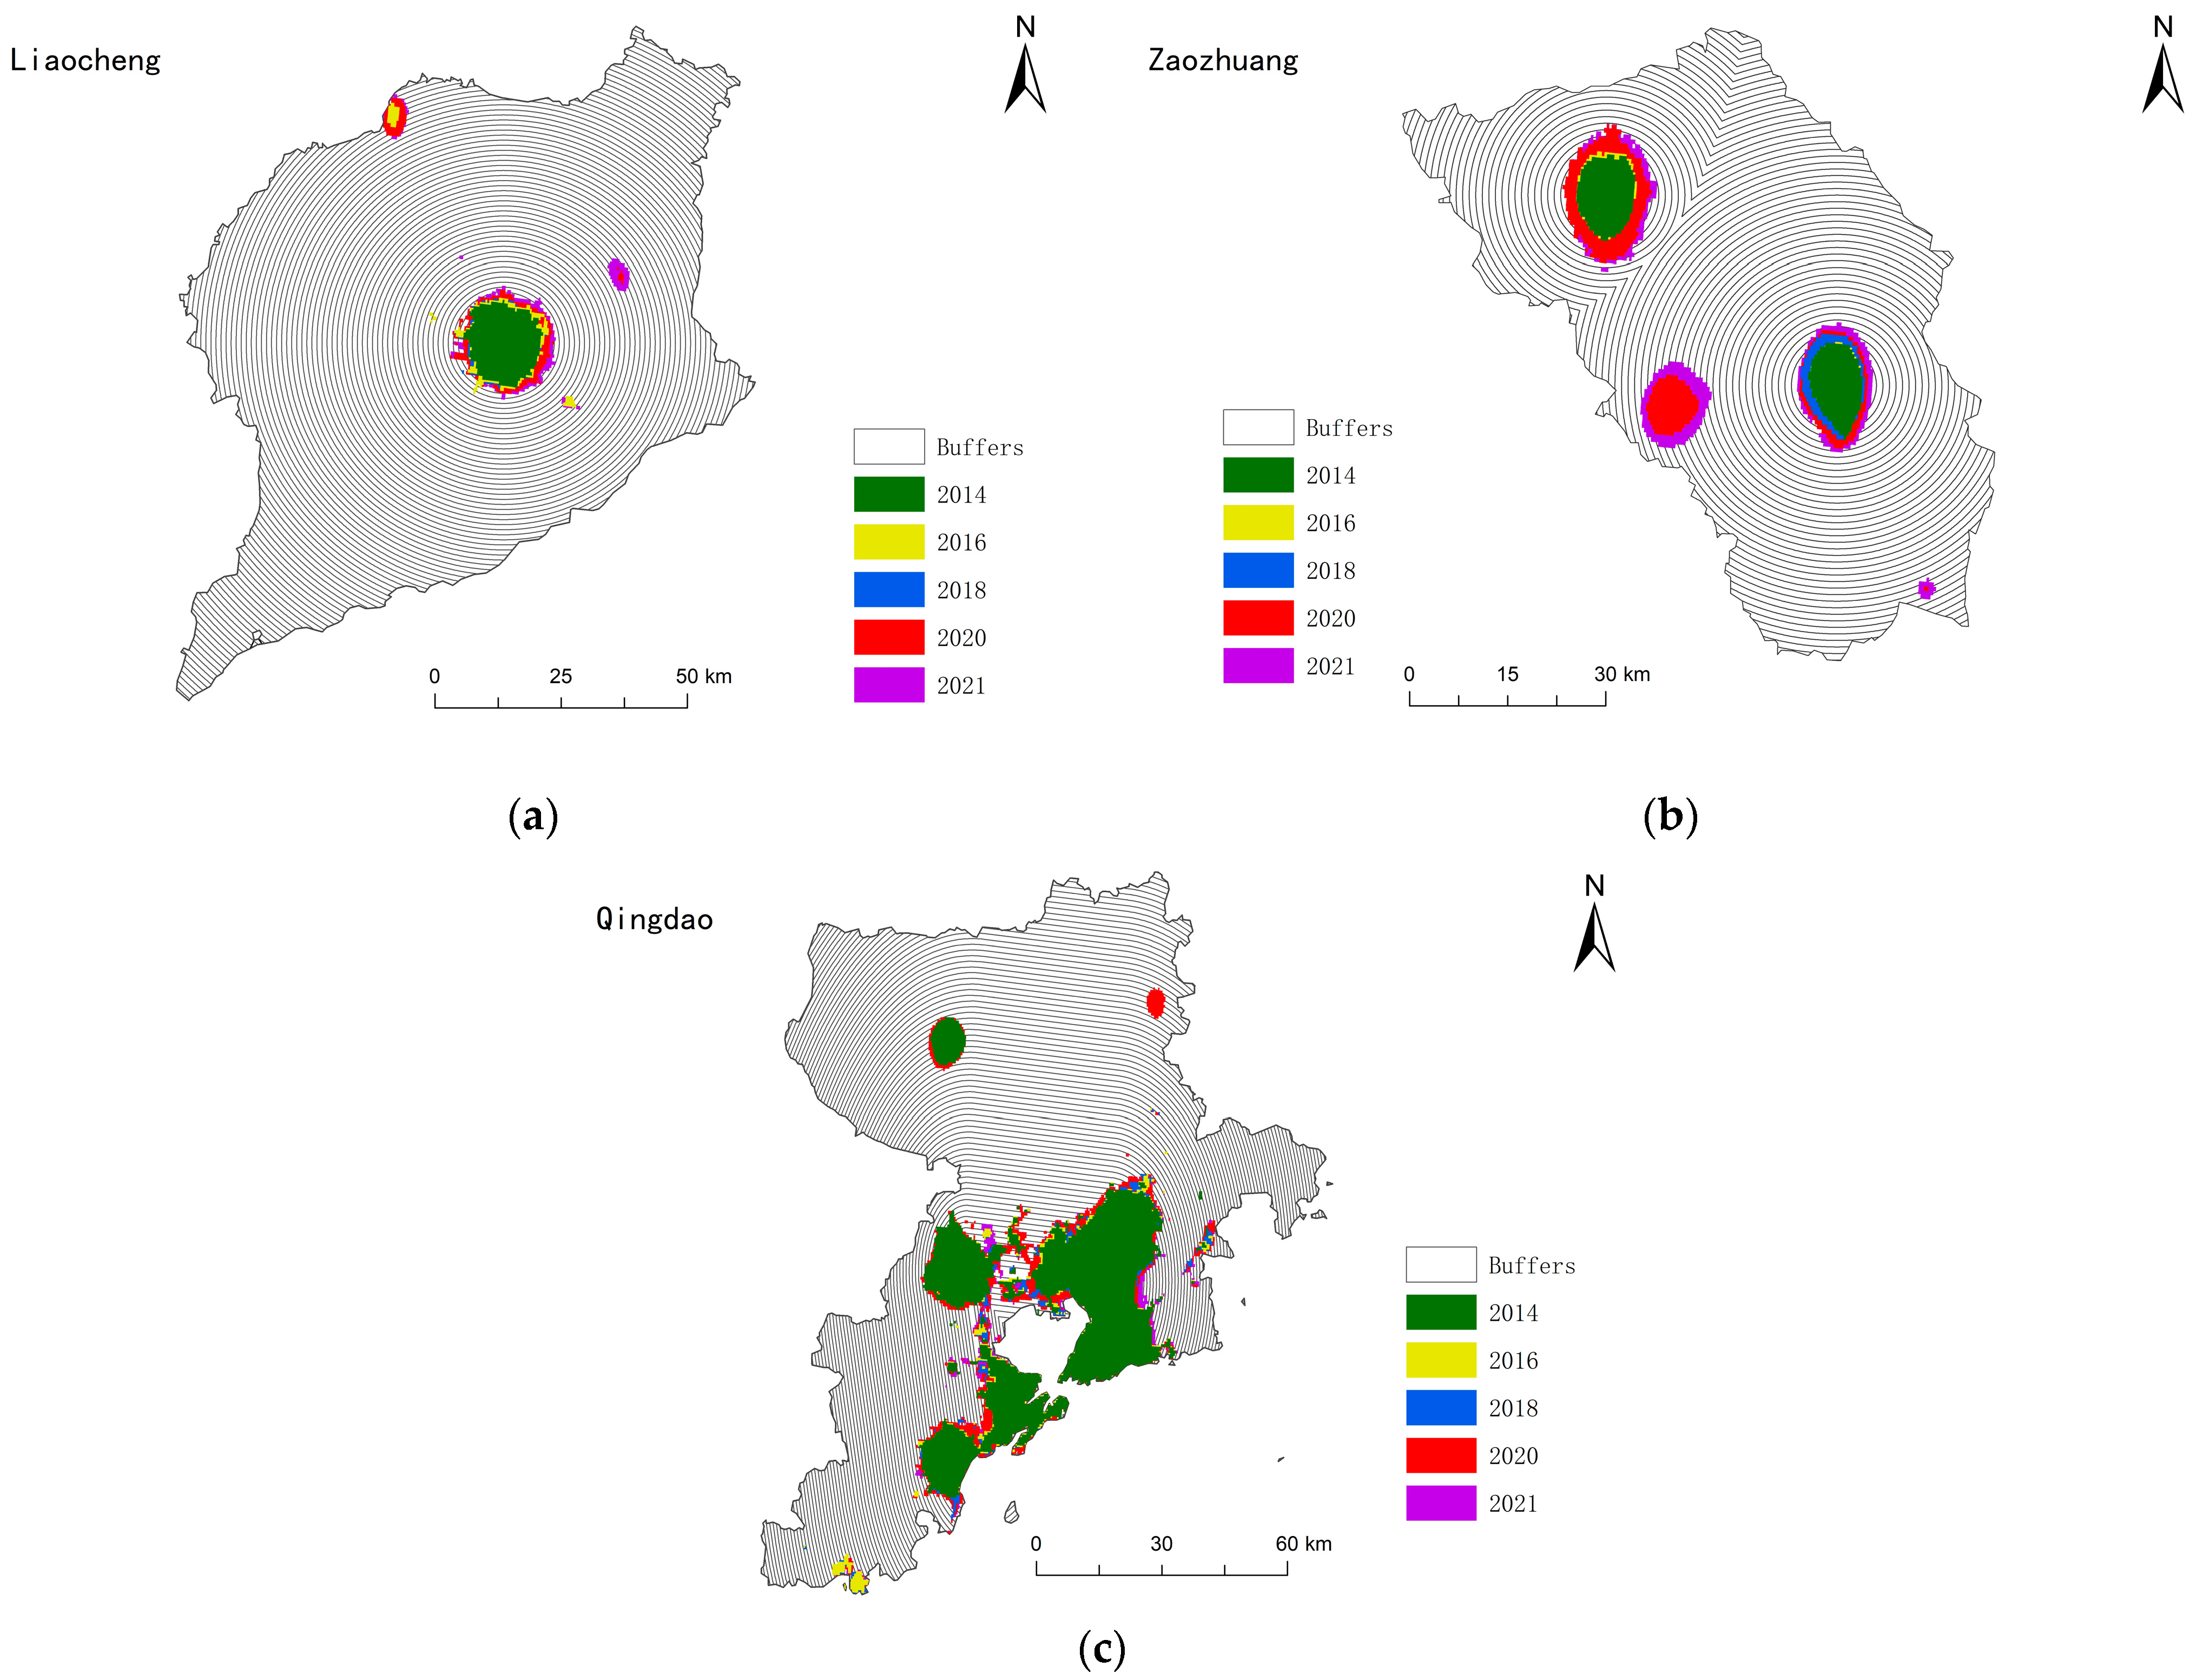
4.1.1. City Center Identification and Circular Delineation

In this paper, the local Moran index is used to analyze the comprehensive index of POI and nighttime lighting data in Shandong Province. The local Moran index is used to identify the city center, the high and high aggregation areas in the analysis results are considered candidate centers of the city cluster, and the Z value is introduced to exclude the abnormal area and extract the center area of the city. Combining the development status of each city and the results of center identification, the cities are divided into monocentric and polycentric cities. The results are shown in Figure 2.
The circular gradient method is used to divide the city into circles. First, the city center form is determined. For monocentric cities, the city center is used as the center of the circle outward with a multilayer buffer zone with an incremental distance of 1 km. For multicenter cities, the city centers are connected, the location with the lowest composite index in the connecting path is identified, multilayer buffer zones with an incremental distance of 1 km outward from the center of each center are established, the lowest point is taken as the buffer circle fusion point, the buffer zones are fused, and then multilayer buffer zones continue to be established outward from the fused buffer zones. For multicenter cities with obvious “belt” shapes, the center points are connected to form a centerline, and multilayer buffer zones with a 1 km incremental distance outward from the centerline are established. The different types of buffer zones are shown in Figure 3.

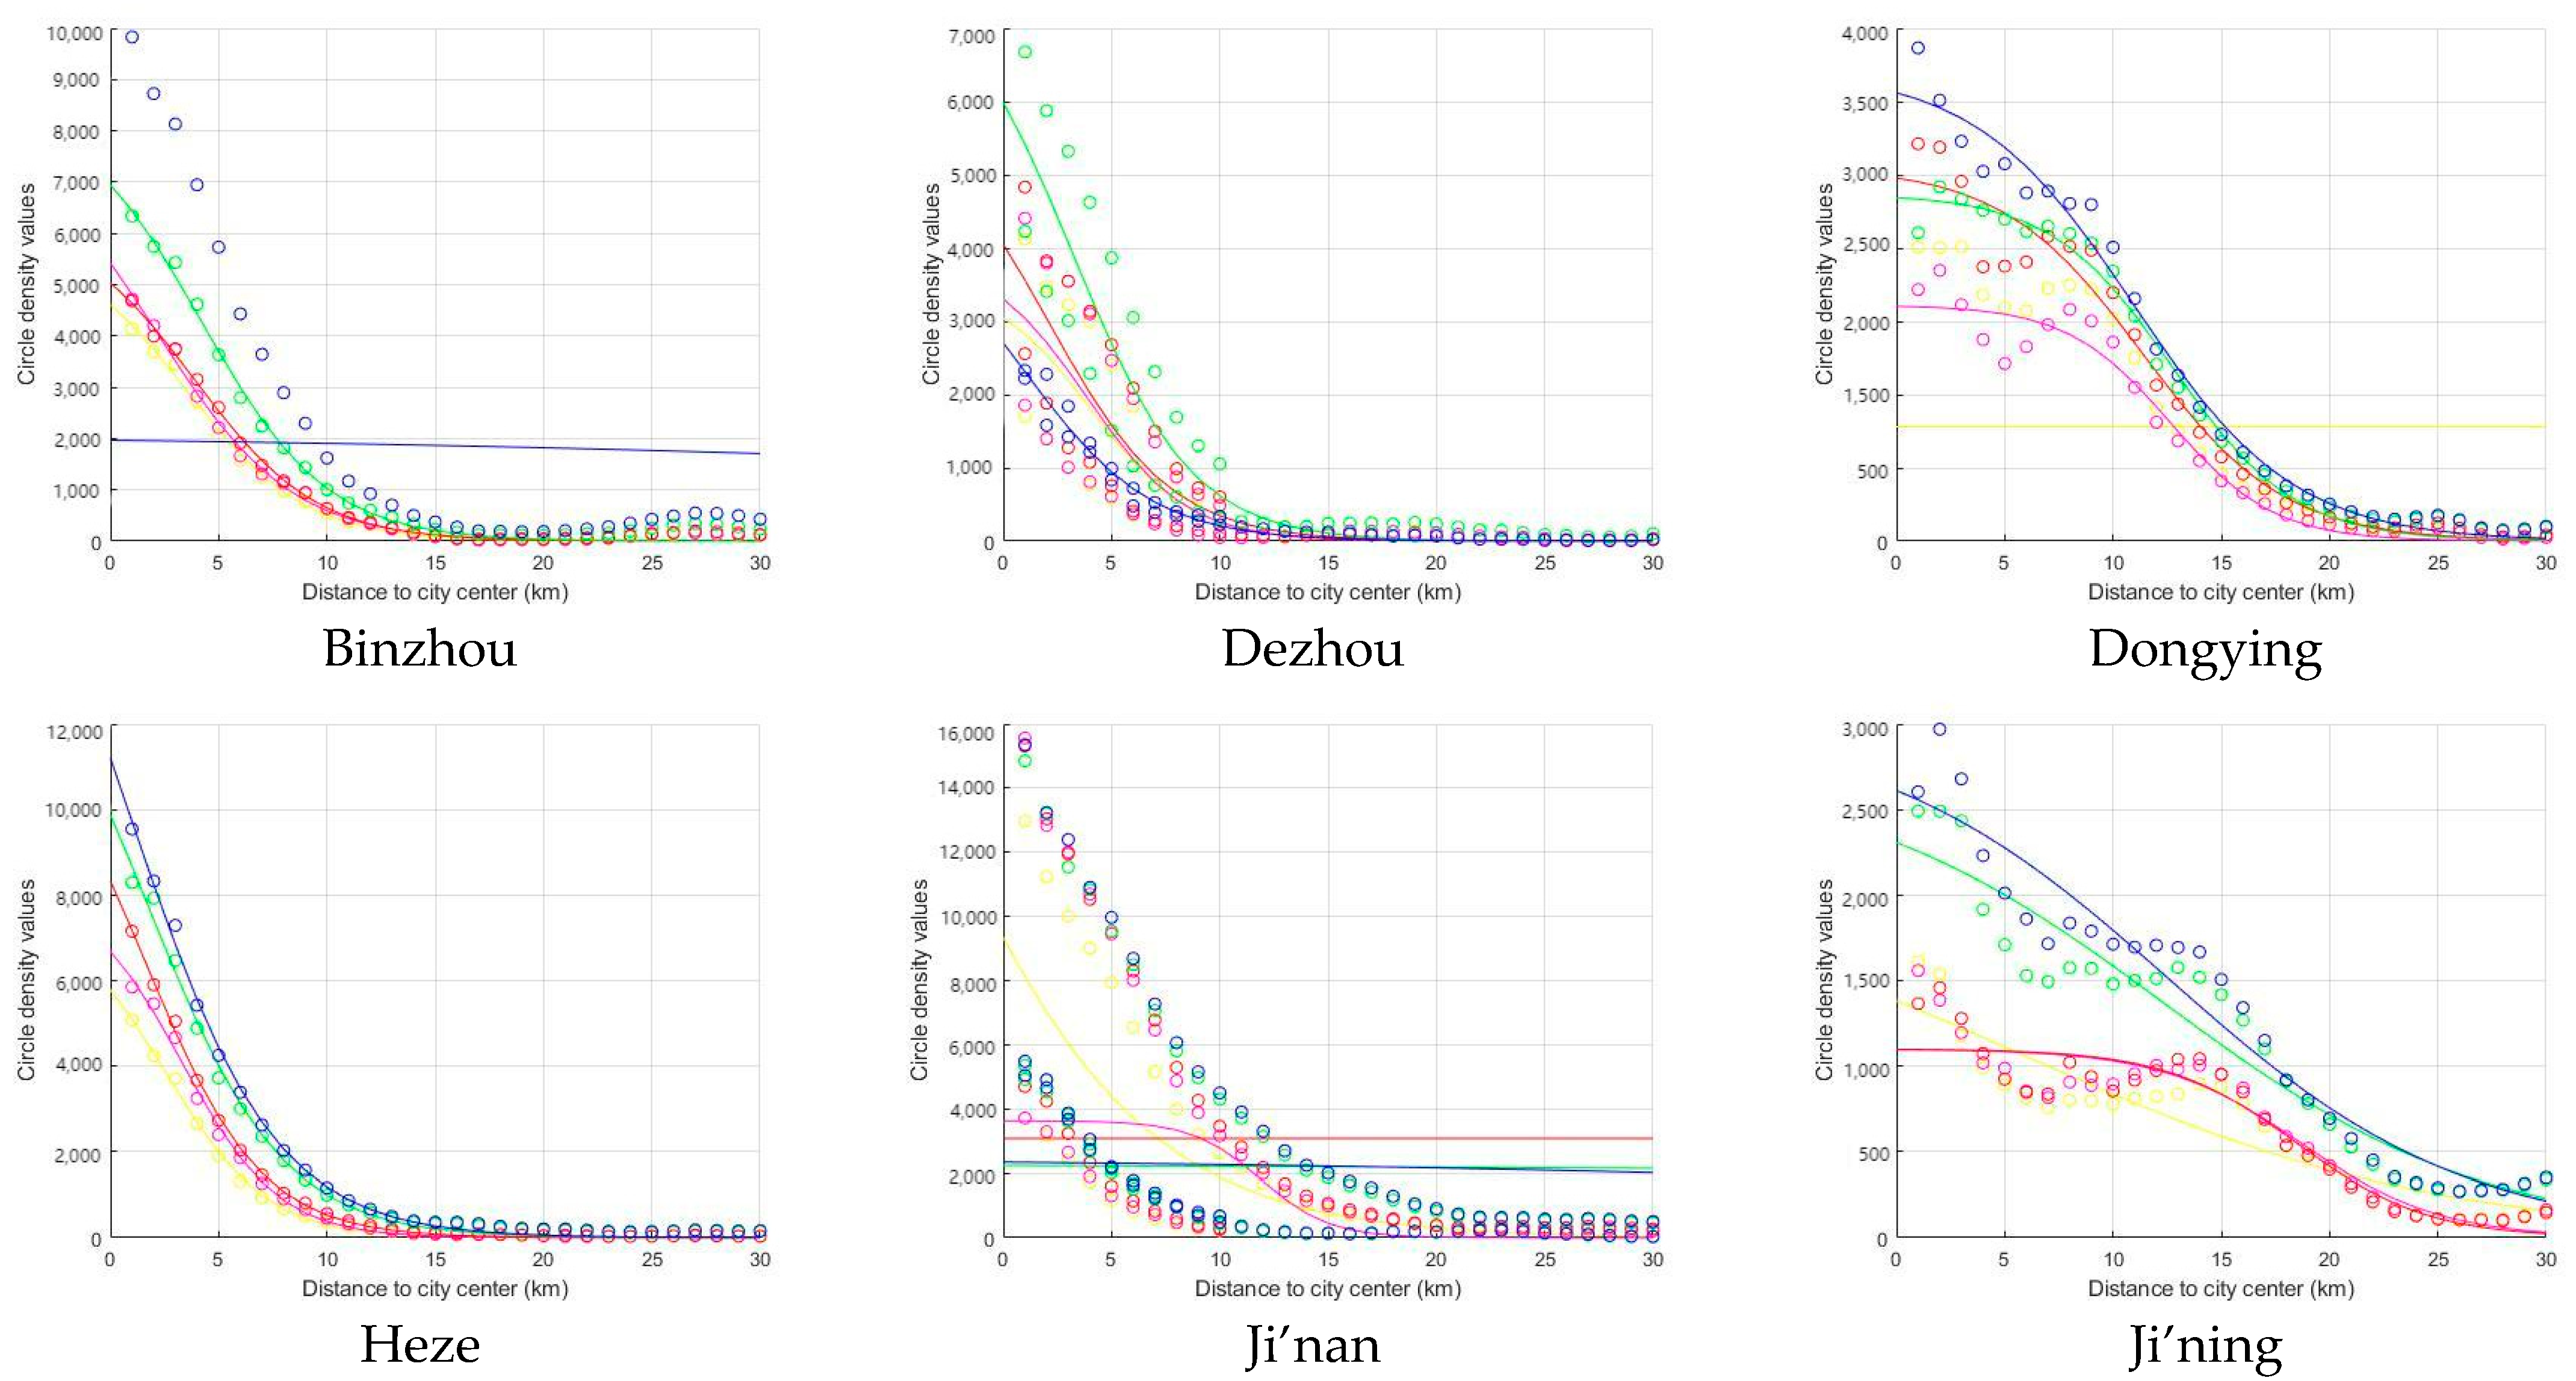
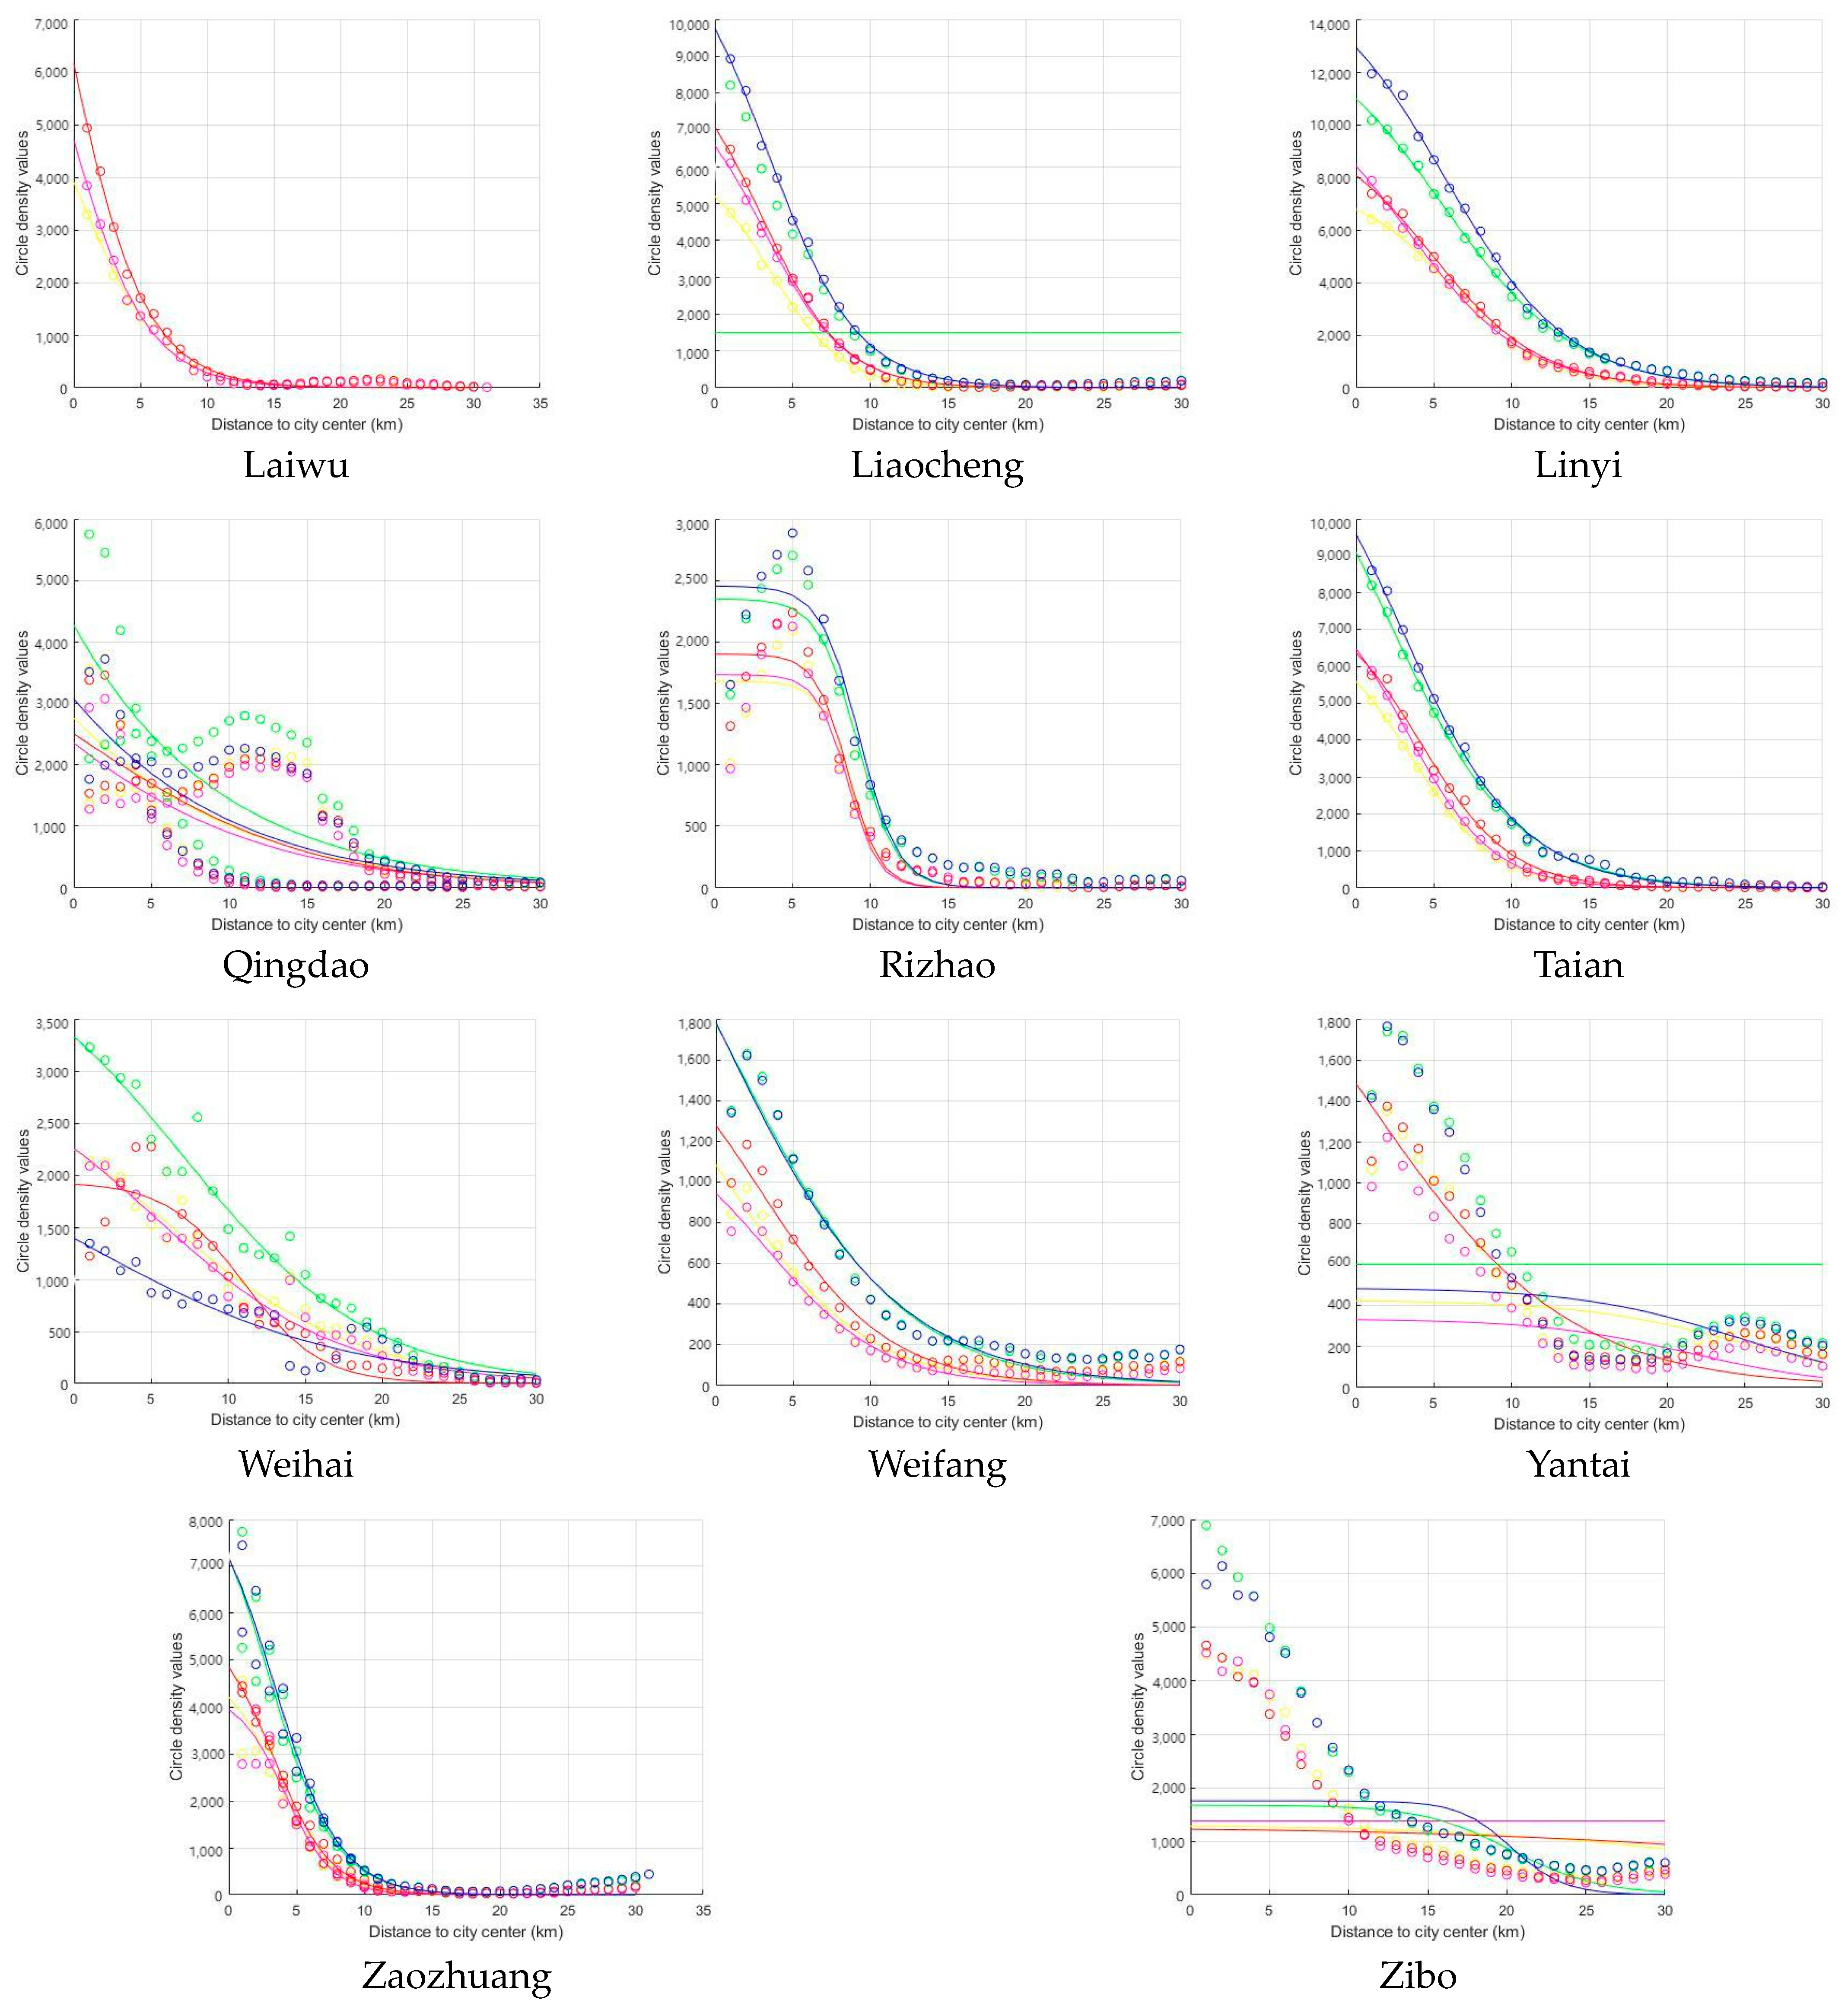
4.1.2. Fitting the Spatial Distribution of Urban Elements

The obtained POINTL composite indices were normalized, assigned to the buffer circle layer at the corresponding position, and fitted to the inverse S-equation in MATLAB 2018. The fitting curve is shown in Figure 4.
From the figure, it can be seen that all the cities in Shandong Province have a decreasing trend from the city center to the outward inverse S. There are differences in the decreasing pattern and evolution form of each city. The slope of the 2014 Qingdao curve is the highest, followed by the slope of the curve in Jinan. Qingdao shows a pattern of rapid decline with increasing distance from the city center, and the slope of the curve in Jinan may be due to the influence of the multicenter circle. The curve formed is not regular, and the urban space generally shows a decreasing trend from the center outward. Laiwu city had little change in the curve pattern from 2014 to 2018, probably due to the size of the city form and the overly concentrated distribution of industries. The slopes of the density distribution curves in Heze and Zaozhuang have clearly shown an increasing trend in recent years, reflecting a higher degree of centripetal agglomeration, rapid development of urban centers, the convergence of urban resources to the center, and slower development of noncentral areas. Rizhao city shows a declining pattern of slow decline followed by rapid decline, indicating that urban resources are mainly concentrated in the development of the city center and areas around the center, while the development of peripheral areas of the city lags behind. Qingdao, Yantai, and other cities show small fluctuations of local bulges at different locations from the city center, reflecting the existence of local agglomeration of urban elements outside the city center and subcenters.

4.1.3. Characterization of Urban Factor Agglomeration

The compactness indicator K derived from the inverse S function can quantitatively describe the compactness of the distribution of urban elements [64], and the compactness of each city is shown in Table 2. Laiwu city has the highest average compactness, followed by Qingdao. The reason for the high degree of compactness in Laiwu city may be because the area of Laiwu city’s jurisdiction is small, the type of industry is more homogenized, and the industrial distribution is highly concentrated. Qingdao has a high level of economic development, strong attraction for business concentration and investment, and a dense population. Taian has the lowest degree of compactness, indicating that the development of the city is more balanced and that the agglomeration of the city center is not prominent. Comparing the indicators of urban compactness in different years, it is found that most of the cities in Shandong Province have declined in compactness indicators, indicating that most of the urban development is still in the stage of development from single-center to multicenter cities. The compactness indicators of Jining city and Binzhou city have risen. Combined with the analysis in Figure 3, the degree of centralization of these cities is not strong, and there is still more space for development in the urban center area.
In accordance with the Peninsula City Circle Plan for Shandong Province, the regional divisions of Qingdao, Weihai, Weifang, Rizhao, and Yantai (five cities) are divided into the Jiaodong Economic Circle; Linyi, Zaozhuang, Jining, and Heze (four cities) are divided into the Lunan Economic Circle; and the eight cities of Jinan, Zibo, Tai’an, Liaocheng, Dezhou, Binzhou, Dongying, and Laiwu (although Laiwu was not assigned to Jinan before 2019) are divided into the Provincial Capital Economic Circle. The Jiaodong Economic Circle has the highest degree of urban compactness, followed by the Provincial Capital Economic Circle, and the Lunan Economic Circle has the lowest degree, which is consistent with the reality of Jiaodong > Provincial Capital > Lunan in combination with the economic and social development of each economic circle.

4.2. Analysis of Urban Eco-Efficiency in Shandong Province

4.2.1. Measurement of Urban Eco-Efficiency in Shandong Province

In terms of measuring urban ecological efficiency, the non-expected output super efficiency SBM model is used to calculate the ecological efficiency of various cities in Shandong Province through MATLAB. Figure 5 reflects the evolutionary trend of the mean eco-efficiency values in Shandong Province and each economic circle from 2014 to 2021.
Overall, the level of urban eco-efficiency in Shandong Province is between 0.2 and 0.7, with an overall downward trend until 2020, with an average decrease of 6.4%, and an upturn in eco-efficiency in Shandong Province in 2021, with an increase of 9.6%. The average value of eco-efficiency in the study period is 0.438, which is at a lower level, and there is still much room for improvement. The temporal change characteristics of eco-efficiency in each economic circle are similar to the overall characteristics. The eco-efficiency level of the Jiaodong Economic Circle has relatively large changes, and the eco-efficiency levels of the Provincial Capital Economic Circle and Lunan Economic Circle are relatively stable.
A comparison of eco-efficiency among the three economic circles shows that the Jiaodong Economic Circle has the highest level of eco-efficiency, the Provincial Capital Economic Circle has the middle level of eco-efficiency, and the Lunan Economic Circle has the lowest level of eco-efficiency. The Jiaodong Economic Circle is located in the coastal area of Shandong Peninsula, which has a natural advantage of opening up to the outside world, attracting high-tech industries, emerging future industries and other key areas, and high-end projects to gather in Jiaodong, and these industries help to improve the eco-efficiency level of the city, whether in terms of energy consumption, resource allocation, or pollution emissions. The Lunan Economic Circle, such as Linyi, Zaozhuang, and other cities in the economic development of the main industry, is mostly secondary industry, with high energy consumption and pollution emissions, and the level of eco-efficiency is stable. The main industries in the Lunan Economic Circle, such as Linyi and Zaozhuang, are mostly secondary industries, with high energy consumption and pollution emissions, which are not conducive to urban eco-development; the main industries in the Provincial Capital Economic Circle are diversified, including both high-tech industries such as Inspur and industrial industries such as steel, whose eco-efficiency is at a medium level.

4.2.2. Characteristics of the Spatial and Temporal Distribution of Urban Eco-Efficiency in Shandong Province

To more intuitively portray the spatial and temporal differentiation characteristics of urban eco-efficiency, the spatial distribution map of eco-efficiency in 17 cities in Shandong Province (Laiwu city was not assigned to Jinan before 2019) from 2014 to 2021 was drawn using ArcGIS software 10.2 (Figure 6). As seen from the figure, the spatial distribution of eco-efficiency in Shandong Province has obvious polarization characteristics. The level of eco-efficiency in western Shandong Province is low, and the level of eco-efficiency in eastern Shandong Province is relatively high. Inland cities except Jinan and Zibo are at very low eco-efficiency levels, and the eco-efficiency level of Zibo city decreased during 2014–2021, falling to below 0.4 in 2018. After Laiwu was assigned to the administrative scope of Jinan city in 2019, the overall eco-efficiency level of Jinan city improved; the eco-efficiency level of the coastal areas also decreased during 2014–2020, and the eco-efficiency level of Yantai city also decreased. Yantai city’s eco-efficiency declined by 18.5% during 2014–2016. In Weihai city, the eco-efficiency level declined by 87% during 2018–2020 and returned to higher levels in 2021.

4.2.3. Spatial Differences in Urban Eco-Efficiency in Shandong Province

To reveal the spatial differences in eco-efficiency and their sources in Shandong Province, this study analyzes urban eco-efficiency based on the Gini coefficient. The analysis results are shown in Figure 7 and Table 3, Table 4 and Table 5. The overall Gini coefficient in Shandong Province shows an upward trend, and the overall difference in urban eco-efficiency rises by 4.5% on average. It rose sharply during 2014–2018, after which it declined with small fluctuations and reached a minimum value of 0.387 in 2020, indicating that the eco-environmental protection synergy mechanism has achieved some success in recent years. Subregionally, the Gini index of the Provincial Capital Economic Circle continued to rise before 2018 and showed a stable state after 2018 with a small decline, indicating that the gap between the eco-efficiency of the cities in the Provincial Capital Economic Circle has been narrowing in recent years. Combined with the previous section, it can be seen that there is a synergistic downward trend in the eco-efficiency of the Provincial Capital Economic Circle. The Jiaodong Economic Circle and the Provincial Capital Economic Circle have roughly the same trend, and the Gini coefficient overall shows a rising trend. After 2018, there is a downward trend. Combined with the analysis of Figure 3, it can be seen that the eco-efficiency of the Jiaodong Economic Circle as a whole is at a high level, and the eco-efficiency of the city of Weihai rebounded in the 21st year, which may be the reason for the decline in the Gini coefficient in the 21st year. The distribution of the Gini coefficient of the Lunan Economic Circle and other economic centers is obviously different; the overall tendency is a downward trend, with an average of 19.6% and a significant decline of 62% in 2018–2020, indicating that there is a synergistic decline in eco-efficiency.
Analyzing the trend of the evolution of the differences between different economic centers in Figure 7, it can be seen that the differences between different economic centers show an upward trend, and the fluctuations are roughly the same. Among them, the difference between the provincial capital and the Lunan Economic Circle is the largest, and the difference between Jiaodong and Lunan is smaller.
Figure 7 reflects the contribution of intrasubgroup differences, intersubgroup differences, and hypervariable density to the overall differences, from which it can be seen that the intersubgroup differences are the largest, indicating that the level of differences between regions is large, which is consistent with the effect presented in Figure 6. The hypervariable density has the smallest contribution, indicating that the differences due to the cross-overlapping parts of different subgroups are small.

5. Urban Eco-Efficiency Response

5.1. Relationship between Urban Eco-Efficiency and Urban Spatial Structure Response

To reveal the trend of eco-efficiency with urban spatial structure in Shandong Province, the relationship between urban eco-efficiency and spatial structure was investigated using linear regression (least squares). Figure 8 shows the regression curve of urban compactness and urban eco-efficiency. From the figure, it can be seen that with the increase in urban compactness, the eco-efficiency shows a trend of a small decrease followed by a large increase, then basically stays stable, and then there is a large decrease. The reason behind this may be that in the initial stage of urban development, resources are concentrated in large cities. With the increase in agglomeration, the environment becomes more crowded and polluted, and the urban development industry is mainly concentrated in industrial industry, with high energy consumption, high pollution, and a large degree of damage to the urban ecological environment. With the expansion of city scale and rapid economic and social development, the main industries complete their transformation, residents and industries spread to the surrounding areas, and the development of new urban centers and urban agglomerations tends to be polycentric; large cities with a concentration of residents, economy, and technology can share and recycle public resources; share fixed costs, such as water conservancy infrastructure; and even protect the environment through technological advances brought about by corporate competition. However, as large cities attract excessive population concentrations, overcrowded urban environments lead to massive duplication of construction and excessive maintenance costs for public resources, and the low costs associated with economic development lead to wasteful use of resources in urban environments.

5.2. Causes of Spatial Differences in Eco-Efficiency of Cities in Shandong Province

To further explore the influencing factors of spatial differences in urban eco-efficiency, the analysis was carried out using quantile regression, and the regression results are presented in Table 6. On the one hand, the changes in the coefficients of the influencing factors in the same region and at different quartile levels explain the overall spatial and intraregional differences in urban eco-efficiency in Shandong Province to a certain extent; on the other hand, the changes in the coefficients of the influencing factors in the same quartile level and in different regions explain the interregional differences in urban eco-efficiency in Shandong Province to a certain extent.
(1)
The coefficients for the level of economic development are significant at most quantile levels, indicating that the level of economic development has a significant effect on the dependent variable, and the level of eco-efficiency improves by 24% when the level of economic development is increased by 1% at the 0.2 quantile level, and by 64% at a quantile of 0.8. From quartile 0.2, the level of economic development leads to a significant increase in eco-efficiency, and the effect of the level of economic development on eco-efficiency is smoother in the process from quartile 0.5 to 0.6. The level of economic development from the 0.2 quantile can have a favorable impact on ecological efficiency and is rising, indicating that it plays a positive role in ecological efficiency. While industrial structure is in a downward trend from the interquartile 0.2–0.6 range, 0.6–0.8 shows an upward trend, indicating that the continuous transformation of industrial structure gradually turns the impact on eco-efficiency from a negative to a positive one. At the 0.2 quantile level, the level of eco-efficiency increases by 4% when the industrial structure is raised by 1%, and by 1% when the quantile is 0.8. The relationship between literacy and education and the dependent variable is positive at most quantile levels. This means that an increase in literacy level leads to an increase in the dependent variable. However, at some quantile levels, the coefficient of literacy level is not significant. The relationship between the level of scientific and technological development and the dependent variable is also negative at most quantile levels, meaning that an increase in the level of scientific and technological development leads to a decrease in the dependent variable. However, at some quartile levels, the coefficient on the level of S&T development is not significant.
(2)
As we move from the lower to upper quantiles, the influence coefficient of technological innovation of the three economic circles decreases, which to a certain extent contributes to the reduction in the differences in urban eco-efficiency within the three economic circles. The influence coefficients of industrial structure and economic development level within different regions increase with the increase in the quantile points. The optimization of the urban industrial structure and the development of economic technology are the key factors for the improvement of eco-efficiency, and the construction of environmentally friendly pillar industries and the promotion of economic and technological development are conducive to urban eco-development.
(3)
The intensity of the impact of different factors on ecological benefits varies across different regions. For example, the influence of public environmental awareness differs significantly between the Lunan Economic Circle and the Jiaodong Economic Circle in Shandong Province. This disparity leads to a widening gap in ecological efficiency between these two areas. In summary, the intensity of different influencing factors on urban ecological efficiency varies across regions, resulting in varying levels of improvement in efficiency. This, to some extent, explains the regional disparities in urban ecological efficiency mentioned earlier.

6. Conclusions

In this paper, the spatial compactness and eco-efficiency of 16 cities in Shandong Province are studied in depth, and the inverse S-type circle decreasing law of the distribution of urban factor density and the developable space of urban centers are revealed through circle gradient analysis and other methods. Meanwhile, this paper measures the eco-efficiency of cities in Shandong Province based on the super-efficient SBM model with non-expected outputs, and explores its evolution trend and response law. Compared with previous studies, the highlights of this paper are the following:
First, this paper conducts a comprehensive study on both spatial structure and eco-efficiency of cities in Shandong Province, analyzing the relationship between the two and their influencing factors in depth. This comprehensive research method is rare in previous studies. Secondly, this paper adopts a variety of methods, such as Gini coefficient, quantile regression, and linear regression, to explore the evolutionary trend of urban compactness and eco-efficiency, and to analyze the situation that different influencing factors play different roles in the size and direction of each economic circle. This multi-angle and multi-dimensional research method makes the findings of this paper more comprehensive and accurate. And the following conclusions are drawn:
(1)
During the sample examination period, the density distribution of factors in cities in Shandong Province generally conforms to the inverse S-type circle decreasing law. The density distribution curves of the cities in Shandong Province show the trend of inverse S-type decreasing from the city center to the outside. Specifically, the slopes of the curves in Qingdao and Jinan are larger, showing a fast decreasing and irregular trend, respectively. The curve of Laiwu city does not change much, probably due to the size of the city form and the overly centralized distribution of industries. The slopes of the density distribution curves of Heze city and Zaozhuang city have gradually increased in recent years, indicating that the urban centers are developing rapidly while the non-central areas are developing relatively slowly. The curve for Rizhao city, on the other hand, shows a slow decline followed by a rapid decline, indicating that urban resources are mainly concentrated in the center and the areas around the center, while the development of peripheral areas of the city is relatively lagging behind. Cities such as Qingdao and Yantai show small fluctuations of local bulges at different distances from the city center, reflecting the existence of localized agglomeration of urban elements outside the city center and sub-centers. These findings indicate that there are differences in the spatial development of cities in Shandong Province, but the overall trend is decreasing from the urban center outward. This has some guiding significance for urban planning and resource allocation.
(2)
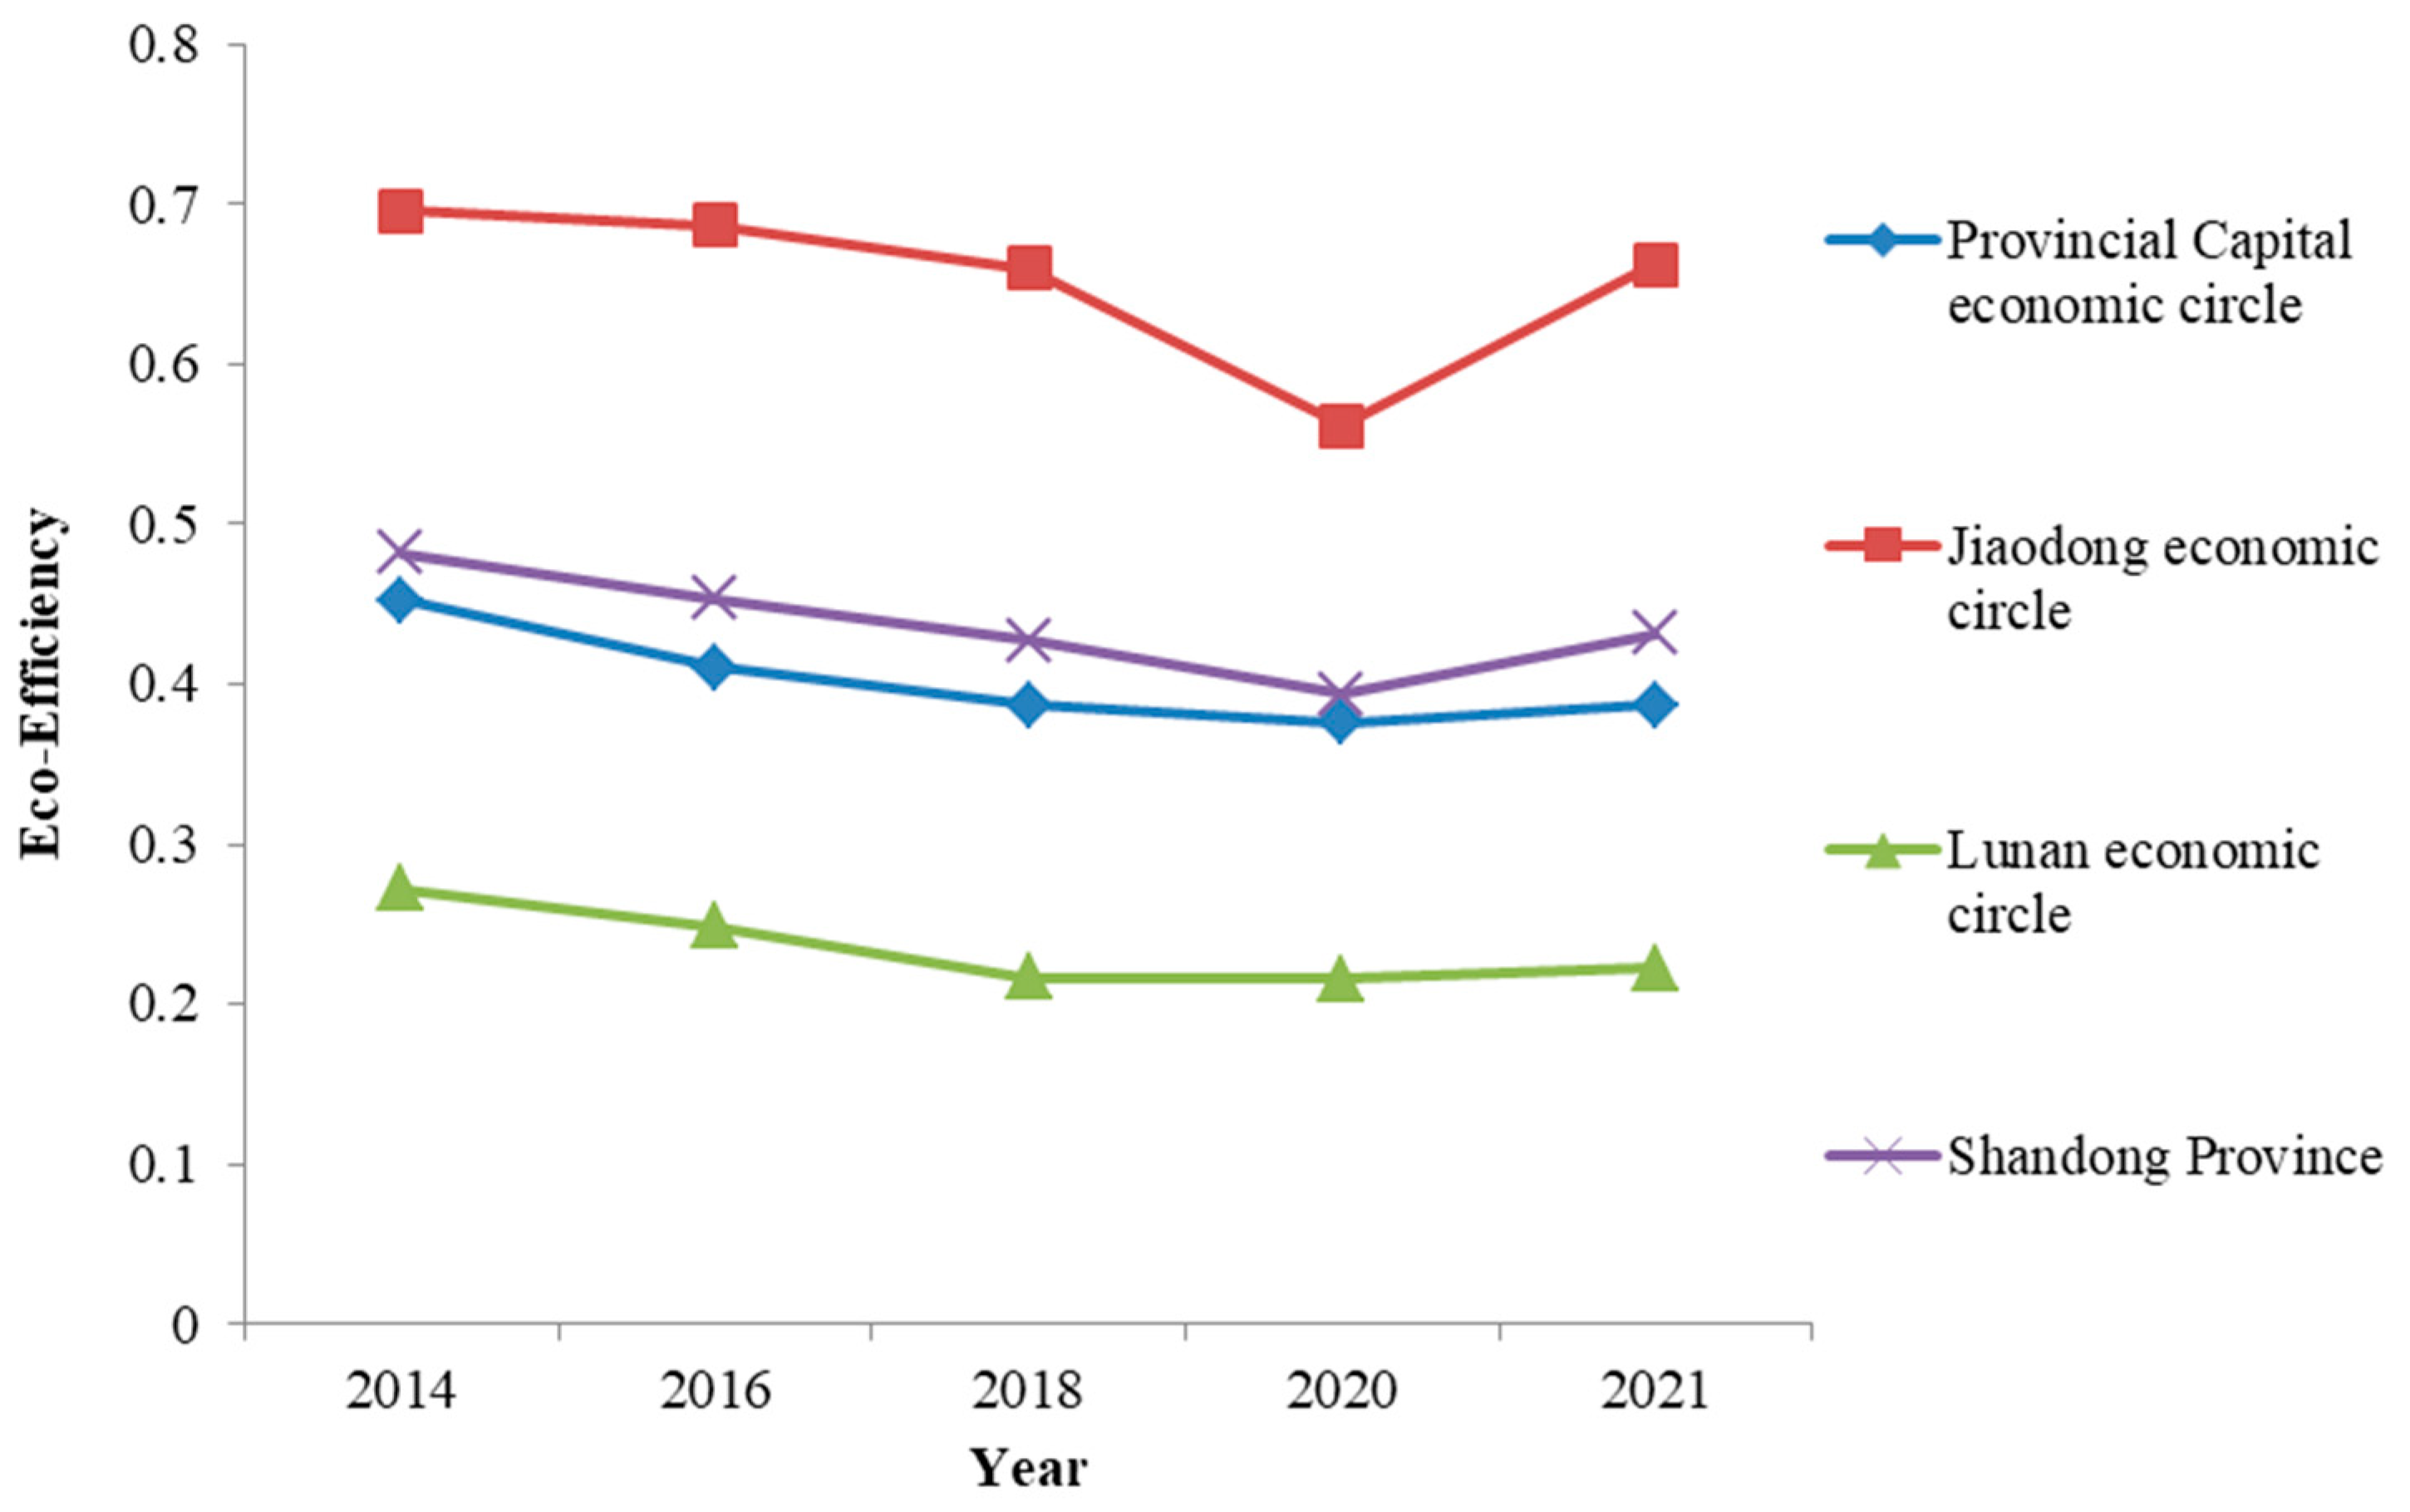
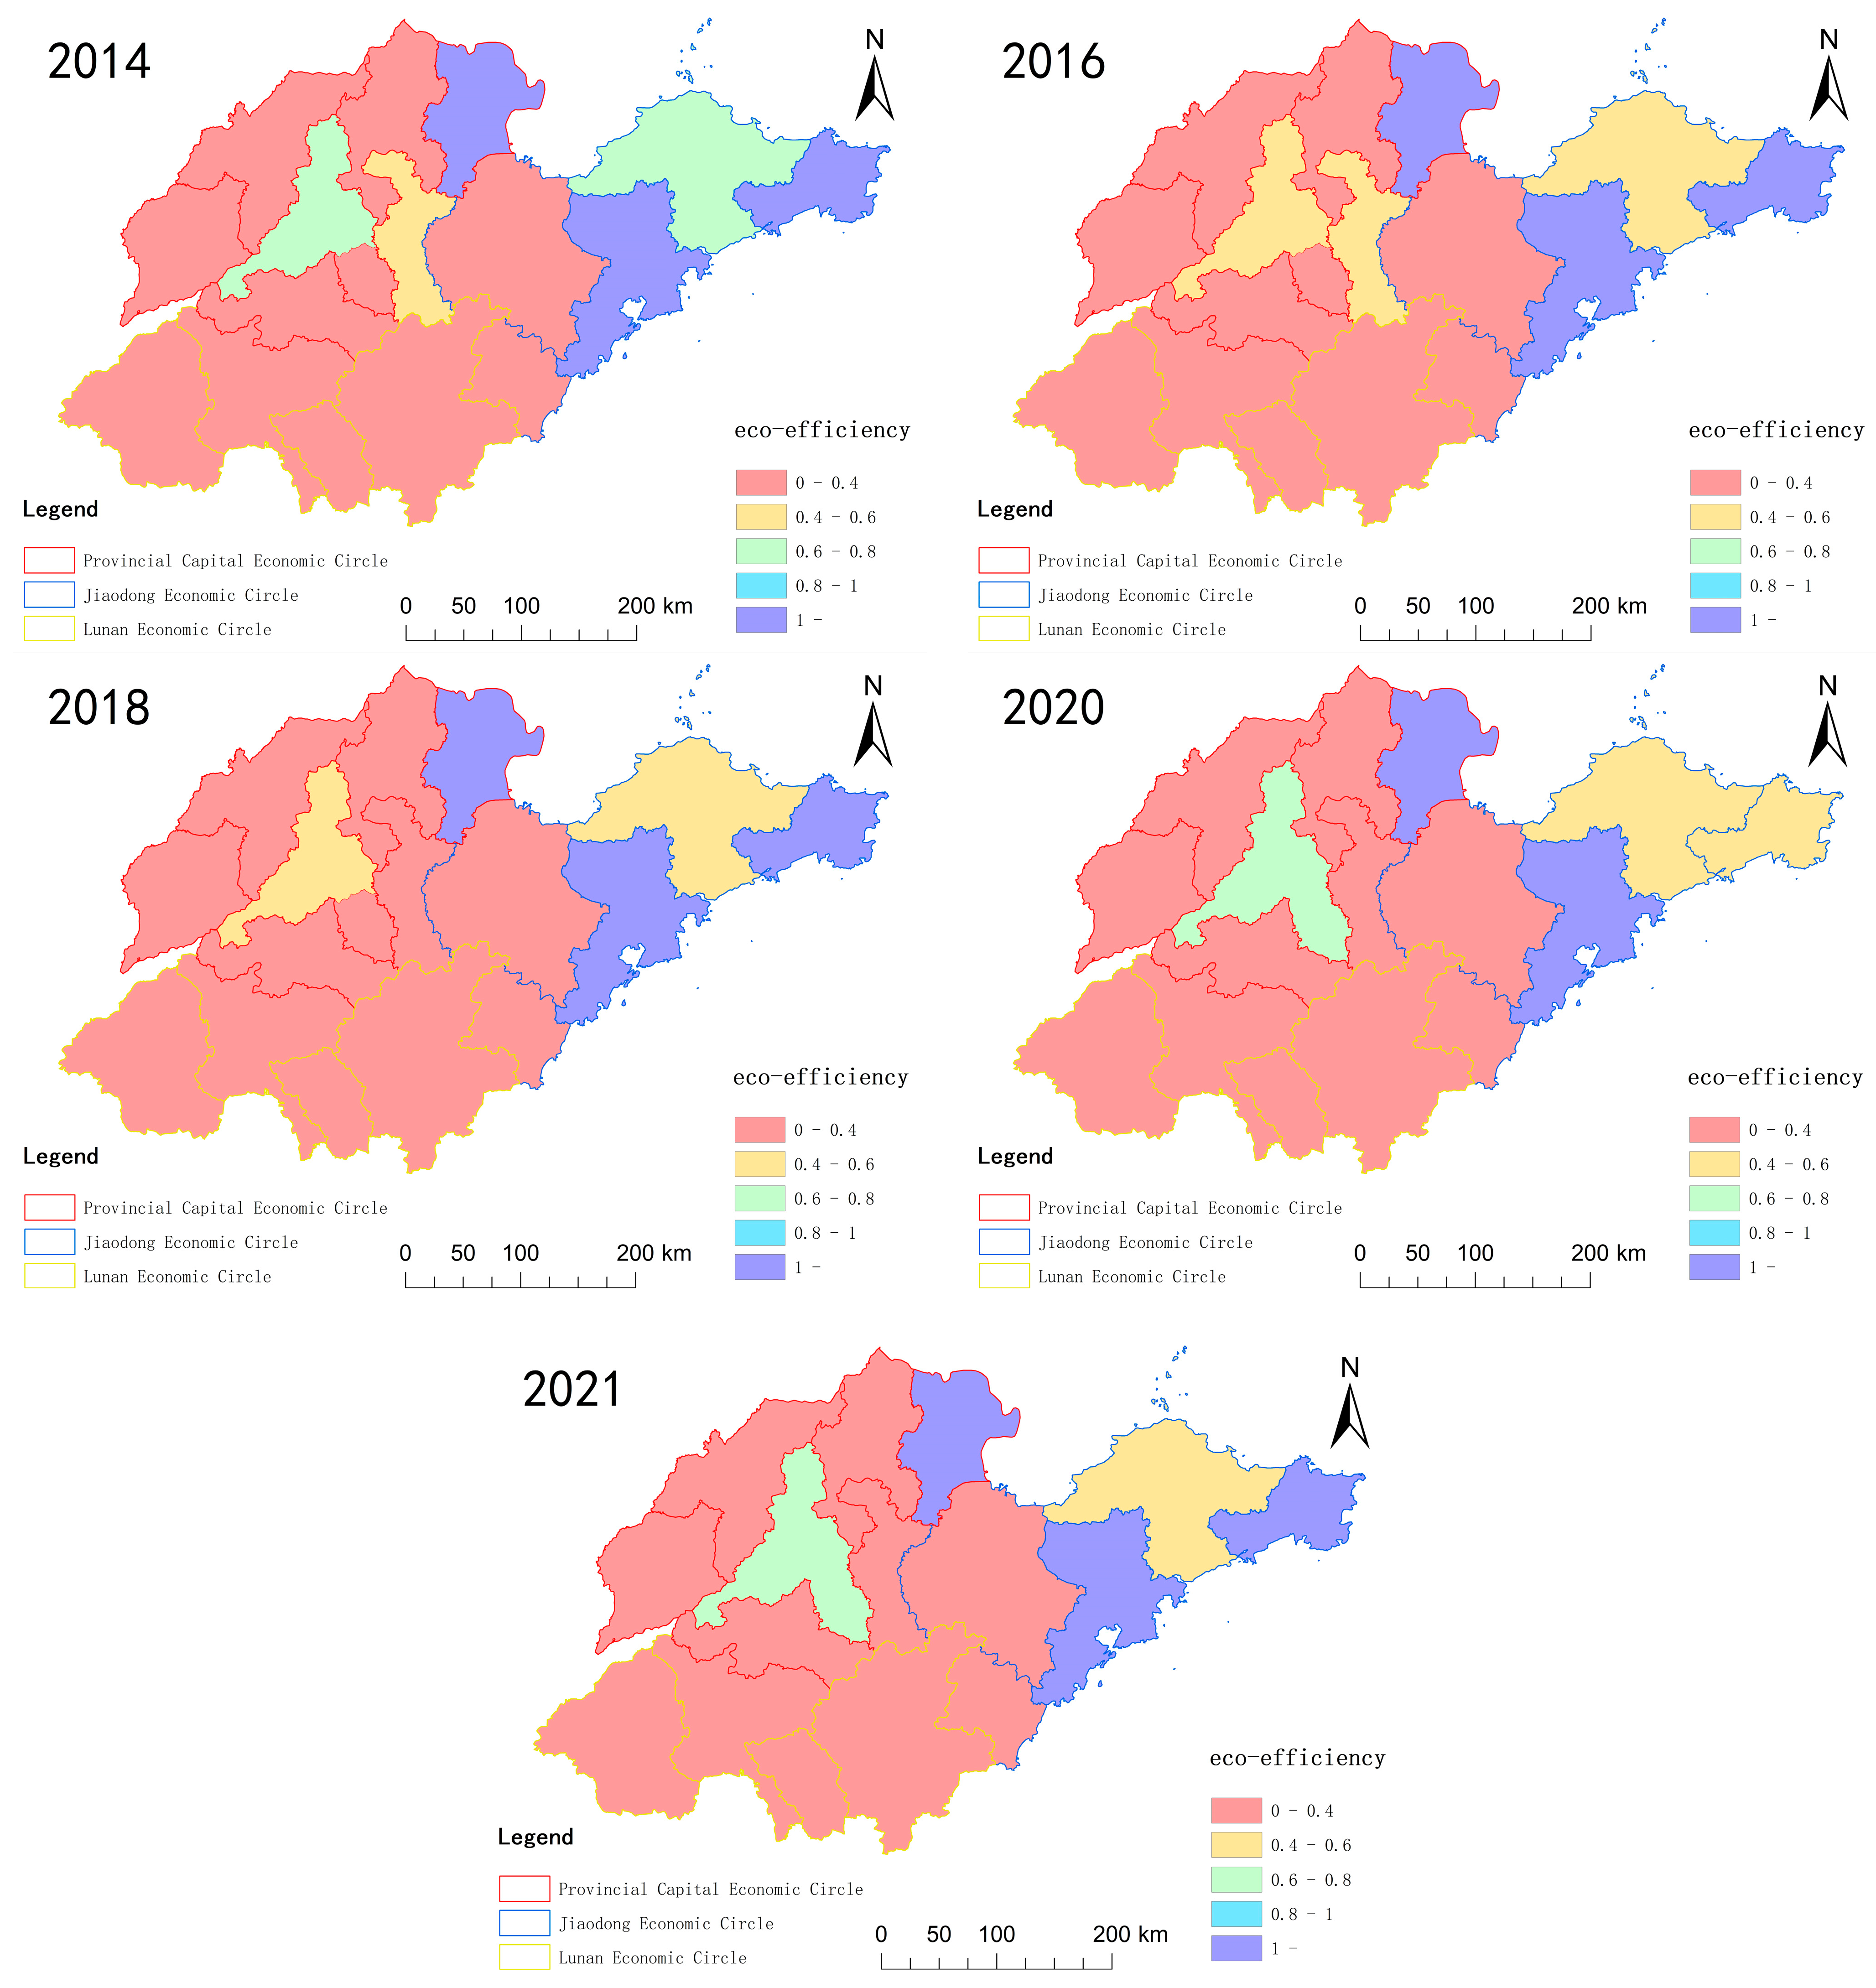
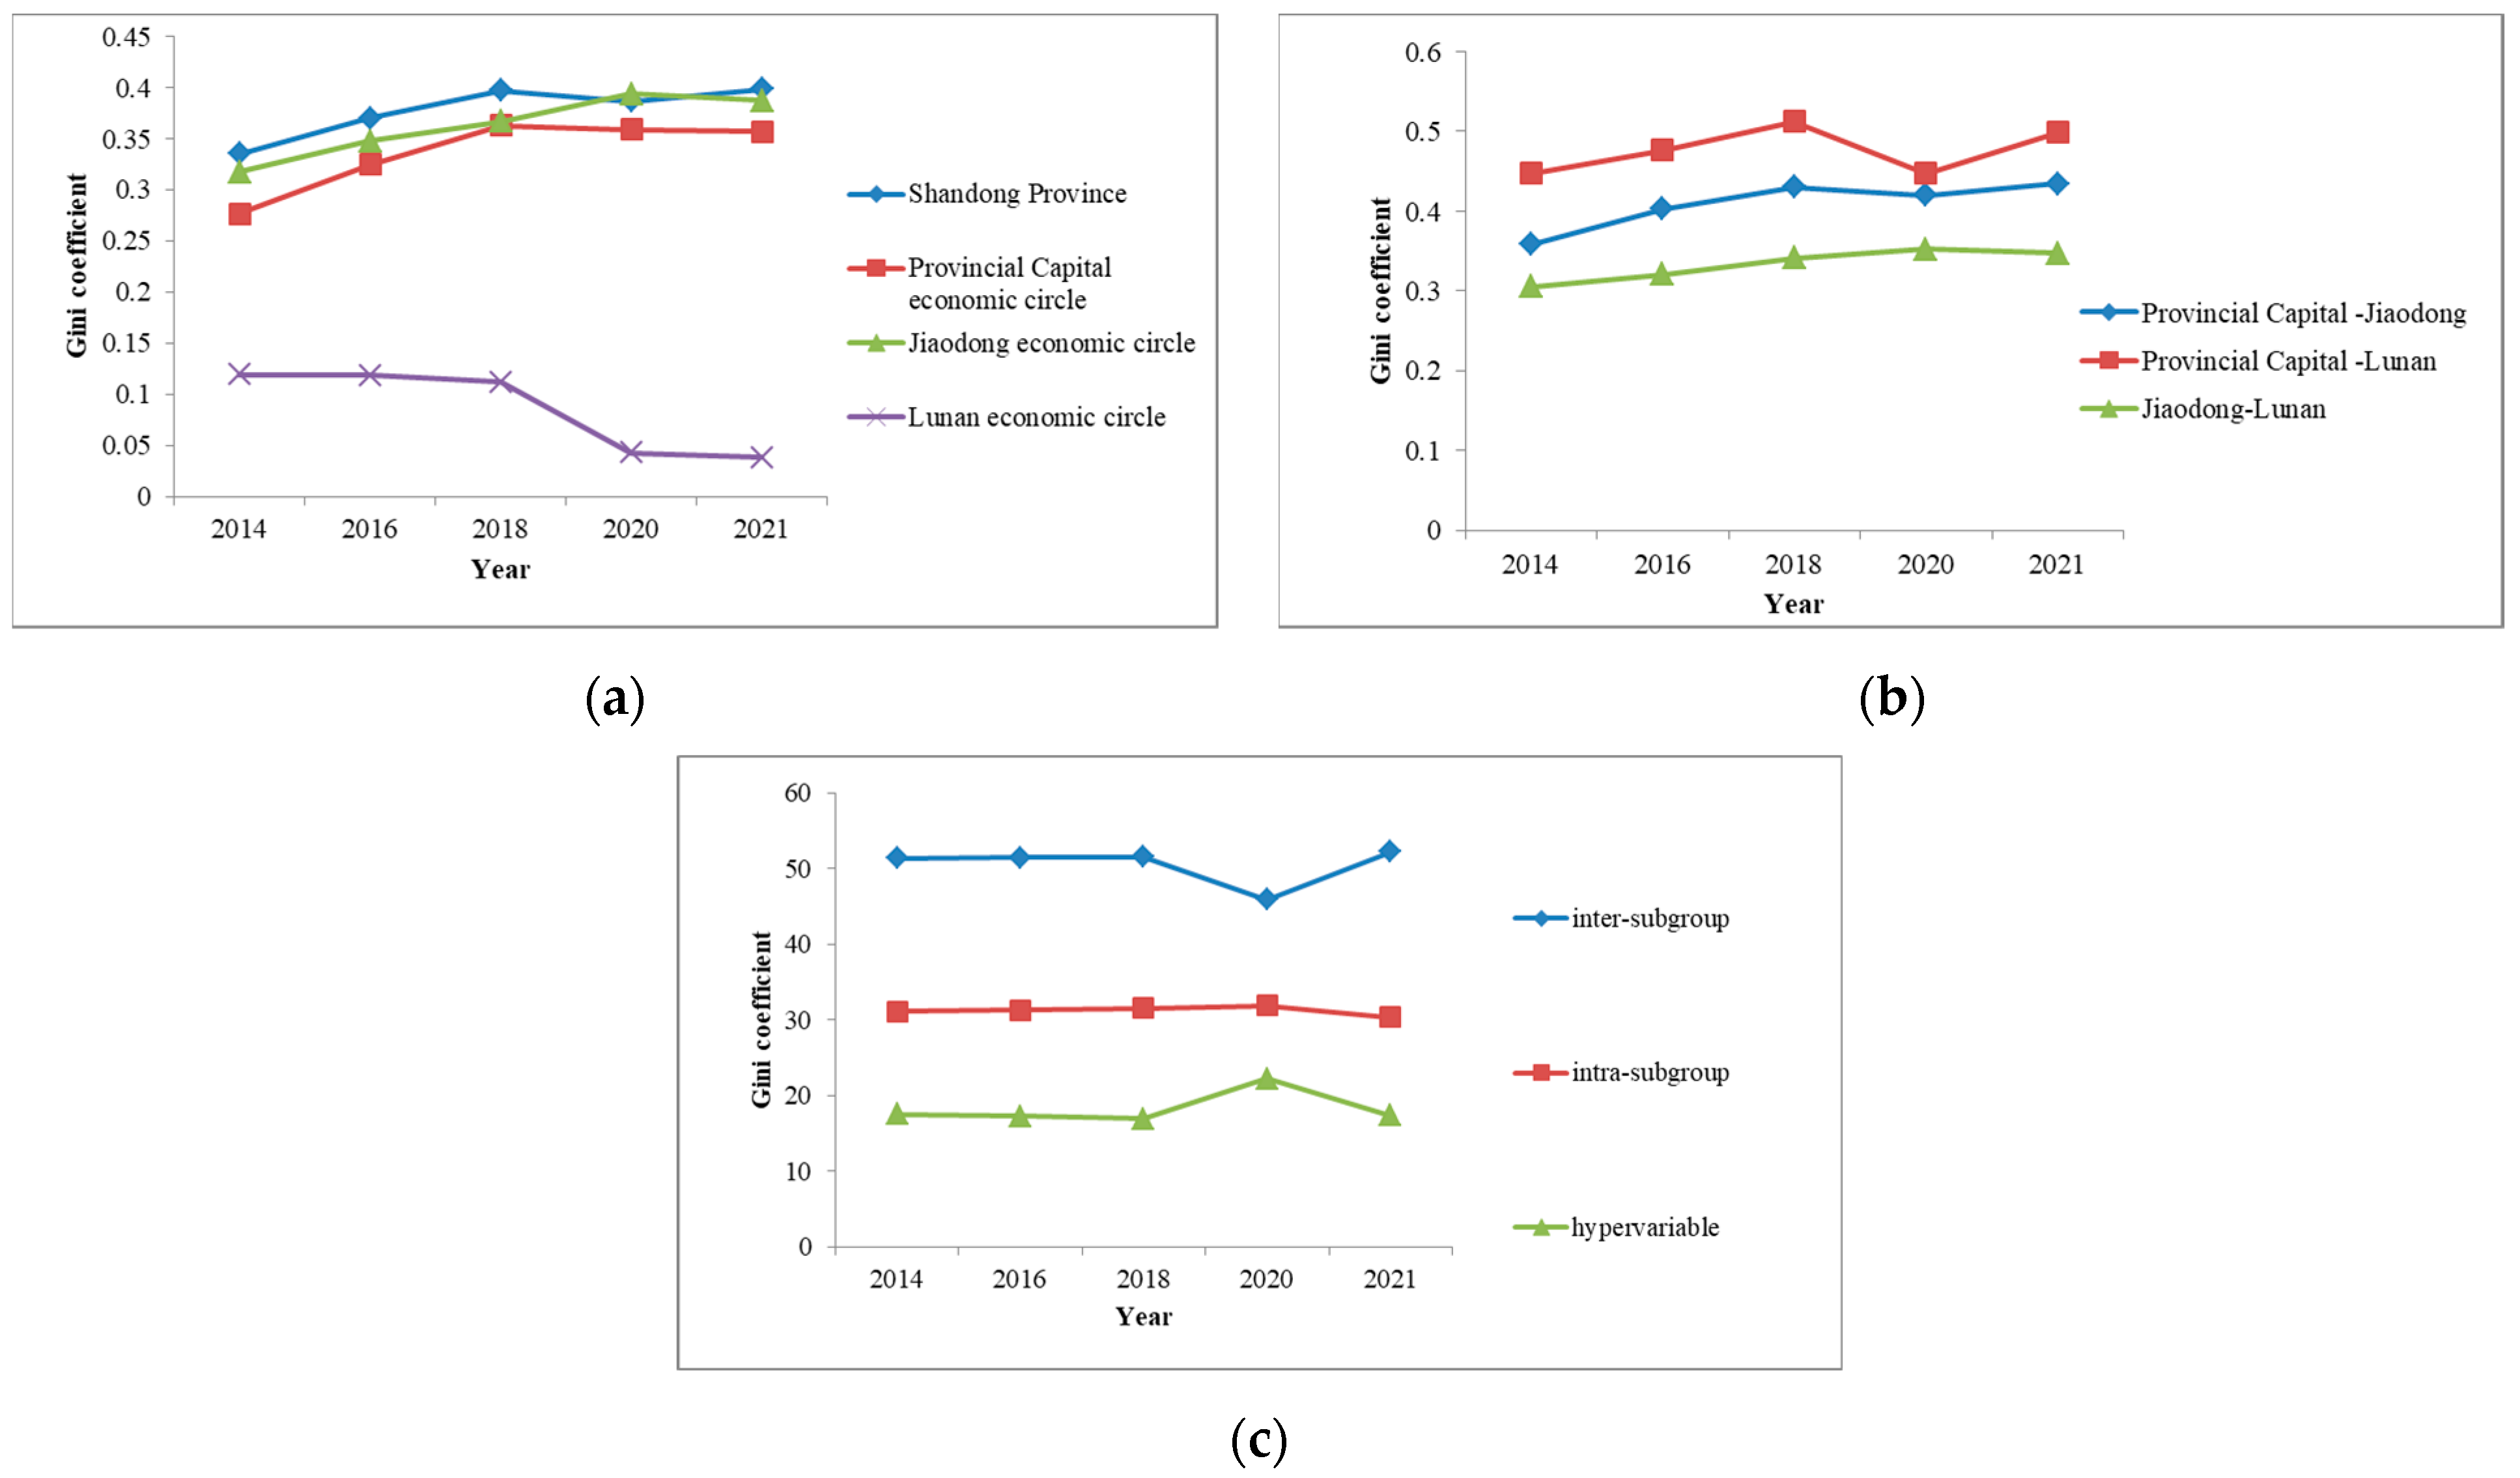
The level of urban eco-efficiency decreases and then rises, the eco-efficiency level of the Jiaodong Economic Circle is significantly higher than that of the provincial capital and Lunan Economic Circle, and the distribution of eco-efficiency shows a clear trend of high in the east and low in the west. The eco-efficiency level decreases year by year from 2014 to 2020 and then picks up in 2021. The relative difference in eco-efficiency between the economic centers increases year by year. The difference in eco-efficiency among cities in the Jiaodong Economic Circle is always the largest, the interregional difference between Lunan and the provincial capital is the largest, and the mechanism of interregional synergistic development is imperfect.
(3)
As urban compactness increases, eco-efficiency in Shandong Province shows a decreasing and then increasing trend. This may be due to the concentration of resources, increased environmental congestion and pollution in the early stages of the city, as well as the ecological damage caused by industrial industries. However, with the expansion of urban scale, economic and social development, and transformation of industrial structure, urban agglomerations tend to become polycentric, and large cities are able to share and recycle public resources and protect the environment through technological advances. However, overcrowded urban environments can lead to duplication of construction and high maintenance costs, as well as waste of resources due to low costs. We also draw some new conclusions from the study results:
There are significant differences in the development patterns of the cities. Cities such as Heze and Zaozhuang show a clear “centripetal” distribution, where urban development is more concentrated in the central region, while the development of non-central regions is relatively slow. The curves of multi-center cities such as Qingdao and Jinan have obvious ups and downs, indicating that the cities as a whole are characterized by multi-center synergistic development.
Urban compactness and eco-efficiency show a certain correlation. With the increase in urban compactness, the ecological efficiency shows a decreasing-rising-decreasing trend. At first, the urban production mode was rough and the environment was damaged. With the urban economic development and industrial structure transformation, the city began to pay attention to environmental protection, and the ecology was effectively restored and maintained. However, with the development of the city to a certain extent, the population and industry are too concentrated, and the low cost and duplicated production lead to the waste of resources and environmental pollution, making the ecological environment deteriorate again.
There are regional differences in the role of different influencing factors on urban eco-efficiency. The regression coefficients of factors such as the level of economic development and culture and education rise as the quantile point increases, leading to an increase in the overall spatial differences and the differences within each region. There are differences in the magnitude and direction of the effects of the influencing factors in different economic zones, and this finding explains, to some extent, the interregional differences in urban eco-efficiency.
In the process of research, certain limitations are found in this study, which can be used as a direction for further development of future research. Firstly, the results of the study in the urban compactness section are obviously in error, and it is speculated that the error is due to the polycentricity of cities as well as the irregular expansion of cities. In future studies, the circles are decomposed into multiple directions and calculated separately to reduce the interference. Second, in the study of the relationship between urban spatial structure and eco-efficiency response, the linear regression does not show the complete relationship between the two. It is hoped that more data will be obtained and corresponding regression formulas will be constructed for fitting in subsequent studies.

Author Contributions

Conceptualization, M.Y. and S.X.; methodology, S.X.; software, S.X.; validation, S.X., M.Y. and H.X.; formal analysis, H.X.; investigation, F.Z.; resources, M.Y.; data curation, S.X.; writing—original draft preparation, S.X. and M.Y.; writing—review and editing, M.Y.; visualization, S.X.; supervision, M.Y.; project administration, M.Y.; funding acquisition, M.Y. All authors have read and agreed to the published version of the manuscript.

Funding

This research was funded by the China National Key R&D Program during the 13th Five-year Plan Period, grant number 2019YFD1100800 and the National Natural Science Foundation of China, grant number 41801308.

Institutional Review Board Statement

Not applicable.

Informed Consent Statement

Not applicable.

Data Availability Statement

POI data are obtained according to the API interface provided by Amap. The data on nighttime light are openly available in the Earth Observation Group at https://eogdata.mines.edu/products/vnl/#annual_v2 (accessed on 30 June 2023). Other city-level data are obtained from the Shandong Statistical Yearbook (2015–2022).

Acknowledgments

The authors appreciate the useful discussion of editors and reviewers.

Conflicts of Interest

The authors declare no conflict of interest.

References

  1. Guozhu, L.; Liqi, W. Study of regional variations and convergence in ecological resilience of Chinese cities. Ecol. Indic. 2023, 154, 110667. [Google Scholar]
  2. Yan, Y.; Wang, X.; Zhao, S.; Zhang, Y. Spatial structure and influencing factors of regional city supply networks in manufacturing: A case study of Shandong, China. Front. Environ. Sci. 2023, 11, 131. [Google Scholar]
  3. Han, X.; Qu, P.; Wu, J.; Su, B.; Qiu, N.; Zhang, L. Research on the Spatial Pattern of Carbon Emissions and Differentiated Peak Paths at the County Level in Shandong Province, China. Sustainability 2023, 15, 13520. [Google Scholar] [CrossRef]
  4. Xiaoming, W.; Bocheng, C.; Qianqian, D. The Limit of Urban Land Expansion Based on Population Growth and Economic Development: A Case Study of Shandong Province in China. Sustainability 2022, 15, 73. [Google Scholar]
  5. Pan, F.; Sun, Y.; Jiang, N.; Jian, Z.; Mei, Y.; Liu, Q. Analysis of the Coordination of Built-Up Area Expansion and Population Growth in the Shandong Peninsula Urban Agglomeration. Sustainability 2023, 15, 7763. [Google Scholar] [CrossRef]
  6. Zhao, C.; Geng, R.; Liu, J.; Peng, L.; Yamaka, W. Spatiotemporal Evolution and Driving Factors of Land Development: Evidence from Shandong Province, China. Sustainability 2023, 15, 15069. [Google Scholar] [CrossRef]
  7. Yang, L.; Zhang, B.; Zhang, X.; Zhang, S.; Yin, L. Exploring the spatial correlation between accessibility to urban vibrancy centers and housing price from a time-dynamic perspective. GISci. Remote Sens. 2023, 60, 2232191. [Google Scholar]
  8. Wang, J.; Zhang, J.; Zhao, Y.; Sun, S.; Wang, X.; He, X.; You, L. Distribution and pollution assessment of marine debris off-shore Shandong from 2014 to 2022. Mar. Pollut. Bull. 2023, 195, 115470. [Google Scholar]
  9. Huang, Z.; Wei, W.; Han, Y.; Ding, S.; Tang, K. The Coupling Coordination Evolutionary Analysis of Tourism-Ecological Environment-Public Service for the Yellow River Basin of China. Int. J. Environ. Res. Public Health 2022, 19, 9315. [Google Scholar] [CrossRef]
  10. Ranran, L.; Ziyuan, D.; Yan, A. Examination and Forecast of Relationship among Tourism, Environment, and Economy: A Case Study in Shandong Province, China. Int. J. Environ. Res. Public Health 2022, 19, 2581. [Google Scholar]
  11. Wang, S.; Hou, D.; Xing, H. A self-supervised-driven open-set unsupervised domain adaptation method for optical remote sensing image scene classification and retrieval. IEEE Trans. Geosci. Remote Sens. 2023, 61, 5605515. [Google Scholar]
  12. Xing, H.; Niu, J.; Feng, Y.; Hou, D.; Wang, Y.; Wang, Z. A coastal wetlands mapping approach of Yellow River Delta with a hierarchical classification and optimal feature selection framework. Catena 2023, 223, 106897. [Google Scholar]
  13. Xing, H.; Zhu, L.; Chen, B.; Zhang, L.; Hou, D.; Fang, W. A novel change detection method using remotely sensed image time series value and shape based dynamic time warping. Geocarto Int. 2022, 37, 9607–9624. [Google Scholar] [CrossRef]
  14. Hou, D.; Wang, S.; Tian, X.; Xing, H. PCLUDA: A pseudo-label consistency learning-based unsupervised domain adaptation method for cross-domain optical remote sensing image retrieval. IEEE Trans. Geosci. Remote Sens. 2022, 61, 5600314. [Google Scholar] [CrossRef]
  15. Cai, J.; Huang, B.; Song, Y. Using multi-source geospatial big data to identify the structure of polycentric cities. Remote Sens. Environ. 2017, 202, 210–221. [Google Scholar]
  16. Kai, Z.; Manya, T.; Yingcheng, L. Did Polycentric and Compact Structure Reduce Carbon Emissions? A Spatial Panel Data Analysis of 286 Chinese Cities from 2002 to 2019. Land 2022, 11, 185. [Google Scholar]
  17. Zuoqi, C.; Qianyu, L.; Hua, S. Do the urban polycentricity and dispersion affect multisectoral carbon dioxide emissions? A case study of 95 cities in southeast China based on nighttime light data. Int. J. Digit. Earth 2023, 16, 4867–4884. [Google Scholar]
  18. Feng, J.; Hou, H. Review of Research on Urban Social Space and Sustainable Development. Sustainability 2023, 15, 16130. [Google Scholar] [CrossRef]
  19. Wu, Y.; Shi, K.; Cui, Y.; Liu, S.; Liu, L. Differentiated effects of morphological and functional polycentric urban spatial structure on carbon emissions in China: An empirical analysis from remotely sensed nighttime light approach. Int. J. Digit. Earth 2023, 16, 532–551. [Google Scholar] [CrossRef]
  20. Zhu, Z.; Zhu, X.; Li, S. Evolution and characteristics of spatial structure of urban agglomerations in the middle reaches of the Yangtze River. Acta Geogr. Sin. 2021, 76, 799–817. [Google Scholar]
  21. Jinqun, W.; Nuoya, W. Spatial structure and evolutionary logic of urban agglomerations based on remote sensing data. Phys. Chem. Earth 2023, 132, 103478. [Google Scholar]
  22. Li, J.; Qian, Y.; Zeng, J.; Yin, F.; Zhu, L.; Guang, X. Research on the Influence of a High-Speed Railway on the Spatial Structure of the Western Urban Agglomeration Based on Fractal Theory—Taking the Chengdu–Chongqing Urban Agglomeration as an Example. Sustainability 2020, 12, 7550. [Google Scholar] [CrossRef]
  23. Lan, F.; Da, H.; Wen, H.; Wang, Y. Spatial Structure Evolution of Urban Agglomerations and Its Driving Factors in China’s mainland: From the Monocentric to the Polycentric Dimension. Sustainability 2019, 11, 610. [Google Scholar]
  24. Wang, Y.; Yang, M.; Xia, Y. Estimation of building density in Chenggong District based on Luojia No.1 and OSM data. Surv. Mapp. Spat. Geogr. Inf. 2023, 46, 17–20, 25. [Google Scholar]
  25. Cao, S.; Hu, D.; Hu, Z.; Zhao, W.; Chen, S.; Yu, C. Comparison of spatial structures of urban agglomerations between the Beijing-Tianjin-Hebei and Boswash based on the subpixel-level impervious surface coverage product. J. Geogr. Sci. 2018, 28, 306–322. [Google Scholar] [CrossRef]
  26. Jincheng, Y.; Xinqu, X.; Mu, Z. A Study on Economic Spatial Structure of Urban Agglomerations in Guangdong-Hong Kong-Macao Greater Bay Area. Int. J. Bus. Manag. 2018, 13, 55686288. [Google Scholar]
  27. Zheng, W.; Du, N.; Yang, Y. Multifractal characteristics of spatial structure of urban agglomerations in the middle reaches of the Yangtze River. Acta Geogr. Sin. 2022, 77, 947–959. [Google Scholar]
  28. Wu, D.; Lie, Y.; Liu, L.; Cheng, Z.; Zhang, Y.; Yang, Y.; Wang, Z. City-level environmental performance and the spatial structure of China’s three coastal city clusters. J. Clean. Prod. 2023, 422, 138591. [Google Scholar] [CrossRef]
  29. Wang, S.; Xia, M.; Cheng, W.; Li, Y.; Hou, B. Urban Spatial Structure and Green Innovation in China. J. Urban Plan. Dev. 2023, 149, 4023023. [Google Scholar]
  30. Dayu, L.; Yongda, H.; Qiaoru, W. Urban spatial structure evolution and smog management in China: A re-examination using nonparametric panel model. J. Clean. Prod. 2020, 285, 124847. [Google Scholar]
  31. Binbin, Y. Urban spatial structure and total-factor energy efficiency in Chinese provinces. Ecol. Indic. 2021, 126, 107662. [Google Scholar]
  32. Wang, Y.; An, L.; Chen, H.; Zhao, Y. Spatial Correlation and Influencing Factors of Tourism Eco-Efficiency in the Urban Agglomeration of the Yangtze River Delta Based on Social Network Analysis. Land 2022, 11, 2089. [Google Scholar] [CrossRef]
  33. Jie, Z.; Yajing, W.; Jiangfeng, L. Maximize Eco-Economic Benefits with Minimum Land Resources Input: Evaluation and Evolution of Land Use Eco-Efficiency of Agglomerations in Middle Reaches of Yangtze River, China. Int. J. Environ. Res. Public Health 2023, 20, 1985. [Google Scholar]
  34. Feng, Y.; Zhang, Y.; Wu, Z.; Ye, Q.; Cao, X. Evaluation of Agricultural Eco-Efficiency and Its Spatiotemporal Differentiation in China, Considering Green Water Consumption and Carbon Emissions Based on Undesired Dynamic SBM-DEA. Sustainability 2023, 15, 3361. [Google Scholar] [CrossRef]
  35. Yimin, W.; Abdul, R.R.; Qiuju, Y. Analysis of the spatial characteristics and influencing factors of agricultural eco-efficiency: Evidence from Anhui Province, China, during the period 2011–2018. Environ. Monit. Assess. 2022, 194, 154. [Google Scholar]
  36. Feng, S.; Kong, Y.; Liu, S.; Zhou, H. Spatiotemporal Pattern and Convergence Test of Energy Eco-Efficiency in the Yellow River Basin. Int. J. Environ. Res. Public Health 2023, 20, 1888. [Google Scholar] [PubMed]
  37. Bin, Y.; Zuo, Z.; Hui, W. Detection and attribution of changes in agricultural eco-efficiency within rapid urbanized areas: A case study in the Urban agglomeration in the middle Reaches of Yangtze River, China. Ecological Indicators 2022, 144, 109533. [Google Scholar]
  38. Sala-Garrido, R.; Mocholi-Arce, M.; Maziotis, A.; Molinos-Senante, M. The carbon and production performance of water utilities: Evidence from the English and Welsh water industry. Struct. Chang. Econ. Dyn. 2023, 64, 292–300. [Google Scholar] [CrossRef]
  39. Yuewei, W.; Xinyang, W. The spatial pattern and influencing factors of tourism eco-efficiency in Inner Mongolia, China. Front. Public Health 2022, 10, 1072959. [Google Scholar]
  40. Liu, Y.; Gong, R.; Ye, W.; Jin, C.; Tang, J. Urban Spatial Structure and Water Ecological Footprint: Empirical Analysis of the Urban Agglomerations in China. Sustainability 2022, 14, 13960. [Google Scholar] [CrossRef]
  41. Su, H.; Yang, J. Research on the Influence of Spatial Structure on Carbon Emission Synergy of Urban Agglomeration—Based on the Development Process of Yangtze River Delta Urban Agglomeration in China. Sustainability 2023, 15, 9178. [Google Scholar]
  42. Wang, Y.; Niu, Y.; Li, M.; Yu, Q.; Chen, W. Spatial structure and carbon emission of urban agglomerations: Spatiotemporal characteristics and driving forces. Sustain. Cities Soc. 2022, 78, 103600. [Google Scholar]
  43. Shijin, W.; Mengya, L. Impact of spatial structure of urban agglomerations on PM2.5 pollution: Based on resource misallocation. Heliyon 2023, 9, e14099. [Google Scholar]
  44. Teng, F.; Wang, Y.; Wang, M. Spatial and temporal coupling between urban spatial form and carbon budget in the Yangtze River Delta urban agglomeration. Acta Ecol. Sin. 2022, 42, 9636–9650. [Google Scholar]
  45. Zhang, Z.; Zhang, T.; Feng, D. China’s carbon intensity of regional differences, the dynamic evolution and convergence study. J. Quant. Tech. Econ. 2022, 33, 67–87. [Google Scholar]
  46. Guo, S. Study on Coupling and Coordination of Ecosystem Health and Urbanization in the Yellow River Basin; China University of Mining and Technology: Xuzhou, China, 2022. [Google Scholar]
  47. Zeng, Z.; Ye, Q. Research progress on the coupling of green space and urban spatial structure. Chin. Urban For. 2022, 20, 131–136. [Google Scholar]
  48. Wan, L.-L.; Liu, C.; Zheng, R. The ecological efficiency of local government fiscal competition spatial spillover effect. J. Econ. Manag. Rev. 2020, 4, 148–160. [Google Scholar]
  49. Wang, C.; Han, A.; Gong, W.; Zhao, M.; Li, W. Threshold Effect of Manufacturing Agglomeration on Eco-Efficiency in the Yellow River Basin of China. Sustainability 2023, 15, 14151. [Google Scholar] [CrossRef]
  50. Zhang, C.; Liu, F.; Liu, C.; Tian, G. Data-driven low-carbon transformation management for manufacturing enterprises: An eco-efficiency perspective. Environ. Sci. Pollut. Res. Int. 2023, 30, 102519–102530. [Google Scholar] [CrossRef]
  51. Liu, Y.; Tian, L.; Wang, Z.; He, P.; Li, M.; Wang, N.; Yu, Y. Spatial–Temporal Evolution of Interprovincial Ecological Efficiency and Its Determinants in China: A Super-Efficiency SBM Model Approach. Sustainability 2023, 15, 13864. [Google Scholar]
  52. Fang, X.; Tian, S.; Wang, X. Analysis of the spatial effect of fiscal decentralization and industrial agglomeration on urban eco-efficiency: An empirical study based on the spatial Durbin panel model. Urban Probl. 2020, 62–71. [Google Scholar] [CrossRef]
  53. Peng, H.; Guo, L.; Zhang, J. Research progress and implication of the relationship between regional economic growth and resource-environmental pressure. Resour. Sci. 2020, 42, 593–606. [Google Scholar] [CrossRef]
  54. Zheng, H.; Jia, S.; Zhao, X. An analysis of regional eco-efficiency in China under the background of new-type urbanization. Resour. Sci. 2017, 39, 1314–1325. [Google Scholar]
  55. Bimonte, S.; Stabile, A. Land consumption and income in Italy: A case of inverted EKC. Ecol. Econ. 2017, 131, 36–43. [Google Scholar]
  56. Lee, S.; Oh, D. Economic growth and the environment in China: Empirical evidence using prefecture level data. China Econ. Rev. 2015, 36, 73–85. [Google Scholar] [CrossRef]
  57. Li, F.; Yan, Q.; Bian, Z.; Liu, B.; Wu, Z. A POI and LST Adjusted NTL Urban Index for Urban Built-Up Area Extraction. Sensors 2020, 20, 2918. [Google Scholar] [CrossRef]
  58. Han, Y.; Wang, W.; Zhang, D. A population spatialization method based on zoning and identification of real residential areas: A case study of Yalong River Basin. J. Mt. 2022, 40, 303–316. [Google Scholar]
  59. Meng, Y.; Zhou, S.; Nie, Y. Spatial Delimitation of the Urban-Rural Fringe Based on POI and Nighttime Light Data: A Case Study of Wuhan City; Geomatics and Information Science of Wuhan University: Wuhan, China, 2023. [Google Scholar]
  60. Liu, S. Research on the determination, dynamic evolution and spatial autocorrelation of the green development level in Hefei metropolitan area. Acad. J. Bus. Manag. 2023, 5, 155–166. [Google Scholar]
  61. Xiong, H.; Yongwang, C.; Chunshan, Z. Evaluation of Polycentric Spatial Structure in the Urban Agglomeration of the Pearl River Delta (PRD) Based on Multi-Source Big Data Fusion. Remote Sens. 2021, 13, 3639. [Google Scholar]
  62. Jiao, L. Urban land density function: A new method to characterize urban expansion. Landsc. Urban Plan. 2015, 139, 26–39. [Google Scholar] [CrossRef]
  63. Jiao, L.; Li, Z.; Xu, G. Distribution characteristics and models of urban spatial agglomeration factors in Wuhan. Acta Geogr. Sin. 2017, 72, 1432–1443. [Google Scholar]
  64. Yu, J. Multi-Dimensional Analysis of Urban Spatial Structure Based on Multi-Source Data. Ph.D. Thesis, Wuhan University, Wuhan, China, 2019. [Google Scholar]
Figure 1. Overview map of the study area.
Applsci 14 00818 g001
Figure 2. Shandong Province city centers.
Applsci 14 00818 g002
Figure 3. Gradient analysis of circle gradients in different types of urban centers. (a) Monocentric city; (b) multi-center city; (c) belt-shaped city.
Applsci 14 00818 g003
Figure 4. Inverse S-equation fitting curves for urban elements in Shandong Province. In the figure, “o” represents the original data, and the curve represents the fitted function curve. The yellow color represents the data from 2014, the purple color represents the data from 2016, the red color represents the data from 2018, the green color represents the data from 2020, and the blue color represents the data from 2021.
Applsci 14 00818 g004aApplsci 14 00818 g004b
Figure 5. Evolution of eco-efficiency in Shandong Province, 2014–2021.
Applsci 14 00818 g005
Figure 6. Spatial distribution pattern of eco-efficiency in Shandong Province, 2014–2021.
Applsci 14 00818 g006
Figure 7. Evolutionary trends of eco-efficiency differences and their contribution in Shandong Province, 2014–2021. (a) Overall and regional differences; (b) regional differences; (c) differential contribution.
Applsci 14 00818 g007
Figure 8. Fitting effect diagram.
Applsci 14 00818 g008
Table 1. Data description table.
VariableUnitMean ValueStandard DeviationMinMax
Labor force10,000 persons360.12165.7884.7722.6
Energy100 million kw × h352.49236.29102.41240.5
Water resource100 million cubic meters12.75.992.823.5
Landhectare175,240.7676,938.4639,567354,460
GDP deflator100 million yuan1089.97662.61198.972977.31
Wastewater10,000 t8893.155304.19121027,101
SO2t35,706.3337,503.442692184,431
Economic development level10,000 yuan/person1.950.510.8083.0499
Industrial structure%46.366.773061.7
Cultural and educational level%2.50.71.34.2
Scientific and technological development level%0.230.140.50.9
Table 2. Compactness indicator K for cities in Shandong Province.
Name20142016201820202021Average K-Value (Outlier
Elimination)
Ji’nan1.13240.41200.49270.27080.25730.35819
Qingdao0.92131.22240.10620.71560.84710.647569
Zibo0.32250.48860.30700.40890.44660.394707
Zaozhuang0.14830.22460.0842−0.03640.03370.122689
Dongying0.47520.37570.31230.35530.27970.359644
Yantai0.36020.3522−5.58070.48010.36310.38891
Weifang−2.5648−0.2496−0.4179−1.66542.142.14
Jining−0.58470.38710.39290.10810.14690.258733
Tai’an−0.0008−0.04980.0400−0.8550−0.35560.04004
Weihai−0.2182−0.27020.3501−0.0596−12.71130.35006
Rizhao0.42680.42380.42070.41010.41190.418652
Laiwu−1.93153.56232.3553 2.958801
Linyi0.1683−0.25440.0335−0.00300.04060.08081
Dezhou0.13460.1050−0.3865−0.0669−1.67490.119798
Liaocheng0.0807−0.0389−0.05480.4892−0.04010.284985
Binzhou−0.0238−0.43160.02220.04150.25330.105666
Heze−0.09670.0592−0.5746−0.6452−1.78840.059192
Table 3. Overall ecological efficiency difference (G) in Shandong Province and the contribution of within-region differences (Gw).
YearShandong ProvinceProvincial Capital
Economic Circle
Jiaodong Economic CircleLunan Economic Circle
20140.335730.277040.317460.11929
20160.370240.325170.347880.11893
20180.39720.363130.366950.11184
20200.386770.35910.393870.042539
20210.398730.357220.387280.038269
Table 4. The contribution of inter-regional differences (Gnb) in ecological efficiency in Shandong Province.
YearProvincial Capital–JiaodongProvincial Capital–LunanJiaodong–Lunan
20140.358410.44730.30512
20160.402770.476540.32027
20180.429990.512360.34065
20200.419470.447330.3524
20210.434520.498110.34696
Table 5. The contribution of super-efficiency density (Gt) in ecological efficiency in Shandong Province.
YearInter-SubgroupIntra-SubgroupHypervariable
201451.358431.09717.5446
201651.445531.311217.2433
201851.491431.541316.9673
202045.8631.915122.2249
202152.239530.372717.3878
Table 6. Quantile regression results.
Quartile 0.2Quartile 0.3Quartile 0.4Quartile 0.5Quartile 0.6Quartile 0.7Quartile 0.8
Jiaodong Economic Circleconst−0.881 (0.551)−1.678 (0.106)−2.384 (0.016 **)−2.798 (0.015 **)−2.06 (0.088 *)−2.157 (0.041 **)−1.812 (0.263)
ln_Per_GDP0.664 (0.279)1.092 (0.035 **)1.346 (0.005 ***)1.12 (0.024 **)1.275 (0.014 **)1.235 (0.008 ***)1.438 (0.022 **)
In_Str−0.006 (0.818)−0.012 (0.580)−0.014 (0.513)0.014 (0.569)−0.004 (0.881)0.006 (0.798)−0.008 (0.814)
Edu_Per 13.693 (0.778)27.291 (0.419)41.967 (0.141)23.382 (0.418)15.507 (0.590)12.004 (0.616)6.077 (0.856)
Res_Per−74.699 (0.577)−111.694 (0.324)−131.697 (0.207)−108.558 (0.356)−79.334 (0.532)−131.62 (0.267)−91.51 (0.625)
0.3310.4090.4640.4940.5530.580.583
const0.216 (NaN)0.206 (0.049 **)0.27 (0.008 ***)0.401 (0.001 ***)0.356 (0.000 ***)0.36 (0.001 ***)0.379 (NaN)
ln_Per_GDP0.116 (NaN)0.125 (0.086 *)0.105 (0.107)0.078 (0.235)0.095 (0.075 *)0.081 (0.072 *)0.044 (NaN)
Lunan Economic CircleIn_Str−0.003 (NaN)−0.004 (0.330)−0.003 (0.384)−0.002 (0.527)−0.002 (0.534)−0.001 (0.731)0.001 (NaN)
Edu_Per−2.228 (NaN)−1.632 (0.683)−2.205 (0.547)−6.168 (0.135)−5.615 (0.105)−6.198 (0.092 *)−8.002 (NaN)
Res_Per40.236 (NaN)40.446 (0.100)8.664 (0.664)18.921 (0.387)13.745 (0.436)14.877 (0.492)15.819 (NaN)
0.5230.4920.510.5630.620.6660.706
const−0.25 (0.137)−0.042 (0.822)−0.295 (0.252)−0.299 (0.295)−0.281 (0.360)−0.23 (0.461)−0.204 (0.515)
ln_Per_GDP0.31 (0.000 ***)0.301 (0.000 ***)0.565 (0.000 ***)0.551 (0.000 ***)0.554 (0.000 ***)0.544 (0.000 ***)0.552 (0.000 ***)
In_Str0.003 (0.218)0.001 (0.619)−0.006 (0.068*)−0.005 (0.187)−0.006 (0.146)−0.005 (0.172)−0.006 (0.150)
Provincial Capital Economic CircleEdu_Per−7.002 (0.038 **)−10.31 (0.012 **)−3.421 (0.529)−2.642 (0.672)−1.002 (0.886)−2.596 (0.710)−2.204 (0.776)
Res_Per−22.531 (0.101)−23.035 (0.069 *)−31.089 (0.034 **)−37.982 (0.028 **)−42.382 (0.022 **)−41.542 (0.031 **)−43.143 (0.054 *)
0.3950.4390.4950.5960.6720.7290.771
const−0.154 (0.156)−0.282 (0.026 **)−0.177 (0.270)−0.413 (0.057 *)−0.34 (0.135)−0.563 (0.071 *)−0.803 (0.092 *)
ln_Per_GDP0.243 (0.000 ***)0.288 (0.000 ***)0.384 (0.000 ***)0.577 (0.000 ***)0.563 (0.000 ***)0.623 (0.000 ***)0.641 (0.000 ***)
Shandong ProvinceIn_Str0.004 (0.020 **)0.004 (0.071 *)−0.002 (0.386)−0.006 (0.087 *)−0.007 (0.100)−0.002 (0.694)0.001 (0.875)
Edu_Per−5.166 (0.062 *)−2.827 (0.379)−0.76 (0.849)4.285 (0.410)3.098 (0.555)2.306 (0.731)5.3 (0.524)
Res_Per−28.84 (0.007 ***)−32.728 (0.004 ***)−37.955 (0.003 ***)−46.599 (0.006 ***)−44.323 (0.010 ***)−54.325 (0.017 **)−17.526 (0.363)
0.2880.3140.3450.4040.4590.4930.525
In the table, ln_Per_GDP refers to ln Per Capita GDP and In_Str refers to Industrial Structure. Edu_Per refers to Education as a Percentage. Res_Per refers to Education as a Percentage. ***, **, and * represent 1%, 5%, and 10% significance levels, respectively.
Disclaimer/Publisher’s Note: The statements, opinions and data contained in all publications are solely those of the individual author(s) and contributor(s) and not of MDPI and/or the editor(s). MDPI and/or the editor(s) disclaim responsibility for any injury to people or property resulting from any ideas, methods, instructions or products referred to in the content.

