Article

Uniaxial Compressive Damage Characteristics of Rock-like Materials with Prefabricated Conjugate Cracks

College of Civil Engineering and Architecture, Zhejiang University of Technology, Hangzhou 310014, China
*
Author to whom correspondence should be addressed.
Appl. Sci. 2024, 14(2), 823; https://doi.org/10.3390/app14020823
Submission received: 30 November 2023 / Revised: 13 January 2024 / Accepted: 16 January 2024 / Published: 18 January 2024

Abstract

:
Joined fractures are an important factor affecting natural rock masses’ mechanical and deformation properties. In this paper, indoor uniaxial compression experiments reproduce prefabricated cracks’ generation, extension, and coalescence in rock-like specimens. For the fractured specimens, a single crack with an inclination of α = 45° was placed on the left and right sides, and a third crack with an angle of β = 30°, 45°, 60°, and 90° to the single crack on the right side was placed in groups III–VI, respectively. All cracks extended in the thickness direction. Vertical pressure was applied at a constant loading rate of v = 0.1 mm/min until the stress dropped dramatically. In addition, numerical calculations were performed on the rock specimens using PFC2D, a sub-module of the Discrete Element Method (DEM). The experimental results agree with the numerical simulations in that the strength of the specimens containing a conjugate crack is significantly reduced, and the mechanical and deformation properties of the specimens are related to the internal angle of the conjugate crack, with the lowest peak strength and lowest percentage energy dissipation at β = 45°.

1. Introduction

Due to the high-pressure mechanical environment of the surrounding rock in deep-buried tunnels, the original rock will produce discontinuous structures such as joints, fault fissures, and weak surfaces [1,2,3]. When joints and cracks containing primary rock were externally disturbed, secondary cracks were created, and these secondary cracks continued to grow until they became connected [4,5], ultimately altering the mechanical properties of the rock mass [6,7]. The existence of rock fissures directly affects the stability and safety of engineering. Understanding and studying the characteristics and behavioral laws of rock fissures can avoid the occurrence of engineering-instability landslides and other disaster accidents.
Prefabricating internal cracks in natural rock is difficult [8,9]. In the past, scholars have conducted extensive experimental studies on pre-cracked specimens of alternative materials: including glass [10,11], Columbia Resin [12], clay [13], and cement mortar [14]. Dyskin investigated crack initiation stress and coalescence stresses in polymethyl methacrylate (PMMA), gypsum, and Huangdeng granite under uniaxial compression [15]. Some scholars have identified two basic types of micro-cracks through cyclic uniaxial compression experiments: tensile wing cracks and shear cracks [16]. Bahat experimentally measured the length of nascent cracks accurately and proposed two new types of crack branching: full branching (FB) and attempted branching (AB) [17,18]. Wong obtained three merging modes of secondary cracks through many uniaxial experiments: wing stretching mode, shear mode, and mixed mode [19].
Numerical simulation can predict the crack extension process of specimens under loading conditions and verify the accuracy of experimental results. The mechanical numerical calculation methods of rock mass with defects are mainly divided into three kinds: finite element method (FEM) [20,21], boundary element method (BEM) [22,23], and discrete element method (DEM) [9,24,25]. Previous studies have shown that parallel bonding modeled by the particle flow code (PFC2D) under uniaxial compression conditions is consistent with laboratory testing phenomena [14] in simulating rock cracking results [26,27,28]. Although PFC2D can only be performed on a 2D planar scale, it can be used to simulate many problems in rock engineering: crack propagation and coalescence of brittle rock materials [29,30,31]. The discrete element method (DEM) can affect the macroscopic properties by calibrating the contact parameters between the particles, avoiding the complex constitutive relationships on the macroscopic side [32]. As such, it is well-suited for studying aspects of fractured rock masses.
Digital image correlation (DIC) is a non-contact material deformation measurement technology [28,33]. During specimen loading, the whole process of micro-crack extension is obtained by identifying and recording digital images of unique corresponding physical points on the specimen surface in different states and calculating the full-field displacement in pixels [4]. Based on the direct analysis of the captured photographs, two-dimensional digital image correlation (DIC) analysis of a single stationary camera is used to measure the strain of the specimen in all directions under external loading, which directly reveals the mechanics and deformation mechanisms of the tested materials.
In previous studies, many scholars had selected specimens with a single type of crack to carry out single-crack or conjugate crack studies [29,34,35,36]. Still, there are few studies on combining single cracks and conjugate cracks under uniaxial compression. This study used the DIC technique and the PFC2D discrete element numerical simulation to comprehensively analyze and obtain rock samples’ characteristics and mechanical properties after damage. This provides further understanding for the study of rock masses with complex fracture assemblages and is an important reference for the study of surrounding rock disturbances in tunnel excavation.

2. Test Design Scheme

2.1. Preparing the Specimen

It is difficult to produce batches of raw rock specimens containing prefabricated cracks [30,37]. Rocks can be considered as a combination of multiple mineral particles, while concrete specimens are also a combination of multiple particles, with cement acting as a binder to bind the sand particles together. Due to the strong bond between cement and sand, deformation is minimized when subjected to loads. By performing compression tests on cement mortar specimens, we can obtain some important information about the evolution of cracks that can help to understand the behavior and properties of rock materials. Therefore, in this study, we used easily fabricated concrete specimens instead of raw rock specimens. To observe high-contrast images, standard 42.5 Silicate white cement [38] and ultrafine quartz sand with a particle size of 0.15–0.3 mm [39] were used for the cement. The mass ratio of concrete, sand, and water was 1:1:0.4. A cubic specimen of 140 mm length by 70 mm width by 30 mm thickness was poured into a steel mold, as shown in Figure 1 and Figure 2a. A single steel plate of 2 mm thickness was inserted vertically into the unconsolidated specimen in the direction of the thickness of the specimen, with the centers of the prefabricated cracks on both sides located in the same straight line as the midpoint of the largest surface of the specimen. The samples were left for 6 h to develop a hardness, and the pieces were pulled out. Finally, the specimens were placed in a standard curing room for 28 days.
Prefabricated crack parameters for this experiment were as follows: Crack length 2 a = 20 mm, the distance between midpoints of prefabricated cracks on both sides 2 L = 30 mm. The angle between the left single crack and the loading direction was maintained as α 1 . The single crack in the right prefabricated crack that was parallel to the left prefabricated single crack was defined as a locating crack. The angle between the positioning crack and the axial loading direction was α 1 = α 2 = 45°, the inner angle of the right cross-fracture was β . Six experimental groups were set up, including intact sample, double-parallel prefabricated single crack, prefabricated cross-crack angle β = 30°, 45°, 60°, and 90°, as shown in Table 1.
For effective correlation, the surface of the specimen should be sprayed with black paint during the preparation phase of the test. The paint adheres naturally and uniformly to the surface of the specimen, forming random black spots. Similar material tests were made with specimens of an aspect ratio of 0.5 (less than 0.6). In this way, during loading, the stresses around the prefabricated cracks in the specimen were uniformly distributed, the friction effect between the specimen ends, and the testing machine was reduced [40].

2.2. Loading Scheme and Test Equipment

The disturbance of the surrounding rock during tunnel construction mainly affects the primary rock mass in the form of compressive stress. Therefore, uniaxial compressive stress loading was used in this study. The loading equipment was a displacement-controlled loading WAW-1000 microcomputer-controlled electro-hydraulic servo universal testing machine (Changchun Experimental Machine Co., Ltd., Changchun, China), and the loading speed was set at 0.1 mm/min, so that the specimen was in a quasi-static compression state, and the whole loading process lasted for 8 to 15 min. The transverse displacement of the specimen was acquired using an LVDT displacement meter with the baud rate set to 9600 (Shenzhen Haodong Technology Co., Ltd., Shenzhen, China). The baud rate was set to 9600 and the acquisition rate was controlled at 200 milliseconds to measure the transverse displacement of the specimen as it was loaded.

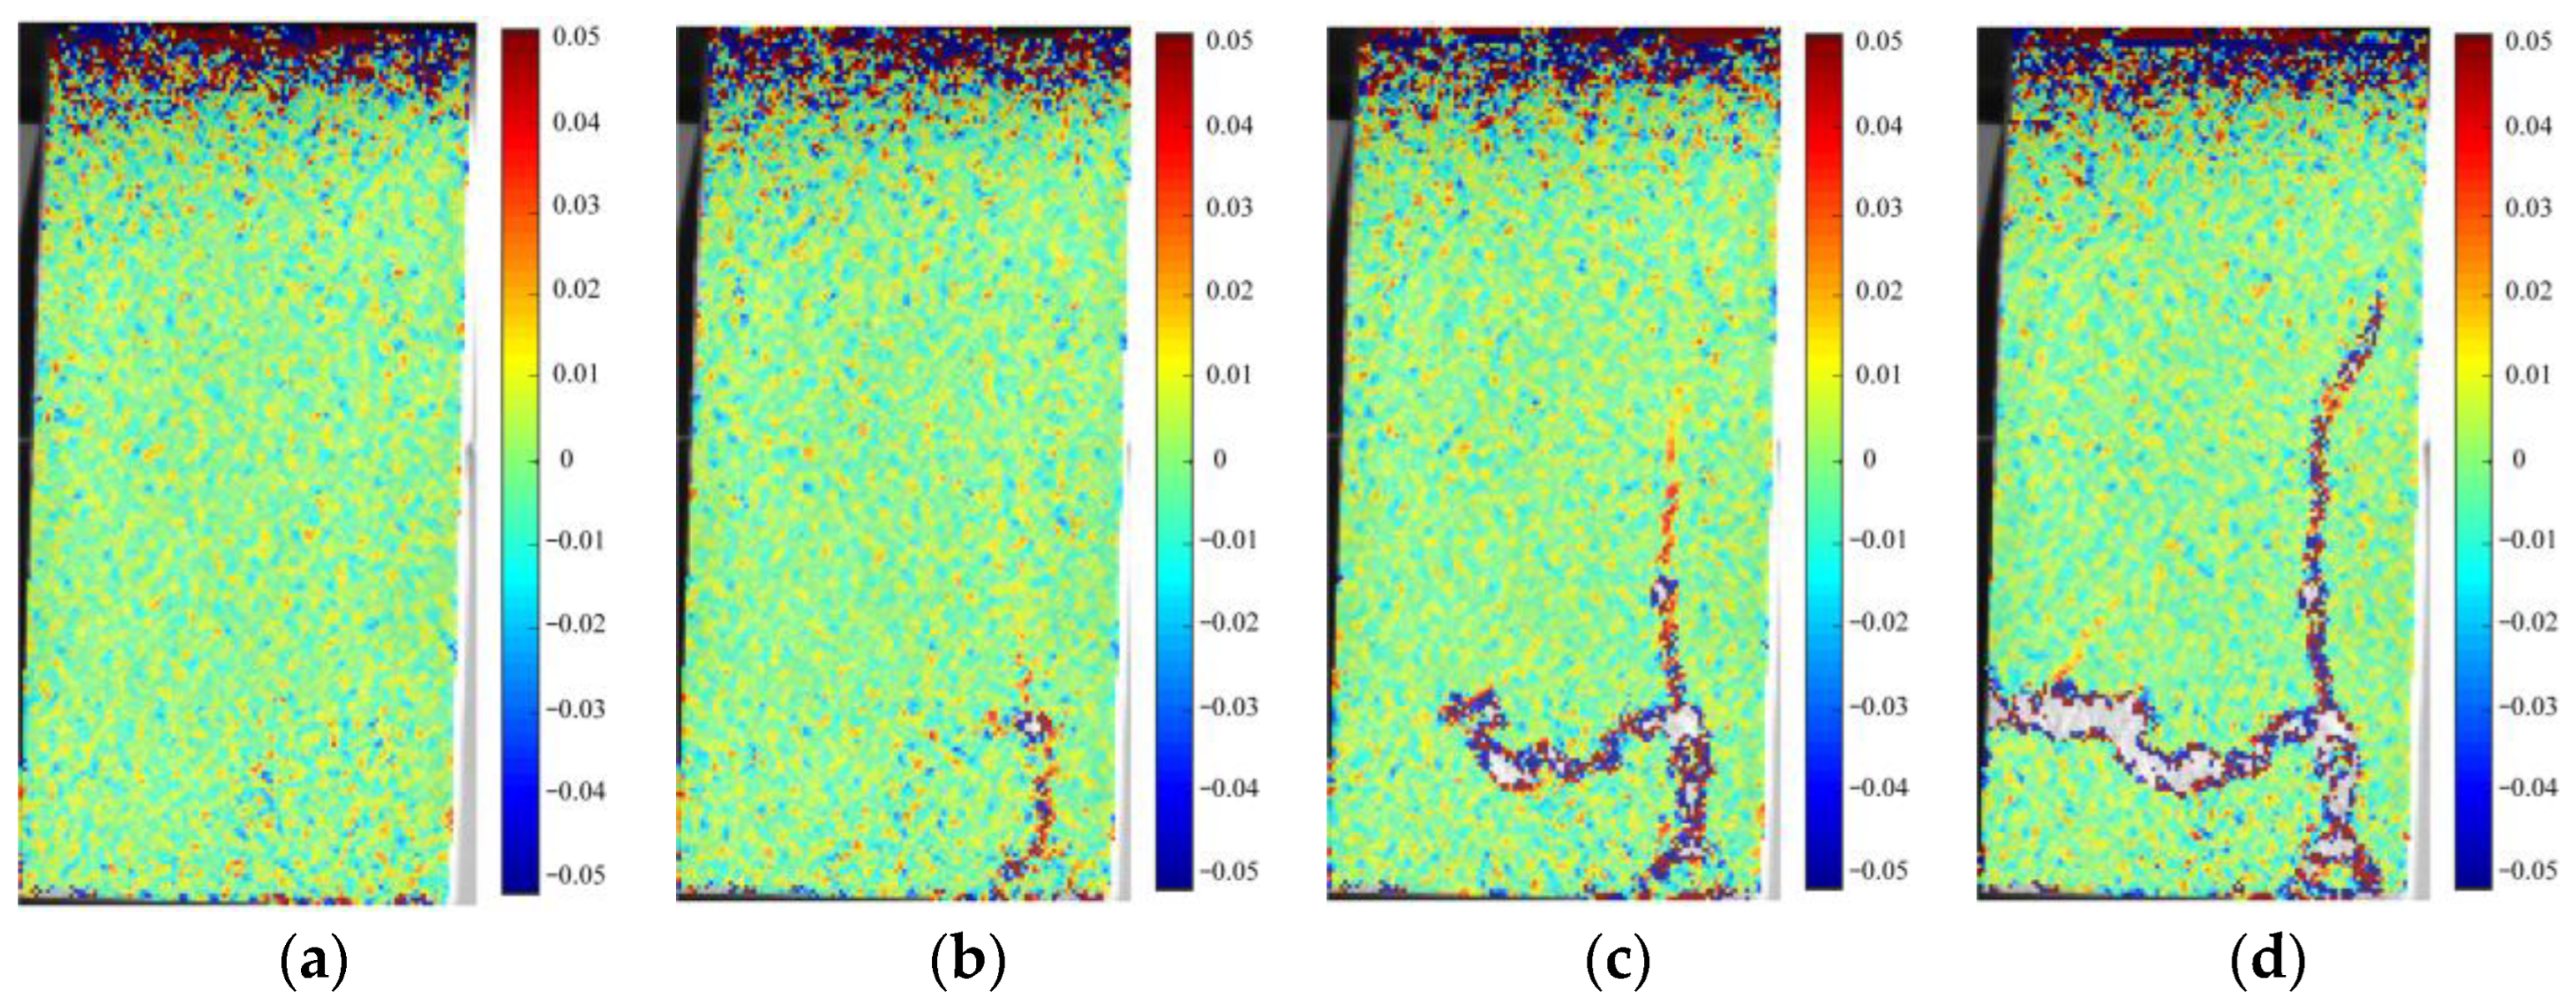
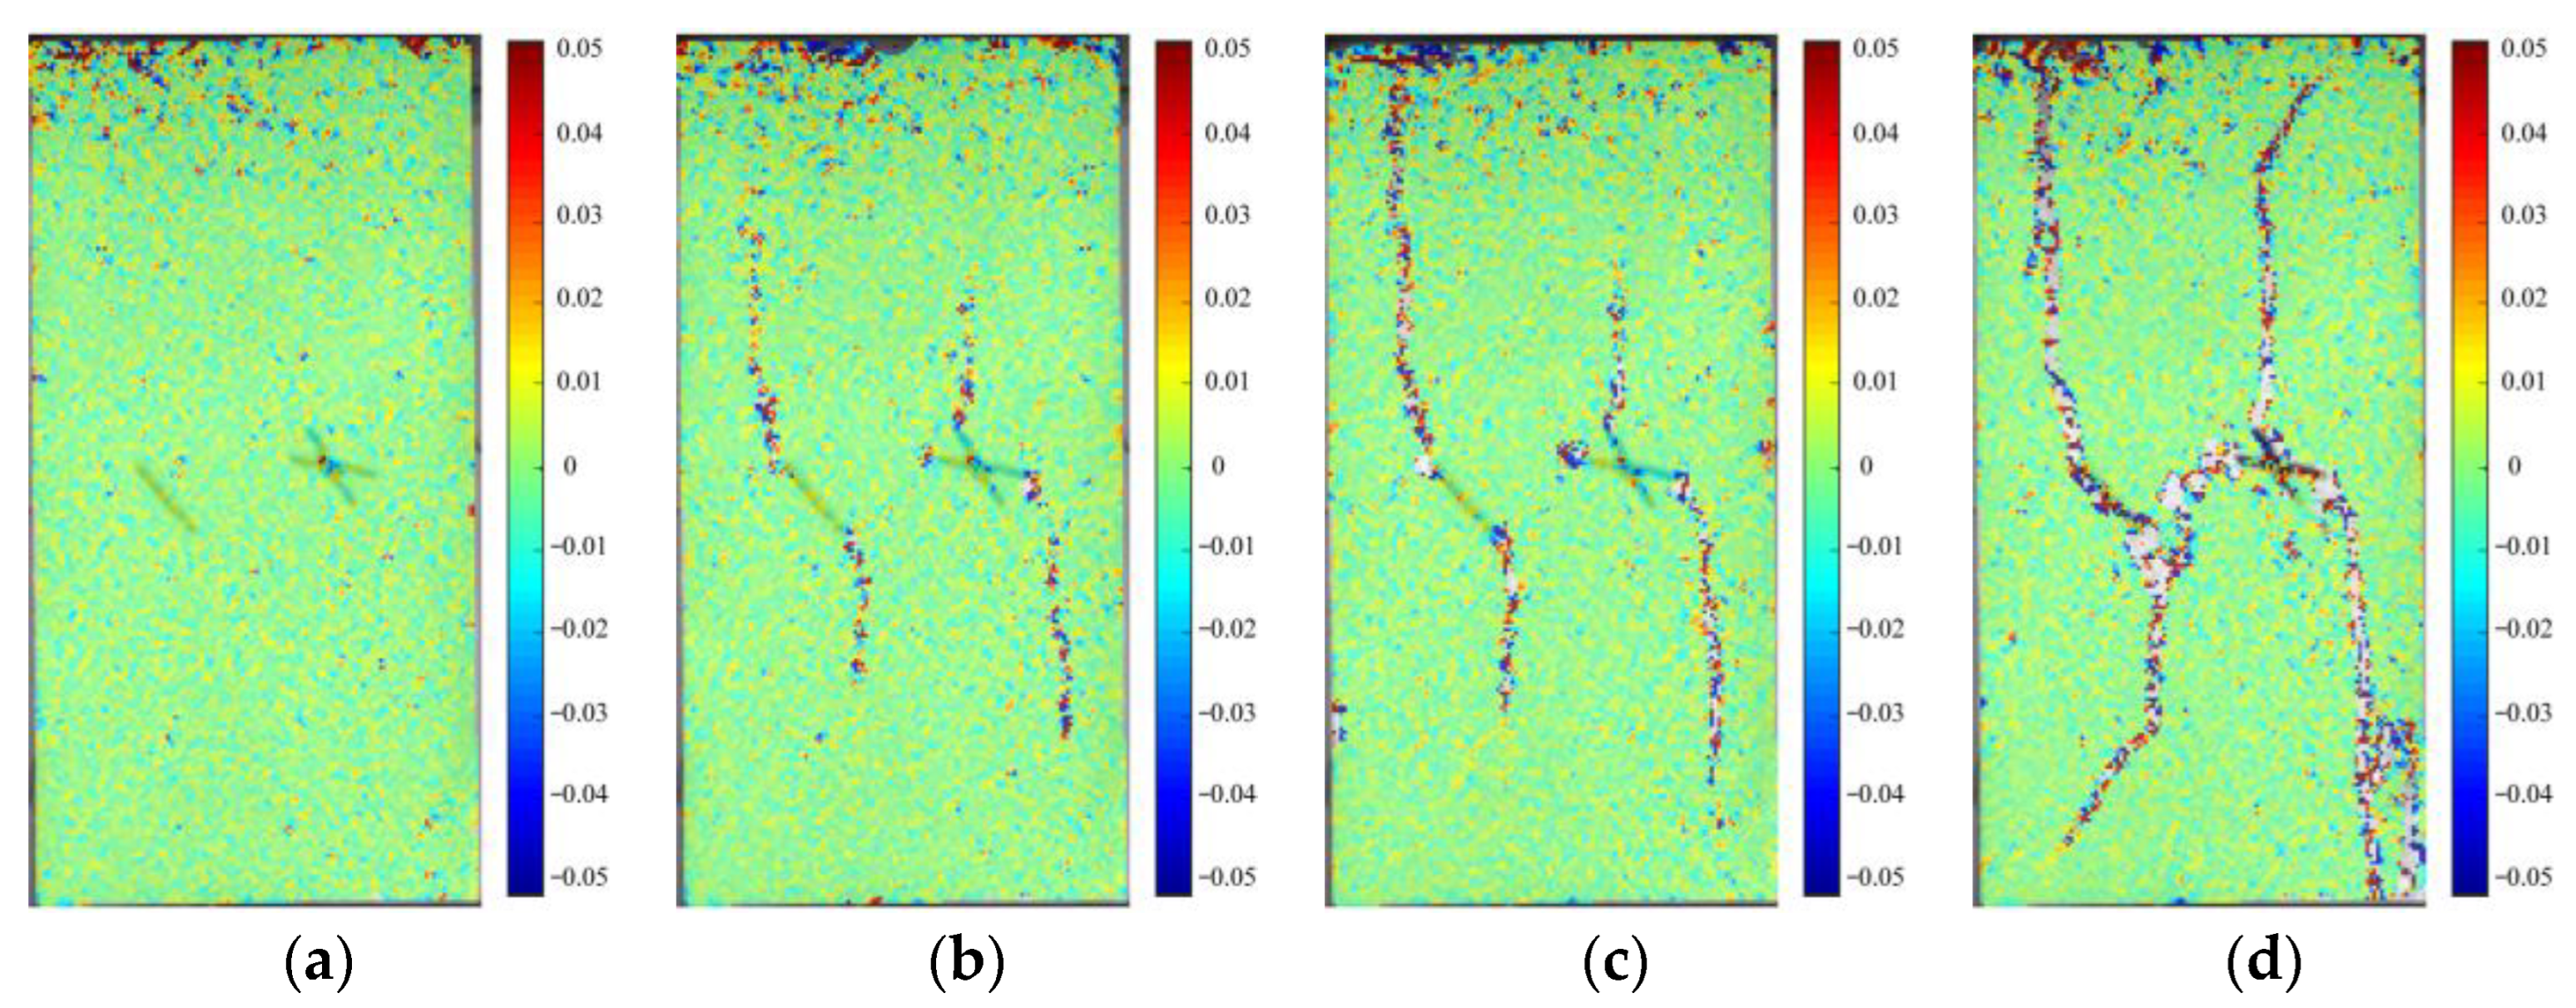
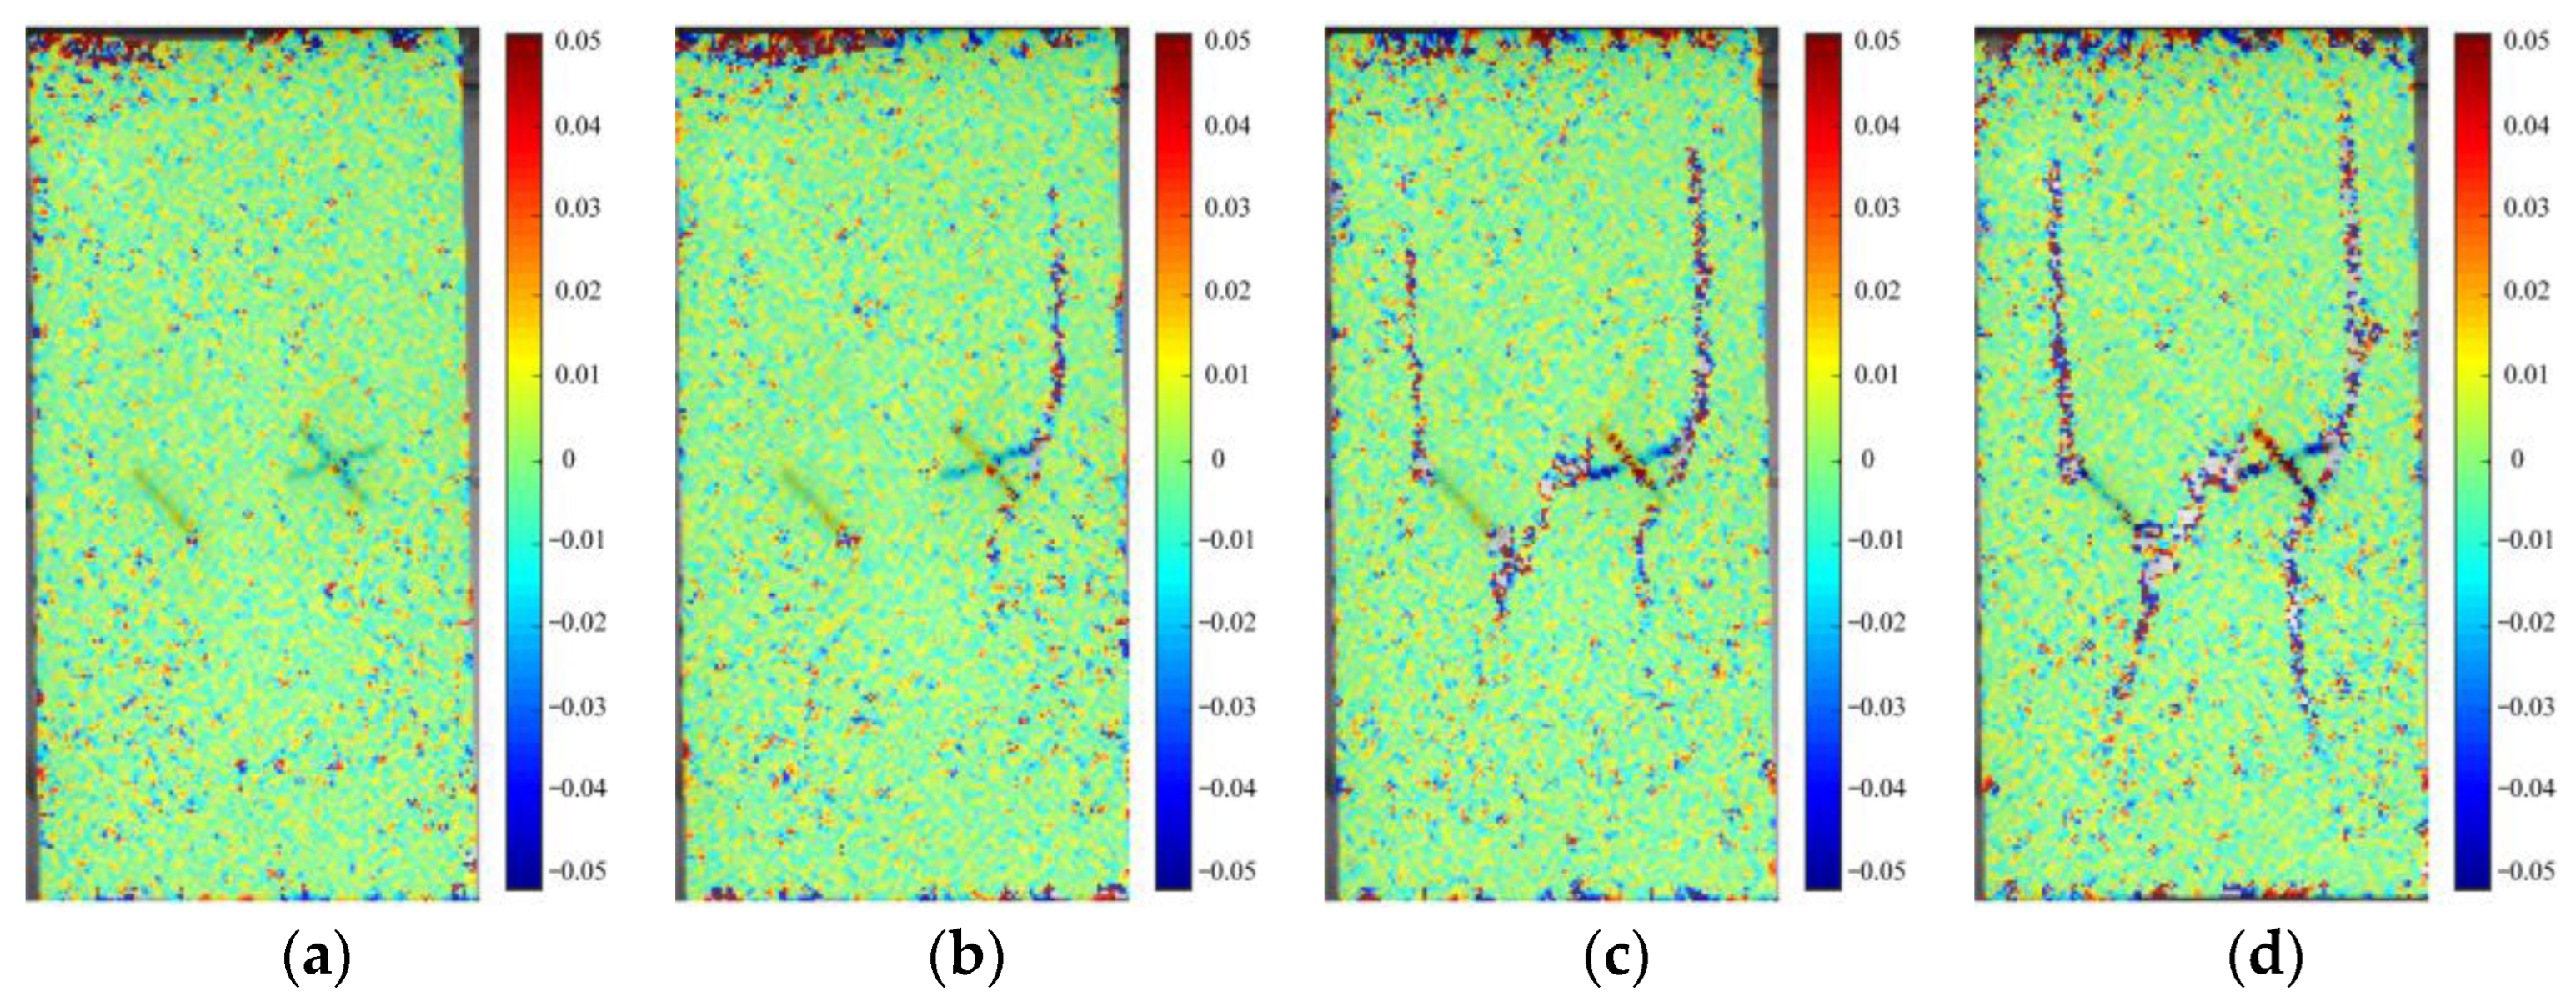
2.3. Digital Image Correlation Technique

The digital image correlation system (DIC) can record the whole process of secondary crack growth of compression specimens [41]. The system consists of a GS3-U3-91S6M-C industrial camera, an LED backlight, and a computer running image processing software as shown in (Figure 2b). To capture a clear image of the specimen during loading, the surface of the specimen block must be given sufficient brightness. The maximum pixel of the acquired image was 3376 × 2704, and the acquisition speed was controlled to 3FPS.
Matlab2018b software was used to run the open-source algorithm Ncorr to compare and analyze the stored images, select the captured area on the rock surface for bleaching, and continuously track the displacement of the black point at the same location in the two images before and after the matching deformation to calculate the full-field strain of the rock body [42].
To further improve the accuracy of the results, two reference points were used in this study to measure the displacement of the calculated points in Figure 3. The displacement of the point P can be determined with the following equation [43]:
x i = x i + u + u x Δ x + u y Δ y y i = y i + v + v x Δ x + v y Δ y
In the formula are the displacement components of one of the reference points along the directions, O 1 , and are set as two reference points. The outputs of the two reference points should satisfy the error conditions [44]. u x and v x are the first-order displacement gradients of the reference subset, and the strain components in the directions are calculated by the Green–Lagrange strain formula.
ε x x = 1 2 2 u x + ( u x ) 2 + ( v x ) 2 ε x y = 1 2 u y + v x + u x u y + v x v y ε y y = 1 2 2 v y + ( u y ) 2 + ( v y ) 2

3. Model Establishment and Parameter Selection

PFC2D is a microanalysis software based on a generalized discrete element model (DEM) framework. It is not constrained by deformation, can effectively fit the cracking and stripping behavior of discontinuous media, and has been widely used in the microscopic study of rock cracks. The simulated specimen consists of particles and a bonding agent, and the contact between particles is generally modeled as both the contact bonding agent model (CBM) and parallel bonding agent model (PBM), as shown in Figure 4a. The contact bonding model can only transmit forces, while the parallel bonding model can be assumed to be a rectangular rock-like material that can transmit forces and moments [45,46]. Therefore, the parallel bond model fits well with the bond between the concrete aggregates. In PBM, the parallel bond breaks when the maximum normal or shear stress exceeds the bond strength between particles. The forces and moments that bind the material are eliminated, the particles lose their bond, and the macroscopic stiffness is immediately reduced, corresponding to rock cracking. This paper used PBM to simulate the uniaxial compression of rock specimens with prefabricated cracks.
The size of the numerical simulation specimen was set to 140 mm × 70 mm, which was consistent with the actual size of the chamber experiment. Circular particles with different radii were randomly generated in the set area. The intact sample for numerical simulation consisted of 5244 particles and 10,234 parallel bonds. In this experiment, prefabricated cracks of rock-like samples were obtained by inserting steel plates. The cracks were 2 mm thick and were non-closed cracks. Prefabricated cracks can be obtained by removing particles. The method of removing particles can consider the roughness of the surface, so the method of removing particles was used in this experiment.
The PFC2D5.0 software compares the experimental and numerical simulation results of the intact sample by the “trial and error method” of continuously adjusting the particle parameters. Based on two parameters, Young’s modulus and peak stress, the post-correction parameters in Table 2 were determined. Figure 4b shows the stress–strain curves for each crack-type specimen after modifying the parameters. Figure 5 shows the comparison between the numerical simulation parameters and the experimental parameters, and the simulated stress peaks of each group are consistent with the experimental stress peaks. The Young’s modulus of each group of numerical simulation has some error with the experiment but it is controlled within 5%, so the numerical simulation parameters are reasonable.

4. Test Result Analysis

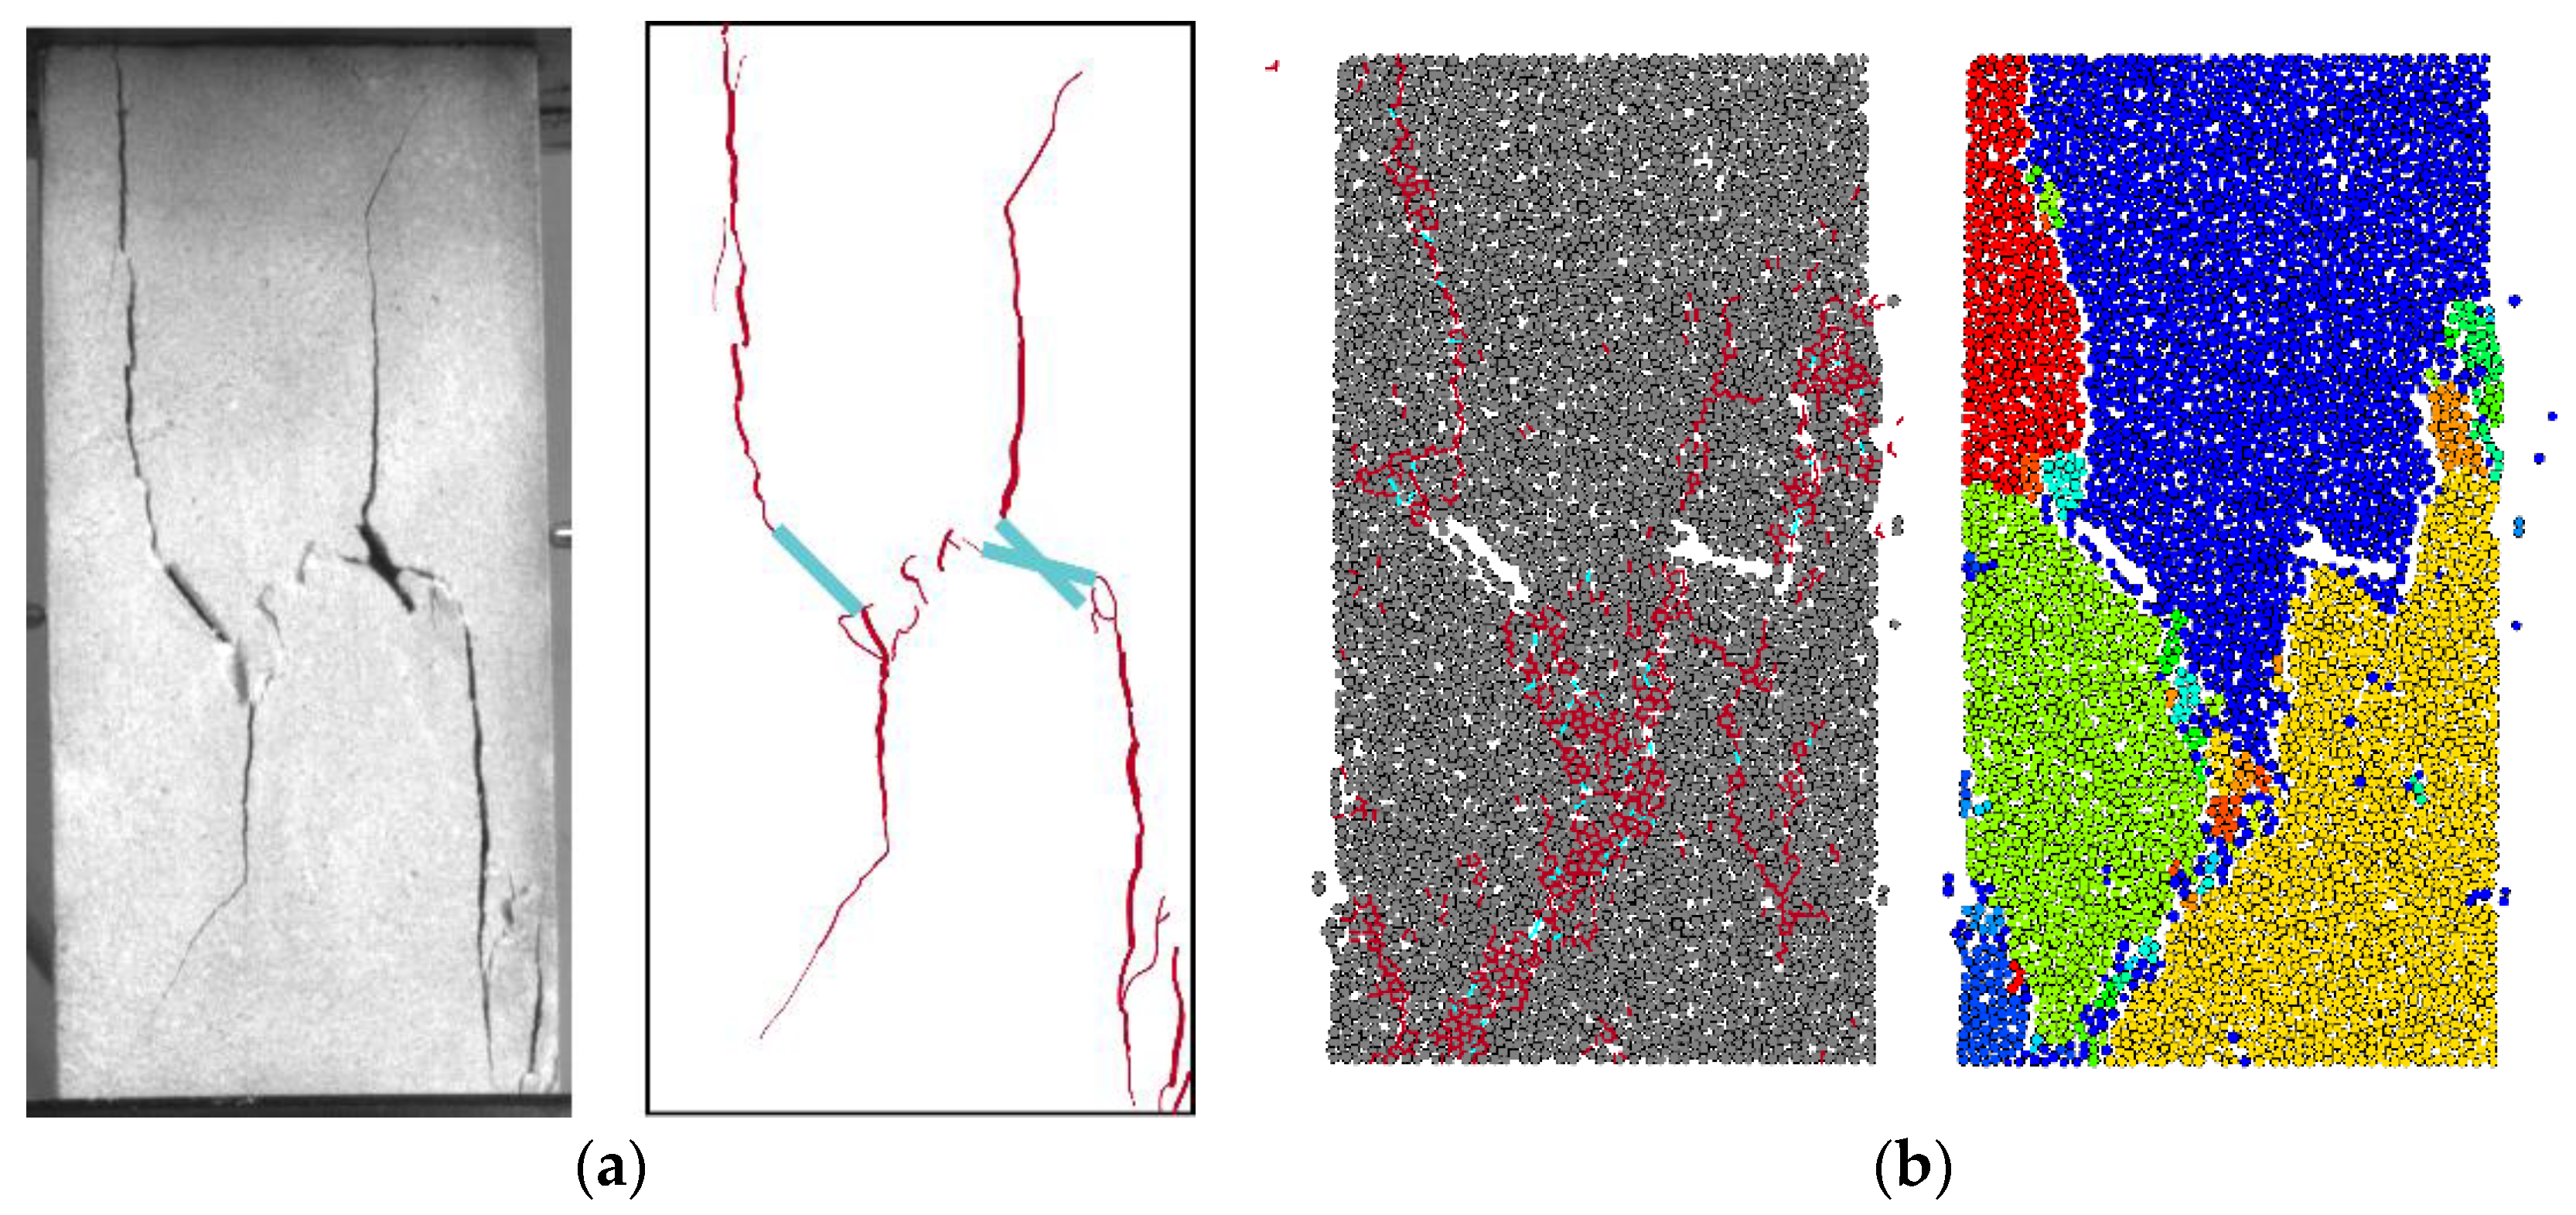
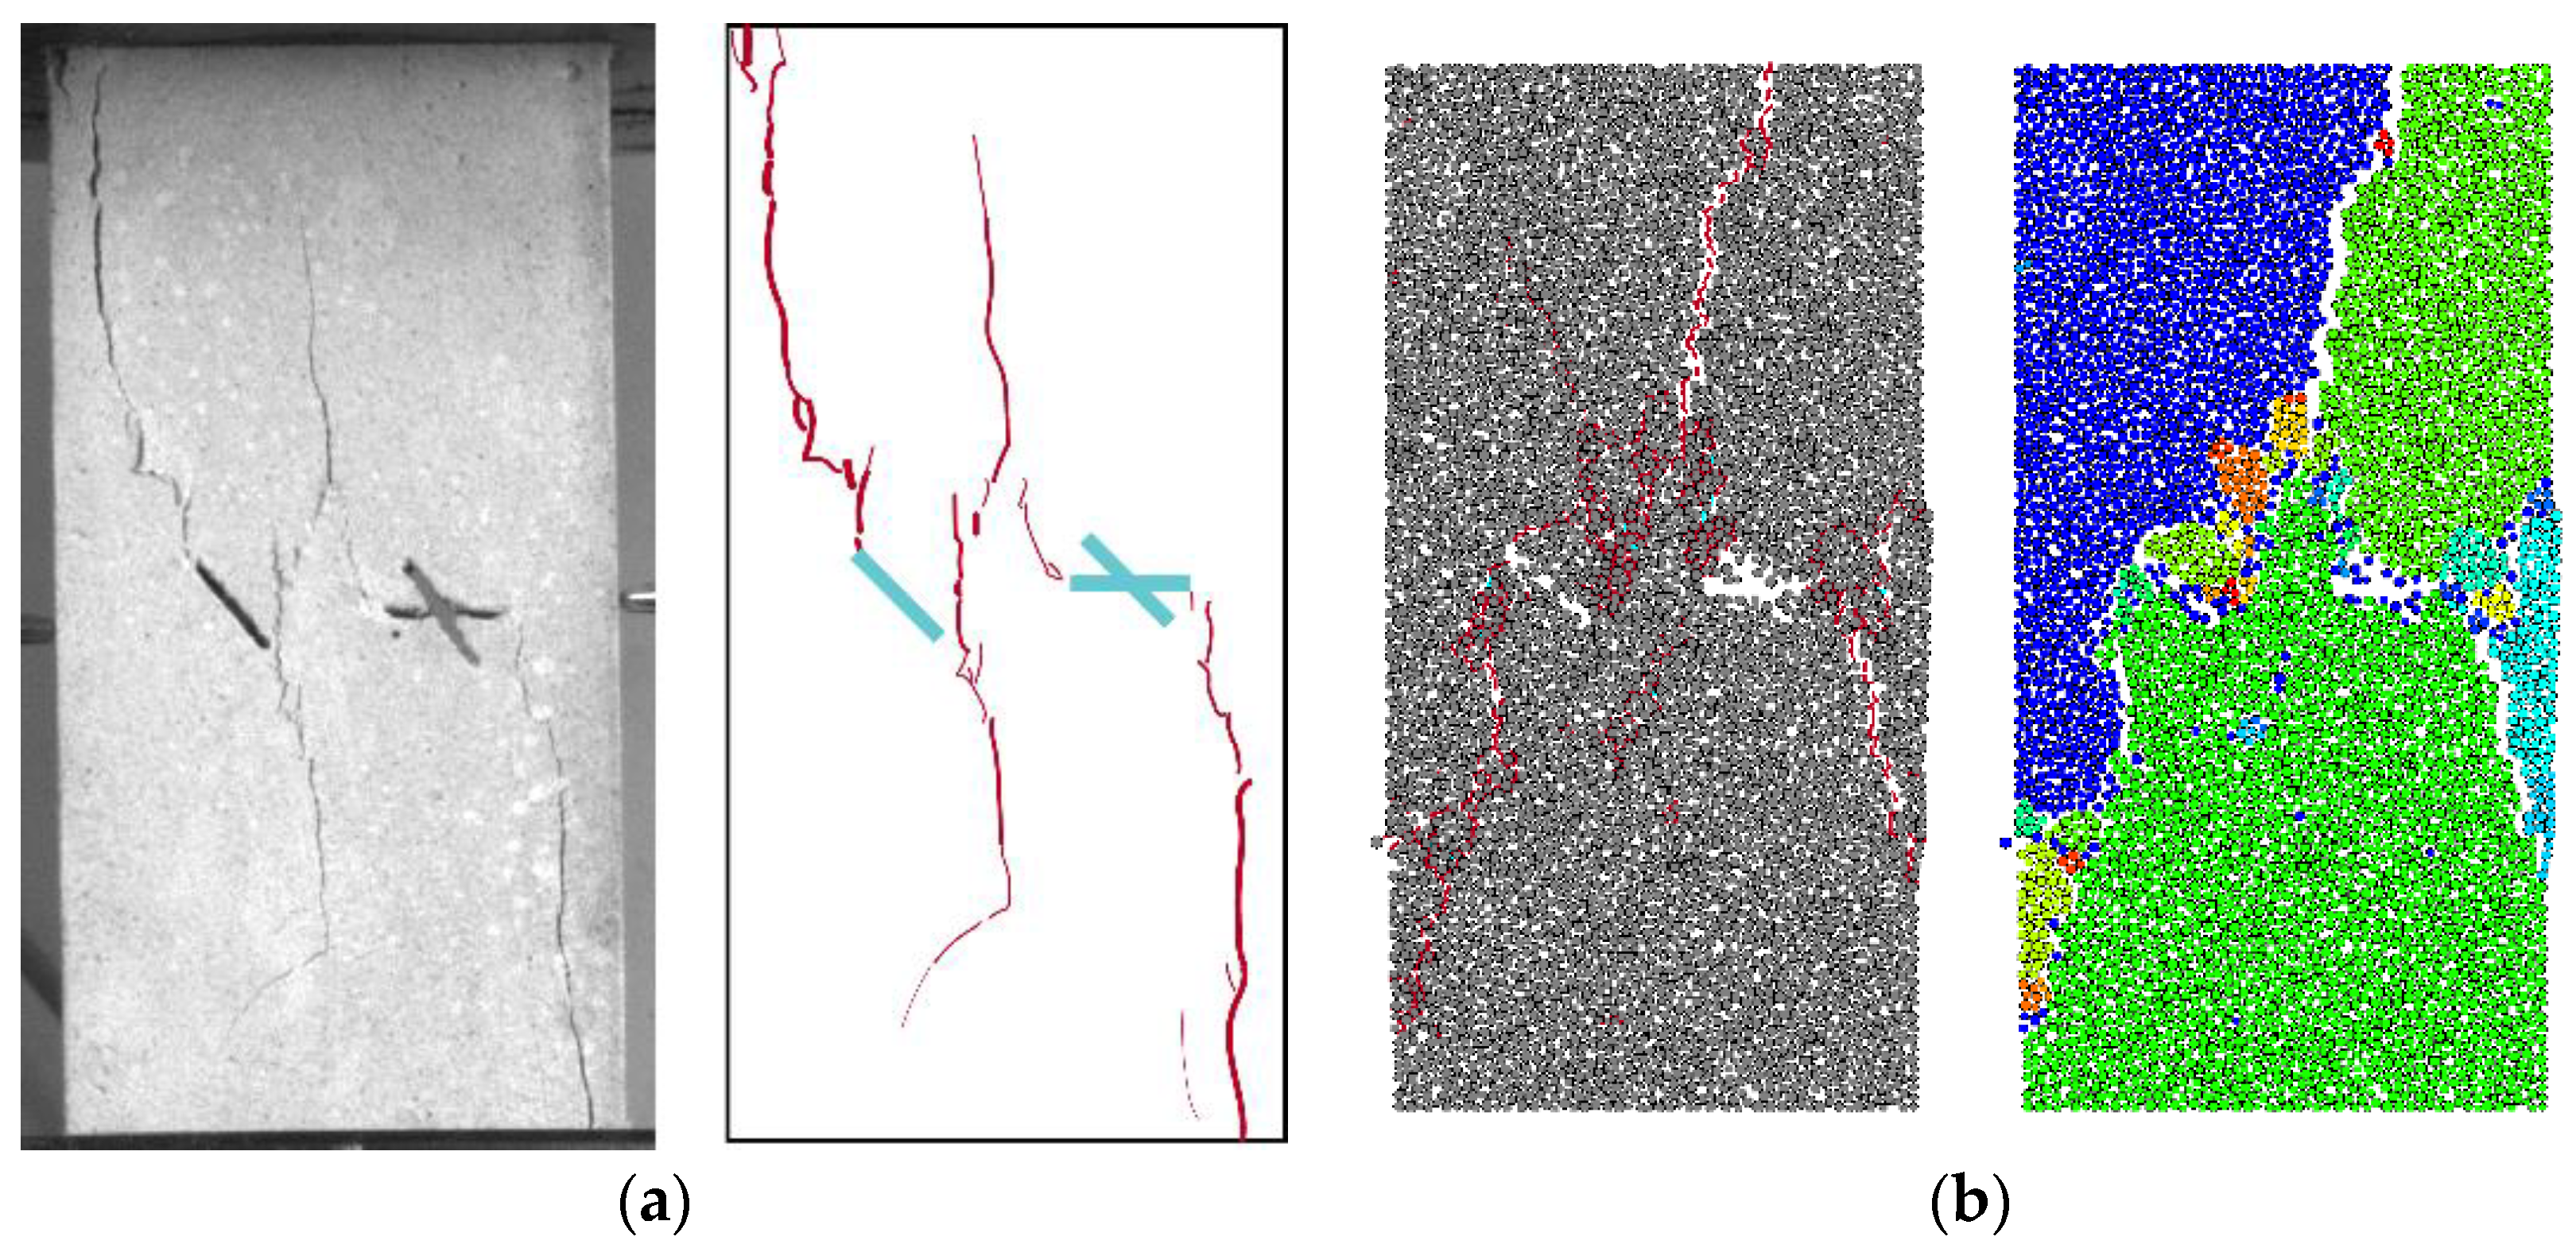
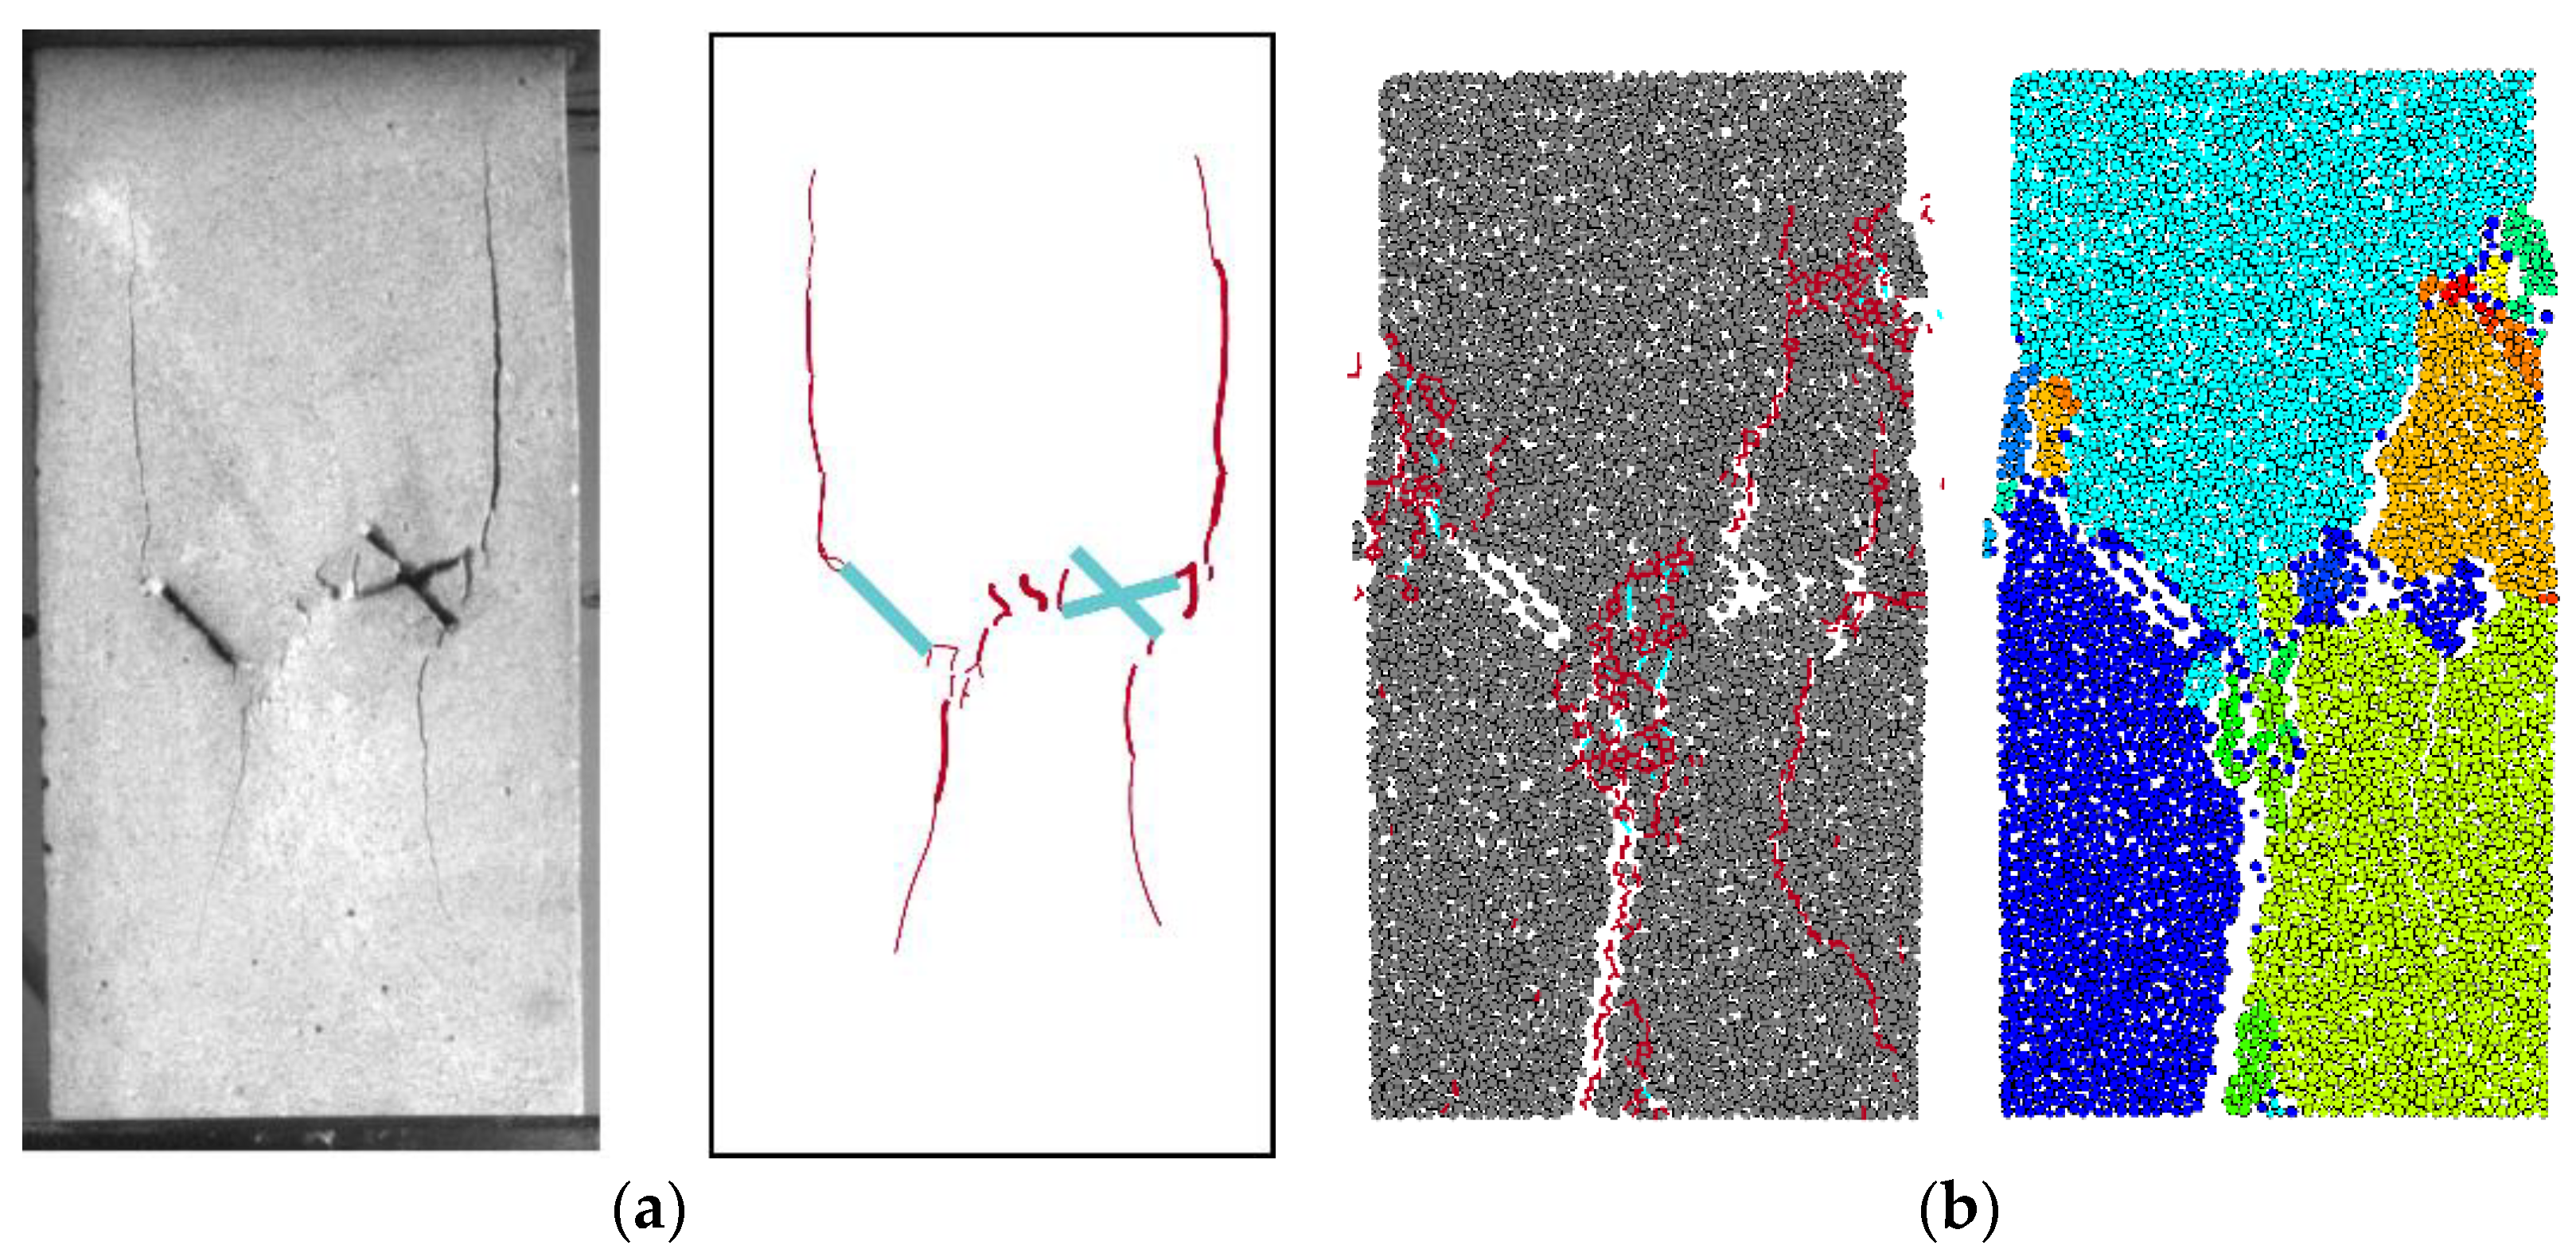
4.1. Type I and Type II Failure Modes

The general trend of each set of curves is consistent with the stress–strain curves. The rising section was in a smooth “S” shape, and the slope of the curve gradually increased. Then, the stress–strain curves showed a linear rise, with the rate of rise gradually decreasing as the peak stress approached. Near the peak, the specimens with prefabricated cracks produced a short-term flat cross-section, followed by a sharp decrease in specimen strength. Comparative results showed that the peak stresses were suppressed to varying degrees in all fracture groups, with Type IV fractures having the lowest peak stresses.
There are two main types of cracks, tensile cracks and shear cracks, which are distinguished according to the direction of growth of the crack. Tensile cracks are cracks created along the axial direction when an axial force is applied to the specimen; shear cracks are cracks created perpendicular to the shear direction [21]. Cracks in between are defined as mixed tensile and shear cracks.
From the Type I stress–strain curve (Figure 6a), it can be seen: From point O to point a is the compaction stage of the original fracture of the specimen; from point a to point b, the curve grows linearly without micro-cracks (Figure 7a). In stage 2, after the curve passes through point b, the tensile crack starts from the lower edge of the specimen and gradually develops into a large-scale crack along the loading direction (Figure 7b). Unstable extension cracks were generated in stage 3 (Figure 7c), and mixed tensile-shear cracks began to appear. In stage 4, the crack width increases and continues to widen until it penetrates the entire specimen, and the specimen fails in strength (Figure 7d and Figure 8). Type II: After the appearance of the two tips of the prefabricated cracks, the micro-cracks expand along the direction of maximum stress (vertically in this study) to form cracks on a macroscopic scale. The courses of the two cracks are approximately parallel (Figure 6b and Figure 9b). The orientation of the two cracks changes abruptly near the edge (Figure 9c). The extension direction of the cracks tends to the near corner of the specimen. At the same time, the rock bridge between the prefabricated cracks breaks, and the two macroscopic cracks merge (Figure 9d and Figure 10).

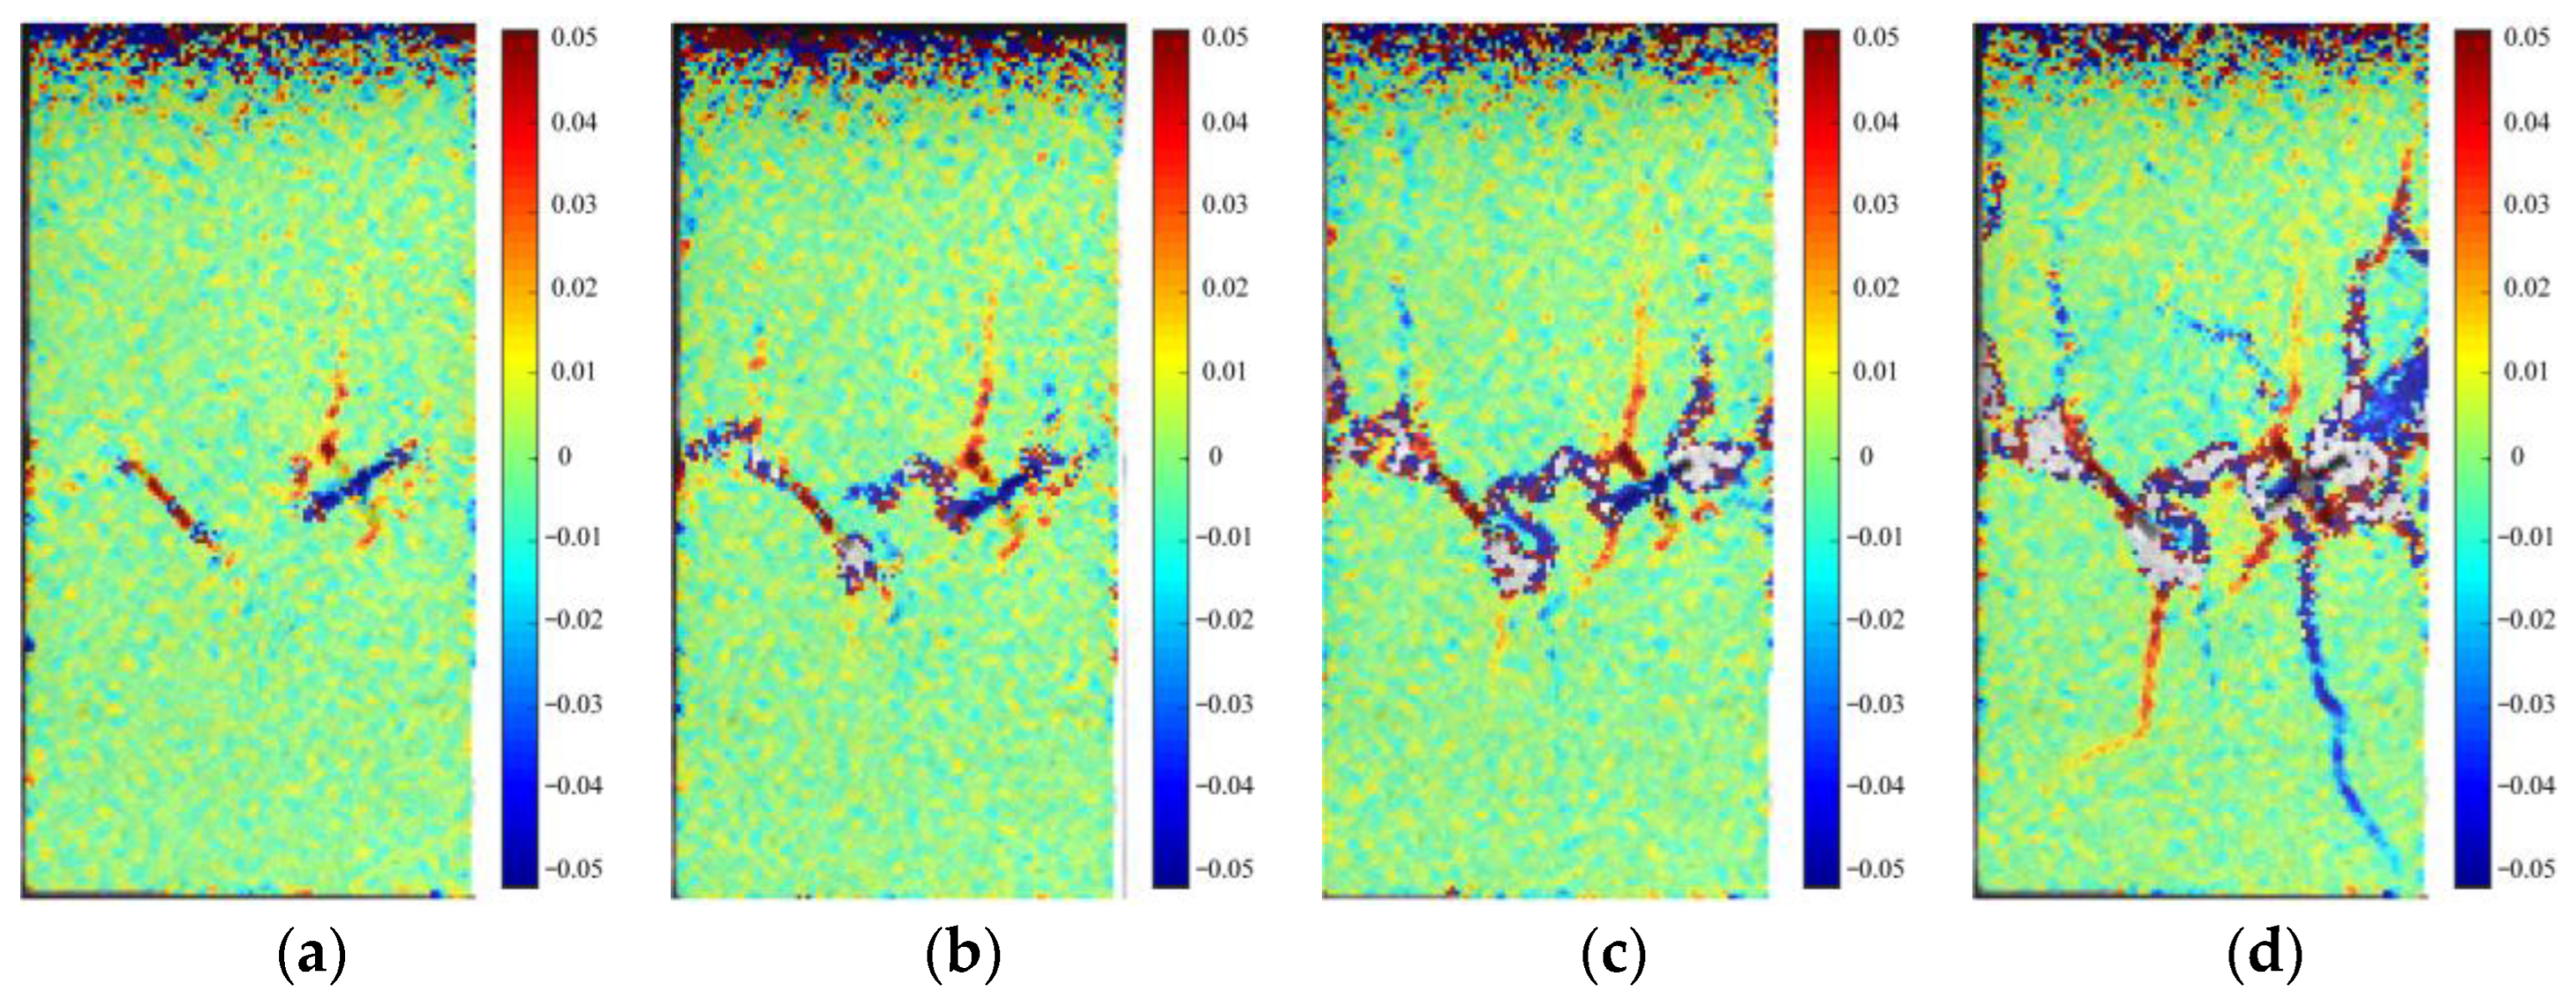
4.2. Failure Effect of Crossed Fractures

The damage effect of conjugate cracks can be derived from experimental and numerical simulation results. When the angle in a right-angle conjugate crack is changed by only one factor, the macroscopic development path of cracks in the damage process of the specimen has a similar pattern: tensile micro-cracks start expanding from the tip of the prefabricated crack, and after a certain stage they form a mixed tensile-shear crack. The micro-crack growth ends at the upper and lower edges. However, there were some differences in the initiation sites and developmental sequence of prefabricated conjugate crack micro-cracks in the various groups of compression specimens. Type III (Figure 11a and Figure 12b): Micro-cracks of the prefabricated conjugate cracks were produced at the left and right apices and the upper part of the apices but the development of the crack at the left apices lags. The micro-cracks continued to expand and the upper crack of the prefabricated single crack penetrated the upper edge first, while the left apical crack of the prefabricated cross crack had not yet developed (Figure 12c). Finally, the left-end crack of the conjugate crack merges with the crack produced at the top of the prefabricated single crack, and the micro-crack continues to expand to form a wide crack (Figure 12d and Figure 13). Type IV: Conjugate micro-cracks first appeared at the left end. It is noteworthy that by this time the prefabricated cracks have broken off from each other and the crack merging path is like that of Type II (Figure 11b and Figure 14b). Subsequently, the right-end crack of the prefabricated transverse crack expanded along the loading direction (Figure 14c,d), and the direction of expansion of the upper right micro-crack did not change near the edge (Figure 11c and Figure 15). Type V: With an internal angle of 60°, the cracks first appeared at the prefabricated intersecting cracks’ upper right and lower right ends. After a certain stage of development, cracks at the left end of the intersecting crack merge with those at the lower end of the prefabricated single crack, similar to Type III but completed earlier (Figure 11c and Figure 16b). The micro-cracks continued to expand towards the vertical edges while fracturing occurred between the ends to the right of the intersecting cracks (Figure 16c). Secondary cracks continue to expand until the specimen is damaged (Figure 16d and Figure 17). Type VI: With an internal angle of 90°, micro-cracks were initiated at all tips of the prefabricated cracks, and the two tips on the left side of the prefabricated conjugate crack were connected (Figure 11d and Figure 18b). Unlike the previous one, some micro-cracks penetrate directly into the left and right edges, generating two longitudinal cracks on the same side of the prefabricated conjugate crack, and the specimen still retains a certain strength (Figure 18c). Under the combined effect of the two cracks, severe damage occurred on the right side of the specimen (Figure 18d and Figure 19).

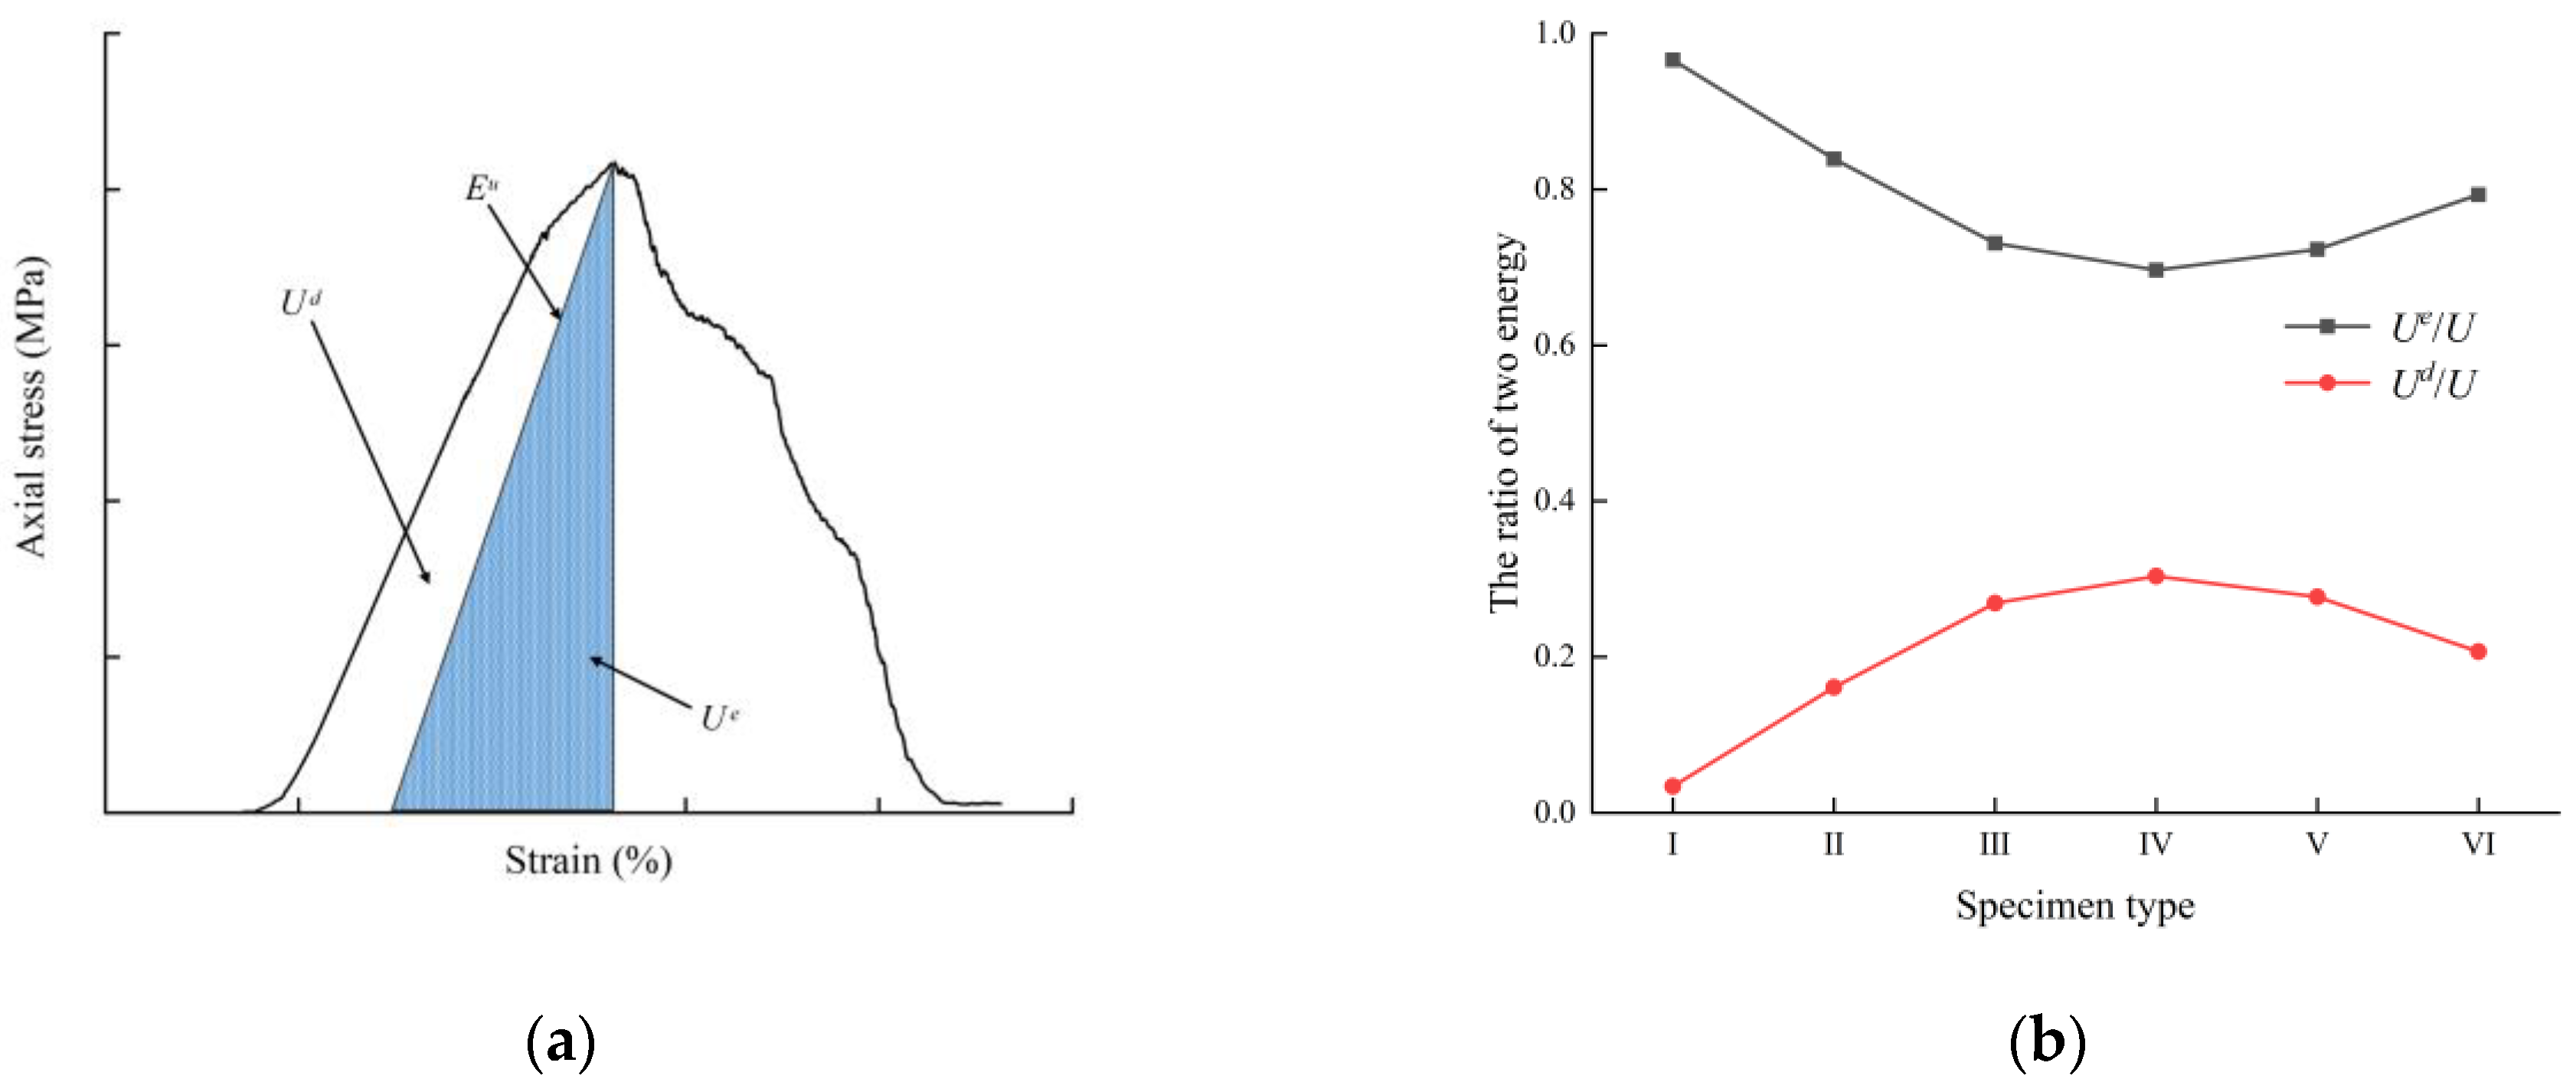
5. Energy Characteristics and Damage Mechanism

Energy dissipation rate theory applies to the study of microfractures in rock masses [47]. Assuming that the entire test system is an adiabatic confined space and ignoring the kinetic energy generated by rock fracture. According to the first law of thermodynamics:
U = U d + U e
where U , U e , and are the total stored energy, the released strain energy, and the dissipated strain energy, respectively.
The relationship between the strain energies can be represented in (Figure 20a), where the dissipated strain energy is the region surrounded by the rising and unloading segments of the loading curve (unloading modulus is E u ), and the remaining blue region is the released strain energy U e . The strain energy is the strain energy of the loaded curve. The strain energy of a specimen loaded in uniaxial compression with a peripheral pressure of 0 can be calculated by the following equation:
U = 0 ε 1 σ 1 d ε 1
U e = 1 2 σ 1 ε 1 e = 1 2 E u σ 1 2
where σ 1 is the axial stress.
Since there is no unloading test, there is no data on the unloaded modulus of elasticity E u . According to the need to calculate the formula to the initial modulus of elasticity E 0 instead, the formula can be rewritten:
U e 1 2 E 0 σ 1 2
This leads to U e , U and U d . For the rationalization of replacing E u . Previous rock-like experiments have shown that the tangent of the unloading curve near the peak stress is approximately parallel to the loading curve [48]. Therefore, the unloading modulus can be simplified to the modulus of elasticity to calculate.
The variation in the specimen’s peak strength strain energy ratio energy distribution with the fracture parameters is shown in (Figure 20b): U e / U decreases and then increases as the conjugate crack internal angle a degree increases, while the changing trend of U d / U has the opposite trend. It shows that the presence of prefabricated cracks will increase dissipation. Due to the most complete participation area of Type I, the dissipation energy required for destruction is the largest, that is, the proportion of dissipation energy is the highest. Most of the micro-cracks in the specimen with prefabricated cracks will initiate and propagate at the prefabricated cracks in advance than the intact sample, and more energy will be used for crack propagation and dissipation. The analysis shows that the energy consumption ratio is directly proportional to the overall strength of the specimen, i.e., the smaller the energy consumption ratio, the lower the strength. It was further verified that the strength of the specimen was minimized when the angle of the cross cleavage was 45°.

6. Discussion

While most of the previous rock fracture experiments used the same fracture types [29,35,47], this paper investigates the effect of rock specimens containing different types of fracture combinations (single-fracture combinations and conjugate crack combinations) on fracture cohesion and specimen strength. The relationship between microfracture cohesion patterns, specimen strength, and conjugate crack angle is investigated in this paper.

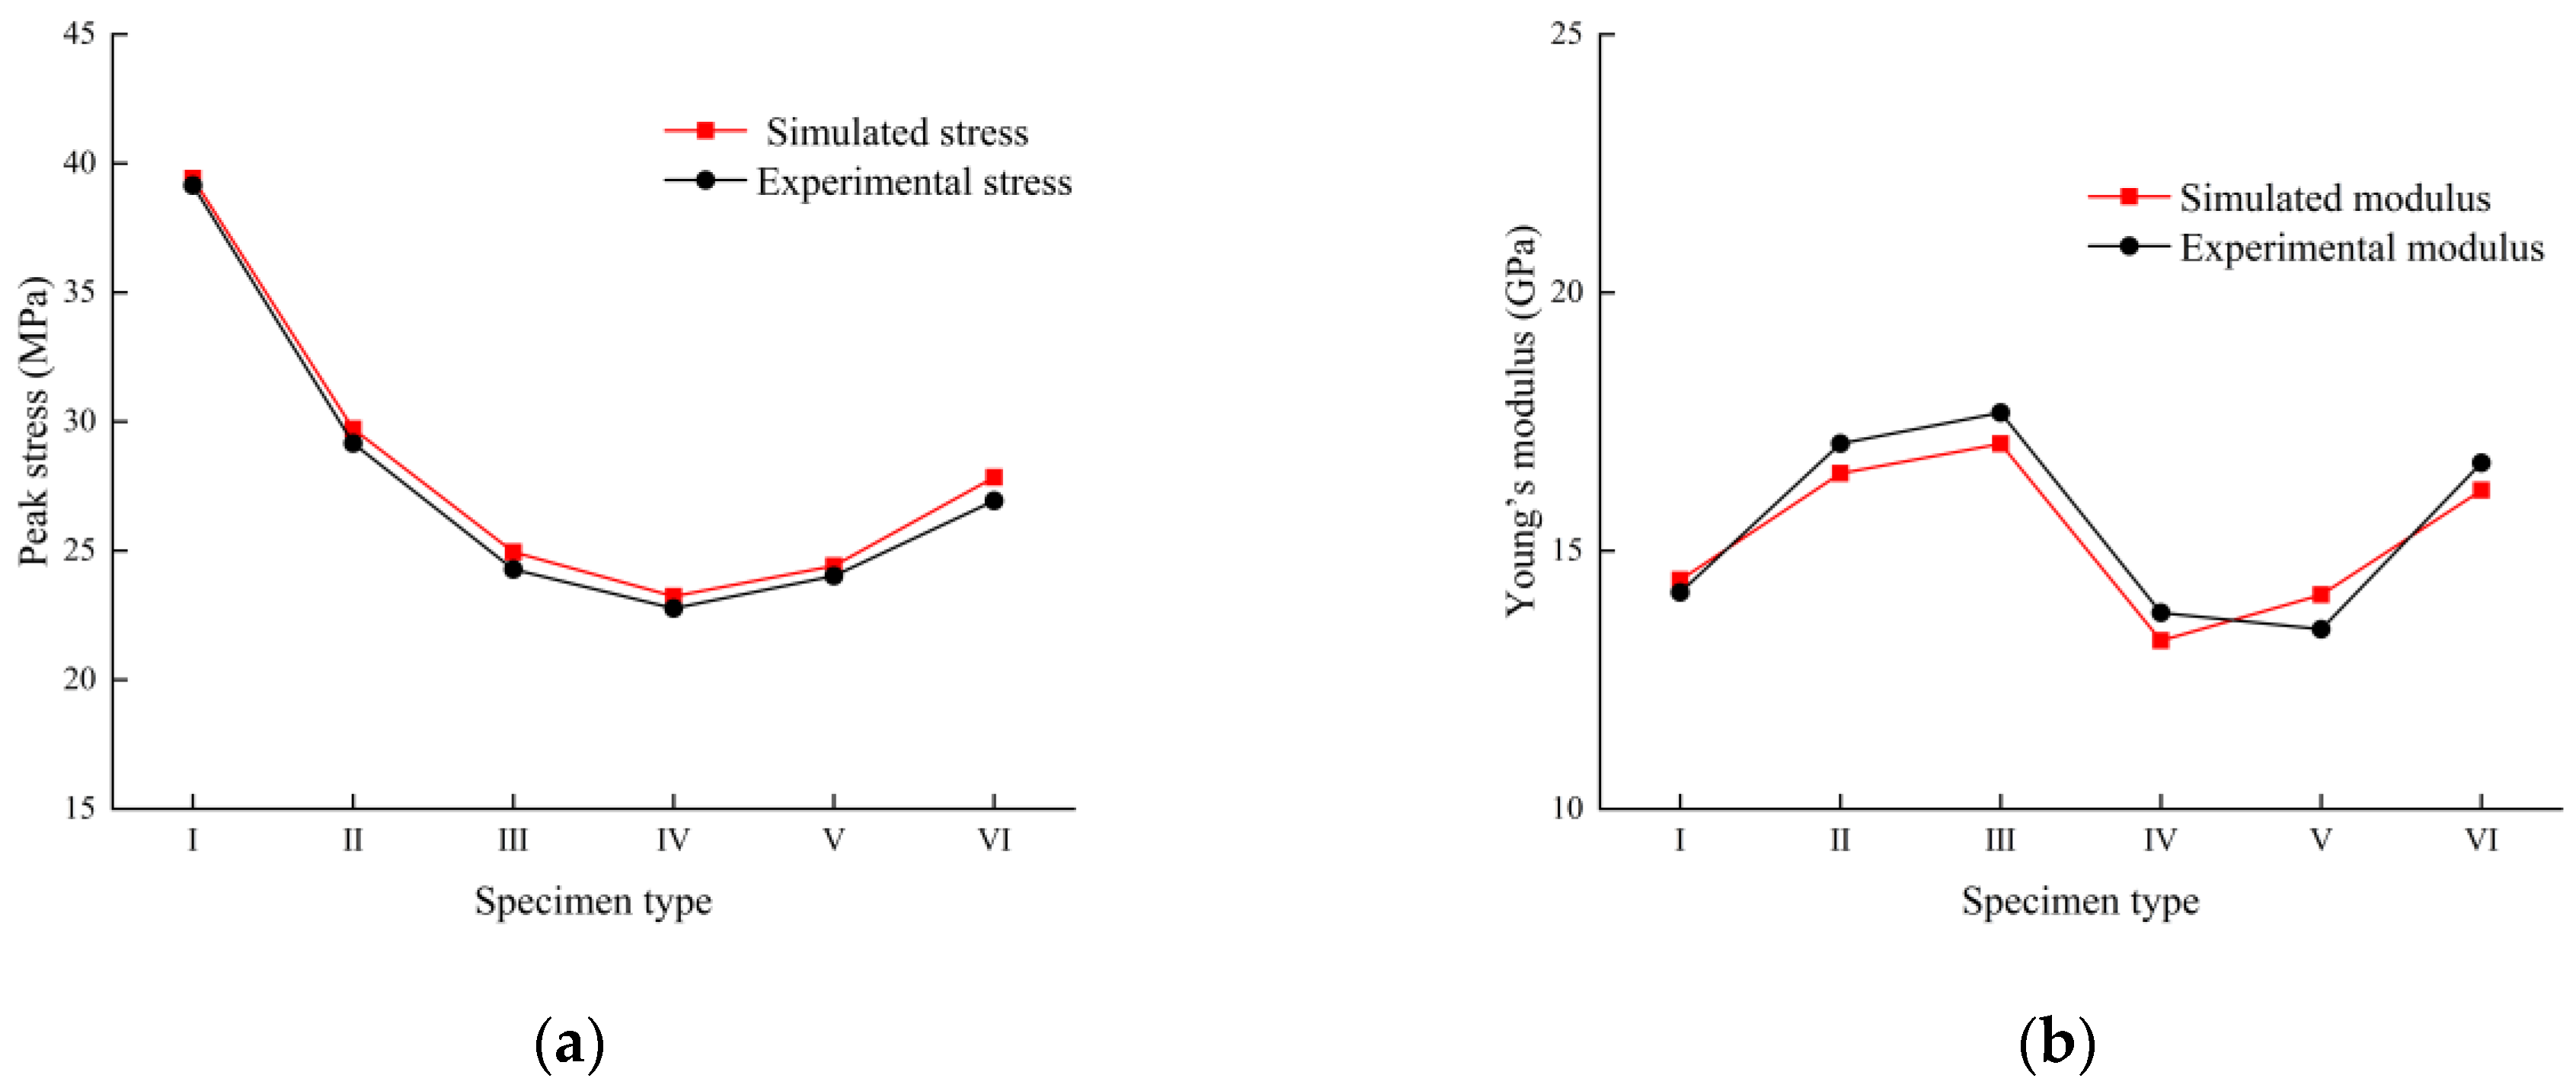
6.1. Mechanical Properties

Previous studies have found a V-shaped relationship between the strength of prefabricated single-crack specimens and crack inclination, with the minimum strength at an inclination of approximately 45° [36]. In this study, the strength characteristics of the right-hand side conjugate cracks were investigated based on the 45° inclination. The experimental results show that the peak stress reaches its lowest value at the inner angle of the conjugate crack β = 45°. This observation is consistent with previous studies that found the lowest strength at a crack inclination angle of 45°. The stress–strain curves in Figure 4b clearly show the significant differences between the groups, highlighting the important effect of the conjugate crack’s internal angle on the mechanical properties of rock-like specimens. In addition, this group shows reduced ductility after damage and a rapid decrease in strength once the load-bearing limit is exceeded, compared to the other groups. These findings emphasize the profound effect of conjugate crack internal angle on the mechanical properties of rock-like specimens and provide valuable insights into their mechanical behavior.

6.2. Aggregation Patterns of Cleavage

In practical engineering, the location of nascent crack aggregation is the area of most concern, which is most likely to cause instability, landslides, or even disaster. Experimental and numerical simulation results show that the conjugate crack’s angle affects the location of crack aggregation. Under uniaxial compression, the cracks in the specimen with two parallel single cracks (Type II) and the specimen with intact sample angle β = 45° (Type IV) are in the upper part of the specimen, while the rest of the cracks with a conjugate crack angle are in the lower part of the specimen. Therefore, it is necessary to make preliminary geological investigations and preparations for the actual project, to document the various fissures in the rock mass containing 45° angles. Based on the existing results, the influence of additional fracture combinations will be investigated subsequently.

7. Conclusions

In this paper, the crack extension and damage characteristics of prefabricated conjugate crack specimens under uniaxial compression conditions are investigated using the DIC and DEM methods, and the effects of the conjugate crack’s angle on crack extension, damage characteristics, and the stress–strain relationship of rock-like specimens are analyzed. Comparing the numerical simulation results of crack initiation, extension, and aggregation of the prefabricated fractured rock specimens, which are in good agreement with the indoor test results, the results are finally verified by using the energy dissipation, and the following conclusions are preliminarily drawn:
  • The peak strength of specimens containing a combination of both single and conjugate cracks is related to the β-angle within the prefabricated conjugate cracks. Under the same conditions, as the β angle increases from 30° to 90°, the peak strength decreases and then increases, reaching a minimum at β = 45° (Type IV).
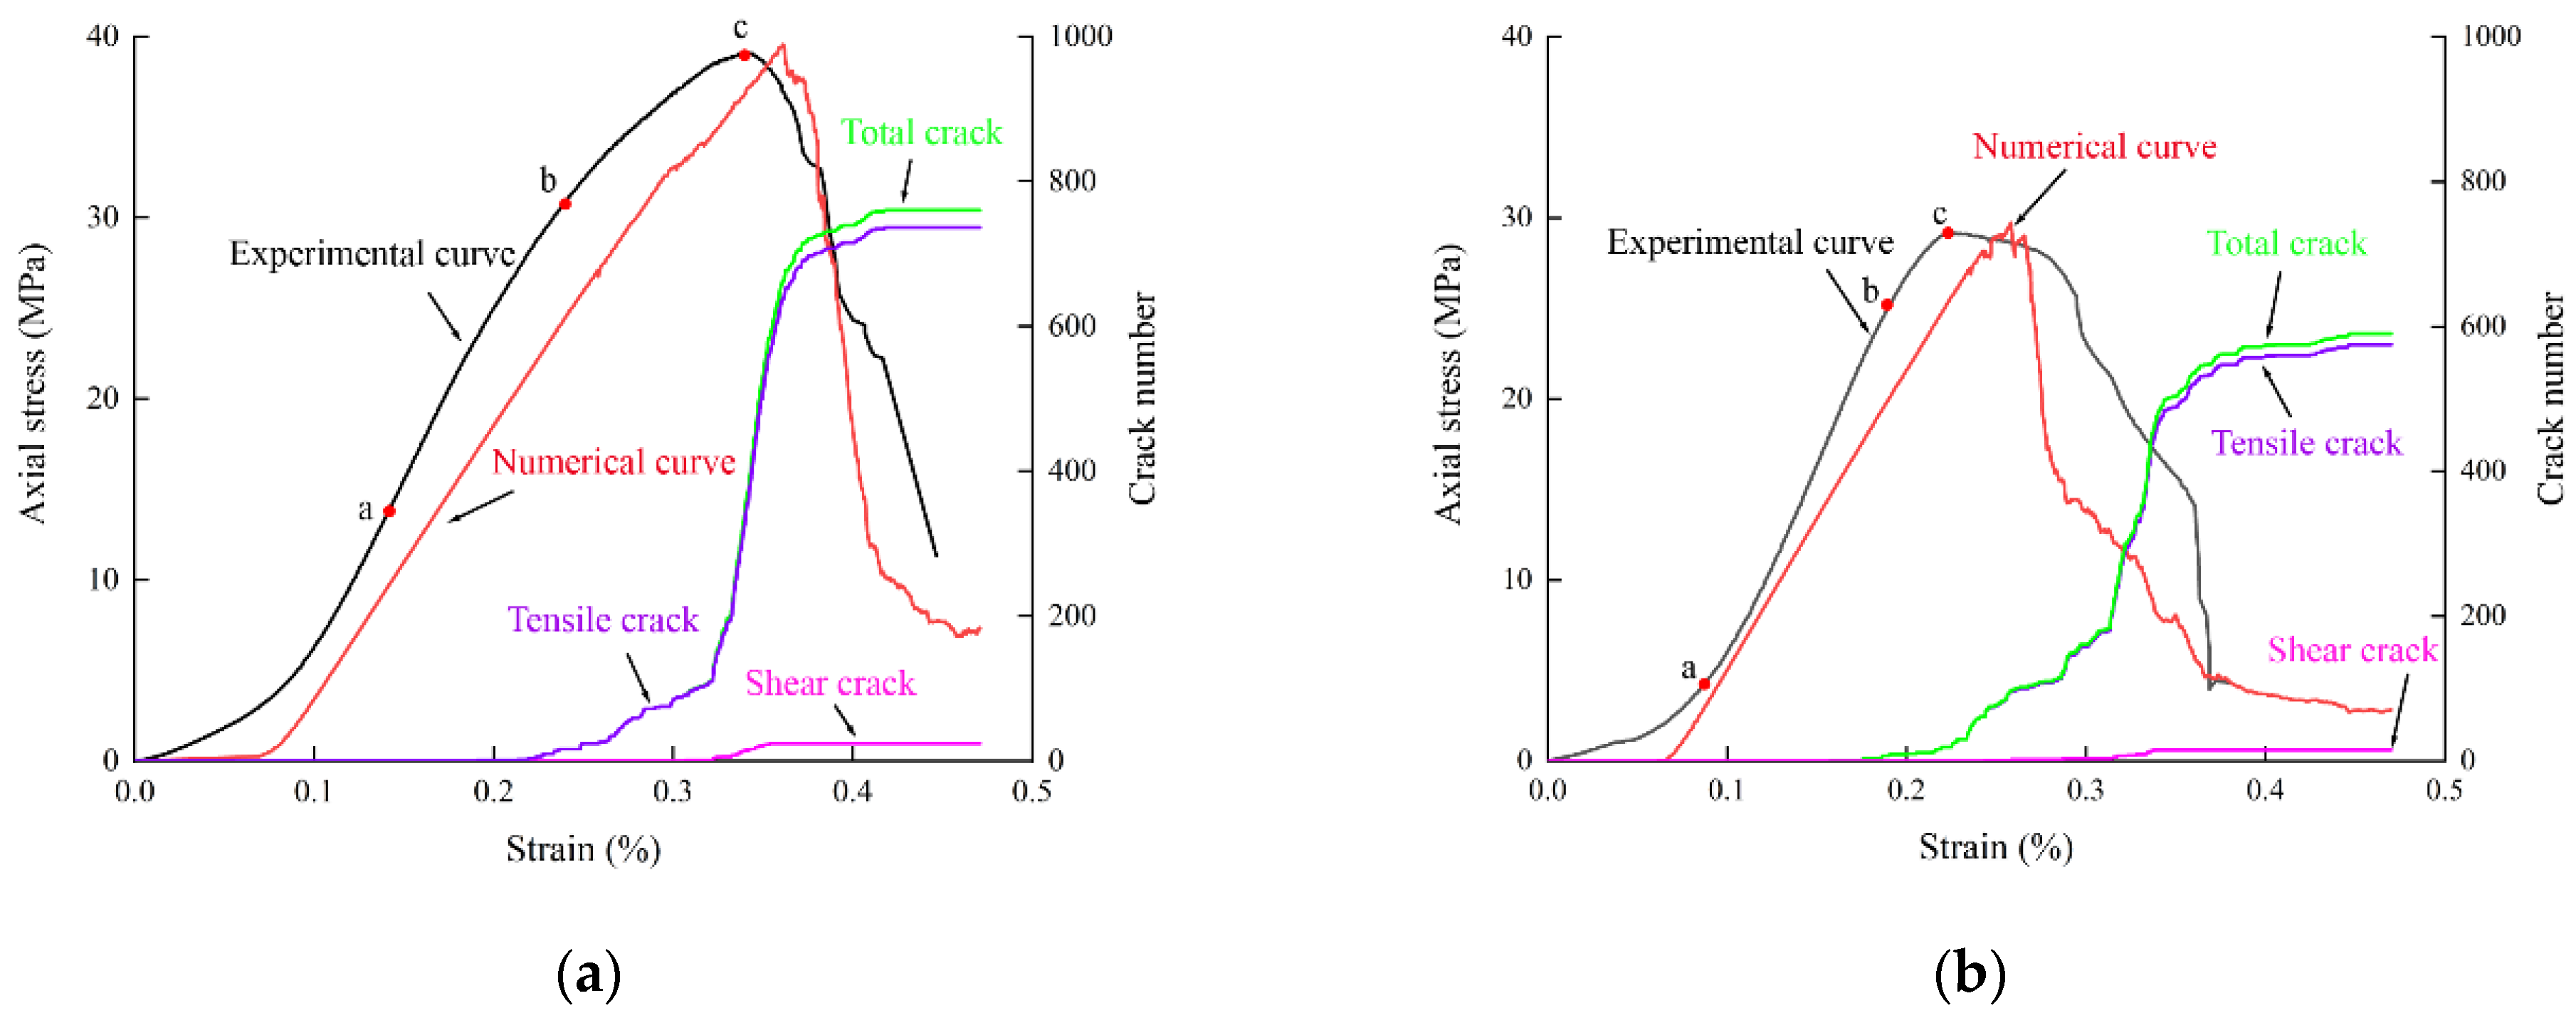
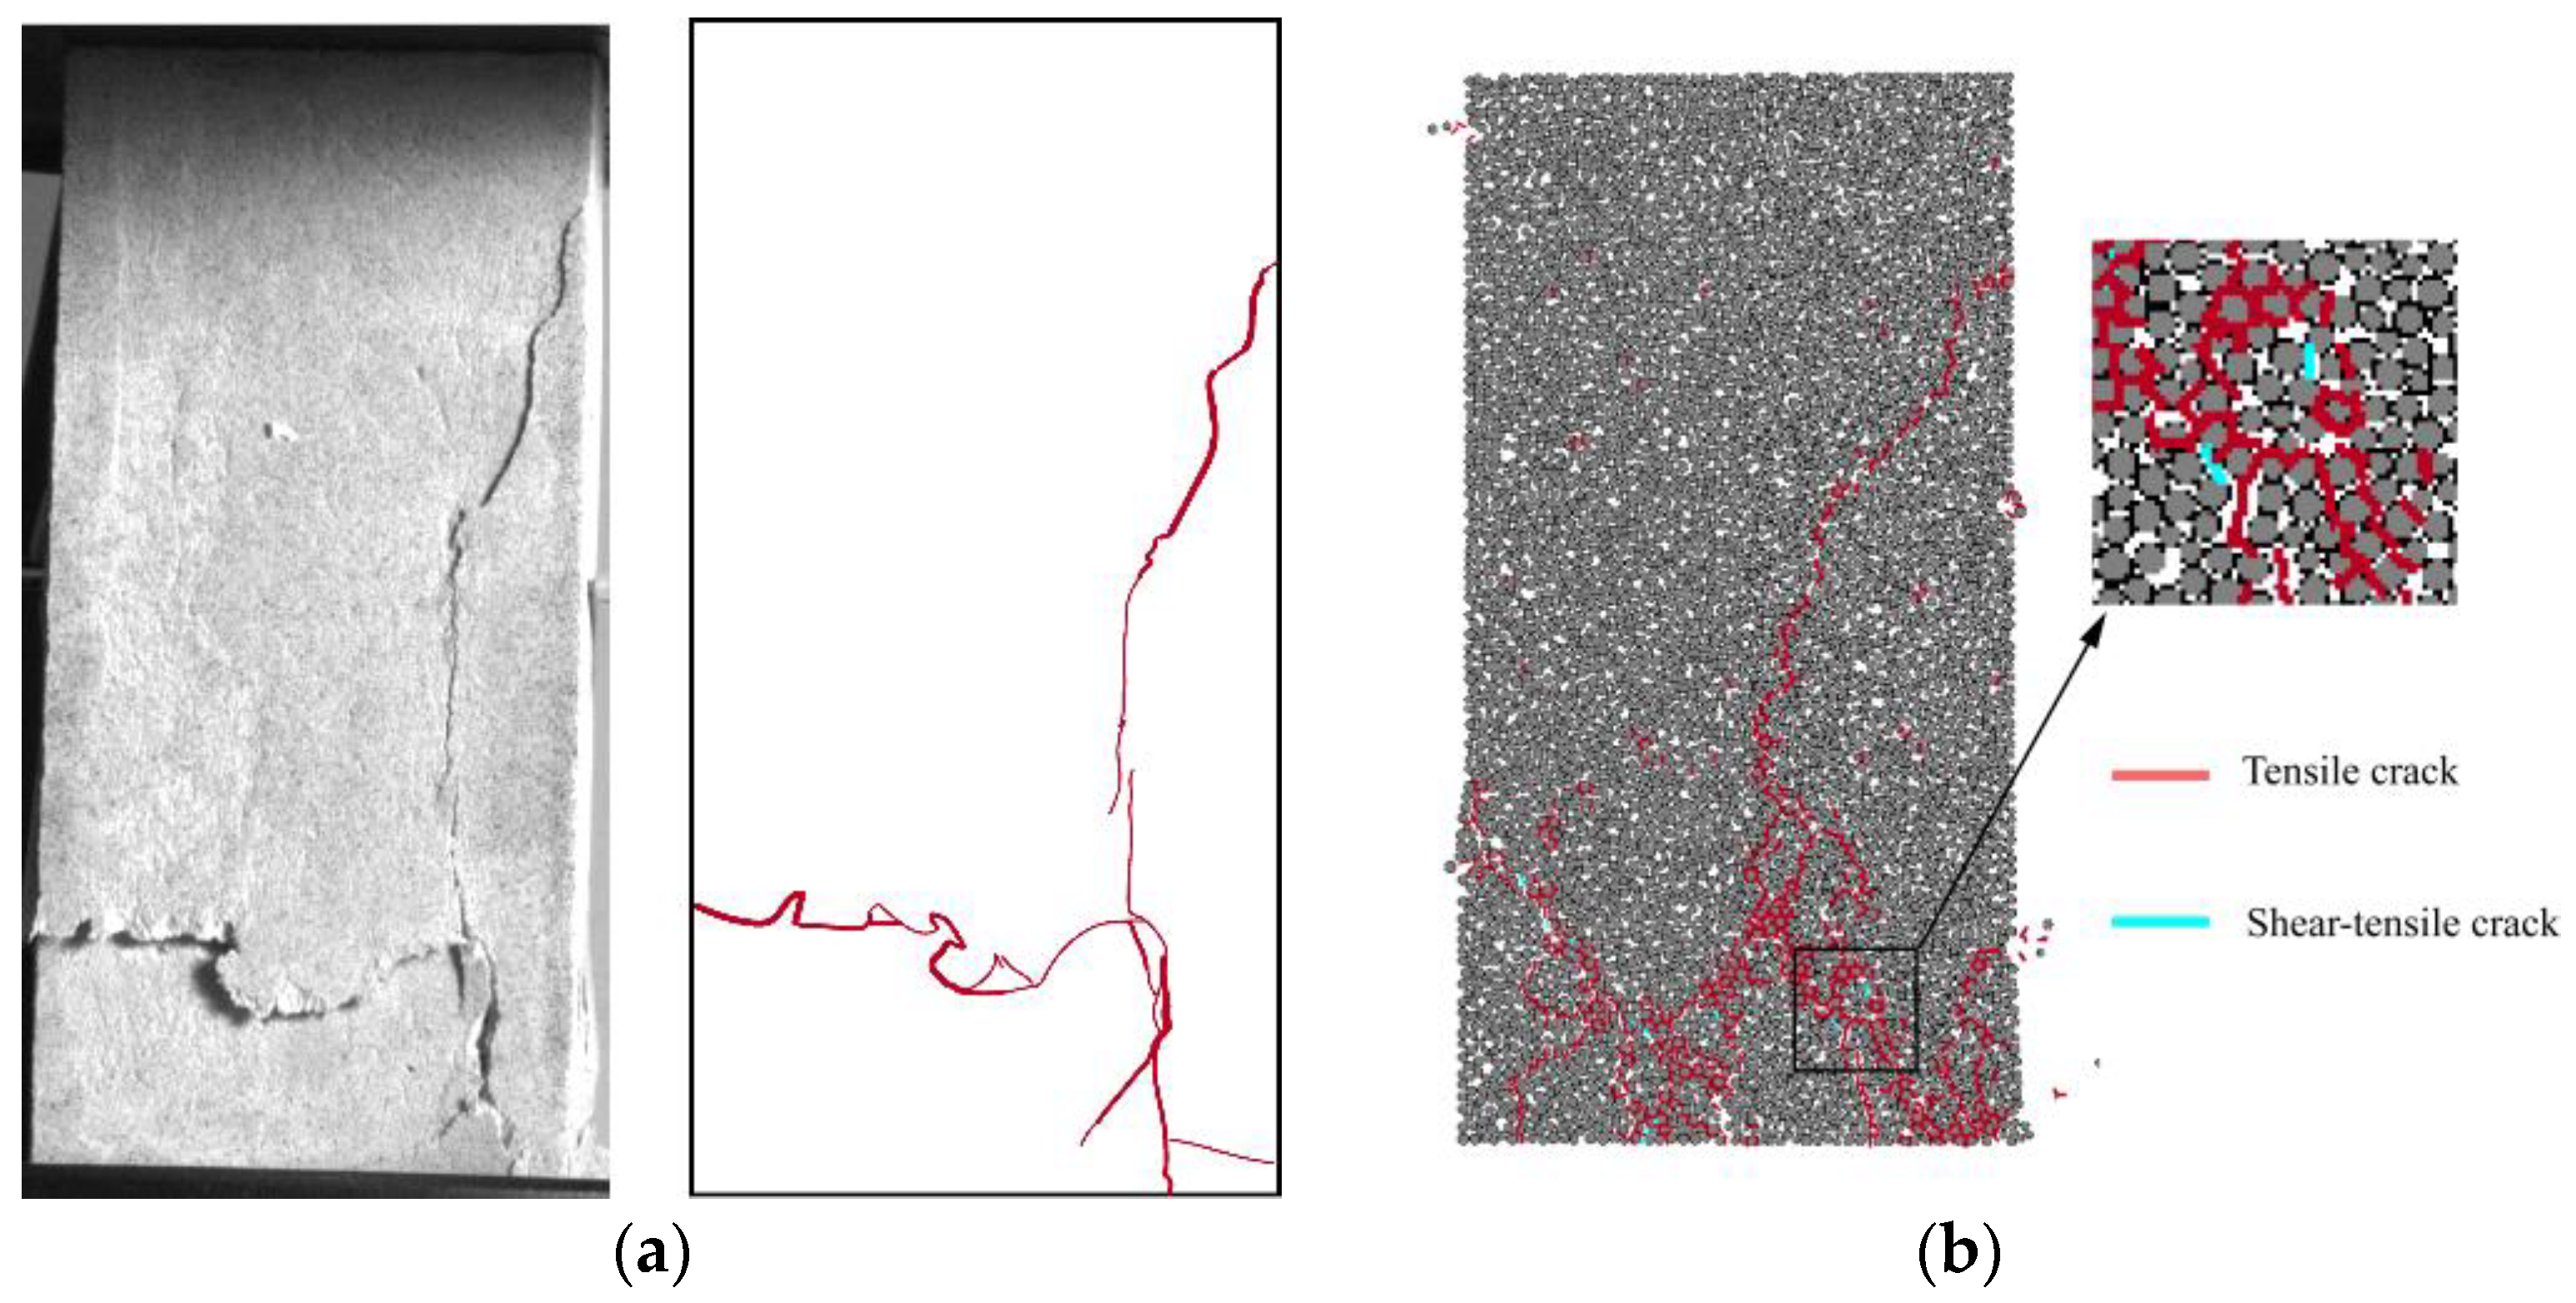
  • The geometry of the conjugate crack affects the location of the crack clusters in the rock specimens. Except for the conjugate cracks with β = 45°, the positions of crack clusters in specimens with conjugate crack clusters are biased towards the lower part of the specimen. The numerical simulation results show that the damage caused by secondary cracks generated by tensile cracks dominates the crack extension process and is the main controlling crack leading to the decrease in rock-bearing capacity;
  • The positive correlation between specimen integrity and energy dissipation rate was verified using the energy dissipation rate method. The crack development law of multiple conjugate crack combination specimens under uniaxial compression conditions was obtained, which helps to infer the process of crack initiation, expansion, and merging in fractured pressure-bearing rock bodies in actual engineering.
In this study, the mechanical properties and failure characteristics of rock samples with conjugate cracks under uniaxial loading are compared and analyzed by combining laboratory tests and numerical simulations, which provides a new reference type for the identification of internal cracks in natural rock mass in practical engineering. This study only analyzes the characteristics of conjugate crack failure under uniaxial loading conditions, and the subsequent plan is to change the stress path to study the development of secondary cracks under different loading conditions.

Author Contributions

Conceptualization, K.W.; data curation, W.Z., Y.Y. and T.X.; funding acquisition, K.W.; investigation, J.Z.; methodology, K.W. and J.Z.; resources, W.Z. and Y.Y.; software, W.Z. and T.X.; writing—original draft, J.Z.; writing—review and editing, J.Z. and Y.Y. All authors have read and agreed to the published version of the manuscript.

Funding

National Natural Science Foundation of China: 51679215; Science Technology Department of Zhejiang Province: LGF21E090005.

Institutional Review Board Statement

Not applicable.

Informed Consent Statement

Not applicable.

Data Availability Statement

The data supporting our findings and analyses are contained in the article itself. Readers can access this data by referring to the article.

Acknowledgments

The research described in this paper is financially supported by Zhejiang University of Technology. The authors are grateful for the financial support from the Science Technology Department of Zhejiang Province (LGF21E090005).

Conflicts of Interest

The authors declare no conflicts of interest.

References

  1. Yang, S.Q.; Yang, D.S.; Jing, H.W.; Li, Y.H.; Wang, S.Y. An experimental study of the fracture coalescence behaviour of brittle sandstone specimens containing three fissures. Rock Mech. Rock Eng. 2011, 45, 563–582. [Google Scholar] [CrossRef]
  2. Shi, G.H.; Goodman, R.E. Generalization of two-dimensional discontinuous deformation analysis for forward modelling. Int. J. Numer. Anal. Methods Geomech. 1989, 13, 359–380. [Google Scholar] [CrossRef]
  3. Hoek, E.; Brown, E.T. The Hoek–Brown failure criterion and GSI–2018 edition. J. Rock Mech. Geotech. Eng. 2019, 11, 445–463. [Google Scholar] [CrossRef]
  4. Dong, P.; Wu, B.; Xia, K.; Wang, Q. Fracture modes of single-flawed rock-like material plates subjected to dynamic compression. Int. J. Geomech. 2020, 20, 04020145. [Google Scholar] [CrossRef]
  5. Priest, S.D.; Hudson, J.A. Discontinuity spacings in rock. Int. J. Rock Mech. Min. Sci. Geomech. Abstr. 1976, 13, 135–148. [Google Scholar] [CrossRef]
  6. Bobet, A.; Einstein, H. Fracture coalescence in rock-type materials under uniaxial and biaxial compression. Int. J. Rock Mech. Min. Sci. 1998, 35, 863–888. [Google Scholar] [CrossRef]
  7. Afolagboye, L.O.; He, J.; Wang, S. Experimental study on cracking behaviour of moulded gypsum containing two non-parallel overlapping flaws under uniaxial compression. Acta Mech. Sin. 2017, 33, 394–405. [Google Scholar] [CrossRef]
  8. Ingraffea, A.R.; Heuze, F.E. Finite element models for rock fracture mechanics. Int. J. Numer. 1980, 4, 25–43. [Google Scholar] [CrossRef]
  9. Yang, S.Q.; Huang, Y.H.; Jing, H.W.; Liu, X.R. Discrete element modeling on fracture coalescence behavior of red sandstone containing two unparallel fissures under uniaxial compression. Eng. Geol. 2014, 178, 28–48. [Google Scholar] [CrossRef]
  10. Hoek, E.; Bieniawski, Z.T. Brittle fracture propagation in rock under compression. Int. J. Fract. 1973, 1, 137–155. [Google Scholar] [CrossRef]
  11. Bahat, D.; Frid, V.; Rabinovitch, A.; Palchik, V. Exploration via electromagnetic radiation and fractographic methods of fracture properties induced by compression in glass-ceramic. Int. J. Fract. 2002, 116, 179–194. [Google Scholar] [CrossRef]
  12. Bombolakis, E.G. Study of the brittle fracture process under uniaxial compression in crystalline rock. Tectonophysics 1973, 18, 231–248. [Google Scholar] [CrossRef]
  13. Vallejo, L.E. The influence of fissures in a stiff clay subjected to direct shear. Géotechnique 1987, 37, 69–82. [Google Scholar] [CrossRef]
  14. Cao, R.H.; Cao, P.; Lin, H.; Pu, C.Z.; Ou, K. Mechanical behavior of brittle rock-like specimens with pre-existing fissures under uniaxial loading: Experimental studies and particle mechanics approach. Rock Mech. Rock Eng. 2016, 49, 763–783. [Google Scholar] [CrossRef]
  15. Dyskin, A.V.; Sahouryeh, E.; Jewell, R.J.; Joer, H.; Ustinov, K.B. Influence of shape and locations of initial 3-D cracks on their growth in uniaxial compression. Eng. Fract. Mech. 2003, 70, 2115–2136. [Google Scholar] [CrossRef]
  16. Liu, Y.; Dai, F.; Fan, P.; Xu, N.; Dong, L. Experimental investigation of the influence of joint geometric configurations on the mechanical properties of intermittent jointed rock models under cyclic uniaxial compression. Rock Mech. Rock Eng. 2017, 50, 1453–1471. [Google Scholar] [CrossRef]
  17. Rabinovitch, A.; Zlotnikov, R.; Bahat, D. Flaw length distribution measurement in brittle materials. J. Appl. Phys. 2000, 87, 7720–7725. [Google Scholar] [CrossRef]
  18. Rabinovitch, A.; Bahat, D. Differentiation of crack branching types in fractured glass. Europhys. Lett. 2011, 95, 16003. [Google Scholar] [CrossRef]
  19. Wong, R.H.C.; Chau, K.T.; Tang, C.A.; Lin, P. Analysis of crack coalescence in rock-like materials containing three flawsFPart I: Experimental approach. Int. J. Rock Mech. Min. Sci. 2001, 38, 909–924. [Google Scholar] [CrossRef]
  20. Le, H.; Sun, S.; Kulatilake, P.H.S.W.; Wei, J. Effect of Grout on Mechanical Properties and Cracking Behavior of Rock-Like Specimens Containing a Single Flaw under Uniaxial Compression. Int. J. Geomech. 2018, 18, 04018129. [Google Scholar] [CrossRef]
  21. Sivakumar, G.; Maji, V.B. Crack growth in rocks with preexisting narrow flaws under uniaxial compression. Int. J. Geomech. 2021, 21, 04021032. [Google Scholar] [CrossRef]
  22. Hosseini-Tehrani, P.; Hosseini-Godarzi, A.R.; Tavangar, M. Boundary element analysis of stress intensity factor KI in some two-dimensional dynamic thermoelastic problems. Eng. Anal. Bound. Elem. 2005, 29, 232–240. [Google Scholar] [CrossRef]
  23. Lu, X.; Wu, W.-l. A subregion DRBEM formulation for the dynamic analysis of two-dimensional cracks. Math. Comput. Model. 2006, 43, 76–88. [Google Scholar] [CrossRef]
  24. Damjanac, B.; Board, M.; Lin, M.; Kicker, D.; Leem, J. Mechanical degradation of emplacement drifts at Yucca Mountain—A modeling case study. Int. J. Rock Mech. Min. Sci. 2007, 44, 368–399. [Google Scholar] [CrossRef]
  25. Xu, H.; Qin, Y.; Wang, G.; Fan, C.; Wu, M.; Wang, R. Discrete element study on mesomechanical behavior of crack propagation in coal samples with two prefabricated fissures under biaxial compression. Powder Technol. 2020, 375, 42–59. [Google Scholar] [CrossRef]
  26. Zhang, X.-P.; Wong, L.N.Y. Cracking processes in rock-like material containing a single flaw under uniaxial compression: A numerical study based on parallel bonded-particle model approach. Rock Mech. Rock Eng. 2012, 45, 711–737. [Google Scholar] [CrossRef]
  27. Bai, J.; Dou, L.; Li, X.; Ma, X.; Lu, F.; Han, Z. Evolution Laws of Stress–Energy and Progressive Damage Mechanisms of Surrounding Rock Induced by Mining Disturbance. Appl. Sci. 2023, 13, 7759. [Google Scholar] [CrossRef]
  28. Zhang, J.; He, Y.; Yang, T.; Bai, W.; Gao, S.; Yan, Y. Study on the Co-Evolution Mechanism of Key Strata and Mining Fissure in Shallow Coal Seam Mining. Appl. Sci. 2023, 13, 8036. [Google Scholar] [CrossRef]
  29. Zhang, X.-P.; Wong, L.N.Y. Crack initiation, propagation and coalescence in rock-like material containing two flaws: A numerical study based on bonded-particle model approach. Rock Mech. Rock Eng. 2013, 46, 1001–1021. [Google Scholar] [CrossRef]
  30. Fan, P.; Liu, J.; Zuo, W.; Wang, M.; Zhang, D. Experimental Study of Rock-like Materials with Two Unequal Parallel Preexisting Fissures under Uniaxial Compression. Appl. Sci. 2022, 12, 10404. [Google Scholar] [CrossRef]
  31. Wu, B.; Liu, Q.; Fu, Q.; Yang, Q.; Chen, Q. Damage Mechanism of Prefabricated Fracture-Grouted Rock Specimens under the Action of Dry and Wet Cycles. Appl. Sci. 2023, 13, 3631. [Google Scholar] [CrossRef]
  32. Cho, N.; Martin, C.D.; Sego, D.C. A clumped particle model for rock. Int. J. Rock Mech. Min. Sci. 2007, 44, 997–1010. [Google Scholar] [CrossRef]
  33. Cao, R.; Dai, H.; Yao, R.; Lin, H.; Li, K. Failure Behaviour of Jointed Rock Masses with 3D Nonpenetrating Joints under Uniaxial Compression: Insights from Discrete Element Method Modelling. Appl. Sci. 2022, 12, 11027. [Google Scholar] [CrossRef]
  34. Park, C.H.; Bobet, A. Crack initiation, propagation and coalescence from frictional flaws in uniaxial compression. Eng. Fract. Mech. 2010, 77, 2727–2748. [Google Scholar] [CrossRef]
  35. Zhang, B.; Li, Y.; Yang, X.Y.; Li, S.C.; Liu, B.; Xu, Z.H.; Pei, Y. Influence of two cross-flaws geometry on the strength and crack coalescence of eock-like material specimens under uniaxial compression. Int. J. Geomech. 2020, 20, 04020134. [Google Scholar] [CrossRef]
  36. Liang, D.; Zhang, N.; Liu, H.; Fukuda, D.; Rong, H. Hybrid finite-discrete element simulator based on GPGPU-parallelized computation for modelling crack initiation and coalescence in sandy mudstone with prefabricated cross-flaws under uniaxial compression. Eng. Fract. Mech. 2021, 247, 107658. [Google Scholar] [CrossRef]
  37. Li, K.S.; Zhao, Z.; Ma, D.P.; Liu, C.X.; Zhang, J.P. Acoustic emission and mechanical characteristics of rock-like material containing single crack under uniaxial compression. Arab. J. Sci. Eng. 2022, 47, 4749–4761. [Google Scholar] [CrossRef]
  38. GB/T 2015-2017; White Portland Cement. Standards Press of China: Beijing, China, 2017.
  39. GB/T 14684-2022; Sand for Construction. Standards Press of China: Beijing, China, 2022.
  40. Zhou, X.-P.; Zhang, J.-Z.; Wong, L.N.Y. Experimental study on the growth, coalescence and wrapping behaviors of 3D cross-embedded flaws under uniaxial compression. Rock Mech. Rock Eng. 2018, 51, 1379–1400. [Google Scholar] [CrossRef]
  41. Blaber, J.; Adair, B.; Antoniou, A. Ncorr: Open-Source 2D Digital Image Correlation Matlab Software. Exp. Mech. 2015, 55, 1105–1122. [Google Scholar] [CrossRef]
  42. Feng, P.; Xu, Y.; Dai, F. Effects of dynamic strain rate on the energy dissipation and fragment characteristics of cross-fissured rocks. Int. J. Rock Mech. Min. Sci. 2021, 138, 104600. [Google Scholar] [CrossRef]
  43. Chu, T.C.; Ranson, W.F.; Sutton, M.A. Applications of Digital.Image-CorrelationTechniques to Experimental Mechanics. Exp. Mech. 1985, 25, 232–244. [Google Scholar]
  44. Pan, B. Digital image correlation for surface deformation measurement: Historical developments, recent advances and future goals. Meas. Sci. Technol. 2018, 29, 082001. [Google Scholar] [CrossRef]
  45. Potyondy, D.O. Simulating stress corrosion with a bonded-particle model for rock. Int. J. Rock Mech. Min. Sci. 2007, 44, 677–691. [Google Scholar] [CrossRef]
  46. Yao, D.; Jiang, N.; Wang, X.; Jia, X.; Lv, K. Mechanical behaviour and failure characteristics of rocks with composite defects of different angle fissures around hole. Bull. Eng. Geol. Environ. 2022, 81, 290. [Google Scholar] [CrossRef]
  47. Wang, K.; Zhang, C.; Gao, Y.; Chen, H.; Xie, T. Influence of prefabricated fissure combinations on strength and failure characteristics of rock-like specimens under uniaxial compression. Int. J. Geomech. 2023, 23, 04022279. [Google Scholar] [CrossRef]
  48. Guo, W.Y.; Zhang, D.X.; Zhao, T.B.; Li, Y.R.; Zhao, Y.Q.; Wang, C.W.; Wu, W.B. Influence of rock strength on the mechanical characteristics and energy evolution law of gypsum-rock combination specimen under cyclic loading-unloading condition. Int. J. Geomech. 2022, 22, 16. [Google Scholar] [CrossRef]
Figure 1. Schematic diagram of prefabricated fracture specimen (Type IV).
Applsci 14 00823 g001
Figure 2. Test machine and related test instruments: (a) precast specimen; (b) loading equipment.
Applsci 14 00823 g002
Figure 3. Schematic diagram of the principle of the DIC algorithm.
Applsci 14 00823 g003
Figure 4. (a) Intact specimen generated in PFC2D; (b) Stress–strain curves for all specimens.
Applsci 14 00823 g004
Figure 5. Numerical simulation and experimental data comparison: (a) peak stress; (b) Young’s modulus.
Applsci 14 00823 g005
Figure 6. Stress–strain curve and crack number of different types: (a) Type I; (b) Type II. (‘a’ represents the transition point from the compression stage to the elastic stage, ‘b’ represents the boundary point between the elastic stage and the plastic stage, and ‘c’ represents the boundary point between the plastic stage and the failure stage).
Applsci 14 00823 g006
Figure 7. The evolution of the principal strain field on the surface of Type I specimen: (a) Stage 1; (b) Stage 2; (c) Stage 3; and (d) Stage 4.
Applsci 14 00823 g007
Figure 8. Photographs and numerical simulation results of specimens at the end of loading (Type I): (a) experimental; (b) numerical.
Applsci 14 00823 g008
Figure 9. The evolution of the principal strain field on the surface of Type II specimen: (a) Stage 1; (b) Stage 2; (c) Stage 3; and (d) Stage 4.
Applsci 14 00823 g009
Figure 10. Photographs and numerical simulation results of specimens at the end of loading (Type II): (a) experimental; (b) numerical.
Applsci 14 00823 g010
Figure 11. Stress-strain curves and number of cracks of different types: (a) Type III; (b) Type IV; (c) Type V; (d) Type VI. (‘a’ represents the transition point from the compression stage to the elastic stage, ‘b’ represents the boundary point between the elastic stage and the plastic stage, and ‘c’ represents the boundary point between the plastic stage and the failure stage).
Applsci 14 00823 g011
Figure 12. The evolution of the principal strain field on the surface of Type III specimen: (a) Stage 1; (b) Stage 2; (c) Stage 3; and (d) Stage 4.
Applsci 14 00823 g012
Figure 13. Photographs and numerical simulation results of specimens at the end of loading (Type III): (a) experimental; (b) numerical.
Applsci 14 00823 g013
Figure 14. The evolution of the principal strain field on the surface of Type IV specimen: (a) Stage 1; (b) Stage 2; (c) Stage 3; and (d) Stage 4.
Applsci 14 00823 g014
Figure 15. Photographs and numerical simulation results of specimens at the end of loading (Type IV): (a) experimental; (b) numerical.
Applsci 14 00823 g015
Figure 16. The evolution of the principal strain field on the surface of Type V specimen: (a) Stage 1; (b) Stage 2; (c) Stage 3; and (d) Stage 4.
Applsci 14 00823 g016
Figure 17. Photographs and numerical simulation results of specimens at the end of loading (Type V): (a) experimental; (b) numerical.
Applsci 14 00823 g017
Figure 18. The evolution of the principal strain field on the surface of Type VI specimen: (a) Stage 1; (b) Stage 2; (c) Stage 3; and (d) Stage 4.
Applsci 14 00823 g018
Figure 19. Photographs and numerical simulation results of specimens at the end of loading (Type VI): (a) experimental; (b) numerical.
Applsci 14 00823 g019
Figure 20. Principle of energy dissipation rate and calculation results: (a) regional representation of strain energy; (b) peak intensity strain energy ratio of the specimen.
Applsci 14 00823 g020
Table 1. Geometric parameters of prefabricated specimens.
SpecimenGeometric AngleGeometrical Length
Type I: intact sample//
Type II α 1 = α 2 = 45°, β = 2 a = 20 mm, 2 L = 30 mm
Type III α 1 = α 2 = 45°, β = 30°
Type IV α 1 = α 2 = 45°, β = 45°
Type V α 1 = α 2 = 45°, β = 60°
Type VI α 1 = α 2 = 45°, β = 90°
Table 2. Experimental data and numerical simulation parameters for intact sample.
MaterialsRock-like MaterialsValue
Rock-like materialsPoisson ratio0.238
Young’s modulus E (GPa)14.435
Uniaxial compressive strength, UCS (MPa)39.419
Particle parametersR (mm)0.6–0.9
Particle stiffness ratio ( k n / k s )1.15
Particle friction1.6
Parameters of simulated specimenTensile strength σ ¯ t (MPa)39.6
Cohesion c ¯ (MPa)39.6
Elastic modulus E ¯ c (MPa)18.7
Particle porosity0.04
Density2387
Disclaimer/Publisher’s Note: The statements, opinions and data contained in all publications are solely those of the individual author(s) and contributor(s) and not of MDPI and/or the editor(s). MDPI and/or the editor(s) disclaim responsibility for any injury to people or property resulting from any ideas, methods, instructions or products referred to in the content.

