Article

Optimal Allocation of Distributed Generations and Capacitor Banks in Distribution Systems Using Arithmetic Optimization Algorithm

Department of Electrical Electronics Engineering, Zonguldak Bulent Ecevit University, 67100 Zonguldak, Turkey
*
Author to whom correspondence should be addressed.
Appl. Sci. 2024, 14(2), 831; https://doi.org/10.3390/app14020831
Submission received: 23 October 2023 / Revised: 15 January 2024 / Accepted: 17 January 2024 / Published: 18 January 2024

Abstract

:
In this paper, an optimization approach based on an arithmetic optimization algorithm (AOA) is proposed for specifying the optimal allocation of distribution generations/generators (DGs) and capacitor banks (CBs) in radial distribution systems. The AOA is a new population-based meta-heuristic algorithm that is essentially based on using basic arithmetic operators in mathematics. The proposed approach is employed to specify the optimum placement, capacity, and power factor of DGs and CBs to decrease the distribution systems’ total power loss and voltage deviation. To state the performance of the proposed approach, DGs and CBs are placed in IEEE 33-bus and 69-bus systems separately or together. When only DGs are used and the parameters of location, capacity, and power factor of DGs are determined simultaneously, the total active power loss reductions in the IEEE 33-bus and 69-bus systems are achieved at 94.42% and 98.03%, respectively. When the results of other optimization algorithms are examined, it is seen that better results are obtained with AOA.

1. Introduction

Electrical power systems consist of three subsystems: generation, transmission, and distribution [1]. Since the distribution systems are the part which is closest to consumers, it is considerably important to transmit electricity with quality and high reliability [2]. In recent years, the increase in the demand for electricity and the growth of electrical power systems have caused the need for both active and reactive power [3]. This demand is substantially supplied by the installation and integration of distributed generations/generators (DGs) and capacitor banks (CBs) into power systems [4]. DGs are generation units that provide active and/or reactive power to the power system, reduce power losses, and energy generation costs, and improve the voltage profile, power quality, and reliability. While DGs can be divided into two groups—conventional and renewable—according to the energy sources, they also can be divided into four groups—micro, small, medium, and large—according to capacity [5].
On the other hand, CBs are units that provide reactive power to power systems, reduce power losses, and increase bus voltages [6]. Although the use of DGs and CBs provides benefits to distribution systems, they can cause some problems. The use of large-scale DGs and CBs can affect the power flow direction, increase power losses, or reduce bus voltages [7]. Therefore, locating the optimal allocation of the DGs and CBs is vitally important.
A significant number of optimization methods have been used to determine the optimum placement and sizing of the DGs and CBs [8]. The primary objective is generally to reduce total power loss as well as to enhance voltage stability or reliability. DGs and CBs are used separately in most of the studies, while they are used simultaneously in some studies [9]. Also, DGs are generally used in unity power factor (p.f), while the optimal p.f of DGs is rarely determined [10].
The researchers have suggested different algorithms to optimally place and size the DGs in the distribution systems in the last decade. The authors of [11] suggested a two-stage method to determine the suitable sitting and sizing of DGs for a reduction in total power loss and enhancement of the voltage profile. In [12], the Fireworks Algorithm (FWA) was employed for the placement of optimum DG units in different distribution systems. In [13], the Improved Raven Roosting Optimization (IRRO) algorithm was proposed to identify optimal DGs sitting and sizing; the suggested algorithm was compared with Particle Swarm Optimization (PSO), Grey Wolf Optimizer (GWO), Modified Teaching Learning Based Optimization (MTLBO), and Jaya Algorithm (JAYA). In [14], the Coyote Optimization Algorithm (COA) was used to solve the optimum placement and capacity of DG units’ problem; this algorithm was developed to find better solutions and was called the Enhanced Coyote Optimization Algorithm (ECOA). In [15], the problem of optimum placement and capacity of DGs was solved using the Quasi-Oppositional Swine Influenza Model-Based Optimization with Quarantine (QOSIMBO-Q) algorithm, which is a developed version of the SIMBO-Q algorithm. In [16], an analytical approach (AA) that referenced active and reactive power losses was developed to find the placement and capacity of DGs and CBs in power systems under different loading conditions. In [17], the Student Psychology-Based Optimization (SPBO) algorithm was proposed for optimum allocation and capacity of DGs and compared with the Harris Hawks Optimization (HHO) algorithm.
Capacitor banks (CBs) are generally utilized to supply reactive power compensation in power systems. Determining the location and capacity of CBs before they are placed in the power system is an important issue and there are many studies on this issue in the literature. In [18], the Gravitational Search Algorithm (GSA) was proposed for optimal capacitor placement, and the suggested algorithm was compared with the Interior Point (IP) algorithm and Simulated Annealing (SA). In [19], DGs and CBs were installed separately and together by using the Bacterial Foraging Optimization Algorithm (BFOA) to minimize power losses. In [20], the Cuckoos Search Algorithm (CSA)—developed based on the breeding behavior of Cuckoos—was used for the allocation of static shunt capacitors in the distribution systems under different loading conditions.
On the other hand, there are studies in which DGs and CBs are used together to provide active and reactive power support to power systems. In [21], a Genetic Algorithm (GA) was used to place DGs and CBs to reduce total power loss and enhance voltage profile. In [22], the Water Cycle Algorithm (WCA) was proposed for the optimal placement and sizes of DGs and CBs. It aimed to provide technical, economical, and environmental advantages by using various objective functions (increasing power losses, voltage deviation, energy cost, and gas emissions) with the proposed algorithm. In [23], the Backtracking Search Algorithm (BSA) was used to resolve the integration of DGs and CBs problem. The proposed algorithm results were compared with the GA/PSO, ICA/GA, and AA algorithms in the literature.
The power factor is generally assumed to be unity when determining the optimum placement and capacity of DGs. In these circumstances, while only the active power demand of the distribution system is provided, compensation systems such as CBs are needed to provide the reactive power demand. The power factor can be adjusted dynamically by using inverter-based DGs and can inject both active and reactive power into the distribution system [24]. Thus, the total power loss and voltage profile of the distribution systems can be improved without CBs by using less equipment. For this reason, the determination of the optimum power factor of DGs is a very important issue and this issue has not been extensively analyzed in the literature.
In this paper, a constrained optimization approach based on the Arithmetic Optimization Algorithm (AOA), a population-based meta-heuristic algorithm, is proposed to find the optimum placement and capacity of DGs and CBs. In addition to the placement and capacity, the optimum power factor of each DG is determined with this constrained optimization approach. AOA, proposed by Abualigah et al. [25], has a fast convergence rate and presents high-quality solutions compared with the other mentioned optimization algorithms. This algorithm uses basic arithmetic operators (multiplication (M), division (D), subtraction (S), and addition (A)) to determine the optimum global solution. AOA consists of two main phases: exploration and exploitation. Division and multiplication operators are used in the exploration phase. These operators obtain highly distributed decisions or choices. However, they cannot approach the optimal solution smoothly because they have high dispersion. Subtraction and addition operators are used in the exploitation phase. These operators can smoothly approach the optimal solution because they have low dispersion.
AOA has been used for various optimization problems such as reconfiguration of distribution systems or specifying the optimum size and location of DG [26], battery energy storage systems [27], electric vehicle charging stations [28], wind turbines, and photovoltaic systems [29]. To the best of the authors’ knowledge, the simultaneous use of DGs and CBs has not been previously examined with the proposed algorithm. In addition, it is seen in the literature that the power factor is generally assumed to be unity in optimal allocation applications of DGs. The power factors of inverter-based DGs (e.g., solar systems or wind turbines) can be adjusted by the converters. Thus, both active power and reactive power can be provided in power systems without the need for CBs. As a result, the novelty of the paper is that the optimal placement and capacity of DGs and CBs are determined simultaneously with the proposed algorithm, and the need for CBs is eliminated by determining the optimal power factor in addition to the placement and capacity of DGs.
In this study, DGs and CBs have been placed in optimal locations with the optimal capacities separately and together in IEEE 33-bus and 69-bus systems with the AOA algorithm, and the optimum power factor of each DG is determined with the proposed algorithm. The main contributions of this paper are summarized as follows:
  • The placement and capacity of each DG and CB have been successfully determined by minimizing total power losses and voltage deviation with AOA.
  • DGs and CBs are placed in the distribution networks both separately and together under different scenarios.
  • The optimal power factor, which is an important parameter of DG and is not examined adequately in the literature, has been determined with AOA in addition to the optimal location and capacity.
  • The proposed algorithm has been implemented in the IEEE 33-bus and IEEE 69-bus systems in various scenarios and the obtained results are compared with the results of other well-known optimization methods.

2. Problem Formulation

In this section, the loss sensitivity factor (LSF) is used to find the optimum location of the DGs and/or CBs in radial systems; the main objective functions and operational constraints that are used to determine the optimum capacity and power factor are presented.

2.1. Objective Functions

The main purpose of using DGs and CBs is to reduce total power loss and provide voltage stability in radial systems. For this reason, two objective functions are employed in this study, as presented in the following subsections.

2.1.1. Reduction in Real Power Losses

The total power losses are high due to the structure of distribution systems. Therefore, a reduction in total power loss is one of the main objectives. Total power loss (f1) formula [30]:
f 1 x = m i n k = 1 N b R k I k 2
where k is the branch number, Nb is the total branch number, Rk is the branch resistance, and |Ik| is the absolute current value passing through the branch.

2.1.2. Minimization of Total Voltage Deviation

Voltage stability is defined as the ability of the power system to maintain bus voltages between certain limits, even if there is any disturbance in power systems. In power systems, bus voltages are required to be between 0.95 p.u and 1.05 p.u. Voltage deviation (f2) calculates how far the current bus voltage is from the specified bus voltage (usually 1 p.u).
f 2 x = k = 1 N b u s ( V s p V k ) 2
where Vsp is the specified bus voltage, Vk is the current voltage, and Nbus is the total bus number.

2.2. Constraints

In this study, the operational limits of the distribution system and deployed DGs and CBs are optimized for being subjected to certain constraints.

2.2.1. Equality Constraints

These constraints ensure that the distribution system operates within operational limits.
i = 1 N G P G i P l o s s = P d
i = 1 N C Q G i Q l o s s = Q d
where NG and NC are the numbers of DG and CB, respectively. PGi and QGi are the generated active and reactive power of installed DG and CB, respectively. Ploss and Qloss are the active and reactive power losses, respectively. Pd and Qd are the active and reactive power demands of the power system, respectively.

2.2.2. Inequality Constraints

These constraints ensure that the distribution system operates within operational limits.
(1)
Active power limits of each DG
P G i m i n P G i P G i m a x
(2)
Reactive power limits of each CB
Q G i m i n Q G i Q G i m a x
(3)
Voltage limits
0.95 V k 1.05
(4)
Power factor limits
0.7 p . f 1
(5)
Total active power injection
P G i t o t a l P L t o t a l
(6)
Total reactive power injection
Q G i t o t a l Q L t o t a l
where P G i m i n and P G i m a x are the minimum and maximum active power limits of each DG, respectively. Q G i m i n and Q G i m a x are the minimum and maximum reactive power limits of each CB, respectively. P G i t o t a l and Q G i t o t a l are the total active power generated by all DGs and total reactive power generated by all CBs, respectively. P L t o t a l and Q L t o t a l are total active and reactive load, respectively.

2.3. Optimal Location

At present, determining the optimal location of DGs is a crucial issue in terms of the power produced by DGs being delivered reliably and efficiently to consumers. For this reason, monitoring and controlling the power produced by DGs, managing the power flow, ensuring system reliability, and maintaining the balance between supply and demand are necessary. Generally, DGs owners determine the optimal location of DGs according to the maximum profit that can be achieved, without paying attention to the aforementioned. However, a distribution company (DISCO) which distributes electrical energy under license determines the optimal DG location to meet consumer demand with maximum profit and create the best investment plan for the network. In some regions, the name distribution system operator (DSO) is used interchangeably with DISCO, but DSO is responsible specifically for managing and optimizing the distribution system. In some cases, DSO or DISCO may be an independent entity. This entity is called the independent distribution system operator (IDSO), and it aims to increase transparency and efficiency in the electricity distribution sector. Also, distribution system planning and determining the location of DGs can be carried out optimally with IDSO. In this study, it is assumed that the optimal locations of DGs are determined through the IDSO; bear in mind that the definitions between DISCO, DSO, and IDSO may vary between different regions and countries and may not be universally applicable in every electricity distribution system [31].
The optimal placements of DGs and/or CBs are pre-identified with LSF. First, the LSF values of all buses in the distribution system are calculated and ordered from largest to smallest. Then, the buses at the top of the list are chosen as candidate buses for the optimal location of DG and/or CB. Finally, DG and/or CB are installed on the candidate buses in the optimization algorithm, and the placement of the bus that reduces the most power losses is determined as the optimal location. The determination of the optimal location of DGs and/or CBs is expressed in Figure 1.

Loss Sensitivity Factor

Considering a two-bus distribution system as in Figure 2, the active power losses of the line in the distribution system can be calculated as:
P l o s s k = R k I k 2 = R k P e f f / r 2 + Q e f f / r 2 V r 2
where V s and V r are the voltage magnitudes at the sending and receiving buses, respectively. δ s and δ r are the phase angles at the sending and receiving buses, respectively. R k and X k are the resistance and reactance of the line, respectively. P e f f / r 2 and Q e f f / r 2 are the sums of the effective active and effective reactive power at the receiving bus, respectively, and I k is the current flowing through the line.
The LSF given in Equation (12) is obtained when Equation (11) first derivatives according to the reactive power [32].
L S F = P l o s s k Q e f f / r = 2 Q e f f / r R k V r 2

2.4. Optimal Capacity and Power Factor

The optimal capacity of each DG and CB is calculated using the minimum and maximum limits in Equations (5) and (6). In addition, the total active power of all DGs ( P G i t o t a l ) should not exceed the total active load ( P L t o t a l ), and the total reactive power of all CBs ( Q G i t o t a l ) should not exceed the total reactive load ( Q L t o t a l ). This is determined by considering the constraints in Equations (9) and (10).
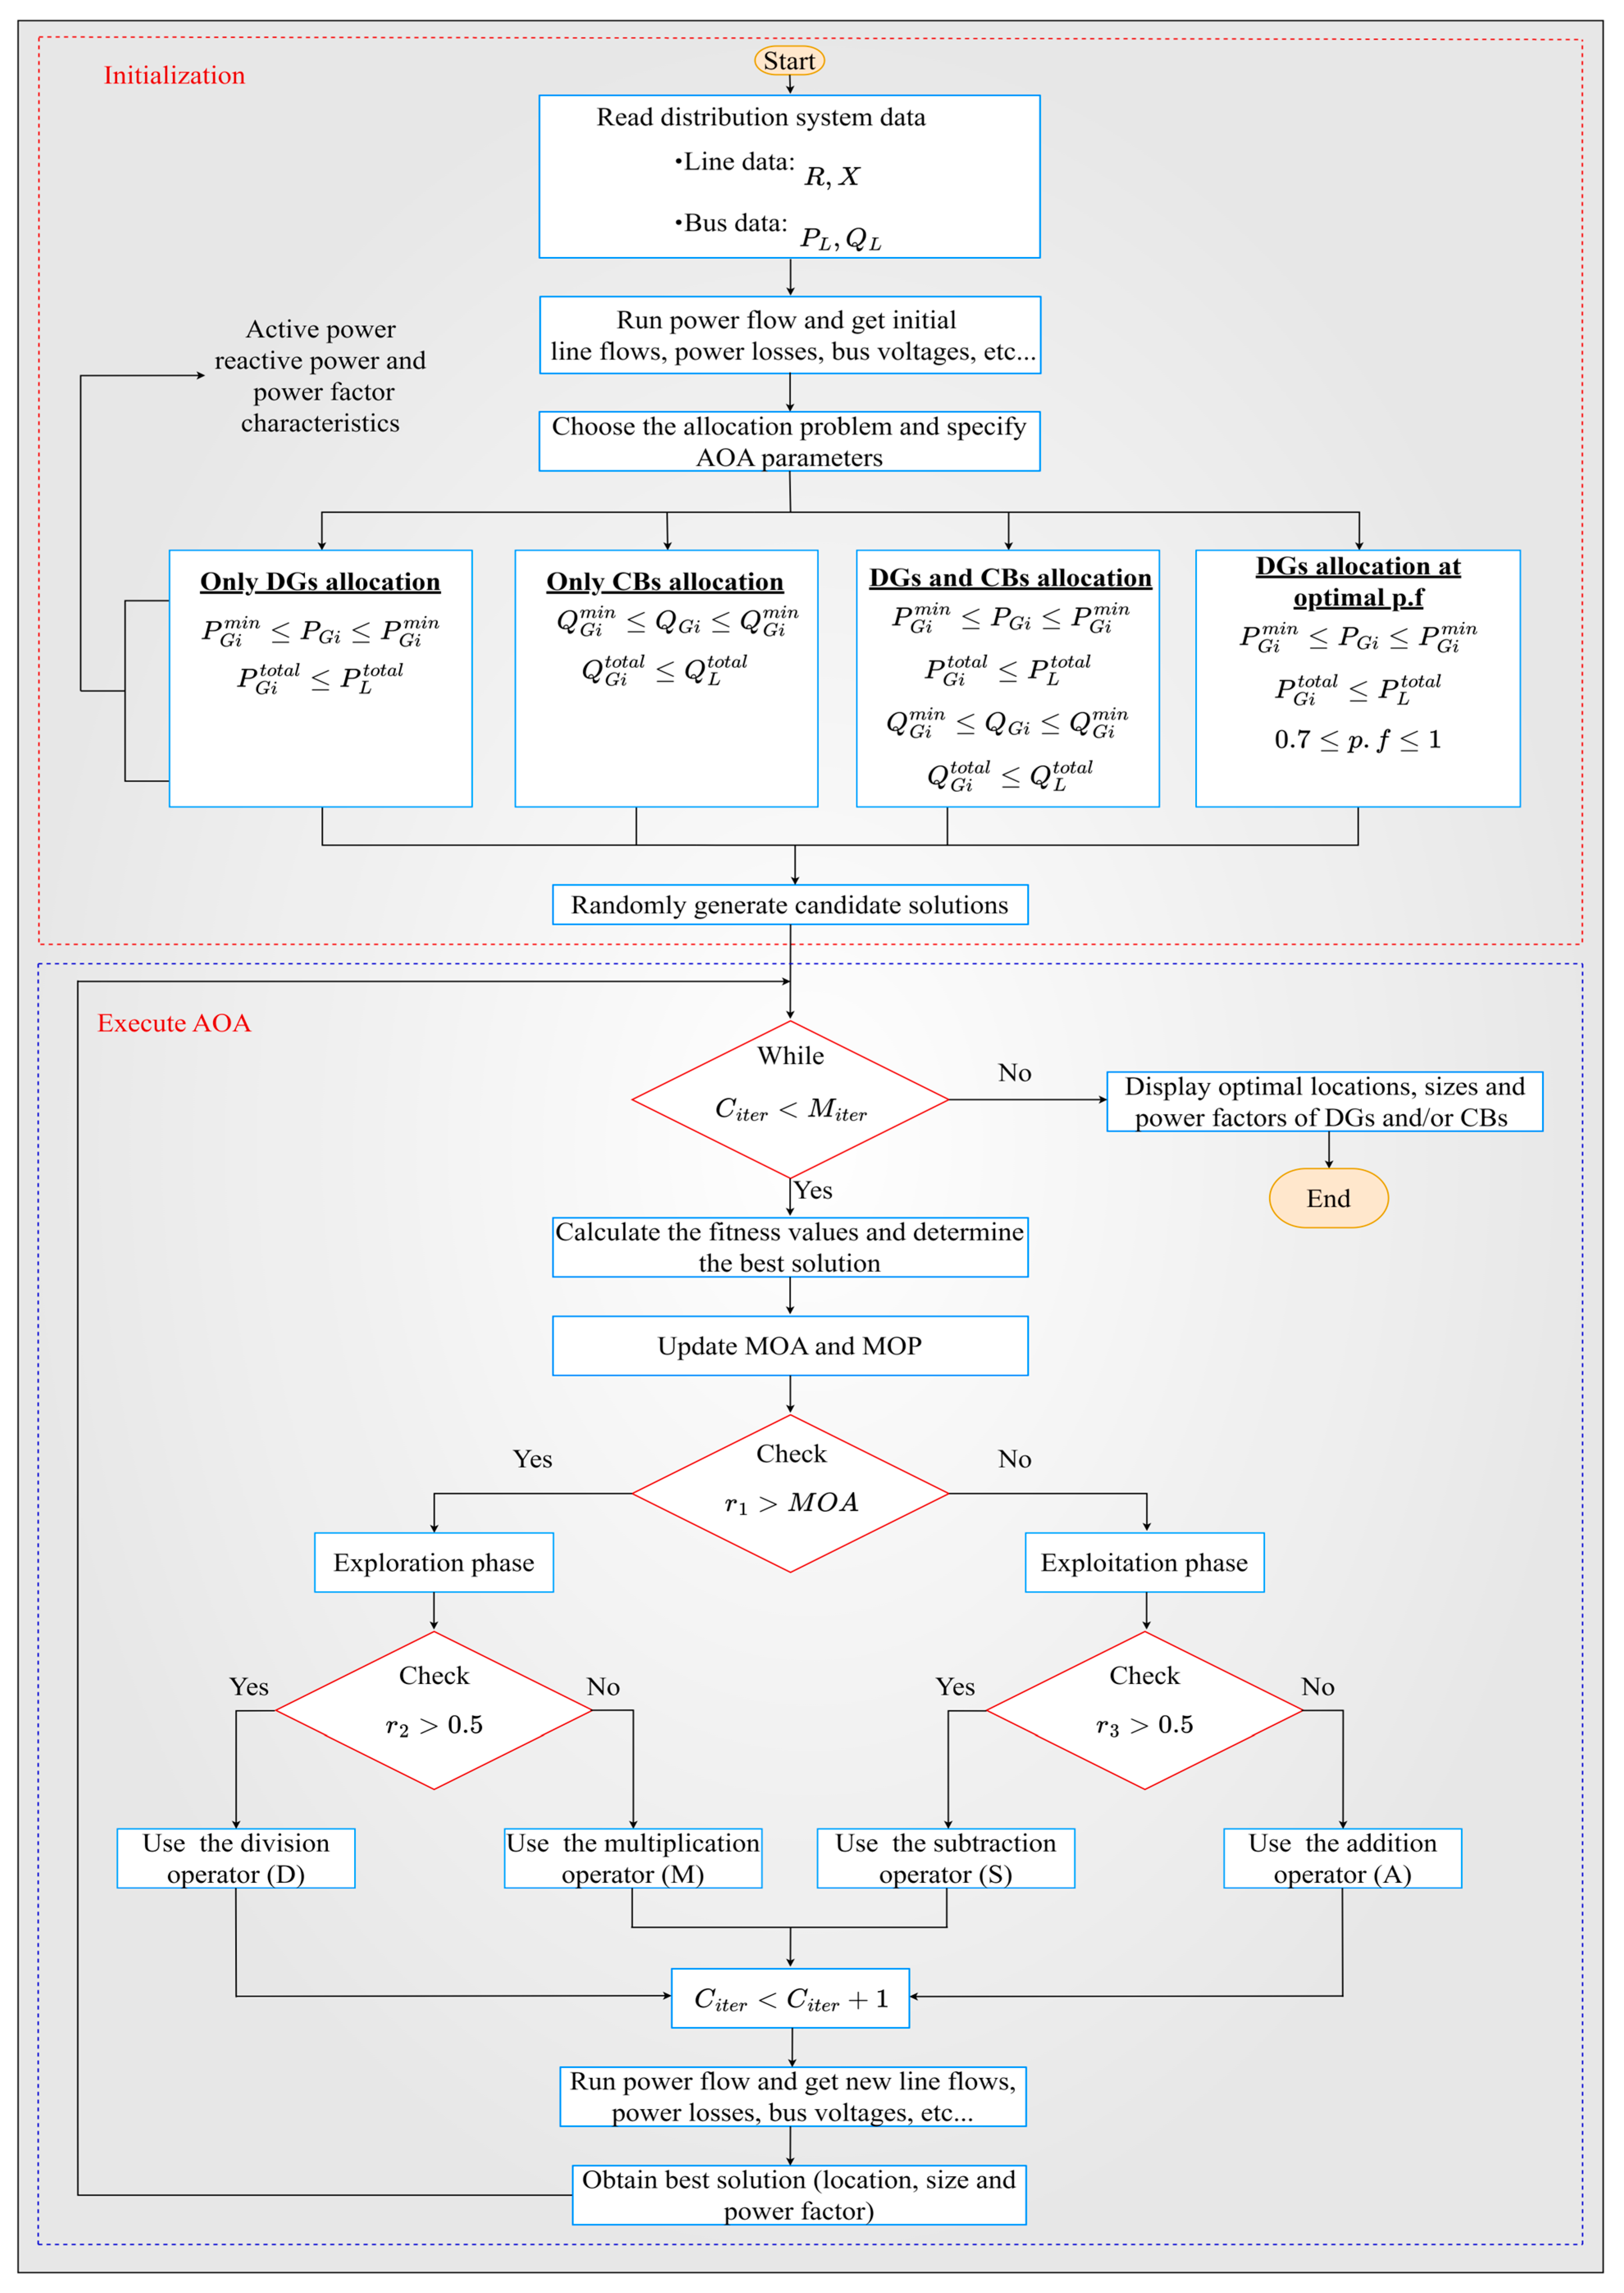
Normally, the power factor of DGs is assumed to be unity. However, the power factors of inverter-based DGs can be adjusted with converters. Thus, both active and reactive power can be provided to the power system with only DGs, without CBs. The optimal power factor of each DG is determined by using all the constraints in Equations (5)–(10). Both optimal capacity and optimal power factor are calculated within the constraints iteratively by the power flow analysis and proposed optimization algorithm. The flowchart of the optimal installation of DGs and/or CBs with AOA is in Figure 3, and it is summarized in the following steps.
Step 1: Read and define the bus and line data of radial distribution systems.
Step 2: Run the power flow and get the initial active and reactive power losses, bus voltages and phase angles, and line flows.
Step 3: Choose the allocation problem (only DGs, only CBs, DGs, and CBs simultaneously, and DGs at optimal p.f) and specify the AOA parameters (population size, maximum iteration, upper or lower generation limits of DGs and CBs, etc.).
Step 4: Randomly generate a candidate solution (location, size, and/or p.f).
Step 5: Calculate the objective function (total power loss and voltage deviation) and determine the best solution.
Step 6: Update MOA and MOP, determine the search phase, use the necessary arithmetic operators, and increase Citer.
Step 7: Apply the power flow and get the new active and reactive power losses, bus voltages and phase angles, and line flows.
Step 8: Obtain the best solution (location, size, and/or p.f).
Step 9: Check the current iteration (Citer) if (Citer < Miter) returns Step 5.
Step 10: Display the best solution (location, size, and/or p.f).

3. Experimental Results

In this section, the AOA is implemented in the IEEE 33-bus and IEEE 69-bus systems to specify optimum placements and capacities of DGs and CBs by minimizing total power loss and voltage deviation. In all scenarios, the minimum and maximum limits of each DG are determined as 0 MW and 3 MW, respectively, while the capacity of each CB is determined as ±3000 kVAR. In addition, the optimum power factor of DGs is determined with AOA, and the obtained results are compared with other algorithms and scenarios. Power losses and voltage profiles of distribution systems are investigated in all scenarios. The results obtained in this study are compared with the results of other optimization algorithms. In this study, the distribution systems are analyzed in four scenarios and each scenario is explained in Table 1.

3.1. Results of IEEE 33-Bus System

The IEEE 33-bus system has 32 lines and 33 buses. In this system, the base voltage is 12.66 kV, and the base power is 100 MVA. The line and load data of this system is given in [33] and the single line diagram is illustrated in Figure 4. In the base case, the power losses are 210.98 kW and 143.14 kVAR, respectively.
  • Scenario I: Installation of only DGs
Optimal locations and capacities of DGs at unity p.f are determined with AOA, and the obtained results are given in Table 2. DGs are settled in buses 14, 24, and 30 with capacities of 776.4 kW, 1099.0 kW, and 1070.2 kW, respectively. Thus, the total power loss was reduced from 210.98 kW to 72.79 kW. The lowest power loss is obtained with AOA when the results obtained from the other optimization algorithms are compared.
  • Scenario II: Installation of only CBs
For this scenario, the obtained results are demonstrated in Table 3, where the optimum locations and capacities of CBs are found through AOA and compared with the other optimization algorithms. The capacity of each CB, which initially had limits of ±3000 kVAR, is determined with the proposed algorithm as 556 kVAR, 513 kVAR, and 965 kVAR and installed in buses 8, 24, and 30, respectively. The total power loss achieved 139.41 kW by reducing 33.92% with the installation of CBs.
  • Scenario III: Installation of DGs and CBs simultaneously
The AOA is employed to specify the optimum placements and sizes of DGs and CBs simultaneously by minimizing the total power loss and voltage deviation in this scenario. DGs are settled in buses 14, 25, and 30 with sizes 794 kW, 881 kW, and 1100 kW, respectively, and CBs are settled in buses 14, 25, and 30 with sizes 384 kVAR, 436 kVAR, and 1009 kVAR, respectively. Thus, the total power loss decreases from 210.98 kW to 12.6571 kW by reducing 94%. The results of the AOA are compared to the other optimization algorithms in Table 4.
  • Scenario IV: Installation of DGs at the optimal power factor
In this scenario, in addition to the optimal location and capacity, the optimal power factor of the DGs is also determined with AOA. The lowest power loss is obtained in this scenario when it is compared to the other scenarios and other optimization algorithms. This scenario suggests installing DGs on buses 14, 24, and 30, respectively. The capacities of the DGs are determined to be 777.6 kW, 1053.5 kW, and 1050.4 kW, respectively, and the optimal power factors of the DGs are found to be 0.9081, 0.9018, and 0.7136, respectively. Thus, total power losses are reduced to 11.7752 kW by decreasing 94.42%. The results of AOA and other algorithms are given in Table 5. Although the total DG size is bigger than the other compared algorithms, the least power loss is achieved with the AOA.

3.1.1. Voltage Profile

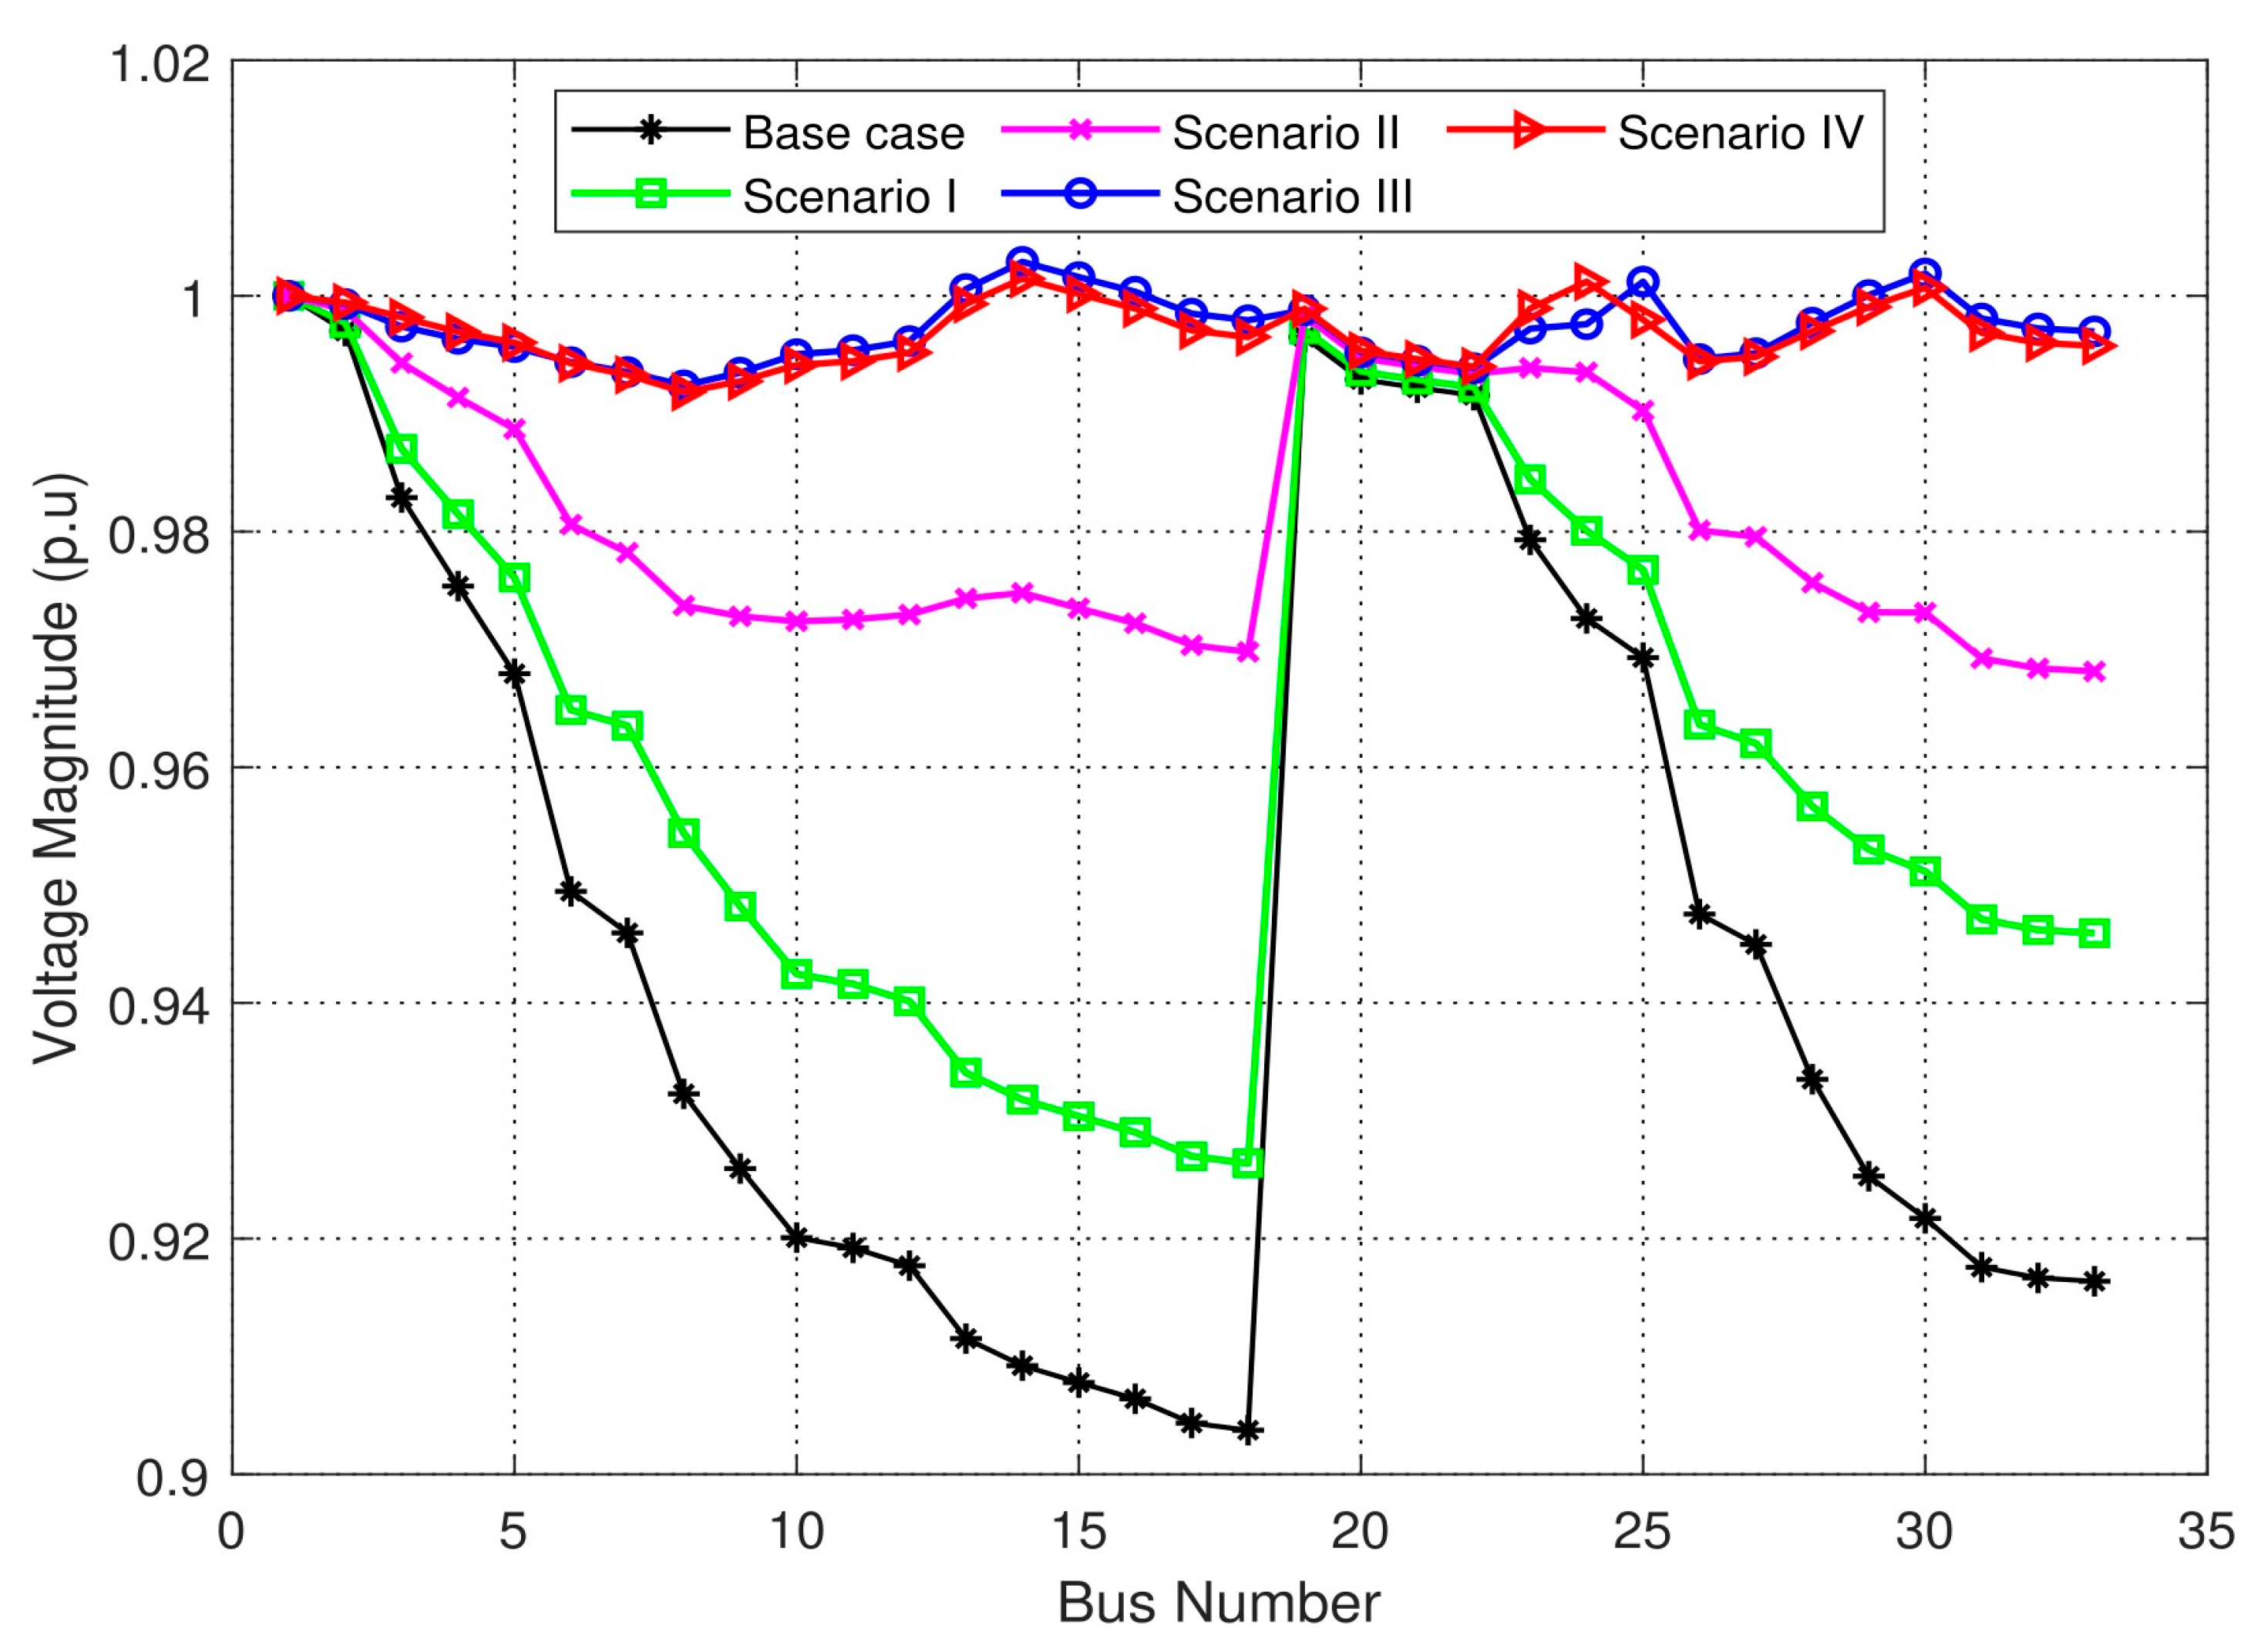
The effects of the DGs and CBs allocation on the voltage profile with different scenarios are shown in Figure 5. Although the bus voltages are increased when only active power (with DGs installation) or only reactive power (with CBs installation) is supplied to the distribution system, the bus voltages are increased much more when both active and reactive power is supplied to the distribution system (with DGs and CBs installation, or with DGs installation at optimum p.f). The best result is obtained by determining the optimum p.f.
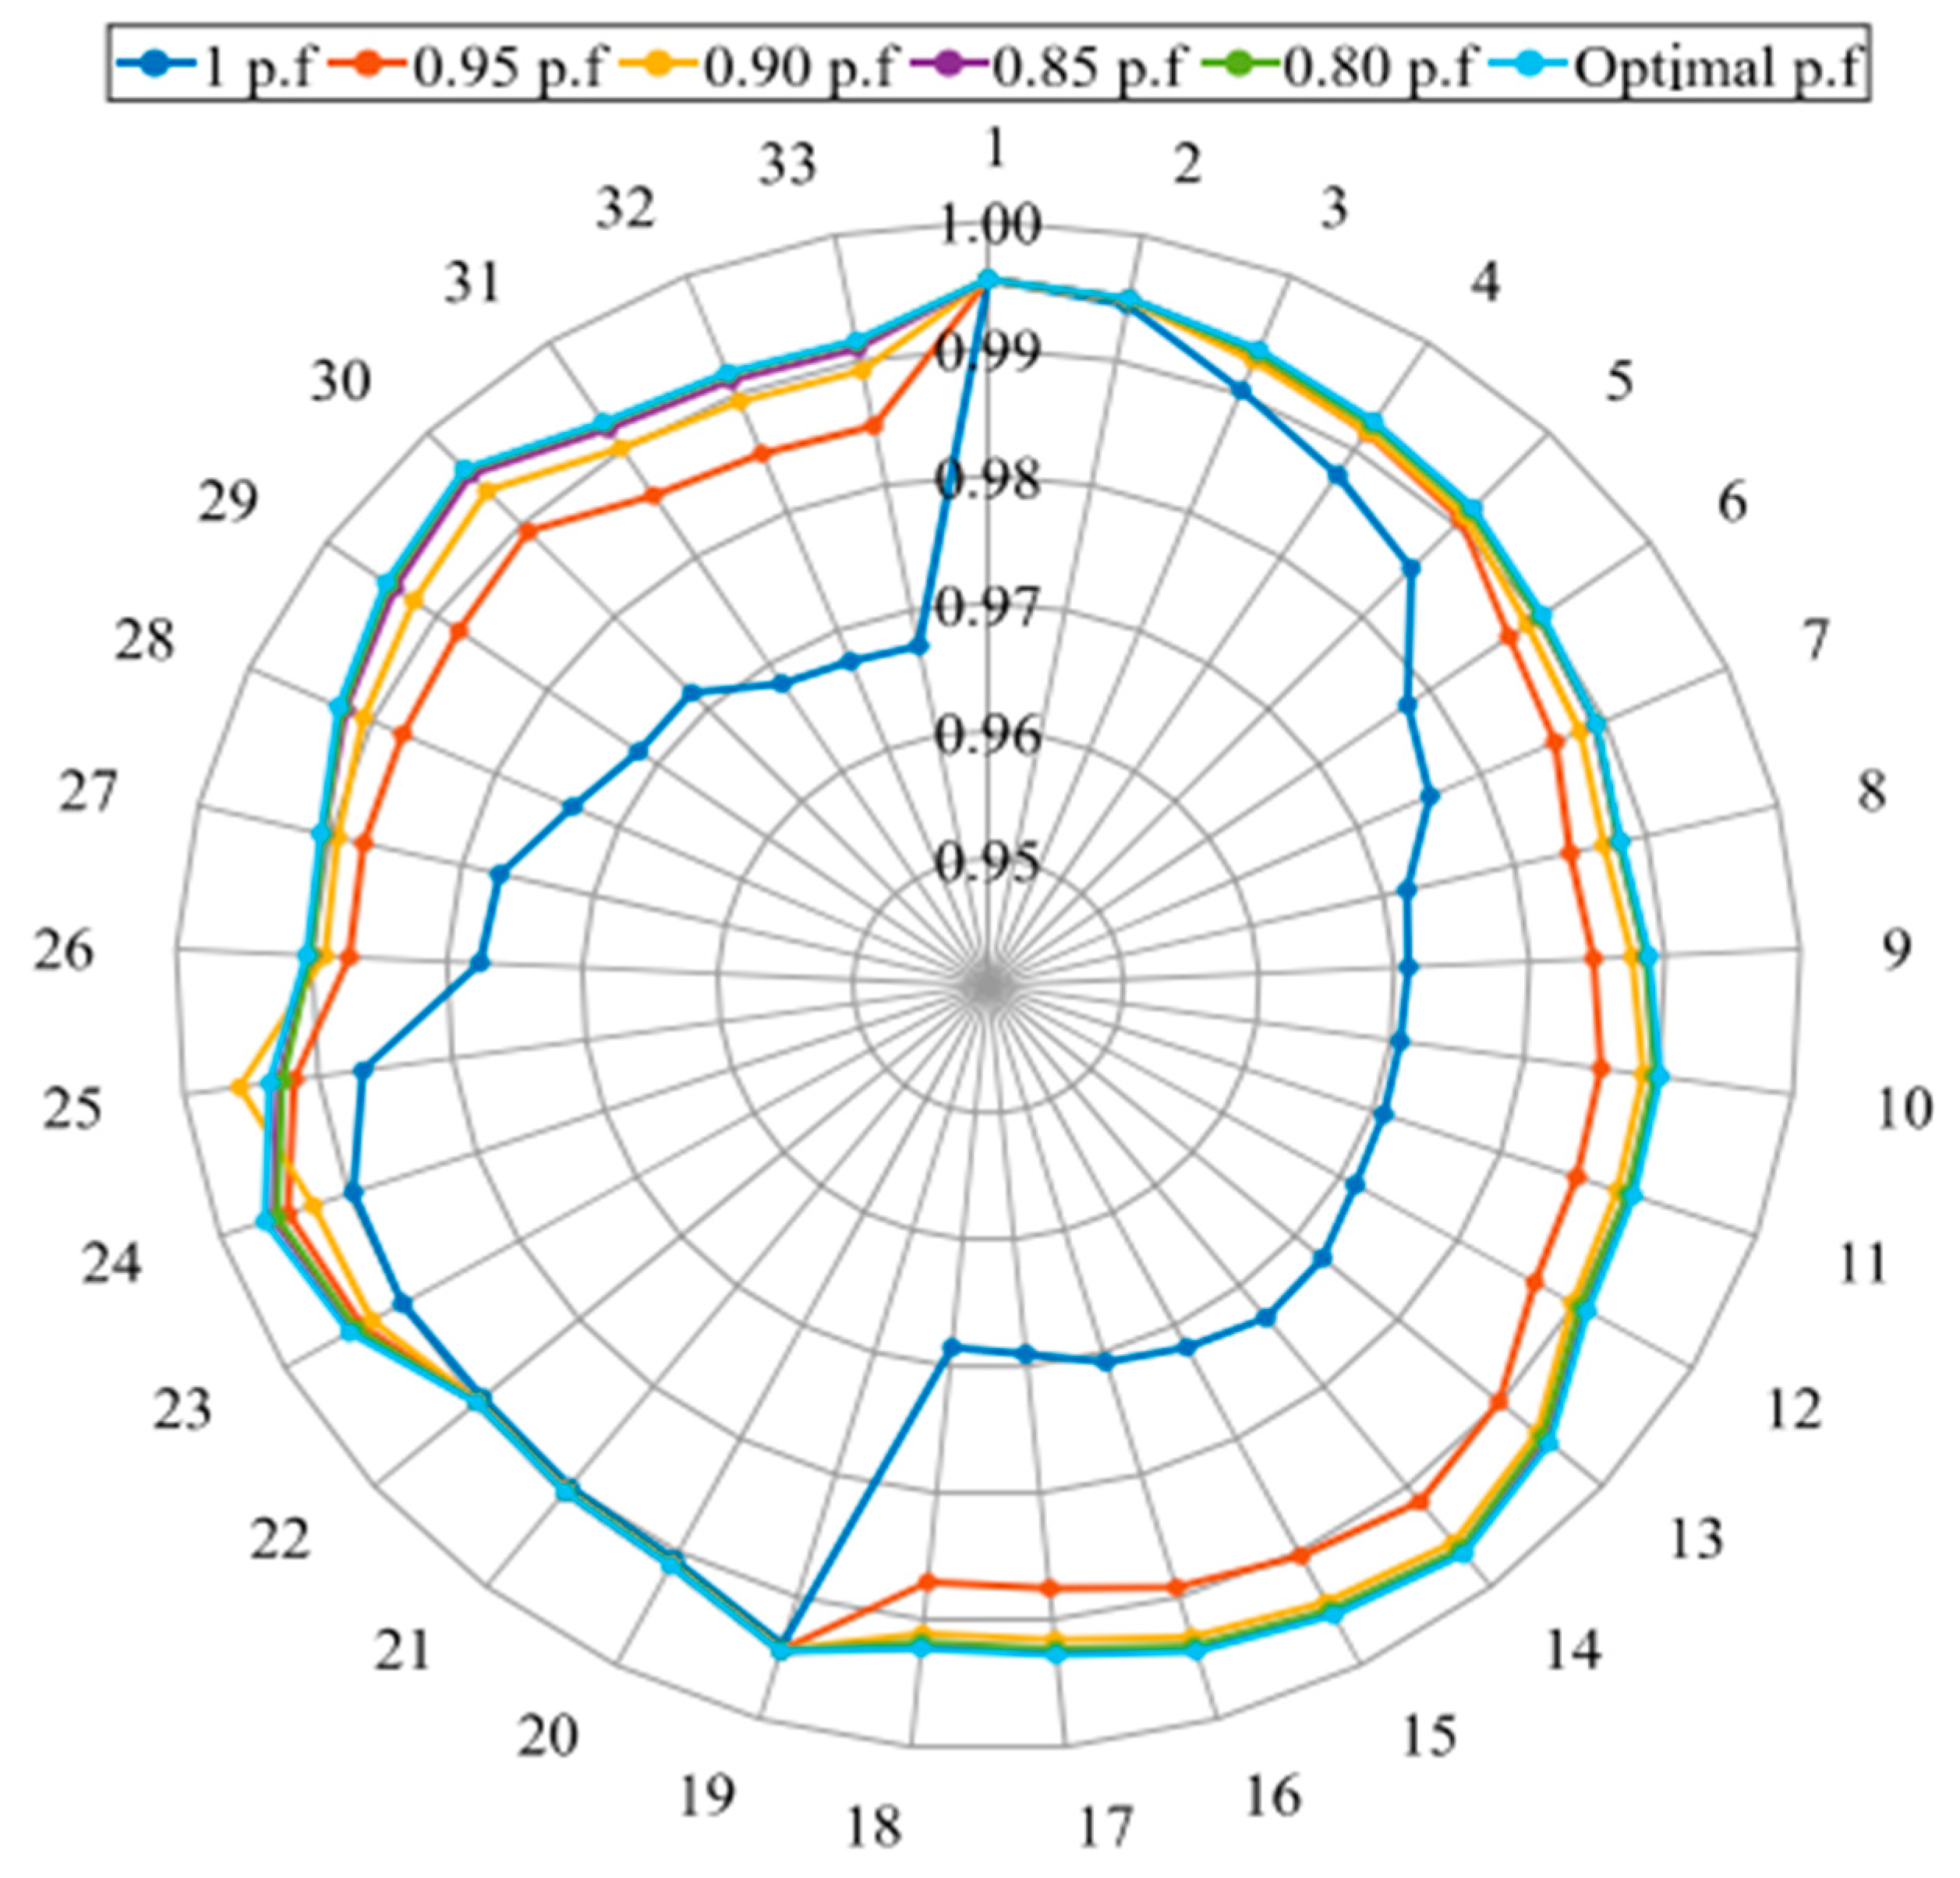
The effect of DGs installed at different p.f values on the voltage profile is given in Figure 6. The mean bus voltage is increased to 0.9815 p.u with the installation of DGs at unity p.f, while, it is increased to 0.9967 p.u with the installation of DGs at optimum p.f. Consequently, bus voltages are approached 1 p.u and voltage deviation is minimized with the optimum p.f solution.

3.1.2. Power Losses

Power losses in each line of the radial system are calculated in different scenarios and the results are presented in Table 6. The results show that the lowest power loss is obtained by using the DGs; here, the optimum power factor is determined in addition to the optimal location and capacity.
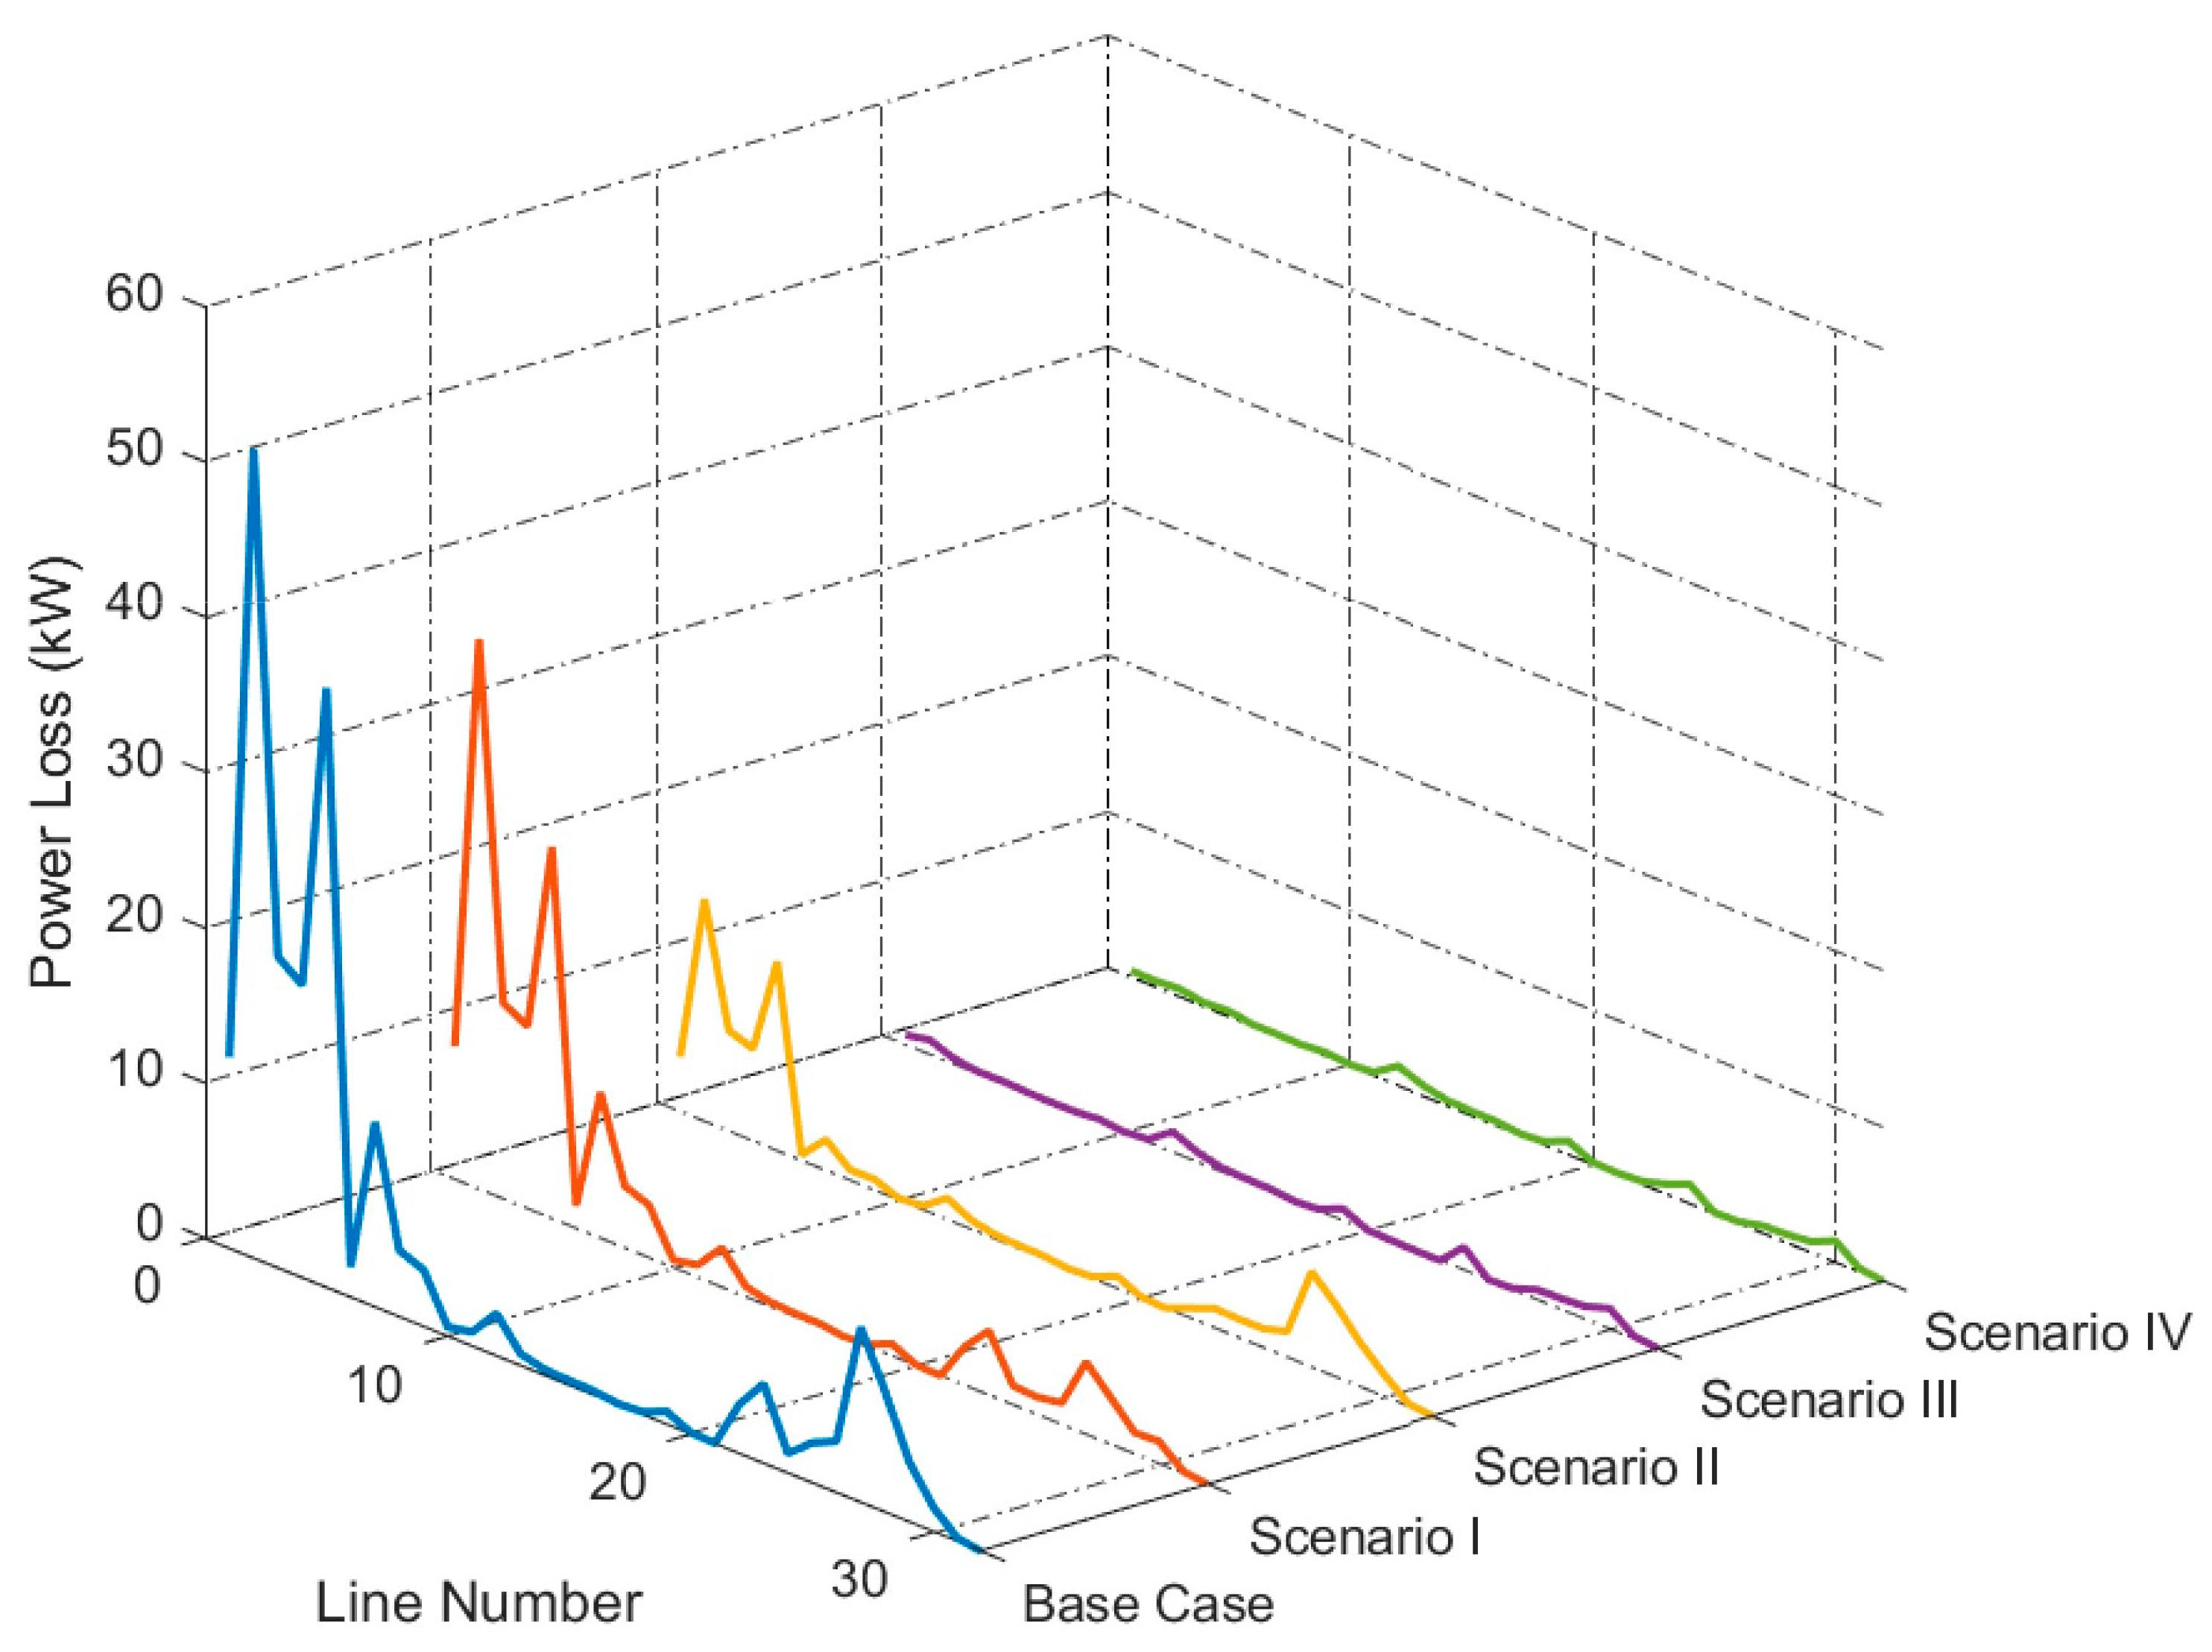
In Scenario IV, the optimum placements, sizes, and power factors of the DGs are specified and they are settled in the radial system. According to the results, it is observed that the total reactive power loss decreased by 93.13% and the total active power loss decreased by 94.42%. The active power loss of each bus in all scenarios is compared in Figure 7.

3.2. Results of IEEE 69-Bus System

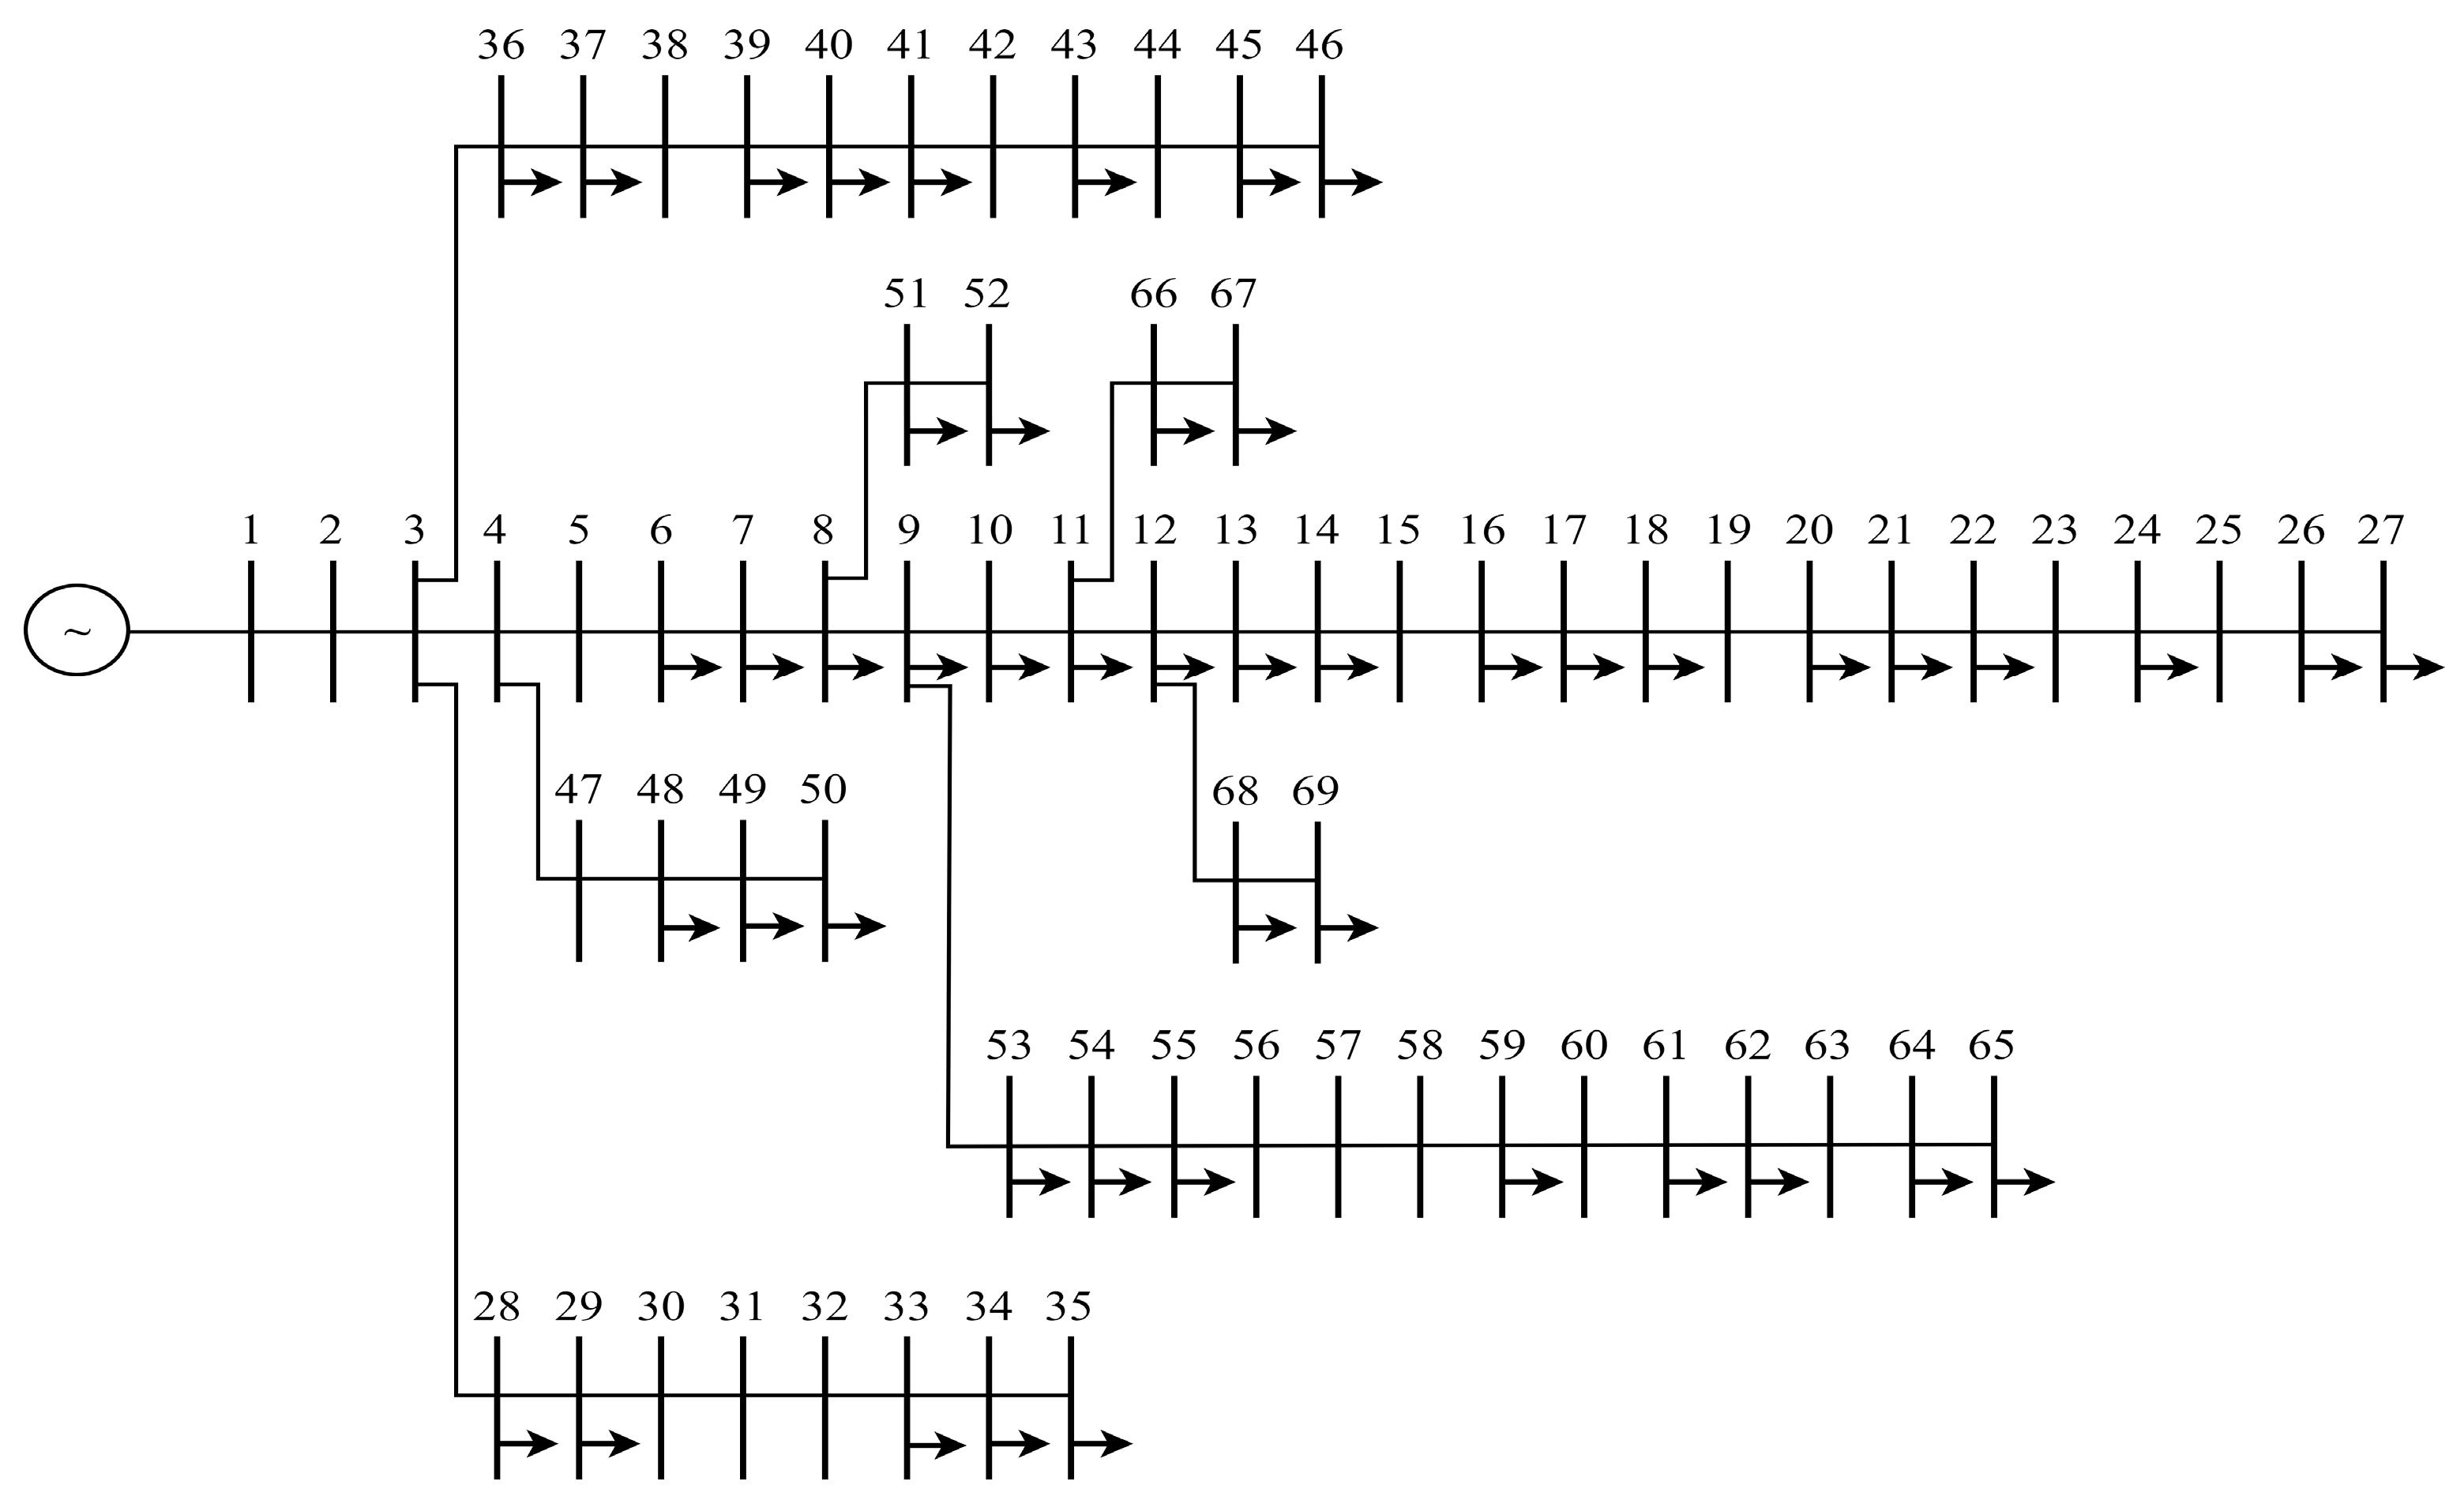
The single-line diagram of the IEEE-69 bus system, which has the same base voltage and power as the IEEE 33-bus system, is given in Figure 8. The line and load data of this system, which have 68 lines and 69 buses, are obtained in [37]. The active and reactive power losses of this system are 224.95 kW and 102.13 kVAR, respectively.
  • Scenario I: Installation of only DGs
The results of DGs placed in the radial system with the AOA are given in Table 7 and compared with other optimization methods. The optimum placements of DGs are determined to be 11, 61, and 21 buses, and optimum capacities are found to be 571.6 kW, 1719.9 kW, and 341 kW, respectively. In this way, the total power loss of this system increases from 224.95 kW to 69.43 kW.
  • Scenario II: Installation of only CBs
The capacity of each CB, which initially had limits of ±3000 kVAR, is determined as 410 kVAR, 233 kVAR, and 1234 kVAR and installed in buses 11, 21, and 61, respectively. The results of the proposed algorithm are given in Table 8 and compared to the other algorithms. By placing CBs in the radial system, the total power loss was reduced from 224.95 kW to 145.096 kW increasing by 35.51%.
  • Scenario III: Installation of DGs and CBs simultaneously
In this scenario, the optimum placements and sizes of DGs and CBs are optimized simultaneously, and the obtained results are presented in Table 9. Both DGs and CBs are placed in buses 61, 11, and 21. The capacities of DGs are determined as 1651.1 kW, 521 kW, and 334 kW, and the capacities of CBs are determined as 1282 kVAR, 414 kVAR, and 234 kVAR, respectively. Thus, the total power loss of the IEEE 69-bus system has been decreased to 4.6243 kW by reducing 97.94%.
  • Scenario IV: Installation of DGs at the optimal power factor
The optimum power factors of the DGs are determined in addition to the optimal location and capacity in this scenario. According to AOA, the placements of DGs are found on 11, 21, and 61 buses. DGs are placed in determined buses at 453 kW, 349 kW, and 1706.4 kW capacities, and 0.7071, 0.8342, and 0.8290 p.f, respectively. When all scenarios are compared, the best reduction in power loss is obtained in this scenario. The total power loss decreases to 4.44 kW by reducing 98.03%. The obtained results are compared to the other algorithms and are given in Table 10.

3.2.1. Voltage Profile

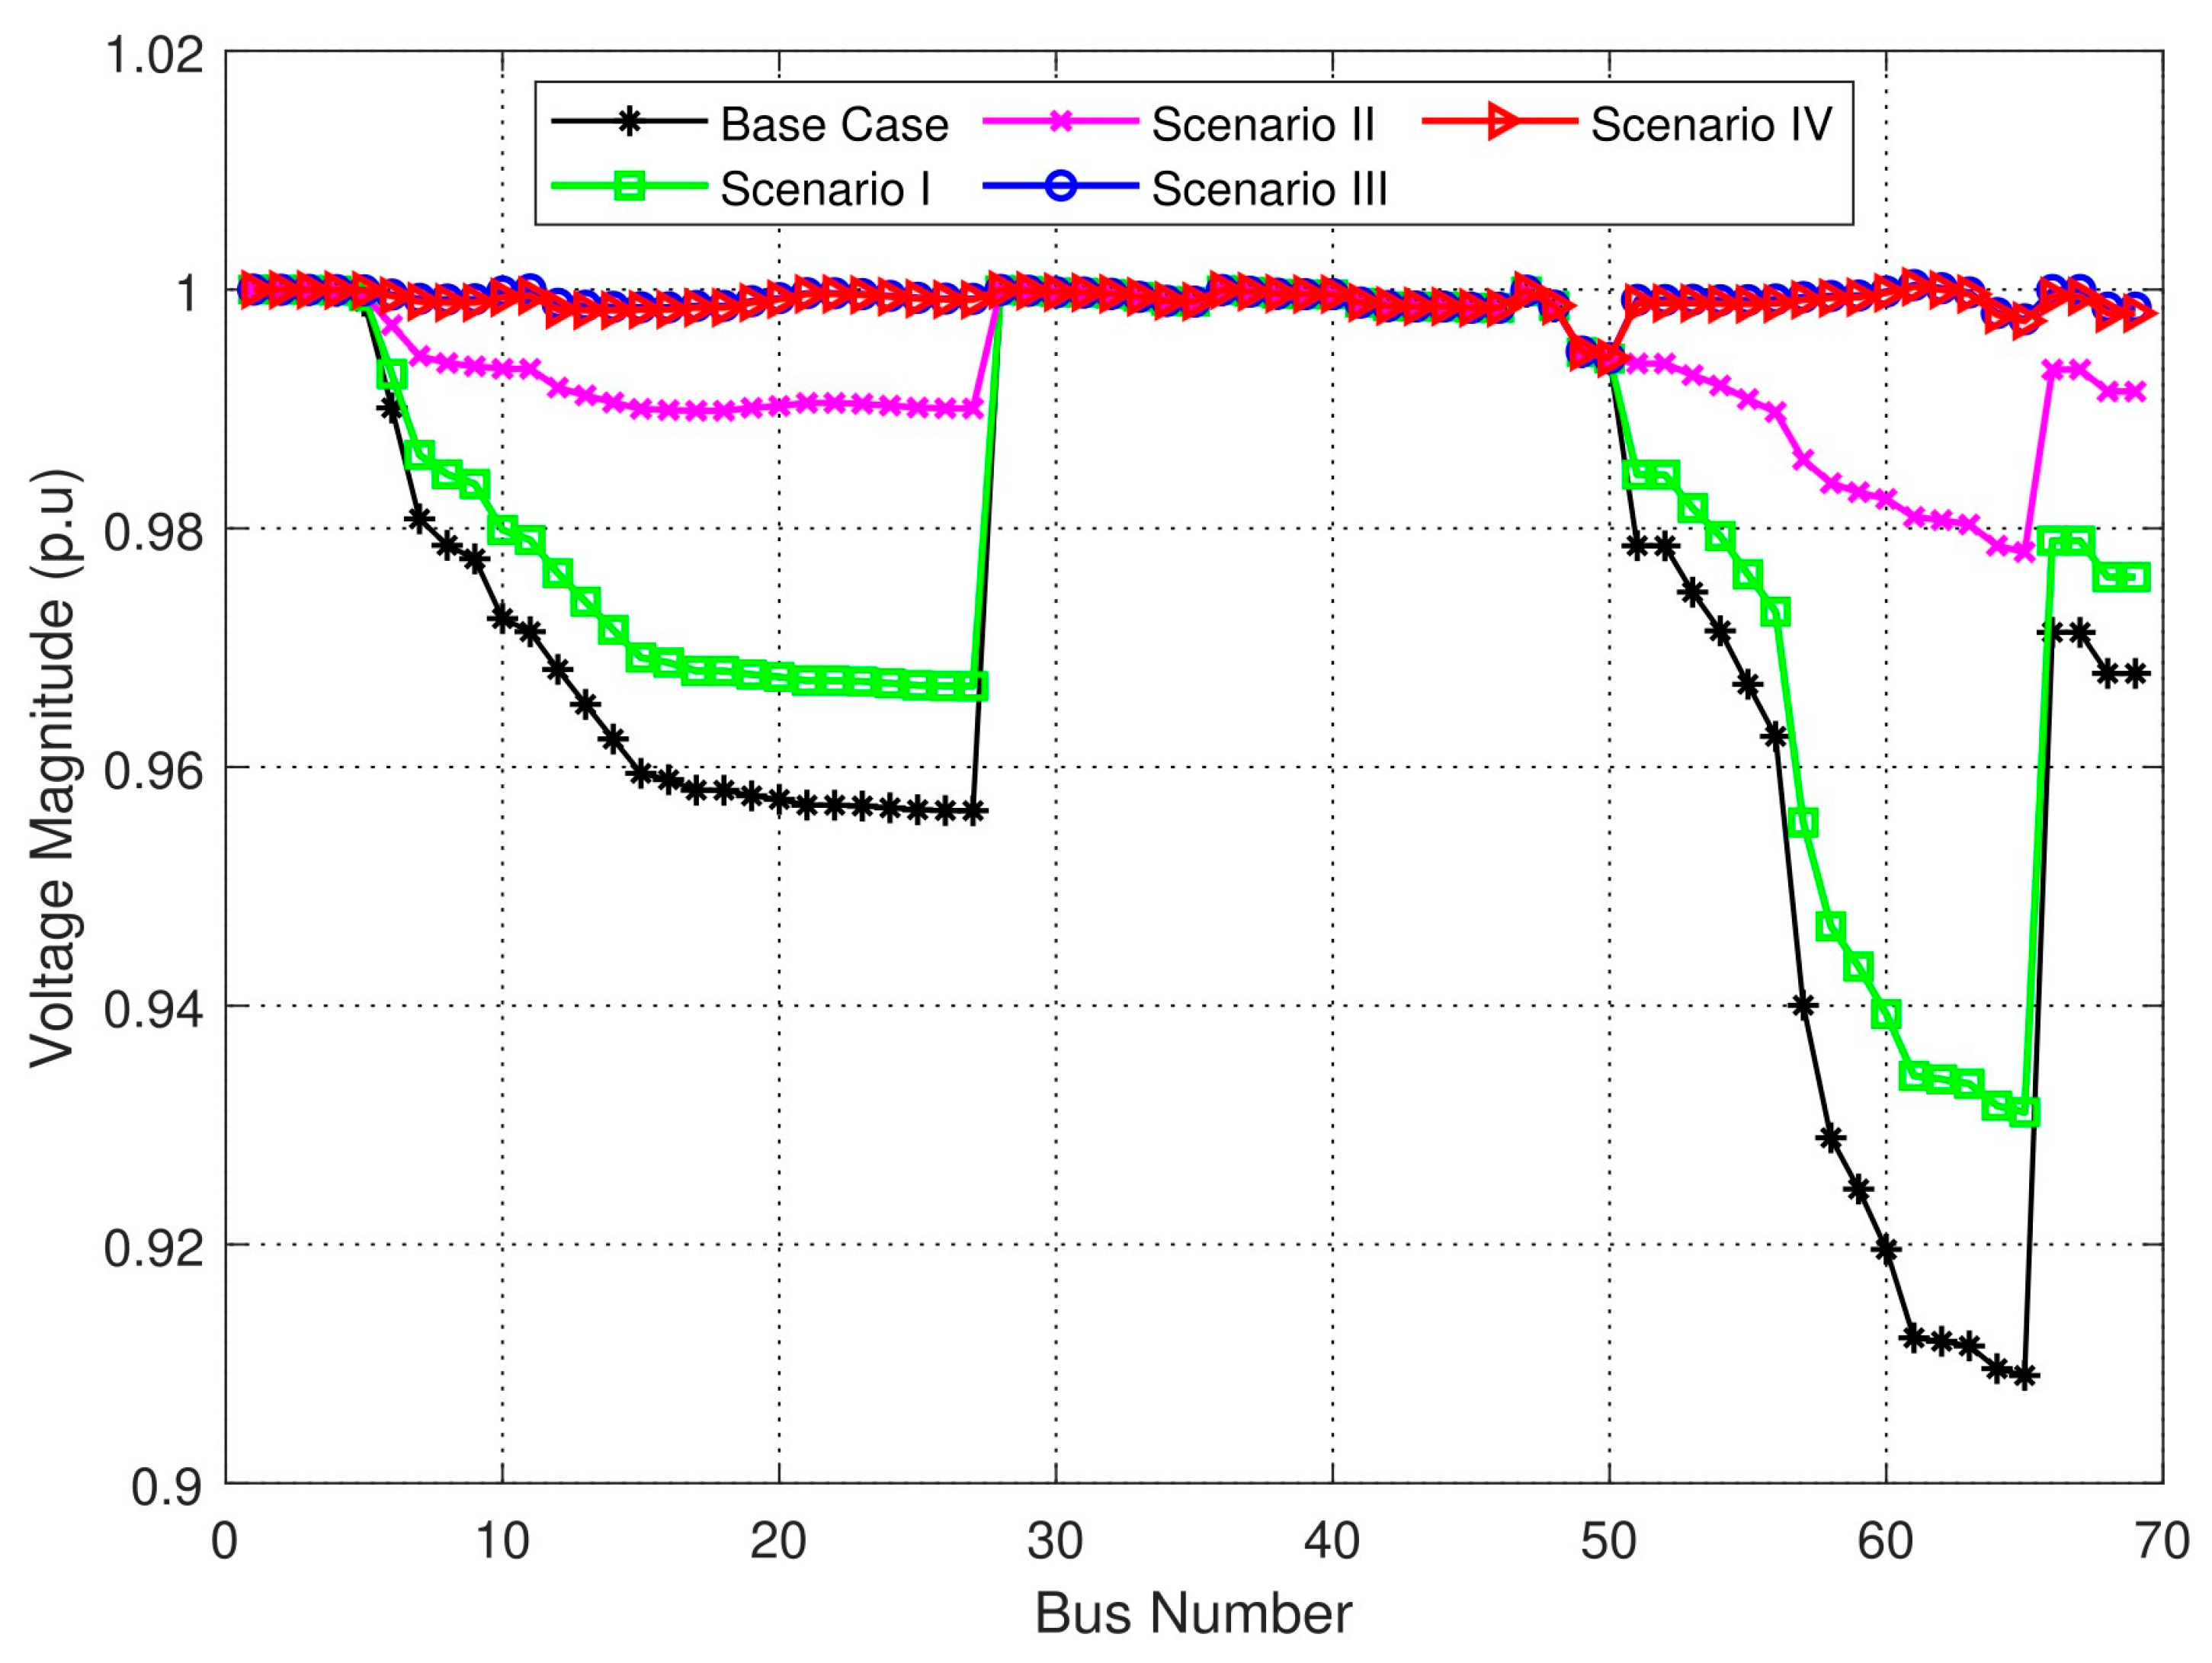
The voltage profiles because of the optimal allocation of DGs and/or CBs in different scenarios are demonstrated in Figure 9. The best voltage profile is obtained in scenario IV; here, both active and reactive power are supplied to the radial system, and the optimum sitting, sizing, and power factor of the DGs are determined.
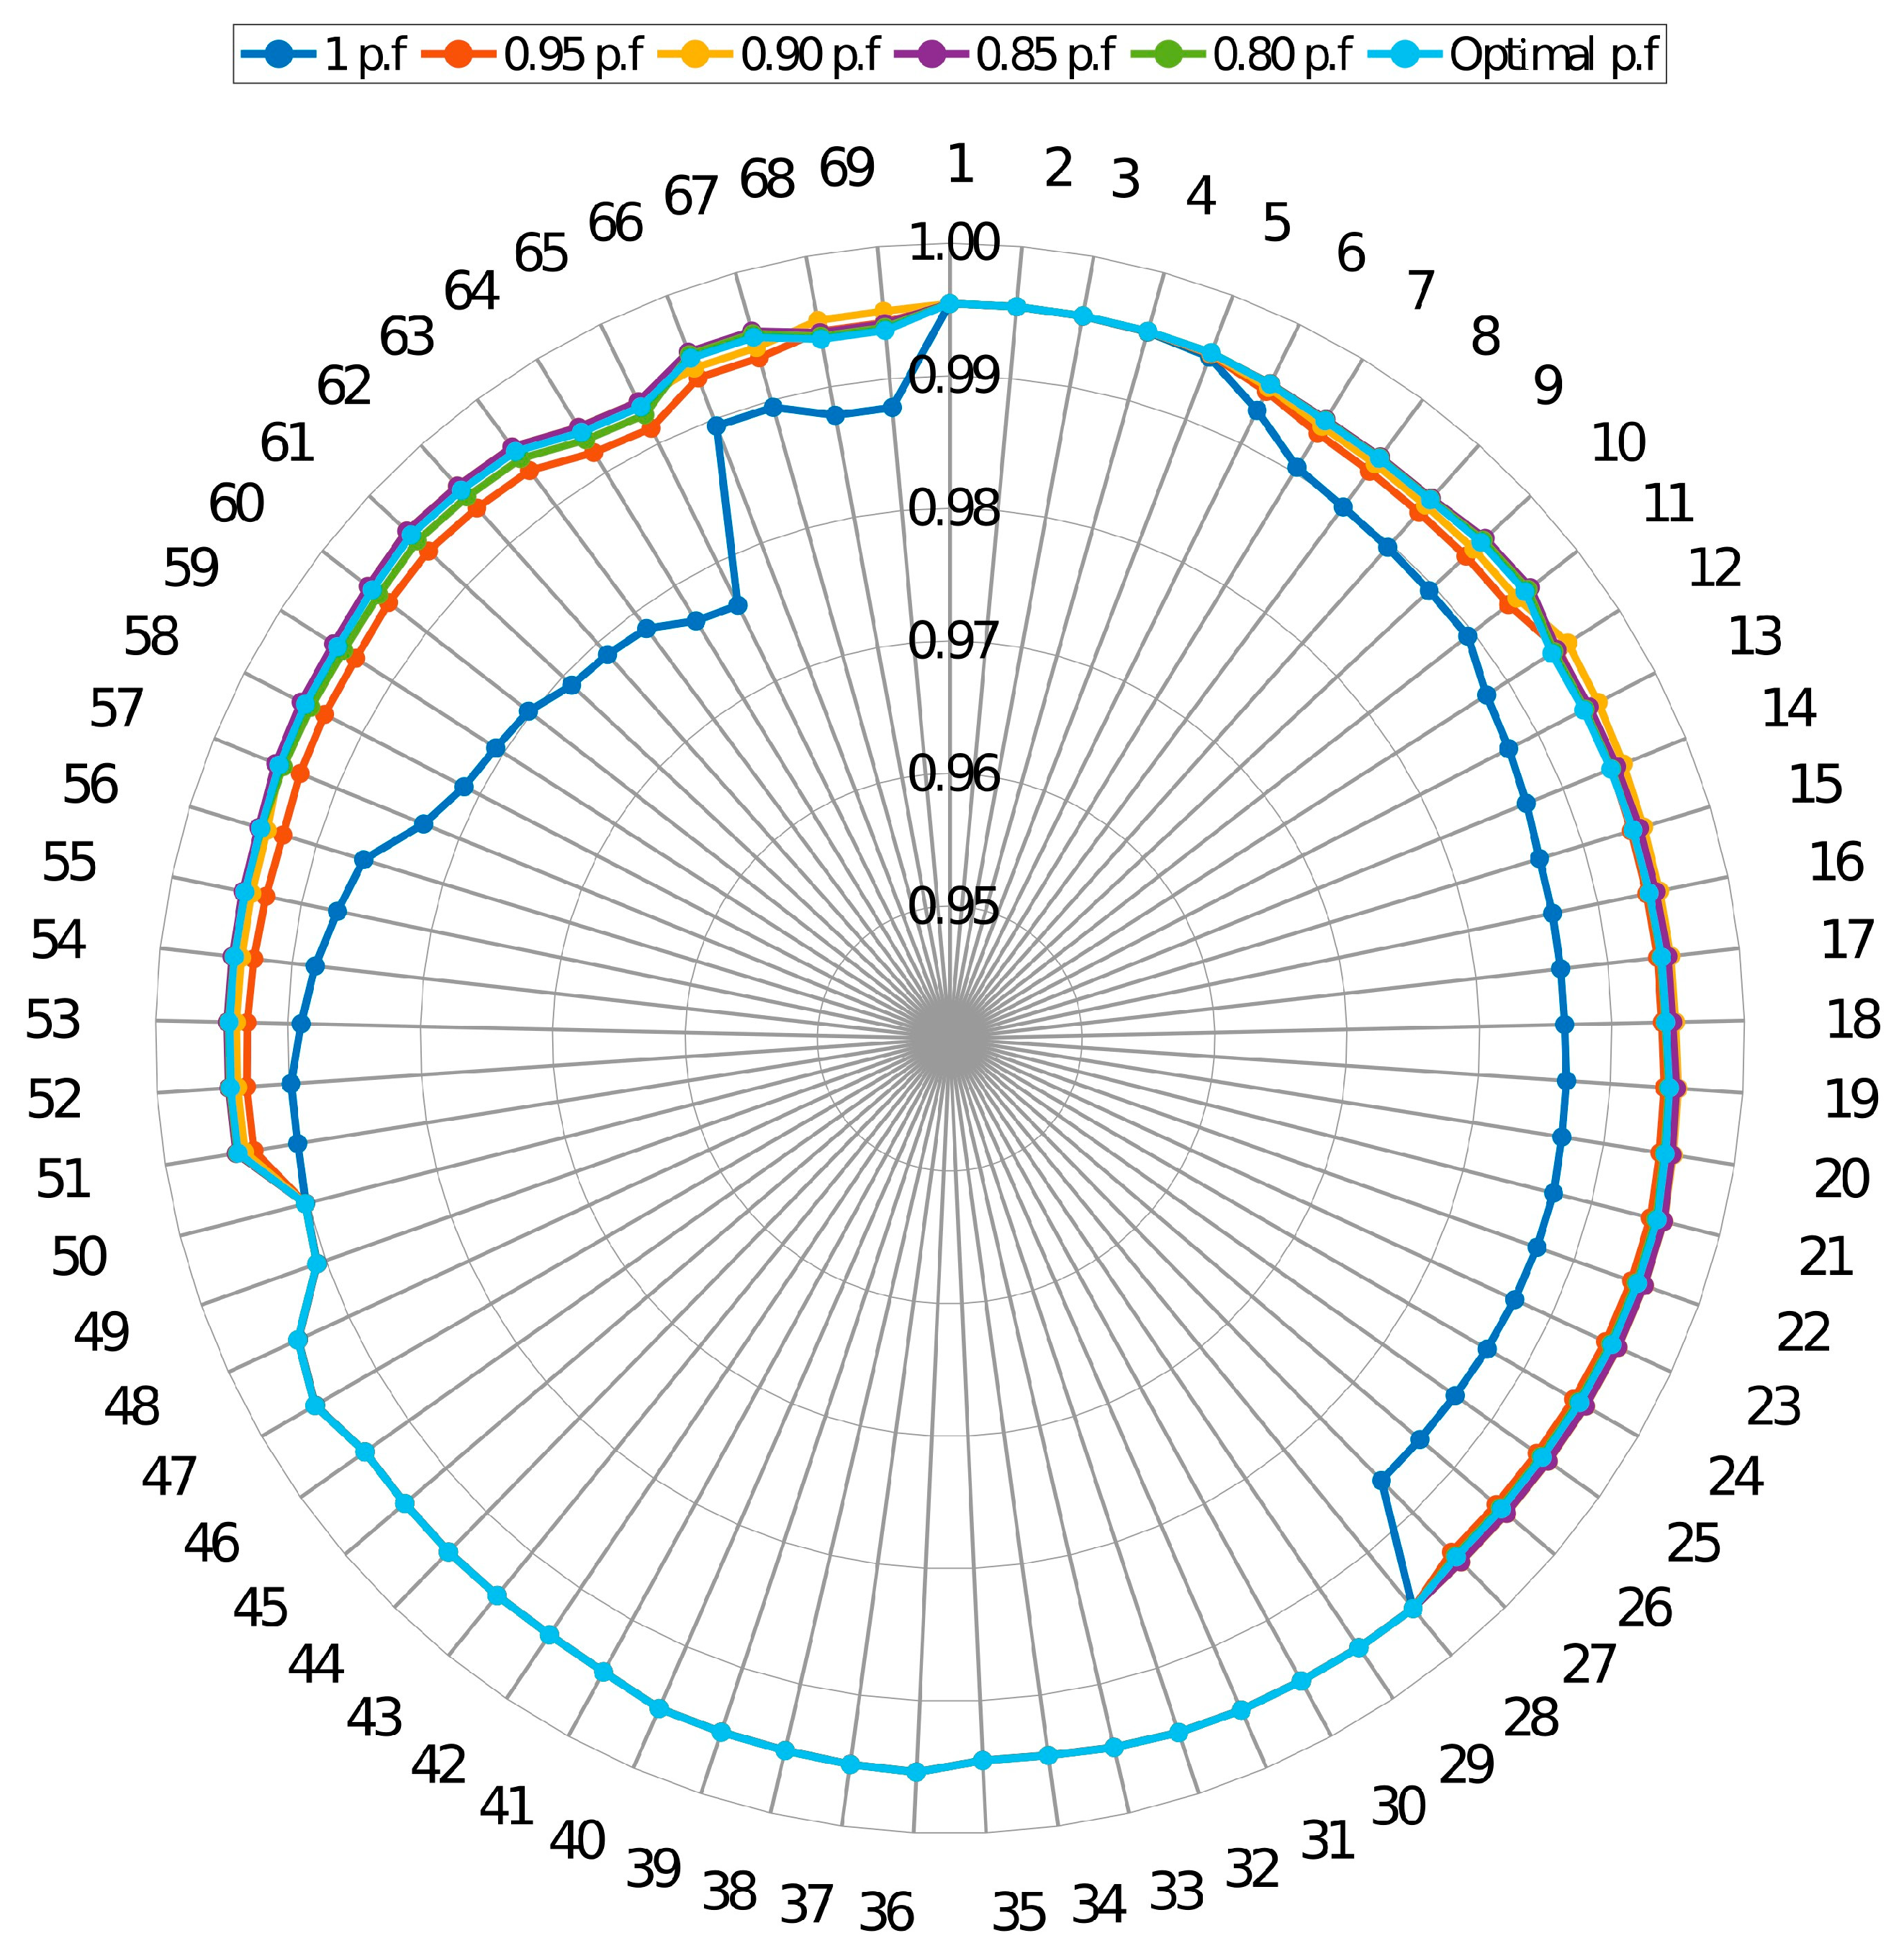
DGs with constant power factors are installed in the radial system and compared with the DGs installed with optimum power factors. The effects on the voltage profile are given in Figure 10. The results show that the best voltage profile is obtained in the scenario where the DGs are placed with the optimum power factor.

3.2.2. Power Losses

The power losses obtained in each scenario are demonstrated in Table 11 and Figure 11.
The best result is obtained in scenario IV; here, it is observed that the total reactive power loss decreased by 93.32% and the total active power loss decreased by 98.03%. The active power loss of each bus in all scenarios is compared in Figure 11.

4. Conclusions

In this paper, the AOA has been designed to solve the allocation problems of DGs and CBs in the radial systems. Four different scenarios have been realized for examining allocation problems in this study. In the allocation problems, the optimum placement and capacity of the CBs and the optimum placement, capacity, and power factor of the DGs are determined to reduce the total power loss and voltage deviation. The AOA has been implemented in IEEE 33-bus and IEEE 69-bus systems in different scenarios. The results of whole scenarios have revealed that the AOA provided a better performance of power loss minimization and voltage profile enhancement compared to other optimization methods. In both radial systems, the best results were obtained when only DGs were placed, and the optimum placement, capacity, and power factor were determined. The total power loss reduction in IEEE 33-bus and IEEE 69-bus systems have been achieved at 94.42% and 98.03%, respectively; the power factor of DGs was determined in addition to the placement and capacity.
In future works, the allocation problem of DGs and CBs could be examined in different load demands, or the allocation problem could be solved together with the reconfiguration problem. All these processes could be affirmed in real-time operations.

Author Contributions

N.P. and U.E.U. contributed to the design and modelling of the system, analysis of the results, and writing of the manuscript. All authors have read and agreed to the published version of the manuscript.

Funding

This research received no external funding.

Data Availability Statement

Data will be made available upon reasonable request. The data are not publicly available due to privacy.

Conflicts of Interest

The authors declare that they have no known competing financial interests or personal relationships that could have appeared to influence the work reported in this paper.

References

  1. McMeekin, A.; Geels, F.W.; Hodson, M. Mapping the winds of whole system reconfiguration: Analysing low-carbon transformations across production, distribution and consumption in the UK electricity system (1990–2016). Res. Policy 2019, 48, 1216–1231. [Google Scholar] [CrossRef]
  2. Ayalew, M.; Khan, B.; Giday, I.; Mahela, O.P.; Khosravy, M.; Gupta, N.; Senjyu, T. Integration of renewable based distributed generation for distribution network expansion planning. Energies 2022, 15, 1378. [Google Scholar] [CrossRef]
  3. Stanelytė, D.; Radziukynas, V. Analysis of voltage and reactive power algorithms in low voltage networks. Energies 2022, 15, 1843. [Google Scholar] [CrossRef]
  4. Nguyen, T.P.; Nguyen, T.A.; Phan, T.V.H.; Vo, D.N. A comprehensive analysis for multi-objective distributed generations and capacitor banks placement in radial distribution networks using hybrid neural network algorithm. Knowl.-Based Syst. 2021, 231, 107387. [Google Scholar] [CrossRef]
  5. Ufa, R.A.; Malkova, Y.Y.; Rudnik, V.E.; Andreev, M.V.; Borisov, V.A. A review on distributed generation impacts on electric power system. Int. J. Hydrogen Energy 2022, 47, 20347–20361. [Google Scholar] [CrossRef]
  6. Pereira, L.D.L.; Yahyaoui, I.; Fiorotti, R.; de Menezes, L.S.; Fardin, J.F.; Rocha, H.R.O.; Tadeo, F. Optimal allocation of distributed generation and capacitor banks using probabilistic generation models with correlations. Appl. Energy 2022, 307, 118097. [Google Scholar] [CrossRef]
  7. Gholami, K.; Islam, R.; Rahman, M.; Azizivahed, A.; Fekih, A. State-of-the-art technologies for volt-var control to support the penetration of renewable energy into the smart distribution grids. Energy Rep. 2022, 8, 8630–8651. [Google Scholar] [CrossRef]
  8. Tiwari, V.; Dubey, H.M.; Pandit, M. Assessment of optimal size and location of DG/CB in distribution systems using coulomb–franklin’s algorithm. J. Inst. Eng. India Ser. B 2022, 103, 1885–1908. [Google Scholar] [CrossRef]
  9. Fetouh, T.; Elsayed, A.M. Optimal control and operation of fully automated distribution networks using improved tunicate swarm intelligent algorithm. IEEE Access 2020, 8, 129689–129708. [Google Scholar] [CrossRef]
  10. Huy, P.D.; Ramachandaramurthy, V.K.; Yong, J.Y.; Tan, K.M.; Ekanayake, J.B. Optimal placement, sizing and power factor of distributed generation: A comprehensive study spanning from the planning stage to the operation stage. Energy 2020, 195, 117011. [Google Scholar] [CrossRef]
  11. Kayal, P.; Chanda, S.; Chanda, C.K. An analytical approach for allocation and sizing of distributed generations in radial distribution network. Int. Trans. Electr. Energy Syst. 2017, 27, e2322. [Google Scholar] [CrossRef]
  12. Imran, A.M.; Kowsalya, M.; Kothari, D. A novel integration technique for optimal network reconfiguration and distributed generation placement in power distribution networks. Int. J. Electr. Power Energy Syst. 2014, 63, 461–472. [Google Scholar] [CrossRef]
  13. Nagaballi, S.; Kale, V.S. Pareto optimality and game theory approach for optimal deployment of dg in radial distribution system to improve techno-economic benefits. Appl. Soft Comput. 2020, 92, 106234. [Google Scholar] [CrossRef]
  14. Pham, T.D.; Nguyen, T.T.; Dinh, B.H. Find optimal capacity and location of distributed generation units in radial distribution networks by using enhanced coyote optimization algorithm. Neural Comput. Appl. 2021, 33, 4343–4371. [Google Scholar] [CrossRef]
  15. Sharma, S.; Bhattacharjee, S.; Bhattacharya, A. Quasi-oppositional swine influenza model based optimization with quarantine for optimal allocation of dg in radial distribution network. Int. J. Electr. Power Energy Syst. 2016, 74, 348–373. [Google Scholar] [CrossRef]
  16. Kamel, S.; Amin, A.; Selim, A.; Ahmed, M.H. Optimal placement of dg and capacitor in radial distribution systems considering load variation. In Proceedings of the 2019 International Conference on Computer, Control, Electrical, and Electronics Engineering (ICCCEEE), Khartoum, Sudan, 21–23 September 2019; pp. 1–6. [Google Scholar] [CrossRef]
  17. Balu, K.; Mukherjee, V. Optimal siting and sizing of distributed generation in radial distribution system using a novel student psychology-based optimization algorithm. Neural Comput. Appl. 2021, 33, 15639–15667. [Google Scholar] [CrossRef]
  18. Shuaib, Y.M.; Kalavathi, M.S.; Rajan, C.C.A. Optimal capacitor placement in radial distribution system using gravitational search algorithm. Int. J. Electr. Power Energy Syst. 2015, 64, 384–397. [Google Scholar] [CrossRef]
  19. Kowsalya, M.; Mohamed Imran, A. Optimal distributed generation and capacitor placement in power distribution networks for power loss minimization. In Proceedings of the 2014 International Conference on Advances in Electrical Engineering (ICAEE), Vellore, India, 9–11 January 2014; pp. 1–6. [Google Scholar] [CrossRef]
  20. El-Fergany, A.A.; Abdelaziz, A.Y. Capacitor allocations in radial distribution networks using cuckoo search algorithm. IET Gener. Transm. Distrib. 2014, 8, 223–232. [Google Scholar] [CrossRef]
  21. Saonerkar, A.; Bagde, B. Optimized dg placement in radial distribution system with reconfiguration and capacitor placement using genetic algorithm. In Proceedings of the 2014 IEEE International Conference on Advanced in Communications, Control and Computing Technologies, Ramanathapuram, India, 8–10 May 2014; pp. 1077–1083. [Google Scholar] [CrossRef]
  22. Abou El-Ela, A.A.; El-Sehiemy, R.A.; Abbas, A.S. Optimal placement and sizing of distributed generation and capacitor banks in distribution systems using water cycle algorithm. IEEE Syst. J. 2018, 12, 3629–3636. [Google Scholar] [CrossRef]
  23. Syed, M.S.; Injeti, S.K. Simultaneous optimal placement of DGs and fixed capacitor banks in radial distribution systems using BSA optimization. Int. J. Comput. Appl. 2014, 108, 28–35. [Google Scholar] [CrossRef]
  24. Phisuthsaingam, P.; Larbwisuthisaroj, S.; Chaitusaney, S. An analysis of potentials and economic benefits of distributed generations as reactive power providers in Thailand. In Proceedings of the 19th International Conference on Electrical Engineering/Electronics, Computer, Telecommunications and Information Technology (ECTI-CON), Prachuap Khiri Khan, Thailand, 24–27 May 2022; p. 21797863. [Google Scholar] [CrossRef]
  25. Abualigah, L.; Diabat, A.; Mirjalili, S.; Abd Elaziz, M.; Gandomi, A.H. The arithmetic optimization algorithm. Comput. Methods Appl. Mech. Eng. 2021, 376, 113609. [Google Scholar] [CrossRef]
  26. Shirishti, S.; Gupta, A.R. DG allocation using arithmetic optimization algorithm in radial and mesh distribution system. In Proceedings of the Second International Conference on Power, Control and Computing Technologies (ICPC2T), Raipur, India, 1–3 March 2022; p. 21764243. [Google Scholar] [CrossRef]
  27. Abdel-Mawgoud, H.; Fathy, A.; Kamel, S. An effective hybrid approach based on arithmetic optimization algorithm and sine cosine algorithm for integrating battery energy storage system into distribution networks. J. Energy Storage 2022, 49, 104154. [Google Scholar] [CrossRef]
  28. Golla, N.K.; Sudabattula, S.K.; Suresh, V. Optimal placement of charging station and distributed generator along with scheduling in distribution system using arithmetic optimization algorithm. Int. J. Renew. Energy Res. IJRER 2022, 12, 970–980. [Google Scholar] [CrossRef]
  29. Ahmadi, B.; Younesi, S.; Ceylan, O.; Ozdemir, A. The arithmetic optimization algorithm for optimal energy resource planning. In Proceedings of the 56th International Universities Power Engineering Conference (UPEC), Middlesbrough, UK, 31 August–3 September 2021; p. 21159677. [Google Scholar] [CrossRef]
  30. Dinakara Prasad Reddy, P.; Veera Reedy, V.C.; Gowri Manohar, T. Optimal renewable resources placement in distribution networks by combined power loss index and whale optimization algorithms. J. Electr. Syst. Inf. Technol. 2018, 5, 175–191. [Google Scholar] [CrossRef]
  31. Muñoz-Delgado, G.; Contreras, J.; Arroyo, J.M. Distribution system expansion planning considering non-utility-owned DG and an independent distribution system operator. IEEE Trans. Power Syst. 2019, 34, 2588–2597. [Google Scholar] [CrossRef]
  32. Prakash, K.; Sydulu, M. Particle swarm optimization based capacitor placement on radial distribution systems. In Proceedings of the IEEE Power Engineering Society General Meeting, Tampa, FL, USA, 24–28 June 2007; p. 10301029. [Google Scholar] [CrossRef]
  33. Baran, M.E.; Wu, F.F. Network reconfiguration in distribution systems for loss reduction and load balancing. IEEE Trans. Power Deliv. 1989, 4, 1401–1407. [Google Scholar] [CrossRef]
  34. El-Fergany, A. Optimal allocation of multi-type distributed generators using backtracking search optimization algorithm. Int. J. Electr. Power Energy Syst. 2015, 64, 1197–1205. [Google Scholar] [CrossRef]
  35. Hung, D.Q.; Mithulananthan, N. Multiple distributed generator placement in primary distribution networks for loss reduction. IEEE Trans. Ind. Electron. 2013, 60, 1700–1708. [Google Scholar] [CrossRef]
  36. Mahmoud, K.; Yorino, N.; Ahmed, A. Optimal distributed generation allocation in distribution systems for loss minimization. IEEE Trans. Power Syst. 2016, 31, 960–969. [Google Scholar] [CrossRef]
  37. Baran, M.E.; Wu, F.F. Optimal sizing of capacitors placed on a radial distribution system. IEEE Trans. Power Deliv. 1989, 4, 735–743. [Google Scholar] [CrossRef]
  38. Saleh, A.A.; Mohamed, A.-A.A.; Hemeida, A.M.; Ibrahim, A.A. Comparison of different optimization techniques for optimal allocation of multiple distribution generation. In Proceedings of the 2018 IEEE International Conference on Innovative Trends in Computer Engineering (ITCE), Aswan, Egypt, 19–21 February 2018; pp. 317–323. [Google Scholar] [CrossRef]
  39. Sambaiah, K.S.; Jayabarathi, T. Optimal allocation of renewable distributed generation and capacitor banks in distribution systems using salp swarm algorithm. Int. J. Renew. Energy Res. IJRER 2019, 9, 96–107. [Google Scholar] [CrossRef]
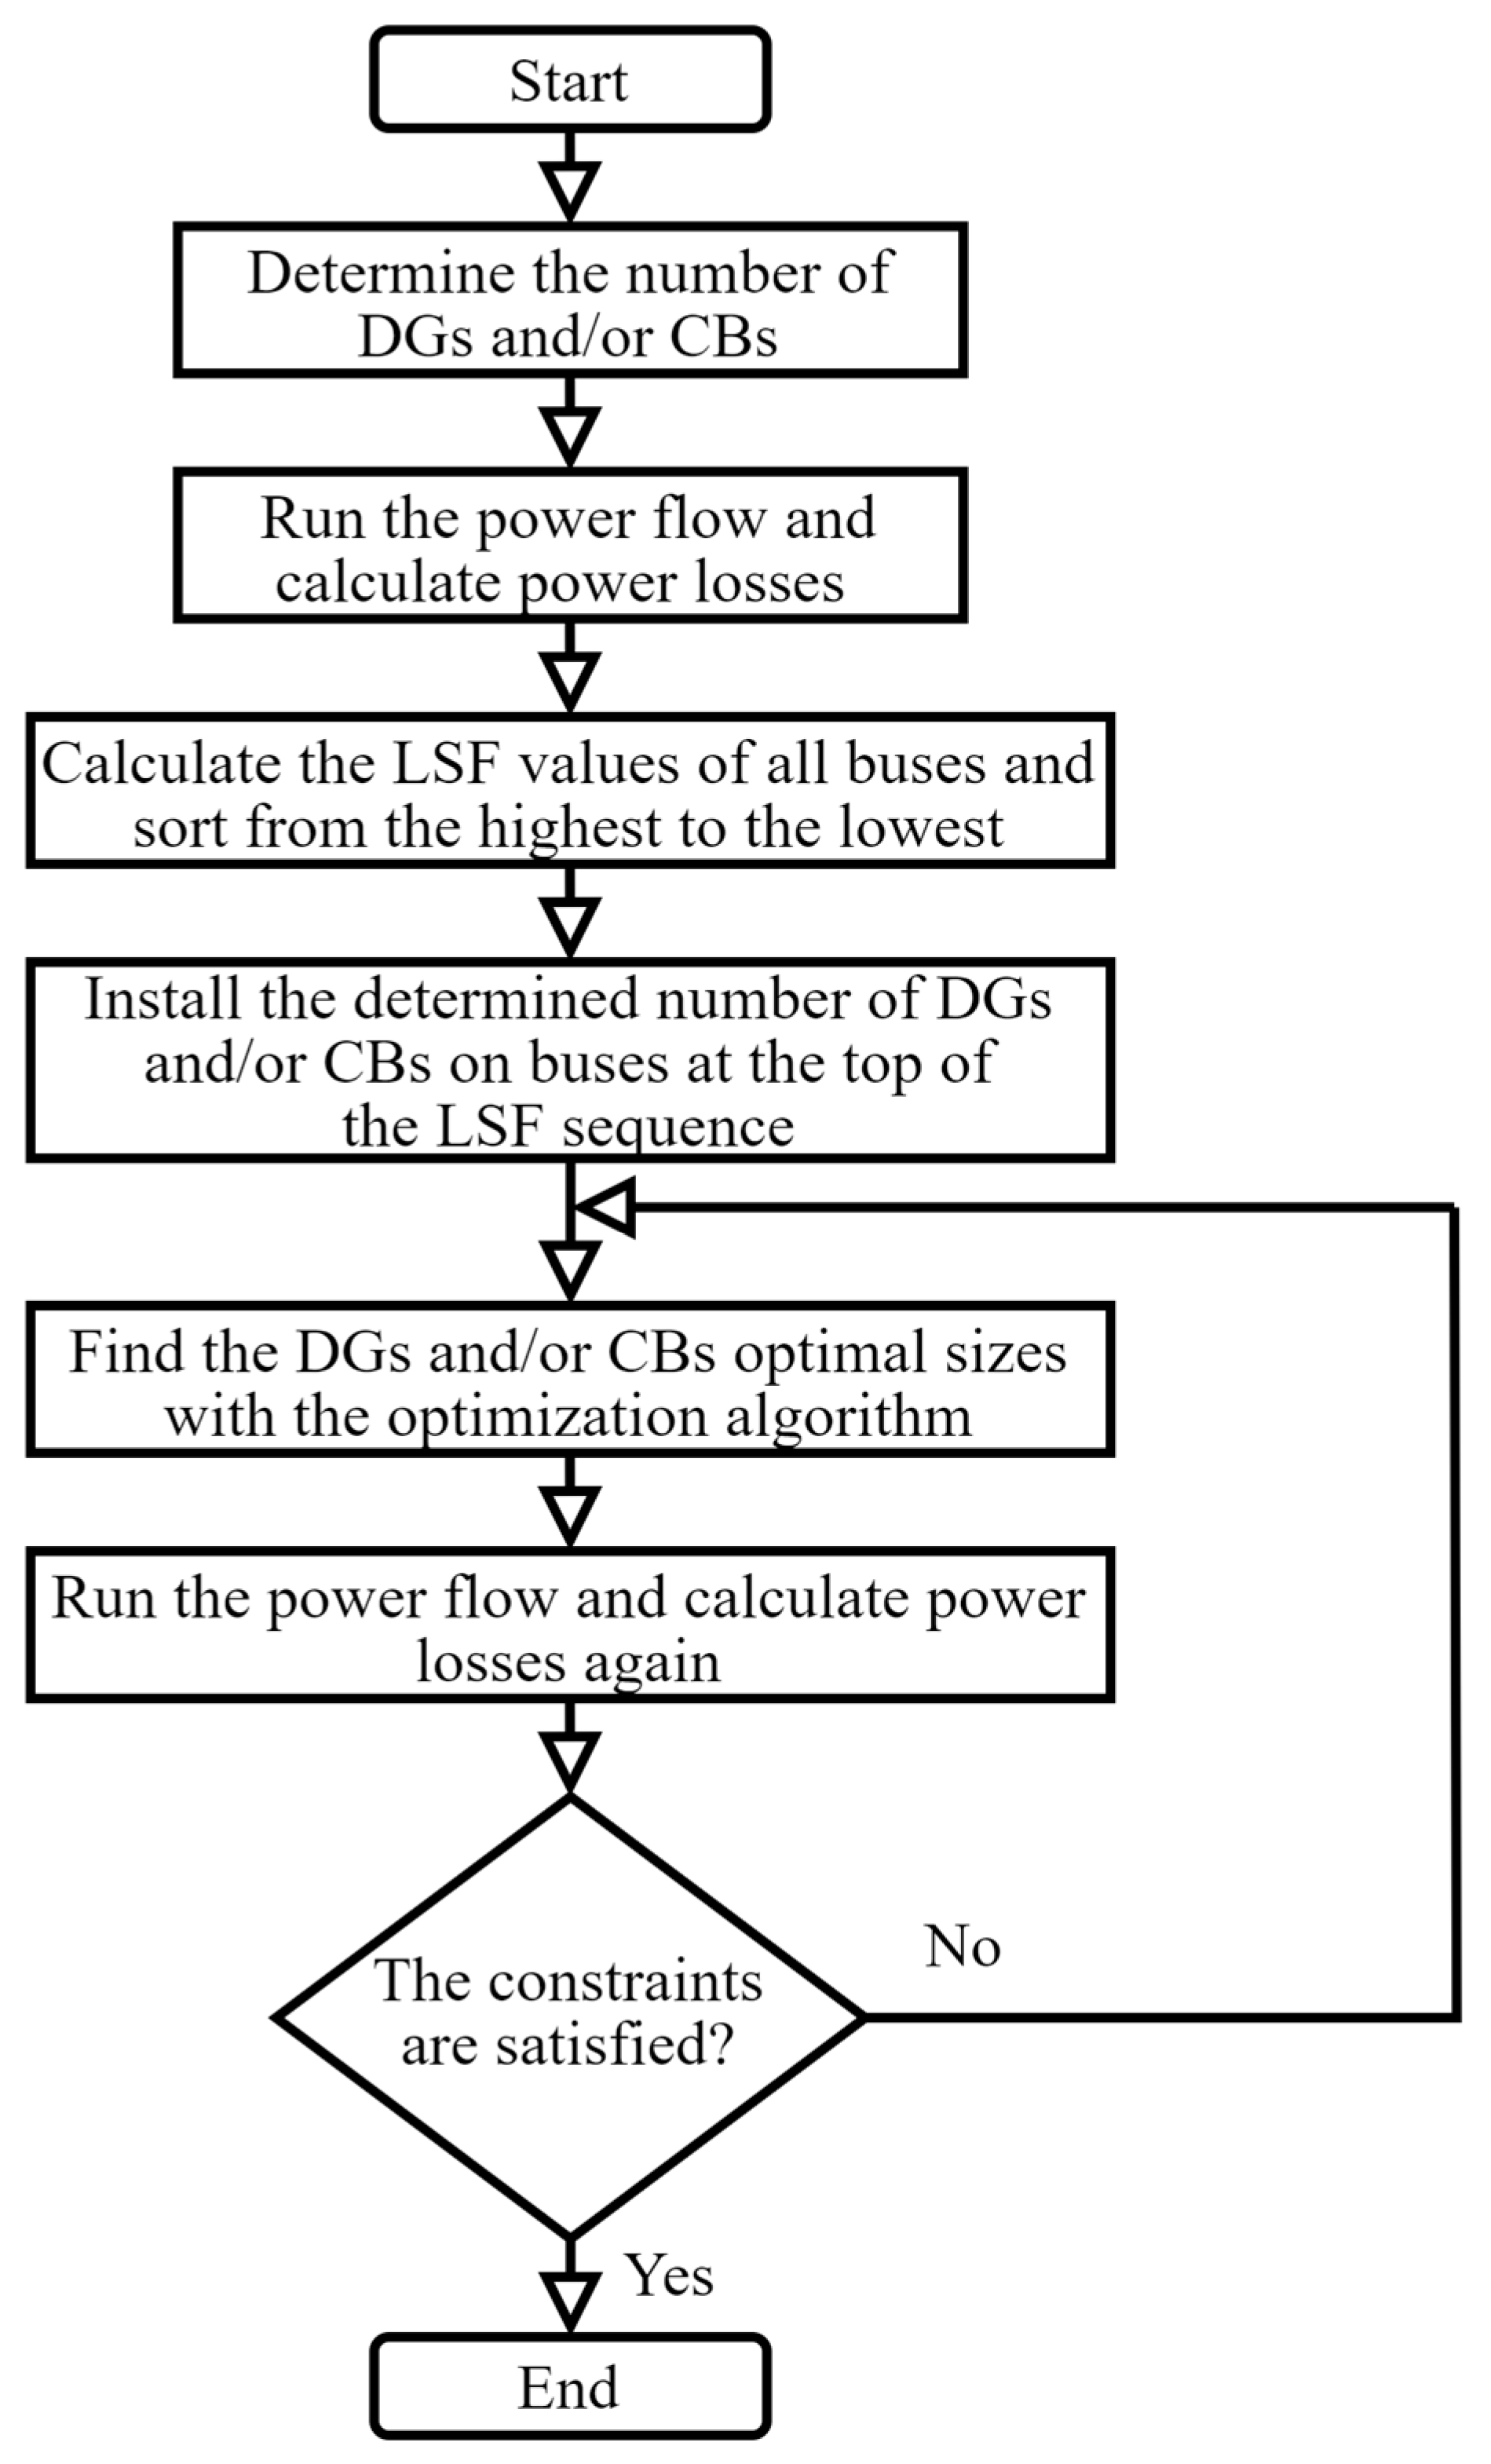
Figure 1. The flowchart for determining the optimal location of DGs and/or CBs.
Applsci 14 00831 g001
Figure 2. Two-bus distribution power system.
Applsci 14 00831 g002
Figure 3. The flowchart of AOA.
Applsci 14 00831 g003
Figure 4. IEEE 33-bus system.
Applsci 14 00831 g004
Figure 5. Voltage profile of the IEEE 33-bus system in different scenarios.
Applsci 14 00831 g005
Figure 6. Voltage profile of the IEEE 33-bus system in different power factor.
Applsci 14 00831 g006
Figure 7. Active power losses of the IEEE 33-bus system in different scenarios.
Applsci 14 00831 g007
Figure 8. IEEE 69-bus system.
Applsci 14 00831 g008
Figure 9. Voltage profile of the IEEE 69-bus system in different scenarios.
Applsci 14 00831 g009
Figure 10. Voltage profile of the IEEE 69-bus system in different power factor.
Applsci 14 00831 g010
Figure 11. Active power losses of the IEEE 69-bus system in different scenarios.
Applsci 14 00831 g011
Table 1. Scenarios.
Table 1. Scenarios.
Scenarios #Installation ModeNetwork
Scenario IInstallation of only DGsIEEE 33-bus network
Scenario IIInstallation of only CBsIEEE 33-bus network
Scenario IIIInstallation of DGs and CBs simultaneouslyIEEE 33-bus network
Scenario IVInstallation of DGs at the optimal p.fIEEE 33-bus network
Scenario IInstallation of only DGsIEEE 69-bus network
Scenario IIInstallation of only CBsIEEE 69-bus network
Scenario IIIInstallation of DGs and CBs simultaneouslyIEEE 69-bus network
Scenario IVInstallation of DGs at the optimal p.fIEEE 69-bus network
Table 2. The results of optimum DGs allocation for IEEE 33-bus system.
MethodOptimal
Location
(Bus No.)
Optimal
DG Size
(MW)
Power
Loss
(kW)
Loss
Reduction
(%)
AM [11]13
29
31
1.121
1.027
0.126
89.557.28
FWA [12]14
18
32
0.5897
0.1895
1.0146
88.6856.24
MTLBO [13]23
32
15
1.066
0.847
0.885
80.2262
JAYA [13]29
25
12
0.921
0.795
1.110
76.6663.6
GWO [13]12
25
30
0.955
0.889
1.037
74.1064.88
COA [14]14
25
30
0.7096
0.5954
0.9972
7663.98
ECOA [14]14
25
30
0.7376
0.6518
1.0705
74.664.64
SIMBO-Q [15]14
24
29
0.7638
1.0415
1.1352
73.465.20
QOSIMBO-Q [15]14
24
30
0.7708
1.0965
1.0655
72.865.48
AA [16]13
24
30
0.79
1.07
1.012
72.8965.45
HHO [17]13
24
30
0.8173
1.0829
1.0465
72.8065.4956
SPBO [17]14
24
30
0.7723
1.1059
1.0685
72.7965.5003
AOA14
24
30
0.7764
1.0990
1.0702
72.7965.50
Table 3. The results of optimum CBs allocation for IEEE 33-bus system.
MethodBus No.CB Size (kVAR)Power Loss (kW)Loss Reduction (%)
9450
IP [18]29800171.7818.58
30900
10450
SA [18]30350151.7528.07
14900
18349.6
BFOA [19]30820.6144.0431.72
33277.3
8556
AOA24513139.4133.92
30965
Table 4. The results of optimum DGs and CBs allocation for IEEE 33-bus system.
MethodBus No.DG Size (kW)Bus No.CB Size (kVAR)Power Loss (kW)Loss Reduction (%)
160.2518300
GA [21]220.252930071.2564.661
300.5030600
170.542418163.2
BFOA [19]180.160430541.041.4180.37
330.895533338.4
250.97323465
WCA [22]291.043056524.68887.82
110.56314535
140.79414384
AOA250.8812543612.657194.00
301.100301009
Table 5. The results of optimum DGs allocation at optimal p.f for IEEE 33-bus system.
MethodBus No.DG Size (MW)OPFPower Loss (kW)Loss Reduction (%)
130.6980.86
BSOA [34]290.4020.7129.6585.94
310.6580.70
60.90040.82
IA [35]140.62980.8222.2989.45
300.90040.82
130.7980.9
EA [36]241.0990.911.8094.41
301.0500.71
140.77760.9081
AOA241.05350.901811.775294.42
301.05040.7136
Table 6. Power losses of the IEEE 33-bus system in different scenarios.
ScenariosActive Power Loss (kW)Loss Reduction (%)Reactive Power Loss (kVAR)Loss Reduction (%)
Base Case210.98 143.14
Scenario I72.7965.5050.7364.56
Scenario II139.4133.9295.0133.62
Scenario III12.657194.0010.3792.75
Scenario IV11.775294.429.8393.13
Table 7. The results of optimum DGs allocation for IEEE 69-bus system.
MethodOptimal
Location
(Bus No.)
Optimal
DG Size
(MW)
Power
Loss
(kW)
Loss
Reduction
(%)
FWA [12]65
61
27
0.4085
1.1986
0.2258
77.8565.39
MTLBO [13]20
62
57
0.446
1.836
0.477
77.3665.61
JAYA [13]61
50
12
2.000
0.100
1.016
75.8366.29
GWO [13]61
50
12
2.000
0.586
0.792
73.4367.36
SIMBO-Q [15]61
9
17
1.500
0.6189
0.5297
71.368.3
QOSIMBO-Q [15]9
18
61
0.8336
0.4511
1.500
71.068.43
AA [16]11
17
61
0.499
0.377
1.668
69.5569.09
HHO [17]12
61
62
0.7341
1.1912
0.7623
74.1467.046
SPBO [17]11
18
61
0.5599
0.3692
1.1731
69.4569.1306
WOA [38]49
18
61
0.84046
0.53352
1.8084
70.1968.40
DA [38]66
14
61
0.23147
0.52993
1.7632
71.1068.40
MFO [38]11
61
21
0.54917
1.7458
0.35254
69.4669.13
AOA11
61
21
0.5716
1.7199
0.341
69.4369.14
Table 8. The results of optimum CBs allocation for IEEE 69-bus system.
MethodBus No.CB Size (kVAR)Power Loss (kW)Loss Reduction (%)
9600
CSA [20]21250147.9534.21
621200
58900
SA [18]11450155.4530.91
59600
26150
GSA [18]13150145.935.16
151050
11368
AA [16]21231145.2135.46
611196
11410
AOA21233145.09635.51
611234
Table 9. The results of optimum DGs and CBs allocation for IEEE 69-bus system.
MethodBus No.DG Size (kW)Bus No.CB Size (kVAR)Power Loss (kW)Loss Reduction (%)
170.540821187.9
WCA [22]612.0621237.333.33985.18
691.159269269.7
190.2947450
BSA [23]220.21923007.604796.61
611.7683150
190.35811600
SSA [39]100.518486004.83797.85
601.6735601200
611.6511611282
AOA110.521114144.624397.94
210.33421234
Table 10. The results of optimum DGs allocation at optimal p.f for IEEE 69-bus system.
MethodBus No.DG Size (MW)OPFPower Loss (kW)Loss Reduction (%)
611.80760.85
WOA [38]41.98870.857.8996.49
170.534720.85
110.496340.85
DA [38]611.74810.855.0197.77
170.395010.85
110.515730.85
MFO [38]611.74560.855.097.77
180.386170.85
170.5100.82
IA [35]50.67980.824.9597.74
611.69990.82
110.5480.82
EA [36]180.3800.834.4898.00
611.7330.82
110.4530.7071
AOA210.3490.83424.4498.03
611.70640.8290
Table 11. Power losses of the IEEE 69-bus system in different scenarios.
ScenariosActive Power Loss (kW)Loss Reduction (%)Reactive Power Loss (kVAR)Loss Reduction (%)
Base Case224.95 102.13
Scenario I69.4369.1434.9565.78
Scenario II145.09635.5167.6433.77
Scenario III4.624397.946.8993.25
Scenario IV4.4498.036.8293.32
Disclaimer/Publisher’s Note: The statements, opinions and data contained in all publications are solely those of the individual author(s) and contributor(s) and not of MDPI and/or the editor(s). MDPI and/or the editor(s) disclaim responsibility for any injury to people or property resulting from any ideas, methods, instructions or products referred to in the content.