Article

Potential of Proton-Exchange Membrane Fuel-Cell System with On-Board O2-Enriched Air Generation

by
Pedro Piqueras
,
Joaquín de la Morena
,
Enrique J. Sanchis
* and
José A. Lalangui
CMT-Clean Mobility & Thermofluids, Universitat Politènica de València, Camino de Vera s/n, 46022 Valencia, Spain
*
Author to whom correspondence should be addressed.
Appl. Sci. 2024, 14(2), 836; https://doi.org/10.3390/app14020836
Submission received: 22 December 2023 / Revised: 12 January 2024 / Accepted: 16 January 2024 / Published: 18 January 2024

Abstract

:
Hydrogen fuel-cell systems are one of the alternatives for the decarbonization of the transportation sector. In such systems, the usage of O 2 -enriched air has the potential to improve fuel cell performance as well as to reduce degradation phenomena linked to local O 2 starvation. However, the production of an O 2 -enriched air stream implies energy consumption that needs to be evaluated in the overall system efficiency. In this study, the potential of a system including polymeric membranes for O 2 -N 2 separation to produce O 2 -enriched air was evaluated theoretically. First, the balance of plant, including the O 2 -N 2 separation membrane and a two-stage boosting system, was considered. Two sources of energy recovery were identified: a high-pressure H 2 stream and retentate flow (N 2 -rich) at the outlet of the separation membrane. Then, the efficiency of the system was evaluated for different levels of O 2 enrichment, with sensitivities to the main operational and design parameters, i.e., cathode excess O 2 ratio, turbomachinery efficiency, essure ratios. The results show the potential for an O 2 -enriched system if the energy recovered reaches approximately 25% of the additional power consumption induced by the separation membrane.

1. Introduction

The increasing global demand for energy and urgent environmental concerns have driven the development of innovative technologies aimed at reducing dependence on fossil fuels [1]. While renewable energy sources such as wind, solar, and hydro hold great promise, their intermittent nature presents a challenge that requires effective solutions for energy storage [2]. In this context, green hydrogen derived from renewable sources has emerged as a high-energy-density vector for energy storage and transportation [3]. As a result, fuel cells are gaining prominence as clean and efficient alternatives to conventional combustion engines, particularly in transportation applications [4].
Fuel cells exhibit high efficiency by converting a significant portion, up to 63%, of the chemical energy contained in the fuel into electricity [5], surpassing the typical efficiency levels achieved with internal combustion engines [6]. Furthermore, an additional advantage of fuel cells is that they solely generate water as a by-product, resulting in a significant reduction in environmental impact compared with engines that release harmful pollutants [7]. In contrast to batteries, fuel cells offer a higher energy density, enabling the storage of larger amounts of energy in a smaller volume [8] and facilitate faster refueling times [9]. Among the different types of fuel cells available, the proton-exchange membrane fuel cell (PEMFC) is the most commonly used variant [10], especially in the transportation sector.
Polarization curves are vital in fuel cell performance analysis, highlighting the voltage–current density relationship and energy efficiency [11]. Particularly in PEMFC studies, these curves have allowed the assessment of the activation, ohmic, and concentration losses, each varying with cell design and operation [12,13]. Activation losses arise from slow electrochemical reactions at fuel cell electrodes, influenced by electrode materials, catalyst properties, operation temperature, and gas properties [14]. Such losses are characterized by a sudden voltage drop under low current density conditions, reaching values between 0.9 and 0.7 V in this region. Conversely, ohmic losses stem from the electrical resistance encountered by the protons in the electrolyte membrane and by the electrons in the current collectors [15]. This linear trend appears from the end of the activation losses area to a value around 0.6–0.4 V. Lastly, concentration (or transport) losses, occurring from 0.6 to 0.4 V, are identified a sudden voltage decrease in a narrow range of current density. Concentration losses arise due to the depletion of reactants, particularly O 2 at the cathode [16], becoming prominent when mass transfer limitations occur [17].
The O 2 concentration plays a vital role in determining the extent of activation [18] and concentration losses [19]. Activation losses are aggravated by the hindrance of electrochemical reactions caused by the low partial pressure of O 2 during low-current conditions [20]. A substantial reduction in activation losses, reaching 92%, was reported following an increase in O 2 concentration from 24% to 100%. This improvement translates to enhanced efficiency across the entire range of current densities [21]. Moreover, a decrease in O 2 concentration intensifies concentration losses by impeding reactant supply to the electrodes, resulting from mass transfer limitations between the gas channel and the catalytic layer of the cathode [22].
In certain fuel cell applications, particularly in the marine sector, specialized systems are employed to enhance the concentration of O 2 in the cathode feed stream [23]. The O 2 enrichment in the cathode feed stream has undergone extensive investigation for its potential to enhance performance and efficiency in PEMFCs [24]. Popat et al. [25] demonstrated that O 2 enrichment offers a notable advantage in increasing the power output of fuel cells at the working current density. By raising the concentration of O 2 at the cathode, the O 2 reduction reaction rate is accelerated, resulting in reduced activation overpotential. Tohidi [21] found that reducing activation losses due to O 2 enrichment improves overall cell efficiency across a wide range of current densities, leading to higher cell voltage and ultimately enabling enhanced power delivery at an equivalent current density. Fournier [26] demonstrated that increasing the O 2 concentration in the feed streams of a PEMFC stack not only enhances power output but also reduces the overall intake air flow rate to the cathode by a greater percentage than the level of enrichment. According to Kumar [27], there was a significant increase in air usage. Additionally, they determined that the optimal enrichment percentage for the stack is around 45% in mass fraction. It was observed that beyond this range, specifically between the natural concentration of O 2 and this value, an increase in cell temperature occurs due to a higher number of O 2 molecule collisions, leading to potential losses.
In addition to its direct impact on O 2 voltage and power output, increasing the concentration of O 2 offers further advantages. O 2 enrichment effectively mitigates local O 2 depletion conditions that can arise when the cathode’s O 2 supply falls short of the electrochemical reaction’s demands [28]. Enriching the cathode feed stream with O 2 boosts the available O 2 concentration, ensuring a balanced supply of reactants and enhancing power delivery, particularly during periods of high demand [29]. Moreover, elevated O 2 concentrations prevent the build-up of high-energy reaction intermediates, such as oxygen adsorbed on the cathode, which can otherwise react with other cell constituents. Averting such reactions and the resultant production of highly reactive oxygen species leads to the reduced degradation of the catalysts and the membrane [30]. However, it also presents challenges and potential drawbacks, including oxidative stress and elevated thermal control requirements and oxidative stress [31]. Elevated O 2 levels can induce oxidative stress in high-temperature conditions [31] and promote the formation of high-energy species, leading to degradation, particularly if O 2 permeates the anode [30]. Nevertheless, these drawbacks can be effectively mitigated through meticulous cell design and appropriate thermal management [31]. Yan Wang [12] also found that the corrosion effects on metallic bipolar plates materials can be significantly stronger on the cathode side, so increased levels of O 2 may limit the implementation of such materials. In addition, introducing supplementary equipment and control mechanisms adds complexity and increases energy costs. Therefore, exploring alternatives that minimize energy consumption while optimizing the O 2 enrichment is crucial in addressing these concerns [32].
From these findings, it can be concluded that a higher O 2 concentration in the cathode stream increases the electrical power produced (at equal H 2 consumption), improving the fuel cell stack performance as an individual element. To achieve a certain level of enrichment, O 2 can be supplied from a pure O 2 source or directly obtained from the atmosphere using N 2 /O 2 separation techniques. For on-board generation, the most typically used techniques encompass chemical separation methods, such as absorption on molten salts or the utilization of mixed ionic–electronic conductors, which operate at extremely high temperatures or cryogenic distillation techniques necessitating temperatures below −150 °C [33]. It should be noted, however, that the extreme temperatures associated with these air enrichment techniques are outside the working range of a typical PEMFC and can induce damage during its operation [34]. An alternative separation technique, which would not require altering the air temperature but rather its pressure, involves the utilization of polymeric membranes for N 2 –O 2 separation [35]. This technology, currently used for industrial N 2 production, consumes less energy than other techniques when intermediate levels of O 2 purity are required [36]. Such polymeric membranes are based on a hollow fiber system, where air passes through small channels, enabling the selective permeation of O 2 molecules while blocking other gases [37]. However, to the best of the authors’ knowledge, no previous work has analyzed the potential of such membranes in the context of fuel-cell system operation.
In order to determine the potential of on-board O 2 enrichment with polymeric membranes for fuel-cell systems, it is crucial to consider the energy consumption associated with the separation of O 2 from atmospheric air. In this sense, in order to achieve a proper N 2 –O 2 separation, such membranes need to maintain a minimum pressure ratio between the inlet of the membrane and the permeate (i.e., the O 2 -enriched stream) flow. Consequently, this entails the generation of significantly higher pressure upstream of the separation membrane than the one arriving the fuel cell stack. Moreover, a significantly higher inlet mass flow rate must be supplied to the membrane compared to the desired O 2 -enriched stream, with the excess mass flow primarily comprising N 2 , not directly useful for the current application. The ratio between the permeate stream mass flow and the inlet air mass flow is defined as the stage cut ratio. Both of these factors, related to membrane selectivity, contribute to an increase in compressor power consumption. Therefore, in order to assess the real potential of on-board O 2 enrichment for fuel cell systems, it is necessary to carefully study the gas management systems to reduce net gas consumption and improve gas integration in the overall balance of plant.
In this study, an evaluation of the potential benefits to the fuel cell balance of plant including on-board O 2 -enriched generation was performed. For this purpose, the performance of a fuel cell stack was estimated using data from the literature, while the energy associated to N 2 /O 2 separation was extracted using a working map from a commercially available polymeric membrane. Then, two sources for energy recovery, one in the hydrogen supply and another in the retentate flow at the separation membrane outlet, were designed and evaluated. The performance of this system in terms of the balance of plant efficiency was assessed against an atmospheric fuel cell fed with standard air. With these considerations, the main objectives of the current work were to:
  • Quantify the effect of O 2 enrichment on a PEMFC stack efficiency and mass flow with constant O 2 and H 2 excess ratio.
  • Evaluate the power consumption linked to the operation of a polymeric membrane for O 2 and N 2 separation.
  • Propose a novel balance for a plant layout for on-board O 2 enrichment and identify the potential sources for energy recovery.
  • Analyze the sensitivity of the new system efficiency regarding its main design and operational parameters to evaluate its potential with respect to a standard architecture.
The paper structure is divided into five different sections. Section 2 describes the proposed architecture of the balance of a plant with O 2 enrichment compared to a standard system from a current vehicle application and summarizes the main hypothesis and equations involved in the evaluation of the different components, with particular attention to the fuel cell stack and the separation membrane. Section 3 describes the contributions from the fuel cell stack, the power consumption of the compressors, and the energy recovery to the overall balance of plant efficiency as a function of the level of O 2 enrichment. Then, Section 4 evaluates the sensitivity of the system response to the main design and operational parameters of the balance of the plant architecture: compressor and turbine efficiencies, excess O 2 ratio, and membrane pressure ratio. Finally, Section 5 summarizes the main conclusions of the study and proposes some future research actions in the field.

2. Approach to Fuel-Cell System Analysis

In this section, the methodology used to estimate the performance of the balance of plant components as a function of the O 2 enrichment is presented. It has to be highlighted that the current study intendsedto determine if on-board oxygen-enriched air generation using N 2 –O 2 separation membranes is a viable option for this concept. For this reason, the operation of the balance of plant elements was represented using simple relationships to achieve a general approximation of the potential energy balance and efficiency achievable with the concept without specific details of the design of each subcomponent. In this sense, the main two components of the system (the fuel cell stack and the N 2 –O 2 separation membrane) were characterized using data extracted from the literature from existing components representative of the technologies’ state-of-the-art at production stage. Then, the proposed balance of a plant for on-board O 2 -enriched air generation is presented and compared with an atmospheric PEMFC balance of a plant, including the hypotheses associated with some specific components such as heat exchangers, compressors, and turbines in the system. Particularly, the heat exchangers are represented by a certain cooling efficiency, guaranteeing the energy balance between both flow streams feeding each component, while compressors and turbines are characterized by constant isentropic efficiency values representative of the average operation of radial turbomachinery components extracted from the literature.

2.1. Fuel Cell Stack

The first of the components to be analyzed is the fuel cell stack. First, the hydrogen consumption in g/(hr/cm 2 ) can be calculated as a function of the current density, i, in the stack according to the following expression:
n ˙ H 2 , e s t = i M W H 2 2 F × 3600 × 1000
where i is the current density in A/cm 2 ; F is the Faraday constant, with a value of 96,485.3 C/mol; and M W H 2 is the molecular weight of H 2 . It must be noted that while the previous expression evaluates H 2 based on pure reaction stoichiometry, it is typical that the PEMFC anode is fed with an excess of H 2 between 10 and 50% with respect the stoichiometric reference in order to avoid local starvation phenomena in the catalytic layer. However, as it described later on, in production PEMFC systems, the excess H 2 is recirculated, so the stoichiometric flow is a reasonable estimation of real H 2 consumption.
In order to convert H 2 consumption into the efficiency of the PEMFC stack, it is necessary to evaluate the relationship between voltage (or power) and current density as a function of the O 2 enrichment level. For this purpose, the experimental information available in the study by Fournier [26] was considered. In their study, the influence of the O 2 molar fraction was explored for a 35-cell stack with an active surface area of 232 cm 2 . During their study, the sensitivity of the O 2 molar fraction was evaluated up to pure oxygen. However, due to the characteristics of the N 2 –O 2 separation membrane, which is describes afterwards, only the range up to 40% was considered in the present analysis. Utilization of the comprehensive dataset from the Fournier study [26] enabled superior resolution in calculating the influence of O 2 enrichment levels. This dataset provides complete polarization curve data for O 2 molar fractions at 21%, 40%, 60%, 80%, and 100% levels. With the aid of these data, second-order polynomial functions were defined, each corresponding to a distinct current density level. These functions streamline the correlation process between the resulting voltage and the specific O 2 molar fraction deployed in this study—from 21% to 40%, evaluated in steps of 1%. The results from this methodology are depicted in Figure 1 for five of these levels, both in terms of the voltage delivered by the stack as well as its efficiency, calculated considering the H 2 flow and its higher heating value (assuming that water can exit the stack in the liquid phase). The efficiency was calculated assuming that the H 2 consumption is only a function of the current density, as expressed in Equation (1). As it can be seen, a higher O 2 molar fraction helps to increase both voltage (i.e., power) and efficiency, especially at higher current density values, as previously discussed in the Introduction.
Finally, to evaluate the balance of the plant, it was necessary to also compute the normalized mass flow consumed in the PEMFC cathode in g/(hr/cm 2 ). This parameter can be calculated according to the following expression:
n ˙ c = λ O 2 X O 2 n ˙ H 2 , e s t 2 = λ O 2 X O 2 i M W c a t h 4 F × 3600 × 1000 ,
where n ˙ c is the molar flow reaching the cathode, while λ O 2 is the excess ratio with respect to the stoichiometric value, expressed in terms of O 2 . The variable X O 2 represents the O 2 molar fraction in the stream arriving at the cathode, and M W c a t h stands for the average molecular weight of this stream.
During the balance of plant evaluation performed in the current study, it was assumed that the same excess O 2 ratio coefficient would be used regardless the degree of enrichment used. However, it would expected that a system with an O 2 -enriched air stream would be less susceptible to performance loss due to O 2 transport limitations at the cathode and to degradation phenomena linked to local O 2 depletion due to the higher partial O 2 pressure. Therefore, the expected results at higher current densities would be slightly better than those found in the present study. Furthermore, it must be noted that the experiments conducted by Fournier were limited to the current density range, where the voltage response is approximately linear and the ohmic losses control the cell response [26]. If the range of current density was further increased, more benefit would be expected from the O 2 -enriched operation.

2.2. N2–O2 Separation

Another critical aspect of the system is related to the process of N 2 –O 2 separation necessary to produce the O 2 -enriched stream. During this study, it was assumed that this process is produced on-board by means of a polymeric membrane. Two main parameters were considered for this element: the pressure ratio between the inlet and permeate streams ( π m e m ) and the stage cut, which represents the ratio between both mass flow rates ( λ m e m ). This ratio is mainly a function of the level of O 2 enrichment and, to a lesser extent, of the pressure and temperature conditions under which it is operated. In the present study, it was assumed as a first approximation that the operating conditions are set constant at π m e m b = 4 and at a temperature of 80 °C. Thus, the ratio of mass flow rates was adjusted to the following correlation based on a complete operating map for the polymeric membrane under study (model NM C05 of UBE Corporation):
λ m e m = 83.287 X O 2 2 34.504 X O 2 + 4.635
This correlation presents a coefficient of determination R 2 of 99.3%, which can be considered to reliably represent the membrane performance in the range of O 2 fraction used for the adjustment (from 21 to 40%). Furthermore, the outlet pressure of the retained stream (N 2 -rich) was assumed to be 90% of the inlet pressure, while the permeate stream was assumed to be at atmospheric pressure. Figure 2 shows the consequence of the membrane stage cut ratio by comparing the mass flow at the cathode inlet and the total air mass flow consumed as a function of the O 2 enrichment. During this study, the flow rates were divided by the total active area of the stack, calculated as the product of the number of cells and each cell active area, so that the actual values were independent from the PEMFC stack size. As it can be seen, applying higher levels of O 2 enrichment helps to reduce the mass flow arriving to the cathode, since the same excess O 2 ratio is assumed, but the requirements from the membrane reverse this trend. Particularly, for X O 2 = 0.25 , the total air mass flow consumed by the membrane is approximately equal to the one consumed by the PEMFC alone with X O 2 = 0.21 , where higher levels of enrichment result in an increase in the total air mass flow consumed.

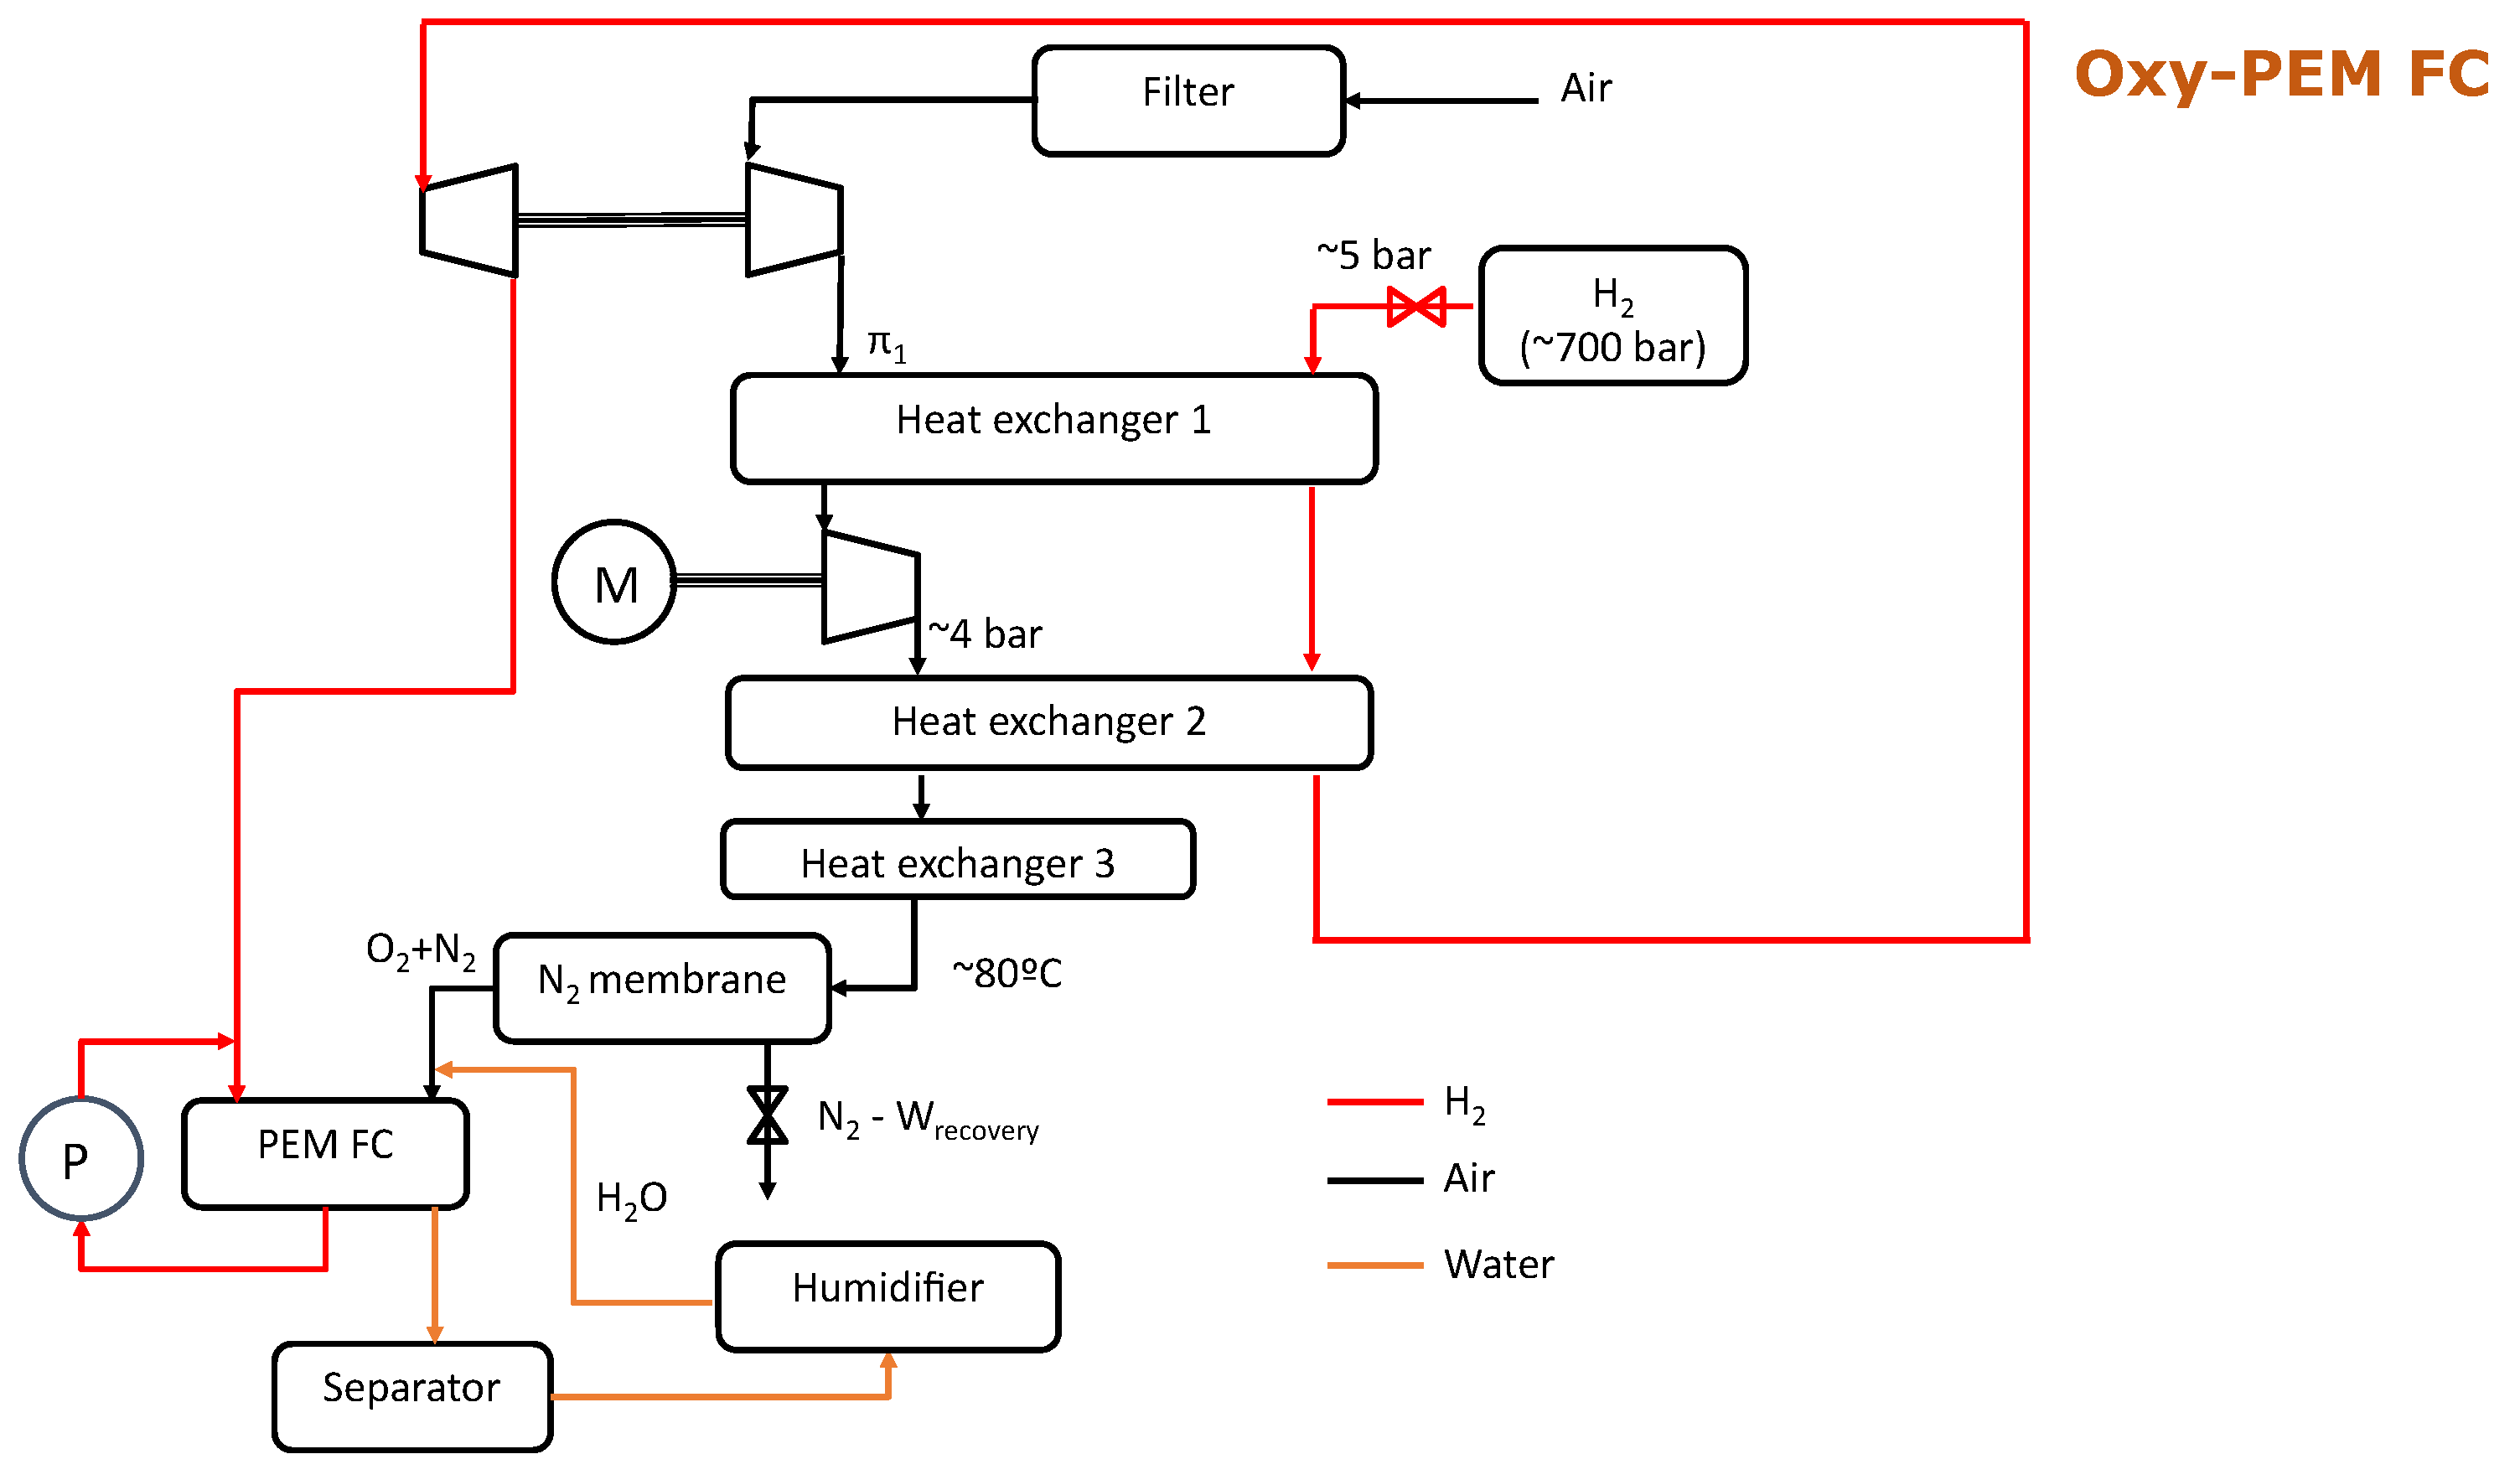
2.3. Balance of Plant Description

In Figure 3, the usual layout for the balance of plant for PEMFCs systems is highlighted. In this diagram, the black lines correspond to the cathode input stream (obtained from the ambient air), the red lines relate to the anode input stream (hydrogen), and the orange lines represent the water stream used for the humidification of the fuel cell stack. In particular, two different configurations are introduced: an atmospheric system, where the air stream is supplied at the ambient pressure, and a supercharged system, where an electrical compressor is included upstream the stack.
One of the more important aspects to be taken into account relates to the thermal management of gaseous streams. This is due to the fact that the fuel cell needs to be operated in a temperature range between 60 and 90 °C in order to reach the best possible efficiency while guaranteeing the presence of liquid water at the proton exchange membrane. In the case of atmospheric systems, electrical heaters can be used to provide the required energy to both H 2 and air up to the working temperature, which, for this study, was assumed to be 80 °C. When working on the supercharged system, this electrical system is not required in principle due to the temperature increase associated with the compression itself, while a heat exchanger may be required to cool the air depending on the pressure ratio of operation ( π ). In supercharged fuel cells, π is in the range of 1.2 to 2.2 [38]. This variation suggests that, depending on the compressor efficiency, the air temperature at the heat exchanger inlet could exceed 250 °C. Additionally, the H 2 line includes an expansion valve to adapt the tank pressure to the stack operating pressure (approximately equal to the pressure on the air side), plus a recirculation circuit to take advantage of the excess hydrogen from the fuel cell. In the air circuit, the outlet gases from the fuel cell cathode, mainly consisting of the excess air and the water produced by the electrolytic reaction, pass through a separator to recover and reuse the water in the humidifier, included to guarantee the correct humidification of the fuel cell membrane (relative humidity between 60 and 90%).
Figure 4 shows the balance of plant proposed for the system with on-board O 2 enrichment in the cathode stream. Due to the level of pressure imposed by the O 2 –N 2 separation membrane, it is necessary to incorporate a two-stage boosting system. The first compression stage is achieved with a turbocharger, which operates under a certain pressure ratio π 1 . After this compression, intermediate cooling is carried out using Heat Exchanger 1 to return to a temperature that is as close as possible to the ambient one before entering the second compression stage, so that the efficiency and energy consumption of the later are not negatively impacted. The second compression is carried out through an electric compressor, which is controlled to provide the necessary pressure at the inlet of the polymeric O 2 –N 2 separation membrane. The output of this compression is cooled down again in Heat Exchanger 2, with the objective to bring it down to a temperature of around 80 °C, close to the optimal operating temperature for both the polymeric O 2 –N 2 separation membrane and the fuel cell stack. To safeguard the N 2 membrane’s operation in circumstances where the H 2 stream is unable to effectively cool compressed air to 80 °C, a third exchanger is employed (utilizing water as the coolant) to ensure that the air enters the separation membrane at the specified temperature. The retained stream from the O 2 separation membrane (mainly composed of N 2 ) is directed to a turbine to recover as much energy as possible. Instead, the permeate stream (i.e., the O 2 -enriched air) arrives at the fuel cell stack again after mixing with water in the outlet of the humidifier.
In the H 2 stream, the first component is a supply valve from the 700-bar tank in the vehicle such as in the standard system, although controlled to a higher pressure ( π H 2 ). The low-temperature H 2 , characterized by its high specific heat capacity of 14.3 kJ/kgK, compared to air’s 1 kJ/kgK at 25 °C, functions as a cooling medium for the first two heat exchangers. The principal objective of these exchangers is to increase the H 2 stream temperature. This helps to raise the H 2 temperature before it arrives at the turbine side of the turbocharger, where it is expanded to provide the power required for the first air compression.
Considering the layout of the balance of plant proposed, other parameters that need to be taken into account are the isentropic efficiencies of the existing compressors and turbines for energy recovery, as well as the expansion ratio in the turbine corresponding to the H 2 -fired generator set. Table 1 shows a summary of all the parameters explored, the values initially adopted for each of them (which are defined using values close to the average values within the usual working range for each parameter and are called base case in the following section), as well as the ranges that were explored later in the sensitivity studies carried out for each of the variables.
Finally, the net efficiency of the balance of plant was obtained as follows:
η n e t = N s t a c k N c o m p + N t u r b m ˙ H 2 H H V
where N s t a c k is the power delivered by the fuel cell stack, N c o m p is the power consumed combining both compressors of the cathode stream, N t u r b is the power delivered by both H 2 and N 2 turbines, and H H V is the higher H 2 heating value (142.5 MJ/kg). In the next sections, the system efficiency reached at different O 2 enrichment levels is compared with the one corresponding to an atmospheric fuel cell such as the one described in Figure 3a. The reason for this selection is that, as mentioned before, it is assumed that the permeate flow in the O 2 separation membrane is approximately atmospheric.

2.4. Summary of Main Assumptions

Considering the information and discussion included in the previous points, the main assumptions in the study are summarized below:
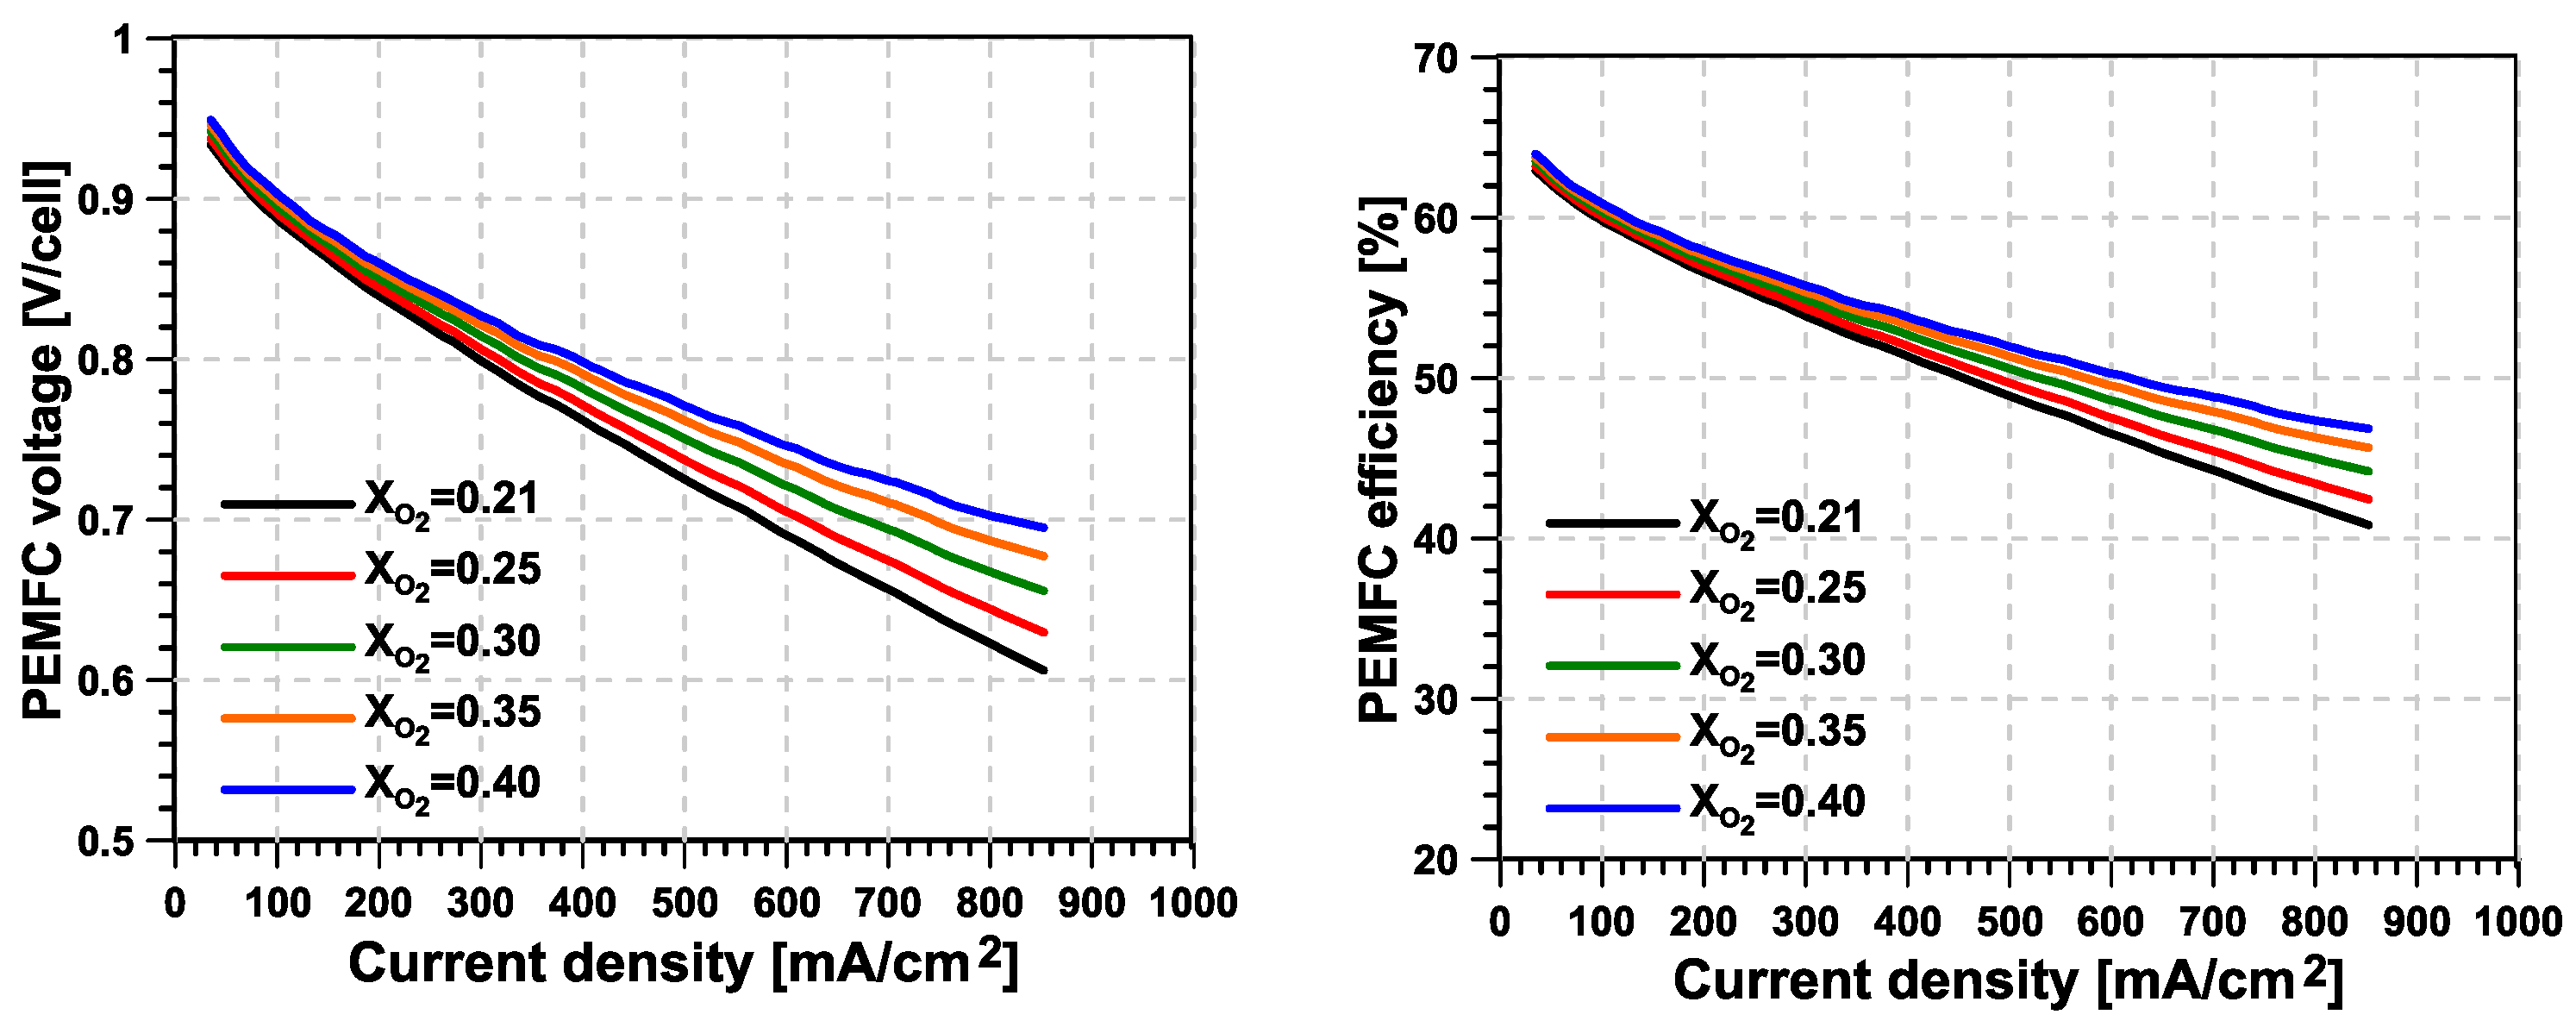
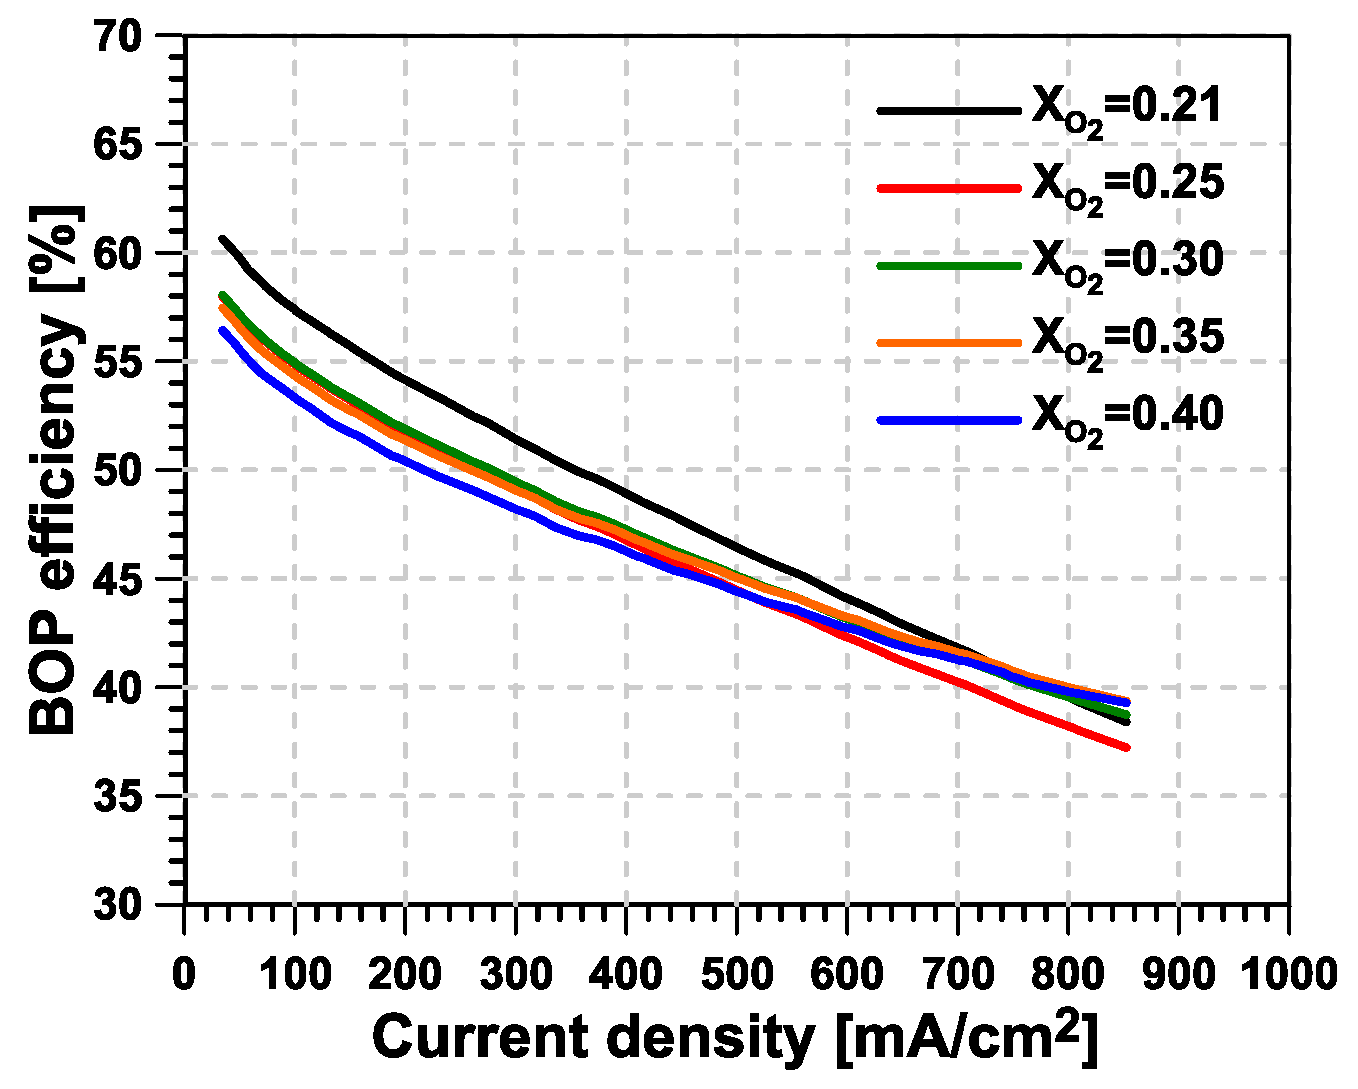
  • For all operating conditions, the sensitivity of the fuel cell stack polarization curve with respect to the oxygen molar fraction is assumed to be equal to the data obtained from the study of Fournier et al. [26].
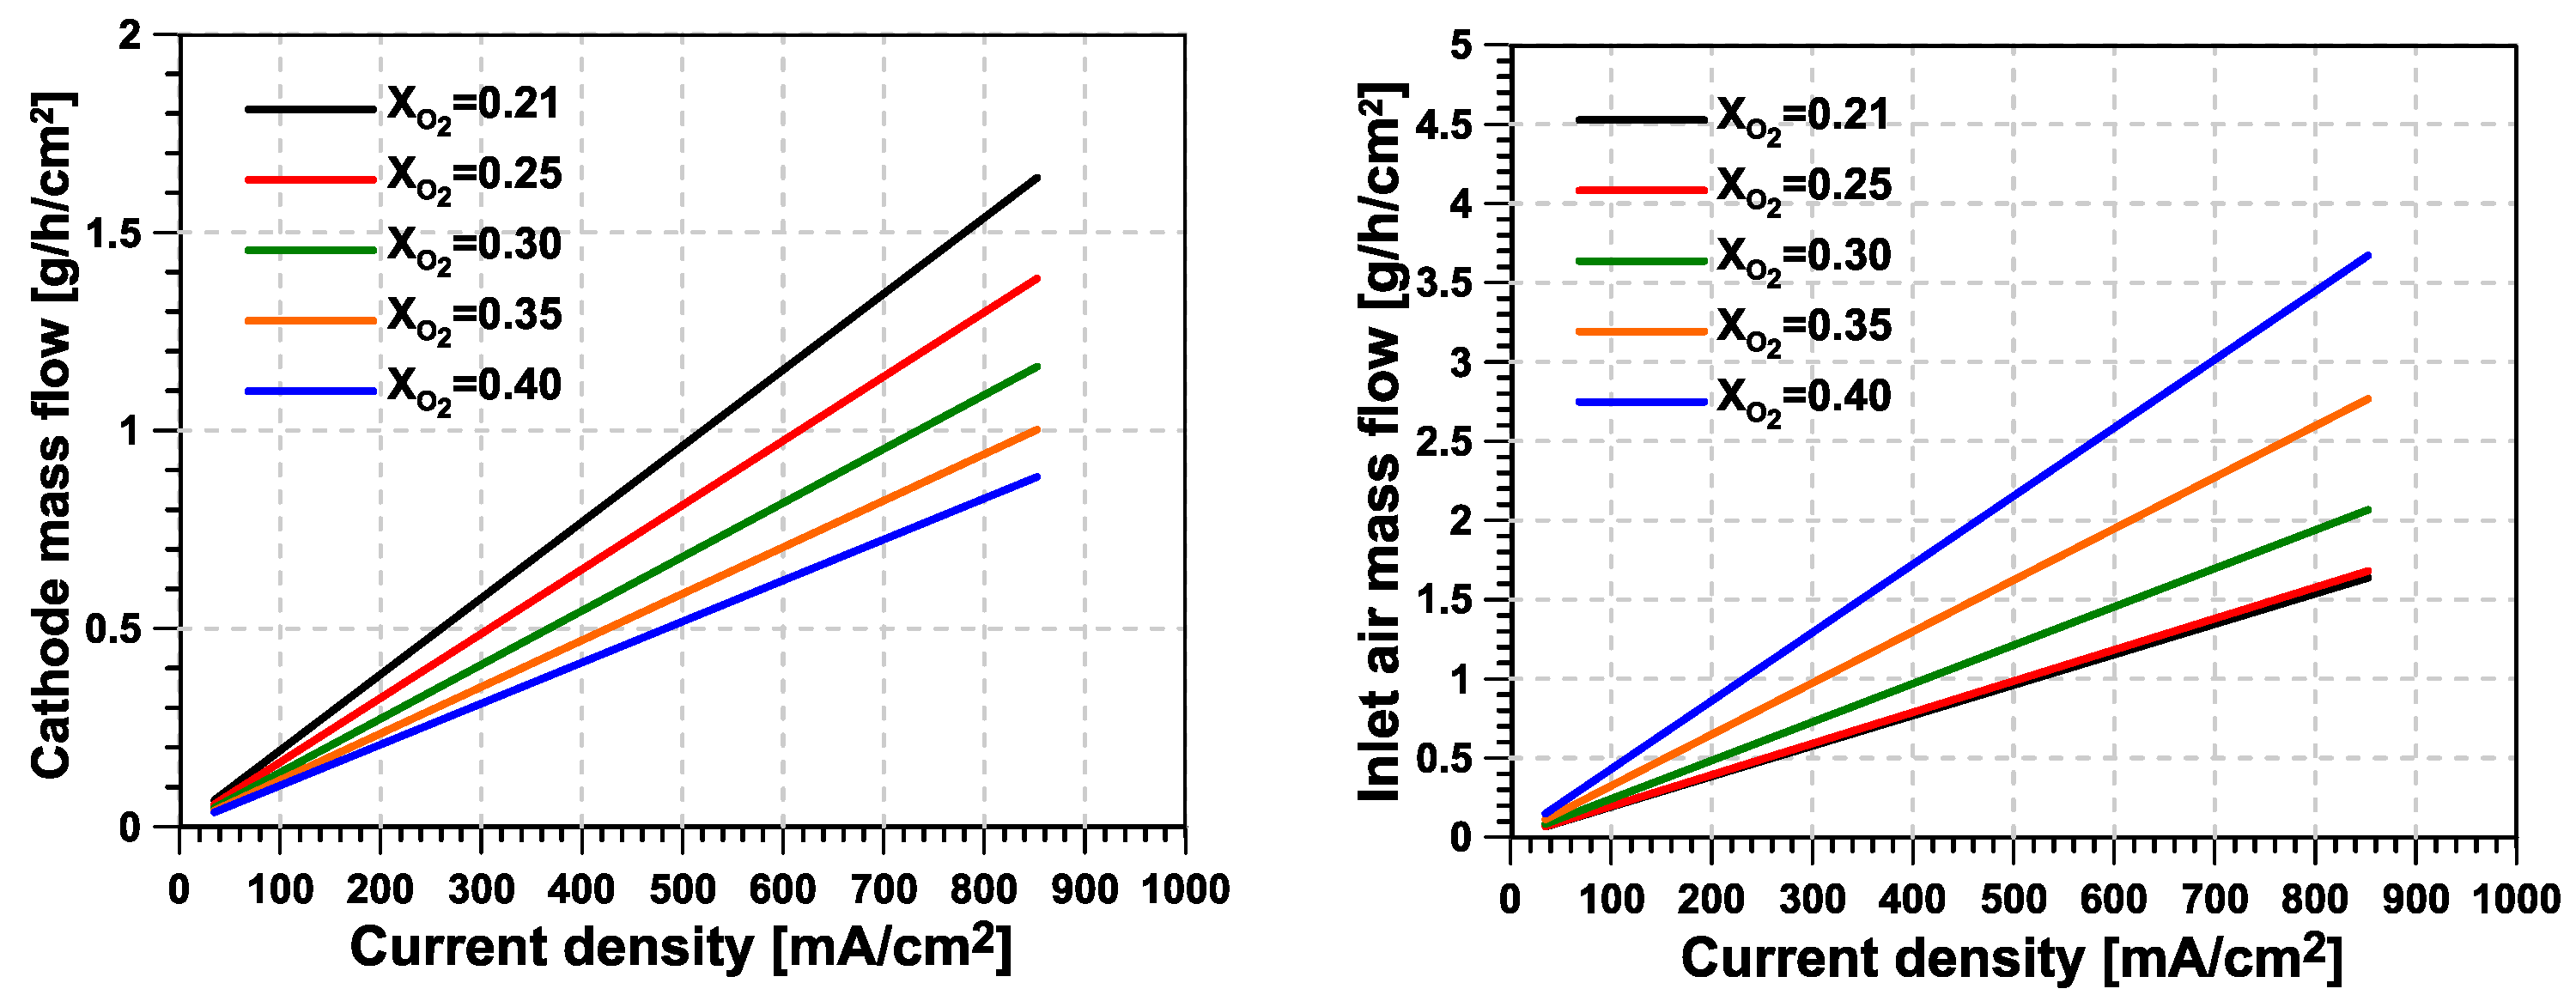
  • The hydrogen consumption is directly calculated from the anode reaction stoichiometry. At the cathode, the total oxygen mass flow is the same regardless the oxygen molar fraction achieved, while this value is adapted as a function of the current density assuming a constant oxygen excess factor.
  • The separation membrane operates at a constant temperature of 80 °C and pressure ratio (nominally, four). The ratio of inlet to permeate (O 2 -enriched) mass flows (stage cut) is extracted from the operating map of a commercial system (model NM C05 of the UBE Corporation, Tokyo, Japan).
  • In the retentate flow (nitrogen-enriched), a pressure drop of 5% is assumed for all working conditions. This stream is directed to an electric turbine, characterized by a constant isentropic efficiency. Instead, in the permeate (oxygen-enriched) stream, the outlet pressure is assumed to be equal to 1 bar. For this reason, the operation of the oxygen-enriched concept was compared to an atmospheric fuel cell, also working with 1 bar at the cathode inlet, so that the pressure effect on the fuel cell stack performance is equivalent.
  • In order to reach the necessary pressure upstream of the separation membrane, a two-stage boosting system with intermediate cooling is used. A cooling efficiency of 90% is assumed for this intermediate cooling.
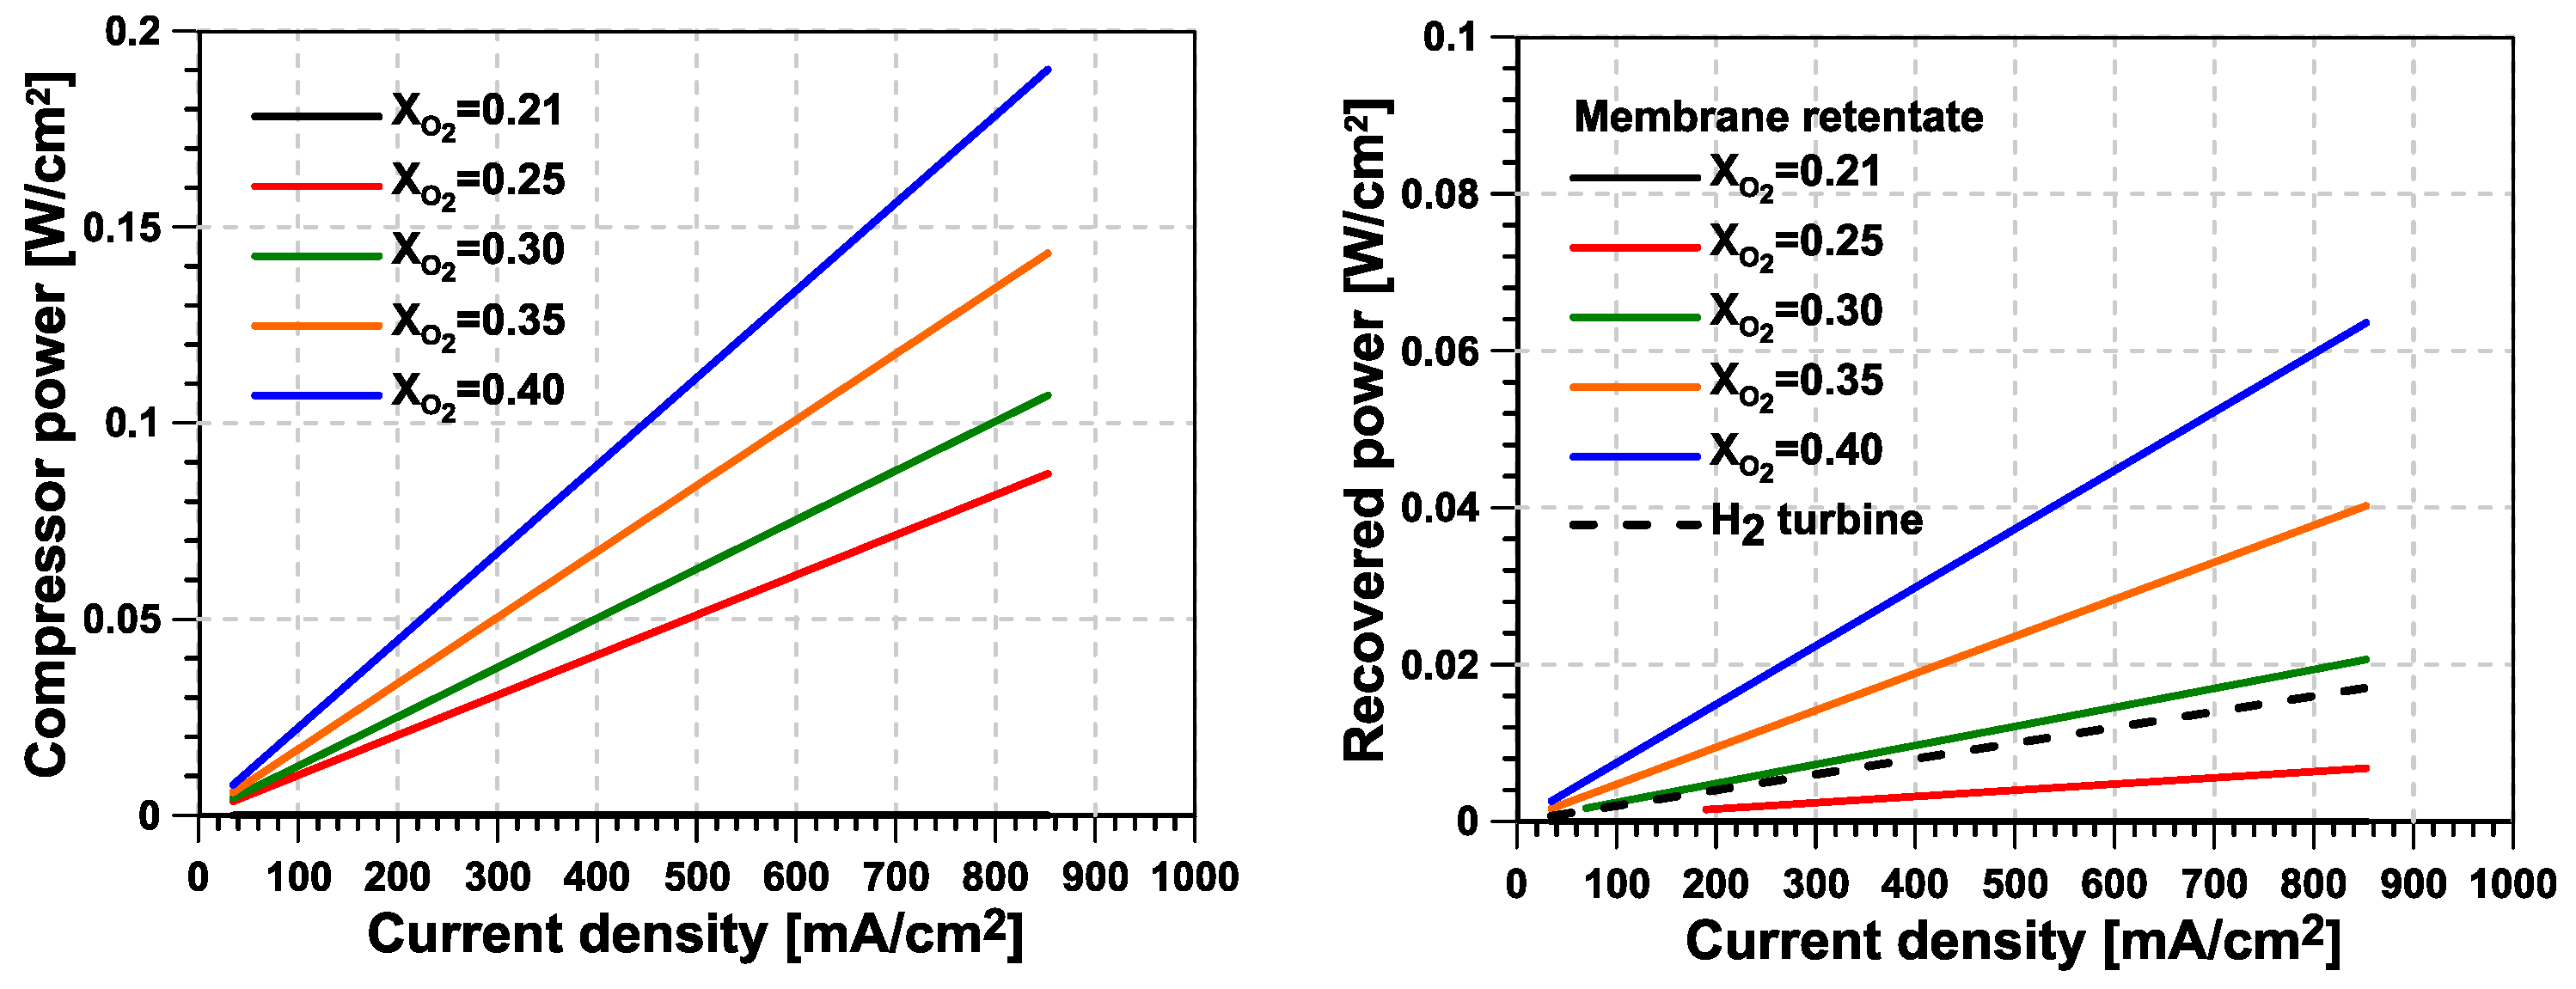
  • The hydrogen stream is assumed to be provided at 5 bar, controlled by an expansion valve at the hydrogen tank outlet. This stream is heated using the energy available in the cathode stream after compression, increasing the exergy available in the flow. Afterword, the 5-bar heated hydrogen stream is directed to a turbine included in a turbocharger, providing the power for the first compression in the cathode stream with a mechanical efficiency of 97%. Instead, the second compression is directly driven by an electrical compressor, representing the main energy consumption in the proposed system.
  • The isentropic efficiency of each compressor stage is assumed to be equal and independent on the working conditions. In the same sense, both nitrogen and hydrogen turbine efficiencies are also constant and equal. The selected ranges for turbine and compressor efficiencies were extracted from the typical values of the radial turbomachinery currently used in automotive applications in the peak efficiency area.

3. Commercial Membrane Analysis

In this section, the main results obtained using the currently available polymeric membrane for N 2 –O 2 separation (model NM C05 from UBE Corporation) are detailed. Figure 5 shows the combined power consumed by both compressor stages together with the power recovered in the turbines present in the H 2 stream and in the membrane outlet (retentate) stream. It must be considered that the power for the first compressor stage is provided by the power produced in the H 2 turbine, with a mechanical efficiency of 97% in the turbocharger shaft. Therefore, the difference between the compressors’ consumption and the H 2 recovery represents the power consumed by the electrical compressor, which consumes the most energy under most conditions.
As was shown in Figure 2, to achieve high levels of O 2 enrichment, it is necessary to significantly increase the membrane inlet mass flow rate. This implies a proportional increase in the power consumed since, as mentioned above, the pressure ratio and efficiency of the compressors are fixed as a first approximation. It should be noted that in the case of working with standard air (21% O 2 molar fraction), there would be no power consumed since it is assumed that the system would operate as an atmospheric fuel cell.
In terms of power recovery, it must be noted that thepower produced the H 2 flow turbine, represented by a dashed black line, is assumed to be independent of the O 2 enrichment intensity, since it depends only on the expansion ratio and the efficiency of the turbine. Differently, the power recovered in the membrane outlet increases with the level of O 2 enrichment due to the higher retentate stream induced by the higher stage cut ratio values. Once both effects are summed, it is possible to recover between one-third and half of the power consumed in the compression stages.
Finally, the result of the combination of all the aforementioned components can be expressed in terms of the balance of plant efficiency, depicted in Figure 6. The chart shows that at low current densities, the O 2 enrichment does not present any advantage, since the effect on the stack performance is minimal compared to the additional power consumption of the compressors. As the current density increases, the improvement induced at the stack level by the higher O 2 molar fraction helps to reduce the decrease in efficiency, with some improvement appearing for the highest current density (around 1% absolute). In the proposed method, operating with a constant enrichment level for the whole range of current densities would not be the best solution in a realistic application. Still, it would be possible to work without enrichment (applying a bypass to the membrane) at low-to-medium current densities and, from that point on, to progressively increase the enrichment level looking for the optimum performance for each operating condition.

4. Sensitivity Analysis to Air Management Parameters

The system response to the parameter changes introduced in Table 1 is now explored. Figure 7 shows the results in terms of the balance of plant efficiency versus current density results for the different studies performed. These include the excess oxygen ratio, the turbine and compressor efficiencies, and the pressure ratio across the membrane. In each study, only one parameter was varied from the case previously discussed. Additionally, the full sensitivity of O 2 enrichment (for an oxygen molar fraction of 0.22 to 0.4) was computed, but only the value that maximizes the average efficiency over the entire polarization curve was selected for the comparison. The legend for each curve also includes the selected O 2 enrichment level.
The first parameter studied was the excess O 2 ratio of the cathode through the value of λ O 2 , shown in the upper left corner of the figure. As can be seen, there is a non-negligible improvement, around 2% absolute, if a reduction in this excess O 2 ratio up to a value of 1.2 is considered. This is due to the lower compressor power associated with the lower air mass flow. It should be noted that, as previously discussed, it is expected that the need to operate with high excess ratios would be reduced as the proportion of O 2 in the cathode stream increases, which is in favor for the possible implementation of the proposed technology. However, above a certain value of λ O 2 , the sensitivity to the excess O 2 ratio is significantly reduced, since a large part of the extra consumption produced by the compressor can be recovered in the expansion of the turbine present at the outlet of the membrane retentate gas.
The second parameter covered is related to the level of compression that is necessary to enable the operation of the polymeric O 2 –N 2 separation membrane ( π m e m b ). The results of this study are presented in the graph in the lower left corner of the figure. As can be seen, this is the parameter that presents the greatest potential for improvement of the performance of the system by almost linearly reducing the power consumed, achieving improvements of more than 4% in absolute performance. In this regard, it must be noted that the present study was based on a performance map from a commercial membrane, model NM C05, from UBE Corporation. However, other membrane technologies with better selectivity levels (i.e., with a higher capacity to separate O 2 from N 2 ) are being evaluated according to the literature [42]. If membranes with such capability become commercially available, it would be possible to achieve similar enrichment levels at lower pressure ratios, further enhancing the system potential.
Finally, sensitivity studies were conducted with respect to the isentropic efficiencies of both the compression (upper right corner) and expansion (lower right corner) stages of the existing turbomachinery. From the compression study, it was found that it is necessary to ensure compressor efficiencies above 60% for the proposed technology to present advantages in terms of system performance. The effect on turbine efficiency is less significant in comparison, although a threshold limit of 70% can also be set to ensure an operating area where the new architecture presents reasonable advantages for its implementation. In this regard, it should be noted that the optimization of the H 2 turbine presents a major technological challenge, mainly due to four factors:
  • The compatibility of H 2 with some of the most common materials used in this type of turbomachinery, especially stainless steel or cast iron.
  • The high diffusivity of H 2 , which makes it necessary to optimize interstitial spaces and sealing systems in order to achieve high target performance.
  • The relatively high expected expansion ratio (around five), which makes mechanical design and reduction of axial stresses in the turbocharger bearings difficult.
  • In order to ensure acceptable turbine performance, it is necessary to ensure a relatively high inlet flow temperature. In the proposed installation, it is very difficult to achieve these conditions, so it would be necessary to introduce a temperature conditioner at the inlet.

5. Conclusions

In the current work, an investigation of the potential of a fuel cell system working with O 2 -enriched air generated on-board was carried out. For this purpose, data regarding the sensitivity of a certain fuel cell technology with respect to the O 2 molar fraction in the cathode stream were extracted from the literature. Then, a performance map of a commercial O 2 -N 2 separation membrane was used to evaluate on-board O 2 -enriched air generation. Based on this, the required air mass flow and power consumption per active area of the fuel cell stack were quantified as a function of the O 2 enrichment level and the fuel cell operating conditions. Additionally, two potential sources for energy recovery, one in the H 2 supply line and another in the outlet of the O 2 -N 2 separation membrane, were identified and evaluated.
The following conclusions were drawn from this study:
  • The main advantage from O 2 enrichment in terms of fuel cell stack efficiency is found at medium-to-high current intensity levels, where a higher O 2 concentration helps to reduce the losses related to diffusion and chemical kinetic aspects at the cathode side. In contrast, the margin for improvement is very small at low current intensity values. Additionally, the mass flow per unit of active area to be supplied to the fuel cell cathode can be reduced if the same level of excess O 2 ratio is applied.
  • Higher levels of O 2 enrichment imply the need to supply the O 2 –N 2 separation membrane with a mass flow that is significantly higher than the useful (permeate) O 2 -enriched generated stream. This reverses the reduction in cathode mass flow seen at the stack level, significantly increasing the compressor’s power consumption and limiting the potential advantages of the system compared with a traditional fuel-cell system. As a consequence, the new proposed concept consumes additional power, which is mostly concentrated in the second stage of compression, driven by an electric motor.
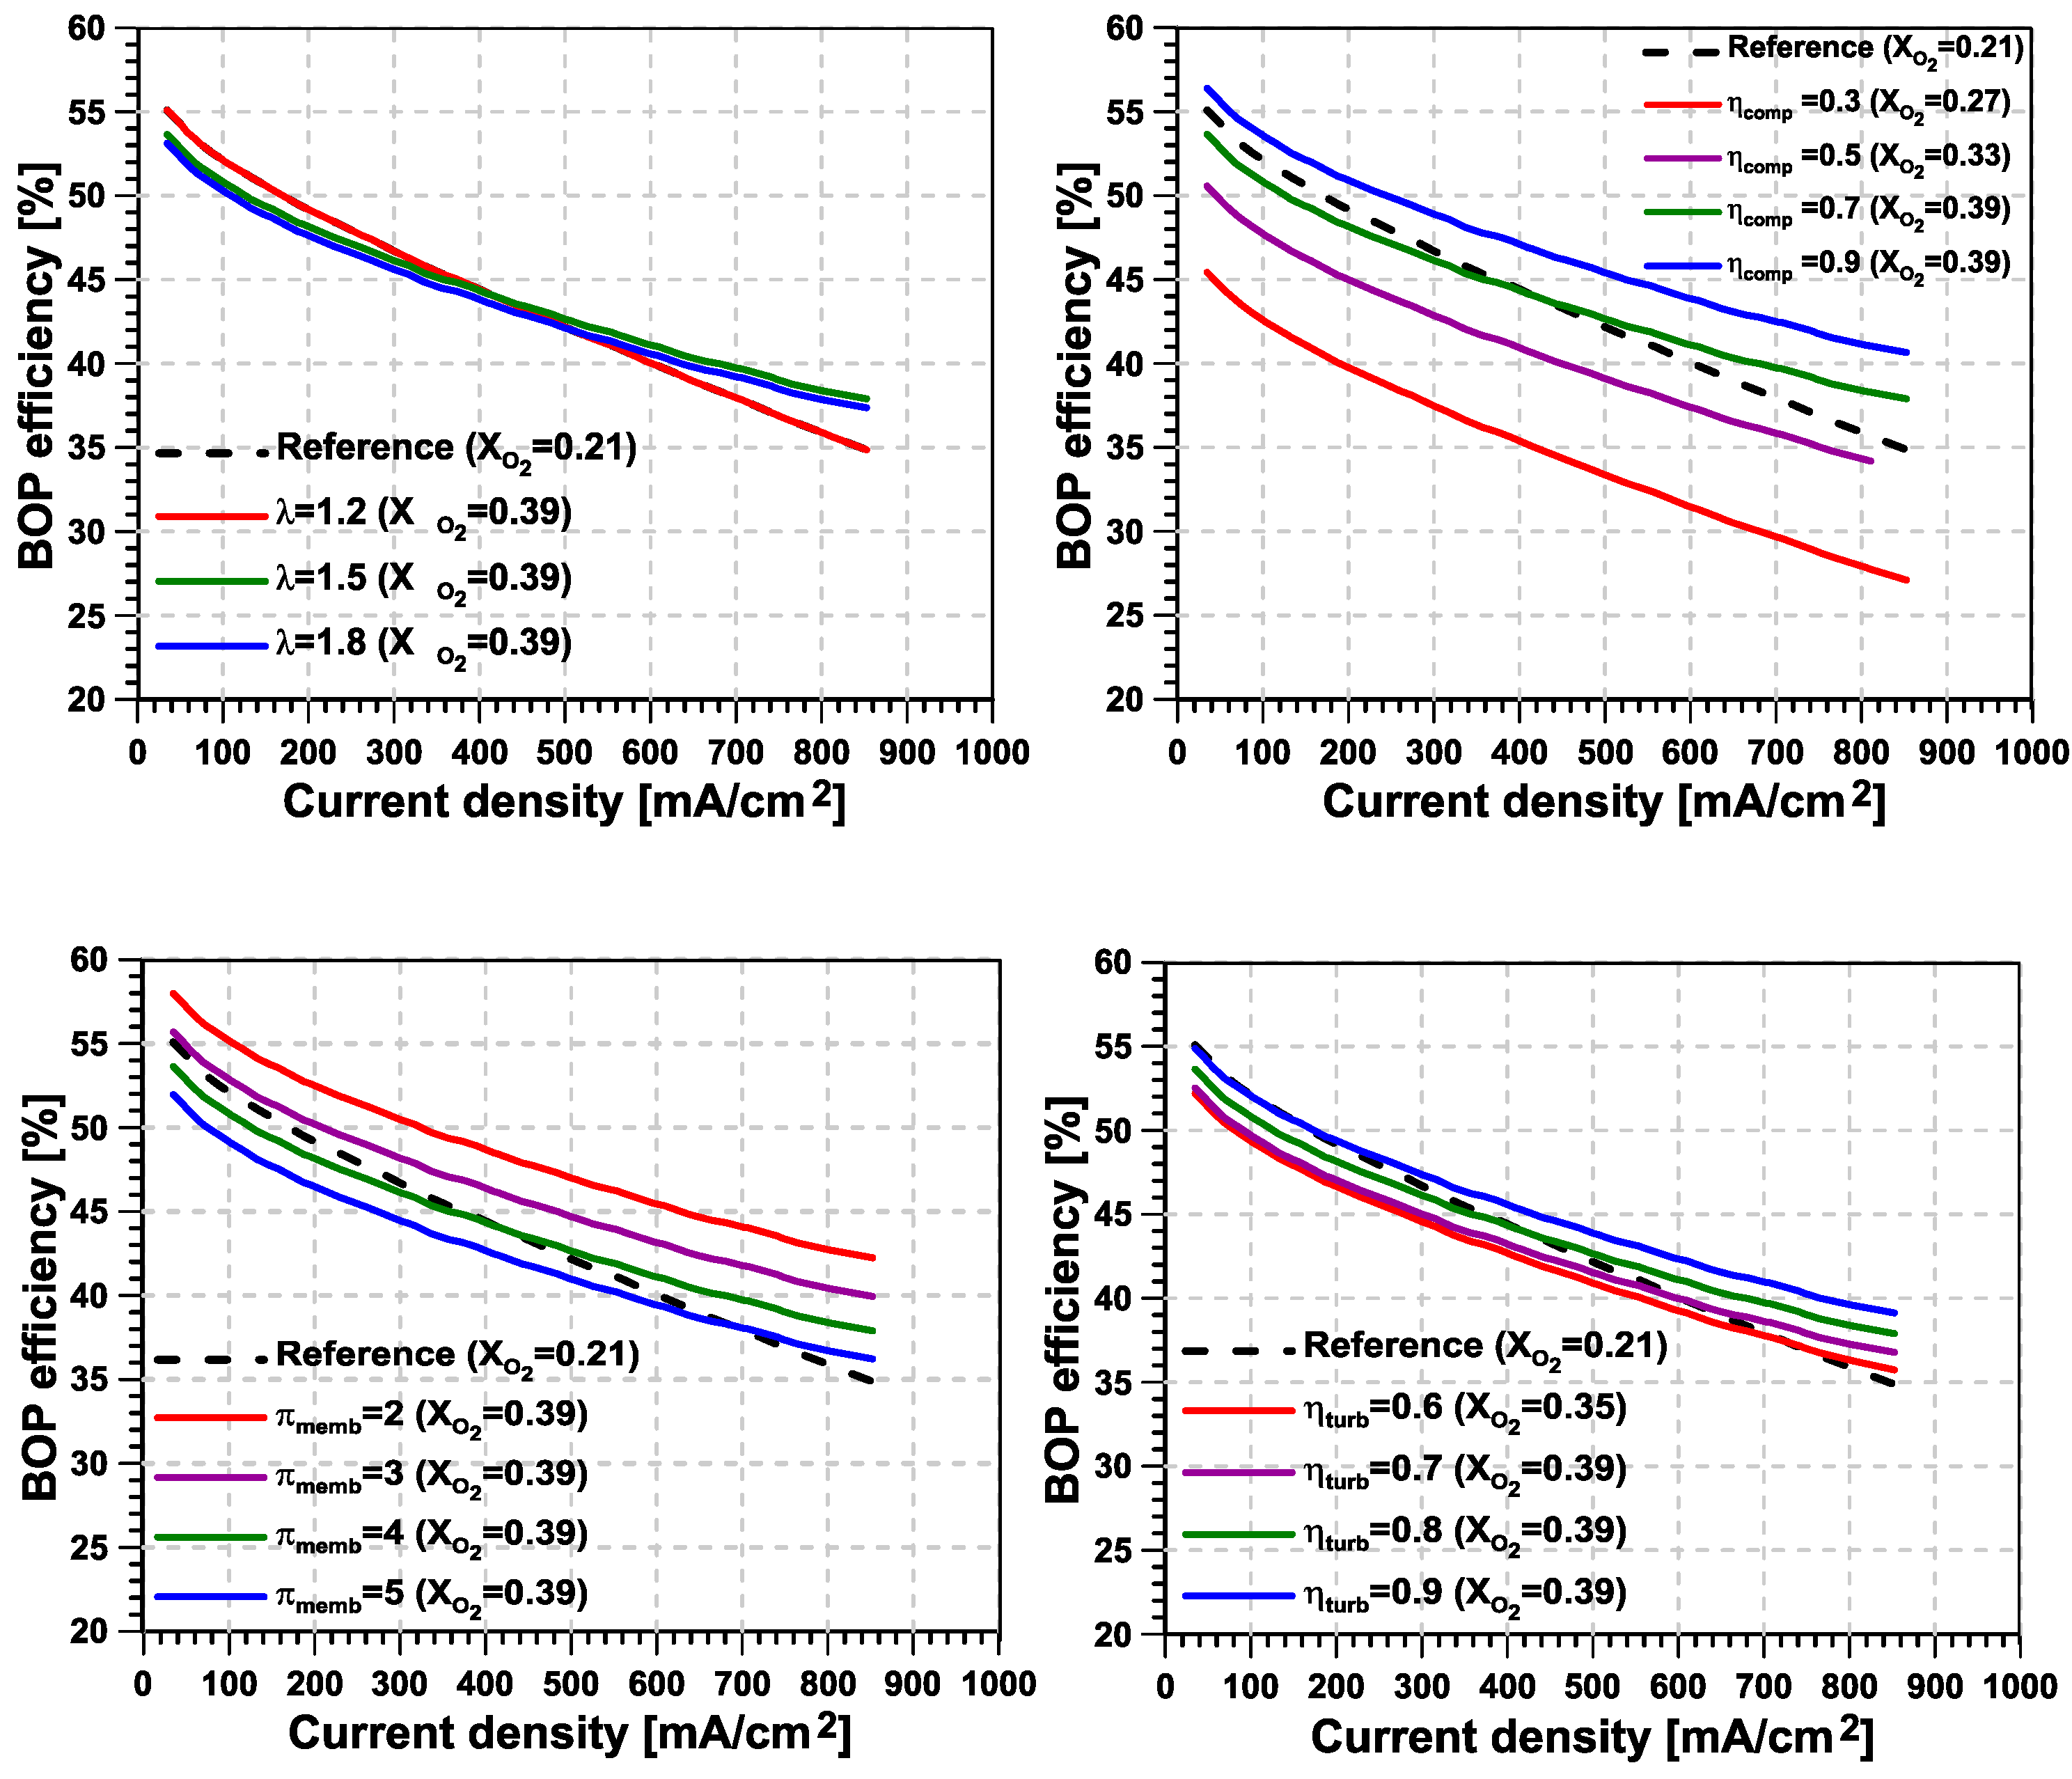
  • From the sensitivity analyses performed, it was concluded that the factors that affect the most the system level efficiency are, in this order, the pressure ratio in the membrane and the compressor efficiency. Both are related to the compression work, highlighting the fact that the proposed system’s potential increases as more efficient O 2 –N 2 separation membrane technologies are developed.
  • Regarding the cathode’s excess O 2 ratio, a higher O 2 partial pressure inside the fuel cell reduces λ O 2 below the value of 1.5 used in the base case. Instead, the penalty induced when working with higher excess O 2 ratio is limited owing to the energy recovery.
  • In general, relatively high levels of enrichment are preferable for the technology, despite the increase in compressor power consumption, as long as it can be guaranteed that at least one-third of this consumption can be recovered from the system.
Based on the results of this study, the following research areas are proposed for further investigation:
  • Conduct an experimental analysis to investigate the effects of the O 2 molar fraction (21–40%) and excess O 2 ratio (1–2) in the cathode stream to ascertain the advantages of O 2 enrichment on cell performance at increased current densities and assess the feasibility of reducing the cathode’s excess O 2 ratio. This research will also aid in developing a 1D fuel cell model with the ability to analyze reactive species depletion, thereby enhancing system efficiency.
  • Evaluate other O 2 enrichment separation membrane technologies with higher selectivity and analyze the potential to reduce the membrane working pressure and/or the ratio of inlet to permeate mass flows.
  • Integrate the fuel cell and the membrane in a one-dimensional model of the complete balance of plant to study the sizing of the compressor and turbine elements, including preliminary maps of these components to better assess their efficiency as a function of the operating conditions.
These research initiatives are directed toward advancing knowledge and development in O 2 -enriched PEM fuel cell technologies, with the goal of developing more efficient, sustainable, and cost-effective systems.

Author Contributions

Conceptualization, P.P. and J.d.l.M.; methodology, J.d.l.M.; software, E.J.S.; validation, P.P., J.d.l.M. and E.J.S.; formal analysis, J.A.L.; investigation, J.d.l.M.; resources, P.P.; data curation, E.J.S.; writing—original draft preparation, J.A.L.; writing—review and editing, J.d.l.M. and E.J.S.; visualization, J.A.L.; supervision, E.J.S.; project administration, J.d.l.M.; funding acquisition, P.P. All authors have read and agreed to the published version of the manuscript.

Funding

This research was partially funded by MCIN/AEI/10.13039/501100011033 and the European Union “NextGenerationEU”/PRTR as part of the project TED2021-131463B-I00. In addition, José A. Lalangui acknowledges Ph.D. funding from the Universitat Politècnica de València through grant FPI-2022-S2-60162.

Data Availability Statement

The data presented in this study are available on request from the corresponding author. The data are not publicly available due to due to data on some devices being the subject to proprietary restrictions.

Conflicts of Interest

The authors declare no conflict of interest.

Nomenclature

Acronyms
BOPbalance of plant
PEMFCproton-exchange membrane fuel cell
R 2 coefficient of determination
Latin Letters
FFaraday constant
H H V H 2 higher heat value
icurrent density
Npower
M W c a t h . average molecular weight of cathode
M W H 2 molecular weight of H 2
X O 2 O 2 molar fraction
Greek Letters
n ˙ H 2 , e s t H 2 molar flow rate consumption
n ˙ c molar flow reaching the cathode
η efficiency
λ m e m ratio between both mass flow rates
λ O 2 O 2 excess ratio
π 1 pressure ratio of operation from compressor 1
π H 2 expansion ratio in turbine corresponding to H2-fired generator set
π m e m level of compression necessary to operate polymeric separation membrane
Subscripts
c o m p compressor
n e t net
s t a c k stack
t u r b turbine

References

  1. Crowley-Vigneau, A.; Kalyuzhnova, Y.; Ketenci, N. What motivates the ‘green’ transition: Russian and European perspectives. Resour. Policy 2023, 81, 103128. [Google Scholar] [CrossRef]
  2. Tan, K.M.; Babu, T.S.; Ramachandaramurthy, V.K.; Kasinathan, P.; Solanki, S.G.; Raveendran, S.K. Empowering smart grid: A comprehensive review of energy storage technology and application with renewable energy integration. J. Energy Storage 2021, 39, 102591. [Google Scholar] [CrossRef]
  3. Carmo, M.; Stolten, D. Energy storage using hydrogen produced from excess renewable electricity: Power to hydrogen. In Science and Engineering of Hydrogen-Based Energy Technologies; Academic Press: Cambridge, MA, USA, 2019; pp. 165–199. [Google Scholar]
  4. Ogungbemi, E.; Wilberforce, T.; Ijaodola, O.; Thompson, J.; Olabi, A. Selection of proton exchange membrane fuel cell for transportation. Int. J. Hydrogen Energy 2021, 46, 30625–30640. [Google Scholar] [CrossRef]
  5. Rosli, R.; Sulong, A.; Daud, W.; Zulkifley, M.; Husaini, T.; Rosli, M.; Majlan, E.; Haque, M. A review of high-temperature proton exchange membrane fuel cell (HT-PEMFC) system. Int. J. Hydrogen Energy 2017, 42, 9293–9314. [Google Scholar] [CrossRef]
  6. Fathabadi, H. Combining a proton exchange membrane fuel cell (PEMFC) stack with a Li-ion battery to supply the power needs of a hybrid electric vehicle. Renew. Energy 2019, 130, 714–724. [Google Scholar] [CrossRef]
  7. Alaswad, A.; Baroutaji, A.; Achour, H.; Carton, J.; Al Makky, A.; Olabi, A.G. Developments in fuel cell technologies in the transport sector. Int. J. Hydrogen Energy 2016, 41, 16499–16508. [Google Scholar] [CrossRef]
  8. O’hayre, R.; Cha, S.W.; Colella, W.; Prinz, F.B. Fuel Cell Fundamentals; John Wiley & Sons: Hoboken, NJ, USA, 2016. [Google Scholar]
  9. Cano, Z.P.; Banham, D.; Ye, S.; Hintennach, A.; Lu, J.; Fowler, M.; Chen, Z. Batteries and fuel cells for emerging electric vehicle markets. Nat. Energy 2018, 3, 279–289. [Google Scholar] [CrossRef]
  10. Jian, Q.; Zhao, J. Experimental study on spatiotemporal distribution and variation characteristics of temperature in an open cathode proton exchange membrane fuel cell stack. Int. J. Hydrogen Energy 2019, 44, 27079–27093. [Google Scholar] [CrossRef]
  11. Hao, D.; Shen, J.; Hou, Y.; Zhou, Y.; Wang, H. An improved empirical fuel cell polarization curve model based on review analysis. Int. J. Chem. Eng. 2016, 2016, 4109204. [Google Scholar] [CrossRef]
  12. Wang, Y.; Northwood, D.O. Effects of O2 and H2 on the corrosion of SS316L metallic bipolar plate materials in simulated anode and cathode environments of PEM fuel cells. Electrochim. Acta 2007, 52, 6793–6798. [Google Scholar] [CrossRef]
  13. Kannan, V.; Xue, H.; Raman, K.A.; Chen, J.; Fisher, A.; Birgersson, E. Quantifying operating uncertainties of a PEMFC–Monte Carlo-machine learning based approach. Renew. Energy 2020, 158, 343–359. [Google Scholar] [CrossRef]
  14. Bianchi, F.R.; Bosio, B.; Baldinelli, A.; Barelli, L. Optimization of a reference kinetic model for solid oxide fuel cells. Catalysts 2020, 10, 104. [Google Scholar] [CrossRef]
  15. Atyabi, S.A.; Afshari, E.; Wongwises, S.; Yan, W.M.; Hadjadj, A.; Shadloo, M.S. Effects of assembly pressure on PEM fuel cell performance by taking into accounts electrical and thermal contact resistances. Energy 2019, 179, 490–501. [Google Scholar] [CrossRef]
  16. Rahman, M.A.; Mojica, F.; Sarker, M.; Chuang, P.Y.A. Development of 1-D multiphysics PEMFC model with dry limiting current experimental validation. Electrochim. Acta 2019, 320, 134601. [Google Scholar] [CrossRef]
  17. Sohn, Y.J.; Yim, S.D.; Park, G.G.; Kim, M.; Cha, S.W.; Kim, K. PEMFC modeling based on characterization of effective diffusivity in simulated cathode catalyst layer. Int. J. Hydrogen Energy 2017, 42, 13226–13233. [Google Scholar] [CrossRef]
  18. Dickinson, E.J.; Hinds, G. The Butler-Volmer equation for polymer electrolyte membrane fuel cell (PEMFC) electrode kinetics: A critical discussion. J. Electrochem. Soc. 2019, 166, F221–F231. [Google Scholar] [CrossRef]
  19. Ghanbarian, A.; Kermani, M.J. Enhancement of PEM fuel cell performance by flow channel indentation. Energy Convers. Manag. 2016, 110, 356–366. [Google Scholar] [CrossRef]
  20. Askaripour, H. Effect of operating conditions on the performance of a PEM fuel cell. Int. J. Heat Mass Transf. 2019, 144, 118705. [Google Scholar] [CrossRef]
  21. Tohidi, M.; Mansouri, S.; Amiri, H. Effect of primary parameters on the performance of PEM fuel cell. Int. J. Hydrogen Energy 2010, 35, 9338–9348. [Google Scholar] [CrossRef]
  22. He, L.; Han, Z.; Liu, Y.; Niu, Z.; Liu, Z. Effects of gas starvation on performance of a single PEMFC. In Proceedings of the 2017 IEEE Transportation Electrification Conference and Expo, Asia-Pacific (ITEC Asia-Pacific), Harbin, China, 7–10 August 2017; pp. 1–5. [Google Scholar]
  23. Lee, J.C.; Shay, T. Analysis of fuel cell applied for submarine air independent propulsion (AIP) system. J. Mar. Sci. Technol. 2018, 26, 657–666. [Google Scholar]
  24. Atlam, O.; Kolhe, M. Performance analysis of PEM fuel cell with varying oxidant supply rates. J. Energy Eng. 2013, 139, 60–63. [Google Scholar] [CrossRef]
  25. Popat, S.C.; Ki, D.; Young, M.N.; Rittmann, B.E.; Torres, C.I. Buffer pKa and transport govern the concentration overpotential in electrochemical oxygen reduction at neutral pH. ChemElectroChem 2014, 1, 1909–1915. [Google Scholar] [CrossRef]
  26. Fournier, M.; Hamelin, J.; Agbossou, K.; Bose, T. Fuel cell operation with oxygen enrichment. Fuel Cells 2002, 2, 117–122. [Google Scholar] [CrossRef]
  27. Kumar, R.; Subramanian, K. Enhancement of efficiency and power output of hydrogen fuelled proton exchange membrane (PEM) fuel cell using oxygen enriched air. Int. J. Hydrogen Energy 2023, 48, 6067–6075. [Google Scholar] [CrossRef]
  28. Kakizawa, Y.; Schreiber, C.L.; Takamuku, S.; Uchida, M.; Iiyama, A.; Inukai, J. Visualization of the oxygen partial pressure in a proton exchange membrane fuel cell during cell operation with low oxygen concentrations. J. Power Sources 2021, 483, 229193. [Google Scholar] [CrossRef]
  29. Pukrushpan, J.T.; Stefanopoulou, A.G.; Peng, H. Control of Fuel Cell Power Systems: Principles, Modeling, Analysis and Feedback Design; Springer: Berlin/Heidelberg, Germany, 2004. [Google Scholar]
  30. Ren, P.; Pei, P.; Li, Y.; Wu, Z.; Chen, D.; Huang, S. Degradation mechanisms of proton exchange membrane fuel cell under typical automotive operating conditions. Prog. Energy Combust. Sci. 2020, 80, 100859. [Google Scholar] [CrossRef]
  31. Meyers, J.P.; Darling, R.M. Model of carbon corrosion in PEM fuel cells. J. Electrochem. Soc. 2006, 153, A1432–A1442. [Google Scholar] [CrossRef]
  32. Boyer, C.; Gamburzev, S.; Appleby, A. Evaluation of methods to increase the oxygen partial pressure in PEM fuel cells. J. Appl. Electrochem. 1999, 29, 1095–1102. [Google Scholar] [CrossRef]
  33. Smith, A.; Klosek, J. A review of air separation technologies and their integration with energy conversion processes. Fuel Process. Technol. 2001, 70, 115–134. [Google Scholar] [CrossRef]
  34. Yan, Q.; Toghiani, H.; Lee, Y.W.; Liang, K.; Causey, H. Effect of sub-freezing temperatures on a PEM fuel cell performance, startup and fuel cell components. J. Power Sources 2006, 160, 1242–1250. [Google Scholar] [CrossRef]
  35. Kianfar, E.; Cao, V. Polymeric membranes on base of PolyMethyl methacrylate for air separation: A review. J. Mater. Res. Technol. 2021, 10, 1437–1461. [Google Scholar] [CrossRef]
  36. Belaissaoui, B.; Le Moullec, Y.; Hagi, H.; Favre, E. Energy efficiency of oxygen enriched air production technologies: Cryogeny vs. membranes. Sep. Purif. Technol. 2014, 125, 142–150. [Google Scholar] [CrossRef]
  37. Meriläinen, A.; Seppälä, A.; Kauranen, P. Minimizing specific energy consumption of oxygen enrichment in polymeric hollow fiber membrane modules. Appl. Energy 2012, 94, 285–294. [Google Scholar] [CrossRef]
  38. Hoeflinger, J.; Hofmann, P. Air mass flow and pressure optimisation of a PEM fuel cell range extender system. Int. J. Hydrogen Energy 2020, 45, 29246–29258. [Google Scholar] [CrossRef]
  39. Santarelli, M.; Torchio, M.F.; Calı, M.; Giaretto, V. Experimental analysis of cathode flow stoichiometry on the electrical performance of a PEMFC stack. Int. J. Hydrogen Energy 2007, 32, 710–716. [Google Scholar] [CrossRef]
  40. Shah, S.; Shaikh, H.; Hafeez, S.; Malik, M.I. Synthesis of 3-(Trimethoxysilyl) Propyl Methacrylate Functionalized Graphene Oxide Based Mixed Matrix Membrane and Its Application for O2/N2 Separation. Pak. J. Anal. Environ. Chem. 2020, 21, 44–53. [Google Scholar] [CrossRef]
  41. Serrano, J.R.; García-Cuevas, L.M.; Samala, V.; López-Carrillo, J.A.; Mai, H. Boosting the capabilities of gas stand data acquisition and control systems by using a digital twin based on a holistic turbocharger model. In Proceedings of the Internal Combustion Engine Division Fall Technical Conference. American Society of Mechanical Engineers, Online, 13–15 October 2021; Volume 85512, p. V001T07A002. [Google Scholar]
  42. Wang, J.; Shi, Z.; Zang, Y.; Jia, H.; Teraguchi, M.; Kaneko, T.; Aoki, T. Macromolecular Design for Oxygen/Nitrogen Permselective Membranes—Top-Performing Polymers in 2020—. Polymers 2021, 13, 3012. [Google Scholar] [CrossRef]
Figure 1. PEMFC output voltage per cell and stack efficiency a function of current density and O 2 molar fraction.
Applsci 14 00836 g001
Figure 2. Cathode mass flow and total inlet air mass flow per unit of active PEMFC area as a function of current density and O 2 molar fraction.
Applsci 14 00836 g002
Figure 3. Typical balance of plant layouts for atmospheric and supercharged fuel cells.
Applsci 14 00836 g003
Figure 4. Proposed layout for an O 2 -enriched fuel cell system.
Applsci 14 00836 g004
Figure 5. Compressor power consumption and recovered power per unit of active area of the stack as a function of current density and O 2 molar fraction.
Applsci 14 00836 g005
Figure 6. Balance of plant (BOP) efficiency as a function of current density and O 2 molar fraction.
Applsci 14 00836 g006
Figure 7. Analysis of the effect of the cathode’s excess O 2 ratio, compressor efficiency, turbine efficiency, and membrane pressure ratio on system efficiency.
Applsci 14 00836 g007
Table 1. Design parameters and operative conditions of fuel cell with O 2 -enriched air.
ParameterBase ValueRange
λ O 2 1.5[1.2–2.1] [39]
π m e m 4[2–5] [40]
η c o m p 0.65[0.3–0.9] [41]
η t u r b 0.75[0.6–0.9] [41]
π H 2 5[3–9]
Disclaimer/Publisher’s Note: The statements, opinions and data contained in all publications are solely those of the individual author(s) and contributor(s) and not of MDPI and/or the editor(s). MDPI and/or the editor(s) disclaim responsibility for any injury to people or property resulting from any ideas, methods, instructions or products referred to in the content.

