Abstract
Telemedicine has emerged as a vital component of contemporary healthcare, revolutionizing the way medical services are delivered and accessed (e.g., it enables patients living in underserved or rural areas to receive medical consultation and treatment remotely). Moreover, telemedicine plays a pivotal role in improving healthcare efficiency by reducing wait times, minimizing unnecessary hospital visits, and optimizing resource allocation. In this paper, we present HealthTracker, a monitoring infrastructure for patients comprising two Internet of Things (IoT) devices (one of which was designed and created by us) and a mobile app that sends data collected by the IoT devices to a cloud service. All these components work together to provide an innovative system able to monitor patient health condition, provide alerts in emergency cases, and elaborate upon data to improve the quality of medical care. Preliminary tests show that the system works well, and real experimentation will start soon in collaboration with the local health authority.
1. Introduction
The COVID-19 pandemic, which swept across the globe in 2019 and 2020, disrupted nearly every aspect of human life. As healthcare systems struggled to manage the influx of patients and minimize the spread of the virus, telemedicine emerged as a critical tool to ensure the continued provision of medical care while maintaining social distancing measures [1]. The pandemic served as a catalyst, hastening the widespread adoption of telemedicine to an unprecedented extent [2]. Consequently, the importance of telemedicine in contemporary healthcare has been amplified, permanently reshaping the terrain of medical practice [3].
Telemedicine, defined as the use of electronic communication and information technologies to provide remote healthcare services, has been in existence for several decades [4]. The ability to connect patients and healthcare providers virtually not only ensured the continuity of care during lockdowns but also offered a means to reach underserved populations and alleviate healthcare disparities [5]. To effectively advance and integrate this technological framework, facilitating prevention, treatment, and decision-making while also enabling a more profound understanding of the disease, it is imperative to engage professionals across diverse medical, IT, and engineering disciplines [6]. These experts should possess a range of skills in their respective fields, enabling them to design, produce, and optimize technologically advanced tools for the collection, assessment, and analysis of data.
In this scenario, we propose a system named HealthTracker: a monitoring infrastructure for patients to store and analyze data provided by devices and store them as time series. The monitoring infrastructure consists of (a) an app, running on a smartphone, which can interface with wearable devices to collect the data generated by the corresponding sensors, and (b) a cloud storage system, where these data are stored for remote access and offline analysis. At the time of writing, HealthTracker can interface with the following two wearable devices: (i) a chest-placed wearable device, named Health Data Collection (HDC) device, and (ii) a wrist oximeter named Viatom Checkme O2 both intended to monitor the patient’s vital signs. Although the latter device is a commercially available product (described in detail in Section 5.2) it is worth highlighting that the former one (the HDC device) has been developed specifically for the HealthTracker system and includes groundbreaking innovations with respect to state-of-the-art wearable devices. More specifically, it is worn in contact with the skin (basically on the chest) and, aside from data reliability and ease of use, performs all-round monitoring of health parameters by two sensors never applied in a single health-monitoring device, namely:
- an accelerometric and acoustic sensor capable of recording (a) the frequency and intensity of the cough, (b) the respiratory rate and depth, (c) the nighttime breathing including apnea and snoring, and (d) tremors and hyperkinesia;
- a hygrometric sensor capable of measuring sweating to determine states of acute fatigue and lipothymia; this sensor has also never been used in devices currently on the market.
To the best of our knowledge, our device is currently the only health-monitoring wearable device that integrates all the sensors described in this paper. For this reason, in the experimental comparison we will perform in future work, we will consider similar devices that integrate only a subset of the sensors available in our device.
In the rest of the paper, we present the motivations behind our work in Section 2, while related work is presented in Section 3. In Section 4, we explain the architecture of our system, and then in Section 5, we describe in detail the hardware and software characteristics of the IoT devices included in the system. In Section 6, we discuss the implementation of our system, and, finally, Section 7 concludes the paper and highlights the future works.
2. Motivations
As mentioned before, in the coming years, it will be necessary to eliminate the barriers of geography, making healthcare accessible to individuals in rural or underserved areas. For this purpose, telemedicine allows patients to connect with healthcare providers remotely, receive a diagnosis and treatment, and access specialist care without the need to travel long distances.
The HealthTracker system can significantly improve the usage of telemedicine in the everyday life of both patients and clinicians to improve people’s health for better health treatments. For example, the patient’s health data can be automatically collected through the patient’s smartphone using the HealthTracker app, saved on its cloud storage system, and subsequently processed to implement the following functionalities:
- provide the medical team with an aggregate view (consisting of graphs and tables) for a better and immediate consultation;
- allow the medical team to customize monitored data according to patients’ specific medical conditions. For instance, physicians can selectively focus on tracking the movement patterns of a patient facing challenges in walking or exclusively monitor the heartbeat rate of an individual with heart-related issues. This functionality is provided by HealthTracker’s app, which enables physicians to select only those data that require monitoring;
- process these data with machine-learning algorithms (already available in HealthTracker) to perform statistical analysis, both to provide information on the current situation and to predict the trend of health parameters in the short term;
- capture real-time biomedical parameters to identify abnormal signs, such as elevated body temperature and inadequate oxygenation, to preemptively alert the user and mitigate the risk of developing certain conditions by advising the patient to sit or lie down or relocate to a cooler environment. Furthermore, a notification system to alert family members and selected medical personnel could be implemented, ensuring swift responses and personalized care in critical situations;
- establish and sustain the foundational core of a knowledge base, with the potential for expansion to incorporate additional parameters characterizing the patient, such as the presence and severity of predisposing or aggravating conditions. This serves as the backbone for conducting statistical analyses leveraging advanced machine-learning techniques.
3. Related Work
The integration of IoT devices in the field of telemedicine has garnered significant attention in recent years. This section provides an overview of key research and development in this domain.
One of the fundamental applications of IoT in telemedicine is remote patient monitoring. In [7], IoT devices such as wearable sensors and continuous glucose monitors have enabled real-time data collection and transmission, allowing healthcare providers to monitor patients’ vital signs and chronic conditions remotely. In particular, IoT-generated data in telemedicine is voluminous, and machine-learning techniques have been employed to extract valuable insights. In [8], machine-learning models have been used for early disease detection, treatment optimization, and predicting patient outcomes. In [9], the authors proposed a remote healthcare system enabling multiple medical sensors to connect to a server using multiple communication technologies such as Wi-Fi, Bluetooth, or GSM technologies.
Concerning telemedicine platforms and ecosystems, refs. [10,11] describe various telemedicine platforms and ecosystems that have been developed to facilitate the seamless integration of IoT devices. These platforms enable secure data transmission, video consultations, and remote diagnostics. Notable examples include the use of Microsoft Azure IoT for healthcare applications. In [12], the authors proposed WhatsApp (the famous mobile messaging application) as a telemedicine platform, but it is used only to share photos and lesion recordings to submit questionnaires to patients to monitor their health. Finally, researchers at the University of Basel (Switzerland) developed an Internet-based platform for telemedicine in 2001 named the Internet Pathology Suite (iPath) [13]. This platform has been implemented to allow the presentation and discussion of images provided by remote electron microscopes; no other device can be used on this platform. Finally, in [14], authors develop a prototype able to provide features for telemedicine like live video streaming, chat boxes, automatic prescription generation, and push notifications. The prototype is used for trial under the supervision of medical experts, and the data are compared with standard tests done in a pathological laboratory.
Conversely to the above approaches, our system adopts a more open framework as it is IoT device agnostic: the modular design of the interacting components allows HealthTracker to be easily extended to include different IoT devices. To prove it, we demonstrate how our system can exploit an innovative device that provides, for the first time, two sensors able to record the frequency and intensity of the cough, the respiratory rate and depth, the nighttime breathing, including apnea and snoring, the acute fatigue, and lipothymia. All these parameters are essential for monitoring a patient’s health condition and for reporting symptoms that must be detected as soon as possible, allowing for prompt action, if necessary, to halt the progression of the disease.
4. Architecture
The HealthTracker system was designed with the objective to develop a monitoring infrastructure for patients to store and analyze data provided by devices and store them as a time series so that it can become a medical support tool helping healthcare personnel to evaluate the health conditions of their patients without the need for a face-to-face visit. In its design, we adhered to the following two key principles:
- ease of use: since elderly people are the main portion of our target user base, it is important that the interaction with the system—especially the recording process—is as simple as possible;
- service-orientation: the use of a microservices architecture, supported by the main cloud technologies, is fundamental to achieve optimal performance while keeping the system running smoothly [15]. Specifically, rather than using the “one-size-fits-all” approach as in a monolithic application architecture, a microservices architecture allows the use of a different technology stack for each microservice independently of the others to achieve the desired performance levels. Also, since microservices are loosely coupled, if one microservice needs to improve its performance, it is possible to replace its technology stack with a better one without affecting the other microservices. Finally, microservices are easier to scale than a monolithic application as it is possible to scale only selected services (i.e., the only ones that actually need to be scaled) rather than the whole “giant” application.
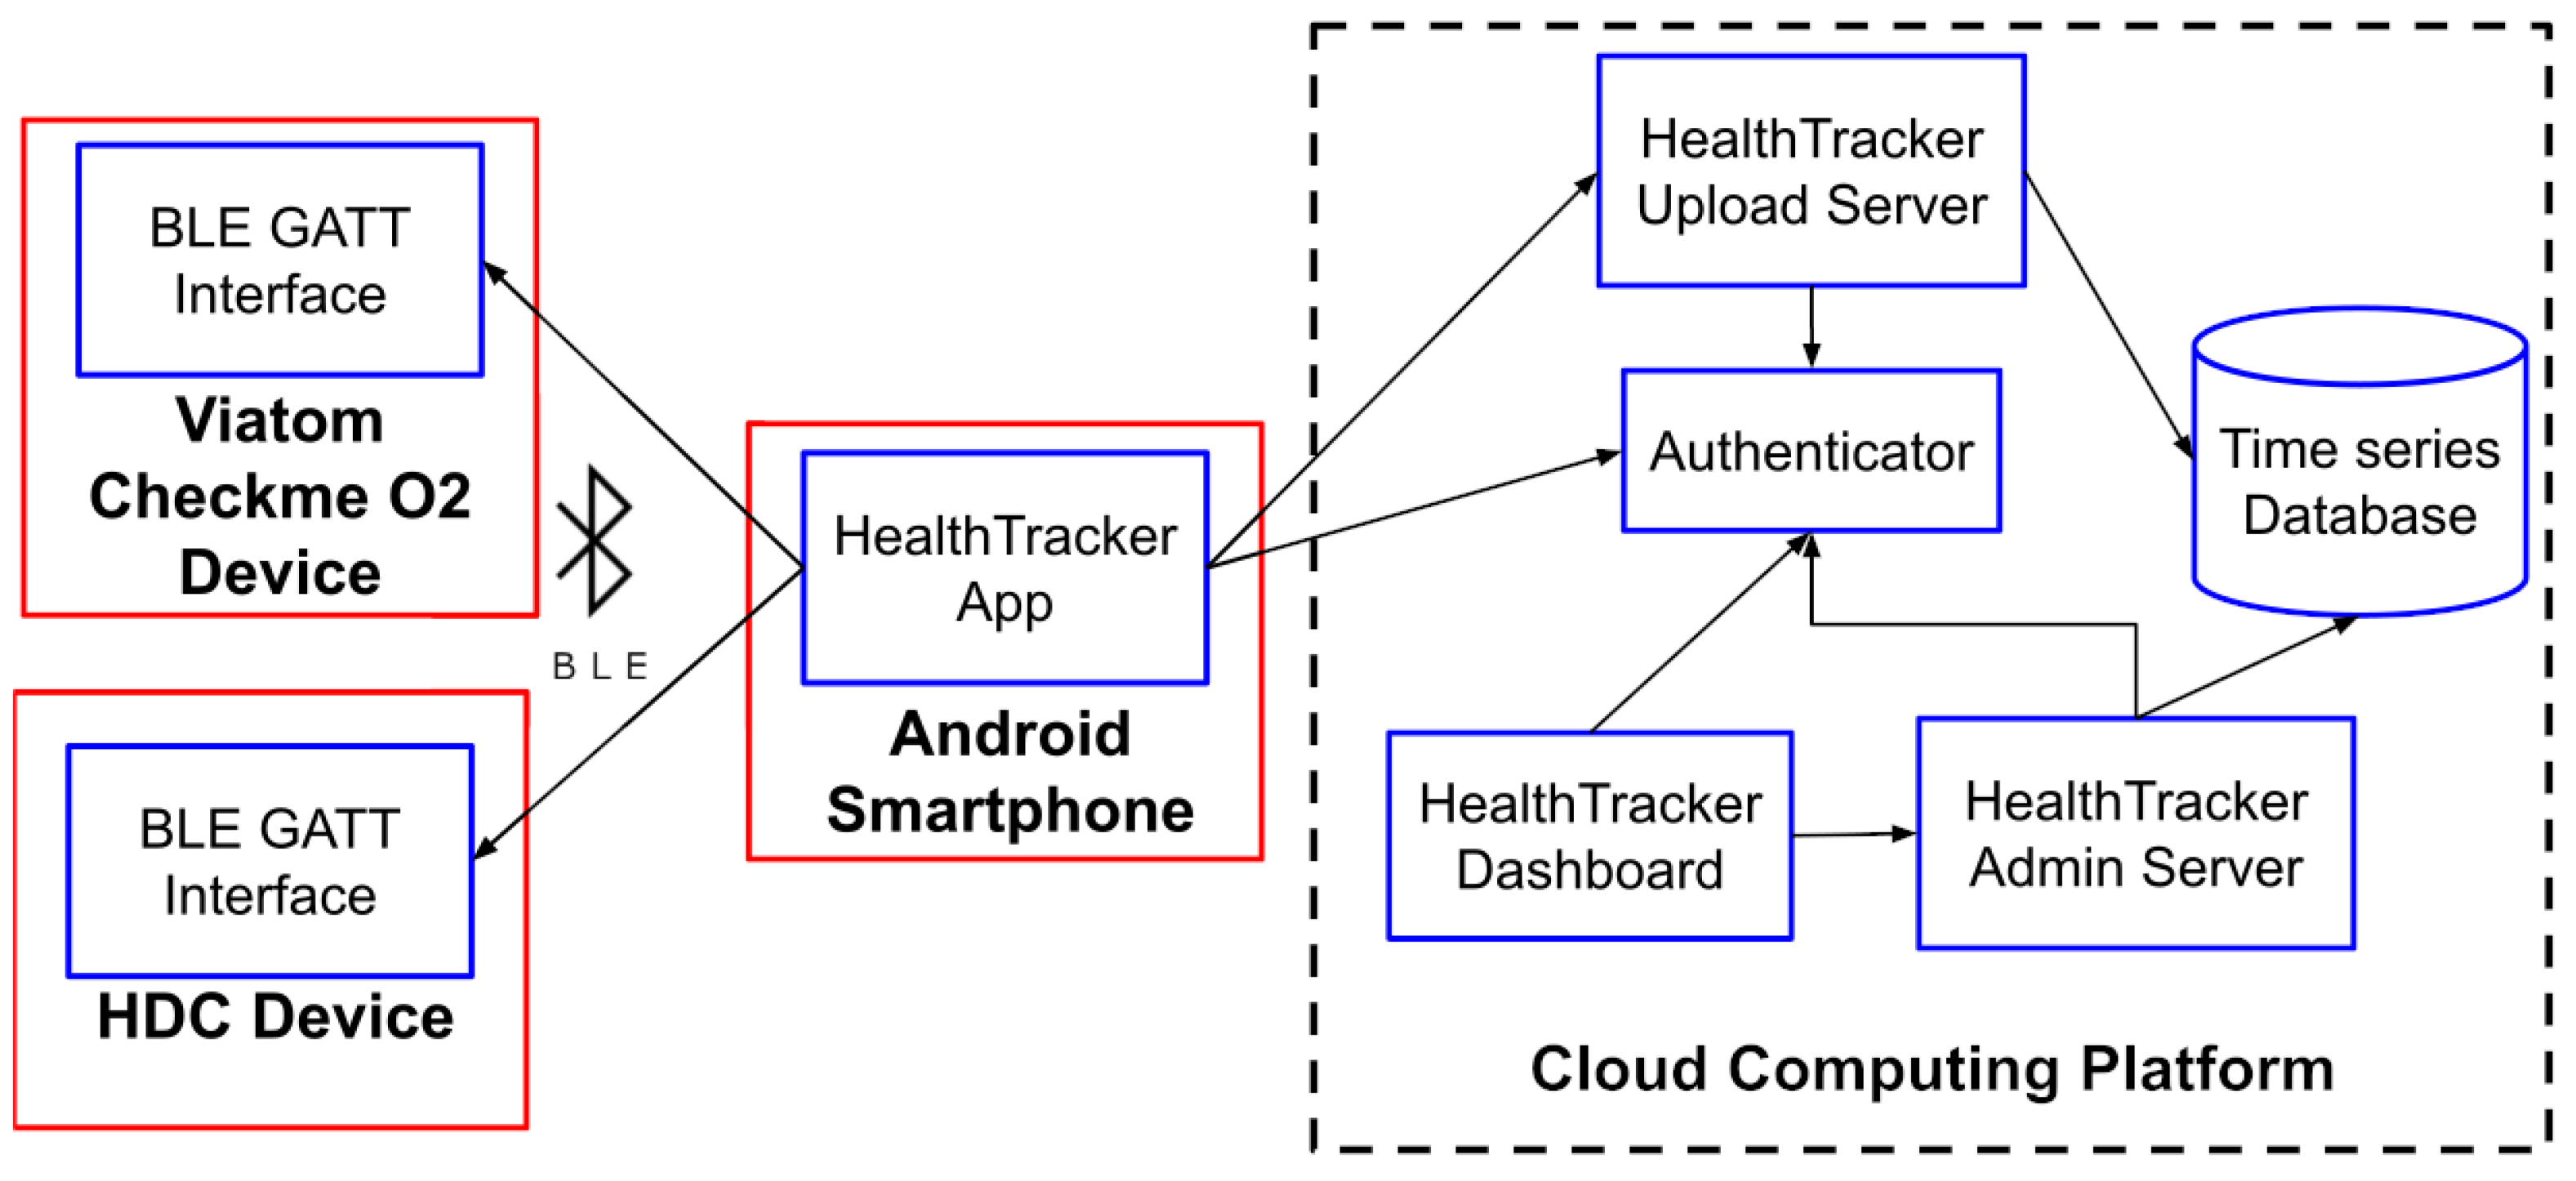
To achieve these goals, we designed and built a software and hardware infrastructure whose architecture is shown in Figure 1, where solid red boxes denote the hardware devices and dashed shapes represent third-party components (e.g., a cloud computing platform) that are used by HealthTracker to run some of its components (e.g., the time-series database). Inside both red boxes and dashed shapes, we indicate with blue boxes the microservice or the communication interface exploited by the hardware component (both explained in detail in Section 6). Finally, arrows denote interactions between components (e.g., an arrow from component to component means that uses the functionality of ).
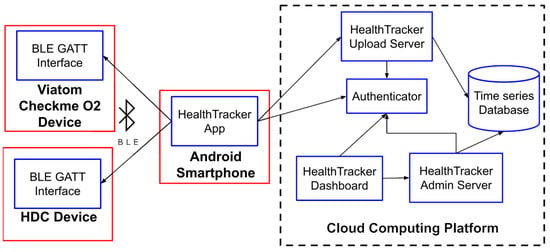
Figure 1.
The architecture of HealthTracker.
As shown in Figure 1, HealthTracker encompasses three distinct subsystems:
- a set of Monitoring Devices, which collect patients’ health data. As discussed later in the paper (Section 5), as part of this work, we designed and built a novel monitoring device (the HDC device), and we developed the code to interface with a commercially available one (the Viatom CheckMe O2 device);
- an Android smartphone, running the HealthTracker app that interfaces with the monitoring devices to both control their behavior and retrieve the health data they collected. This app is responsible for user authentication and communication with the monitoring device, as well as for data collection and storage in the cloud. As discussed later in the paper (Section 6.1), the communication protocol between devices and mobile apps can be customized, so other devices, in addition to the currently supported ones, can be integrated into HealthTracker;
- a Cloud Computing Platform, which provides both secure storage and offline processing for collected health data, and is composed of the following components:
- the HealthTracker Upload Server, whose implementation is discussed in Section 6.2, which exposes an API that allows the Android app to upload the health data collected, which, after validation, are sent to the Time series database;
- the Time-series Database, whose implementation is discussed in Section 6.3, which stores the health data making them easily and efficiently accessible to the rest of the system;
- the HealthTracker Dashboard, whose implementation is discussed in Section 6.5, which is a web application enabling physicians to plot the time series recorded in each time frame;
- the HealthTracker Admin Server, whose implementation is discussed in Section 6.4, which fulfills the task of authorizing users before enabling the Dashboard to retrieve time-series data on their behalf.
- the Authenticator, whose main purpose is to provide a fully functioning authentication and authorization mechanism (based on the OAuth2 standard [16]) with a series of ancillary services useful to speed up the development. Its integration with the other components of the architecture is discussed in Section 6.
An important issue in systems storing and processing health data is protecting the confidentiality of these data. To adequately protect confidentiality, data needs to be protected both while in transit and while at rest.
In HealthTracker, we deal with this issue by incorporating into its design encryption mechanisms both for data transmission and data storage, in the form of encrypted communication protocols between the Android smartphone and the Upload Server, and an encrypted DBMS for the time-series database.
As will be discussed in Section 6, in the current implementation, we have adopted the HTTPS protocol for communication between the Android smartphone and the Upload Server, and the MongoDB DBMS to store time-series data, both of which provide data encryption. Furthermore, HealthTracker requires that all user operations be authenticated before being actually carried out by means of the authentication functionalities provided by the Authenticator, thus providing access to unencrypted data only to legitimate users.
Jointly, encryption and strong user authentication mechanisms provide the necessary level of protection for the health data stored in and processed by HealthTracker.
5. Devices
For the studies that motivated our initial design, devices providing sensors able to monitor ambient temperature and humidity, skin impedance, heartbeat, and blood oxygenation, as well as a microphone, an accelerometer, and a gyroscope, were necessary. Among the various devices available on the market or proposed in the literature (see Section 3), we did not find any of them able to provide all these functionalities. For this reason, we decided to proceed as follows:
- we designed and implemented the HDC device to collect ambient temperature, humidity, and skin impedance, as well as to provide the microphone, the accelerator, and the gyroscope;
- we adapted the Viatom Checkme O2 device, which is commercially available and can collect heart rate and oxygen saturation, to interface it with the Android app.
To enable external connections with them, both devices support the Generic ATTribute (GATT) [17] protocol, which defines the way that two Bluetooth Low Energy (BLE) devices transfer data back and forth using concepts called Services and Characteristics. GATT makes use of a generic data protocol called the Attribute Protocol (ATT), which is used to store services, characteristics, and related data in a simple lookup table using 16-bit IDs for each entry in the table.
In the rest of this section, we will discuss these devices more thoroughly.
5.1. The HDC Device
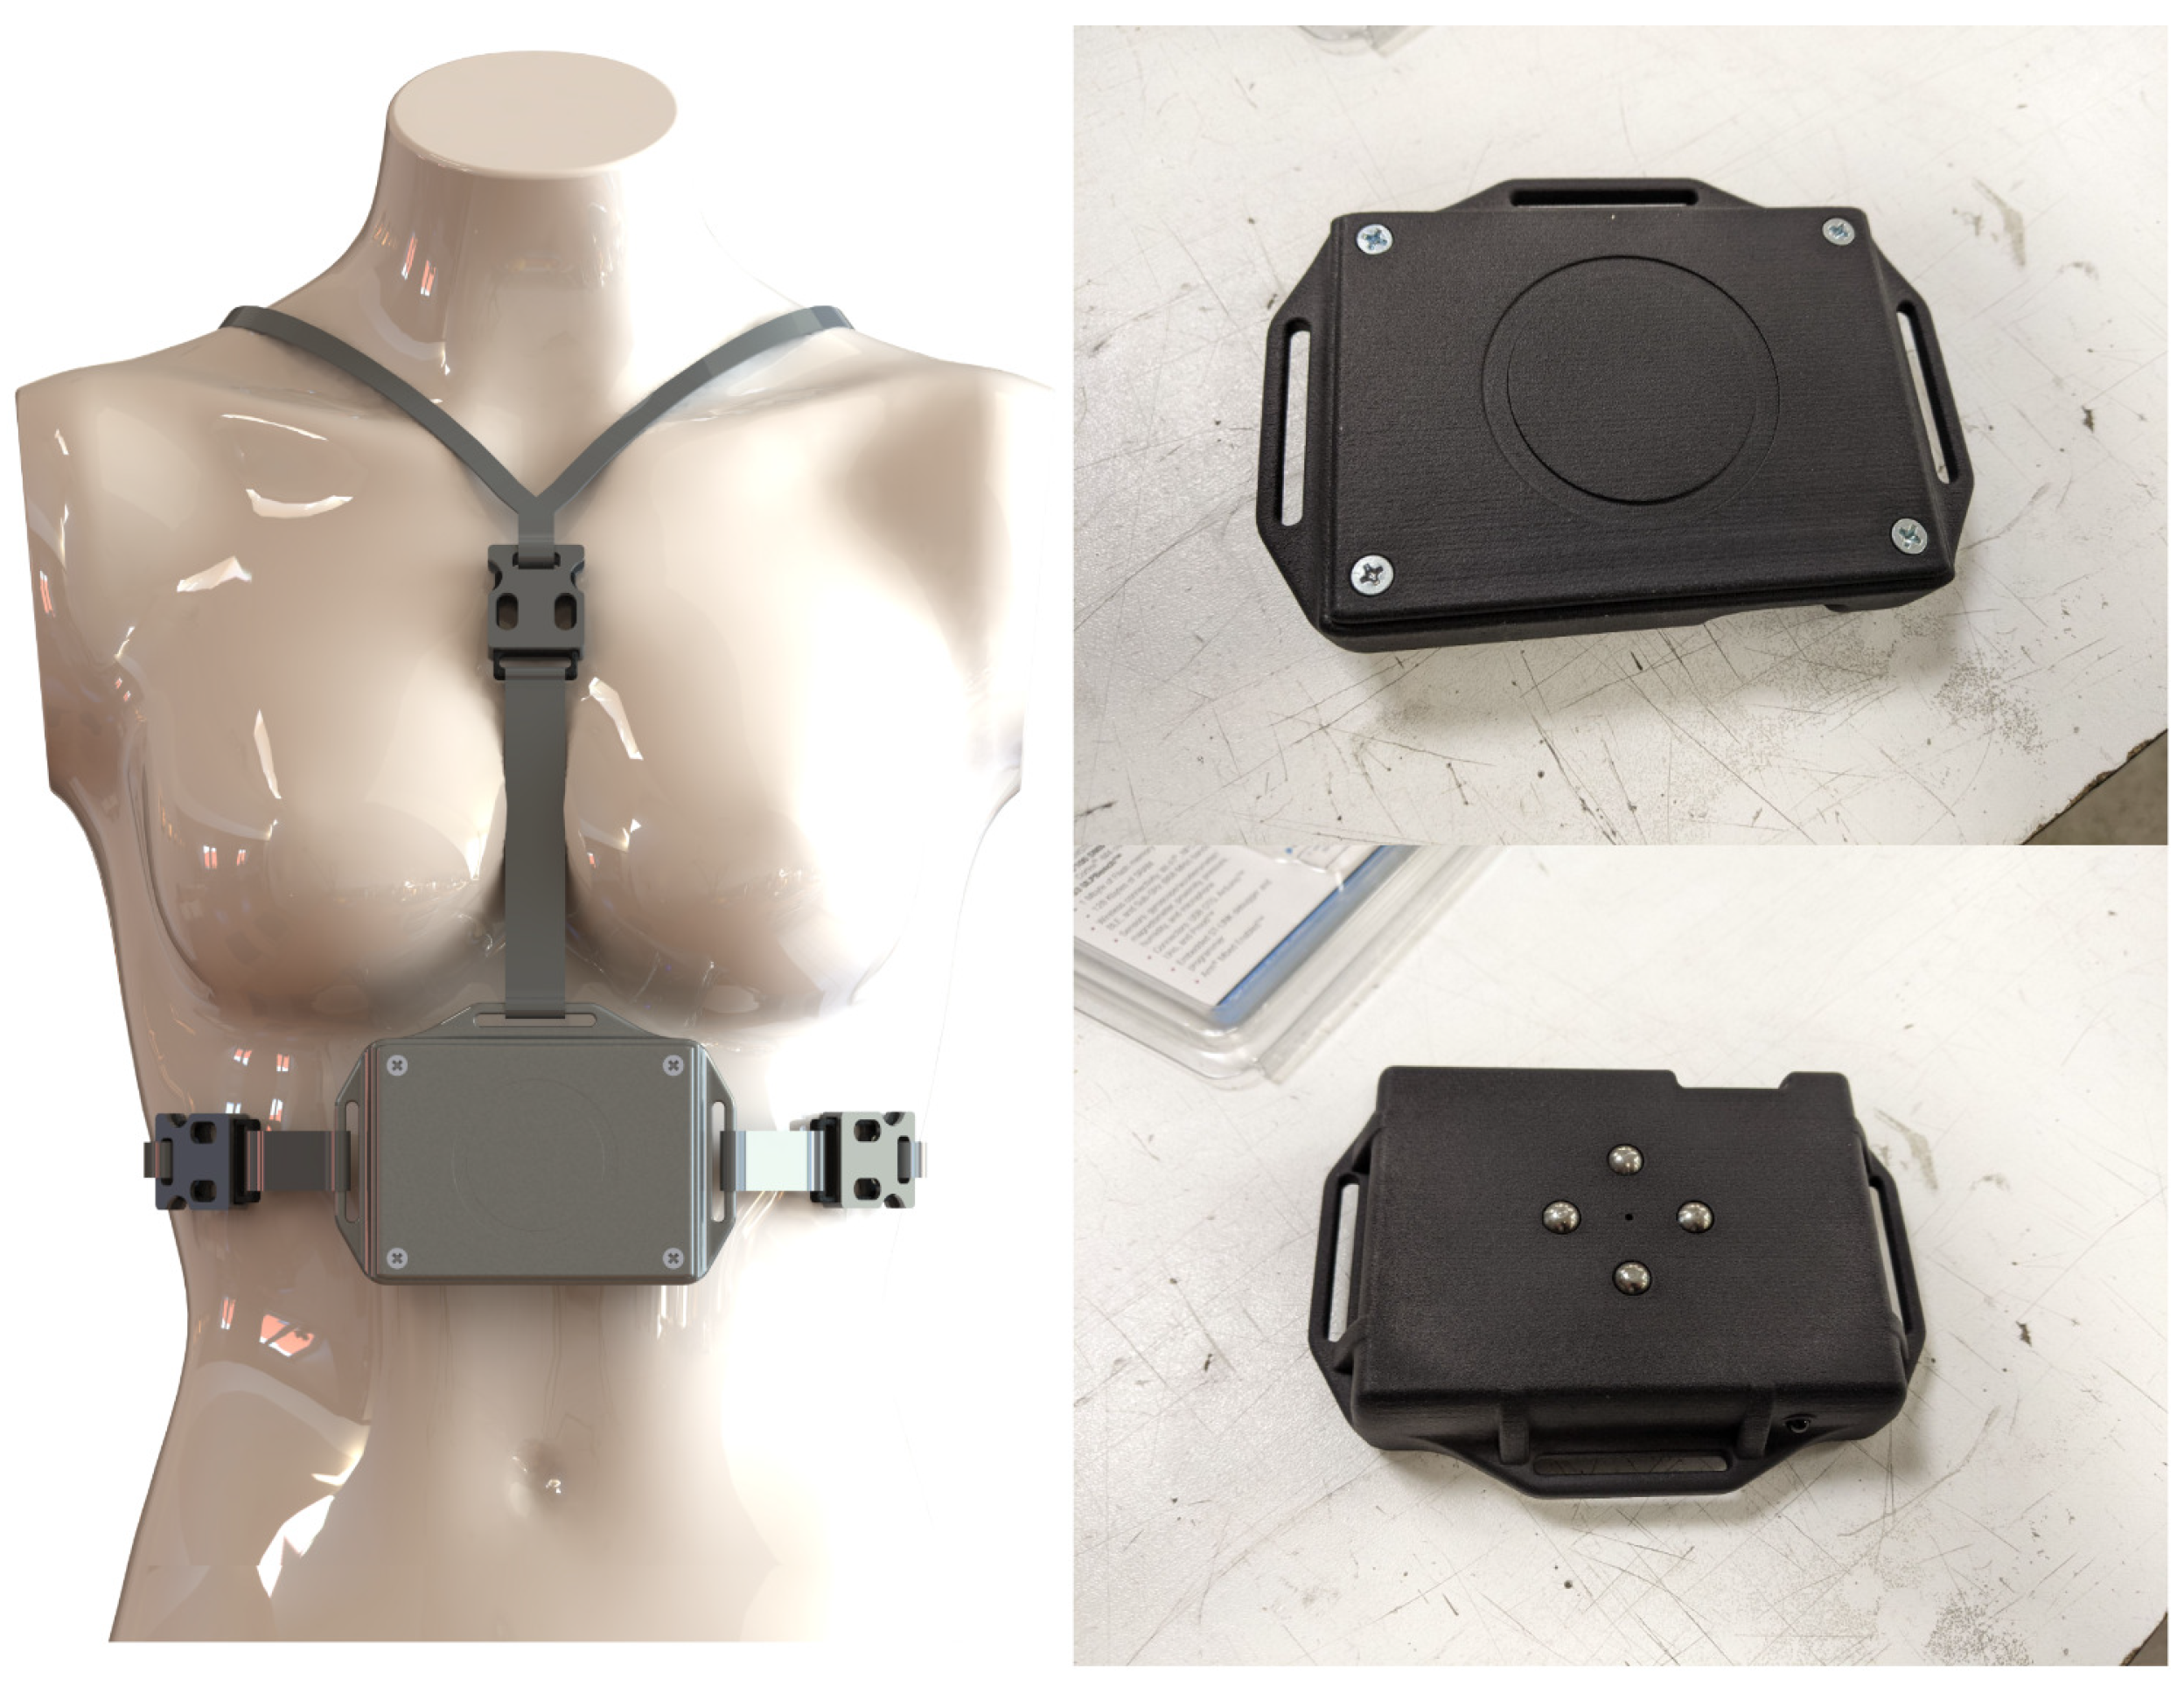
This device was specifically designed for the HealthTracker project with the goal of building a working prototype of a wearable multi-sensor device able to interact with an app to collect and send information such as movement, breathing patterns, and temperature. In Figure 2, we show how the device is worn (left photo), how it looks from the front (top right photo), and how it looks from the back (bottom right photo).
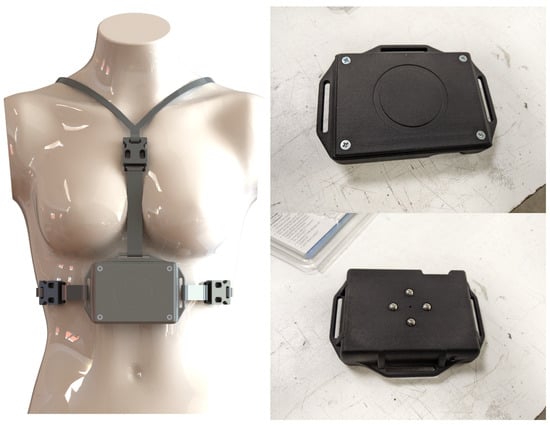
Figure 2.
The HDC device. On the left how it is worn, while on the right, we show the front of the device (figure on the top right) and the back of the device (figure on the bottom right).
The device was designed to comply with two sets of requirements: it had to be able to detect and measure movement, coughing, respiratory rate and depth, tremors and hyperkinesia, sweating, and temperature while also being light, easy to wear on the chest, and water-resistant.
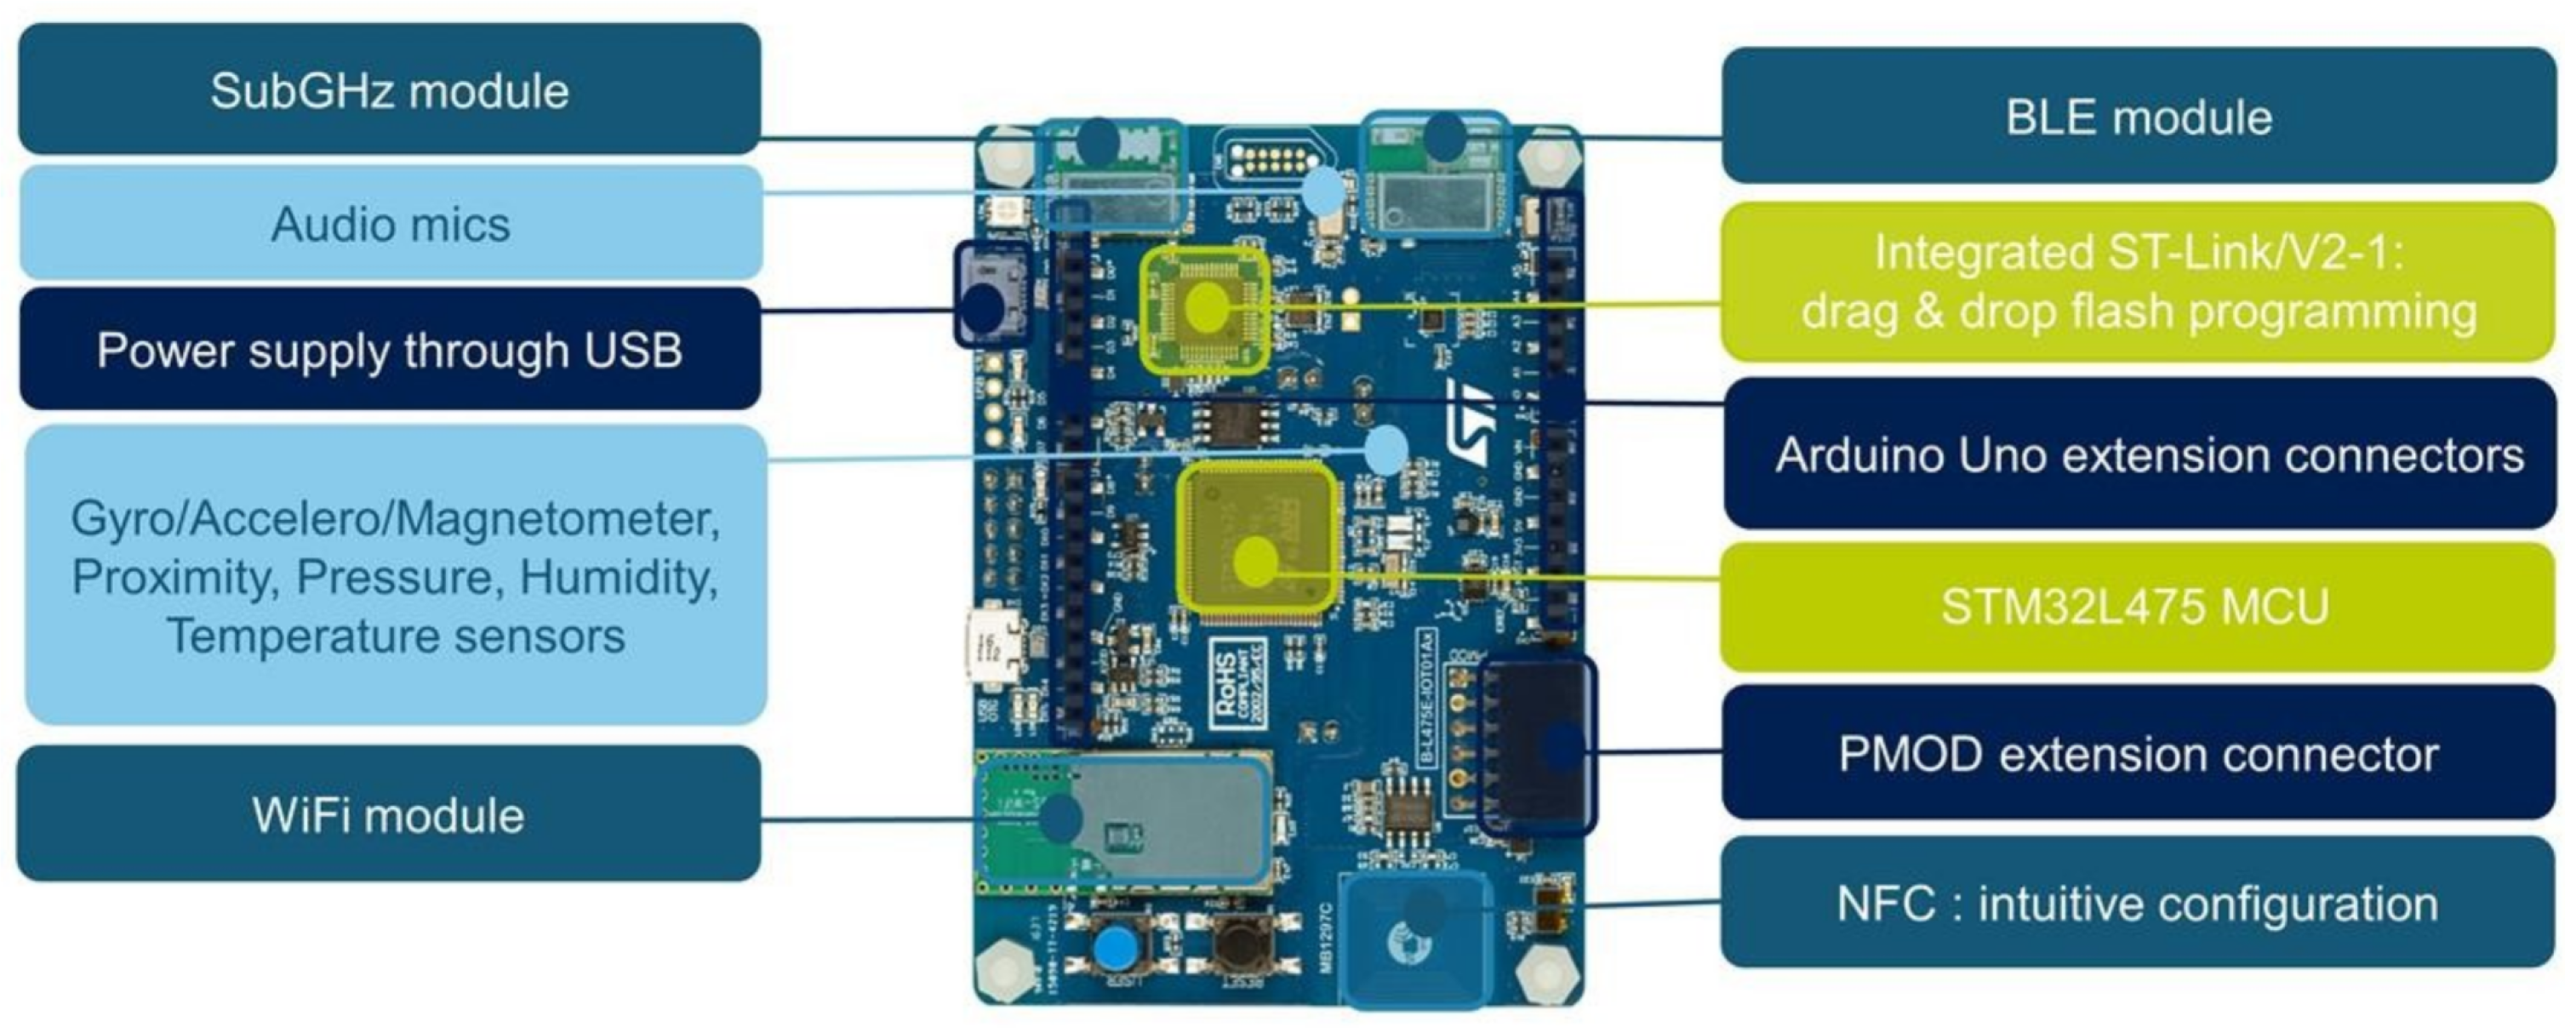
Concerning the hardware (see Figure 3), the HDC device is based on an IoT node multi-channel communication named B-L475E-IOT01A [18] produced by STMicroelectronics. In particular, the device is composed of two boards connected via the Arduino Header, both housed in a custom-made PA12 case. The main one (master) is the B-L475E-IOT01A IoT node by STMicroelectronics featuring an ARM Cortex-M4-based STM32L4 low-power MCU with a 1 MB Flash memory and a 128 KB SRAM, a 64-Mbit Flash memory, a Bluetooth 4.1 module, 2 microphones, a barometer, a magnetometer (LIS3MDL), an accelerometer and a gyroscope (LSM6DSL). The power supply to the integrated ST-link module has been disabled to save power. The other one (slave), also called HealthTracker Shield, is a custom-made board containing two rechargeable Li-ion batteries, which make up the 3.7 v 4000 mAh power supply. The batteries have been sized to guarantee at least 8 h of operation with all sensors turned on. Our tests confirmed this duration of device operability. Other hardware components included in the HDC device are an LED, a magnetic buzzer, a signal conditioning unit, and a humidity and temperature sensor. The LED is used to notify the user about the device’s functioning: blinking green LED means the device is up and running, blinking yellow LED means the battery is under 15% of its power capacity, and, finally, blinking red LED means the battery under 5% of its capacity. There is a specific pin in the device where it is possible to obtain the residual battery capacity. The device can be charged wirelessly according to the Qi standard (an interface for wireless power transfer using inductive charging). In particular, HDC is powered by a rechargeable battery with swap architecture in order to be replaced and allow the continuous device to work with two accumulators by putting one in recharging.
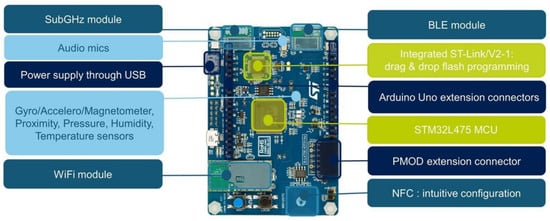
Figure 3.
The HDC device block design.
Concerning the software, we developed the firmware of the HDC device. In particular, we implemented the GATT interface used by the device to send data through a BLE connection. The interface can supply the following information: accelerometer, gyroscope, and magnetometer values for each axis, temperature, humidity, pressure, and battery status. It uses three services, but each of them only has one characteristic and employs bytes instead, using 16 bits for each value and representing the same information on the same range in a more compact though less readable way. For example, the acceleration on the x-axis can be found in the first two bytes of the array received by subscribing to the characteristic 02055000-0000-0000-0001-000000000001 on the service 02055000-0000-0000-0001-000000000000.
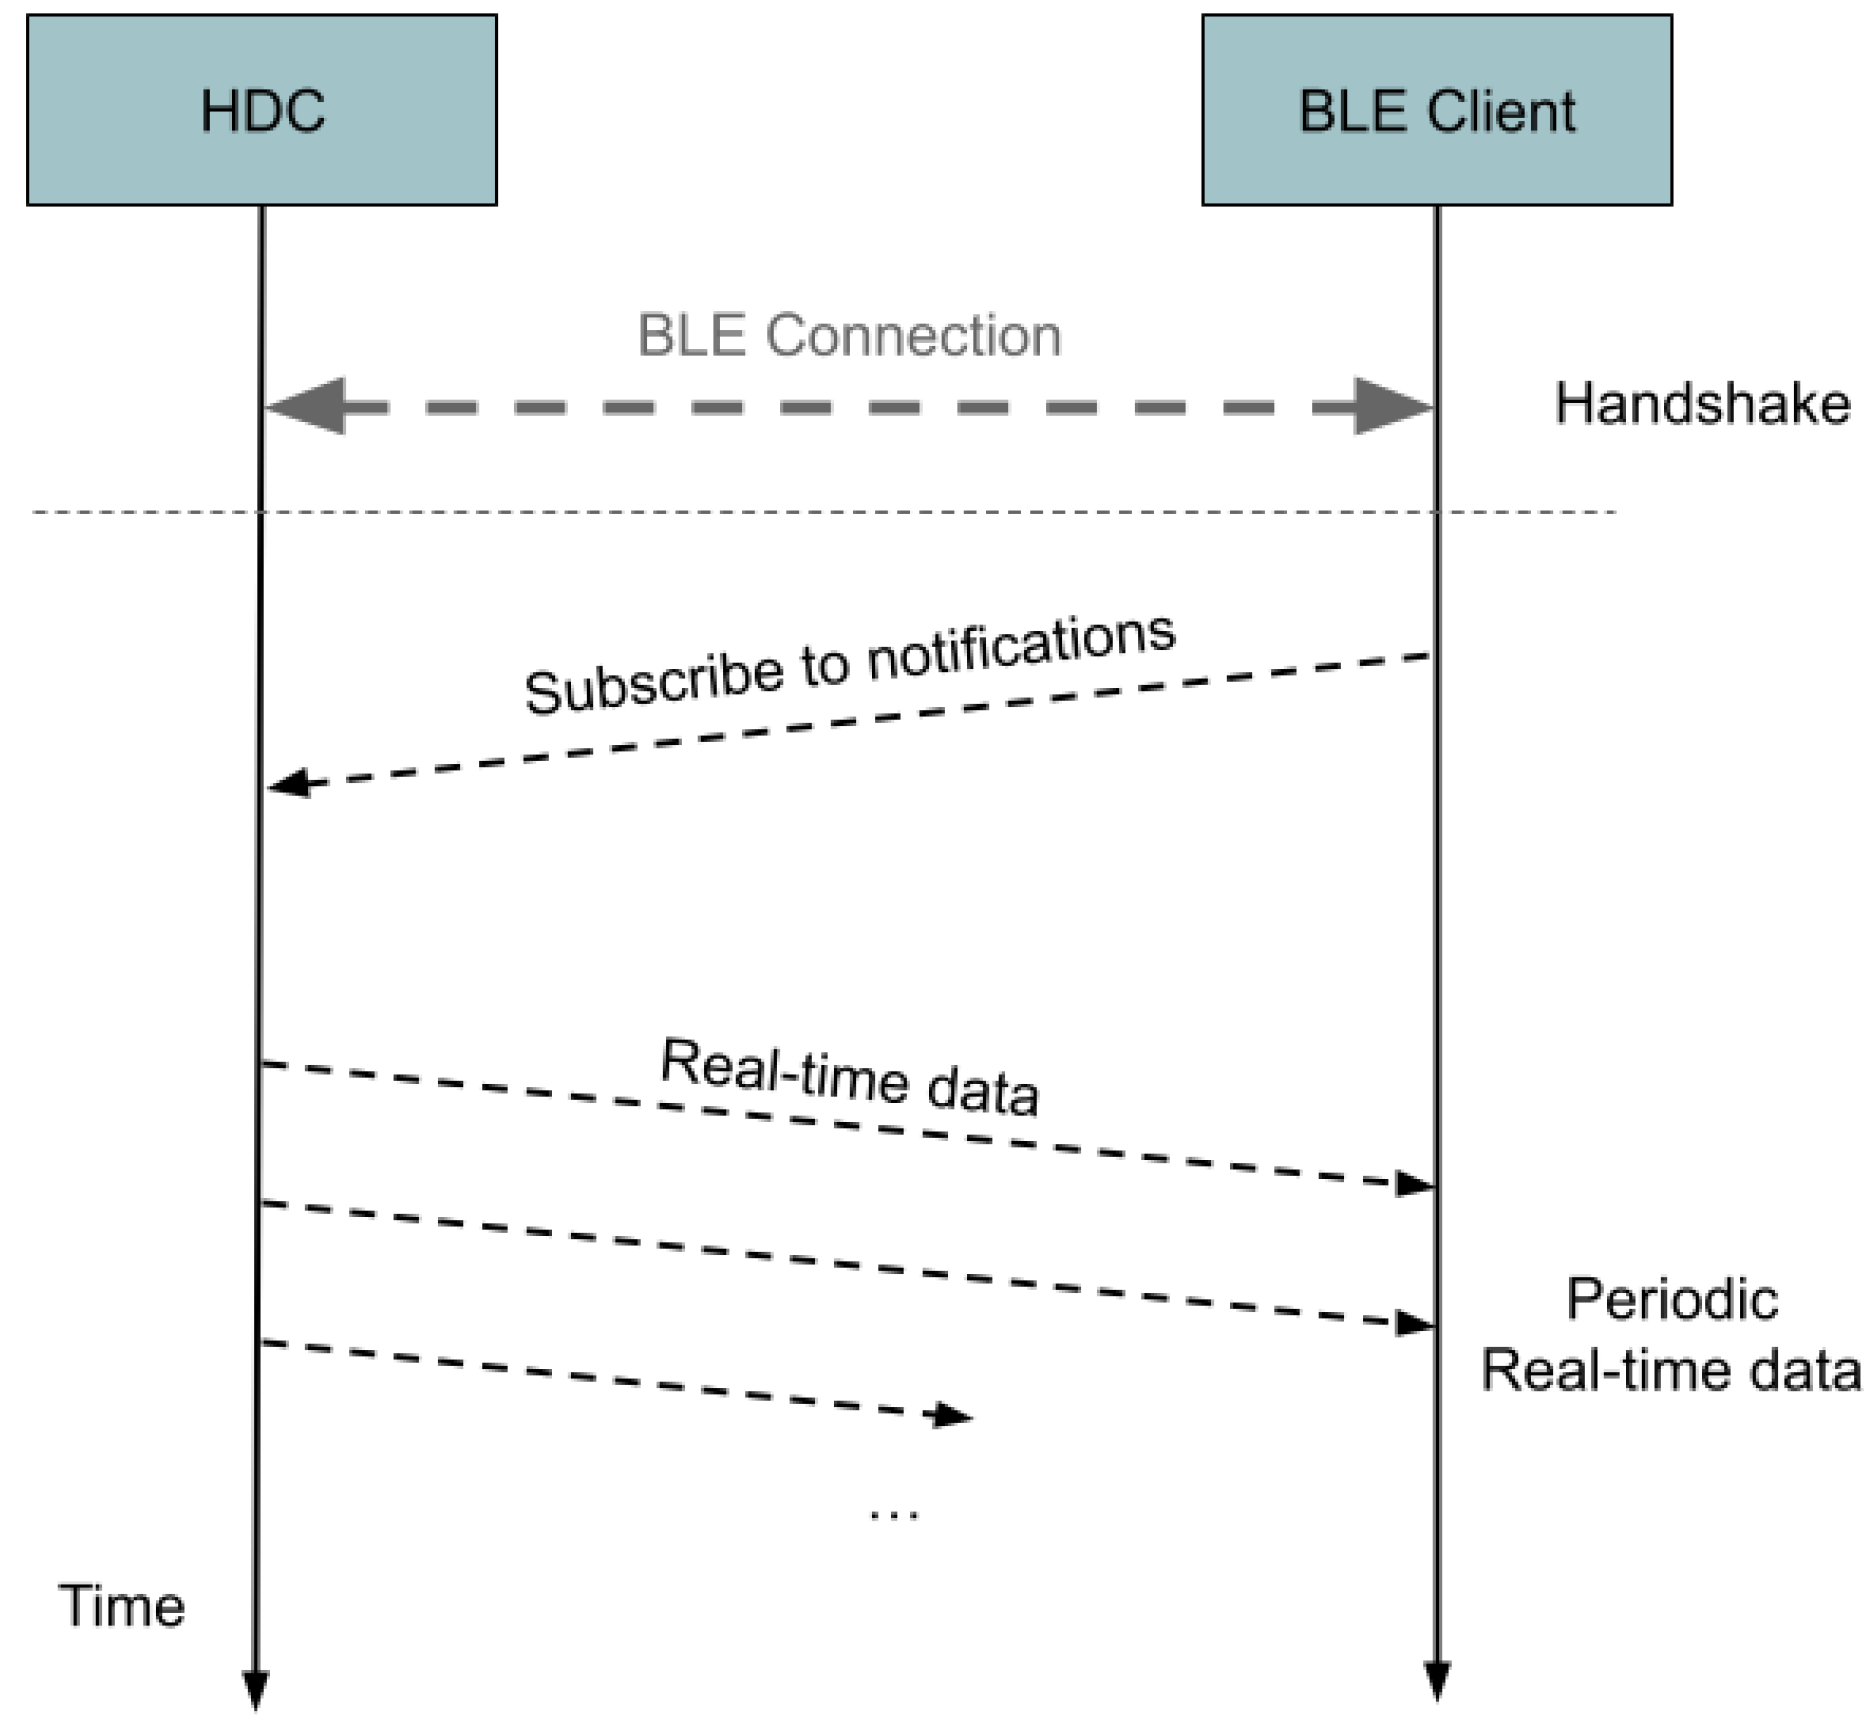
An example of the real-time data retrieval procedure is shown in Figure 4, where a BLE client, after establishing a connection with the HDC device, subscribes itself to the periodic reception of real-time data.
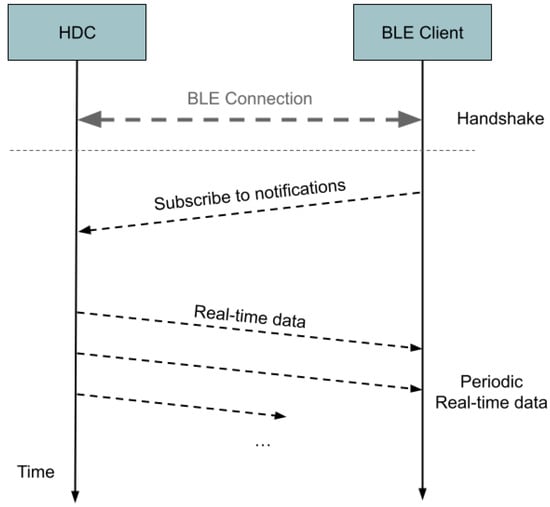
Figure 4.
Sequence diagram illustrating the interactions between the HDC device and a BLE client during the retrieval of real-time data.
5.2. The Viatom Checkme O2 Device
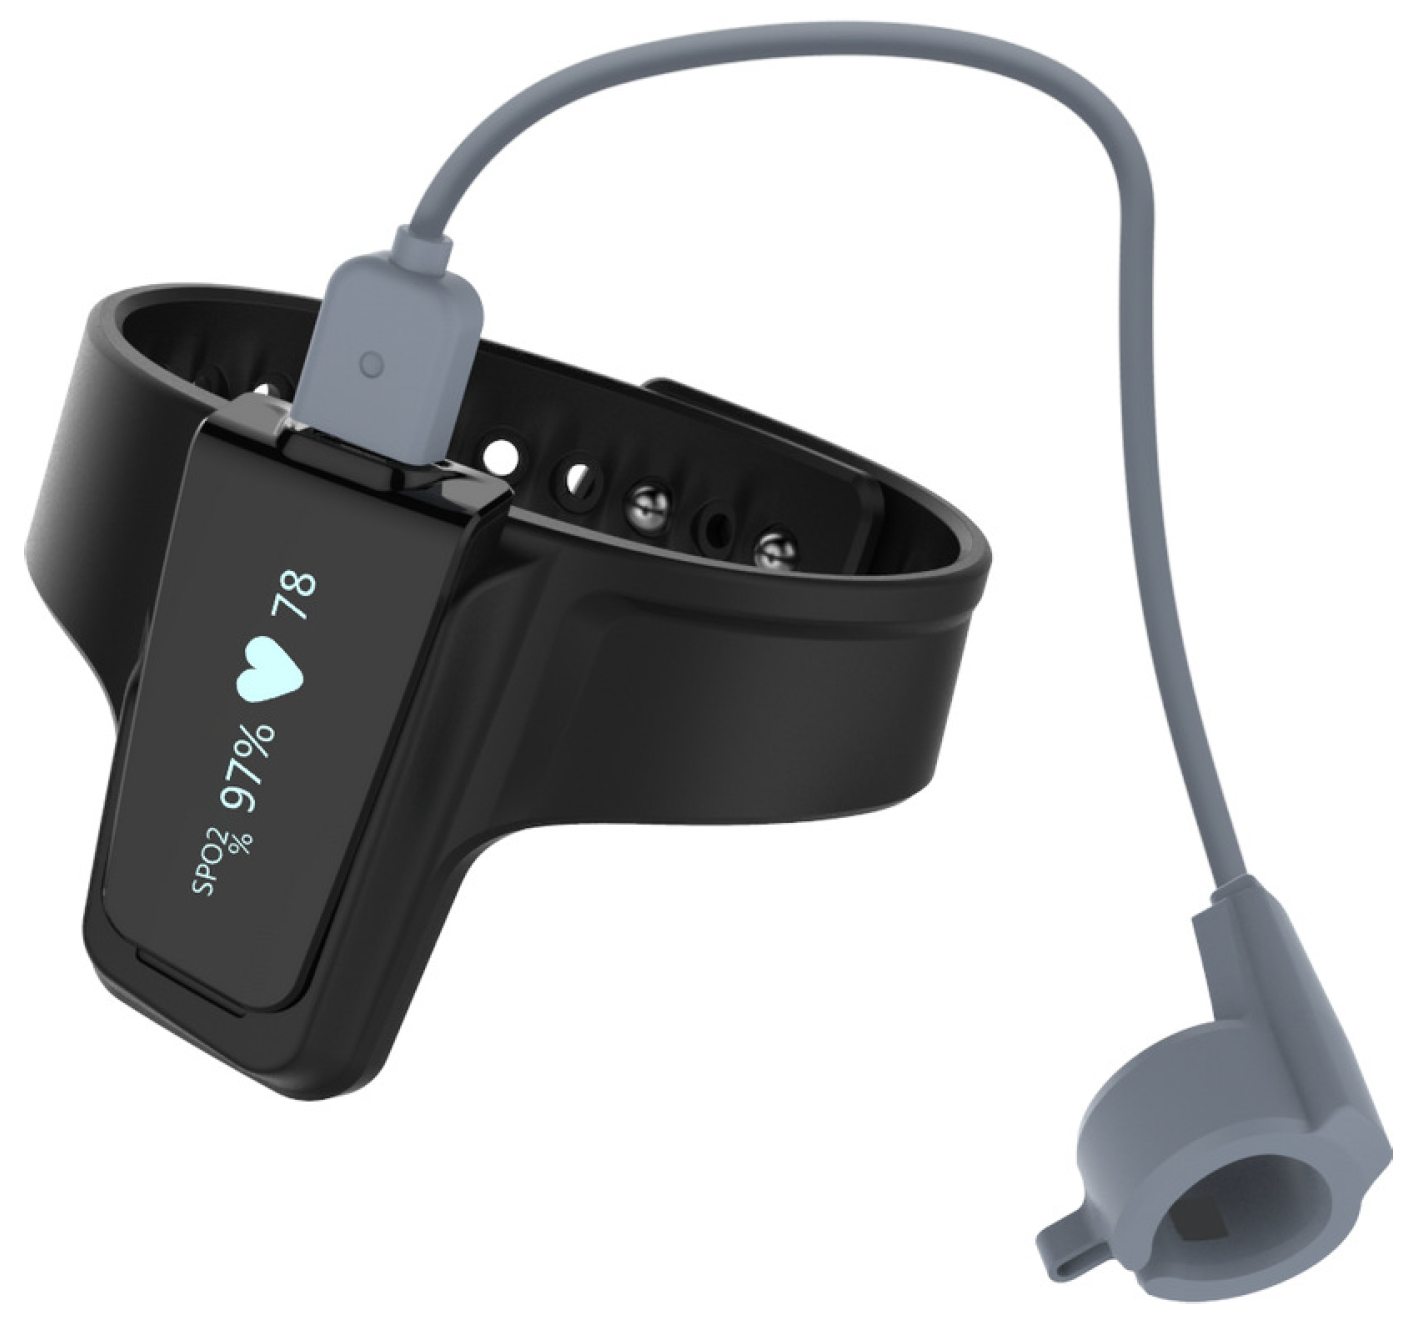
The HealthTracker system is complemented by sensors for continuous monitoring and alerting of oxygen saturation level and heart rate, so both our devices together can monitor all the parameters reported as relevant in innovative telemedicine [19]. The Viatom Checkme O2 device is a wrist oximeter that can measure blood oxygen levels, heart rate, and movements (see Figure 5). It can send the values to a nearby smartphone in real time or store them locally in files that can later be downloaded on a smartphone. It can also warn the user if the current readings are at a dangerous level by triggering the vibration of the device itself. This device can be used along with the ViHealth app provided by the manufacturer to take advantage of additional features.
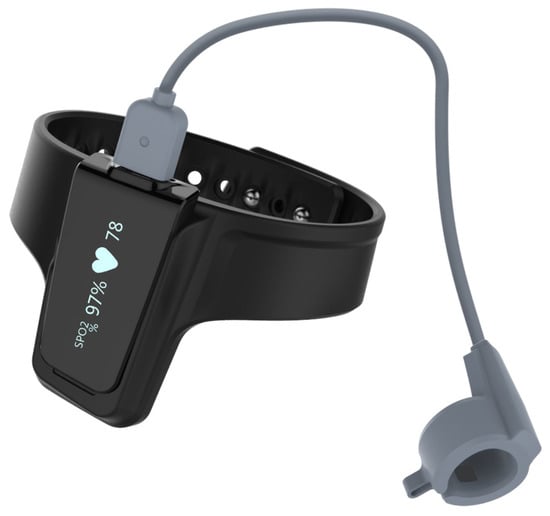
Figure 5.
The Viatom Checkme O2 device to monitor blood oxygen level, heart rate, and movements.
Concerning the hardware, the device uses a ring sensor to collect oxygen saturation and heart rate data, while the main unit is a bracelet containing a BLE 4.0 chip, a 3.7 v 130 mAh rechargeable battery, an accelerometer, and a small OLED display. The display can show the current oxygen saturation level, the heartbeat rate, and step count values. The device has an Ingress Protection (IP) rating of 22, which protects the device from water spray IP22 is enough since the device is removed from patients during personal hygiene, and it has an internal memory able to store up to 40 h of recording data.
Concerning the software, the device comes with a mobile app that, through a BLE connection, can download the files containing the data recorded offline, store them on the smartphone, and examine them, providing user-friendly charts. Since the source code of the ViHealth app was not available, the Viatom Checkme O2 device could not be easily integrated into the HealthTracker project. Therefore, we reverse-engineered the communication protocol between this device and the ViHealth app to exploit it in HealthTracker. To do so, we analyzed the Bluetooth data exchanged between the device and the app during operations such as downloading recordings and requesting the current values. This process allowed us to obtain enough information on how to receive real-time data about oxygen saturation and heart rate, how to receive files, and how this information is arranged while disregarding the acquisition of data pertaining to steps or movement because it is not important in our scenario. All the aforementioned functionalities are accessible through a single service, with UUID 14839AC4-7D7E-415C-9A42-167340Cf2339, within the GATT interface, which, in turn, has two characteristics: one for sending commands and one for receiving data after subscribing for notifications. To elaborate further, the former characteristic is identified by the UUID 8B00ACE7-EB0B-49B0-BBE9-9AEE0A26E1A3, while the latter is denoted by the UUID 0734594A-A8E7-4B1A-A6B1-CD5243059A57.
The specifics of the protocol are beyond the scope of this paper, so the following is a summary of the behavior. The app acts as a client, and after subscribing for notifications, it can send commands containing different fields. An example of a command showcasing the full structure is shown in Figure 6. The first field is a one-byte preamble used to identify the start of a command, followed by a one-byte command identifier. Subsequently, an XOR operation between the previous byte and 0xFF is performed. The fourth field is a two-byte acknowledgment used in specific operations to confirm received data on the client’s end. Moreover, the structure involves a two-byte value represented in the little-endian format, denoting the length of the subsequent field, which is a variable-size payload containing the necessary parameters when the command requires them. Lastly, the command concludes with a one-byte checksum computed using the CRC-8-CCITT algorithm. Each command serves a different purpose and, by sending one, the client can request information about the device (including the file list), request real-time data (see Figure 6), request a file, set the date and set thresholds to warn the user of dangerous values.

Figure 6.
Structure of the command used to request real-time data.
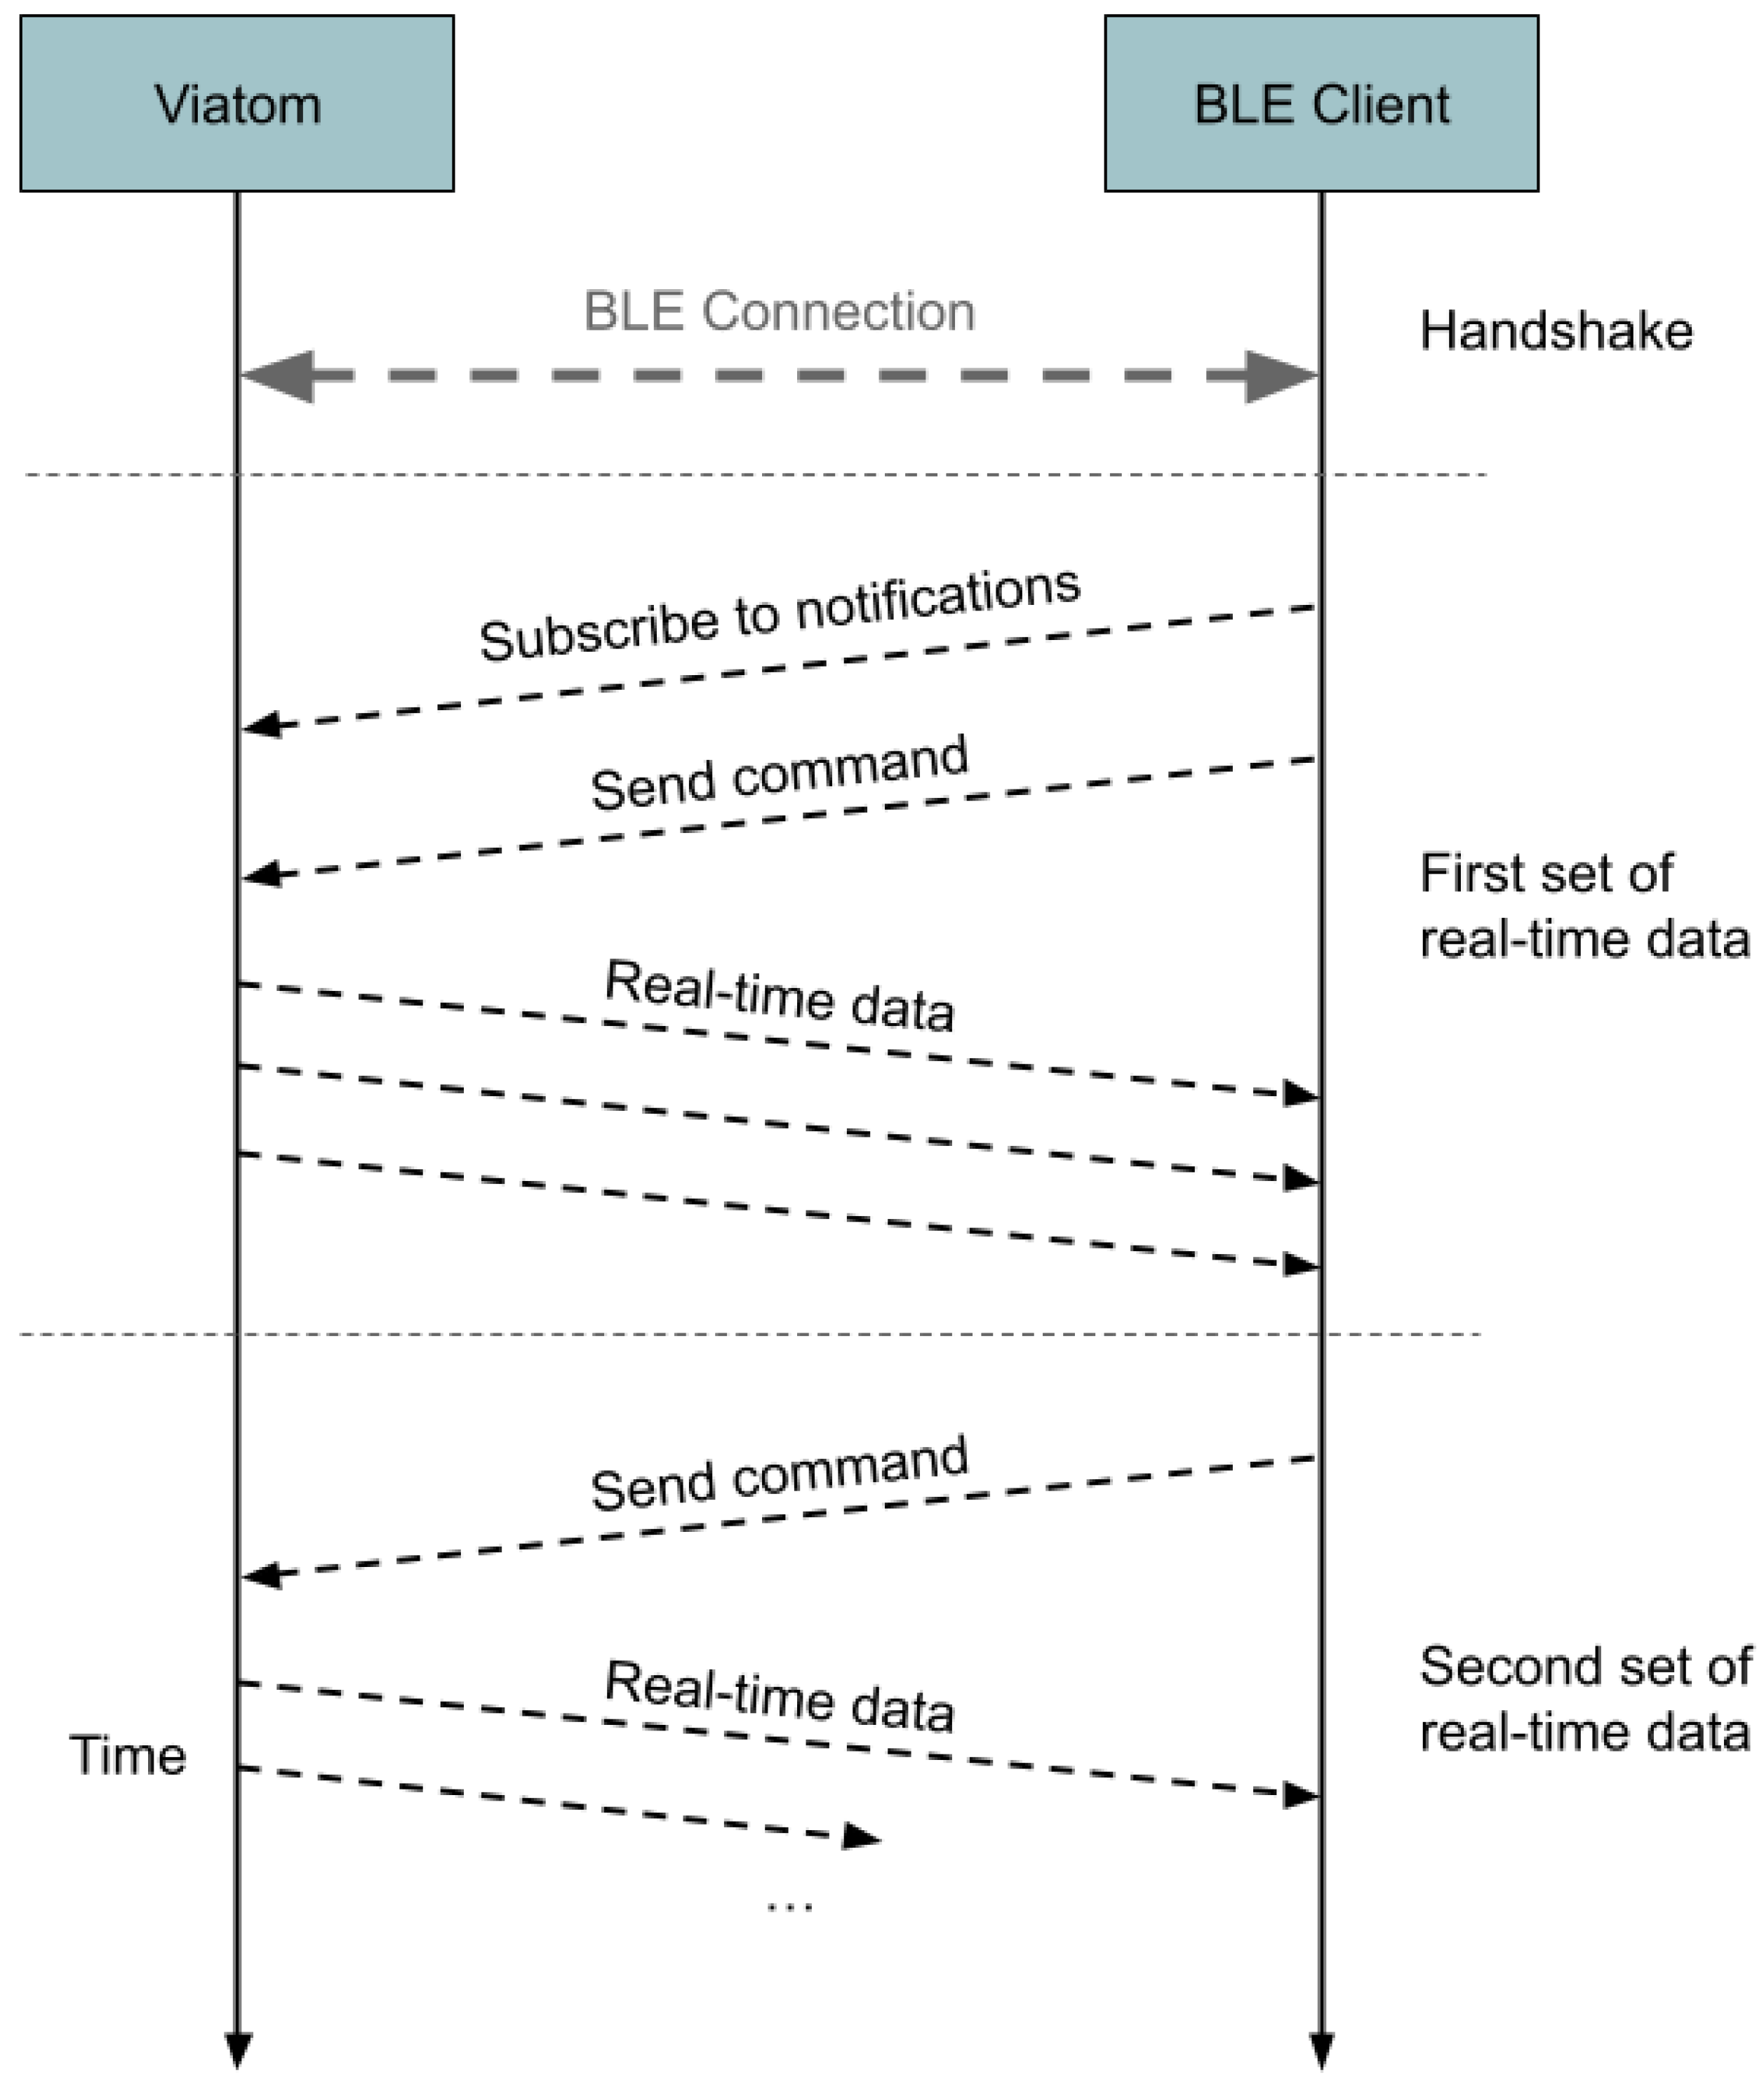
Files are sent in bursts of no more than 26 packets. The first burst contains a header section with metadata about the file, after which the actual values begin. The values are recorded every 4 s and arranged in this order: one byte each for saturation and heart rate, one zero byte, one byte for movement, and one zero byte. Each burst is identified by a progressive number, and the final packet of each burst contains a CRC, after which the client responds with an ack command containing the same progressive number. Real-time data are sent once in response to the designated command, which must be sent every time the client needs new values. The data are sent in a sequence of packets, the first of which contains the saturation on the seventh byte and the heart rate on the eighth one. The illustration in Figure 7 details the interaction between the two devices, a Viatom Checkme O2, and any BLE client, specifically when the aim is to receive real-time data.
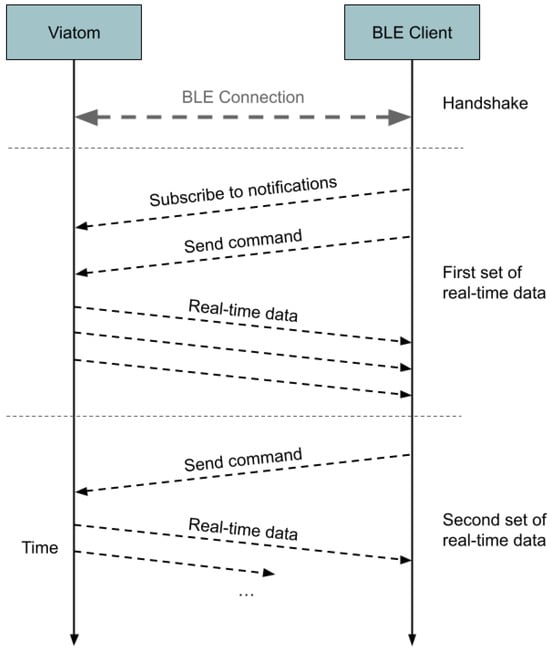
Figure 7.
Sequence diagram illustrating the interactions between the Viatom Checkme O2 device and a connected BLE client during the retrieval of real-time data.
5.3. Sensors and Metrics
As mentioned before, our system provides a set of sensors able to measure a variety of metrics with a given degree of accuracy. These sensors are listed in Table 1, where—for each one of them—we provide the metric which it measures (column Unit), its scale (column Scale) and its accuracy (column Accuracy).

Table 1.
Unit, scale and accuracy of each sensor of our system.
In Table 2, we compare the health and wellness monitoring features provided by HealthTracker with respect to other popular commercial devices, namely Apple Watch Series 9 [20], Garmin Venu 3 [21], Google Pixel Watch 2 [22] and Samsung Galaxy Watch6 [23], denoted as columns “Apple”, “Garmin”, “Google” and “Samsung” in the table, respectively. As we can note, some features are provided only by HealthTracker, such as “Cough frequency and intensity” and “Tremors and hyperkinetic movements”. For these features, we are implementing specific algorithms in our firmware to monitor the relative parameters and send alerts in case a danger threshold is reached. In particular, there are acoustic techniques for cough detection [24] that can be used to diagnose over one hundred medical conditions like respiratory diseases (e.g., asthma, bronchiectasis, or chronic obstructive pulmonary disease), generic pathologies such as cold or allergies, or even lifestyle (smokers). Concerning sweating, in [25], a machine-learning model has been implemented to estimate sweat loss. Knowing how much individuals sweat during exercise allows the planning of fluid intake effectively before (prehydration), during, and after (rehydration) exercise. In [26], researchers propose a prediction model for sleep-disordered breathing (SDB) in relation to different malocclusions and oral habits with the purpose of aiding clinicians in early screening of patients at risk of developing SDB. Utilizing Python deep learning algorithms, a Multi-Layered Perceptron (MLP) was developed for SDB prediction. Finally, concerning tremors and hyperkinetic movements, in [27], the authors propose a novel algorithm to characterize tremors using inertial sensors. It uses a two-stage approach that (1) estimates the tremor frequency of a subject and only quantifies tremor near that range; (2) estimates the tremor amplitude as the portion of signal power above baseline activity during recording, allowing tremor estimation even in the presence of other activity; and (3) estimates tremor amplitude in physical units of translation (cm) and rotation (°), consistent with current tremor rating scales. The authors declare that their algorithm can quantify tremor accurately even in the presence of other activities.

Table 2.
Comparison of health and wellness monitoring features provided HealthTracker and other commercial devices. The symbol “✓” in a cell means that the device in the corresponding column provides the feature in the corresponding row.
6. Implementation
In this section, we discuss the implementation of the prototype of HealthTracker by describing the main components of the HealthTracker architecture presented in Section 4. In particular, we describe the Android mobile application implemented (Section 6.1), and then we describe how the data are sent to the cloud service (Section 6.2). In Section 6.3, we show how the time-series database has been implemented, and in Section 6.4, we describe how the HealthTracker admin server works. Finally, Section 6.5 concludes the implementation section by describing in detail the HealthTracker dashboard.
6.1. The HealthTracker Android Application
The Android app is responsible for interfacing with both the monitoring devices to collect the data they generate and with the Cloud Computing Platform to store them. It has been implemented by exploiting Android Studio [28], which is the Integrated Development Environment (IDE) for native Android app development. The mobile app code was written using the Kotlin programming language.
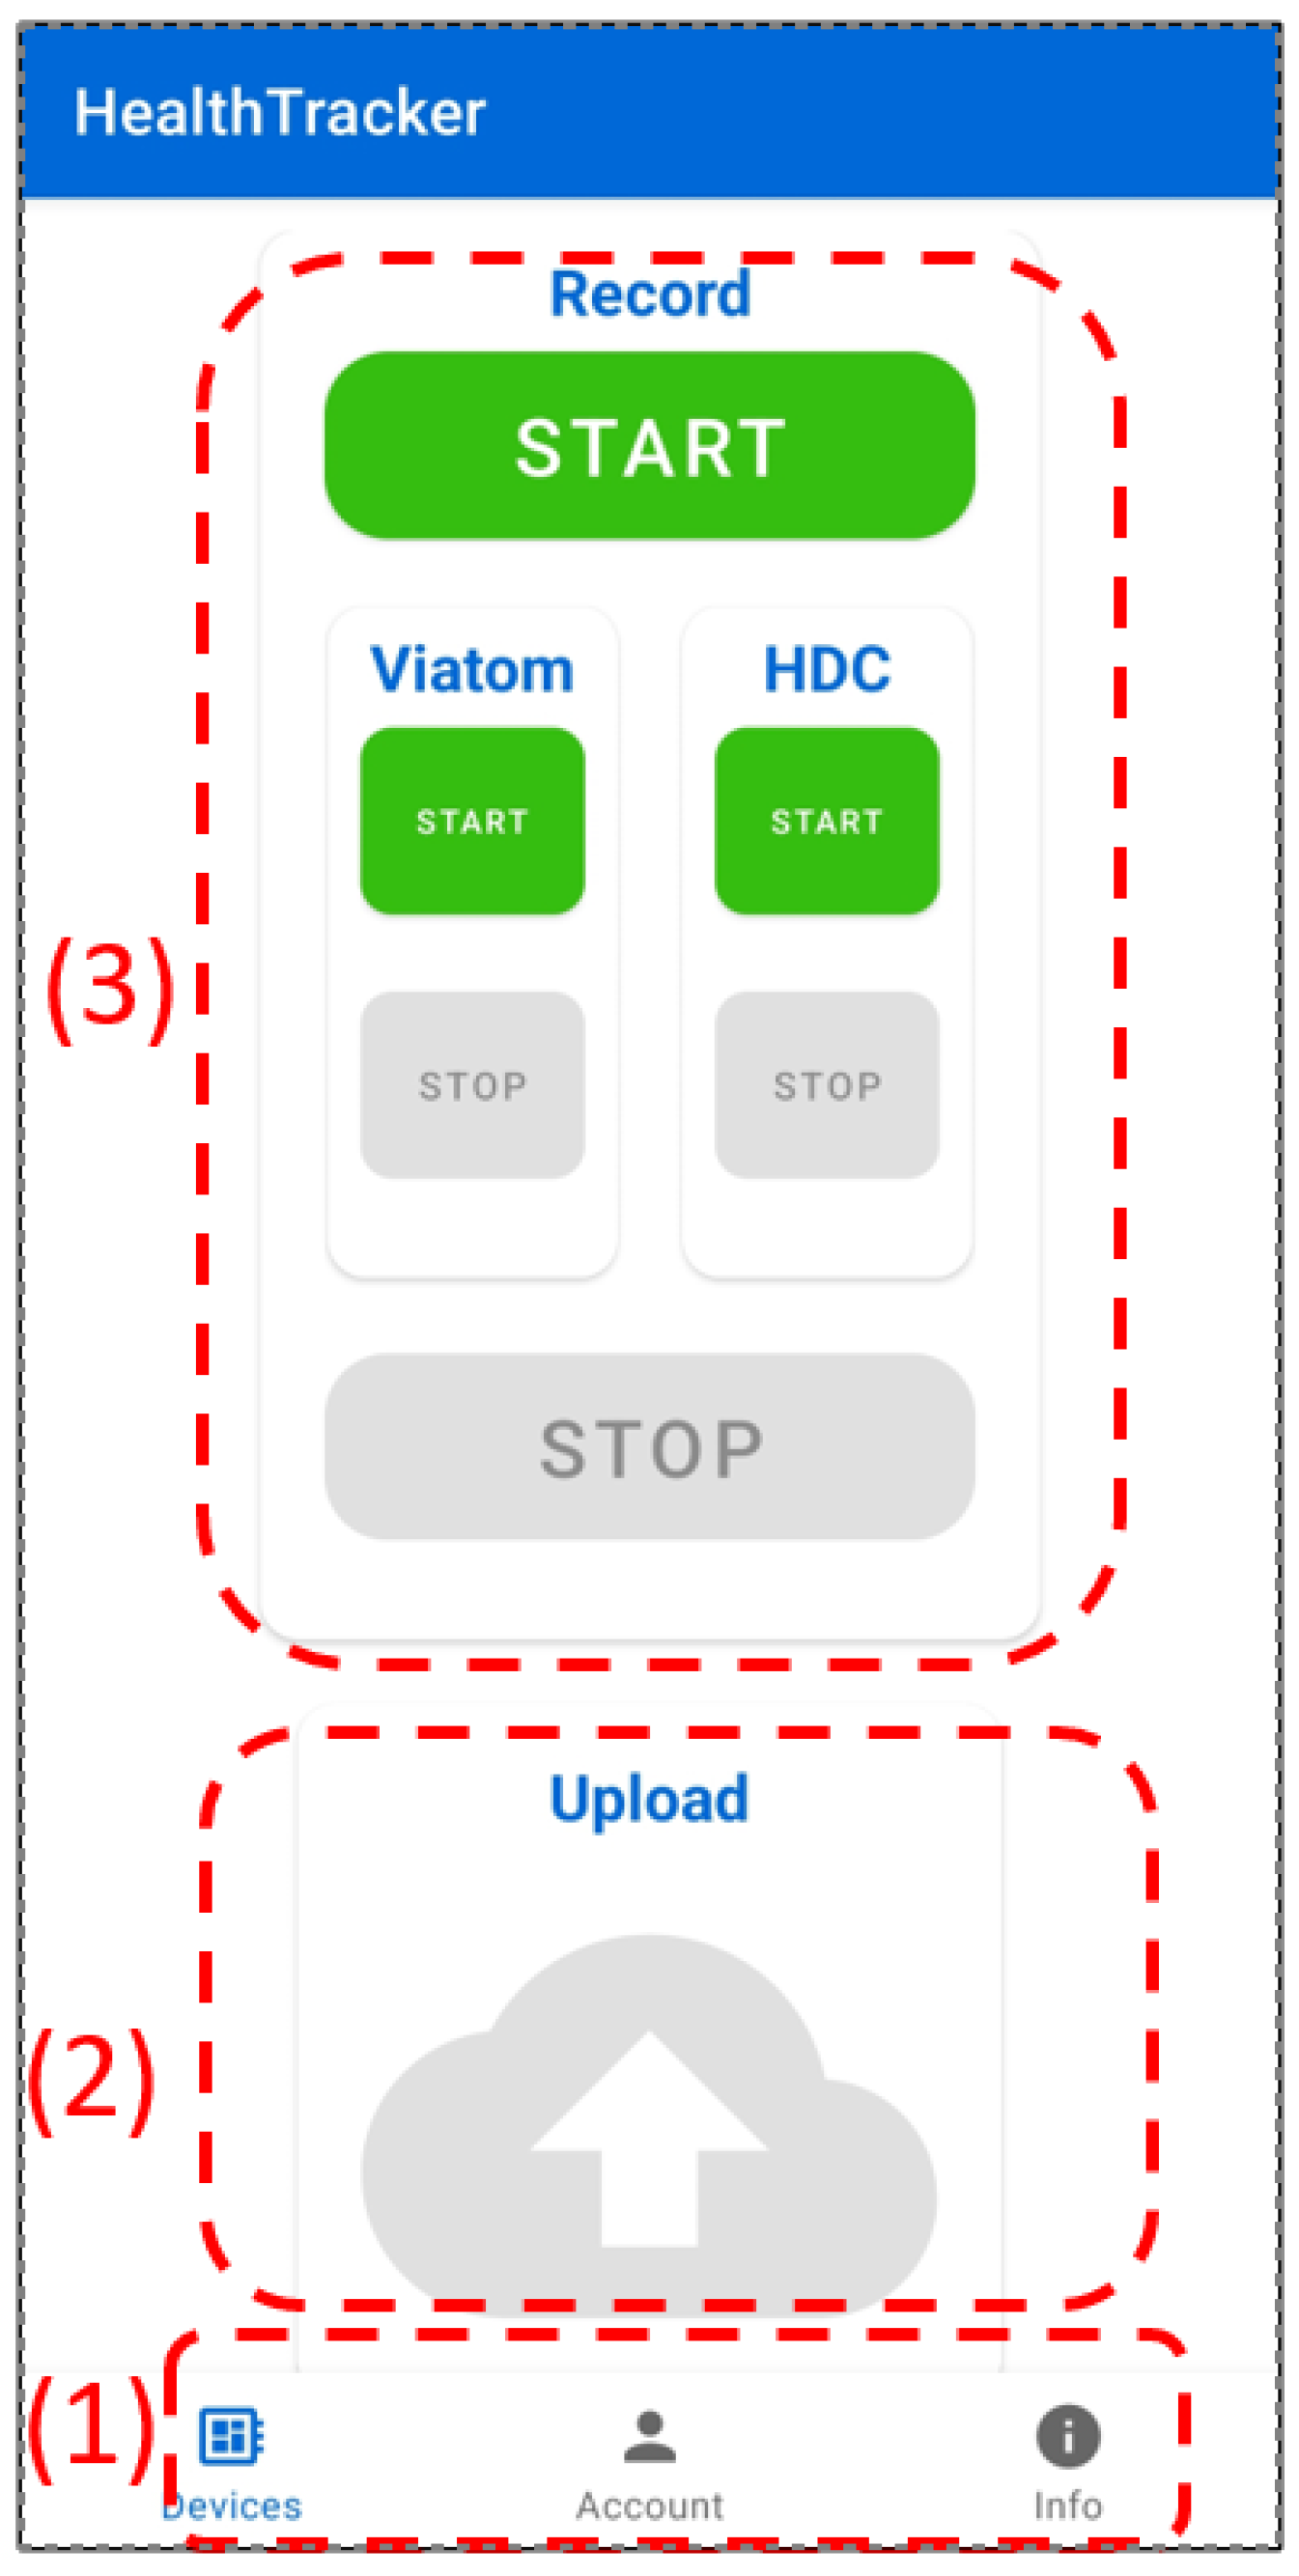
To better illustrate how it works, we refer to its user interface, which is shown in Figure 8, where we highlight its various parts by enclosing each one of them into a dashed-line rectangle and denoting them with a progressive number. The main functionalities provided by the app are authentication of the user within the HealthTracker system, activation and de-activation of health data acquisition from the monitoring devices, and the storage of these data on the Cloud Computing Platform. All functionalities are accessible through the various parts of the user interface. In particular, by looking at the Area (1) of the interface, we see the following icons (each corresponding to a specific function):
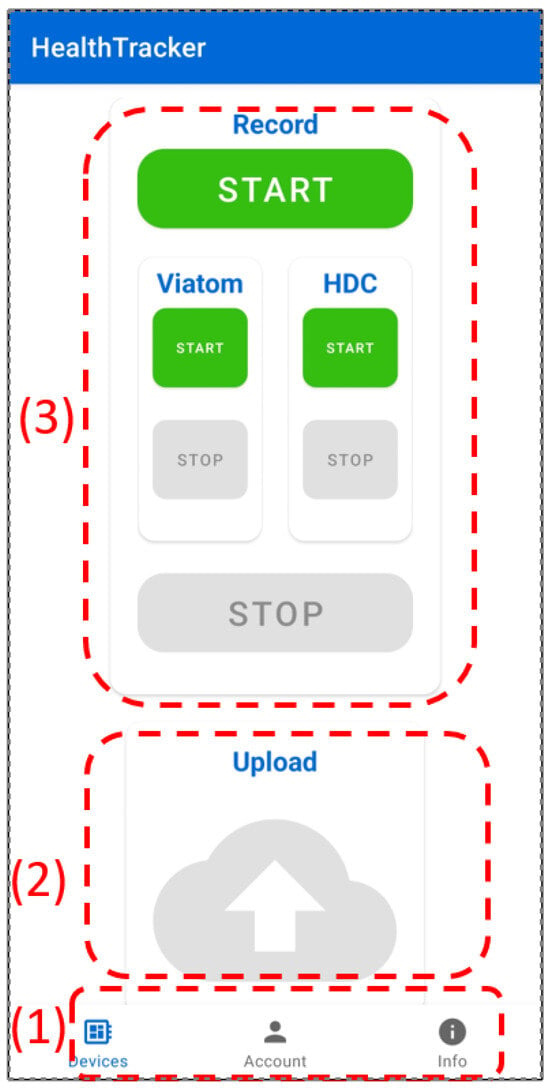
Figure 8.
The HealthTracker Android application user interface.
- Account: shows user information following authentication. User authentication is performed by submitting the corresponding credentials (user email address and password), which are validated by means of the Firebase Authenticator [29] running on the Cloud Computing Platform. Before the initial authentication phase, the user can perform account registration, email confirmation, or password reset. After the login step has been completed. Session persistence is managed by means of the Firebase Auth Android SDK.In the current implementation, we have adopted Single Factor Authentication, whereby a user authenticates by just providing a username and a password. However, switching to Multi-Factor Authentication (MFA), whereby additional identity verification information (e.g., a code sent via SMS) needs to be provided to the system to authenticate, is straightforward thanks to the already available MFA mechanisms provided by Firebase Authenticator.
- Devices: displays buttons that enable users to initiate independent data recording for each device and upload the sensor readings afterward (see Figure 8). Notably, in Area (3) of the figure, two prominent “Start” and “Stop” buttons are present to control data recording on both devices simultaneously. Meanwhile, smaller “Start” and “Stop” buttons are utilized when the user intends to record data from a single device.
As anticipated in Section 5, the Android app exploits the GATT protocol to communicate with both monitoring devices. This device-to-smartphone communication is implemented as follows: when the user presses the “Start” button in the Devices Fragment, the application checks if Bluetooth and GPS are enabled (it is necessary to perform a BLE Scan) or prompts the user to enable them and after all necessary permissions are granted, a Service called BLEService is responsible for starting each thread to enable the communication with the requested devices. Starting these threads from a Service lets us record the data even when the application is in the background. The BLESTConnectionThread and the BLEViatomConnectionThread classes have been implemented to manage the communication, respectively, with the HDC device and with the Viatom Checkme O2 device.
Despite being two separate threads, they work in similar ways. In fact, after their creation, they immediately perform a BLE Scan until the target device is found. After the connection has been established, each thread subscribes to the notify event on the characteristics presented in Section 5 in order to regularly obtain data updates and store the time-series data in a temporary vector. When the user is satisfied with the amount of information that has been gathered, (s)he can press the “Stop” button in Area (3) of the interface, storing these data—as a .csv file—in the internal memory of the Android smartphone. After having stopped data gathering, the user can upload the above .csv to the Cloud Computing Platform by pushing the “Upload” button in Area (2) of the interface. This activates a thread of the Android app (the UploadThread), which uploads the file to the Upload Server (see Figure 1) using a multipart HTTPS request; if the upload process is successful, all the files are deleted. Each of the previously mentioned operations is authorized by requesting a Firebase Auth token so the user’s identity can be safely established.
Another thread of the app (the DeleterThread) is responsible for deleting the local data upon user logoff. This ensures that when a different user logs in, there is no risk of recordings becoming mixed up or compromised.
The presence of multiple threads in the Android app posed the primary challenges we encountered during its implementation. These challenges revolved around synchronizing the BLE events (happening on different threads) with the user interface. To address this, we adopted the Handler class to implement a sophisticated bidirectional message-passing mechanism. This implementation facilitated seamless communication between worker threads, such as BLESTConnectionThread and BLEViatomConnectionThread, and the UI thread.
When a BLE event (e.g., a device connection) happens, a message is sent to the DevicesFragment to update the user interface accordingly, and when the user presses the “stop” button, the same thing happens in the opposite direction. Each event is associated with a different event code so the receiver knows the actions to take in response to the message reception.
6.2. The HealthTracker Upload Server
For the upload HTTPS server, we decided to use Node.js [30] so we were able to develop the infrastructure faster and independently from the other components. This technology enabled us to deploy our server on a Cloud Virtual Machine without the need for an extensive configuration.
Its primary function was to expose various API endpoints, allowing users’ applications to securely upload sensor time-series data for storage. This server exposed a different endpoint (using the Express [31] framework) for each type of time series that can be uploaded according to the types of data presented in Section 5. As each file is uploaded, it is stored in a temporary folder (using the multer [32] middleware) on the server, and it is parsed and validated according to the expected data format.
Each line in every .csv file (by means of which the data is stored locally by the Android application) represents a data point to which an absolute POSIX date is associated. After the upload, each sequence is ready to be stored as a time series in the collection pointed by the user ID specified in the authentication token. Token decoding can be performed after its successful verification thanks to the Firebase Auth JavaScript SDK. The time-series storage system will be further explored in Section 6.3.
Another endpoint is responsible for retrieving the time series based on the user ID specified in the request, but this is only used for debugging purposes as the full retrieving system will be analyzed in Section 6.4.
6.3. The Time-Series Database
Another important choice was the time-series database to use to efficiently store and retrieve our temporal data.
In a world where the problem of storing time-related information is not completely solved (especially from a commercial/production standpoint), we had to evaluate the different features and implementations available for different products, with a particular look at their ability to support the storage and retrieval of time-series data, and to provide encryption.
The outcome of our analysis was the decision to use the MongoDB DBMS [30] to store the time-series data.
MongoDB is mainly known as a document-oriented NoSQL database, ideal for storing data where the formal model is not strictly defined, and the introduction of modifications must be done in the simplest and fastest possible way. Since its 5.0 version, MongoDB also offers the possibility to create Time-Series Collections, which allow the direct storage of documents representing time-series data, eliminating the need for completely unstructured data as required in previous versions. Furthermore, it natively provides strong encryption of databases, thus making it very suitable for our needs to protect the confidentiality of data at rest. For these reasons, MongoDB represented a very suitable solution for the implementation of the Time-series database.
Each document stored in a collection of this type must present the following fields:
- Time: field indicating when the data were recorded.
- Source/Metadata: label or tag that uniquely identifies a time series.
- Measurements: data points tracked into the time series.
This structure allowed us to store different types of time-based data (accelerometer, gyroscope, blood oxygenation, heartbeat, etc.) separately for each user. The only downsides we experienced using this DBMS were related to the queries executed on large data volumes, where we found out that the indexes created by MongoDB were not as efficient as expected. This problem is also linked to the performance limits of a single disk, and the next step would be to migrate the data to a distributed storage system.
As a final consideration, we point out that in our current implementation, which is not intended to be used “in production” but only as a proof-of-concept for experimental purposes, we adopted the “Community Edition” of MongoDB, whose use is free but that does not provide encryption. Encryption is instead available for paid MongoDB licenses, which are, however, fully compatible with the Community Edition one; thus, if database encryption is desired (e.g., for the use of HealthTracker in a production scenario), it is sufficient to purchase a license for the Enterprise Edition, without having to change anything in our implementation.
We are currently working on finding alternative no-cost solutions to paid versions of MongoDB providing both effective support for time-series data and database encryption.
Our work on this aspect moves along two different directions:
- couple MongoDB Community Edition with a third-party encryption solution, and in particular with eCryptFS [33], an open-source file encryption utility, built in the Linux operating system and is part of the Linux kernel;
- replace MongoDB with free time-series database systems providing encryption natively, such as TimeCrypt [34] and Waldo [35] that have been proposed recently in the literature.
6.4. The HealthTracker Admin Server
This server, as the HealthTracker Upload server (see Section 6.2), is also implemented using Node.js, but it has been developed as a separate component, deployable on the same machine or a different one. Its core functionality was to manage the authentication of some “admin” accounts, allowing them to access the patient’s recordings from a specific dashboard (which will be presented in Section 6.5).
As anticipated before, user authentication is managed by the Firebase Authenticator, but an extension of its features was nevertheless needed to allow the definition and the management of subsets of the user accounts that can access sensitive information. This is the main reason that drove us to include enhanced security functionalities within the HealthTracker Admin server API, whereby any operation requested by a user is checked to verify whether that user has the rights to perform the above operation, after having verified first the legitimacy of the user’s token (by means of a remote call to the Firebase Authenticator).
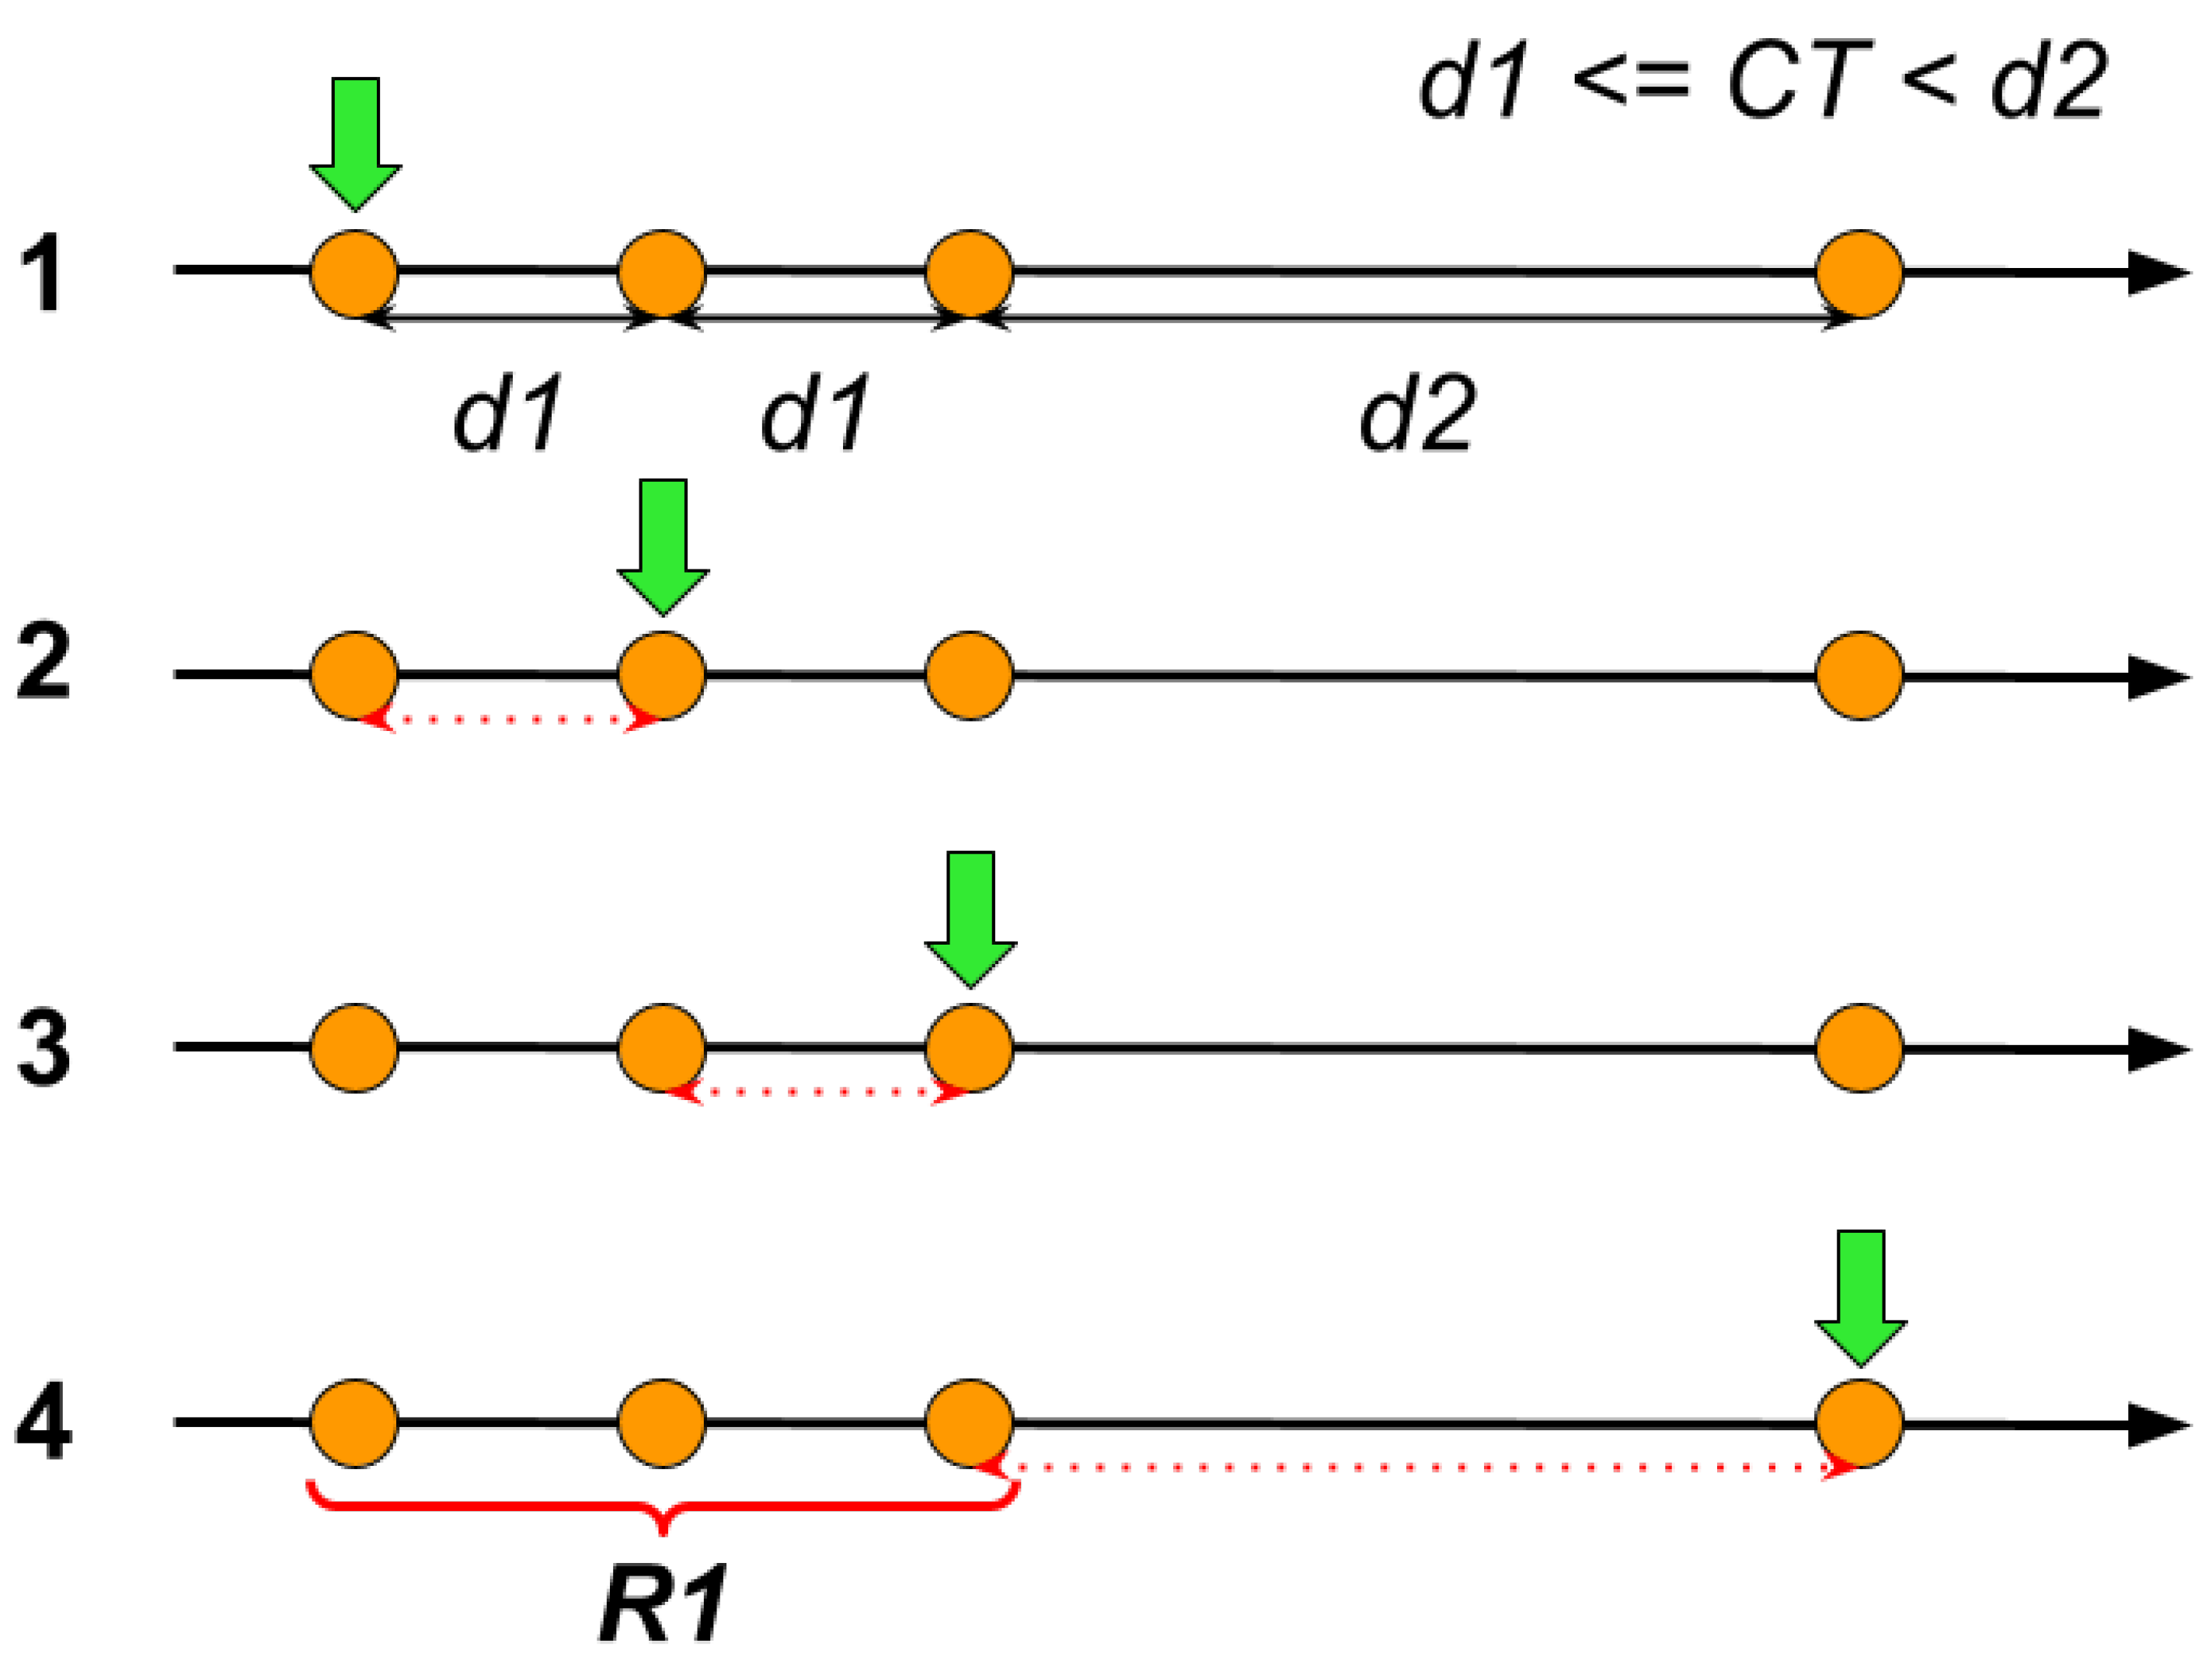
In addition to verifying the user identity and checking that (s)he is allowed to access the data, we implemented a specific endpoint for retrieving the ranges of time series for a specific user. By “ranges”, we mean the contiguous portions of data delimited by a start and an end time. This endpoint allows the user to choose what time duration to consider as a splitter between a range and the next (which we will refer to now on as Cutting Threshold or CT) and what time granularity to use for its interpretation.
Referring to Figure 9 to better understand the ranges generation algorithm, we can observe the time series during different phases of the procedure (from 1 to 4).
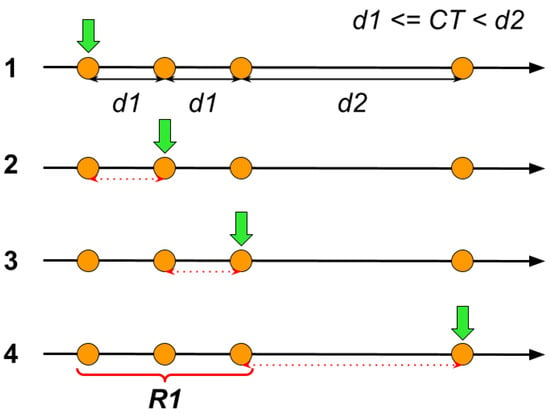
Figure 9.
Ranges generation algorithm applied to an example.
An index (represented by a green arrow) scans through the different time points (modeled as orange circles), and for each step, except for the first one where only the range starting point is defined, it calculates the temporal distance between the current point and the previous one (the considered gap is highlighted by a dotted red double arrow for each step).
If the CT is greater than or equal to the current time gap, the algorithm advances to the next step, while if the CT is smaller than the current time gap, the algorithm closes the current unfinished range (defined as R1 in step 4) and starts a new one. After we obtain this “ranges” representation, it is possible to request the time logs directly using the start and end times of the single range. This operation returns all the data points of the requested time series in the specified interval.
In our prototype, the HealthTracker Upload server, the HealthTracker Admin server, and the time-series database have all been deployed on different virtual machines managed by Chameleon Cloud [36].
6.5. The HealthTracker Dashboard
This dashboard is a web application whose goal is to support researchers and physicians in the visualization of the data stored—in the format discussed before—on the Time series database (see Figure 1). The dashboard was implemented using the Angular framework, enabling the creation of modular components, which could be reused across various parts of the application by generating HTML and JavaScript code dynamically.
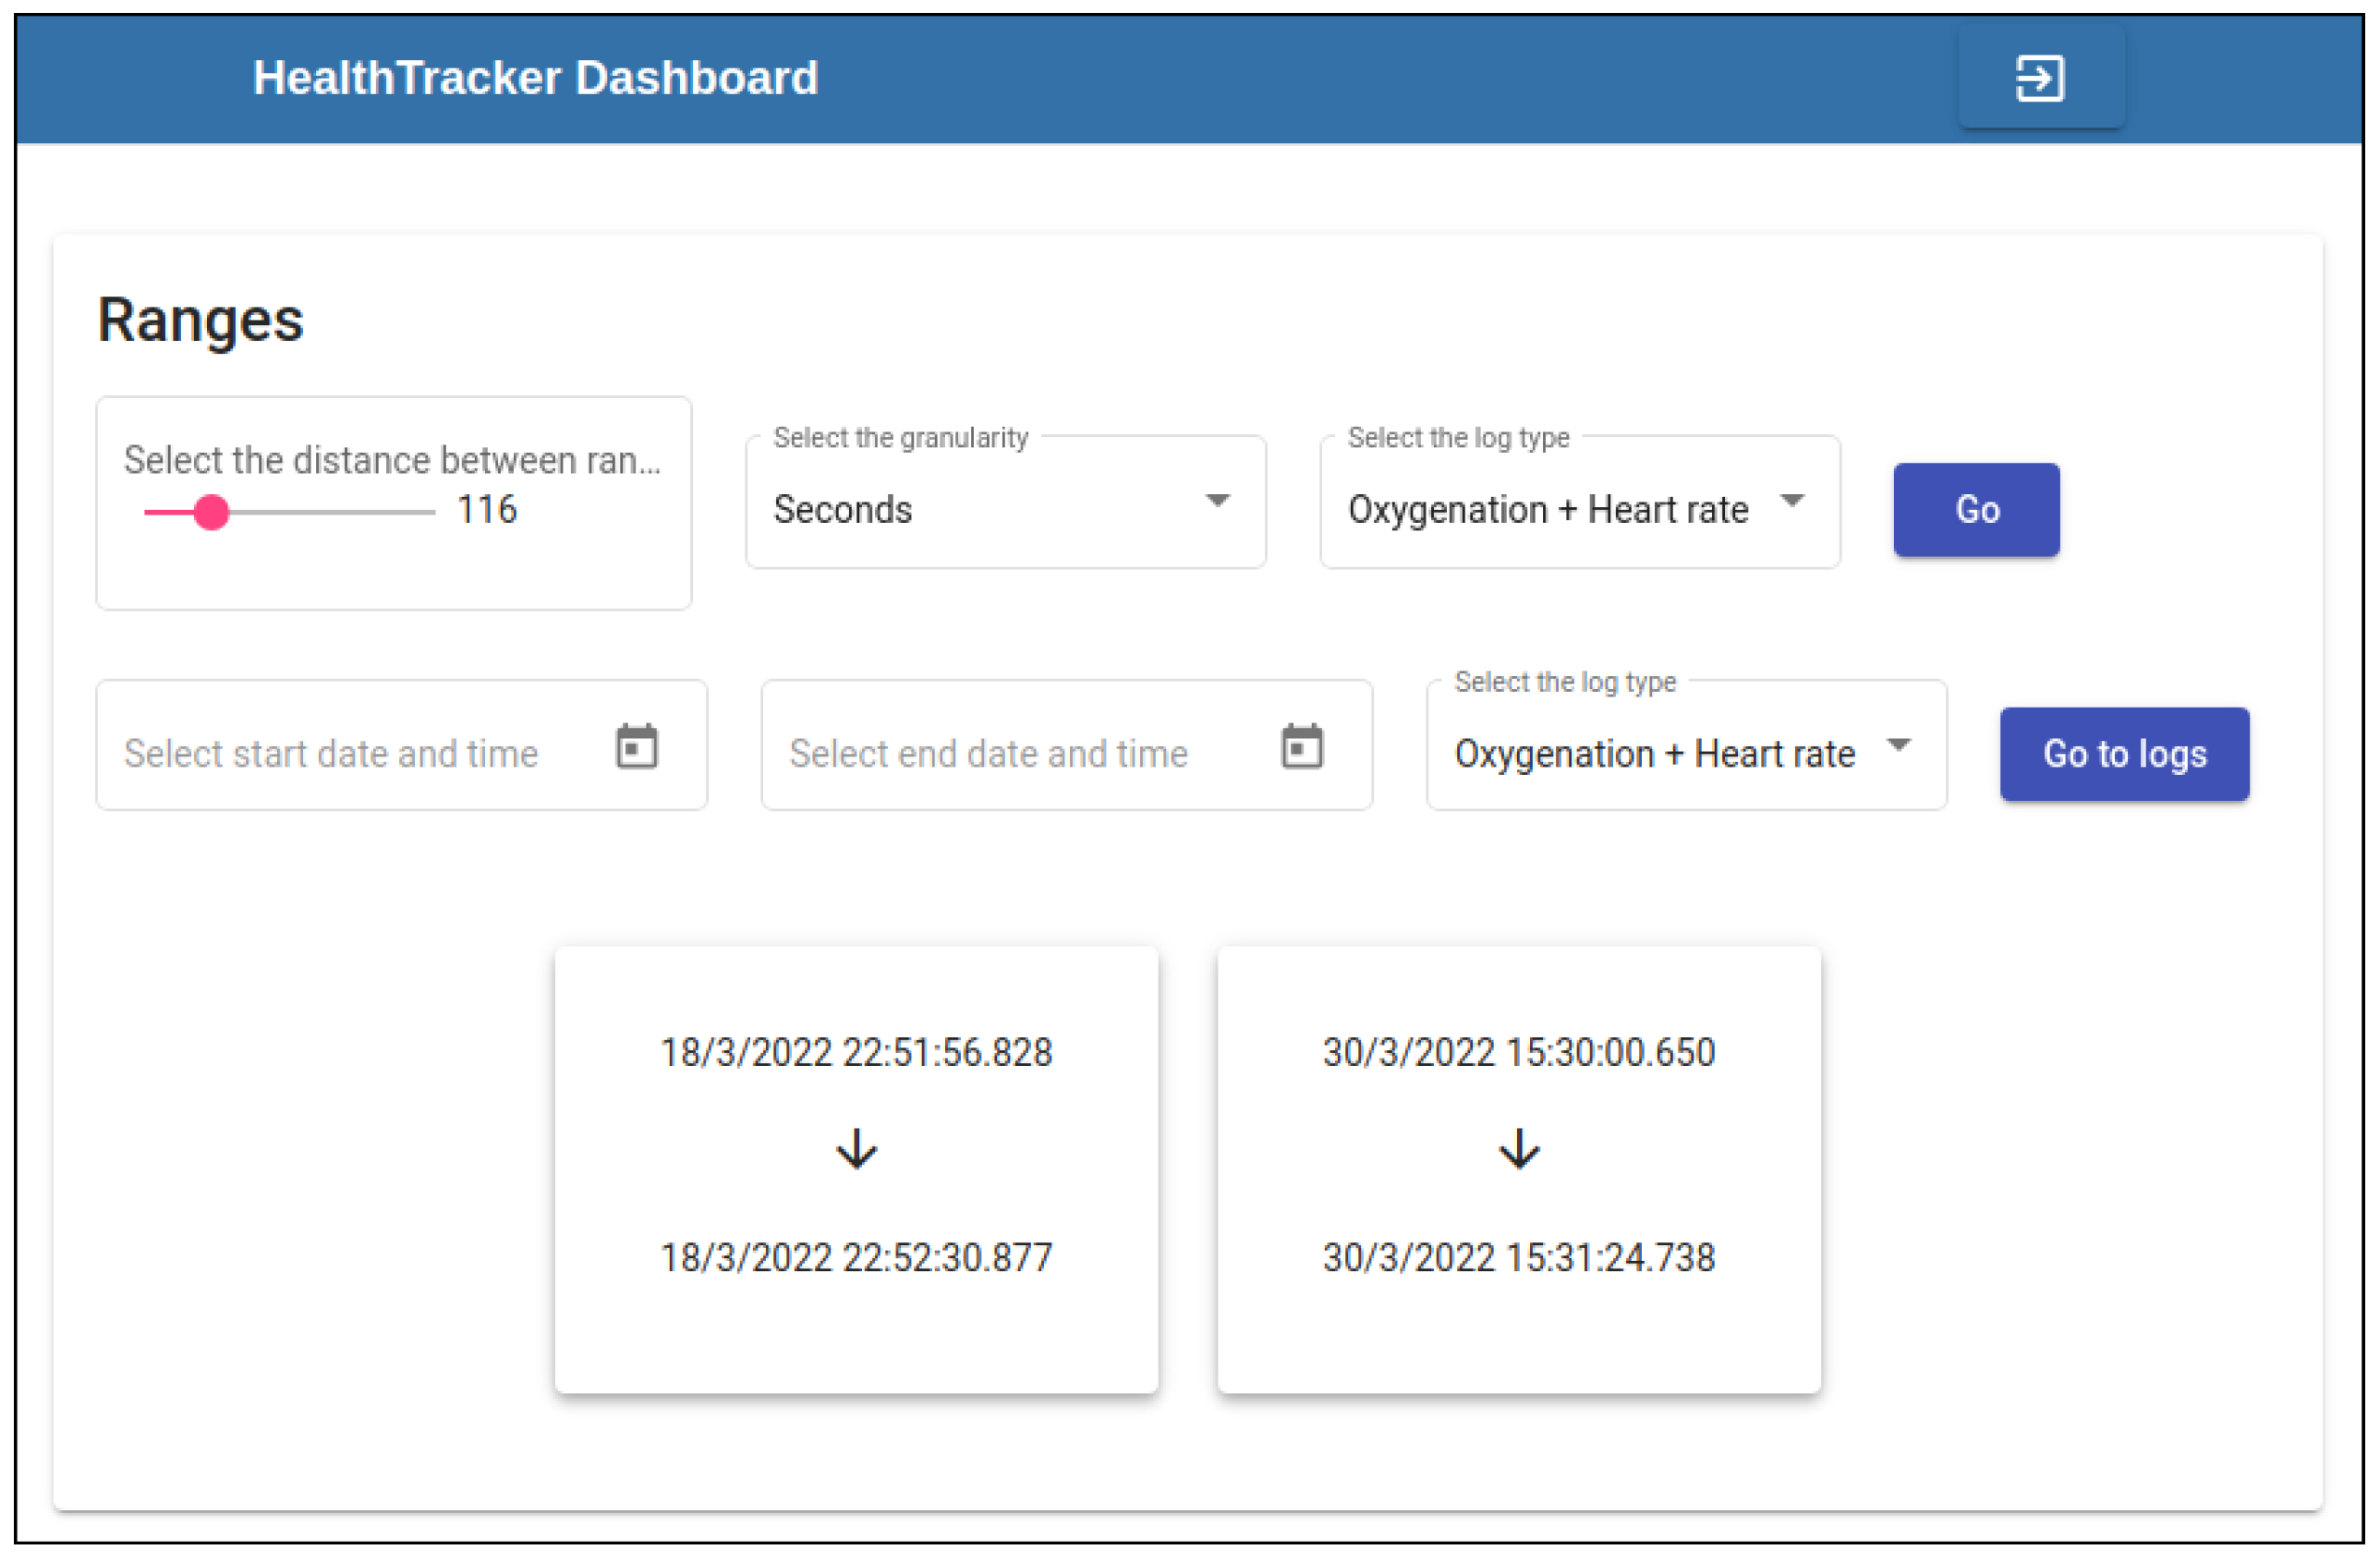
After the user has been authenticated by the system (through direct authentication with the Firebase Authenticator and consequential authorization managed by the HealthTracker Admin server), the dashboard shows its Ranges page (see Figure 10) which allows the selection of the time series of interest, the type of data to display among those stored in that time series (accelerometer, gyroscope, magnetometer/temperature, blood oxygenation, and heartbeat, etc.) and the time sub-interval of that series to consider.
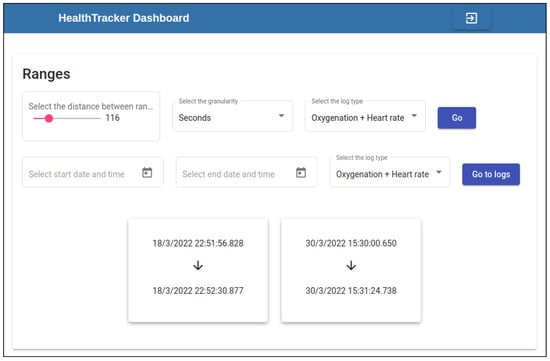
Figure 10.
The HealthTracker dashboard page where the logs produced by a specific user can be summarized in configurable time intervals.
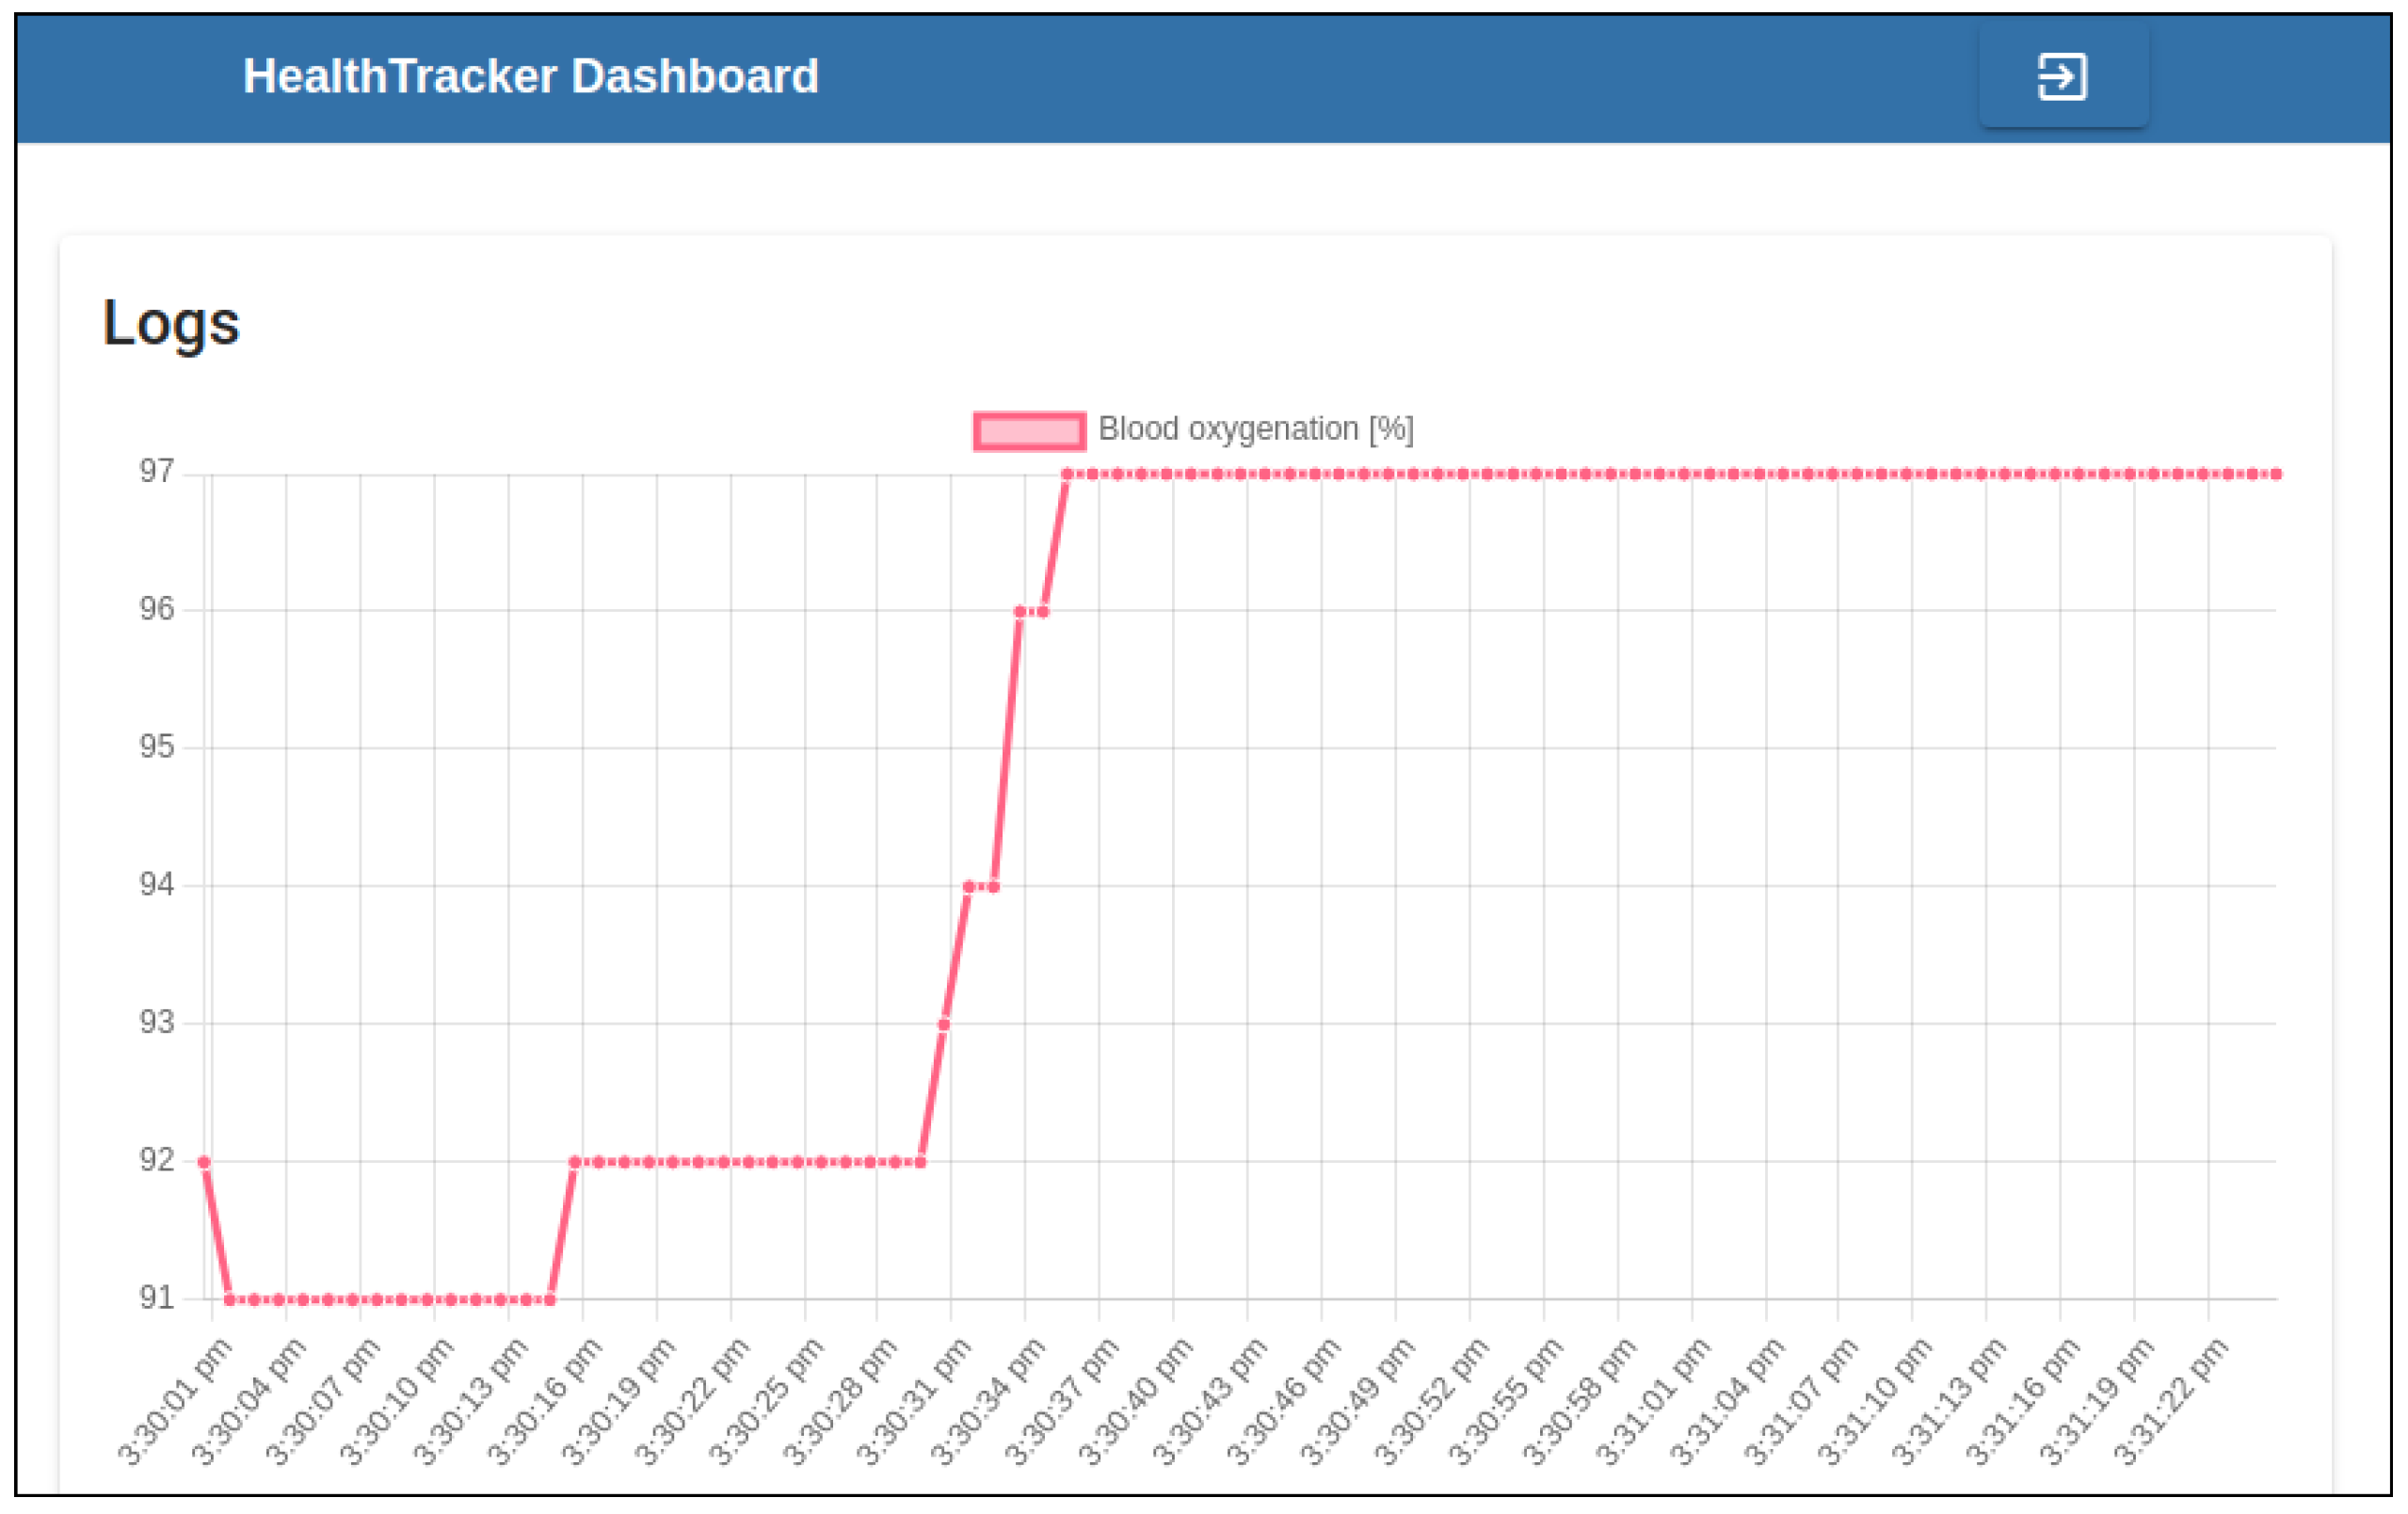
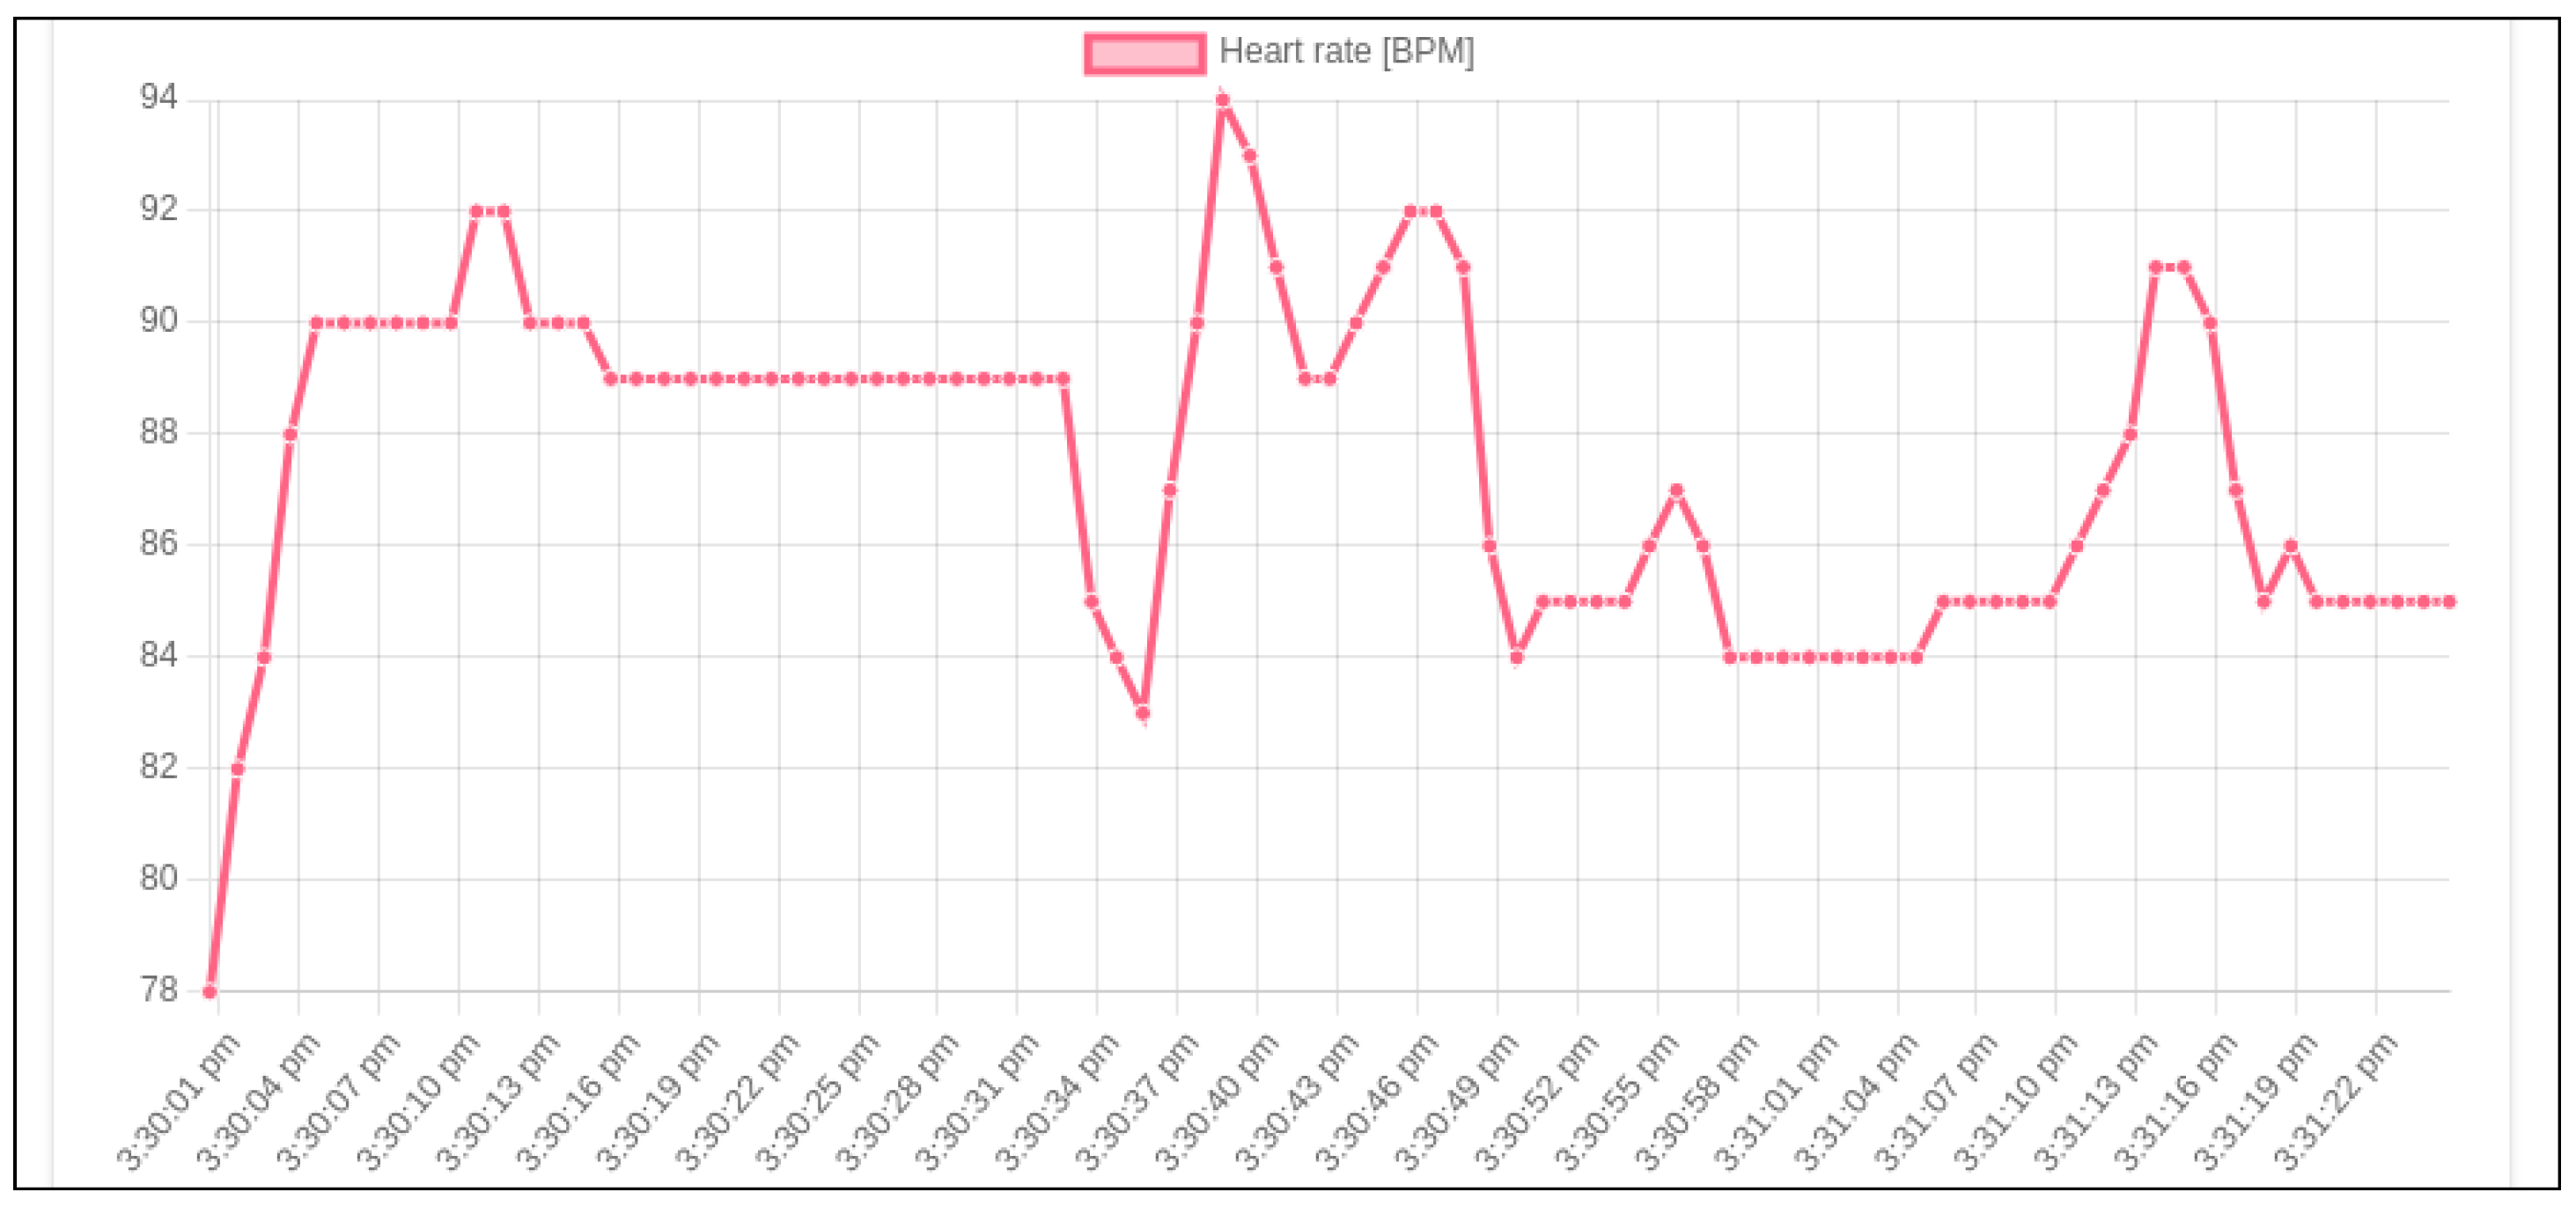
After these parameters have been set, the dashboard visualizes the data in a scatter plot, which shows, in the x-axis, the time of the collection of each data point. For instance, the data plot related to blood oxygenation for a specific user is reported in Figure 11, while the one related to the heartbeat rate is shown in Figure 12. As a future extension, this application could be enriched with further data visualization tools and other metrics useful to keep track of the user’s upload compliance. In our prototype, this dashboard has been deployed on a dyno container managed by the Heroku Cloud Platform.
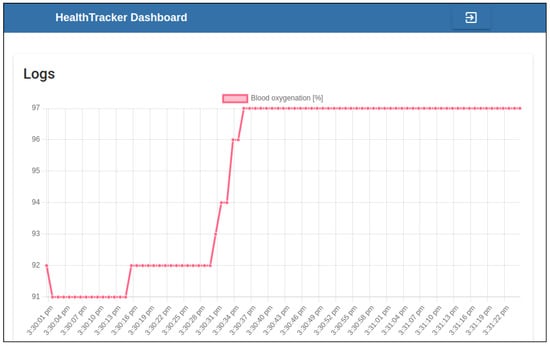
Figure 11.
The HealthTracker dashboard page where the blood oxygenation logs produced by a specific user in the selected time interval can be visualized.
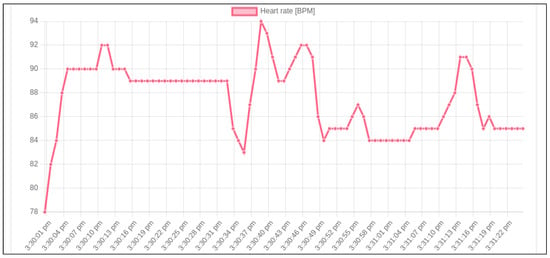
Figure 12.
The HealthTracker dashboard page where the heart rate logs produced by a specific user in the selected time interval can be visualized.
7. Conclusions
Telemedicine plays a pivotal role in improving healthcare accessibility by enabling remote consultations, ensuring that individuals, regardless of their geographical location, can receive timely medical advice and treatment.
It also increases patient convenience by reducing the need for physical visits to healthcare facilities, therefore saving time and minimizing the risk of exposure to contagious diseases. As a matter of fact, telemedicine has proven crucial during public health crises, such as the COVID-19 pandemic, by facilitating safe and efficient healthcare delivery while reducing the burden on overstretched healthcare systems.
In this paper, we presented a system called HealthTracker which has been specifically designed and implemented to support telemedicine by enabling facilities to collect data generated by health-monitoring devices, store them securely in the cloud, and analyze them with advanced algorithms for both statistical analysis and future trend predictions.
HealthTracker is composed of both software and hardware components that seamlessly interact to provide the above functionalities. A significant part of our research effort has focused on designing and constructing a new health-monitoring wearable device equipped with a set of innovative sensors that have never been implemented together in a single device before.
Preliminary tests have shown that the system works well and that it is ready for real experimentation that will start soon. This experimentation is already planned as part of a joint project that will involve the Department of Translational Medicine of the University of Eastern Piedmont (DIMET-UPO) and the Hospital of Alessandria—Respiratory Diseases ward. In this real experimentation, we will also be able to explore the potential limitations of our study. In particular, some issues related to technical problems or human behavior can occur, as discussed below.
Concerning the technical issue, the devices need a smartphone with a working Internet connection: if an Internet connection is not available, both devices have an internal memory able to store data for no more than about 2.5 h for the HDC device and about 40 h for the Viatom Checkme O2 device. If an Internet connection is not recovered within these limits, then data will be lost after this period.
Concerning human behavior issues, devices work if the patients wear them correctly and as long as possible. This means that the experimentation needs an active collaboration of the patients during the study. Moreover, devices need to be charged when the residual batter capacity is lower than 15%. This means that nurses must take care of the devices by checking both that they are worn correctly by the patients and that they always have a residual battery level above 15%.
This study will pursue several goals, namely:
- it will perform safety and functionality validation tests in accordance with IEC 62304 (that is, a functional safety standard that covers safe design and maintenance of software specific for medical devices [37]) and IEC 60601-2-49 standard (which applies to the basic safety and essential performance requirements of multifunction patient monitoring equipment [38]);
- it will evaluate the calibration of the response and cross-check the validity of the data on patients at Alessandria’s hospital;
- it will assess the ease of use of the wearable device and the software interfaces according to the IEC 62304 standard;
- it will assess the safety of the user interface according to the IEC 62366 standard (specifies a process for a manufacturer to analyze, specify, develop, and evaluate the usability of a medical device as it relates to safety [39]);
- it will consider further application aspects for the National Health Service, such as the reimbursement of the device.
In future work, we plan to perform a quantitative comparison analysis of the HDC device with other potentially similar devices. However, since, to the best of our knowledge, our device is currently the only health-monitoring wearable device that integrates all the sensors described in this paper, in the experimental comparison, we will consider similar devices that integrate only a subset of the sensors available in our device.
Also, we plan to equip the HDC device with a plug-in battery to make its battery easier to replace when it is approaching the end of life and an optional GSM module to be used in place of the built-in BLE module when the primary wireless network connection is not available (neither between the device and the smartphone nor between the smartphone and the Internet) so as to make the device more robust to data loss due to network issues (The main reasons for keeping the GSM module optional is that GSM modules tend to be more expensive and to consume more power than BLE modules [40,41]).
Finally, we plan to complete the evaluation of alternative solutions to MongoDB, as discussed in Section 6.3, in order to provide database encryption without having to pay a commercial license.
As a final consideration, we believe that our system can enhance the level of telemedicine by allowing remote follow-up of patients and critical emergency structures to be able to respond proactively to critical issues.
Author Contributions
Conceptualization and methodology, C.A., M.C. and M.G.; software F.D. and D.S. All authors have read and agreed to the published version of the manuscript.
Funding
This paper is part of the project NODES, which has received funding from the MUR-M4C2 1.5 of PNRR funded by the European Union-NextGenerationEU (Grant agreement no. ECS00000036). This research was also partly supported by the INdAM-GNCS Project 2023.
Institutional Review Board Statement
Not applicable.
Informed Consent Statement
Not applicable.
Data Availability Statement
Data is contained within the article.
Conflicts of Interest
The authors declare no conflicts of interest.
References
- Bashshur, R.L.; Doarn, C.R.; Frenk, J.M.; Kvedar, J.C.; Woolliscroft, J.O.; Yellowlees, P.M. Telemedicine and the COVID-19 Pandemic, Lessons for the Future. Telemed. E-Health 2020, 26, 571–573. [Google Scholar] [CrossRef]
- Mahajan, V.; Singh, T.; Azad, C. Using telemedicine during the COVID-19 pandemic. Indian Pediatr. 2020, 57, 658–661. [Google Scholar] [CrossRef]
- Hau, Y.S.; Kim, J.K.; Hur, J.; Chang, M.C. How about actively using telemedicine during the COVID-19 pandemic? J. Med Syst. 2020, 44, 1–2. [Google Scholar] [CrossRef] [PubMed]
- Whitten, P.; Holtz, B. Provider utilization of telemedicine: The elephant in the room. Telemed. E-Health 2008, 14, 995–997. [Google Scholar] [CrossRef] [PubMed]
- Wosik, J.; Fudim, M.; Cameron, B.; Gellad, Z.F.; Cho, A.; Phinney, D.; Curtis, S.; Roman, M.; Poon, E.G.; Ferranti, J.; et al. Telehealth transformation: COVID-19 and the rise of virtual care. J. Am. Med Inform. Assoc. 2020, 27, 957–962. [Google Scholar] [CrossRef]
- Aghdam, M.R.F.; Vodovnik, A.; Hameed, R.A. Role of Telemedicine in Multidisciplinary Team Meetings. J. Pathol. Inform. 2019, 10, 35. [Google Scholar] [CrossRef] [PubMed]
- Lane, J.E.; Shivers, J.P.; Zisser, H. Continuous glucose monitors: Current status and future developments. Curr. Opin. Endocrinol. Diabetes Obes. 2013, 20, 106–111. [Google Scholar] [CrossRef] [PubMed]
- Rajkomar, A.; Oren, E.; Dai, K. Scalable and accurate deep learning with electronic health records. NPJ Digit. Med. 2019, 1, 18. [Google Scholar] [CrossRef] [PubMed]
- Mohamed, W.; Abdellatif, M.M. Telemedicine: An IoT application for healthcare systems. In Proceedings of the 8th International Conference on Software and Information Engineering, Cairo, Egypt, 9–12 April 2019; pp. 173–177. [Google Scholar]
- Sonune, S.; Kalbande, D.; Yeole, A.; Oak, S. Issues in IoT healthcare platforms: A critical study and review. In Proceedings of the 2017 International Conference on Intelligent Computing and Control (I2C2), Coimbatore, India, 23–24 June 2017; IEEE: Piscataway, NJ, USA, 2017; pp. 1–5. [Google Scholar]
- Li, C.; Wang, J.; Wang, S.; Zhang, Y. A review of IoT applications in healthcare. Neurocomputing 2024, 565, 127017. [Google Scholar] [CrossRef]
- Petruzzi, M.; De Benedittis, M. WhatsApp: A telemedicine platform for facilitating remote oral medicine consultation and improving clinical examinations. Oral Surg. Oral Med. Oral Pathol. Oral Radiol. 2016, 121, 248–254. [Google Scholar] [CrossRef] [PubMed]
- Brauchli, K.; Oberholzer, M. The iPath telemedicine platform. J. Telemed. Telecare 2005, 11, 3–7. [Google Scholar] [CrossRef] [PubMed]
- Raj, C.; Jain, C.; Arif, W. HEMAN: Health monitoring and nous: An IoT based e-health care system for remote telemedicine. In Proceedings of the 2017 International Conference on Wireless Communications, Signal Processing and Networking (WiSPNET), Chennai, India, 22–24 March 2017; pp. 2115–2119. [Google Scholar] [CrossRef]
- Newman, S. Building Microservices: Designing Fine-Grained Systems, 2nd ed.; O’Reilly Media, Inc.: Sebastopol, CA, USA, 2021. [Google Scholar]
- Hardt, D. RFC 6749: The OAuth 2.0 Authorization Framework. RFC 6749, 2012. Available online: https://auth0.com/docs/authenticate/protocols/oauth (accessed on 17 January 2024).
- Bluetooth® Technology Website. GATT. 2023. Available online: https://www.bluetooth.com/specifications/specs/gatt-specification-supplement/ (accessed on 17 January 2024).
- STMicroelectronics. Discovery Kit IoT Node. 2023. Available online: https://www.st.com/en/evaluation-tools/b-l475e-iot01a.html (accessed on 17 January 2024).
- Perez, A.J.; Zeadally, S. Recent Advances in Wearable Sensing Technologies. Sensors 2021, 21, 6828. [Google Scholar] [CrossRef] [PubMed]
- Apple Inc. Apple Watch Series 9. 2023. Available online: https://www.apple.com/apple-watch-series-9/ (accessed on 17 January 2024).
- Garmin Ltd. Garmin Venu 3. 2023. Available online: https://www.garmin.com/en-US/p/873008 (accessed on 17 January 2024).
- Google LLC. Google Pixel Watch 2. 2023. Available online: https://store.google.com/us/product/pixel_watch_2_specs?hl=en-US (accessed on 17 January 2024).
- Samsung Electronics Co., Ltd. Samsung Galaxy Watch6. 2023. Available online: https://www.samsung.com/us/watches/galaxy-watch6/buy/?modelCode=SM-R960NZKAXAA (accessed on 17 January 2024).
- Monge-Álvarez, J.; Hoyos-Barceló, C.; Dahal, K.; de-la Higuera, P.C. Audio-cough event detection based on moment theory. Appl. Acoust. 2018, 135, 124–135. [Google Scholar] [CrossRef]
- Pavlov, K.; Perchik, A.; Tsepulin, V.; Megre, G.; Nikolaev, E.; Volkova, E.; Nigmatulin, G.; Park, J.; Chang, N.; Lee, W.; et al. Sweat Loss Estimation Algorithm for Smartwatches. IEEE Access 2023, 11, 23926–23934. [Google Scholar] [CrossRef]
- Jasen, S.; Nastasi, E.; Ghanim, S. Predicting Sleep-Disordered Breathing Using Deep Learning Algorithms. In Cutting-Edge Business Technologies in the Big Data Era; Yaseen, S.G., Ed.; Springer Nature: Cham, Switzerland, 2023; pp. 1–9. [Google Scholar]
- Mcgurrin, P.; Mcnames, J.; Wu, T.; Hallett, M.; Haubenberger, D. Quantifying Tremor in Essential Tremor Using Inertial Sensors—Validation of an Algorithm. IEEE J. Transl. Eng. Health Med. 2021, 9, 1–10. [Google Scholar] [CrossRef]
- Google. Android Studio. 2023. Available online: https://developer.android.com/studio/releases (accessed on 17 January 2024).
- Moroney, L.; Moroney, L. Using authentication in firebase. In The Definitive Guide to Firebase: Build Android Apps on Google’s Mobile Platform; Apress: New York, NY, USA, 2017; pp. 25–50. [Google Scholar]
- Satheesh, M.; D’mello, B.J.; Krol, J. Web Development with MongoDB and NodeJs; Packt Publishing Ltd.: Birmingham, UK, 2015. [Google Scholar]
- OpenJS Foundation Website. Express. 2023. Available online: https://expressjs.com/ (accessed on 17 January 2024).
- OpenJS Foundation Website. Multer. 2023. Available online: http://expressjs.com/en/resources/middleware/multer.html (accessed on 17 January 2024).
- Dustin Kirkland. eCryptfs: The Enterprise Cryptographic Filesystem for LINUX. 2020. Available online: https://www.ecryptfs.org/ (accessed on 17 January 2024).
- Burkhalter, L.; Hithnawi, A.; Viand, A.; Shafagh, H.; Ratnasamy, S. TimeCrypt: Encrypted Data Stream Processing at Scale with Cryptographic Access Control. In Proceedings of the 17th USENIX Symposium on Networked Systems Design and Implementation (NSDI 20), Santa Clara, CA, USA, 25–27 February 2020; USENIX Association: Berkeley, CA, USA, 2020; pp. 835–850. [Google Scholar]
- Dauterman, E.; Rathee, M.; Popa, R.A.; Stoica, I. Waldo: A Private Time-Series Database from Function Secret Sharing. In Proceedings of the 2022 IEEE Symposium on Security and Privacy (SP), San Francisco, CA, USA, 23–26 May 2022; pp. 2450–2468. [Google Scholar]
- Keahey, K.; Anderson, J.; Zhen, Z.; Riteau, P.; Ruth, P.; Stanzione, D.; Cevik, M.; Colleran, J.; Gunawi, H.S.; Hammock, C.; et al. Lessons Learned from the Chameleon Testbed. In Proceedings of the 2020 USENIX Annual Technical Conference (USENIX ATC ’20), virtual, 15–17 July 2020; USENIX Association: Berkeley, CA, USA, 2020. [Google Scholar]
- Jordan, P. Standard IEC 62304-Medical Device Software-Software Lifecycle Processes; IET: Malmo, Sweden, 2006. [Google Scholar]
- Woehrle, D. Experts debate international alarm standards: Changes to the alarm standard are crucial to ensure patient safety. Biomed. Instrum. Technol. 2011, 45, 61–65. [Google Scholar] [CrossRef] [PubMed]
- Bras Da Costa, S.; Beuscart-Zéphir, M.C.; Bastien, J.; Pelayo, S. Usability and safety of software medical devices: Need for multidisciplinary expertise to apply the IEC 62366: 2007. In MEDINFO 2015: eHealth-Enabled Health; IOS Press: Clifton, VA, USA, 2015; pp. 353–357. [Google Scholar]
- Carroll, A.; Heiser, G. An Analysis of Power Consumption in a Smartphone. In Proceedings of the 2010 USENIX Conference on USENIX Annual Technical Conference, USENIXATC’10, Boston, MA, USA, 23–25 June 2010; p. 21. [Google Scholar]
- Pramanik, P.K.D.; Sinhababu, N.; Mukherjee, B.; Padmanaban, S.; Maity, A.; Upadhyaya, B.K.; Holm-Nielsen, J.B.; Choudhury, P. Power Consumption Analysis, Measurement, Management, and Issues: A State-of-the-Art Review of Smartphone Battery and Energy Usage. IEEE Access 2019, 7, 182113–182172. [Google Scholar] [CrossRef]
Disclaimer/Publisher’s Note: The statements, opinions and data contained in all publications are solely those of the individual author(s) and contributor(s) and not of MDPI and/or the editor(s). MDPI and/or the editor(s) disclaim responsibility for any injury to people or property resulting from any ideas, methods, instructions or products referred to in the content. |
© 2024 by the authors. Licensee MDPI, Basel, Switzerland. This article is an open access article distributed under the terms and conditions of the Creative Commons Attribution (CC BY) license (https://creativecommons.org/licenses/by/4.0/).

