

Electroencephalography (EEG)-Based Comfort Evaluation of Free-Form and Regular-Form Landscapes in Virtual Reality


Abstract
1. Introduction
1.1. Research Background
1.2. EEG Signals and Related Theoretical Research
2. Experimental Methods and Design
2.1. Design and Experimental Video
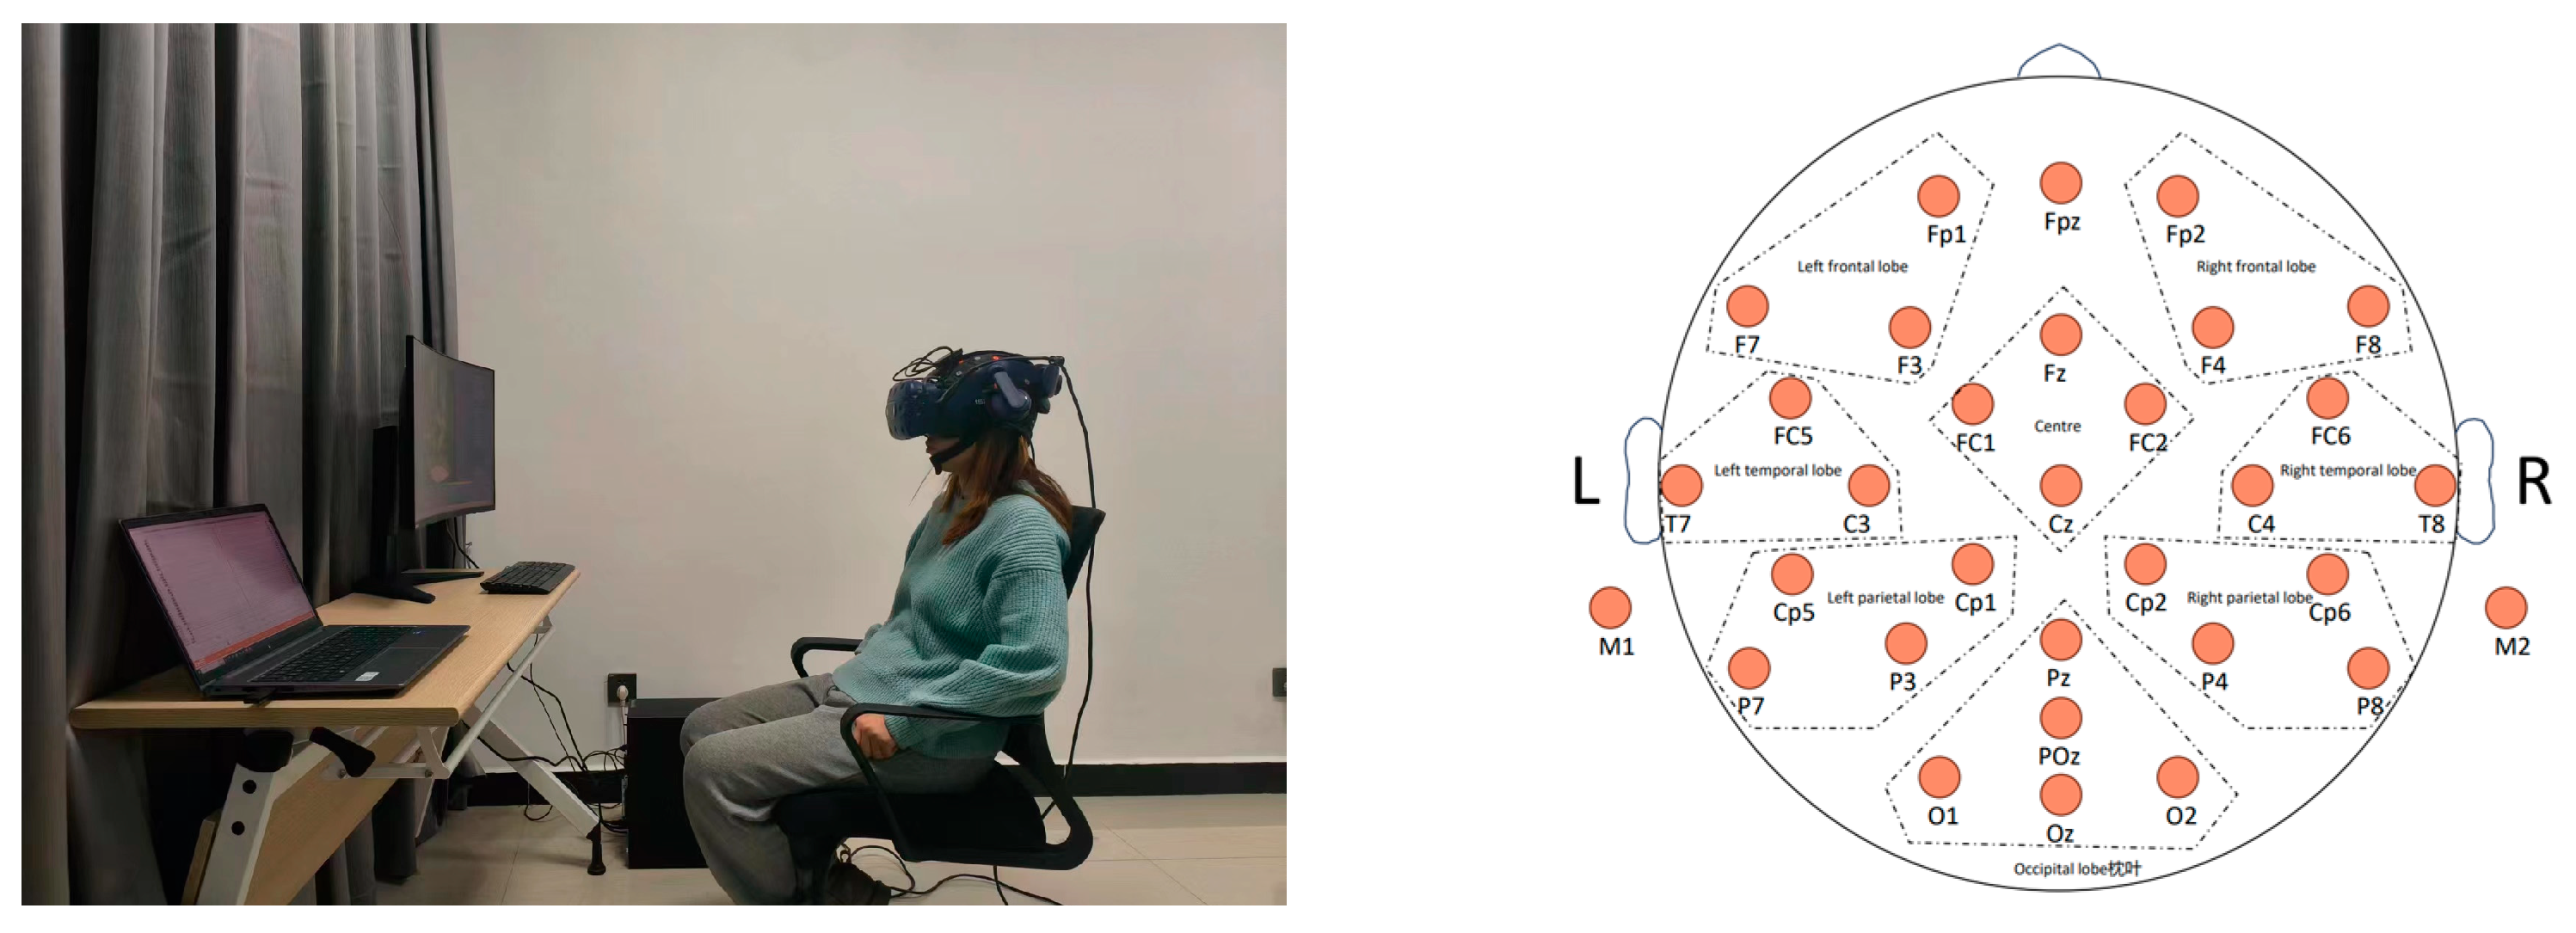
2.2. Experimental Materials
2.3. Participant Selection
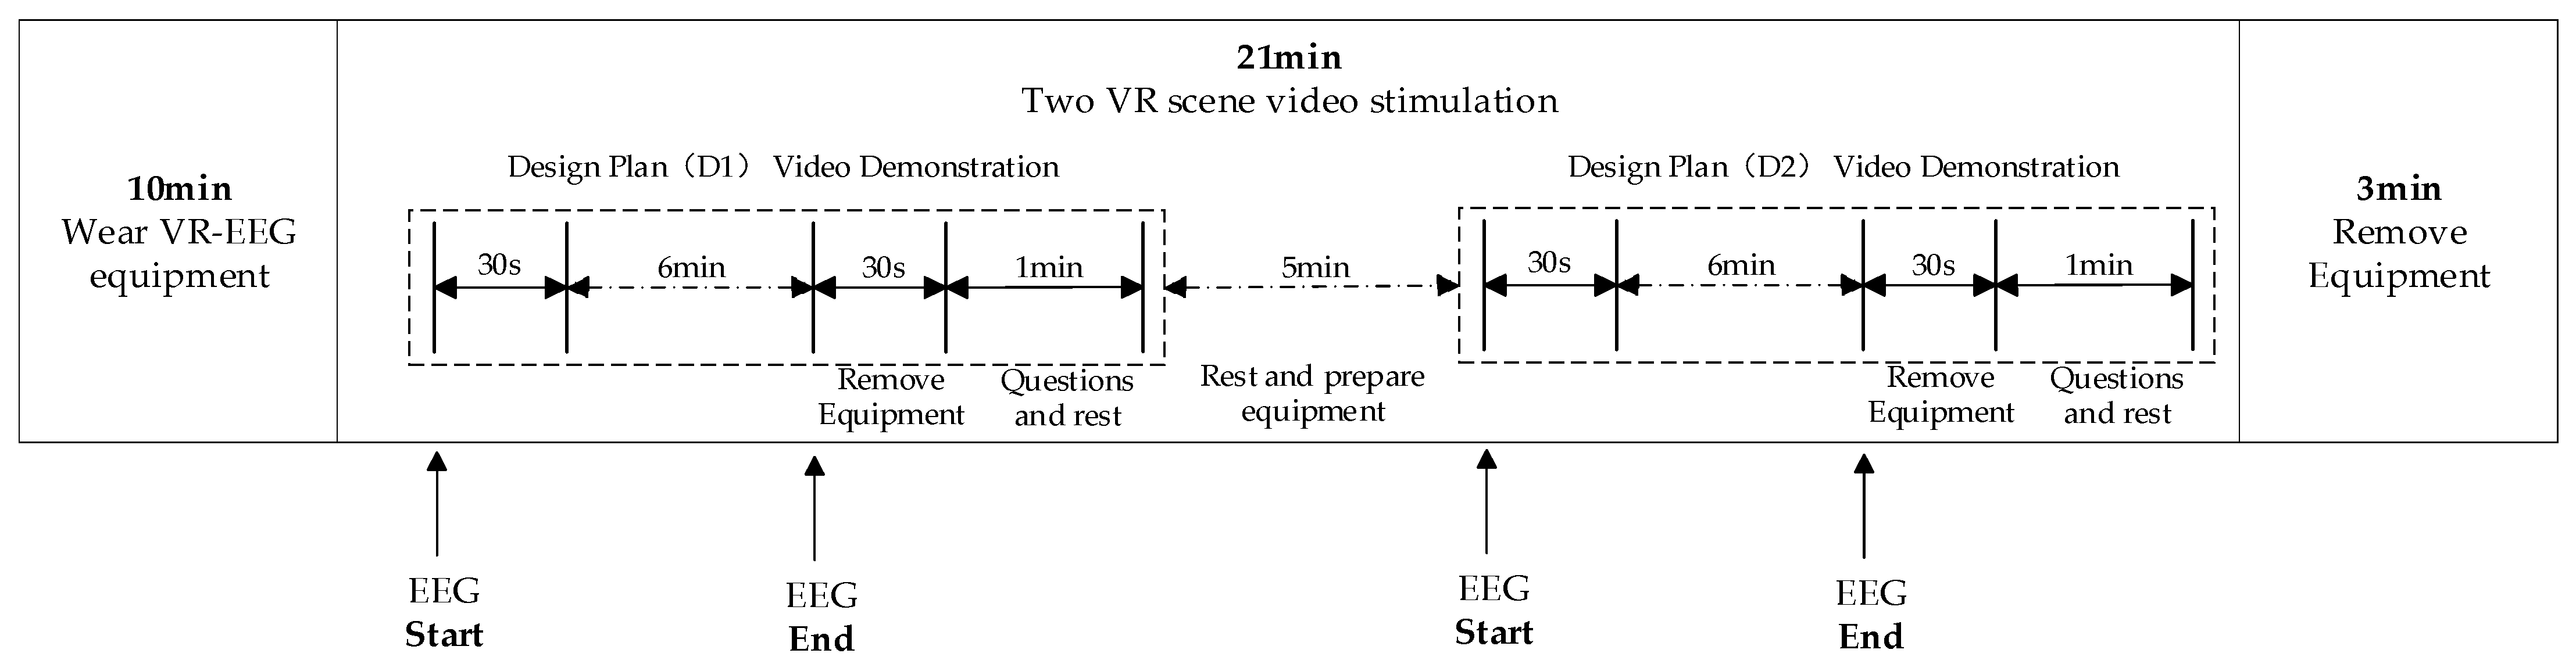
2.4. Experimental procedure
3. Results
3.1. Analytical Method
3.2. EEG Analysis Results
3.2.1. Individual Participant EEG Data Analysis
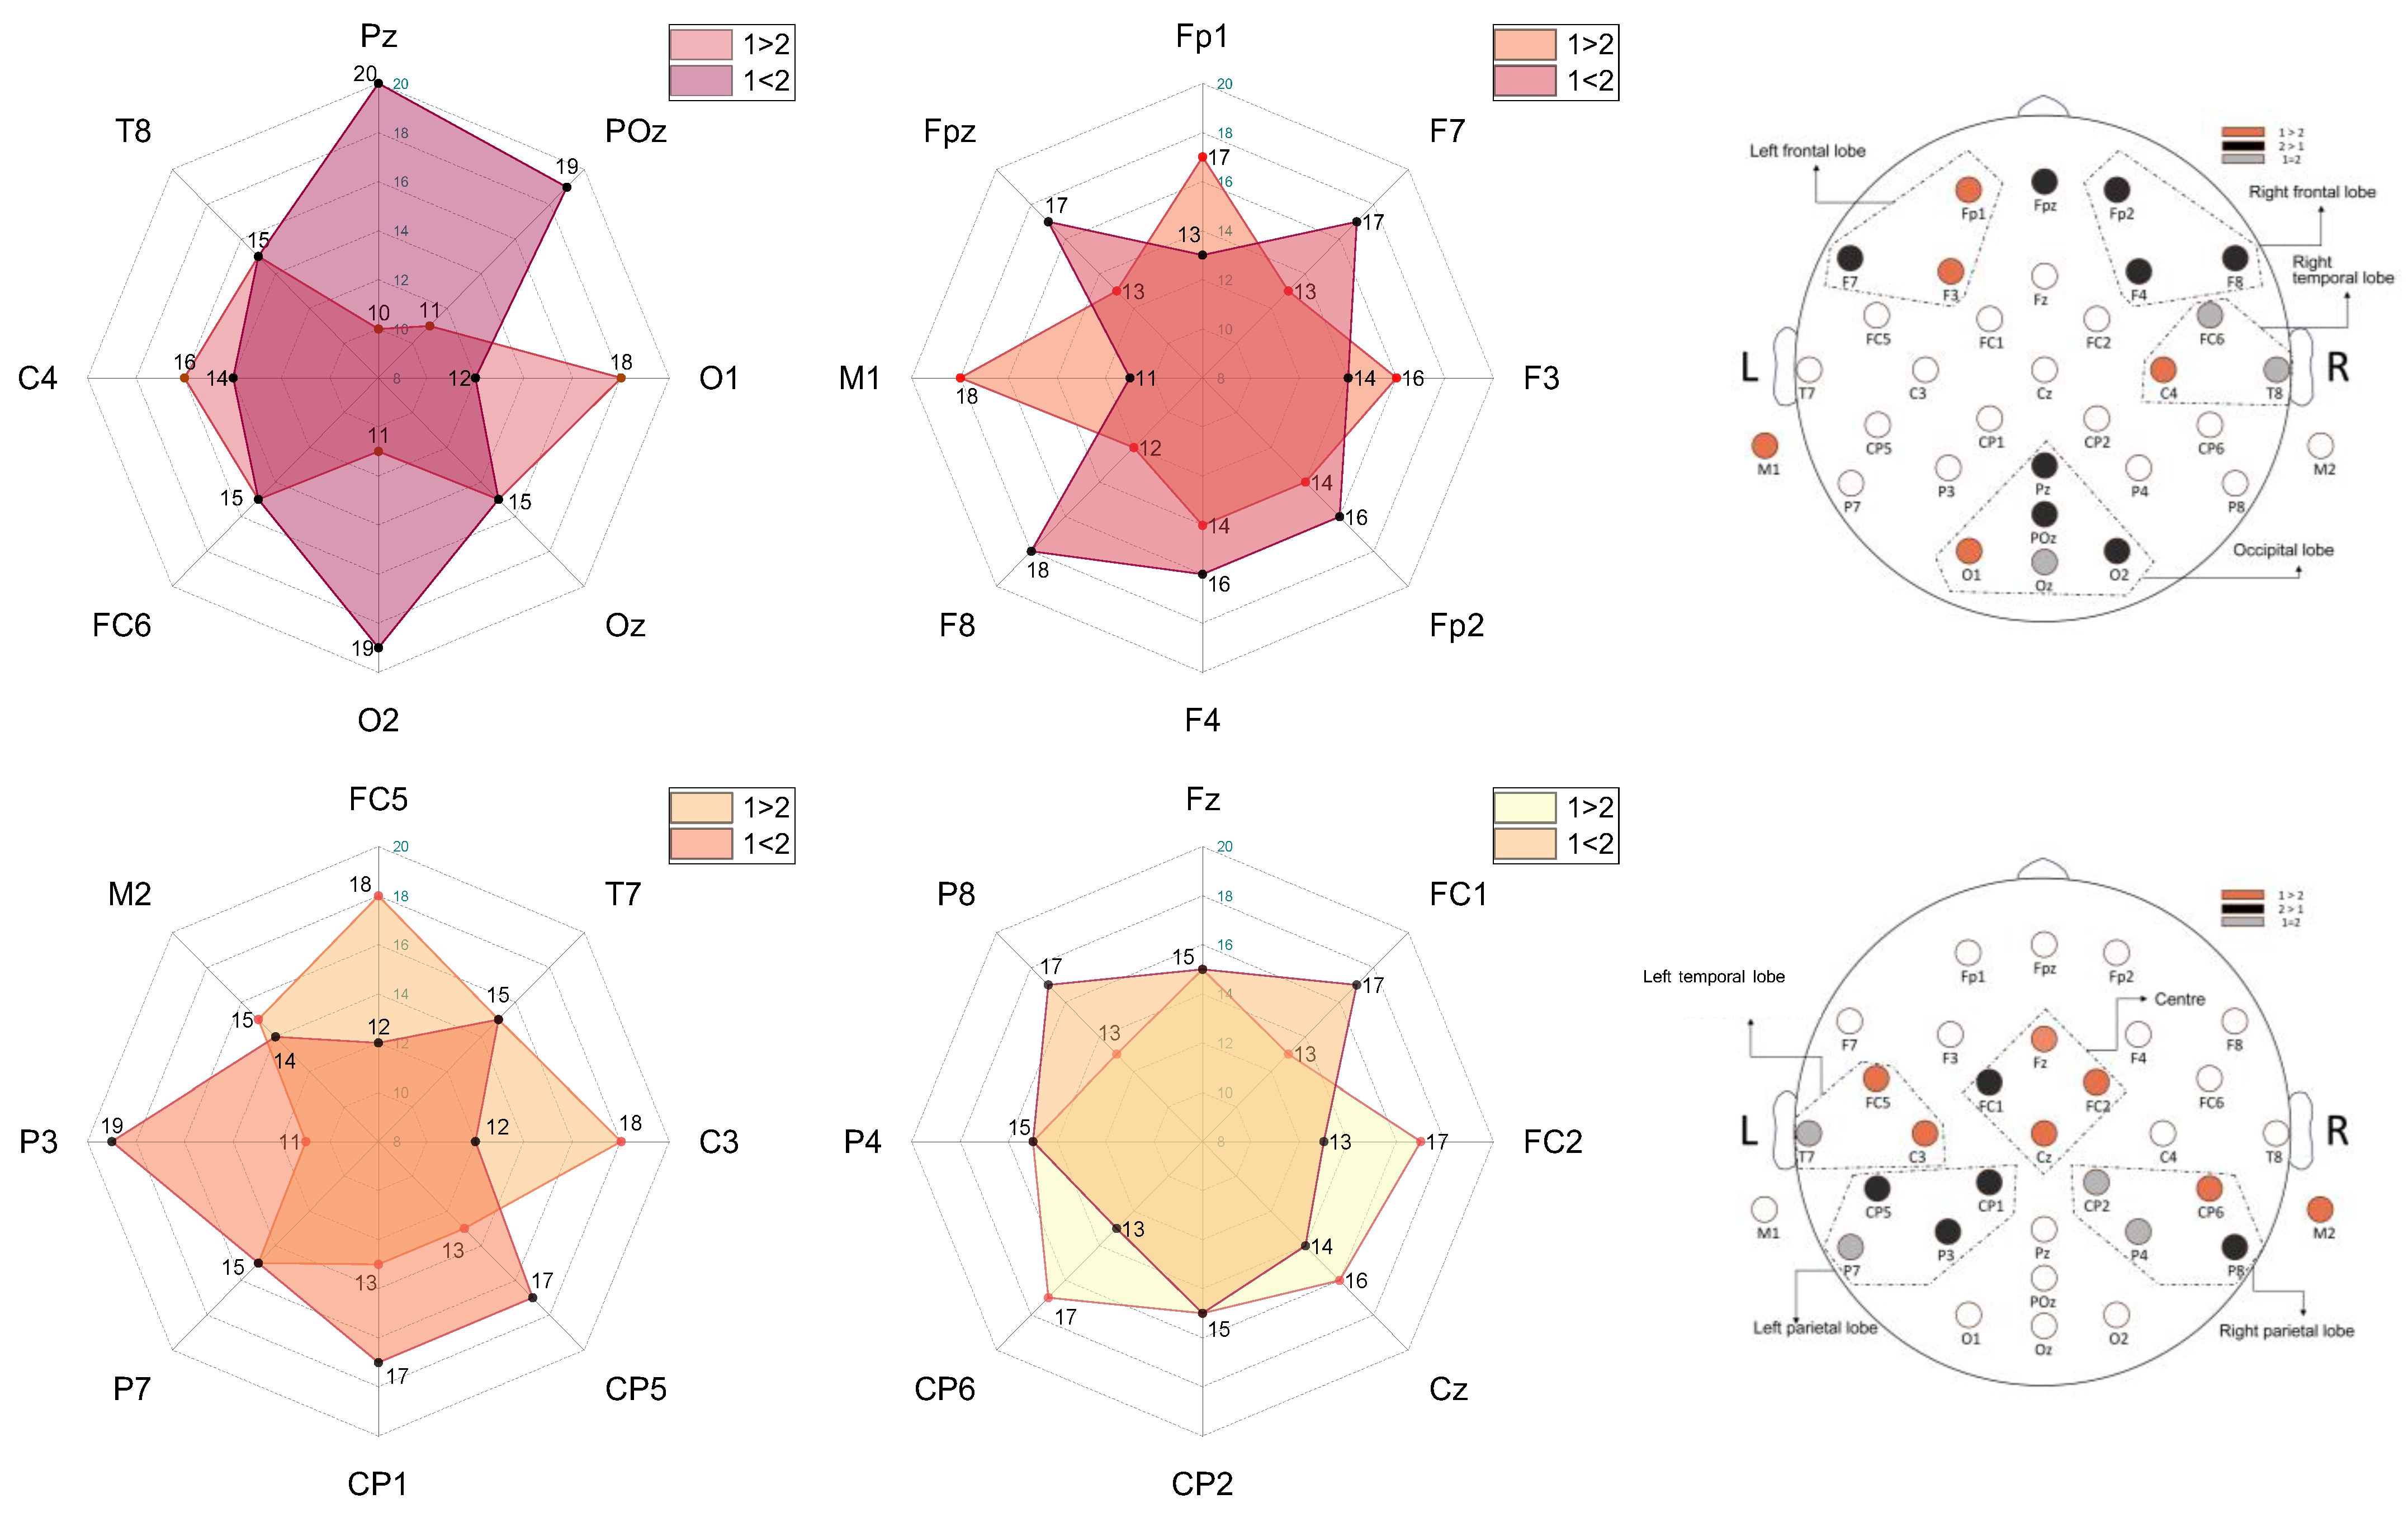
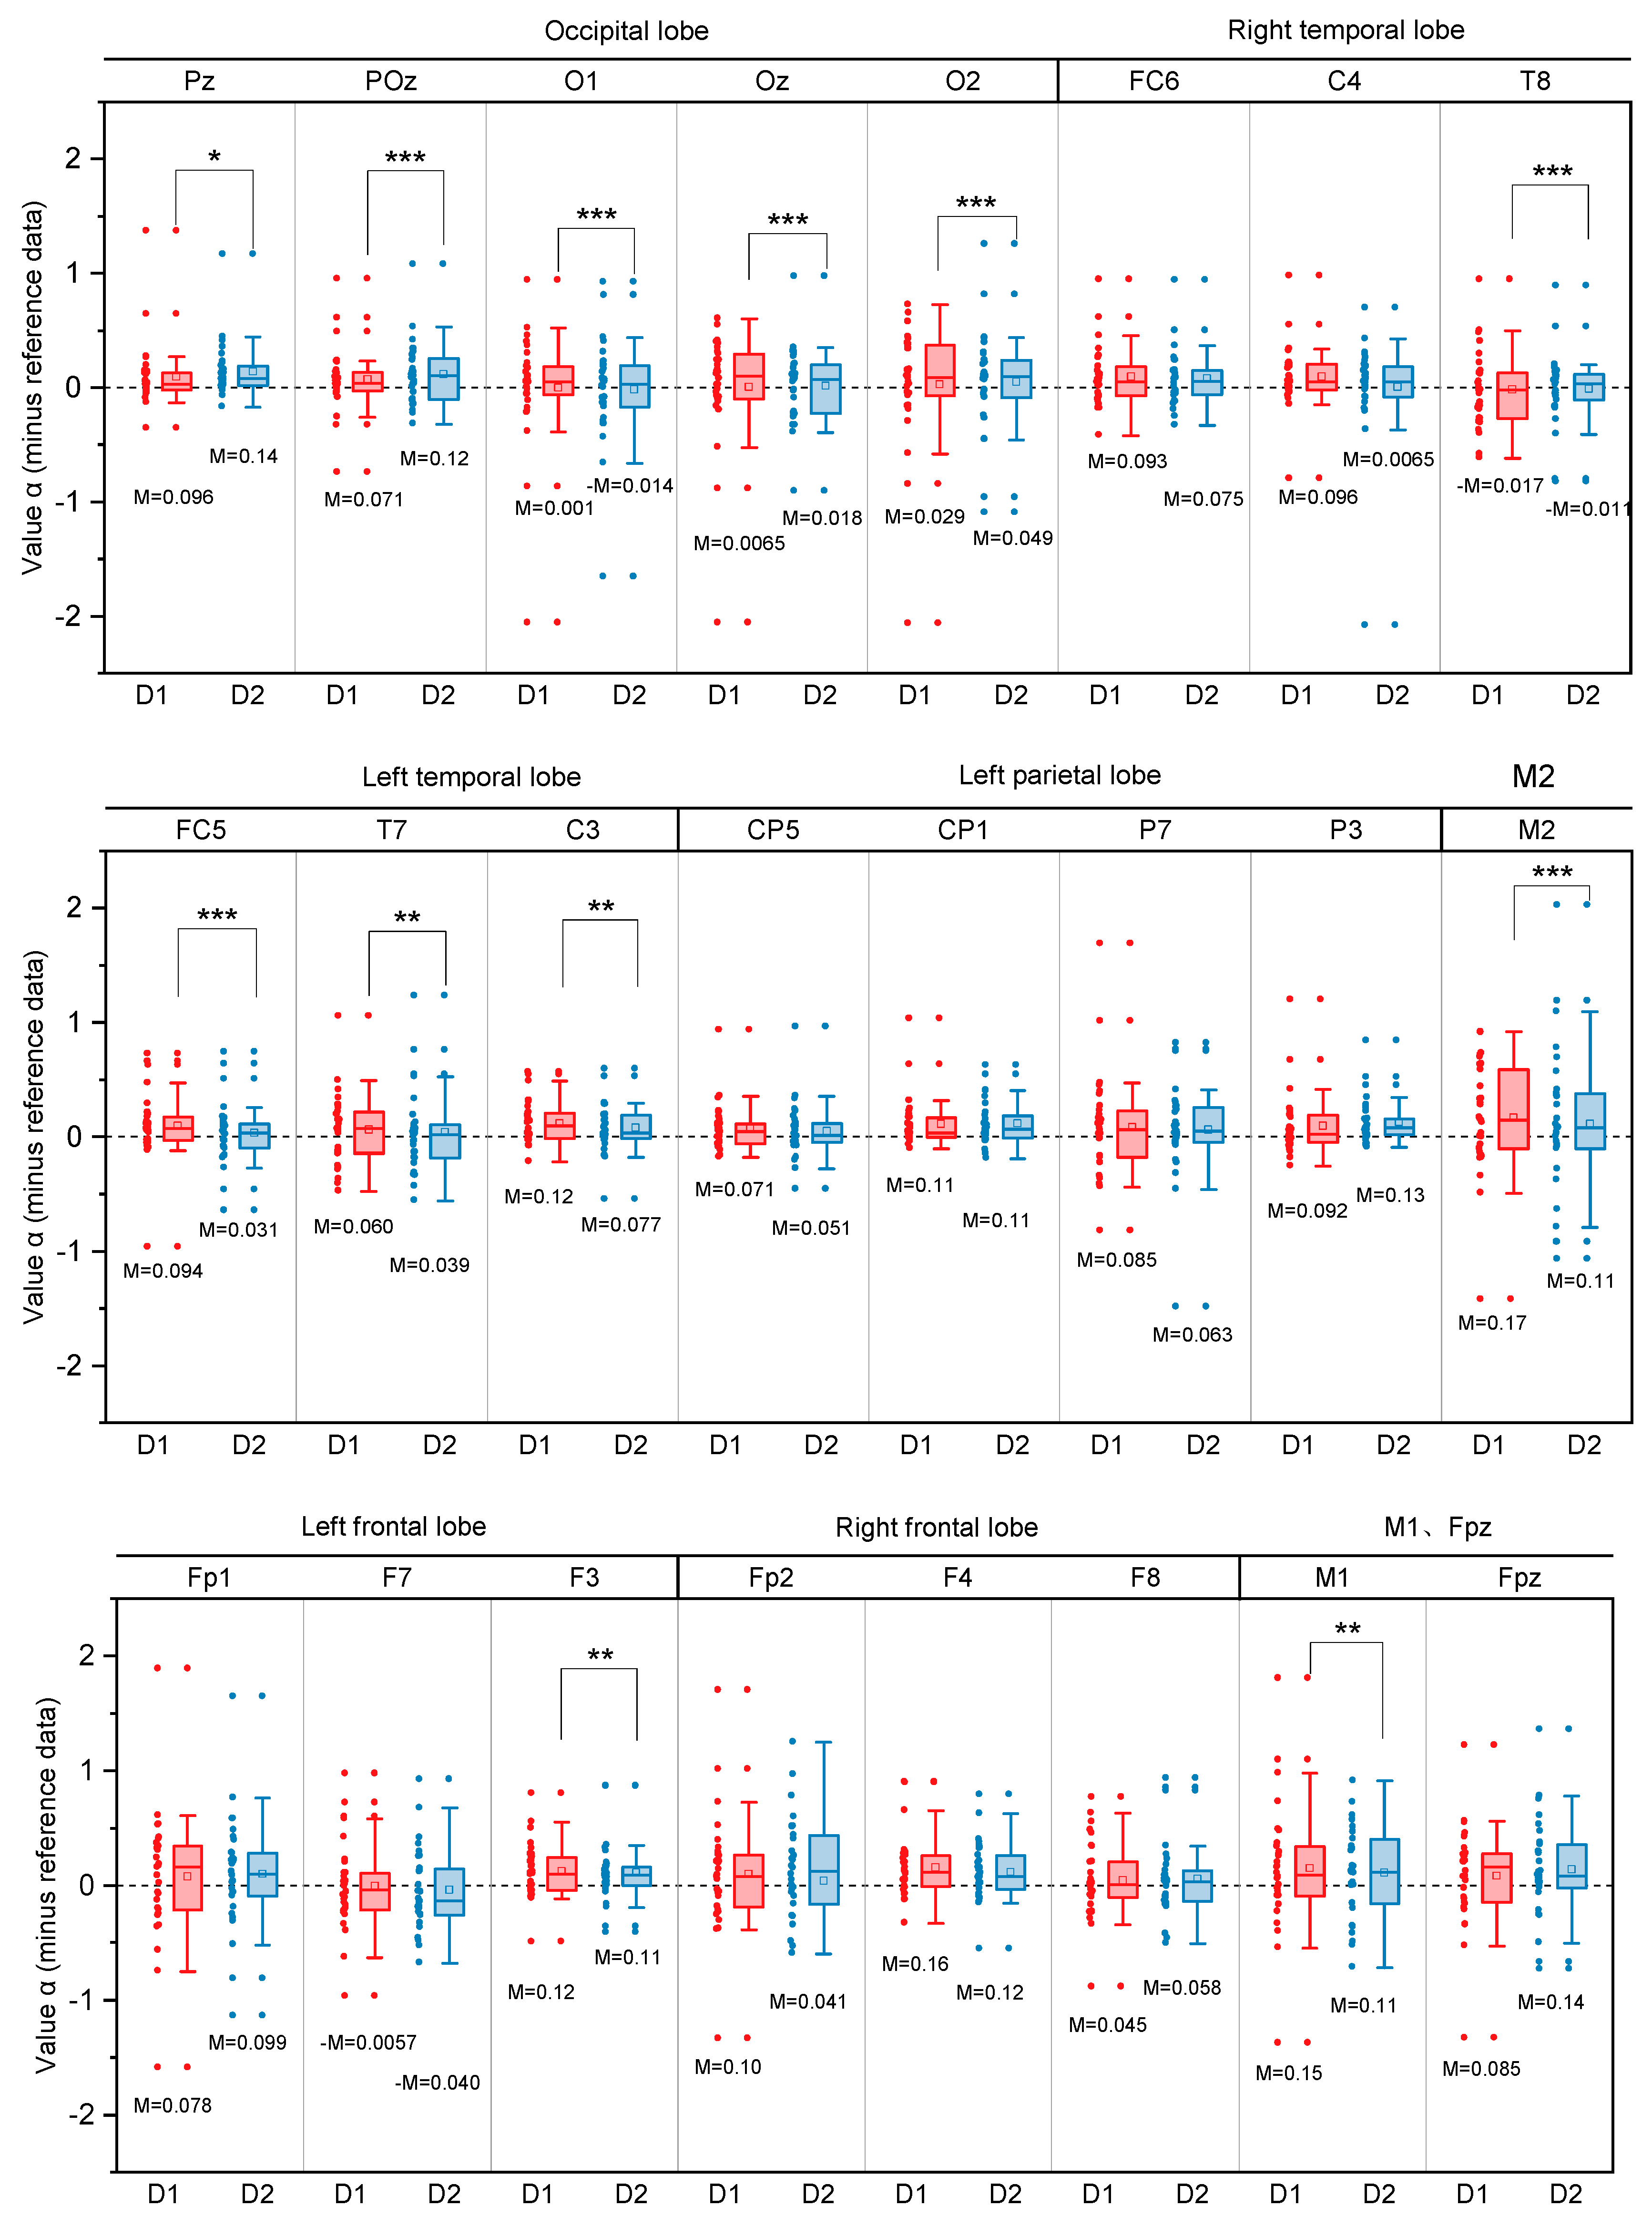
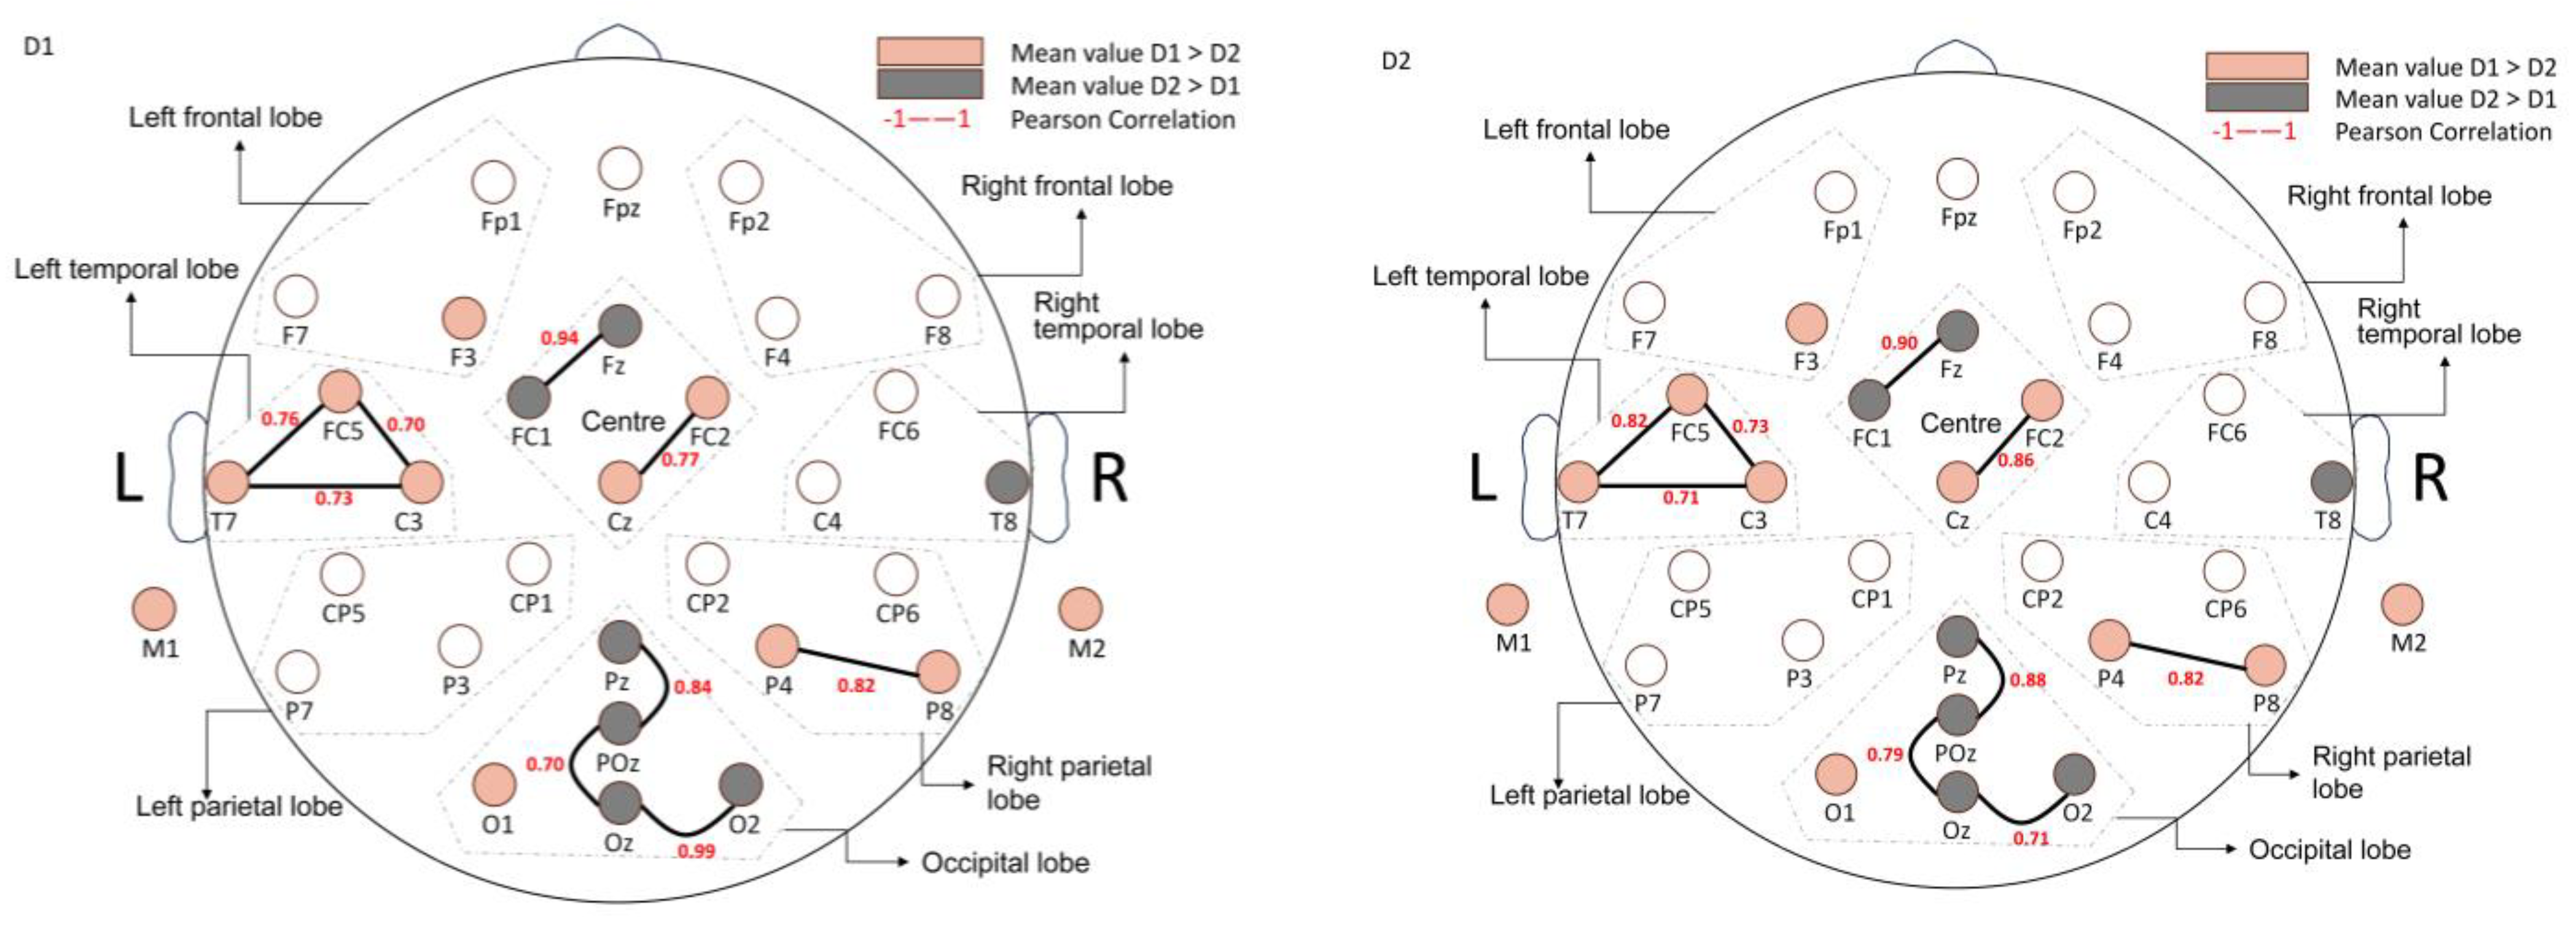
3.2.2. Comparison of α Values of Electrodes in Design D1 and D2
3.2.3. Individual Participant EEG Data Analysis
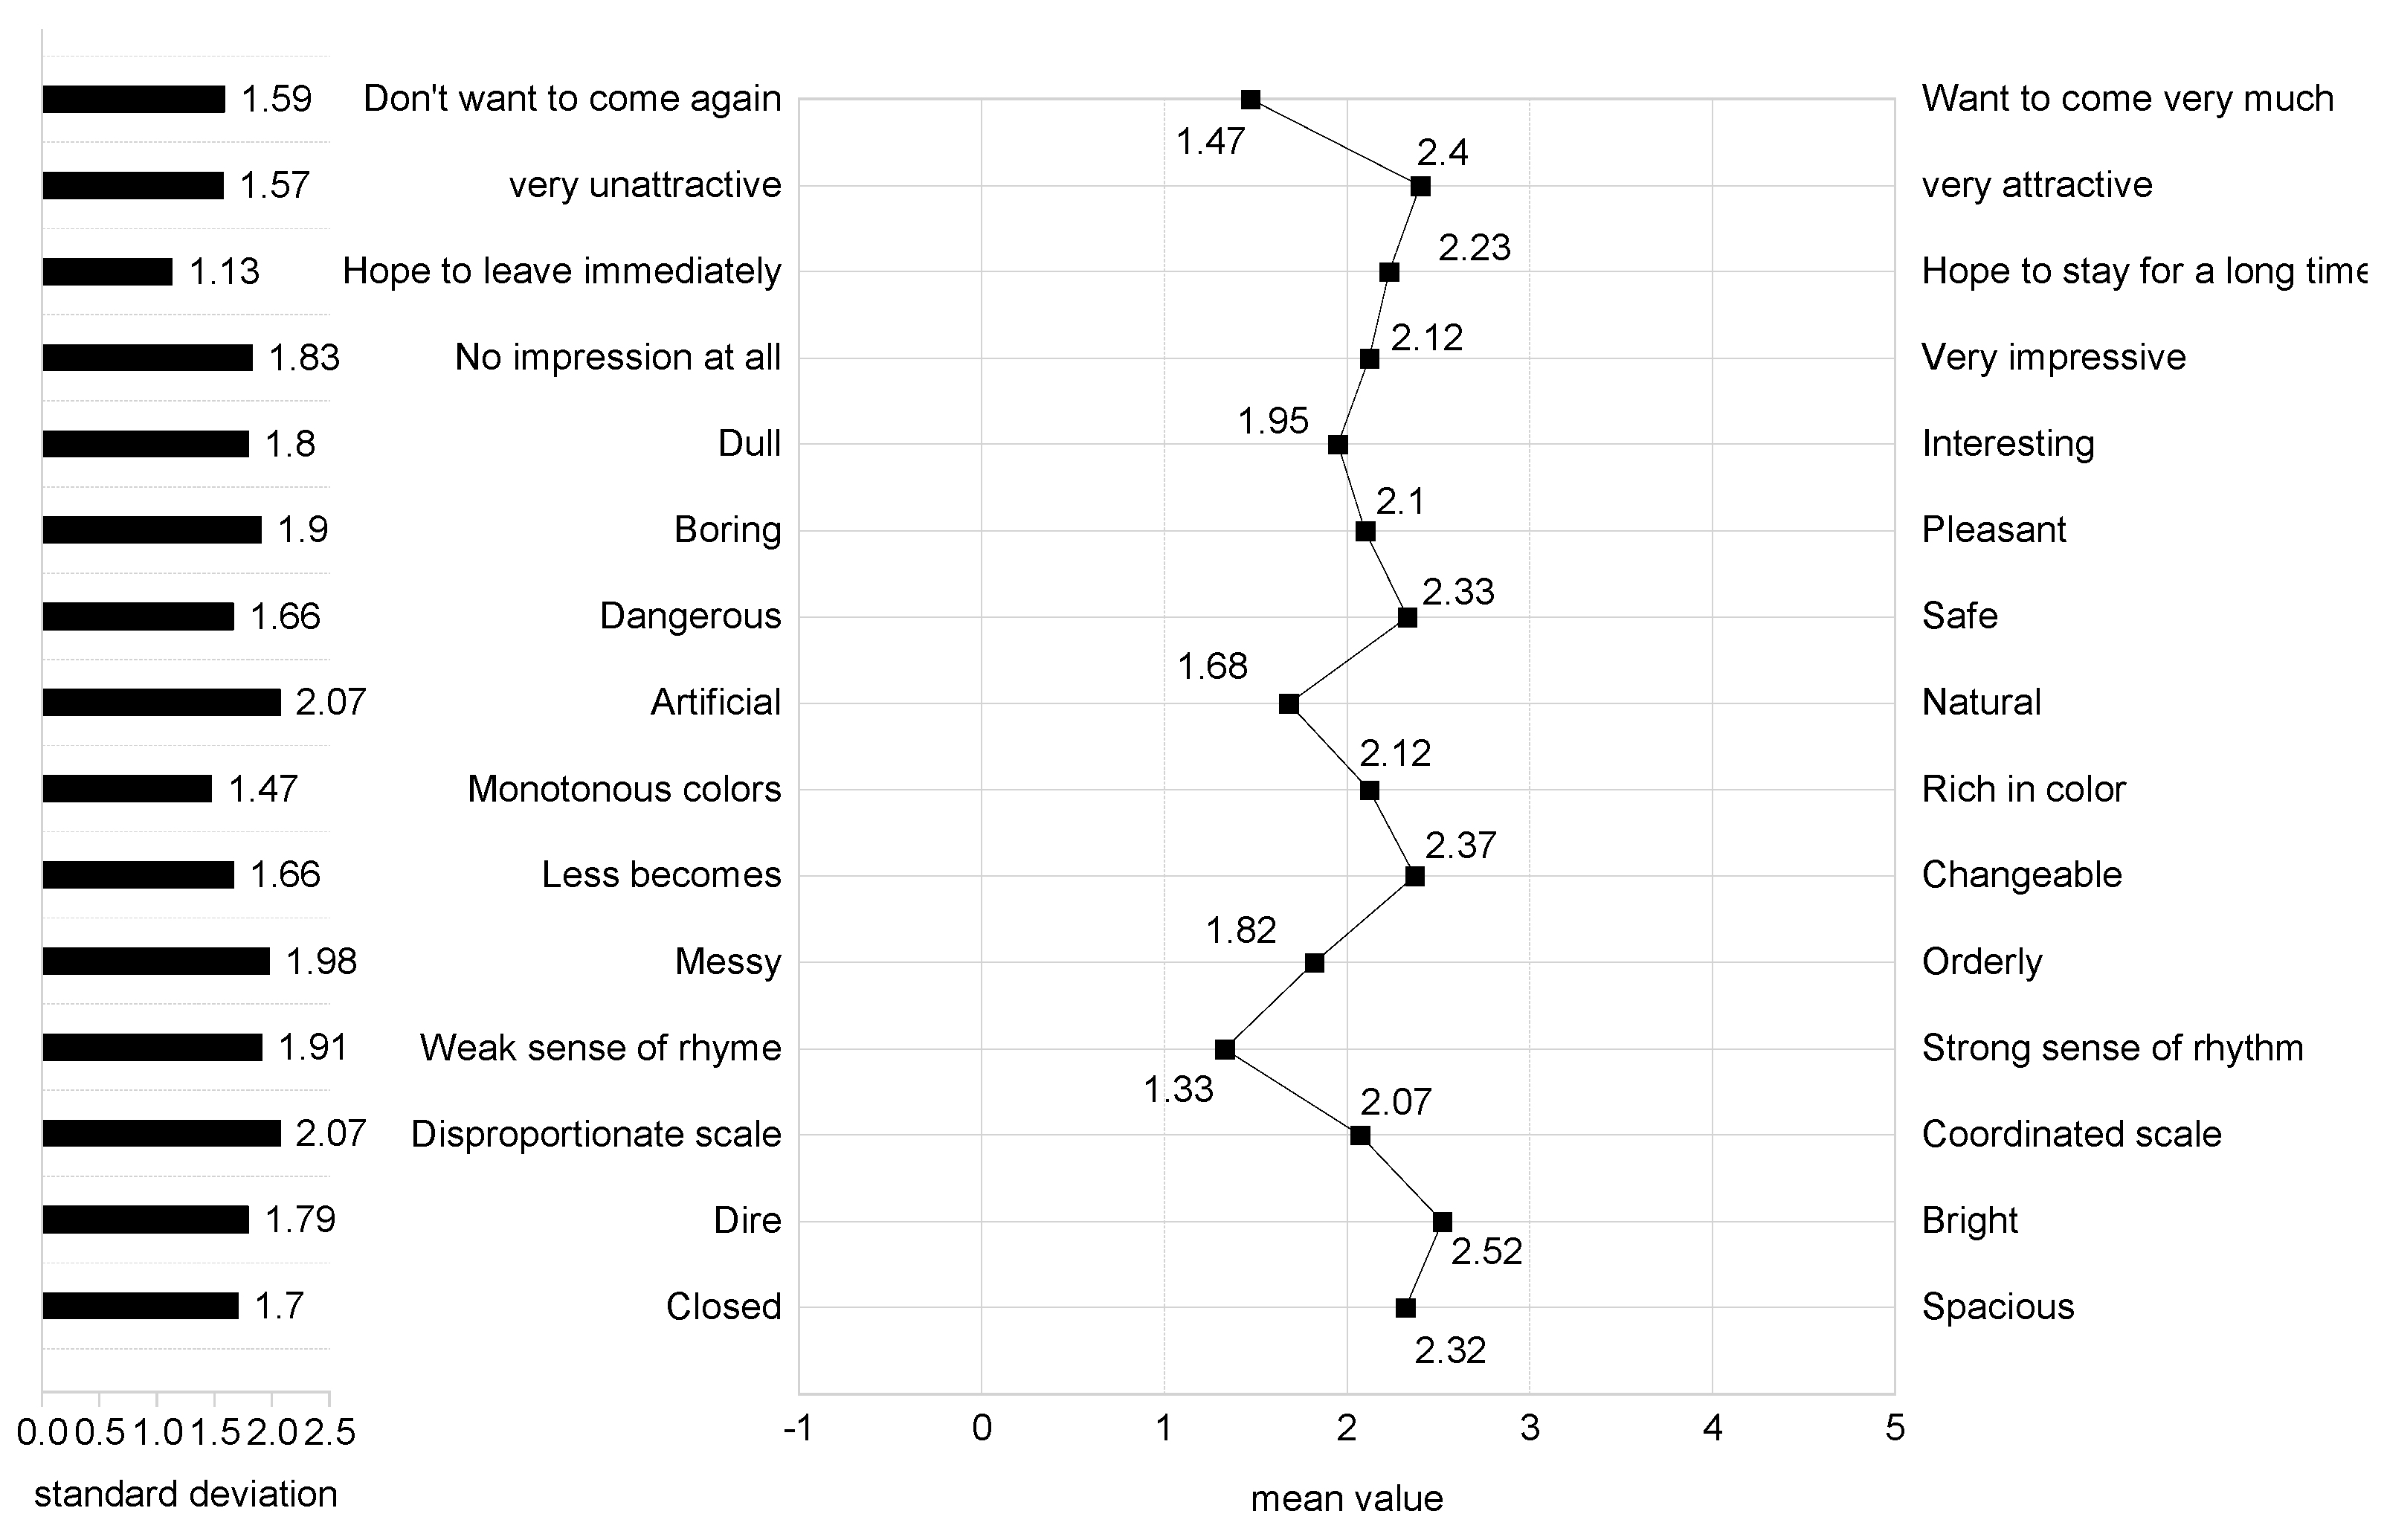
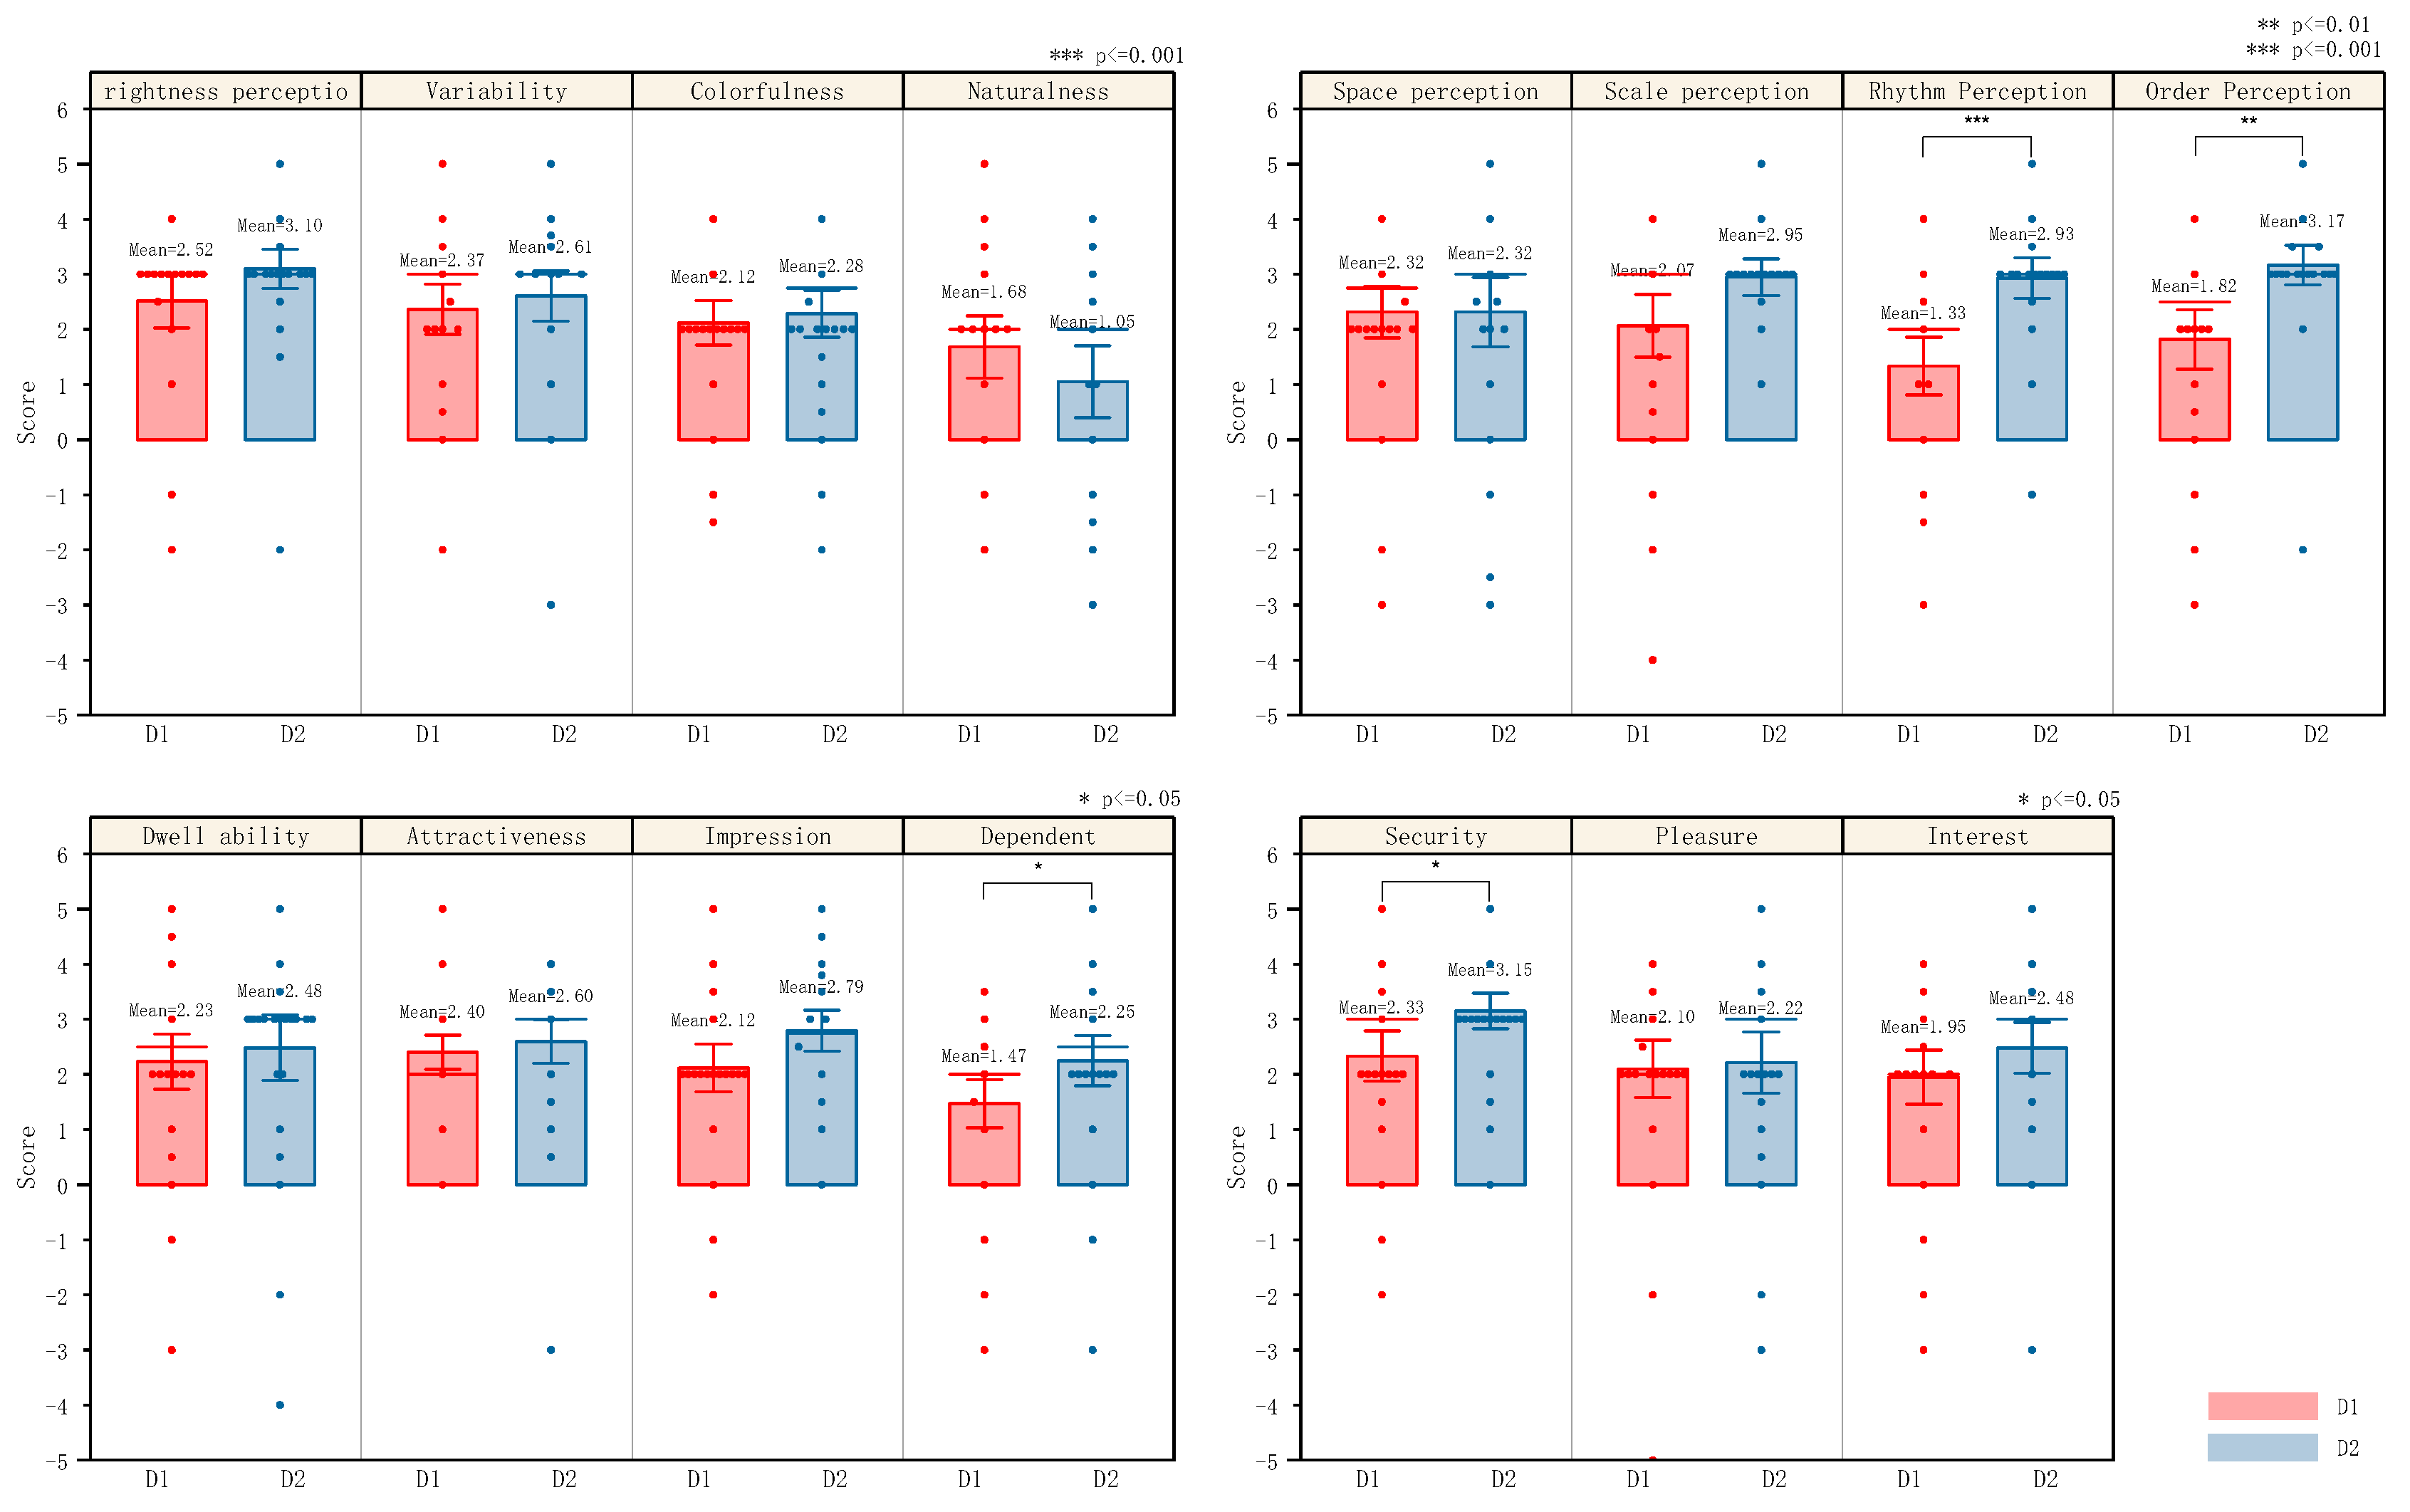
3.3. Subjective Evaluation Results
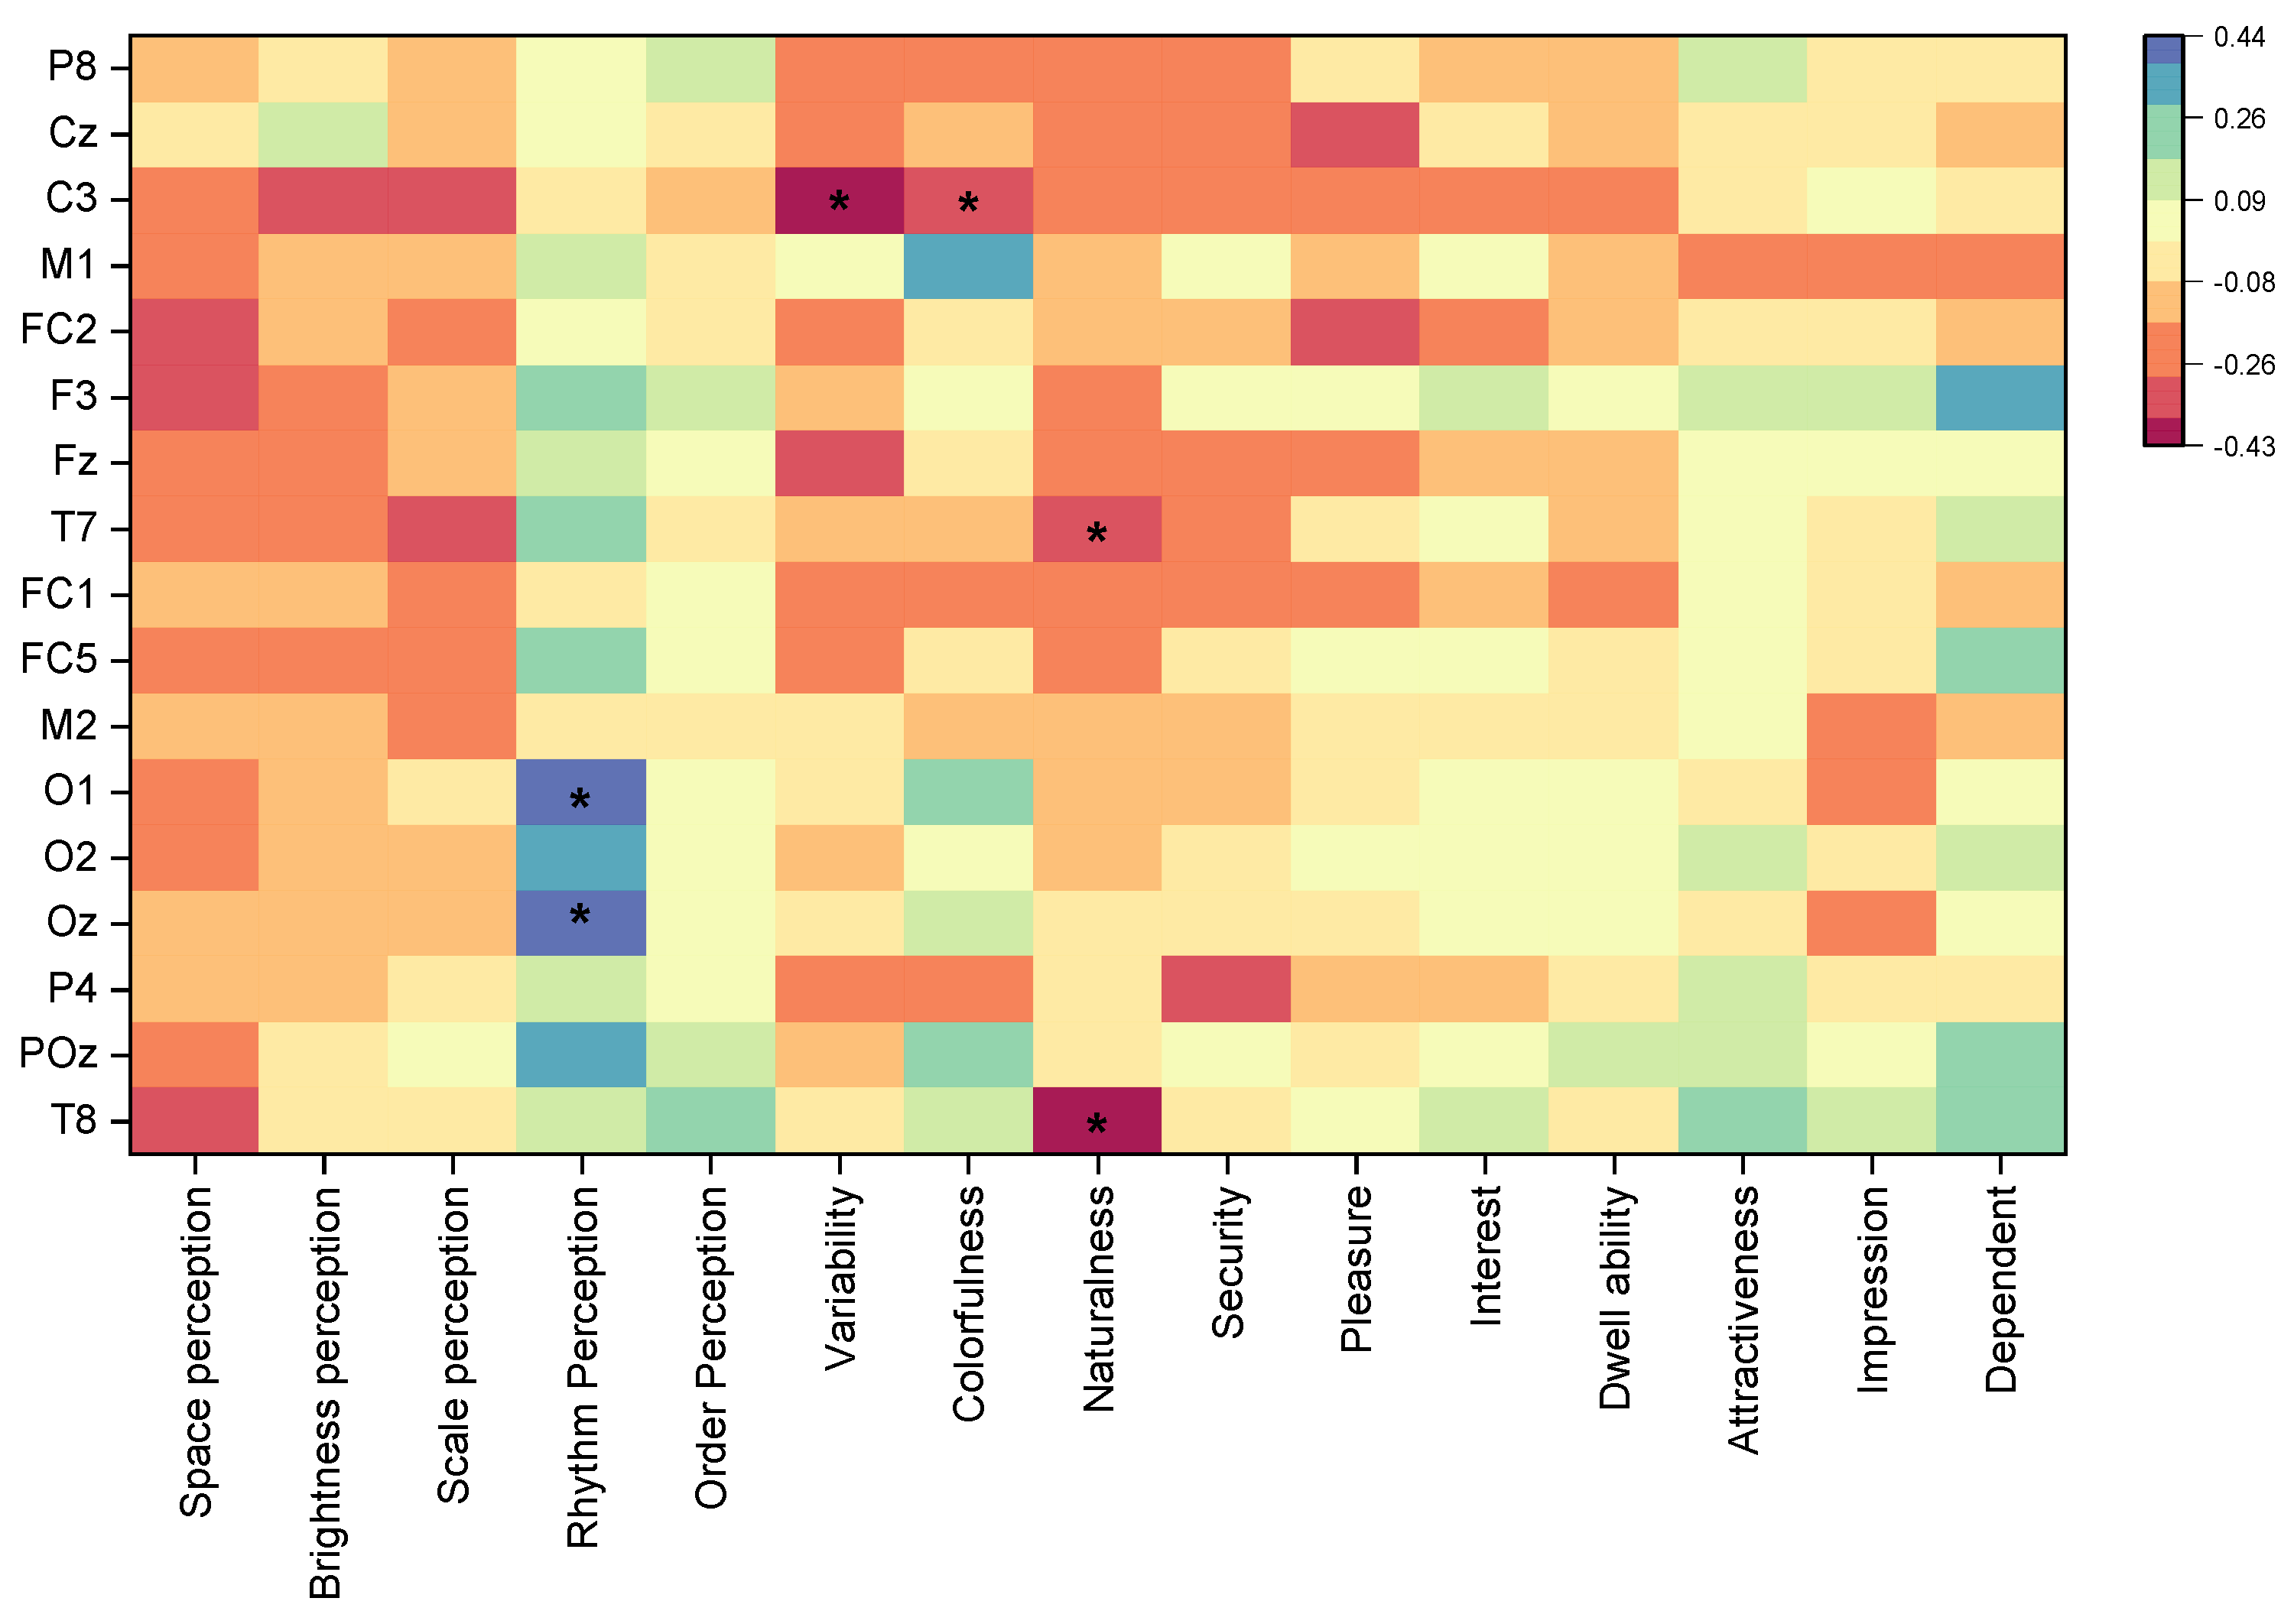
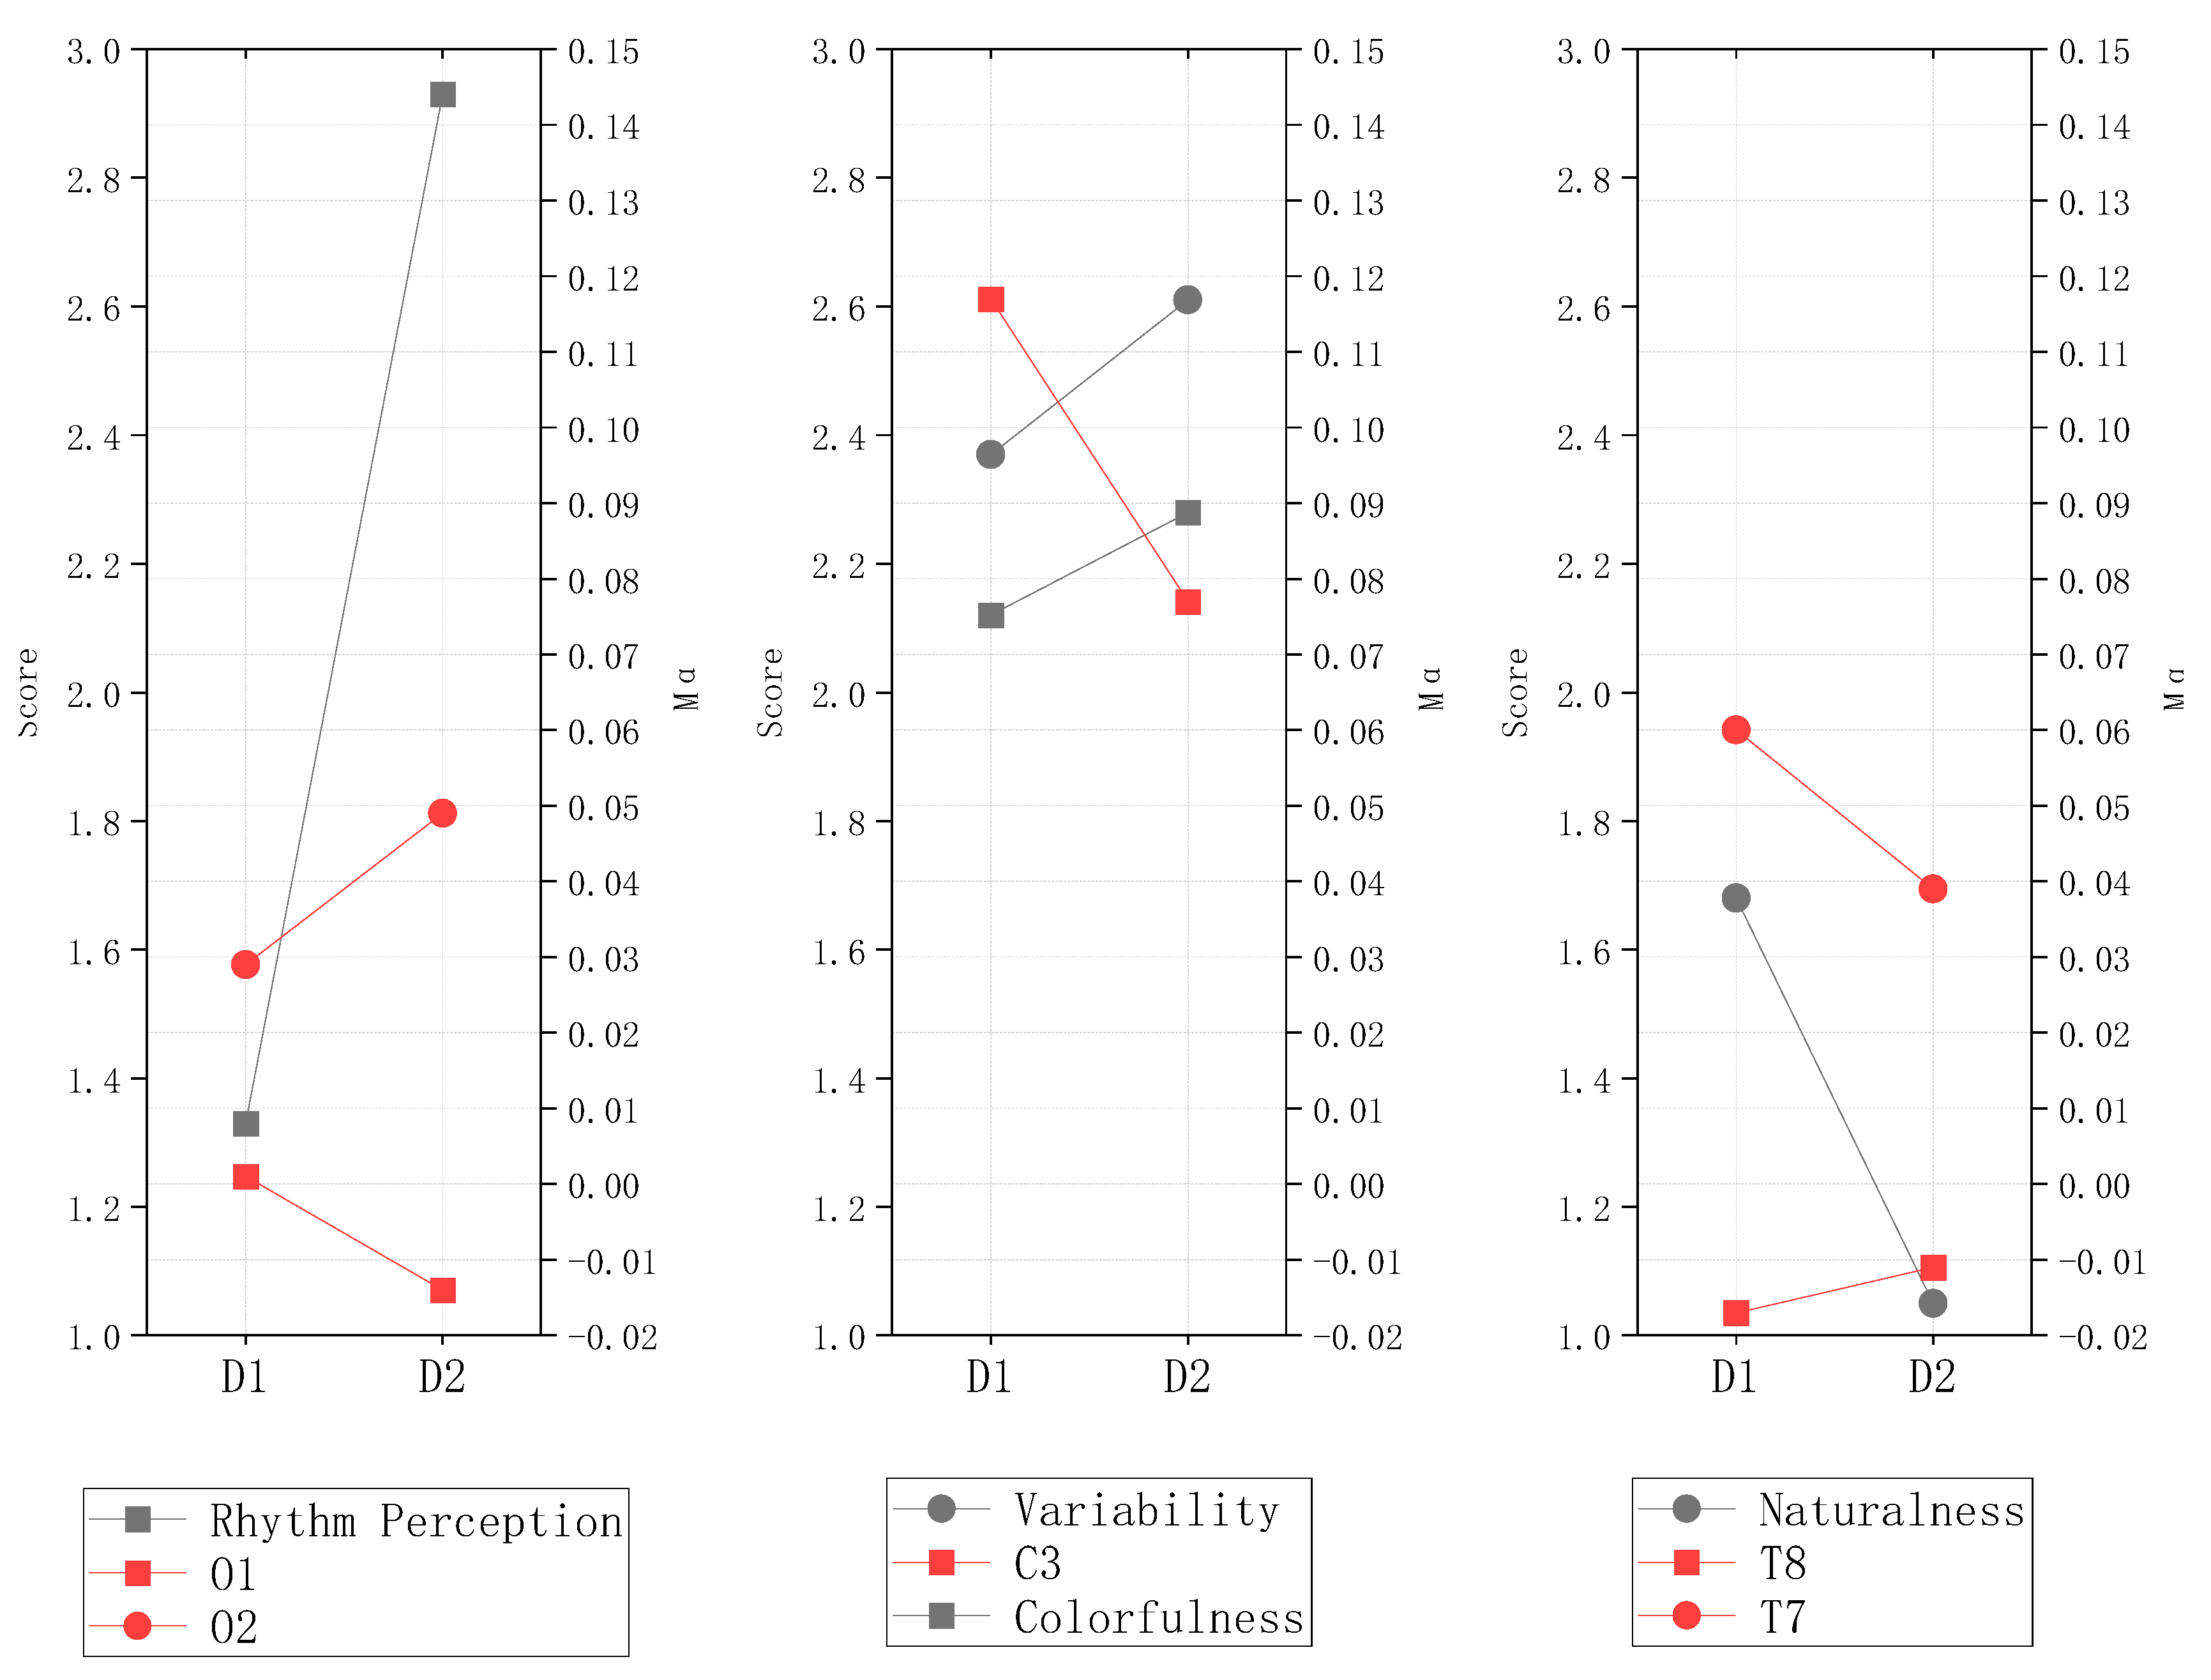
4. Correlation Analysis
Correlation between Alpha Wave Values of Each Electrode and Factor Scores
5. Conclusions
Author Contributions
Funding
Institutional Review Board Statement
Informed Consent Statement
Data Availability Statement
Conflicts of Interest
References
- Zhou, W. History of Chinese Classical Gardens; Tsinghua University: Beijing, China, 1999. [Google Scholar]
- Jacques, D. On the supposed Chineseness of the English landscape garden. Gard. Hist. 1990, 18, 180–191. [Google Scholar] [CrossRef]
- Keswick, M. The Chinese Garden: History, Art, and Architecture; Harvard University Press: Cambridge, MA, USA, 2003. [Google Scholar]
- Thacker, C. The History of Gardens; University of California Press: Berkeley, CA, USA, 1985. [Google Scholar]
- Conway, H. People’s Parks: The Design and Development of Victorian Parks in Britain; Cambridge University Press: Cambridge, UK, 1991. [Google Scholar]
- Bassin, J. The English landscape garden in the eighteenth century: The cultural importance of an English institution. Albion 1979, 11, 15–32. [Google Scholar] [CrossRef]
- Van den Berg, A.E.; van Winsum-Westra, M. Manicured, romantic, or wild? The relation between need for structure and preferences for garden styles. Urban For. Urban Green. 2010, 9, 179–186. [Google Scholar] [CrossRef]
- Lindsley, D.B. Psychological phenomena and the electroencephalogram. Electroencephalogr. Clin. Neurophysiol. 1952, 4, 443–456. [Google Scholar] [CrossRef] [PubMed]
- Cooper, R.; Osselton, J.W.; Shaw, J.C. EEG Technology; Butterworth-Heinemann: Oxford, UK, 2014. [Google Scholar]
- Teplan, M. Fundamentals of EEG measurement. Meas. Sci. Rev. 2002, 2, 1–11. [Google Scholar]
- Klimesch, W. EEG alpha and theta oscillations reflect cognitive and memory performance: A review and analysis. Brain Res. Rev. 1999, 29, 169–195. [Google Scholar] [CrossRef] [PubMed]
- Wang, L. Impact of roadside landscape color of freeways on α/β value of driver’s EEG signal. J. South China Univ. Technol. (Nat. Sci. Ed.) 2016, 44, 61–66+73. [Google Scholar]
- Qin, J.; Sun, C.; Zhou, X.; Leng, H.; Lian, Z. The effect of indoor plants on human comfort. Indoor Built Environ. 2014, 23, 709–723. [Google Scholar] [CrossRef]
- Hassan, A.; Tao, J.; Li, G.; Jiang, M.; Aii, L.; Zhihui, J.; Zongfang, L.; Qibing, C. Effects of walking in bamboo forest and city environments on brainwave activity in young adults. Evid.-Based Complement. Altern. Med. 2018, 2018, 9653857. [Google Scholar] [CrossRef]
- Ulrich, R.S. Natural versus urban scenes: Some psychophysiological effects. Environ. Behav. 1981, 13, 523–556. [Google Scholar] [CrossRef]
- Li, H.; Xie, H.; Woodward, G. Soundscape components, perceptions, and EEG reactions in typical mountainous urban parks. Urban For. Urban Green. 2021, 64, 127269. [Google Scholar] [CrossRef]
- Kacha, L.; Matsumoto, N.; Mansouri, A. Electrophysiological evaluation of perceived complexity in streetscapes. J. Asian Archit. Build. Eng. 2015, 14, 585–592. [Google Scholar] [CrossRef]
- Sun, X.; Li, Z. Use of electroencephalography (EEG) for comparing study of the external space perception of traditional and modern commercial districts. J. Asian Archit. Build. Eng. 2021, 20, 840–857. [Google Scholar] [CrossRef]
- Grill-Spector, K.; Kushnir, T.; Hendler, T.; Edelman, S.; Itzchak, Y.; Malach, R. A sequence of object-processing stages revealed by fMRI in the human occipital lobe. Hum. Brain Mapp. 1998, 6, 316–328. [Google Scholar] [CrossRef]
- Shi, L. A Study on EEG-Based Vigilance Estimation. Ph.D. Thesis, Shanghai Jiao Tong University, Shanghai, China, 2012. [Google Scholar]
- Wong, C.; Gallate, J. The function of the anterior temporal lobe: A review of the empirical evidence. Brain Res. 2012, 1449, 94–116. [Google Scholar] [CrossRef]
- Maheu, F.S.; Dozier, M.; Guyer, A.E.; Mandell, D.; Peloso, E.; Poeth, K.; Jenness, J.; Lau, J.Y.; Ackerman, J.P.; Pine, D.S. A preliminary study of medial temporal lobe function in youths with a history of caregiver deprivation and emotional neglect. Cogn. Affect. Behav. Neurosci. 2010, 10, 34–49. [Google Scholar] [CrossRef]
- Dolcos, F.; LaBar, K.S.; Cabeza, R. Remembering one year later: Role of the amygdala and the medial temporal lobe memory system in retrieving emotional memories. Proc. Natl. Acad. Sci. USA 2005, 102, 2626–2631. [Google Scholar] [CrossRef]
- Thier, P.; Karnath, H.-O.; Thier, P. Parietal Lobe Contributions to Orientation in 3D Space; Springer: Berlin/Heidelberg, Germany, 1997; Volume 25. [Google Scholar]
- Colby, C.L.; Duhamel, J.-R. Spatial representations for action in parietal cortex. Cogn. Brain Res. 1996, 5, 105–115. [Google Scholar] [CrossRef]
- Rizzolatti, G.; Fogassi, L.; Gallese, V. Parietal cortex: From sight to action. Curr. Opin. Neurobiol. 1997, 7, 562–567. [Google Scholar] [CrossRef]
- Chang, C.-Y.; Hammitt, W.E.; Chen, P.-K.; Machnik, L.; Su, W.-C. Psychophysiological responses and restorative values of natural environments in Taiwan. Landsc. Urban Plan. 2008, 85, 79–84. [Google Scholar] [CrossRef]
- Wang, X.; Rodiek, S.; Wu, C.; Chen, Y.; Li, Y. Stress recovery and restorative effects of viewing different urban park scenes in Shanghai, China. Urban For. Urban Green. 2016, 15, 112–122. [Google Scholar] [CrossRef]
- Grahn, P.; Stigsdotter, U.A. Landscape planning and stress. Urban For. Urban Green. 2003, 2, 1–18. [Google Scholar] [CrossRef]
- Deng, L.; Li, X.; Luo, H.; Fu, E.-K.; Ma, J.; Sun, L.-X.; Huang, Z.; Cai, S.-Z.; Jia, Y. Empirical study of landscape types, landscape elements and landscape components of the urban park promoting physiological and psychological restoration. Urban For. Urban Green. 2020, 48, 126488. [Google Scholar] [CrossRef]
- Zhang, J.; Park, S.; Cho, A.; Whang, M. Recognition of Emotion by Brain Connectivity and Eye Movement. Sensors 2022, 22, 6736. [Google Scholar] [CrossRef] [PubMed]
- Song, C.; Ikei, H.; Kagawa, T.; Miyazaki, Y. Effect of viewing real forest landscapes on brain activity. Sustainability 2020, 12, 6601. [Google Scholar] [CrossRef]
- Joung, D.; Kim, G.; Choi, Y.; Lim, H.; Park, S.; Woo, J.-M.; Park, B.-J. The prefrontal cortex activity and psychological effects of viewing forest landscapes in autumn season. Int. J. Environ. Res. Public Health 2015, 12, 7235–7243. [Google Scholar] [CrossRef]
- Bratman, G.N.; Hamilton, J.P.; Hahn, K.S.; Daily, G.C.; Gross, J.J. Nature experience reduces rumination and subgenual prefrontal cortex activation. Proc. Natl. Acad. Sci. USA 2015, 112, 8567–8572. [Google Scholar] [CrossRef]
- Epstein, R.A.; Baker, C.I. Scene perception in the human brain. Annu. Rev. Vis. Sci. 2019, 5, 373–397. [Google Scholar] [CrossRef]
- Epstein, R.A.; Patai, E.Z.; Julian, J.B.; Spiers, H.J. The cognitive map in humans: Spatial navigation and beyond. Nat Neurosci 2017, 20, 1504–1513. [Google Scholar] [CrossRef]
- Shelton, P.A.; Bowers, D.; Duara, R.; Heilman, K.M. Apperceptive visual agnosia: A case study. Brain Cogn. 1994, 25, 1–23. [Google Scholar] [CrossRef]
- Zhao, X.; Wang, J.; Li, J.; Luo, G.; Li, T.; Chatterjee, A.; Zhang, W.; He, X. The neural mechanism of aesthetic judgments of dynamic landscapes: An fMRI study. Sci. Rep. 2020, 10, 20774. [Google Scholar] [CrossRef] [PubMed]
- Ueno, A.; Abe, N.; Suzuki, M.; Hirayama, K.; Mori, E.; Tashiro, M.; Itoh, M.; Fujii, T. Reactivation of medial temporal lobe and occipital lobe during the retrieval of color information: A positron emission tomography study. Neuroimage 2007, 34, 1292–1298. [Google Scholar] [CrossRef] [PubMed]
- Pulvermüller, F.; Hauk, O. Category-specific conceptual processing of color and form in left fronto-temporal cortex. Cereb. Cortex 2006, 16, 1193–1201. [Google Scholar] [CrossRef] [PubMed]


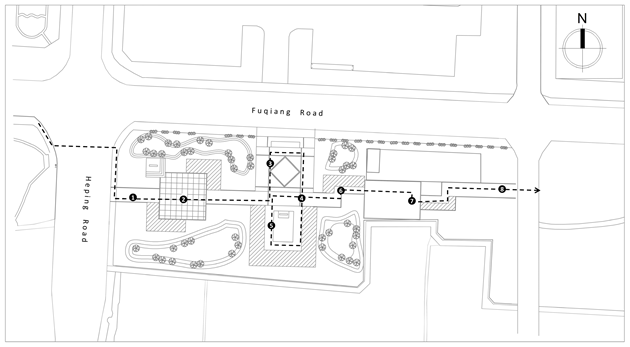
| Route and Node Location | |
|---|---|
 | |
| Route and Node Location | |
|---|---|
 | |
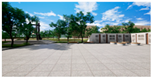
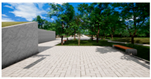
| Location 1 | Location 2 | Location 3 | Location 4 |
|---|---|---|---|
 |  | 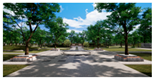 |  |
| Description: | |||
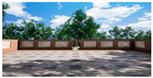
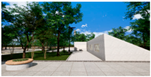
| West entrance: no axis relationship, sets up a modern sense of landscape sketches. | Small square: strong concealment, unilateral arrangement of landscape walls. | The main entrance on the north side: a relatively open central plaza with a certain axis relationship. | The large square on the north side: the scale is larger, the closure is stronger, and it is surrounded by a landscape wall. |
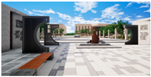
| Location 5 | Location 6 | Location 7 | Location 8 |
 |  |  | 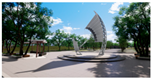 |
| Description: | |||
| The small square on the south side: strong concealment and landscape sculptures. | Small square: surrounded by trees, strong privacy. | Park trails: There is greenery on both sides of the road. | East entrance: open plaza with landscape sculptures. |
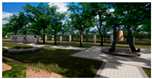
| Location 1 | Location 2 | Location 3 | Location 4 |
|---|---|---|---|
 |  | 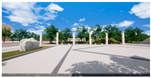 |  |
| Description: | |||
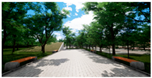
| West entrance: obvious axis relationship, no landscape sketches. | Small square: The openness is strong, and sculptures and landscape walls are arranged in the corners. | The main entrance on the north side: a relatively open central plaza with a certain axis relationship. | The large square on the south side: the scale is suitable for a relatively closed area, surrounded by a landscape wall on three sides. |
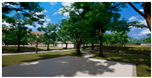
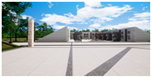
| Location 5 | Location 6 | Location 7 | Location 8 |
 |  |  |  |
| Description: | |||
| The large square on the south side: the scale is appropriate, and the landscape sketches are arranged. | Small square: more spacious | Park trails: large width, single-sided landscape greenery, and arrangement of covered landscape. | East exit: wide roadway, no sculpture arrangement. |
| Items | Attribute |
|---|---|
| Location | Enclosed space |
| Temperature | 20° |
| Video | 6 min and 30 s 360° Panoramic 60 frame video |
| VR | VR all-in-one device |
| EEG devices | 64-channel lead-count electrode cap |
| Questionnaire | Paper questionnaire Paper questionnaire, 15 evaluation indicators, −5–5 points |
| Indicators Names | −5 Points | −2.5 Points | 0 Points | −2.5 Points | −5.0 Points | Any Score (−5–5) |
|---|---|---|---|---|---|---|
| Space perception | closed | relatively closed | neutral | relatively open | spacious | |
| Brightness perception | very dim | relatively dim | neutral | relatively bright | very bright | |
| Scale perception | loss of proportion | relatively imbalanced | neutral | relatively coordinated | proper proportion | |
| Rhythm Perception | no sense of rhythm | weak rhythm | neutral | strong rhythm | very strong sense of rhythm | |
| Order Perception | messy | relatively messy | neutral | relatively orderly | orderly | |
| Variability | very low sense of change | lack of variety | neutral | full of variety | very rich in changes | |
| Colorfulness | monotonous color | relatively monotonous | neutral | relatively rich | colorful | |
| Naturalness | very artificial | relatively artificial | neutral | relatively natural | very natural | |
| Security | very dangerous | relatively dangerous | neutral | relatively safe | very safe | |
| Pleasure | very melancholy | more melancholy | neutral | more pleasant | very pleasant | |
| Interest | very boring | relatively boring | neutral | relatively interesting | very interesting | |
| Impression | no impression at all | less impressive | neutral | more impressive | Very impressive | |
| Dwell ability | hope to leave immediately | want to leave | neutral | want to stay | hope to stay for a long time | |
| Attractiveness | very unattractive | less attractive | neutral | more attractive | very attractive | |
| Dependent | don’t want to come again | probably won’t come again | neutral | may come again | want to come very much | |
| Name: Gender: Age: Education | ||||||
| Background: | ||||||
| Item | Details | Unit: Person |
|---|---|---|
| Gender | Male | 12 |
| Female | 18 | |
| Age Group | 20–24 | 16 |
| 24–28 | 13 | |
| 29–30 | 1 | |
| Education Background | Bachelor’s Degree | 3 |
| Master’s Degree and Above | 27 |
| Electrode | Subject1 | Subject2 | Subject3 | Subject4 | Subject5 | Subject6 | Subject7 | |
|---|---|---|---|---|---|---|---|---|
| M | M | M | M | M | M | M | ||
| FP1 | D1 | 0.30 | −0.21 | 0.34 | 0.40 | −1.60 | −0.57 | −0.07 |
| D2 | 0.23 | 0.18 | 0.58 | 0.03 | 0.58 | −0.32 | −0.29 | |
| D1–D2 | + | − | − | + | − | − | + | |
| FPZ | D1 | 0.24 | −0.21 | 0.56 | 0.32 | −1.34 | −0.53 | −0.15 |
| D2 | 0.20 | 0.28 | 0.78 | 0.08 | 0.53 | −0.26 | −0.26 | |
| D1–D2 | + | − | − | + | − | − | + | |
| FP2 | D1 | 0.29 | −0.22 | 0.52 | −0.07 | −1.35 | −0.38 | −0.19 |
| D2 | 0.15 | 0.29 | 0.97 | −0.35 | 0.51 | −0.27 | −0.28 | |
| D1–D2 | + | − | − | + | − | − | + | |
| F7 | D1 | 0.20 | 0.10 | 0.22 | 0.07 | 0.97 | −0.98 | 0.01 |
| D2 | 0.29 | −0.14 | 0.41 | −0.19 | −0.20 | −0.15 | −0.33 | |
| D1–D2 | − | + | − | + | + | − | + | |
| F3 | D1 | 0.23 | −0.08 | 0.16 | −0.04 | 0.32 | −0.50 | −0.05 |
| D2 | 0.12 | 0.09 | 0.30 | 0.13 | 0.19 | 0.16 | −0.03 | |
| D1–D2 | + | − | − | − | + | − | − |
| Indicator | Space Perception | Brightness Perception | Scale Perception | Rhythm Perception | Order Perception | Variability | Colorfulness | Naturalness |
|---|---|---|---|---|---|---|---|---|
| U | 397,000 | 381,500 | 362,000 | 216,500 | 255,500 | 405,500 | 412,000 | 390,000 |
| W | 862,000 | 846,500 | 827,000 | 681,500 | 720,500 | 870,500 | 877,000 | 855,000 |
| Z | −0.801 | −1.051 | −1.339 | −3.516 | −2.963 | −0.666 | −0.576 | −0.896 |
| p | 0.423 | 0.293 | 0.181 | 0.000 | 0.003 | 0.505 | 0.564 | 0.370 |
| Indicator | Security | Pleasure | Interest | Dwell ability | Attractiveness | Impression | Dependent | / |
| U | 318,000 | 425,500 | 368,000 | 376,000 | 361,000 | 345,000 | 313,500 | / |
| W | 783,000 | 890,500 | 833,000 | 841,000 | 826,000 | 810,000 | 778,500 | / |
| Z | −2.007 | −0.368 | −1.230 | −1.118 | −1.367 | −1.592 | −2.046 | / |
| p | 0.045 | 0.713 | 0.219 | 0.263 | 0.172 | 0.111 | 0.041 | / |
Disclaimer/Publisher’s Note: The statements, opinions and data contained in all publications are solely those of the individual author(s) and contributor(s) and not of MDPI and/or the editor(s). MDPI and/or the editor(s) disclaim responsibility for any injury to people or property resulting from any ideas, methods, instructions or products referred to in the content. |
© 2024 by the authors. Licensee MDPI, Basel, Switzerland. This article is an open access article distributed under the terms and conditions of the Creative Commons Attribution (CC BY) license (https://creativecommons.org/licenses/by/4.0/).
Share and Cite
Ren, H.; Zheng, Z.; Zhang, J.; Wang, Q.; Wang, Y. Electroencephalography (EEG)-Based Comfort Evaluation of Free-Form and Regular-Form Landscapes in Virtual Reality. Appl. Sci. 2024, 14, 933. https://doi.org/10.3390/app14020933
Ren H, Zheng Z, Zhang J, Wang Q, Wang Y. Electroencephalography (EEG)-Based Comfort Evaluation of Free-Form and Regular-Form Landscapes in Virtual Reality. Applied Sciences. 2024; 14(2):933. https://doi.org/10.3390/app14020933
Chicago/Turabian StyleRen, Hongguo, Ziming Zheng, Jing Zhang, Qingqin Wang, and Yujun Wang. 2024. "Electroencephalography (EEG)-Based Comfort Evaluation of Free-Form and Regular-Form Landscapes in Virtual Reality" Applied Sciences 14, no. 2: 933. https://doi.org/10.3390/app14020933
APA StyleRen, H., Zheng, Z., Zhang, J., Wang, Q., & Wang, Y. (2024). Electroencephalography (EEG)-Based Comfort Evaluation of Free-Form and Regular-Form Landscapes in Virtual Reality. Applied Sciences, 14(2), 933. https://doi.org/10.3390/app14020933