Article

Implementation of Quality Tools in Mechanical Engineering Piece Production

1
Department of Safety and Quality, Faculty of Mechanical Engineering, Technical University of Kosice, Letna 1/9, 04200 Košice, Slovakia
2
Institute of Materials and Quality Engineering, Faculty of Materials, Metallurgy and Recycling, Technical University of Kosice, Letna 1/9, 04200 Košice, Slovakia
3
ECO-Invest, Námestie SNP, Obchodná 2, 81108 Bratislava, Slovakia
*
Author to whom correspondence should be addressed.
Appl. Sci. 2024, 14(2), 944; https://doi.org/10.3390/app14020944
Submission received: 18 December 2023 / Revised: 15 January 2024 / Accepted: 19 January 2024 / Published: 22 January 2024
(This article belongs to the Special Issue Mechanical and Biomedical Engineering in Paradigm)

Abstract

:
The world is undergoing dynamic changes. For businesses, it brings positives, but also negatives. The positive is the global market for business. The downside of the global market is the increasing competitive pressure. Large enterprises with serial production who are setting production for a longer period ahead are not so noticeable. Small companies are the most vulnerable. There are various tools or overall approaches to business management that allow them to increase work efficiency or production productivity or eliminate waste. In recent years, one can see an increase in the popularity of Lean or Six Sigma. Their contribution to businesses cannot be disputed. Most of the tools and approaches to support business management are oriented or based on the conditions of serial production. Small businesses with piece production are at a disadvantage here. It was this fact that motivated us to focus on piece production and to find space for the implementation of supporting tools that could be helpful. Our research has shown that there are tools that can be applied in the conditions of piece production. The application of the identified tools proved that the results achieved in reducing production times or increasing productivity are unmistakable.

1. Introduction

Compared to big series production, production in small companies with piece production is very demanding. In piece production, there is no small number of jigs or fixtures to make it easier to manage. If they exist, they are in large numbers, unlike series production, because of the large portfolio of products produced. Piece production is very specific and differs in almost everything from series production [1,2,3]. Series production has proper tested and established technological procedures, instructions for operators, single-purpose tools such as molds, fixtures, templates, test fixtures for a given product type, etc. All of this helps to streamline series production to prevent non-conformances [2]. However, what must be ensured, regardless of the number of units produced, is a management/control that guarantees the customer that the product conforms to the requirements. There are several managerial approaches to streamline the management of the company.
The most well-known approaches include the implementation of a quality management system according to the ISO 9001, Total Quality Management (TQM), World Class Manufacturing (WCM), the Toyota Production System (TPS), Six Sigma, Lean, and others [4,5].
According to the available literature, it could be said that Lean concepts are on the agenda again, particularly because of high quality requirements [6,7]. Since its launch in manufacturing, Lean has been widely recognized as a powerful management system to improve the overall performance of an organization [8,9]. As such, Lean production is based on the principles and working processes of the Toyota Production System and has been defined as doing more with less [10]. In its simplest terms, lean production can be described as the elimination of waste [11]. Today most manufacturing companies claimed that lean is not an option, it is mandatory for manufacturing firms operating in global markets [12,13]. Wilson defines Lean management as a philosophy for long-term growth that generates value for the customer, society, and the economy [14]. According to Carreira, Lean management is a philosophy of no waste [15]. Lean is a philosophy of 100 small improvements every day. It is focused on excellence at the lowest and the highest level of detail. It is a concept that is based on a vision for the whole system [16]. According to Womack and Jones, Lean management is a philosophy that promotes the use of methodologies, techniques, and tools like Kanban and the JIT (Just In Time) pull system to reduce wastes and to increase the performances of the company ([17], pp. 112–129). Researchers have identified many tools and techniques for quality improvement. A single tool is a device with a clear function and is usually applied on its own, whereas a technique has a wider application and is understood as a set of tools [18,19]. The literature review suggests that there are several differences between quality tools and techniques. According to McQuater a single “tool” may be described as a device which has a clear role. It is often narrow in focus and is usually used on its own [18]. A “technique”, on the other hand, has a wider application than a tool. This often results in a need for more thought, skill, and training, so that techniques can be used effectively. For example, SPC uses a variety of tools such as charts, graphs, and histograms, as well as other statistical methods, all of which are necessary for the effective use of this technique [18,20]. Even though there are other authors who refer to these sets of tools as methodologies, in this paper, we name them tools. Techniques and tools are vital to support and develop the quality improvement process [20,21]. Research conducted in Thailand on a sample of 187 companies explores the impact of Lean management practices on the company’s performance. The results showed that when applied, Lean practices boosted the performance of the company. When it comes to small developing countries, the experiences are quite poor [22]. According to Karlsson and Ahlstrom, who tried to assess changes towards Lean production, following the goal of implementing Lean production within an operation (increase productivity, enhance quality, shorten lead times, reduce cost, etc.), they developed a model for operationalizing the determinants of a Lean production system [23]. Sanchez and Perez developed and tested an integrated checklist for assessing manufacturing changes towards Lean production. Within the Lean production model, they combined six groups of indicators from common basic Lean production practices (the elimination of zero-value activities, continuous improvement, multifunctional teams, JIT production and delivery, supplier integration, and a flexible information system) [24].
Lean is an approach by which a company can identify and then address internal reserves. This reserve is perceived as a waste of, e.g., time, material, or workers. Lean is one of the ways to become more competitive and thus achieve sustainability in business [5]. The purpose of Lean concepts is to eliminate waste in a manufacturing process. This infers that Lean manufacturing is one of the strategies most manufacturers employ when expanding the global market to sustain competitiveness [25,26,27]. According to Womack and Jones, Lean concepts originate from the production process (Lean production) and can be viewed as a systemic method for the elimination of wastes (Muda) within a manufacturing process. It is worth noting that the main goal of Lean production in the construction and manufacturing sectors is to generate a rationalized and high-quality system that produces finished products at the leap of customer demand with limited waste ([17]; pp. 151–154). This objective can be achieved through the adoption of diverse tools and techniques such as JIT, Kanban, TPM, cellular manufacturing, and 5S to reduce the cycle time and remove any form of devastation that could lead to waste in the production process [27,28]. The above-mentioned Lean tools, techniques, and concepts have been extensively adopted in the manufacturing and construction sectors so as to improve the performance of the industry [29,30,31,32,33,34,35,36,37].
In the book The Machine that Changed the World [38], it is stated that if Lean manufacturing tools are properly understood and then implemented in a company, by implementing them, it is possible to achieve:
  • half the human labor time in production,
  • reducing the number of output failures by half,
  • reducing investment in machinery, tools, and equipment by 50%,
  • reducing engineering by up to 60%,
  • the reduction of space required by 50%,
  • the reduction of inventories by 90%.
Being Lean means making more profit in less time with minimal effort. In general, the Lean philosophy focuses on eliminating waste in the company [39]. It is the decision of the management whether to focus only on production and related processes (purchasing, manufacturing, and supplier management) or to cover all business processes (receiving and processing customer requests, new product design and development, packaging, transport, etc.).
There are many Lean tools. This article is based on 25 basic Lean tools. The aim of this article is to analyze individual tools about the specific conditions of piece production. Another intention is to apply the identified Lean tools in real conditions of piece production. The output of the article is the presentation of real benefits after the application of Lean tools. Many lean tools and techniques have been used by many factories and industries to improve performance in the manufacturing process, for example, TPM, TQM, Kanban, VSM, 5S, MUDA, Visual workplace, etc. [40].

2. Materials and Methods

The application of the Lean philosophy represents the implementation of several tools that can be used to achieve results, i.e., synergistic effect. There are several tools that are used in the application of Lean strategy [3,5]. Among the most basic tools are those shown in Figure 1.
The application of any approach, philosophy, or tool must be adapted to the real conditions of the company. Those conditions are created by the culture itself, the competence of the workforce, the type of production, the size of the company, the maturity of the management system, etc. [8,40]. The size of the company plays a key role in the implementation of Lean (Table 1).
The result of waste reduction is multiplied with the size of series production. The larger the production run, the greater the effect obtained from waste reduction. For small organizations that operate in small series (up to 10 pieces) or if it is a piece production, the application of some Lean tools is difficult or even impossible. To find answers on how and if it is even possible to apply Lean philosophy to a small company with piece production, the following tasks were defined:
  • To analyze the basic tools of Lean production with respect to the specifics of production conditions in a small company with piece production and to identify those that are applicable in the conditions of such a company.
  • To verify the applicability of the proposed tools in the real conditions of the selected company.
Within the first task, the aim was to assess whether the given tool, about its principle of application, can be used in the conditions of piece production, which are very specific in comparison with series production. The team of authors examined this fact for each tool. Twenty-five basic Lean tools were included in the analysis (Figure 1). When examining the applicability of a given Lean tool, it was based on the team’s knowledge of individual Lean tools. Each Lean tool analyzed has its own specifics for its application. To select suitable Lean tools, we used our own methodology, which in individual steps gradually analyzes the applicability of individual tools for the specifics of production conditions in small companies with piece production. Based on the knowledge and experience of the team, we determined the basic factors that could significantly influence the outputs of processes in small companies with piece production. After analyzing the data and identifying the key issues, we then used a multicriteria analysis. When determining the criteria, we were based on consultations with the company’s management. We consulted the individual advantages and disadvantages of the analyzed Lean tools. The basic evaluation criteria were:
  • independence from the amount of input data (which the Lean tool uses to achieve the expected effect),
  • ease of obtaining input data,
  • ease of processing input data (sophistication necessity of using software support for processing input data),
  • easy to understand principle of tool,
  • the shortest time to implement a tool,
  • ease of sustainability of the tool after implementation,
  • economic simplicity of the tool’s sustainability after implementation.
To be objective in determining the weights of the evaluation criteria, each of the researchers evaluated the criteria separately. The evaluation of individual criteria is based on the experience of researchers. Each of them were asked to assign points from 1 to 7. The highest point rating (7 points) was assigned to the criterion with the highest importance. One point was assigned to the least significant criterion. Based on the achieved score, the weights of the individual evaluation criteria were determined. The following table (Table 2) shows the described determining the weights.
After determining the weights of the evaluation criteria, a multi-criteria evaluation of individual instruments was used. The table below (Table 3) shows each tool with a point rating expressing the degree of fulfillment of the evaluation criterion. In the second line of each tool in the above table, there is a recalculated value considering the weight of the given criterion.
Criteria for assessing the suitability of the Lean tool in the conditions of a small organization with piece production:
  • 2 to 1.5 points—full application,
  • 1.49 to 0.9 points—limited application,
  • 0 to 0.89 points—no application.
Considering the analysis of up to 25 basic Lean tools, a summary table is provided (Table 4). This provides information on the possibility of applying a given tool, considering the specificity of a small organization with piece production. Looking at the above table, 7 tools can be applied without limitation in the conditions of piece production, 9 tools can be applied to a limited extent, and 9 tools cannot be applied at all.
Within the second task, it was necessary to verify the conclusions of the analysis in practice. The following 7 tools were applied: 5S, Kaizen, PDCA, Gemba, Muda, Smart Goals, and Visual Workplace. It was not just a matter of applying these tools for the sake of it, it was a matter of demonstrating real benefits for the selected company, which fulfilled the condition of piece production. The definition of a small business, resulting from European legislation according to 2003/361/EC, is a number of employees up to 49, annual turnover up to EUR 10 million, and annual balance up to EUR 10 million. The company under study has 12 employees and annual turnover up to EUR 5 million. It is focused on mechanical engineering production with customers in various EU countries. This includes processes such as material splitting, bending, welding, grinding, assembly, etc.
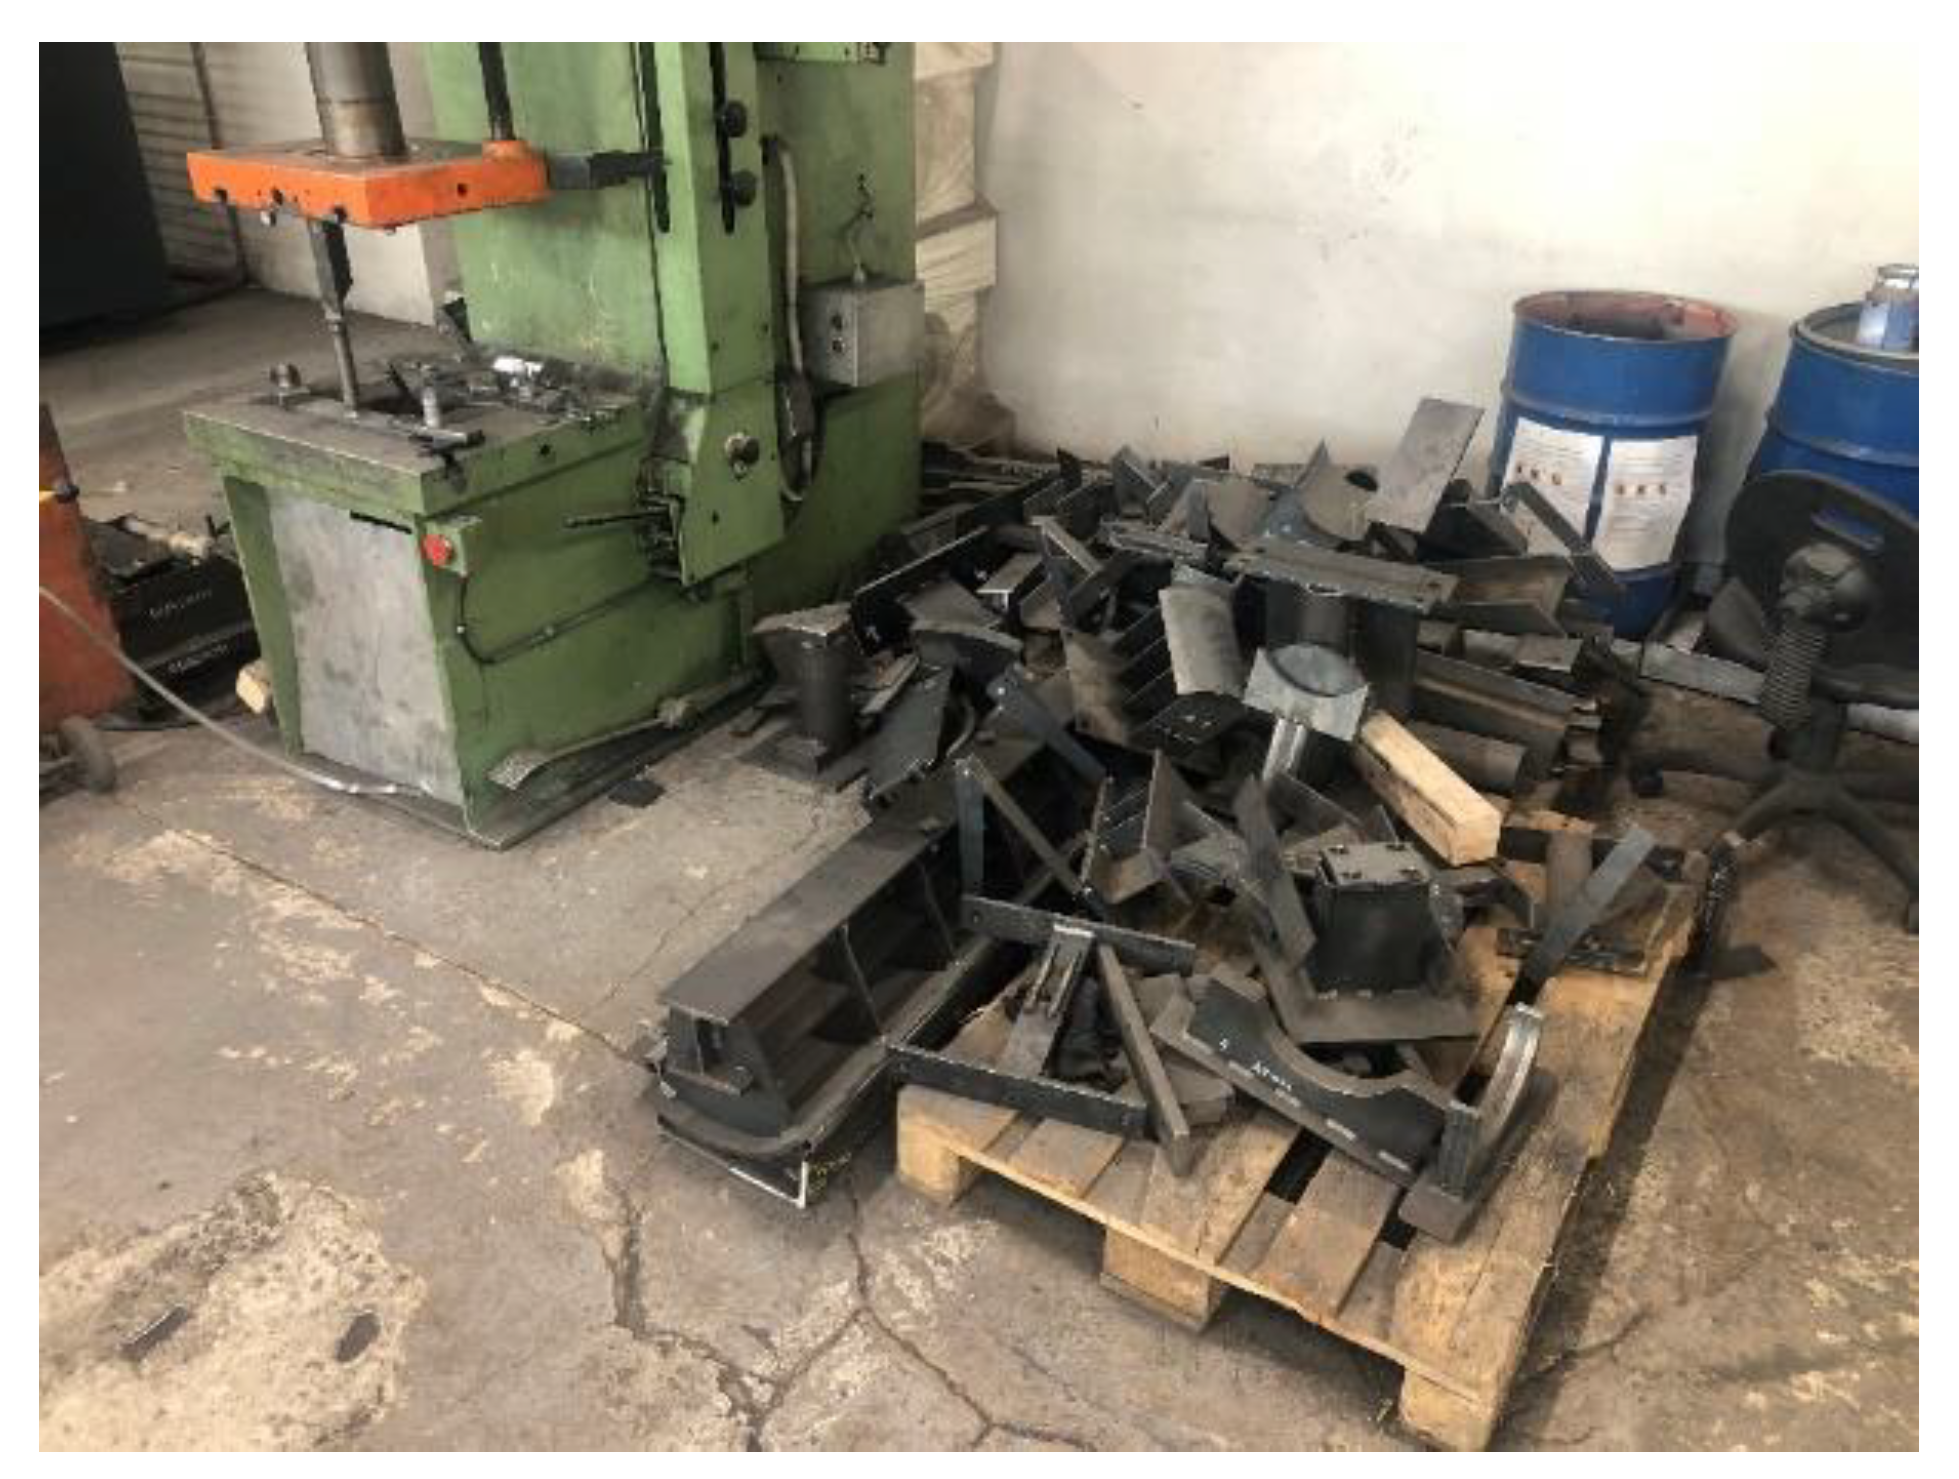
As a first tool, 5S was applied. It is probably the most basic Lean tool. It defines order in the workplace. As the company is focused on piece production and small series of up to 10 pieces, it had many different fixtures (Figure 2). It made sense for the company to store (keep) the fixtures because the products were repeated at certain periods of time.
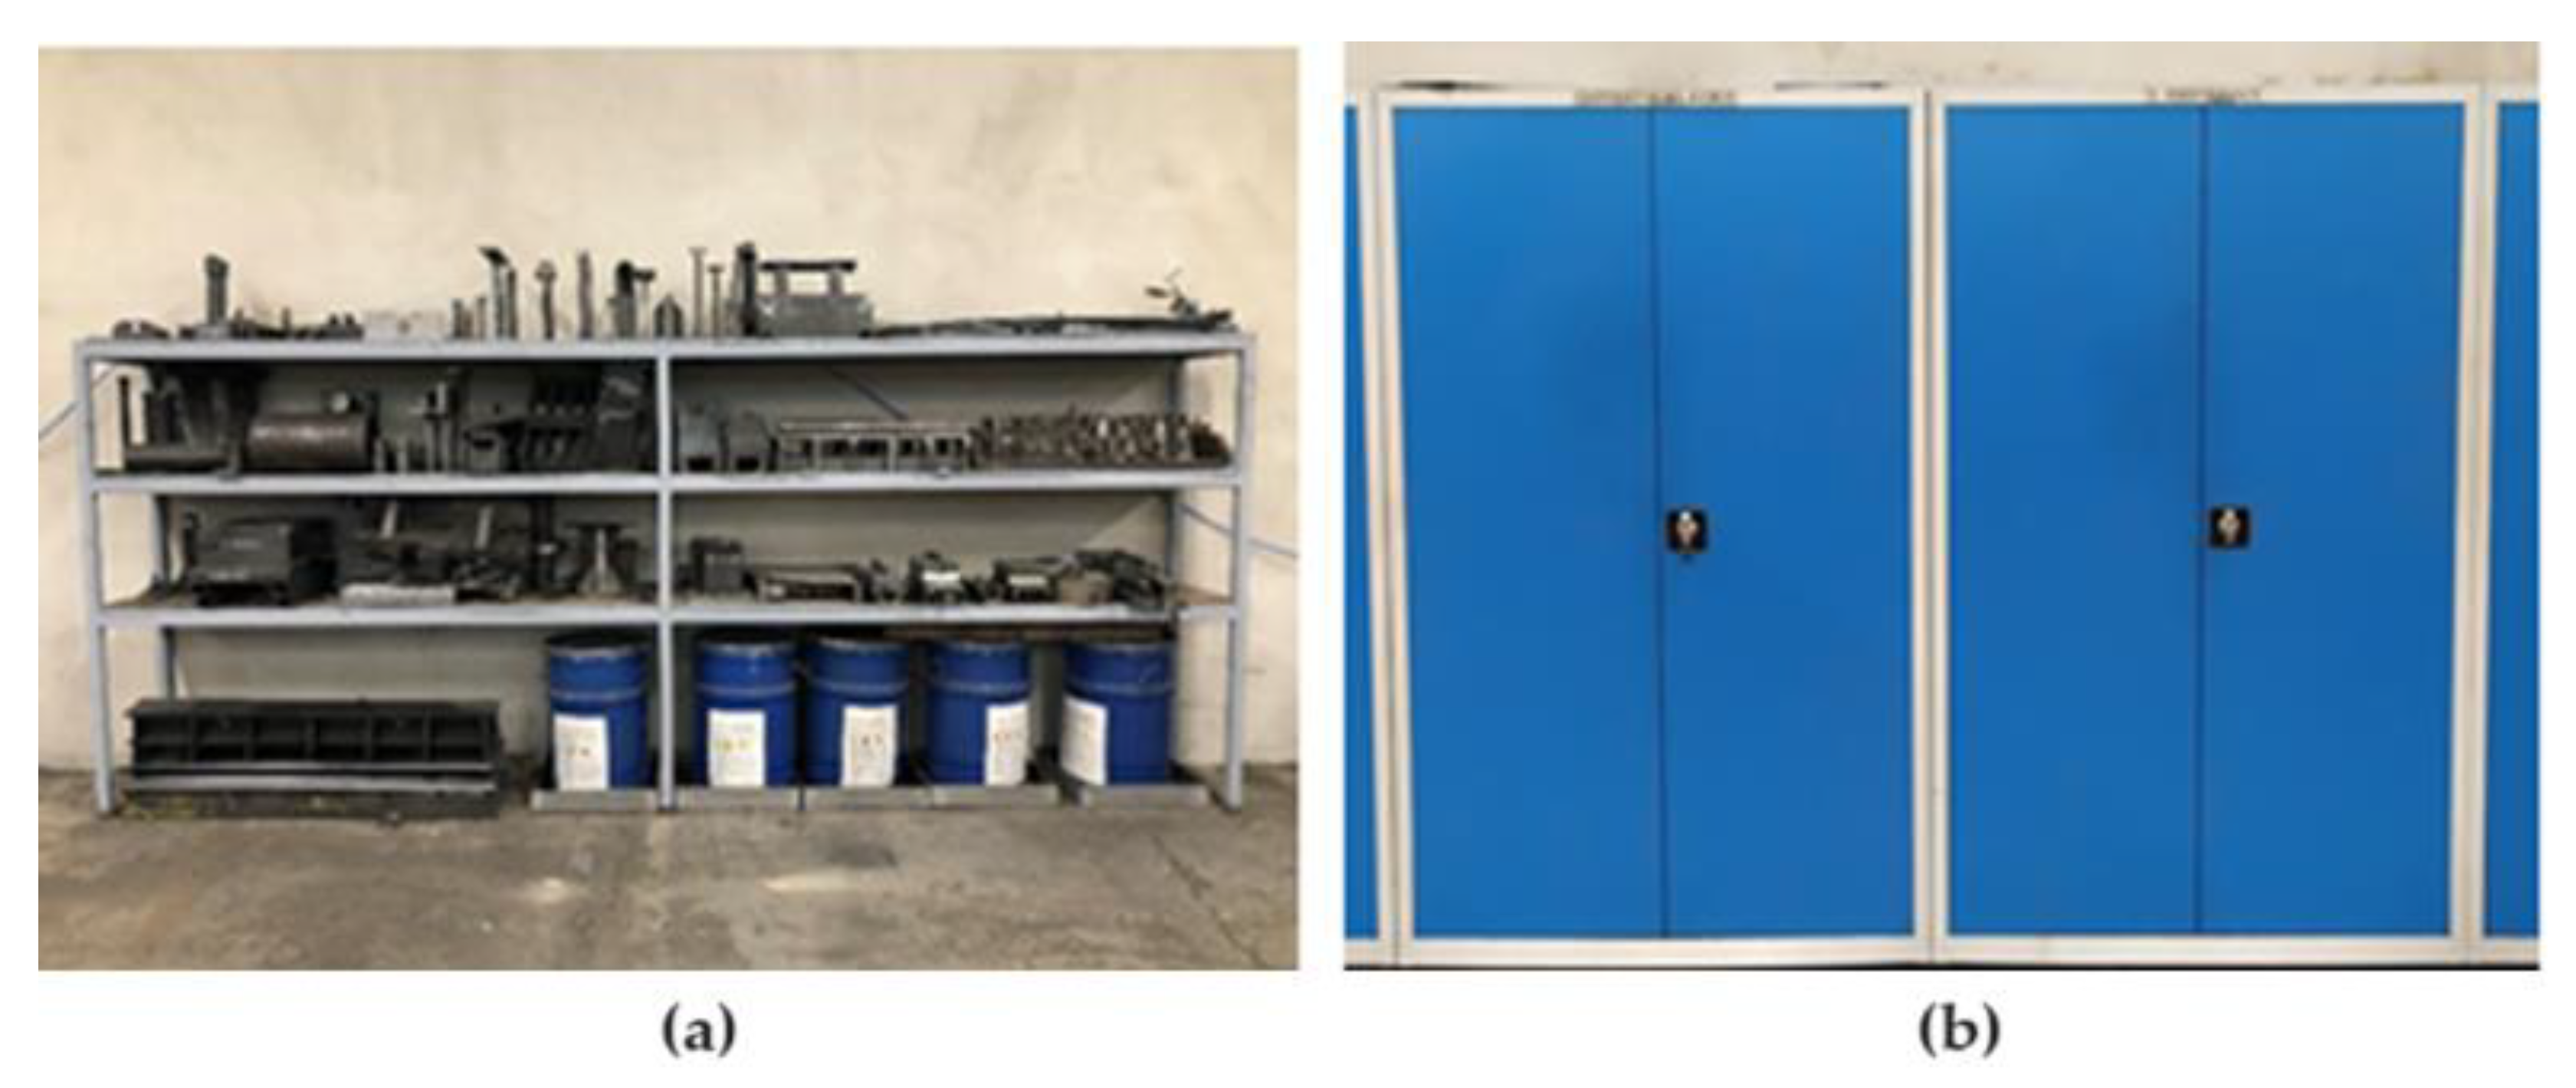
It was necessary to sort (Seiri) these fixtures in terms of their real use, label them, and arrange them (Seiton) (Figure 3a). Cleanliness (Seiso) in a workplace where mechanical metalworking occurs can only be achieved up to a certain level. Cabinets (Figure 3b) were set up to accommodate smaller fixtures. This provided greater protection against contamination of the fixtures and eliminated complicated cleaning.
Standardization of the workplace (Seiketsu) was not realized by establishing a record of the fixtures or their inventory. This was due to the small group of workers working with the same fixtures. They use them, clean them, and put them away in a designated place. The idea behind the 5S tool is that a lot depends on the attitude and skills of the workers themselves. Their behavior at home should not be fundamentally different from their behavior at the workplace [41,42,43]. As far as the identification of the fixture is concerned, an identification label with the drawing number and the customer for whom the fixture was used can be used. This will help the worker to quickly identify the fixture in question. As part of self-discipline (Shitsuke), it was necessary to train and supervise the workers to follow the rules established by the 5S tool.
Kaizen is often freely translated as continuous improvement [40,44,45]. The application of the Kaizen tool in the conditions of the selected company focused on the improvement of individual operations in production with a view to reducing overall time. Its application involves a standardized procedure. These steps are define the problem, analyze the problem, propose a solution, verify solution, quantify the result, and standardize. The Kaizen tool has been applied to a product that is repeated with some regularity in production. Specifically, it was the operation of welding two steel profiles to right angles on this product (define the problem). The problem involved multiple manufacturing operations. It involved bending the sheet metal, regrinding the corners, bending to ensure the corners were cast, welding, and grinding the weld (Figure 4). The product had to be moved to multiple workstations within the production floor for this purpose (analyze the problem).
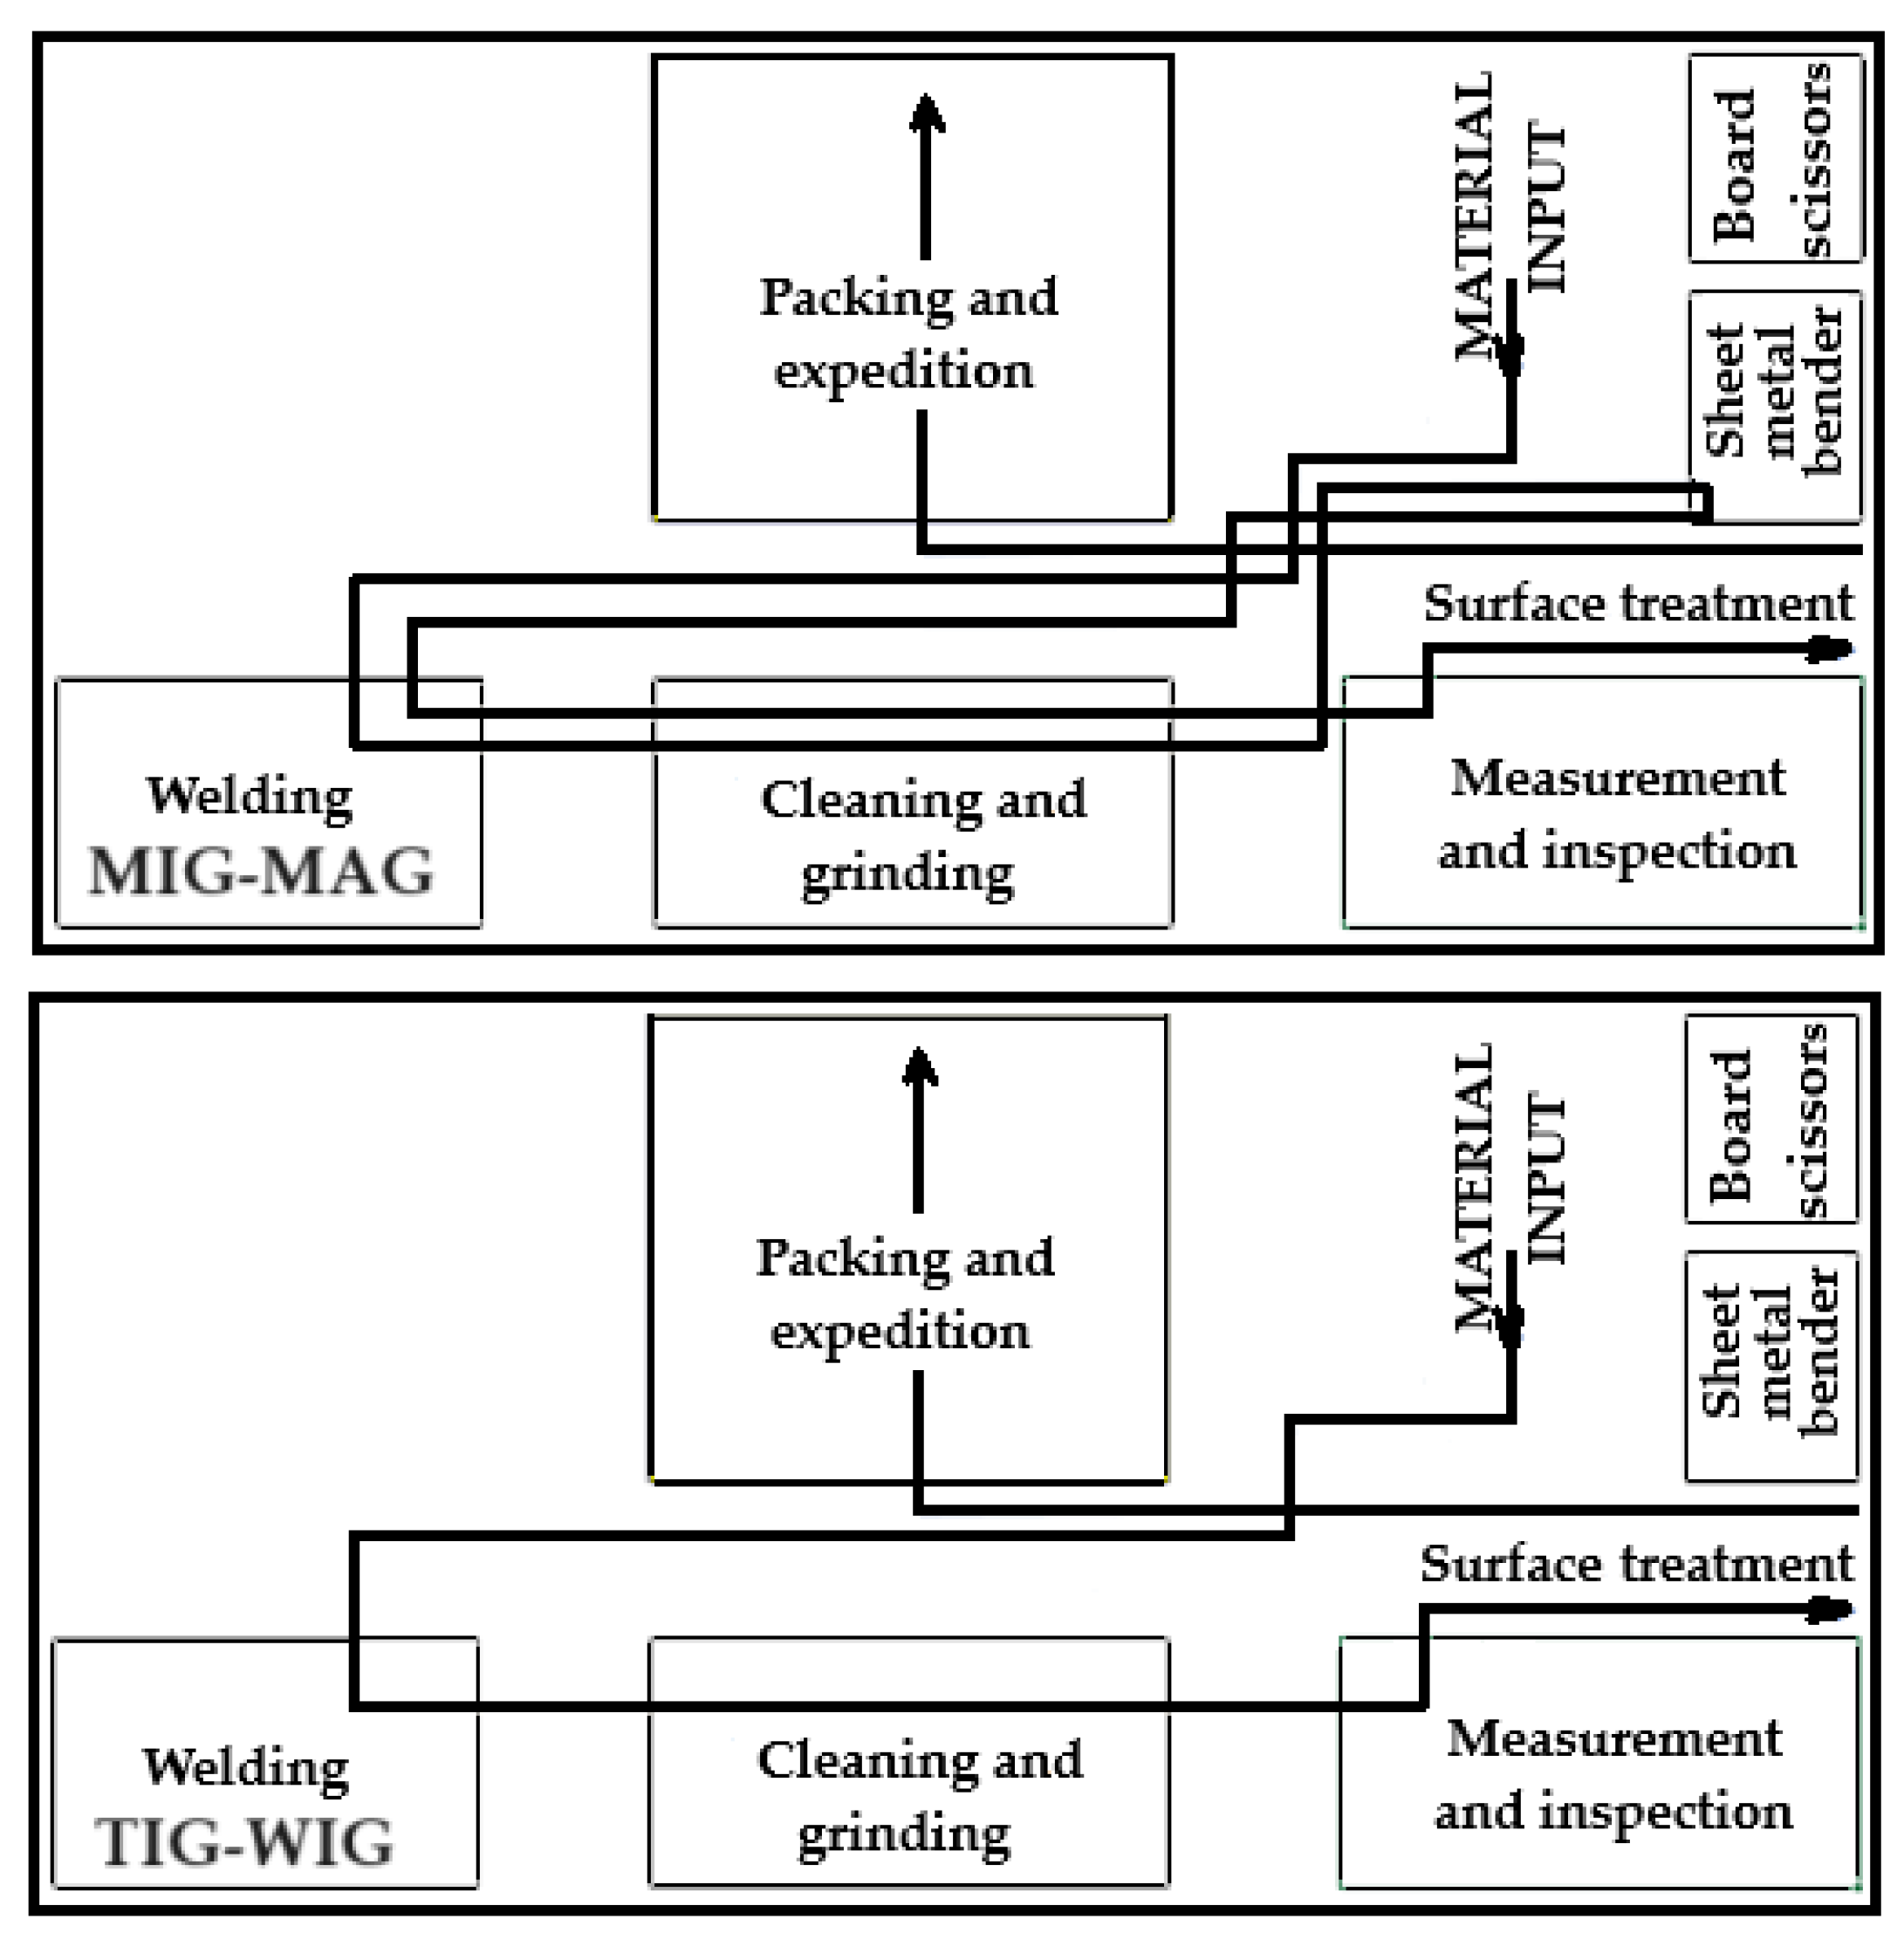
To eliminate unnecessary movement of product around the production hall, a way to reduce this was searched for. The proposed solution was to change the welding technology from MIG-MAG to TIG-WIG. The changed welding technology does not require subsequent grinding of the weld. This significantly shortened the movement of the product around the production hall (propose a solution). The movement of the product during processing before and after the introduction of TIG-WIG welding technology is illustrated in Figure 5.
As part of the verification of the solution, a time measurement was performed (verify solution). The processing time was measured before and after the implementation of the solution. The measured times are shown in the following table (Table 5).
The overall evaluation of the above solution resulted in 17% time savings. Standardization as the last step of the Kaizen tool involved modifying the work instruction as well as retraining the workers on these changes (standardize).
Another tool applied was PDCA. Its application has no restriction and can be applied anywhere and to any activity [46,47]. The idea of PDCA has been applied to the needs of the production planning process. Since it is a piece production, the production plan changes frequently. There are deviations between the estimated and actual production time or in scheduling the capacity of workers. A production plan (Figure 6) has been created and is prepared for each day in advance. The production plan is a record card in which outsourced processes, current orders in production, and delivery times are entered.
The column marked as “ST” denotes the indication of the surface finish requirement of the product in question. The columns “M, L, O” represent records of external processes provided in cooperation with suppliers. “Deli” represents the delivery date. “Expi” indicates the remaining days until the completion of the contract or indicates a delay of the contract beyond the delivery date. “Who” represents a column with the names of the workers who are performing each activity within the contract. The above production schedule both serves and secures all PDCA steps. It is about production planning, production execution, continuous monitoring of the plan, and, if necessary, taking measures to solve problems. This production plan has become a fixed part of production planning and management in the company under study.
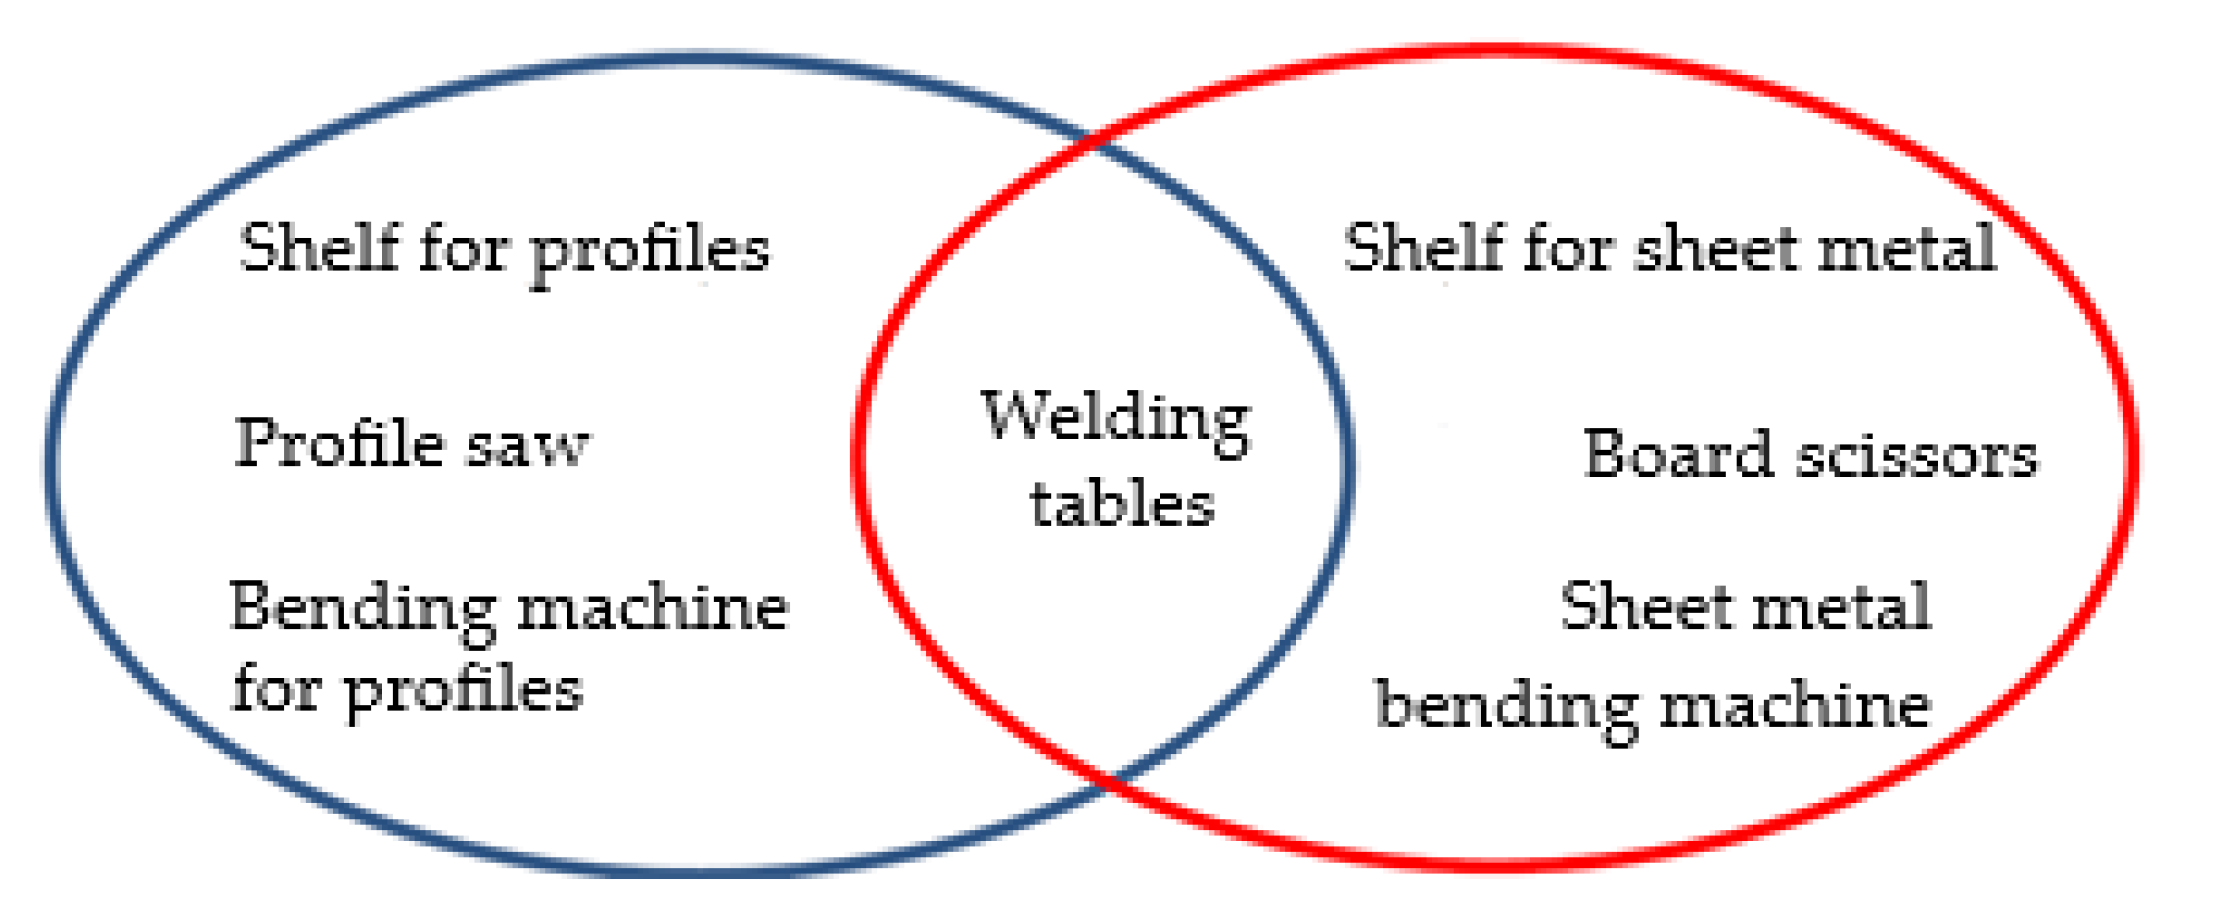
Gemba’s idea is to manage processes directly from where production takes place, not from behind a desk in an office. It is necessary to personally walk through the workplace so that those in charge are aware of the context, the needs, and the problems related to production [5,48,49]. Only in this way can weaknesses or pre-existing problems be detected. By visiting the production area, it was concluded that the material flow can be improved. It was necessary to analyze the nature of the production. By analyzing the history of all the orders carried out, it was found that sheet metal was the most frequently processed material (60%). The remaining 40% is made up of the processing of various profiles. Up to 85% of the total production was products and only 15% was a service. A product in the company under study is understood to be one for which all inputs are provided by the company itself. It is a service when the customer supplies the material on which the technological operations required by the customer are carried out. It was necessary to rearrange the production machines to shorten the material flow. Groups of machines were created which process the same type of material. The result of the arrangement of the machines is shown in Figure 7.
In the professional world, the Japanese word Muda covers the various kinds of wastage that a business can commit. The 7 types of wastage [1,2,42,50] are the most mentioned. These are Transport, Inventory, Motion, Waiting, Overproduction, Overprocessing, and Defects. Piece production is production to order. For this reason, wastage—Overproduction—does not tend to occur in a company. Inventory represents excess stock of materials, semi-finished goods, and components, including finished goods [2,43,51]. In the company under study, there were no warehouses with material. The company is stocked with material directly for a given order. Due to the diversity of production, many different sockets were accumulated in the production area. These were tools, fixtures, and leftover material from completed orders for later use. Therefore, sorting of these items every 3 months was introduced. Motion represents unnecessary staff movements. The company is a logically arranged workplace, including the necessary materials, to minimize the movement of workers during work activities [42,51]. All material brought into the plant is deposited directly into the production area where it is processed. In the company under study, this was an arrangement of workstations for sheet metal processing, profile processing, and assembly workstations. The result of the workstation layout is shown in Figure 8.
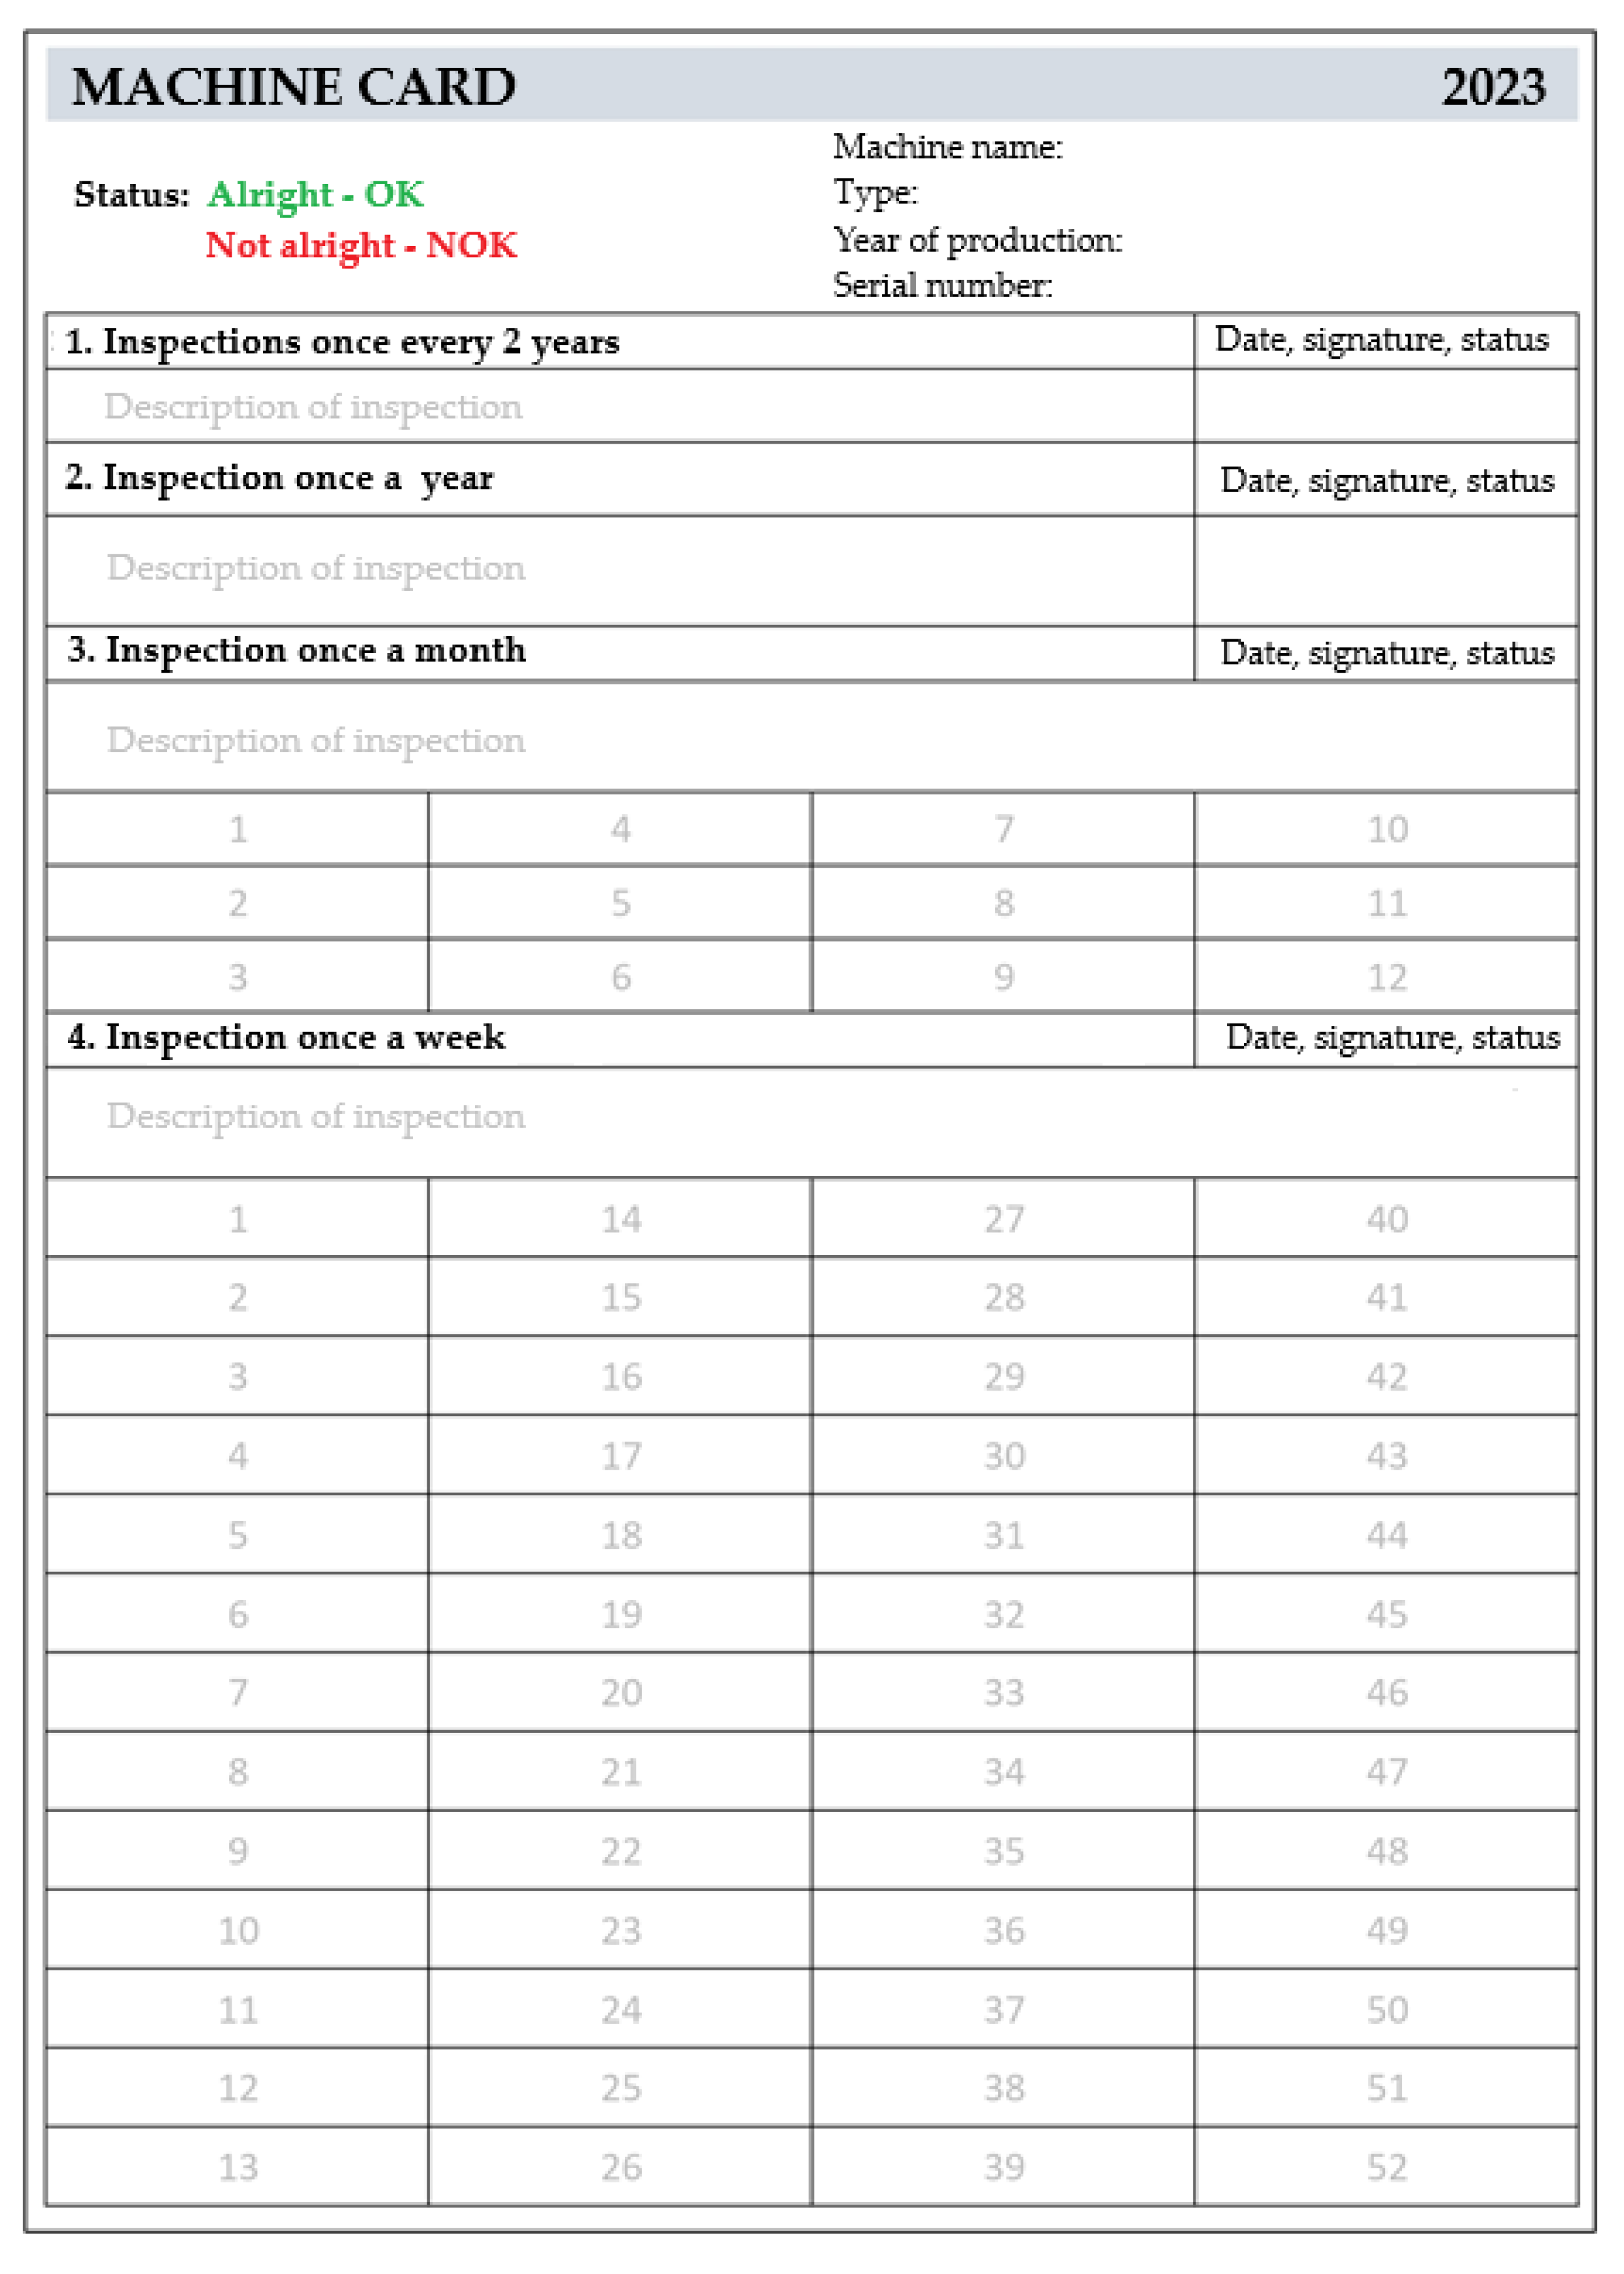
Transport is a supporting activity of any production, even though it does not create added value. The ideal transport is one that ensures the import of materials and the dispatch of final products [45,52,53]. Transport in the present company was already significantly modified during the implementation of Gemba (described above). After entering the company, the material is placed in the workplace on designated shelves (Figure 9). From there, it proceeds to the individual production activities according to the order. This has significantly reduced unnecessary transport of material during its processing to the final product. Waiting is a type of wastage in a process when it is interrupted. Waiting due to machine breakdown or waiting for material can also be included [4,5,48,54]. The above-mentioned implemented changes in the investigated company also contributed to the reduction of waiting time. In addition, a machine card (Figure 9) was introduced to determine the scope of inspection and maintenance activities for a given machine. The scope and frequency of these activities were based on the use of the machine.
Defects are part of every production. The goal is to prevent the occurrence of non-conforming products [39,40,48,55,56]. The application of the changes described for the 5S tool above has contributed to the reduction of the occurrence of defects. Input, inter-operational, and output inspection was implemented in the studied company. Input control provides control of the material entering production. The inter-operational control aims to prevent further processing of the material in the event of a defect occurrence. Output control is used to intercept non-conforming product prior to shipment to the customer unless the product has already been intercepted during production. Overprocessing also includes those activities that remove a non-conformity on the product. It goes, for example, about sorting (regrade), correction, rework, or repair [45,57,58,59]. In the company under study, the focus was on the information system. There are many applications on the market ranging from scheduling, asset registration, warehouse management, and document databases to accounting [60,61,62,63]. However, the available information systems are focused on larger companies or companies with series production. A small company with series production does not need a complex solution, but a small simple support for management [2,62]. The final solution to the problem of the lack of an information system in the company under study was to create a custom information system using MS Access 2016 software.
Goals are necessary for any human activity. The degree to which they have been met makes it possible to assess whether the maximum has been done to meet them. Smart Goals are used to enable a company to correctly formulate the goals it wants to achieve [5,45,50]. In the conditions of the studied company, Smart Goals were applied in three levels. Quality goals, goals in production (production plan), and goals to ensure operable production machines were defined. The investigated company wants to apply a quality management system (QMS) according to ISO 9001, where quality objectives are the required documented information. This will also help the company in preparation for later QMS certification. Quality objectives are formulated considering their specificity, measurability, achievability, relevance, and time limit. For a production plan, the time bound is set at 24 h. The production plan is largely addressed by the PDCA tool (described above). The maintenance targets have become part of the established machine card, which is described within the Muda tool (Figure 9).
There are situations where visualization of information is more appropriate than written text. Visual Workplace creates workplace conditions where the worker gets quick, relevant, and correct information. In contrast, written text can be tedious to read and runs the risk of misinterpretation [64,65,66,67,68,69,70]. In the conditions of the studied company, it was necessary to visualize most of the management documents. These were primarily work instructions related to production, assembly, and packaging (Figure 10).
Arranging the shelves with the components and visually displaying them made it faster to identify their storage and it reduced the workers’ search time and, thus, the overall assembly time (Figure 11).

3. Results

In the following, the results that this application of the quality tools (Lean tools) in the company under study achieved are presented.
The application of the 5S tool reduced the number of fixtures that the company under study had at its disposal by half (−50%). Those that were retained were tagged and organized. Figure 3 and Figure 4 may serve as one piece of evidence. The established workplace order reduced the inventory time by half, from the original 4 h to 2 h.
The application of the Kaizen tool reduced the production time by 17% (Table 4). The application and evaluation of the benefits was carried out on one product type to make the comparison of the situation before the changes were introduced and the results achieved after the introduction relevant.
By applying the PDCA tool, a new production plan was introduced in the company under study (Figure 6). The introduction of a system for the timely provision of external products and processes brought about a smooth production flow. Downtime due to waiting for undelivered material to production was reduced by approximately 98%. The introduction of a production plan and adherence to it reduced the waiting time measured over 3 months from 8 h to 10 min. The production process has been accelerated and the volume of units produced per week has increased by 10 to 15%.
When the Gemba tool was applied, the percentage of processed material types in production was determined by analysis. The analysis was the basis for the layout of the workplace. The workplace layout divided the production area into two parts. A section for processing profiles and a section for processing sheet metal (Figure 8). The dedicated space for sheet metal and profiles eliminated wastage from the transport. The transport paths for sheet metal and profiles do not cross. This eliminated transport collisions and minor work accidents that occasionally happened before the changes were introduced. The elimination of occupational accidents was monitored for 3 months of operation. Arranging the machines with respect to what was described above (Figure 8) increased the capacity capabilities of the company under study by 20%.
In applying the Muda tool, the aim was to identify all the basic types of wastage that a company may commit. Based on the nature of piece-rate contract manufacturing, overproduction cannot occur. Only as many units as the customer requires are produced. No overproduction was identified in the undertaking under examination and, therefore, no action was necessary in this respect. Overstocks (inventory) were identified in the company under study. To reduce them, up to 50% of the fixtures were removed after the analysis of the actual requirement. A six-monthly cycle for their sorting was introduced with the aim of removing 10% of the stockpiled formulations. In total, 70% of the material that was stored there as leftover material from completed orders was removed from the profile shelves. Like the fixtures, a six-month cycle was implemented to sort and dispose of 30% of the material from completed orders. Reducing unnecessary movement (motion) was achieved by arranging production machines and shelves in the workplace (Figure 8). When measuring the impact, a 13% reduction in production time was achieved for a frequently repeated product (expressed in time, this is 16 min less). The workplace layout, as mentioned above, also had an impact on material transport. Incoming material is shelved directly at the entrance, eliminating previous material handling and distribution on the production floor. From the shelves, the material goes directly to the workplace where it is processed. The material transport is reduced to just the handling—the necessary transport. Unnecessary transport has been eliminated by the reorganization of the workplace. Wastage from waiting was occurring in the company under study due to machine breakdown and the unavailability of input material for production or incomplete production documentation. It should be noted that some of the production machines in the company under study were more than 20 years old. Unexpected breakdowns caused an average of 25 h of waiting per year. In the single-shift operation of the company under study, this represents more than 3 days of production. Once scheduled maintenance measures were introduced at weekly, monthly, annual, and bi-annual frequencies, there was an 80% reduction. The downtime from unexpected breakdowns now amounts to 5 h in one year. Waiting due to missing material at the input or from insufficient production documentation has been almost eliminated with the introduction of the production schedule (Figure 6). Waiting for 3 months of impact tracking was only related to waiting for material (10 min), see PDCA description. The wastage resulting from the number of non-conforming products (defects) was 0.5% of the total volume of products sold in the company under study before the introduction of Lean tools. The introduction of three levels of control (input, intermediate, and output) reduced the number of non-conforming products to 0.3% of the total number of pieces sold. In financial terms this amounts to EUR 2000 per 12 months. In the company under study, there was a low level of wastage from repeated machining and repairs of products (overprocessing) during production even before the introduction of Lean tools. The introduction of a new information system using MS Access created a software environment for creating or sending documents on a one-click (Push One Button) basis. It is very easy to generate a delivery note, an invoice, or a PDF version of a document and prepare it for dispatch with one click in this information system. The speed of administrative processes has been doubled.
The effort in applying the Smart Goals tool was to use this to the benefit of defining quality objectives, as the company under study was interested in implementing a quality management system according to the ISO 9001 standard. Quality objectives are essential in the planning of this system. The quality objectives were defined in such a way that they were measurable, time-bound, and a person was assigned to be responsible for achieving them. The last year of the assessment showed that the quality objectives were accepted and fully achieved. The second place where targets were defined was in production. A production plan was put in place in which targets were set and reviewed daily (Figure 6). The production plan eliminated waiting due to the unavailability of input material and a delay in the delivery of products to customers. The third place where targets were introduced was in the maintenance of production machinery. The benefits of introducing targets for maintenance activities are described in the section where wastage from waiting is described.
The application of the Visual Workplace tool was an effort to make production workflows more transparent. It was about the faster orientation of workers when performing activities (Figure 10) and finding the necessary templates, fixtures (jigs), tools, or components assembled at the assembly workplace (Figure 11). The visualization of the packing workplace reduced the assembly time (including packing) by 10%. The lead time was 75 min for a single product. After the introduction of the visual workplace, it is now 67 min.

4. Discussion

Business sustainability is important for every company so that the continuity of business activities is maintained, and the company cannot constantly increase the prices of its products. The competitive battle between small companies is becoming more and more fierce. Pricing policy pushes businesses to the very edge of profit and loss. Therefore, it is important for the company to look for ways to make its operations more efficient and thus ensure the running of its business. One way is to use various tools that are used in mass production and are an integral part of their business strategy. This fact was the motivation for this research, to identify quality (Lean) tools that can be applied in the conditions of a small company with serial production. The research confirmed two facts.
The fact that was predictable is that there are tools that could be applicable in a small business with piece production with real benefits. By analyzing each of the quality (Lean) tools, seven such tools were identified. To confirm the analysis, it was necessary to apply these tools to a small business with piece production. The individual benefits are listed above in the text.
The second fact is that the application of the ideas of the individual tools sometimes overlapped. This means that the application of two tools complements each other or the results obtained can be presented as the impact of two different tools. The tools are somehow intertwined, complementary, or even like each other. Looking at each tool separately, it is a full-fledged tool with predictable expectations (benefits) in advance. When multiple tools are applied simultaneously, as research has shown, some of the benefits of the individual tools merge into one. It is more difficult to say, unequivocally, that the outcome achieved is the impact of this or another Lean tool. Or, to put it another way, a given impact can be presented for multiple tools implemented. For the successful application of one tool, the support of the other tool can be leveraged. One example can be presented: 5S, Muda, and Visual Workplace tools. Their current application is really a synergy rather than just a stand-alone application of each tool separately with the expectation of completely different impacts for the company. A very important final note is that Lean does not mean only the application of Lean tools. It is also about people and a learning organization. This means that the success of applying Lean tools and the level of results strongly depends on the knowledge of Lean tools. The limitation of the achieved worker and the practical result is the degree of knowledge of all Lean tools, as well as the motivation of all workers in the company.
Based on the above, efforts will be made to continue research in the application of quality (Lean) tools in other small companies with piece production. The aim will be to find collaborating companies, applying the same Lean tools, to confirm what has been found so far or to identify new findings.

5. Conclusions

Small and medium companies are the pillar of the gross domestic product of every country. They are companies without which the big ones could not exist. Businesses face daily various challenges that are generated by changes (cultural, social, geo-political, and competitive). Therefore, we focused our research on a small manufacturing company that must face these changes and adapt to maintain its business. The goal of the research was to analyze, identify, and verify the possibility of applying quality (Lean) tools used in regular serial production in specific conditions of piece production in a small company.
This fact was the inspiration for our research, with which we wanted to support the competitiveness of small companies. We established two research tasks. One was focused on the analysis and identification of suitable quality (Lean) tools for piece production in small companies. The second task was verified through an application in a real small company with piece production.
Based on the comparison of knowledge about Lean tools and knowledge about the specifics of piece production in a small company, we identified seven Lean tools. Through the subsequent application of the identified Lean tools, we came to interesting findings. There was a reduction in the movements of workers at the workplace by the better positioning of machines and stored material for work; production time was reduced, resulting in an increase in the potential production capacity; the warehouse with forms and textures for individual types of products was reduced; supply logistics were improved; and occupational accidents were eliminated (during the monitored period).

Author Contributions

Conceptualization, Š.M. and M.Š.; methodology, Š.M.; validation, Š.M., M.Š., and M.F.; formal analysis, Š.M.; investigation, M.Š.; resources, Š.M. and M.F.; data curation, M.F.; writing—original draft preparation, Š.M.; writing—review and editing, Š.M.; visualization, M.F.; supervision, Š.M.; project administration, M.Š.; funding acquisition, Š.M. All authors have read and agreed to the published version of the manuscript.

Funding

This research has been supported by the grant of KEGA 026TUKE-4/2023 Development Knowledge Support in the field of the quality management system requirements implementation in Aviation, Space and Defense Industry.

Institutional Review Board Statement

Not applicable.

Informed Consent Statement

Not applicable.

Data Availability Statement

Data are contained within the article.

Conflicts of Interest

Author Milan Fiľo was employed by the company ECO-INVEST. The remaining authors declare that the research was conducted in the absence of any commercial or financial relationships that could be construed as a potential conflict of interest.

References

  1. Nguyen, T.M.P.; Ngo, T.H.C. Determinants Influencing the Application of Lean Accounting: The Case of Vietnamese Garment Firms. J. Risk Financ. Manag. 2023, 16, 279. [Google Scholar] [CrossRef]
  2. Qureshi, K.M.; Mewada, B.G.; Buniya, M.K.; Qureshi, M.R.N.M. Analyzing Critical Success Factors of Lean 4.0 Implementation in Small and Medium Enterprises for Sustainable Manufacturing Supply Chain for Industry 4.0 Using PLS-SEM. Sustainability 2023, 15, 5528. [Google Scholar] [CrossRef]
  3. Kotturu, C.M.V.V.; Mahanty, B. Determinants of SME integration into global value chains: Evidence from Indian automotive component manufacturing industry. J. Adv. Manag. Res. 2017, 14, 313–331. [Google Scholar] [CrossRef]
  4. García-Alcaraz, J.L.; Sánchez Ramírez, C. Special Issue on Applied Engineering to Lean Manufacturing and Production Systems 2020. Appl. Sci. 2022, 12, 8897. [Google Scholar] [CrossRef]
  5. Santos, E.; Lima, T.M.; Gaspar, P.D. Optimization of the Production Management of an Upholstery Manufacturing Process Using Lean Tools: A Case Study. Appl. Sci. 2023, 13, 9974. [Google Scholar] [CrossRef]
  6. Vujica, H.N.; Tonchia, S. An Instrument for Measuring the Degree of Lean Implementation in Manufacturing. Stroj. Vestn. J. Mech. Eng. 2014, 60, 797–803. [Google Scholar] [CrossRef]
  7. Alsmadi, M.; Almani, A.; Jerisat, R. A comparative analysis of Lean practices and performance in UK manufacturing and service sector firms. Total Qual. Manag. Bus. Excell. 2012, 23, 381–396. [Google Scholar] [CrossRef]
  8. Bortolotti, T.; Boscari, S.; Danese, P. Successful lean implementation: Organizational culture and soft lean practices. Int. J. Prod. Econ. 2015, 160, 182–201. [Google Scholar] [CrossRef]
  9. Meng, X. Lean management in the context of construction supply chains. Int. J. Prod. Res. 2019, 57, 3784–3798. [Google Scholar] [CrossRef]
  10. Powell, D.; Binder, A.; Arica, E. MES Support for Lean Production. In Proceedings of the Advances in Production Management Systems. Competitive Manufacturing for Innovative Products and Services, Rhodes, Greece, 24–26 September 2012. [Google Scholar]
  11. Liker, J.K. Toyota Way: 14 Management Principles from the World’s Greatest Manufacturer, 1st ed.; McGraw-Hill: New York, NY, USA, 2004; pp. 23–27. [Google Scholar]
  12. Ringen, G.; Aschehoug, S.; Holtskog, H.; Ingvaldsen, J. Integration Quality and Lean into a Holistic Production System. In Proceedings of the 47th CIRP Conference on Manufacturing Systems—Variety Management in Manufacturing, Windsor, ON, Canada, 28–30 April 2014. [Google Scholar]
  13. Liker, J.K.; Meier, D. The Toyota Way Fieldbook: A Practical Guide for Implementing Toyota′s 4P′s, 1st ed.; McGraw-Hill: New York, NY, USA, 2006; pp. 32–36. [Google Scholar]
  14. Wilson, L. How to Implement Lean Manufacturing, 1st ed.; McGraw-Hill: New York, NY, USA, 2010; pp. 75–88. [Google Scholar]
  15. Carreira, B. Lean Manufacturing That Works: Powerful Tools for Dramatically Reducing Waste and Maximizing Profit; American Management Association: New York, NY, USA, 2005. [Google Scholar]
  16. Minovski, R.; Jovanoski, B.; Galevski, P. Lean implementation and implications: Experiences from Macedonia. Int. J. Lean Six Sigma 2021, 12, 78–97. [Google Scholar] [CrossRef]
  17. Womack, J.P.; Jones, D.T. Lean Thinking: Banish Waste and Create Wealth in Your Corporation, 2nd ed.; Free Press: New York, NY, USA, 2003; pp. 112–129; 151–154. [Google Scholar]
  18. McQuater, R.E.; Scurr, C.H.; Dale, B.G.; Hillman, P.G. Using quality tools and techniques successfully. TQM Mag. 1995, 7, 37–42. [Google Scholar] [CrossRef]
  19. McDermott, O.; Antony, J.; Sony, M.; Fernandes, M.M.; Koul, R.; Doulatabadi, M. The Use and Application of the 7 New Quality Control Tools in the Manufacturing Sector: A Global Study. TQM J. 2023, 35, 2621–2639. [Google Scholar] [CrossRef]
  20. Castello, J.; De Castro, R.; Marimon, F. Use of quality tools and techniques and their integration into ISO 9001: A wind power supply chain case. Int. J. Qual. Reliab. Manag. 2020, 37, 68–89. [Google Scholar] [CrossRef]
  21. Bunney, H.S.; Dale, B.G. The implementation of quality management tools and techniques: A study. TQM Mag. 1997, 9, 183–189. [Google Scholar] [CrossRef]
  22. Rahman, S.; Laosirihongthong, T.; Sohal, A.S. Impact of lean strategy on operational performance: A study of Thai manufacturing companies. J. Manuf. Technol. Manag. 2010, 21, 839–852. [Google Scholar] [CrossRef]
  23. Karlsson, C.; Ahlstrom, P. Assessing changes towards lean production. Int. J. Oper. Prod. Manag. 1996, 16, 24–41. [Google Scholar] [CrossRef]
  24. Sanchez, A.M.; Perez, M.P. Lean indicators and manufacturing strategies. Int. J. Oper. Prod. Manag. 2001, 21, 1433–1451. [Google Scholar] [CrossRef]
  25. O’Donoghue, K.; Woods, B.; Morrissey, S.; Walsh, J. Adoption of Lean by AgriTech Companies in Ireland. In Proceedings of the 2023 IEEE International Symposium on Technology and Society, Swansea, UK, 13–15 September 2023. [Google Scholar]
  26. Demaj, E.; Mehillaj, D. Implementing Lean Manufacturing Approach in SMEs: A Case Study From the Food Processing Industry in Albania. In Digitalization, Sustainable Development, and Industry 5.0; Emerald Publishing Limited: Leeds, UK, 2023; pp. 149–162. [Google Scholar]
  27. Zahraee, S.M.; Golroudbary, S.R.; Hashemi, A.; Afshar, J.; Haghighi, M. Simulation of manufacturing production line based on arena. Adv. Mater. Res. 2014, 933, 744–748. [Google Scholar] [CrossRef]
  28. Rother, M.; Shook, J. Learning to See: Value Stream Mapping to Create Value and Eliminate Muda, 1st ed.; Lean Enterprise Institute: Boston, MA, USA, 2009; pp. 35–38. [Google Scholar]
  29. Nagapan, S.; Rahman, I.A.; Asmi, A.; Memon, A.H.; Zin, R.M. Identifying causes of construction waste: Case of Central Region of Peninsula Malaysia. Int. J. Integr. Eng. 2012, 4, 20–28. [Google Scholar]
  30. Zahraee, S.M.; Hashemi, A.; Abdi, A.A.; Shahpanah, A.; Rohani, J.M. Lean manufacturing implementation through value stream mapping: A case study. J. Teknol. 2014, 68, 119–124. [Google Scholar]
  31. Hatami, M.; Zahraee, S.M.; Khademi, A.; Shahpanah, A.; Rohani, J.M. Evaluating the effect of main factors in manufacturing production line based on simulation experiment. Appl. Mech. Mater. 2014, 60, 199–203. [Google Scholar] [CrossRef]
  32. Nikakhtar, A.; Hosseini, A.A.; Wong, K.Y.; Zavichi, A. Application of lean construction principles to reduce construction process waste using computer simulation: A case study. Int. J. Serv. Oper. Manag. 2015, 20, 461–480. [Google Scholar] [CrossRef]
  33. Suleiman, I.J.; Luvara, V.G.M. Factors influencing change of design of building projects during construction stage in DarEs-Salaam Tanzania. Int. J. Constr. Eng. Manag. 2016, 5, 93–101. [Google Scholar]
  34. Yap, J.B.H.; Low, P.L.; Wang, C. Rework in Malaysian building construction: Impacts, causes and potential solutions. J. Eng. Des. Technol. 2017, 15, 591–618. [Google Scholar] [CrossRef]
  35. Mpofu, B.; Ochieng, E.; Moobela, C.; Pretorius, A. Profiling causative factors leading to construction project delays in the United Arab Emirates. Eng. Constr. Archit. Manag. 2017, 24, 346–376. [Google Scholar] [CrossRef]
  36. Love, P.E.D.; Teo, P.; Ackermann, F.; Smith, J.; Alexander, J.; Paleneeswaran, E.; Morrison, J. Reduce rework, improve safety: An empirical inquiry into the precursors to error in construction. Prod. Plan. Control 2018, 29, 353–366. [Google Scholar] [CrossRef]
  37. Matthews, J.; Love, P.E.D.; Mewburn, J.; Stobaus, C.; Ramanayaka, C. Building information modelling in construction: Insights from collaboration and change management perspectives. Prod. Plan. Control 2018, 29, 202–216. [Google Scholar] [CrossRef]
  38. Womack, J.P.; Jones, D.T.; Roos, D. The Machine That Changed the World—The Story of Lean Production; Simon & Schuster: New York, NY, USA; Harper Perennial: New York, NY, USA, 2011; ISBN 978-07-432-9979-4. [Google Scholar]
  39. Proença, A.P.; Gaspar, P.D.; Lima, T.M. Lean optimization techniques for improvement of production flows and logistics management: The case study of a fruits distribution center. Processes 2022, 10, 1384. [Google Scholar] [CrossRef]
  40. Aka, A.; Abubakar, D.I.; Eze, C.J.; Owolabi, T. Application of lean manufacturing tools and techniques for waste reduction in Nigerian bricks production process. Eng. Constr. Archit. Manag. 2020, 27, 658–679. [Google Scholar] [CrossRef]
  41. Sundararajan, N.; Terkar, R. Improving productivity in fastener manufacturing through the application of Lean-Kaizen principles. Mater. Today Proc. 2022, 62, 1169–1178. [Google Scholar] [CrossRef]
  42. Ramakrishnan, V.; Nallusamy, S. Implementation of total productive maintenance lean tool to reduce lead time—A case study. Int. J. Mech. Eng. Technol. 2017, 8, 295–306. [Google Scholar]
  43. Medyński, D.; Bonarski, P.; Motyka, P.; Wysoczański, A.; Gnitecka, R.; Kolbusz, K.; Dąbrowska, M.; Burduk, A.; Pawelec, Z.; Machado, J. Digital Standardization of Lean Manufacturing Tools According to Industry 4.0 Concept. Appl. Sci. 2023, 13, 6259. [Google Scholar] [CrossRef]
  44. Gallo, T.; Cagnetti, C.; Silvestri, C.; Ruggieri, A. Industry 4.0 tools in lean production: A systematic literature review. Procedia Comput. Sci. 2021, 180, 394–403. [Google Scholar] [CrossRef]
  45. Janjić, V.; Bogicevic, J.R.; Krstić, B. Kaizen as a global business philosophy for continuous improvement of business performance. Ekonomika 2019, 65, 13–25. [Google Scholar] [CrossRef]
  46. Harada, T. Management Lessons from Taiichi Ohno; McGraw-Hill: New York, NY, USA, 2015. [Google Scholar]
  47. Purvis, B.; Mao, Y.; Robinson, D. Three pillars of sustainability: In search of conceptual origins. Sustain. Sci. 2018, 14, 681–695. [Google Scholar] [CrossRef]
  48. Foley, I.; McDermott, O.; Rosa, A.; Kharub, M. Implementation of a Lean 4.0 Project to Reduce Non-Value Add Waste in a Medical Device Company. Machines 2022, 10, 1119. [Google Scholar] [CrossRef]
  49. García-Alcaraz, J.L.; Sánchez Ramírez, C. Special Issue on Applied Engineering to Lean Manufacturing Production Systems. Appl. Sci. 2022, 12, 8609. [Google Scholar] [CrossRef]
  50. Oliveira, C.; Lima, T.M. Setup Time Reduction of an Automotive Parts Assembly Line Using Lean Tools and Quality Tools. Eng 2023, 4, 2352–2362. [Google Scholar] [CrossRef]
  51. Androniceanu, A.; Enache, I.-C.; Valter, E.-N.; Raduica, F.-F. Increasing Energy Efficiency Based on the Kaizen Approach. Energies 2023, 16, 1930. [Google Scholar] [CrossRef]
  52. Langlotz, P.; Siedler, C.; Aurich, J.C. Unification of lean production and industry 4.0. Procedia CIRP 2021, 99, 15–20. [Google Scholar] [CrossRef]
  53. Moeuf, A.; Pellerin, R.; Lamouri, S.; Tamayo-Giraldo, S.; Barbaray, R. The industrial management of SMEs in the era of Industry 4.0. Int. J. Prod. Res. 2018, 56, 1118–1136. [Google Scholar] [CrossRef]
  54. Poswa, F.; Adenuga, O.T.; Mpofu, K. Productivity Improvement Using Simulated Value Stream Mapping: A Case Study of the Truck Manufacturing Industry. Processes 2022, 10, 1884. [Google Scholar] [CrossRef]
  55. Matenga, A.E.; Mpofu, K. Blockchain-Based Cloud Manufacturing SCM System for Collaborative Enterprise Manufacturing: A Case Study of Transport Manufacturing. Appl. Sci. 2022, 12, 8664. [Google Scholar] [CrossRef]
  56. Niekurzak, M.; Lewicki, W.; Coban, H.H.; Bera, M. A Model to Reduce Machine Changeover Time and Improve Production Efficiency in an Automotive Manufacturing Organisation. Sustainability 2023, 15, 10558. [Google Scholar] [CrossRef]
  57. Tsao, Y.C.; Lee, P.L.; Liao, L.W.; Zhang, Q.; Vu, T.L.; Tsai, J. Imperfect economic production quantity models under predictive maintenance and reworking. Int. J. Syst. Sci. Oper. Logist. 2020, 7, 347–360. [Google Scholar] [CrossRef]
  58. Umar, R.Z.R.; Tiong, J.Y.; Ahmad, N.; Dahalan, J. Development of framework integrating ergonomics in Lean’s Muda, Muri, and Mura concepts. Prod. Plan. Control. 2023, 24, 1–9. [Google Scholar] [CrossRef]
  59. Heston, T. Ergonomics: The First Step to Lean. Fabr. Metalwork. 2006, 5, 52. [Google Scholar]
  60. Nagamachi, M. Japanese Style of production system after lean production. In First World Congress on Ergonomics for Global Quality and Productivity; Educational Technology Center: Hong Kong, China, 1998; Volume 8, pp. 109–112. [Google Scholar]
  61. Karthika Devi, M.S.; Bhuvaneshwari, R.; Kavin Pragadeesh, K.; Ramachandran, B. IPD—An Investment Portfolio Detector Using SEBI API. In Information and Communication Technology for Competitive Strategies (ICTCS 2021) Intelligent Strategies for ICT; Springer Nature: Singapore, 2022; pp. 555–567. [Google Scholar] [CrossRef]
  62. Jia, F. Enterprise management and monitoring in the background of big data and Internet of Things. J. Comput. Methods Sci. Eng. 2023, 23, 1679–1690. [Google Scholar] [CrossRef]
  63. Vuković, M.; Jorg, O.; Hosseinifard, M.; Fantoni, G. Low-Cost Digitalization Solution through Scalable IIoT Prototypes. Appl. Sci. 2022, 12, 8571. [Google Scholar] [CrossRef]
  64. Jiang, D.; Ni, Z.; Chen, Y.; Chen, X.; Na, C. Influence of Financial Shared Services on the Corporate Debt Cost under Digitalization. Sustainability 2023, 15, 428. [Google Scholar] [CrossRef]
  65. Sabih, M.; Farid, M.S.; Ejaz, M.; Husam, M.; Khan, M.H.; Farooq, U. Raw Material Flow Rate Measurement on Belt Conveyor System Using Visual Data. Appl. Syst. Innov. 2023, 6, 88. [Google Scholar] [CrossRef]
  66. Furman, J.; Małysa, T. The role of visual management in the organization of safe work in production companies. Prod. Eng. Arch. 2023, 29, 195–200. [Google Scholar] [CrossRef]
  67. Mazur, M.; Momeni, H. Lean production issues in the organization of the company—The first stage. Prod. Eng. Arch. 2018, 21, 36–39. [Google Scholar] [CrossRef]
  68. Sá, J.C.; Manuel, V.; Silva, F.J.G.; Santos, G.; Ferreira, L.P.; Pereira, T.; Carvalho, M. Lean Safety-assessment of the impact of 5S and Visual Management on safety. IOP Conference Series: Materials Science and Engineering; IOP Publishing: Bristol, UK, 2021; Volume 1193, p. 012049. [Google Scholar] [CrossRef]
  69. Chałada, M. Sustainable supply chain on the example of the steel sector in Poland. Metalurgija 2023, 162, 164–166. [Google Scholar]
  70. Furman, J.; Kuczyńska-Chałada, M. Change management in lean enterprise. Eng. Manag. Prod. Serv. 2016, 8, 23–30. [Google Scholar] [CrossRef]
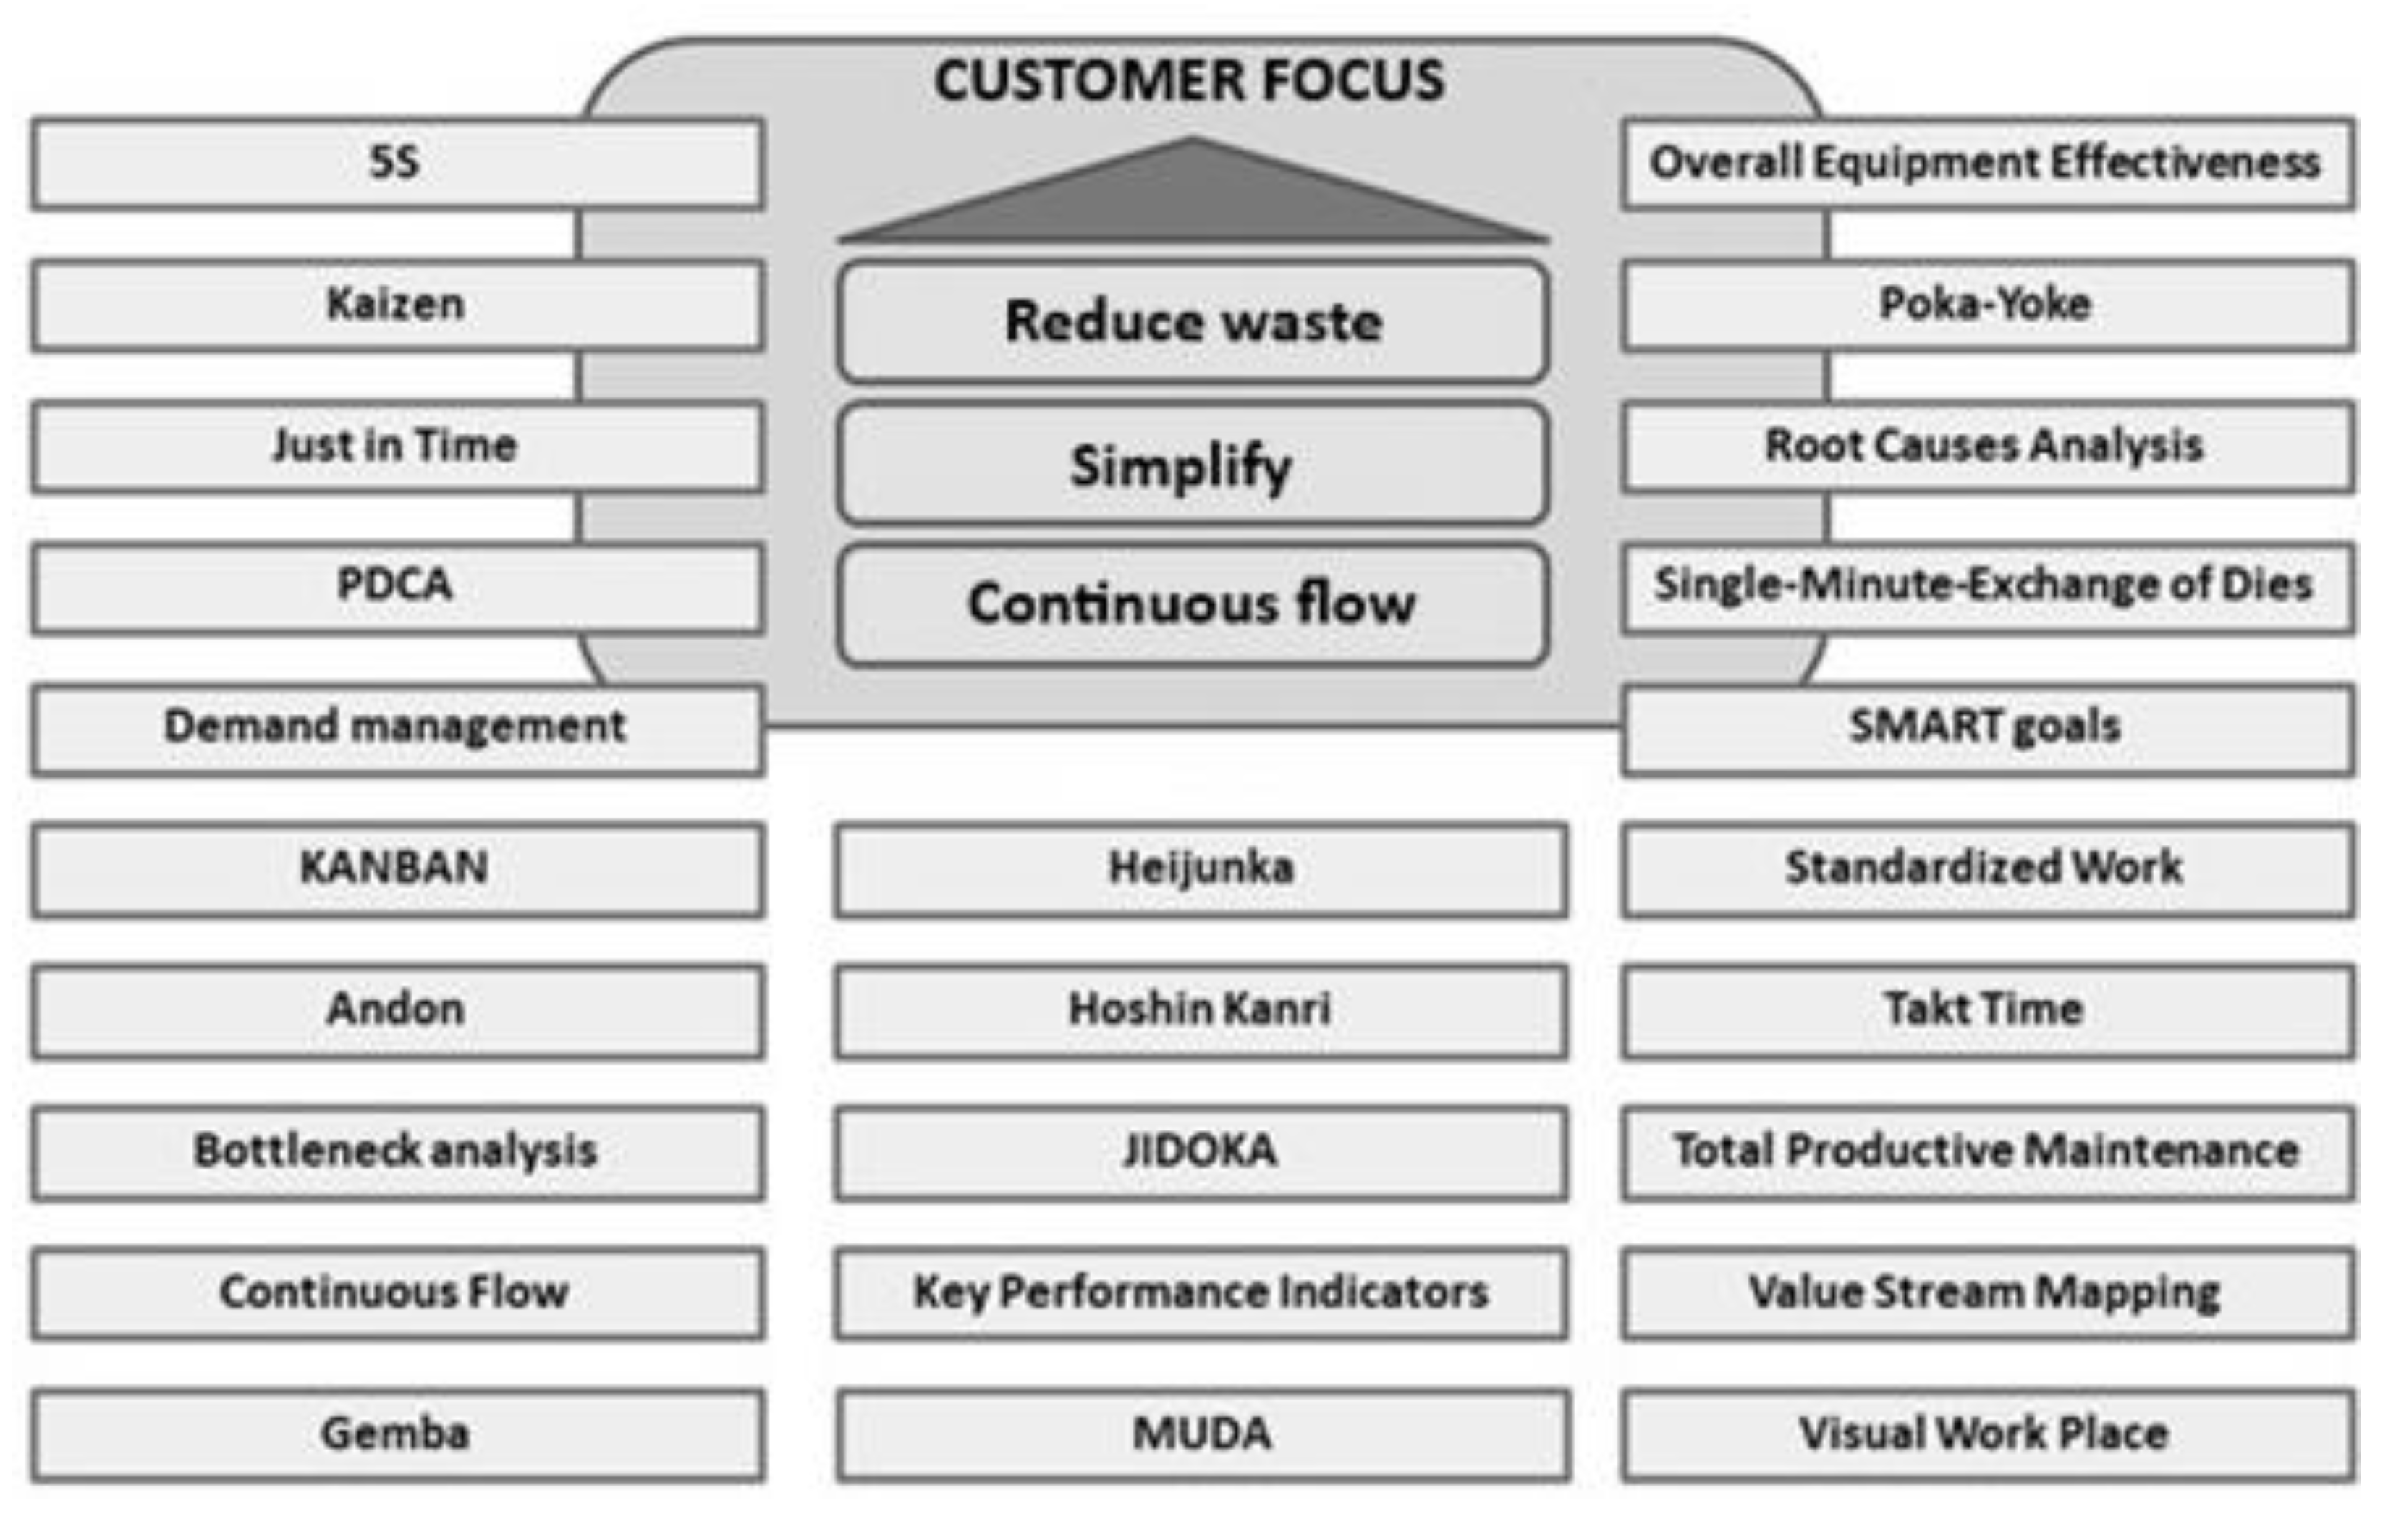
Figure 1. Basic tools of Lean.
Applsci 14 00944 g001
Figure 2. Storage of fixtures and molds in the company before the application of 5S.
Applsci 14 00944 g002
Figure 3. Storage of fixtures and molds in the company after the application of 5S.
Applsci 14 00944 g003
Figure 4. Analyze the problem.
Applsci 14 00944 g004
Figure 5. Product movement during production.
Applsci 14 00944 g005
Figure 6. Sample of the Production plan.
Applsci 14 00944 g006
Figure 7. Layout design.
Applsci 14 00944 g007
Figure 8. Floor plan of the workplace.
Applsci 14 00944 g008
Figure 9. Machine card.
Applsci 14 00944 g009
Figure 10. Visual work instructions for packaging.
Applsci 14 00944 g010
Figure 11. Shelf with components at the assembly workplace.
Applsci 14 00944 g011
Table 1. Basic comparison between piece and serial production (own processing).
Piece
Production
Serial (Mass)
Production
Production
quantity
Production of unique products or products in small series. Each product is individual and adapted to the needs of the customer.Production of many of the same products. The production process is standardized and repetitive.
FlexibilityHigh flexibility. Adaptation of the production process to the individual needs of the customer. Each product may be different.Less flexible. Focus on mass production of identical products. There are costly and fundamental changes in the production process.
AutomatizationLess automated. It depends more on manual work or individual craft.A large degree of automation with the use of special machines, conveyors, and robots.
Storage and
distribution
A minor problem with storage. Products are made to order.It requires a better organization of storage and distribution due to the larger volume of products.
Time and costMore demanding on time and costs. Each product is produced individually. It is suitable for special, unique, or customized products.More efficient in terms of time and costs. The production process is optimized to produce many of the same products.
Table 2. Determining the weights of each evaluation criteria (own research).
Researcher
A
Researcher
B
Researcher
C
ScoreWeight of Criteria
Volume of input data (which the Lean tool uses to achieve the expected effect) 372120.14
The difficulty of obtaining input data 535130.15
Method of processing input data (sophistication necessity of using software support for processing input data) 464140.17
Difficulty in understanding the principle of operation of the tool of the interested parties of the company 647170.20
Time required to implement the tool 756180.21
Time sustainability of the tool after implementation 12360.07
Economic difficulty 21140.05
Table 3. Multicriterial evaluation of Lean tools (own research).
Independence from the Amount of Input DataEase of Obtaining Input DataEase of Processing Input DataEasy to Understand Principle of ToolThe Shortest Time to Implement a ToolEase of Sustainability of the Tool after ImplementationEconomic Simplicity of the Tool’s Sustainability after ImplementationResult
Weight of criteria0.140.150.170.20.210.070.051
5S122222112
0.140.30.340.40.420.140.051.79
Kaizen212221212
0.280.150.340.40.420.070.11.76
JIT00111115
000.170.20.210.070.050.7
PDCA122222213
0.140.30.340.40.420.140.11.84
Demand
Manag.
00001113
00000.210.140.050.4
Kanban01101126
00.150.1700.210.070.10.7
Andon21120208
0.280.150.17000.1400.74
Bottleneck
Analysis
00010124
0000.200.070.10.37
Continuous Flow01111116
00.150.170.20.210.070.050.85
Gemba222122112
0.280.30.340.20.420.140.051.73
Heijunka00010214
0000.200.140.050.39
Hoshin Kanri00010113
0000.200.070.050.32
Jidoka00011002
0000.20.21000.41
KPI00121127
000.170.40.210.070.010.86
Muda122221111
0.140.30.340.40.420.070.051.72
OEE00011113
0000.20.210.070.050.53
Poka-Yoke11110015
0.140.150.170.2000.050.71
Root Cause
Analysis
01110116
00.150.170.400.070.050.84
SMED00011114
0000.20.210.070.050.53
Smart goals221222213
0.280.30.170.40.420.140.11.81
Standarized Work01110227
00.150.170.200.140.10.76
Takt time00001113
00000.210.070.050.33
TPM00111206
000.170.20.210.1400.72
VSM00010113
0000.200.070.050.32
Visual Workplace222212213
0.280.30.340.40.210.140.051.72
Table 4. Applicability of Lean tools in small company with piece production (own research).
Tool of Lean Philosophy Applicability
YesLimitedNo
15Sx
2Kaizenx
3Just in Time x
4PDCA x
5Demand Management x
6Kanban x
7Andon x
8Bottleneck Analysis x
9Continuous Flow x
10Gembax
11Heijunka x
12Hoshin Kanri x
13Jidoka x
14Key Performance Indicators x
15Muda x
16Overall Equipment Effectiveness x
17Poka-Yoke x
18Root Cause Analysis x
19Single-Minute Exchange of Dies x
20SMART Goalsx
21Standardized Work x
22Takt Time x
23Total Productive Maintenance x
24Value Stream Mapping x
25Visual Workplace x
Table 5. Measured time (own research).
OperationTime before
(s)
Time after
(s)
Reduction
(%)
Bending25.52118
Welding453620
Grinding15147
TOTAL:85.57117
Disclaimer/Publisher’s Note: The statements, opinions and data contained in all publications are solely those of the individual author(s) and contributor(s) and not of MDPI and/or the editor(s). MDPI and/or the editor(s) disclaim responsibility for any injury to people or property resulting from any ideas, methods, instructions or products referred to in the content.