
Acute Fatigue Impairs Heart Rate Variability and Resting Muscle Oxygen Consumption Kinetics


 , , , ,
Abstract
:Featured Application
Abstract
1. Introduction
2. Materials and Methods
2.1. Participants
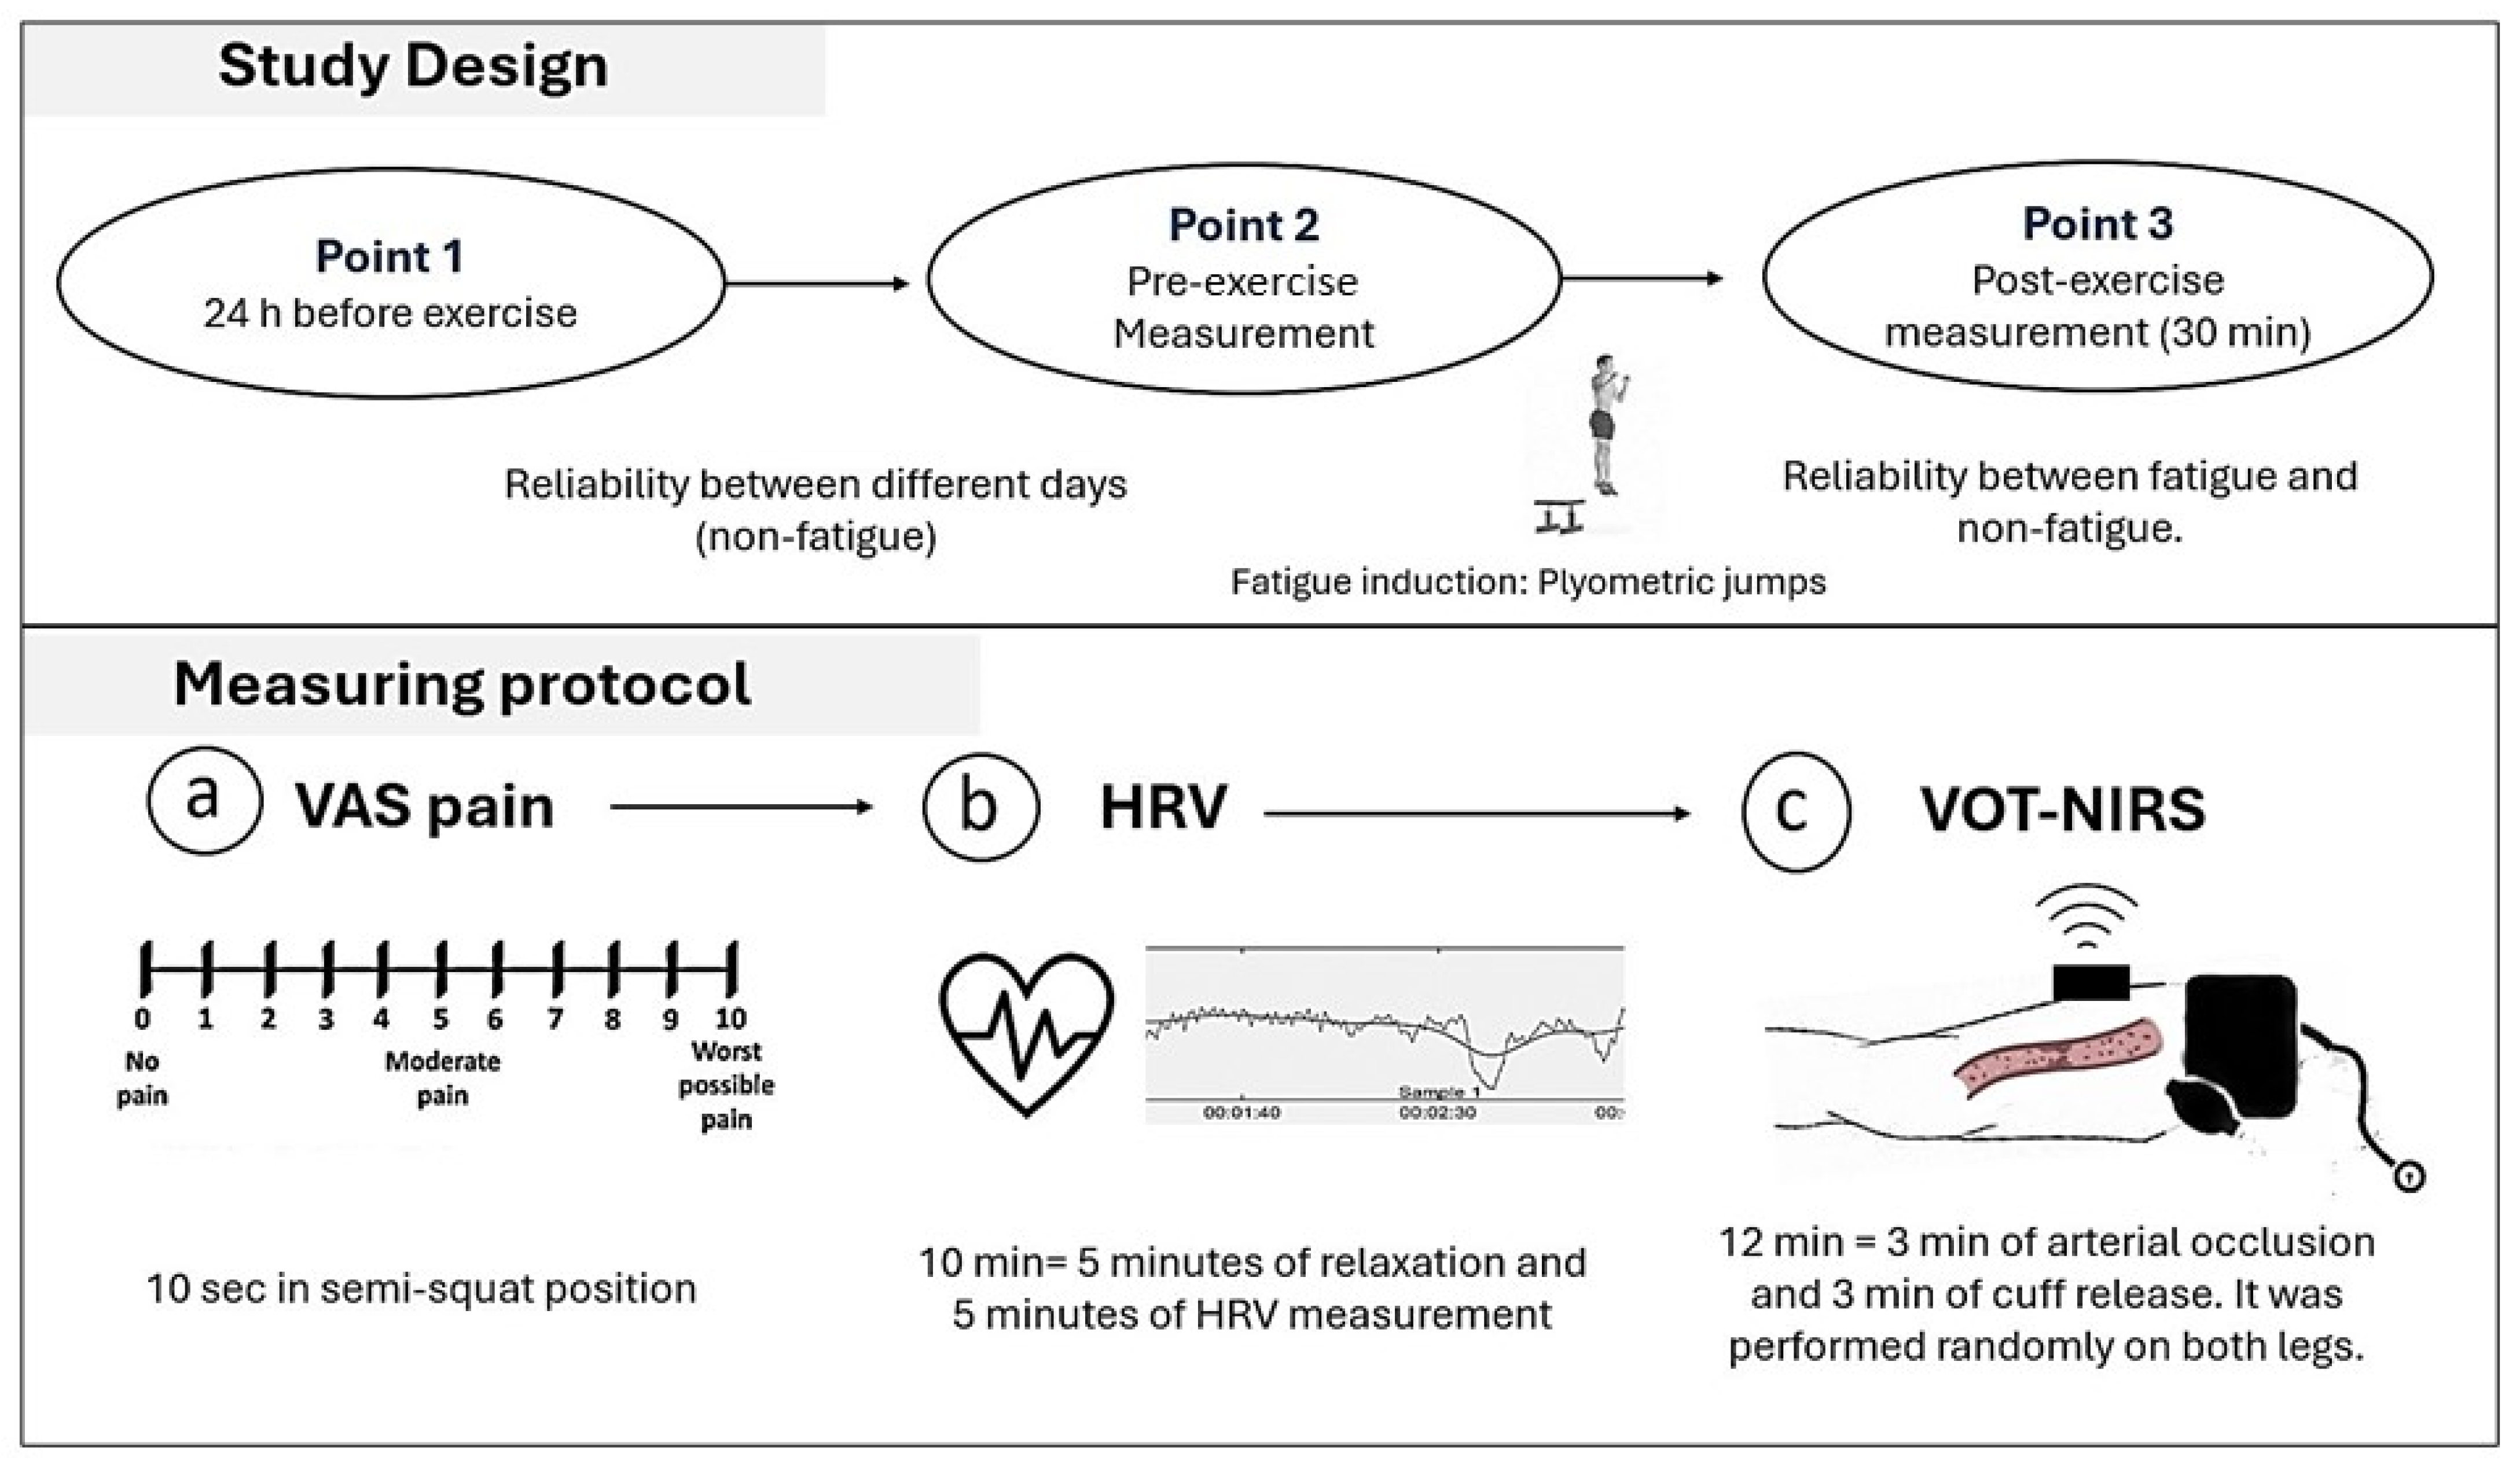
2.2. Study Design
- Measurements
- Induction of localized muscle damage
- Perceived muscle soreness
- Heart Rate Variability (HRV)
- Near-infrared spectroscopy (NIRS)
- Vascular Occlusions Test (VOT)
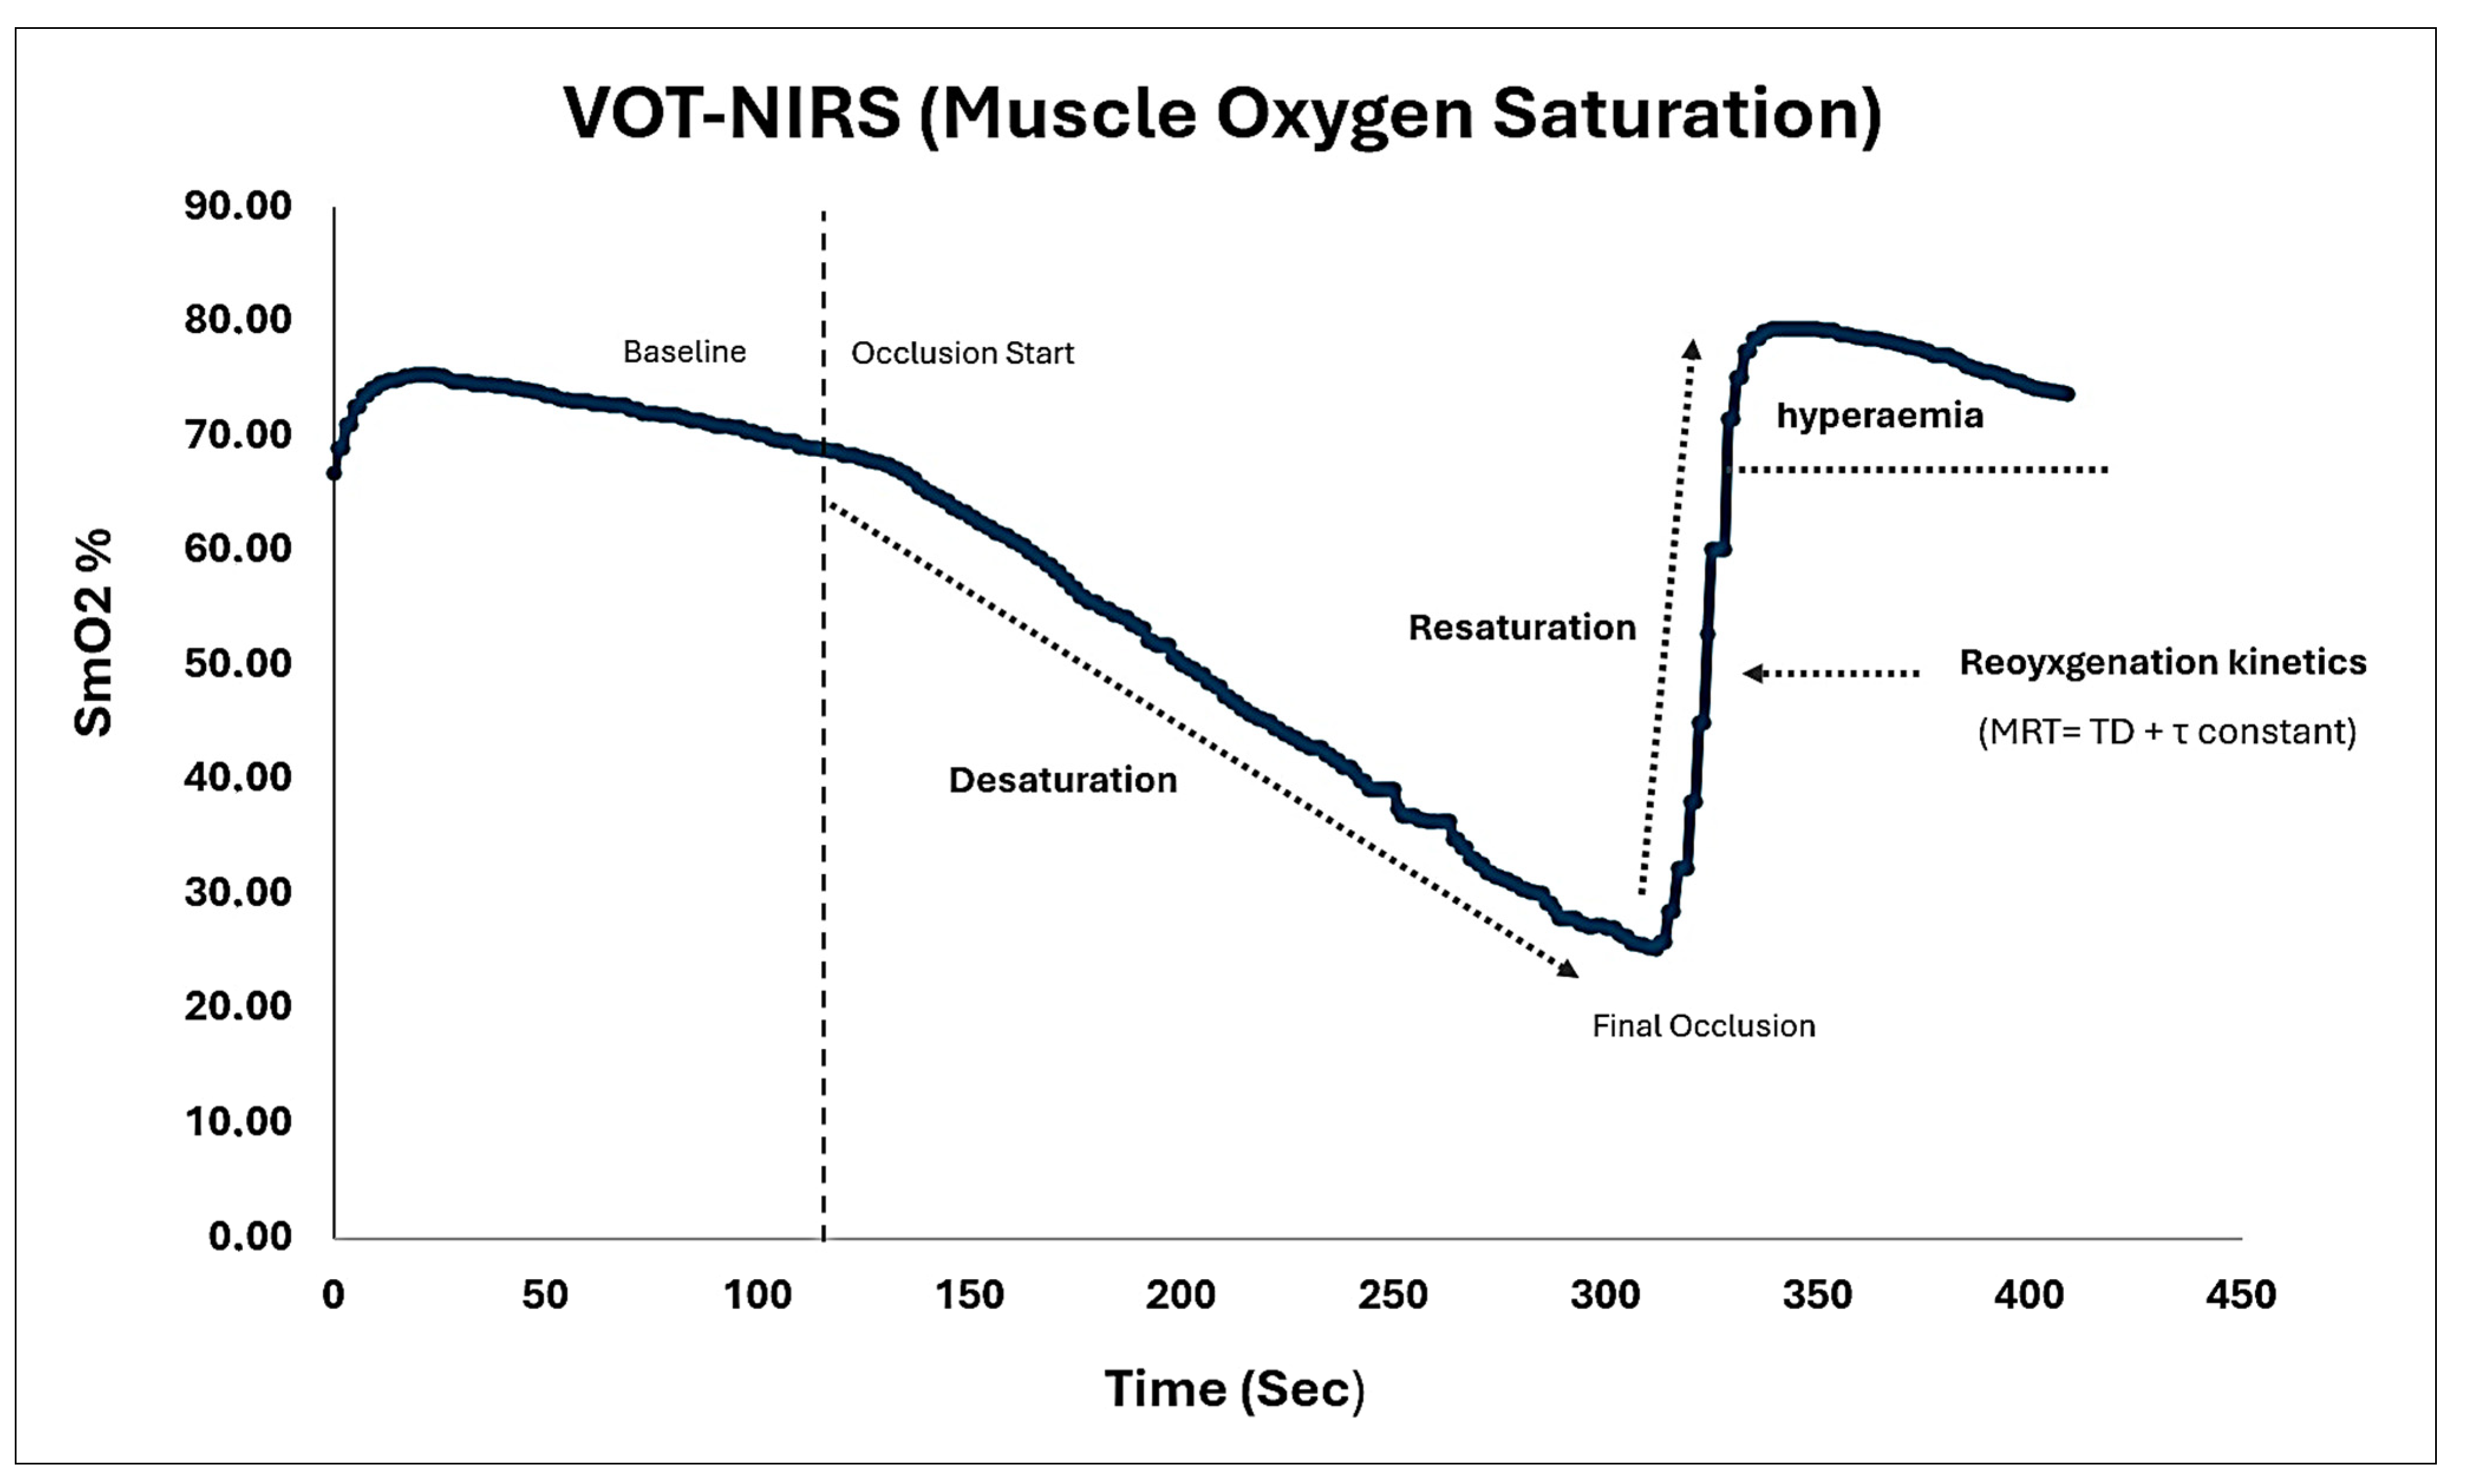
- Resting Muscle Oxygen Consumption Data
- (a).
- SmO2 Dynamics: The analysis of SmO2 dynamics involved examining the following curves: desaturation (the difference between SmO2 at the beginning and end of occlusion), resaturation (the difference between SmO2 stabilized at the end of recovery and SmO2 at the end of occlusion), and reactive hyperemia (the area under the SmO2 curve from the end of recovery to the beginning of occlusion) [6,13,14,15] (See Figure 2);
- (b).
- Reoyxgenation kinetics: The post-occlusion reoxygenation kinetics were derived from oxyhemoglobin [oxy (Hb+Mb)] values taken at 1 s intervals and plotted against time [17,34,35]. The curve was fitted to an exponential model using the least squares method to describe the oxyhemoglobin response following arterial occlusion. The equation used was as follows:where Y0 represents the baseline value (i.e., the last 20 s before the end of the 3 min arterial occlusion), A is the amplitude of the oxy[Hb+Mb] response, TD is the time delay immediately after the occlusion is released, and τ (tau) is the time constant associated with the slope recovery.Y(t) = Y0 + A × (1 − e−(t−TD)/τ)
- Statistical Analysis
3. Results
4. Discussion
4.1. Limitations
4.2. Future Perspectives
5. Conclusions
6. Practical Applications
Author Contributions
Funding
Institutional Review Board Statement
Informed Consent Statement
Data Availability Statement
Conflicts of Interest
References
- Perrey, S.; Quaresima, V.; Ferrari, M. Muscle Oximetry in Sports Science: An Updated Systematic Review. Sports Med. 2024, 54, 975–996. [Google Scholar] [CrossRef] [PubMed]
- Jones, S.; D’Silva, A.; Bhuva, A.; Lloyd, G.; Manisty, C.; Moon, J.C.; Sharma, S.; Hughes, A.D. Improved Exercise-Related Skeletal Muscle Oxygen Consumption Following Uptake of Endurance Training Measured Using Near-Infrared Spectroscopy. Front. Physiol. 2017, 8, 299464. [Google Scholar] [CrossRef]
- Tuesta, M.; Yáñez-Sepúlveda, R.; Monsalves-Álvarez, M.; Vásquez-Bonilla, A.; Olivares-Arancibia, J.; Rojas-Valverde, D.; Alvear-Órdenes, I. Muscle Oxygen Extraction during Vascular Occlusion Test in Physically Very Active versus Inactive Healthy Men: A Comparative Study. J. Funct. Morphol. Kinesiol. 2024, 9, 57. [Google Scholar] [CrossRef] [PubMed]
- Gómez, H.; Torres, A.; Polanco, P.; Kim, H.K.; Zenker, S.; Puyana, J.C.; Pinsky, M.R. Use of Non-Invasive NIRS during a Vascular Occlusion Test to Assess Dynamic Tissue O2 Saturation Response. Intensive Care Med. 2008, 34, 1600–1607. [Google Scholar] [CrossRef]
- Gerovasili, V.; Dimopoulos, S.; Tzanis, G.; Anastasiou-Nana, M.; Nanas, S. Utilizing the Vascular Occlusion Technique with NIRS Technology. Int. J. Ind. Ergon. 2010, 40, 218–222. [Google Scholar] [CrossRef]
- Rosenberry, R.; Munson, M.; Chung, S.; Samuel, T.J.; Patik, J.; Tucker, W.J.; Haykowsky, M.J.; Nelson, M.D. Age-Related Microvascular Dysfunction: Novel Insight from near-Infrared Spectroscopy. Exp. Physiol. 2018, 103, 190–200. [Google Scholar] [CrossRef]
- Soares, R.N.; Reimer, R.A.; Alenezi, Z.; Doyle-Baker, P.K.; Murias, J.M. Near-Infrared Spectroscopy Can Detect Differences in Vascular Responsiveness to a Hyperglycaemic Challenge in Individuals with Obesity Compared to Normal-Weight Individuals. Diab. Vasc. Dis. Res. 2018, 15, 55–63. [Google Scholar] [CrossRef]
- Soares, R.N.; Murias, J.M.; Saccone, F.; Puga, L.; Moreno, G.; Resnik, M.; De Roia, G.F. Effects of a Rehabilitation Program on Microvascular Function of CHD Patients Assessed by Near-Infrared Spectroscopy. Physiol. Rep. 2019, 7, e14145. [Google Scholar] [CrossRef]
- Vieira de Oliveira, G.; Soares, R.N.; Volino-Souza, M.; Murias, J.M.; Alvares, T.S. The Association between Near-Infrared Spectroscopy Assessment of Microvascular Reactivity and Flow-Mediated Dilation Is Disrupted in Individuals at High Risk for Cardiovascular Disease. Microcirculation 2019, 26, e12556. [Google Scholar] [CrossRef]
- Sandberg, C.; Crenshaw, A.G.; Elçadi, G.H.; Christersson, C.; Hlebowicz, J.; Thilén, U.; Johansson, B. Slower Skeletal Muscle Oxygenation Kinetics in Adults With Complex Congenital Heart Disease. Can. J. Cardiol. 2019, 35, 1815–1823. [Google Scholar] [CrossRef]
- Beever, A.T.; Tripp, T.R.; Zhang, J.; MacInnis, M.J. NIRS-Derived Skeletal Muscle Oxidative Capacity Is Correlated with Aerobic Fitness and Independent of Sex. J. Appl. Physiol. 2020, 129, 558–568. [Google Scholar] [CrossRef]
- Vasquez Bonilla, A.A.; Brazo Sayavera, F.J.; Timón Andrada, R.; Olcina Camacho, G.J. Measurement of Resting Muscle Oxygenation and the Relationship with Countermovement Jumps and Body Composition in Soccer Players. Cult. Cienc. Deporte 2021, 16, 215–223. [Google Scholar]
- Bonilla, A.A.V.; Timon, R.; Camacho-Cardeñosa, A.; Camacho-Cardeñosa, M.; Guerrero, S.; Olcina, G. Fatigue Increases in Resting Muscle Oxygen Consumption after a Women’s Soccer Match. Int. J. Sports Med. 2020, 41, e2–e8. [Google Scholar] [CrossRef]
- Vasquez-Bonilla, A.A.; Brazo-Sayavera, J.; Timón, R.; Olcina, G. Monitoring Muscle Oxygen Asymmetry as a Strategy to Prevent Injuries in Footballers. Res. Q. Exerc. Sport 2023, 94, 609–617. [Google Scholar] [CrossRef]
- Jones, S.; Chiesa, S.T.; Chaturvedi, N.; Hughes, A.D. Recent Developments in Near-Infrared Spectroscopy (NIRS) for the Assessment of Local Skeletal Muscle Microvascular Function and Capacity to Utilise Oxygen. Artery Res. 2016, 16, 25–33. [Google Scholar] [CrossRef]
- Batterson, P.M.; Norton, M.R.; Hetz, S.E.; Rohilla, S.; Lindsay, K.G.; Subudhi, A.W.; Jacobs, R.A. Improving Biologic Predictors of Cycling Endurance Performance with Near-Infrared Spectroscopy Derived Measures of Skeletal Muscle Respiration: E Pluribus Unum. Physiol. Rep. 2020, 8, e14342. [Google Scholar] [CrossRef] [PubMed]
- Venckunas, T.; Satas, A.; Brazaitis, M.; Eimantas, N.; Sipaviciene, S.; Kamandulis, S. Near-InfraRed Spectroscopy Provides a Reproducible Estimate of Muscle Aerobic Capacity, but Not Whole-Body Aerobic Power. Sensors 2024, 24, 2277. [Google Scholar] [CrossRef]
- Tzanis, G.; Manetos, C.; Dimopoulos, S.; Vasileiadis, I.; Malliaras, K.; Kaldara, E.; Karatzanos, E.; Nanas, S. Attenuated Microcirculatory Response to Maximal Exercise in Patients With Chronic Heart Failure. J. Cardiopulm. Rehabil. Prev. 2016, 36, 33–37. [Google Scholar] [CrossRef]
- McLay, K.M.; Gilbertson, J.E.; Pogliaghi, S.; Paterson, D.H.; Murias, J.M. Vascular Responsiveness Measured by Tissue Oxygen Saturation Reperfusion Slope Is Sensitive to Different Occlusion Durations and Training Status. Exp. Physiol. 2016, 101, 1309–1318. [Google Scholar] [CrossRef]
- Orbegozo Cortés, D.; Puflea, F.; De Backer, D.; Creteur, J.; Vincent, J.-L. Near Infrared Spectroscopy (NIRS) to Assess the Effects of Local Ischemic Preconditioning in the Muscle of Healthy Volunteers and Critically Ill Patients. Microvasc. Res. 2015, 102, 25–32. [Google Scholar] [CrossRef]
- Chen, Y.; Liu, M.; Zhou, J.; Bao, D.; Li, B.; Zhou, J. Acute Effects of Fatigue on Cardiac Autonomic Nervous Activity. J. Sports Sci. Med. 2023, 22, 806–815. [Google Scholar] [CrossRef]
- Lu, K.; Sjörs Dahlman, A.; Karlsson, J.; Candefjord, S. Detecting Driver Fatigue Using Heart Rate Variability: A Systematic Review. Accid. Anal. Prev. 2022, 178, 106830. [Google Scholar] [CrossRef]
- Thorpe, R.T.; Atkinson, G.; Drust, B.; Gregson, W. Monitoring Fatigue Status in Elite Team-Sport Athletes: Implications for Practice. Int. J. Sports Physiol. Perform. 2017, 12, S227–S234. [Google Scholar] [CrossRef]
- Jakeman, J.R.; Byrne, C.; Eston, R.G. Lower Limb Compression Garment Improves Recovery from Exercise-Induced Muscle Damage in Young, Active Females. Eur. J. Appl. Physiol. 2010, 109, 1137–1144. [Google Scholar] [CrossRef]
- Twist, C.; Eston, R. The Effects of Exercise-Induced Muscle Damage on Maximal Intensity Intermittent Exercise Performance. Eur. J. Appl. Physiol. 2005, 94, 652–658. [Google Scholar] [CrossRef]
- Twist, C.; Eston, R.G. The Effect of Exercise-Induced Muscle Damage on Perceived Exertion and Cycling Endurance Performance. Eur. J. Appl. Physiol. 2009, 105, 559–567. [Google Scholar] [CrossRef] [PubMed]
- Bloomfield, D.M.; Magnano, A.; Bigger, J.T.; Rivadeneira, H.; Parides, M.; Steinman, R.C. Comparison of Spontaneous vs. Metronome-Guided Breathing on Assessment of Vagal Modulation Using RR Variability. Am. J. Physiol. Heart Circ. Physiol. 2001, 280, H1145-50. [Google Scholar] [CrossRef]
- Pino-Ortega, J.; Rico-González, M.; Gantois, P.; Nakamura, F.Y. Level of Agreement between sPRO and Kubios Software in the Analysis of R-R Intervals Obtained by a Chest Strap. Proc. Inst. Mech. Eng. Part P J. Sports Eng. Technol. 2023, 237, 224–229. [Google Scholar] [CrossRef]
- Tarvainen, M.P.; Niskanen, J.-P.; Lipponen, J.A.; Ranta-Aho, P.O.; Karjalainen, P.A. Kubios HRV—Heart Rate Variability Analysis Software. Comput. Methods Programs Biomed. 2014, 113, 210–220. [Google Scholar] [CrossRef]
- Gisselman, A.S.; D’Amico, M.; Smoliga, J.M. Optimizing Intersession Reliability of Heart Rate Variability—The Effects of Artifact Correction and Breathing Type. J. Strength Cond. Res. 2020, 34, 3199. [Google Scholar] [CrossRef]
- Chiu, Y.-W.; Clemente, F.M.; Bezerra, P.; Pagaduan, J.C.; Chen, Y.-S. Day-to-day Variation of The Heart Rate, Heart Rate Variability, and Energy Expenditure During FIFA 11+ and Dynamic Warm-up Exercises. J. Hum. Kinet. 2022, 81, 73–84. [Google Scholar] [CrossRef]
- Di Credico, A.; Petri, C.; Cataldi, S.; Greco, G.; Suarez-Arrones, L.; Izzicupo, P. Heart Rate Variability, Recovery and Stress Analysis of an Elite Rally Driver and Co-Driver during a Competition Period. Sci. Prog. 2024, 107, 00368504231223034. [Google Scholar] [CrossRef] [PubMed]
- Lipcsey, M.; Eastwood, G.M.; Woinarski, N.C.Z.; Bellomo, R. Near-Infrared Spectroscopy of the Thenar Eminence: Comparison of Dynamic Testing Protocols. Crit. Care Resusc. J. Australas. Acad. Crit. Care Med. 2012, 14, 142–147. [Google Scholar] [CrossRef]
- Bopp, C.M.; Townsend, D.K.; Warren, S.; Barstow, T.J. Relationship between Brachial Artery Blood Flow and Total [Hemoglobin + Myoglobin] during Post-Occlusive Reactive Hyperemia. Microvasc. Res. 2014, 91, 37–43. [Google Scholar] [CrossRef] [PubMed]
- Veras, L.; Diniz-Sousa, F.; Boppre, G.; Resende-Coelho, A.; Moutinho-Ribeiro, E.; Devezas, V.; Santos-Sousa, H.; Preto, J.; Vilas-Boas, J.P.; Machado, L.; et al. Mechanical Loading Prediction through Accelerometry Data during Walking and Running. Eur. J. Sport Sci. 2023, 23, 1518–1527. [Google Scholar] [CrossRef] [PubMed]
- van Hooff, M.; Meijer, E.J.; Scheltinga, M.R.M.; Savelberg, H.H.C.M.; Schep, G. Test–Retest Reliability of Skeletal Muscle Oxygenation Measurement Using Near-infrared Spectroscopy during Exercise in Patients with Sport-related Iliac Artery Flow Limitation. Clin. Physiol. Funct. Imaging 2022, 42, 114–126. [Google Scholar] [CrossRef]
- Niemeijer, V.M.; Jansen, J.P.; van Dijk, T.; Spee, R.F.; Meijer, E.J.; Kemps, H.M.C.; Wijn, P.F.F. The Influence of Adipose Tissue on Spatially Resolved Near-Infrared Spectroscopy Derived Skeletal Muscle Oxygenation: The Extent of the Problem. Physiol. Meas. 2017, 38, 539–554. [Google Scholar] [CrossRef]
- Fritz, C.O.; Morris, P.E.; Richler, J.J. Effect Size Estimates: Current Use, Calculations, and Interpretation. J. Exp. Psychol. Gen. 2012, 141, 2–18. [Google Scholar] [CrossRef]
- Koo, T.K.; Li, M.Y. A Guideline of Selecting and Reporting Intraclass Correlation Coefficients for Reliability Research. J. Chiropr. Med. 2016, 15, 155–163. [Google Scholar] [CrossRef]
- Hopkins, W.G. Measures of Reliability in Sports Medicine and Science. Sports Med. 2000, 30, 1–15. [Google Scholar] [CrossRef]
- Gaesser, G.A.; Brooks, G.A. Metabolic Bases of Excess Post-Exercise Oxygen Consumption: A Review. Med. Sci. Sports Exerc. 1984, 16, 29–43. [Google Scholar] [CrossRef] [PubMed]
- Panissa, V.L.G.; Fukuda, D.H.; Staibano, V.; Marques, M.; Franchini, E. Magnitude and Duration of Excess of Post-Exercise Oxygen Consumption between High-Intensity Interval and Moderate-Intensity Continuous Exercise: A Systematic Review. Obes. Rev. Off. J. Int. Assoc. Study Obes. 2021, 22, e13099. [Google Scholar] [CrossRef]
- Buitrago, S.; Wirtz, N.; Flenker, U.; Kleinöder, H. Physiological and Metabolic Responses as Function of the Mechanical Load in Resistance Exercise. Appl. Physiol. Nutr. Metab. Physiol. Appl. Nutr. Metab. 2014, 39, 345–350. [Google Scholar] [CrossRef]
- Piepoli, M.; Coats, A.J.; Adamopoulos, S.; Bernardi, L.; Feng, Y.H.; Conway, J.; Sleight, P. Persistent Peripheral Vasodilation and Sympathetic Activity in Hypotension after Maximal Exercise. J. Appl. Physiol. 1993, 75, 1807–1814. [Google Scholar] [CrossRef]
- Halliwill, J.R.; Buck, T.M.; Lacewell, A.N.; Romero, S.A. Postexercise Hypotension and Sustained Postexercise Vasodilatation: What Happens after We Exercise? Exp. Physiol. 2013, 98, 7–18. [Google Scholar] [CrossRef]
- Parsanathan, R.; Jain, S.K. Novel Invasive and Noninvasive Cardiac-Specific Biomarkers in Obesity and Cardiovascular Diseases. Metab. Syndr. Relat. Disord. 2020, 18, 10–30. [Google Scholar] [CrossRef] [PubMed]
- Aon, M.A.; Cortassa, S.; Akar, F.G.; Brown, D.A.; Zhou, L.; O’Rourke, B. From mitochondrial dynamics to arrhythmias. Int. J. Biochem. Cell Biol. 2009, 41, 1940–1948. [Google Scholar] [CrossRef]
- Ichinose, M.; Nakabayashi, M.; Ono, Y. Sympathoexcitation Constrains Vasodilation in the Human Skeletal Muscle Microvasculature during Postocclusive Reactive Hyperemia. Am. J. Physiol. Heart Circ. Physiol. 2018, 315, H242–H253. [Google Scholar] [CrossRef] [PubMed]
- Kapilevich, L.V.; Kologrivova, V.V.; Zakharova, A.N.; Mourot, L. Post-Exercise Endothelium-Dependent Vasodilation Is Dependent on Training Status. Front. Physiol. 2020, 11, 348. [Google Scholar] [CrossRef]
- Danduran, M.J.; Dixon, J.E.; Rao, R.P. Near Infrared Spectroscopy Describes Physiologic Payback Associated With Excess Postexercise Oxygen Consumption in Healthy Controls and Children With Complex Congenital Heart Disease. Pediatr. Cardiol. 2012, 33, 95–102. [Google Scholar] [CrossRef]
- Bangsbo, J.; Hellsten, Y. Muscle Blood Flow and Oxygen Uptake in Recovery from Exercise. Acta Physiol. Scand. 1998, 162, 305–312. [Google Scholar] [CrossRef] [PubMed]
- Zuccarelli, L.; Baldassarre, G.; Magnesa, B.; Degano, C.; Comelli, M.; Gasparini, M.; Manferdelli, G.; Marzorati, M.; Mavelli, I.; Pilotto, A.; et al. Peripheral Impairments of Oxidative Metabolism after a 10-Day Bed Rest Are Upstream of Mitochondrial Respiration. J. Physiol. 2021, 599, 4813–4829. [Google Scholar] [CrossRef] [PubMed]
- Koutlas, A.; Smilios, I.; Kokkinou, E.M.; Myrkos, A.; Kounoupis, A.; Dipla, K.; Zafeiridis, A. NIRS-Derived Muscle-Deoxygenation and Microvascular Reactivity During Occlusion–Reperfusion at Rest Are Associated With Whole-Body Aerobic Fitness. Res. Q. Exerc. Sport 2024, 95, 127–139. [Google Scholar] [CrossRef] [PubMed]
- van Hall, G. Lactate Kinetics in Human Tissues at Rest and during Exercise. Acta Physiol. Oxf. Engl. 2010, 199, 499–508. [Google Scholar] [CrossRef] [PubMed]
- Tan, Q.; Wang, Y.; Chen, T.L.-W.; Wong, D.W.-C.; Yan, F.; Li, Z.; Zhang, M. Exercise-Induced Hemodynamic Changes in Muscle Tissue: Implication of Muscle Fatigue. Appl. Sci. 2020, 10, 3512. [Google Scholar] [CrossRef]
- Tan, Q.; Wang, Y.; Li, Z.; Wang, D.; Lam, W.-K.; Wong, D.W.-C.; Peng, Y.; Zhang, G.; Zhang, M. Spectral Analysis of Muscle Hemodynamic Responses in Post-Exercise Recovery Based on Near-Infrared Spectroscopy. Sensors 2021, 21, 3072. [Google Scholar] [CrossRef]
- Jones, P.P.; Davy; Seals. Influence of Gender on the Sympathetic Neural Adjustments to Alterations in Systemic Oxygen Levels in Humans. Clin. Physiol. 1999, 19, 153–160. [Google Scholar] [CrossRef]
- Segal, S.S. Regulation of Blood Flow in the Microcirculation. Microcirculation 2005, 12, 33–45. [Google Scholar] [CrossRef]
- Clark, M.G.; Colquhoun, E.Q.; Rattigan, S.; Dora, K.A.; Eldershaw, T.P.; Hall, J.L.; Ye, J. Vascular and Endocrine Control of Muscle Metabolism. Am. J. Physiol.-Endocrinol. Metab. 1995, 268, E797–E812. [Google Scholar] [CrossRef]
- Kavcic, N.S.; Lehman, G.H.; McGill, S.M. Effect of Modulated TENS on Muscle Activation, Oxygenation, and Pain: Searching for a Physiological Mechanism. J. Musculoskelet. Pain 2005, 13, 19–30. [Google Scholar] [CrossRef]
- McGranahan, M.J.; Kibildis, S.W.; McCully, K.K.; O’Connor, P.J. Evaluation of Inter-Rater and Test-Retest Reliability for near-Infrared Spectroscopy Reactive Hyperemia Measures. Microvasc. Res. 2023, 148, 104532. [Google Scholar] [CrossRef]
- Shoemaker, M.E.; Smith, C.M.; Gillen, Z.M.; Cramer, J.T. Sex Differences in Test-Retest Reliability of Near-Infrared Spectroscopy During Postocclusive Reactive Hyperemia of the Vastus Lateralis. J. Strength Cond. Res. 2024, 38, e40–e48. [Google Scholar] [CrossRef] [PubMed]
- Iannetta, D.; Inglis, E.C.; Soares, R.N.; McLay, K.M.; Pogliaghi, S.; Murias, J.M. Reliability of Microvascular Responsiveness Measures Derived from Near-Infrared Spectroscopy across a Variety of Ischemic Periods in Young and Older Individuals. Microvasc. Res. 2019, 122, 117–124. [Google Scholar] [CrossRef] [PubMed]
- Soares, R.N.; McLay, K.M.; George, M.A.; Murias, J.M. Differences in Oxidative Metabolism Modulation Induced by Ischemia/Reperfusion between Trained and Untrained Individuals Assessed by NIRS. Physiol. Rep. 2017, 5, e13384. [Google Scholar] [CrossRef]
- Southern, W.M.; Ryan, T.E.; Reynolds, M.A.; McCully, K. Reproducibility of Near-Infrared Spectroscopy Measurements of Oxidative Function and Postexercise Recovery Kinetics in the Medial Gastrocnemius Muscle. Appl. Physiol. Nutr. Metab. Physiol. Appl. Nutr. Metab. 2014, 39, 521–529. [Google Scholar] [CrossRef]


| Descriptives | Point 1 | Point 2 | Point 3 | F | p | η2p | ||||
|---|---|---|---|---|---|---|---|---|---|---|
| Mean | SD | Mean | SD | Mean | SD | |||||
| Occlusion variables | Initial Occlusion | 70.5 | 6.9 | 72.8 | 9.2 | 77.5 | 5.0 | 1.88 | 0.177 | 0.152 |
| Final Occlusion | 31.7 | 9.3 | 32.3 | 8.1 | 17.4 | 7.2 | 8.26 | 0.002 | 0.440 | |
| Recovery Occlusion | 77.4 | 5.2 | 78.1 | 8.2 | 81.6 | 3.7 | 1.11 | 0.348 | 0.096 | |
| SmO2 dynamics | Desaturation | 38.8 | 6.2 | 40.5 | 6.2 | 60.0 | 8.4 | 22.4 | <0.001 | 0.681 |
| Resaturation | 45.7 | 7.3 | 45.8 | 8.4 | 64.1 | 9.5 | 12.5 | <0.001 | 0.544 | |
| Hyperemia | 6.9 | 5.9 | 5.3 | 5.0 | 4.1 | 4.4 | 0.554 | 0.583 | 0.050 | |
| Reoxygenation kinetics | Baseline (Y0) | 6.8 | 1.4 | 6.4 | 1.1 | 5.2 | 0.6 | 3.99 | 0.034 | 0.275 |
| Amplitude | 3.4 | 0.7 | 3.5 | 1.1 | 6.0 | 0.8 | 22.3 | <0.001 | 0.680 | |
| Time Delay | 2.7 | 0.6 | 2.6 | 0.6 | 4.8 | 0.6 | 0.516 | 0.604 | 0.047 | |
| Tau | 35.9 | 14.5 | 41.3 | 13.5 | 19.0 | 5.4 | 7.58 | 0.003 | 0.419 | |
| MRT | 37.4 | 10.3 | 32.6 | 15.2 | 21.8 | 8.2 | 7.60 | 0.033 | 0.420 | |
| Descriptives | Point 1 | Point 2 | Point 3 | F | p | η2p | |||
|---|---|---|---|---|---|---|---|---|---|
| Mean | SD | Mean | SD | Mean | SD | ||||
| Interval R-R | 1113.7 | 192.3 | 1070.3 | 235.0 | 852.3 | 117.7 | 4.44 | 0.025 | 0.297 |
| RMSSD | 258.6 | 271.7 | 196.2 | 288.3 | 79.8 | 50.1 | 1.24 | 0.310 | 0.106 |
| SDNN | 324.7 | 426.0 | 155.1 | 199.6 | 71.9 | 29.2 | 1.79 | 0.191 | 0.146 |
| PNS Index | 6.7 | 8.0 | 5.3 | 9.9 | 0.8 | 1.4 | 1.42 | 0.264 | 0.119 |
| SNS Index | −1.6 | 0.9 | −1.1 | 1.5 | −0.1 | 0.7 | 4.03 | 0.033 | 0.277 |
| Mean HR | 55.2 | 9.4 | 58.8 | 11.9 | 71.6 | 10.0 | 5.34 | 0.013 | 0.337 |
| VAS pain | 0.50 | 0.75 | 1.25 | 1.03 | 6.87 | 0.83 | 125 | <0.001 | 0.922 |
| Reliability between Different Days (Non-Fatigue) | Reliability between Fatigue and Non-Fatigue Measurements | |||||||
|---|---|---|---|---|---|---|---|---|
| Variables | TE | ICC | CV% | MDC | TE | ICC | CV% | MDC |
| Desaturation | 7.3 (5.4 to 11.3) | 0.49 | 5.97 | 7.4 | 8.5 (6.3 to 13.2) | 0.04 | 1.96 | 8.6 |
| Resaturation | 7.4 (5.5 to 11.4) | 0.63 | 14.4 | 7.5 | 9.4 (6.6 to 15.9) | 0.18 | 2.63 | 11.1 |
| Hyperemia | 3.6 (2.6 to 6.1) | 0.57 | 40.5 | 4.3 | 3.3 (2.3 to 5.6) | 0.49 | 11.41 | 3.9 |
| Tau | 11.6 (8.2 to 19.7) | 0.32 | 94.7 | 13.7 | 12.0 (8.5 to 20.4) | 0.03 | 13.67 | 14.2 |
| MRT | 8.2 (5.8 to 13.9) | 0.50 | 9.50 | 9.7 | 12.2 (8.7 to 20.8) | 0.45 | 2.80 | 14.5 |
| Interval R-R | 51.53 (36.5 to 87.5) | 0.94 | 2.95 | 60.9 | 141.7 (100.4 to 240.6) | 0.44 | 0.97 | 167.1 |
| RSMMD | 38.0 (27.0 to 64.6) | 0.98 | 1.76 min | 45.0 | 164.2 (116.3 to 278.7) | 0.21 | 1.96 | 194.0 |
| SDNN | 224.6 (159.1 to 381.3) | 0.43 | 1.58 | 265.4 | 113.3 (80.3 to 192.4) | 0.26 | 2.28 | 133.9 |
| PNS index | 1.5 (1.1 to 2.5) | 0.98 | 15.27 | 1.8 | 5.7 (4.0 to 9.7) | 0.25 | 9.31 | 6.7 |
| SNS index | 0.4 (0.3 to 0.7) | 0.97 | 24.97 | 0.5 | 0.7 (0.5 to 1.1) | 0.61 | 9.63 | 0.8 |
| Mean HR | 3.1 (2.2 to 5.3) | 0.91 | 8.72 | 3.7 | 7.2 (5.1 to 12.3) | 0.59 | 3.76 | 8.5 |
Disclaimer/Publisher’s Note: The statements, opinions and data contained in all publications are solely those of the individual author(s) and contributor(s) and not of MDPI and/or the editor(s). MDPI and/or the editor(s) disclaim responsibility for any injury to people or property resulting from any ideas, methods, instructions or products referred to in the content. |
© 2024 by the authors. Licensee MDPI, Basel, Switzerland. This article is an open access article distributed under the terms and conditions of the Creative Commons Attribution (CC BY) license (https://creativecommons.org/licenses/by/4.0/).
Share and Cite
Vasquez-Bonilla, A.A.; Yáñez-Sepúlveda, R.; Tuesta, M.; Martin, E.B.-S.; Monsalves-Álvarez, M.; Olivares-Arancibia, J.; Duclos-Bastías, D.; Recabarren-Dueñas, C.; Alacid, F. Acute Fatigue Impairs Heart Rate Variability and Resting Muscle Oxygen Consumption Kinetics. Appl. Sci. 2024, 14, 9166. https://doi.org/10.3390/app14209166
Vasquez-Bonilla AA, Yáñez-Sepúlveda R, Tuesta M, Martin EB-S, Monsalves-Álvarez M, Olivares-Arancibia J, Duclos-Bastías D, Recabarren-Dueñas C, Alacid F. Acute Fatigue Impairs Heart Rate Variability and Resting Muscle Oxygen Consumption Kinetics. Applied Sciences. 2024; 14(20):9166. https://doi.org/10.3390/app14209166
Chicago/Turabian StyleVasquez-Bonilla, Aldo A., Rodrigo Yáñez-Sepúlveda, Marcelo Tuesta, Eduardo Báez-San Martin, Matías Monsalves-Álvarez, Jorge Olivares-Arancibia, Daniel Duclos-Bastías, Catalina Recabarren-Dueñas, and Fernando Alacid. 2024. "Acute Fatigue Impairs Heart Rate Variability and Resting Muscle Oxygen Consumption Kinetics" Applied Sciences 14, no. 20: 9166. https://doi.org/10.3390/app14209166