Article

Fall Risk Classification Using Trunk Movement Patterns from Inertial Measurement Units and Mini-BESTest in Community-Dwelling Older Adults: A Deep Learning Approach

by
Diego Robles Cruz
1,2,3,*,†,
Sebastián Puebla Quiñones
3,
Andrea Lira Belmar
4,†,
Denisse Quintana Figueroa
5,
María Reyes Hidalgo
5 and
Carla Taramasco Toro
3,6,7,†
1
Escuela de Ingeniería Civil Informática, Universidad de Valparaíso, Valparaíso 2362905, Chile
2
Centro de Estudios del Movimiento Humano (CEMH), Escuela de Kinesiología, Facultad de Salud y Odontología, Universidad Diego Portales, Santiago 8370179, Chile
3
Instituto de Tecnología para la Innovación en Salud y Bienestar, Facultad de Ingeniería, Universidad Andrés Bello, Viña del Mar 2531015, Chile
4
Center of Interdisciplinary Biomedical and Engineering Research for Health—MEDING, Universidad de Valparaíso, Valparaíso 2362905, Chile
5
Carrera de Kinesiología, Universidad Central de Chile, Santiago 8330601, Chile
6
Facultad de Ingeniería, Universidad Andrés Bello, Viña del Mar 2531015, Chile
7
Millennium Nucleus on Sociomedicine, Santiago 7560908, Chile
*
Author to whom correspondence should be addressed.
These authors contributed equally to this work.
Appl. Sci. 2024, 14(20), 9170; https://doi.org/10.3390/app14209170 (registering DOI)
Submission received: 9 September 2024 / Revised: 26 September 2024 / Accepted: 27 September 2024 / Published: 10 October 2024
(This article belongs to the Special Issue Falls: Risk, Prevention and Rehabilitation (2nd Edition))

Abstract

:
Falls among older adults represent a critical global public health problem, as they are one of the main causes of disability in this age group. We have developed an automated approach to identifying fall risk using low-cost, accessible technology. Trunk movement patterns were collected from 181 older people, with and without a history of falls, during the execution of the Mini-BESTest. Data were captured using smartphone sensors (an accelerometer, a gyroscope, and a magnetometer) and classified based on fall history using deep learning algorithms (LSTM). The classification model achieved an overall accuracy of 88.55% a precision of 90.14%, a recall of 87.93%, and an F1 score of 89.02% by combining all signals from the Mini-BESTest tasks. The performance outperformed the metrics we obtained from individual tasks, demonstrating that aggregating all cues provides a more complete and robust assessment of fall risk in older adults. The results suggest that combining signals from multiple tasks allowed the model to better capture the complexities of postural control and dynamic gait, leading to better prediction of falls. This highlights the potential of integrating multiple assessment modalities for more effective fall risk monitoring.

1. Introduction

In 2021, the World Health Organization (WHO) defined the term “fall” as an “event that causes a person to unintentionally rest on the ground, floor, or another lower level”. This phenomenon occurs annually in approximately 30% of adults over 65 years old [1] and represents one of the leading causes of morbidity and mortality in this age group [2], representing a significant challenge for public health globally [3]. The global prevalence of falls among older adults is 26.5% [4]; cultural differences and lifestyle factors appear to influence this figure [3]. Furthermore, it has been demonstrated that falls in the elderly are predominantly determined by the characteristics of their vital space [4]. The elderly are especially susceptible to the conditions of their immediate environment [5]. The incidence of falls, as well as associated injuries, generates substantial economic costs for the individual, society, and the healthcare system. In 2024, in the USA, the estimated medical costs attributed to falls were approximately 20 billion USD [6]. Unintentional injuries are one of the leading causes of death among older adults—cardiovascular diseases, respiratory disorders, and cancer [7] are second on the list of the leading causes of accidental injury deaths worldwide [8]—representing one of the most important health problems in the older adult population, since they combine a high incidence and susceptibility to injury.
Physiological changes typical of age, such as a greater latency of protective reflexes accompanied by highly prevalent diseases, such as osteoporosis, make suffering a fall particularly dangerous. Fractures in osteoporotic bones, such as hip fractures, represent one of the most devastating consequences of falls [9,10].
The inherent changes associated with aging in the somatic nervous system lead to alterations in stability, increasing the individual’s vulnerability when performing motor tasks [11]. The adaptability of postural responses shows significant variations depending on age, and their proper regulation is influenced not only by structural changes in the musculoskeletal system but also by cognitive factors that affect longevity [11]. Deterioration associated with the aging process, particularly sarcopenia, negatively impacts motor variability and the functional skills required for maintaining stability. Additionally, greater latency in the initiation of muscle activation [12], the decrease in muscle strength [13], the reduction in flexibility, and other neuromuscular changes increase the “risk” of falls [14,15].

1.1. Frailty Syndrome

One of the key concepts is the term fragility, which is defined as a clinical–biological syndrome that generates alterations in multiple physiological systems, including dysfunction of the musculoskeletal, neurological, and energy metabolism systems, causing a state of increased vulnerability and increased risk of suffering adverse health effects, such as falls, disability, hospitalization, institutionalization, and death [16,17,18]. With an aging population, there is growing interest in the identification of frail older people who present risks of functional decline. Frailty has been shown to be a significant predictor of future falls among community-dwelling older people, despite the various criteria used to define it [19].

1.2. Risk Factors

The term risk refers to the probability that an event, generally unfavorable, will occur within a given period of time or before a given age. A risk factor may be an aspect of personal behavior or lifestyle, an environmental circumstance, or due to an inherited characteristic. This is not necessarily a causal factor, but it is a marker of increased probability [20]. All biological alterations associated with the individual are classified as intrinsic factors of falls. However, due to the multifactorial nature of these events, those factors that are extrinsic must also be considered, that is, they include the environment [21].
Intrinsic factors are specific to each individual and include age, chronic diseases, muscle weakness, problems with gait, balance, and cognitive impairment [21]. Extrinsic factors link the etiology of falls with psychosocial behavior and the environment in which people live (for example, environmental hazards or dangerous activities). The latter is described as the leading cause of falls and accounts for approximately half of all falls [22]. Conditions such as walking on slippery/rough surfaces, obstacles, inadequate lighting, loose carpets, or even the way medications are taken at home [23] promote tripping or slipping in any age group, but they represent a significant risk in people with underlying intrinsic factors.
To assess fall risk, multiple tools and functional evaluation tests have been developed. Among these, the Mini-Balance Evaluation Systems Test (Mini-BESTest) has proven to be one of the most effective methods for evaluating postural control and balance in older adults [24,25]. This test assesses the key components of dynamic balance through 14 items addressing four main domains: anticipatory control, reactive control, sensory orientation, and gait stability. Several studies have demonstrated the ability of the Mini-BESTest to predict falls; however, its use for the automatic classification of fall risk remains limited. Manual evaluation of these methods requires clinical expertise, making their large-scale, automated implementation difficult.
With the advancement of Artificial Intelligence (AI) and deep learning, new opportunities have emerged to automate and improve fall risk prediction methods in this population. Deep learning techniques, which mimic the functioning of the human brain through artificial neural networks, allow for the processing of large volumes of complex data and the extraction of patterns not apparent through traditional methods. These techniques have been widely applied across various areas of medicine, including disease detection, medical image analysis, and clinical outcome prediction. Currently, efforts are focused on developing new paradigms for fall prediction in older adult populations, aiming to integrate both real-time assessment and the risk of future falls. These approaches are crucial for optimizing the quality of healthcare systems, as the accurate identification of fall risk is an essential prerequisite for their effective implementation [26,27]. On the other hand, the ability to anticipate and proactively address the phenomenon of falls requires predictive tools that are robust and efficient, as well as capable of detecting older individuals who are at a high risk of falling. Furthermore, early intervention, based on proper forecasting, is critical to mitigating the incidence of this adverse event and facilitating the appropriate care and preparedness for this vulnerable population [26,28]. In this context, the present study aimed to classify risk of falls in community-dwelling older adults based on patterns derived from the Mini-BESTest using a deep neural network approach. Our main hypothesis was based on the fact that the Mini-BESTest scoring patterns provide key information to identify individuals at risk of falls and that a deep learning model improves the classification accuracy compared to traditional methods. Furthermore, we were interested in evaluating the individual performance of each functional task included in the Mini-BESTest in identifying those who suffer falls and those who do not, as well as determining the overall performance when all functional tasks were combined in the binary classification (with falls or without falls). This approach not only has the potential to automate the evaluation process, but it also may facilitate early identification of fall risk, allowing for timely intervention by healthcare professionals and the implementation of personalized preventive measures.

2. Related Work

There are currently a considerable number of fall risk assessment tools available [29], all of which assess similar characteristics of people. However, fall risk assessment is not standardized within or across settings. Traditionally, two types of assessments relevant to falls and mobility have been performed based on setting or specific disciplinary factors.

2.1. Clinical Tools for Fall Risk Assessment

Functional mobility assessments, such as the Tinetti Mobility Test [30], the Berg Balance Scale [31], and the Dynamic Gait Index [32], have been widely used to measure balance and fall risk. These tools are useful for identifying functional limitations that may predispose individuals to falls. However, they present limitations, as they do not capture critical factors such as reactive postural adjustments or changes in gait speed, which are key to assessing fall risk [33]. Additionally, many of these tools rely on the subjective evaluation of clinical staff, which can introduce variability and bias.

2.2. Sensor-Based Fall Risk Assessment

There are a variety of methodologies used to estimate fall risk from data from multiple bioinstruments [34]. Consequently, the acquisition of signals can be carried out while volunteers perform functional tests, predefined tasks of daily life, or continuously and without restrictions. All of these experimental conditions use different acquisition techniques, processing, application of signal analysis and statistical analysis techniques, ranging from comparing characteristics between groups of fallers and non-fallers using retrospective or prospective designs [35,36,37], to other reports that use machine learning techniques to distinguish between those who fall from those who do not [38,39,40]. Therefore, taking into account the heterogeneity of the studies, there is a lack of consensus on the most appropriate parameters to study falls, especially in old people [41].

2.3. Current Methodologies for Predicting Fall Risk

A wide range of sensor-based technologies have been used to assess fall risk in older adults. Current ones include inertial sensors such as accelerometers and gyroscopes used to quantify center of mass (CoM) motion [42,43,44,45], motion capture cameras (Kinect™ system) [46,47], pressure sensing platforms such as the Wii board [48,49] and environmental motion sensing technologies such as radar or laser [50]. Overall, these devices have the potential to provide an accurate, cost-effective, and easy-to-implement fall risk assessment. However, variation in measured parameters, assessment tools, sensor placement sites, motion tasks, and modeling techniques preclude a firm conclusion about their ability to predict future falls [41].
In addition to those mentioned, different movements have been used as functional evaluation mechanisms (gait, transfer from sitting to biped and from biped to sitting, Test up and Go, Berg Balance Scale, etc.). At the same time, the characteristics extracted to implement the methods are also different (movement, duration, movement speed, acceleration amplitude, measurements in the frequency, domain, reaction time, etc.), and the modeling methods are diverse. This may explain why the current literature describes a diverse range of performance (accuracy: 47.9–100%, sensitivity: 16.7–100%, specificity: 40–100%, AUC 0.65–0.89) [41].

2.4. Classification Models for Fall Risk Prediction

Currently, there are numerous quantitative models and methods for predicting fall risk. The most commonly used include logistic regression, linear regression, radial basis function network (RBFN) classifiers [51], support vector machines (SVMs) [52], Bayesian classifiers, multilayer perceptrons [51], locally weighted learning, decision trees [53], cluster analysis, k-nearest neighbors (kNNs) [54], neural networks, neuroevolution of augmenting topologies (NEAT) [54], and discriminant analysis. It is worth noting that logistic regression has historically been the most widely used technique for fall risk prediction modeling, although recent publications have increasingly employed non-linear classification models [54]. On the other hand, it is relevant to note that only 50% of the studies were carried out with adequate validation procedures based on recommended models, such as single-output cross-validation, ten-fold cross-validation, and cross-validation retention. Consequently, the diagnostic performance of studies without adequate model validation could be overstated [53].

2.5. Advances in Deep Learning for Fall Risk Prediction

Deep learning has opened new possibilities for analyzing complex data obtained from inertial sensors. Deep neural networks (DNNs) and convolutional neural networks (CNNs) are effective in identifying complex movement patterns that are not detected by traditional data analysis methods [55,56]. For example, in a study, researchers used recurrent neural networks (RNNs) to analyze movement patterns obtained through IMUs, achieving significant improvements in fall risk prediction accuracy compared to more traditional methods such as support vector machines and random forests [57]. These advances suggest that the use of deep learning algorithms offers a new approach to improving risk identification.
In another study, researchers explored the use of deep neural networks for predicting fall risk by utilizing time series signals generated from a force plate. The study highlighted the capability of neural networks to identify human balance patterns and their effectiveness in classifying individuals based on their fall risk [58]. This investigation is particularly relevant to our work, as both studies share the goal of improving fall prediction through the analysis of complex balance data. The use of force plates and neural network analysis in the context of postural control emphasizes the potential of these approaches to enhance the accuracy of fall risk prediction.
Chen and Pen [59] provided a comprehensive survey on deep learning techniques applied to inertial positioning, emphasizing the use of inertial sensors in smartphones, drones, and IoT devices for localization and motion tracking. The survey explores key challenges in inertial positioning, such as sensor calibration, reducing error drifts, and enhancing multisensor fusion. The study highlighted the potential of deep learning to address the limitations of traditional inertial navigation algorithms, particularly in mitigating measurement errors and unbounded drifts that often occur with low-cost MEMS inertial sensors. This research is especially relevant to our work, as it aligns with the use of deep learning to analyze complex sensor data, which is critical for accurately predicting balance and postural control issues in older adults. While other researchers have proposed a Bidirectional Residual Deep Short-Term Memory (Bidir-LSTM) model for human activity recognition (HAR) using wearable sensors [60]. The use of Bidir-LSTM is particularly beneficial in improving the ability to capture temporal dependencies both forward and backward in time. The authors demonstrated that this architecture significantly improved the model’s performance on HAR tasks by increasing recognition rates when applied to public datasets such as Opportunity and UCI [61], which explained the effectiveness of using deep learning architectures with wearable sensor data to capture complex motion patterns.
In addition, one study explored the use of deep learning and machine learning methods, specifically joint node graphs (JNPs), to assess postural control in younger and older adults. The study used Kinect to capture joint motions and analyzed individuals’ postural stability during 40-s standing tasks. Their findings demonstrated that deep learning methods could effectively distinguish between different age groups based on their postural control, with the accuracy, sensitivity, and specificity metrics exceeding 0.9 [62]. This study demonstrated the utility of deep learning techniques to analyze postural control, which aligns with our goals of improving fall risk prediction using wearable sensors and biomechanical data.
A deep neural network was applied—specifically, a bidirectional long short-term memory (BiLSTM) network—to classify fall risk in individuals with multiple sclerosis based on gait data captured from wearable sensors. The model demonstrated a strong performance with an AUC of 0.88, significantly improving upon traditional machine learning models based on spatiotemporal gait parameters and other statistical features [63]. The simplicity of the setup, using only two wearable sensors during a one-minute walking task, underscores the potential of using deep learning in combination with wearable technologies for practical and effective fall risk assessment.
The application of deep learning for fall risk assessment using inertial sensors was also explored, specifically focusing on spatiotemporal gait parameters. The study emphasizes the value of domain knowledge in improving model performance, as spatiotemporal gait metrics are critical for accurately predicting fall risk. The authors used long short-term memory (LSTM) neural networks to process gait data, demonstrating that incorporating domain-specific features significantly enhances the predictive power of deep learning models in fall risk assessment [64].
The use of wrist-worn inertial sensors and deep learning techniques to detect gait abnormalities associated with fall risk was investigated. The authors employed a combination of convolutional layers and bidirectional long short-term memory (BiLSTM) layers to capture spatiotemporal features from accelerometer, gyroscope, and rotation vector sensor data collected from smartwatches worn on both wrists. Their proposed model achieved an accuracy of 88.9%, sensitivity of 90.6%, and specificity of 86.2%, demonstrating its effectiveness in detecting abnormal gait patterns. This study highlighted the potential of wearable sensors and deep learning for continuous and non-invasive fall risk assessment, which aligns with our aim of leveraging deep learning models for fall detection and prevention [65].
Finally, Yıldız [66] explored the use of deep learning techniques to assess fall risk by classifying walking surface conditions using IMU-based gait data. A 25-layer convolutional neural network was developed to classify nine different walking surfaces, emphasizing the influence of environmental factors on fall risk. The study collected data from 30 participants wearing six IMU sensors, achieving accuracies of up to 0.971 under optimal conditions. This research highlighted the importance of considering environmental context in fall risk assessment, which complements our study’s focus on deep learning models for identifying fall risk through gait and postural control data.
Despite the advancements in fall risk assessment, there remains a significant gap in the real-time, continuous, and non-invasive evaluation of fall risk, particularly using wearable technologies. Existing clinical tools, while useful in controlled environments, often fail to capture the dynamic nature of a fall risk in real-world settings, and they many rely on subjective assessments that can introduce variability and bias. Furthermore, while many machine learning and deep learning techniques have been applied to fall risk prediction, few studies have fully explored the potential of combining multisensor data from wearable devices to evaluate balance and postural control across a comprehensive set of functional movements.
Our study sought to address this gap by leveraging the clinical robustness of the Mini-BESTest, which is a well-validated tool for assessing balance, and combining it with sensor-based data from inertial measurement units (IMUs). By using deep learning models to process data from multiple tasks of the Mini-BESTest, our approach captured a broader spectrum of movement patterns, thereby improving the predictive power of fall risk. The innovation in this work lies in the ability to fuse data from different functional tasks and provide an integrated fall risk assessment that is accurate and clinically relevant. Unlike traditional methods that rely on single-task assessments, our approach demonstrated the value of using combined signals from multiple postural and gait tasks to improve fall risk prediction.

3. Materials and Methods

3.1. Dataset

Participants for the study were recruited from the Metropolitan region of Santiago de Chile through local community centers and elderly care facilities. The recruitment process targeted older adults aged 65 and above, regardless of socioeconomic status, to ensure a diverse and representative sample. A total of 181 elderly people from the community were evaluated (See Table 1 with the description of the sample). Of these participants, 85 were classified as non-fallers, and 96 were classified as fallers based on their fall history. This diverse sample allows for a comprehensive analysis of fall risk across different demographics within the older adult population.
This study considered the following recruitment criteria: Men and women over 65 years of age who did not feel tired or had difficulty breathing at the time of testing. Participants were excluded if they had any recent injuries or surgeries affecting mobility, uncontrolled cardiopulmonary conditions, or balance disorders that could interfere with the study’s focus on fall risk. Individuals with moderate to severe cognitive impairment, or uncontrolled chronic illnesses like hypertension or diabetes were also excluded to ensure they could fully engage in the tasks and provide informed consent. These criteria helped maintain participant safety and the integrity of the study. Each participant signed an informed consent form prior to the evaluations, which were approved by the Scientific Committee of Bioethics of the Central University of Chile (reference folio project 48/2022). The evaluations took place over a six-month period, from August 2023 to January 2024, ensuring that the study adhered to ethical standards and allowing sufficient time for comprehensive data collection.

3.2. Data Augmentation and Segmentation

To increase the diversity and the volume of available data for training the model, various data augmentation techniques were applied. This approach is particularly useful when the original dataset is limited in size.
After applying data augmentation, the total number of samples increased from 181 (85 non-fallers, 96 fallers) to 279 samples (136 non-fallers, 143 fallers). To address data scarcity and improve model robustness, data augmentation techniques were employed, which included:
  • Jittering: Adding random noise to simulate natural variability. This technique is commonly employed in time series data augmentation to enhance model robustness by introducing minor variations in the input data [67].
  • Scaling: Applying small, constant variations to the time series. Scaling has been shown to improve model performance by generating variability in the amplitude of the input data [68].
  • Time warping: Non-linear stretching or compressing of the time axis. Time warping is especially useful in time series classification tasks, as it allows the model to handle variations in the speed of events [68].
  • Window slicing: Extracting different segments from the time series to create new, slightly shifted samples. This technique helps create additional data points by slicing the data into overlapping windows, increasing the effective size of the dataset [69].
  • Interpolation: Generating new, smoothed samples by interpolating between existing data points. Interpolation techniques are widely used in augmenting time series data to create smoothed transitions between samples [68].

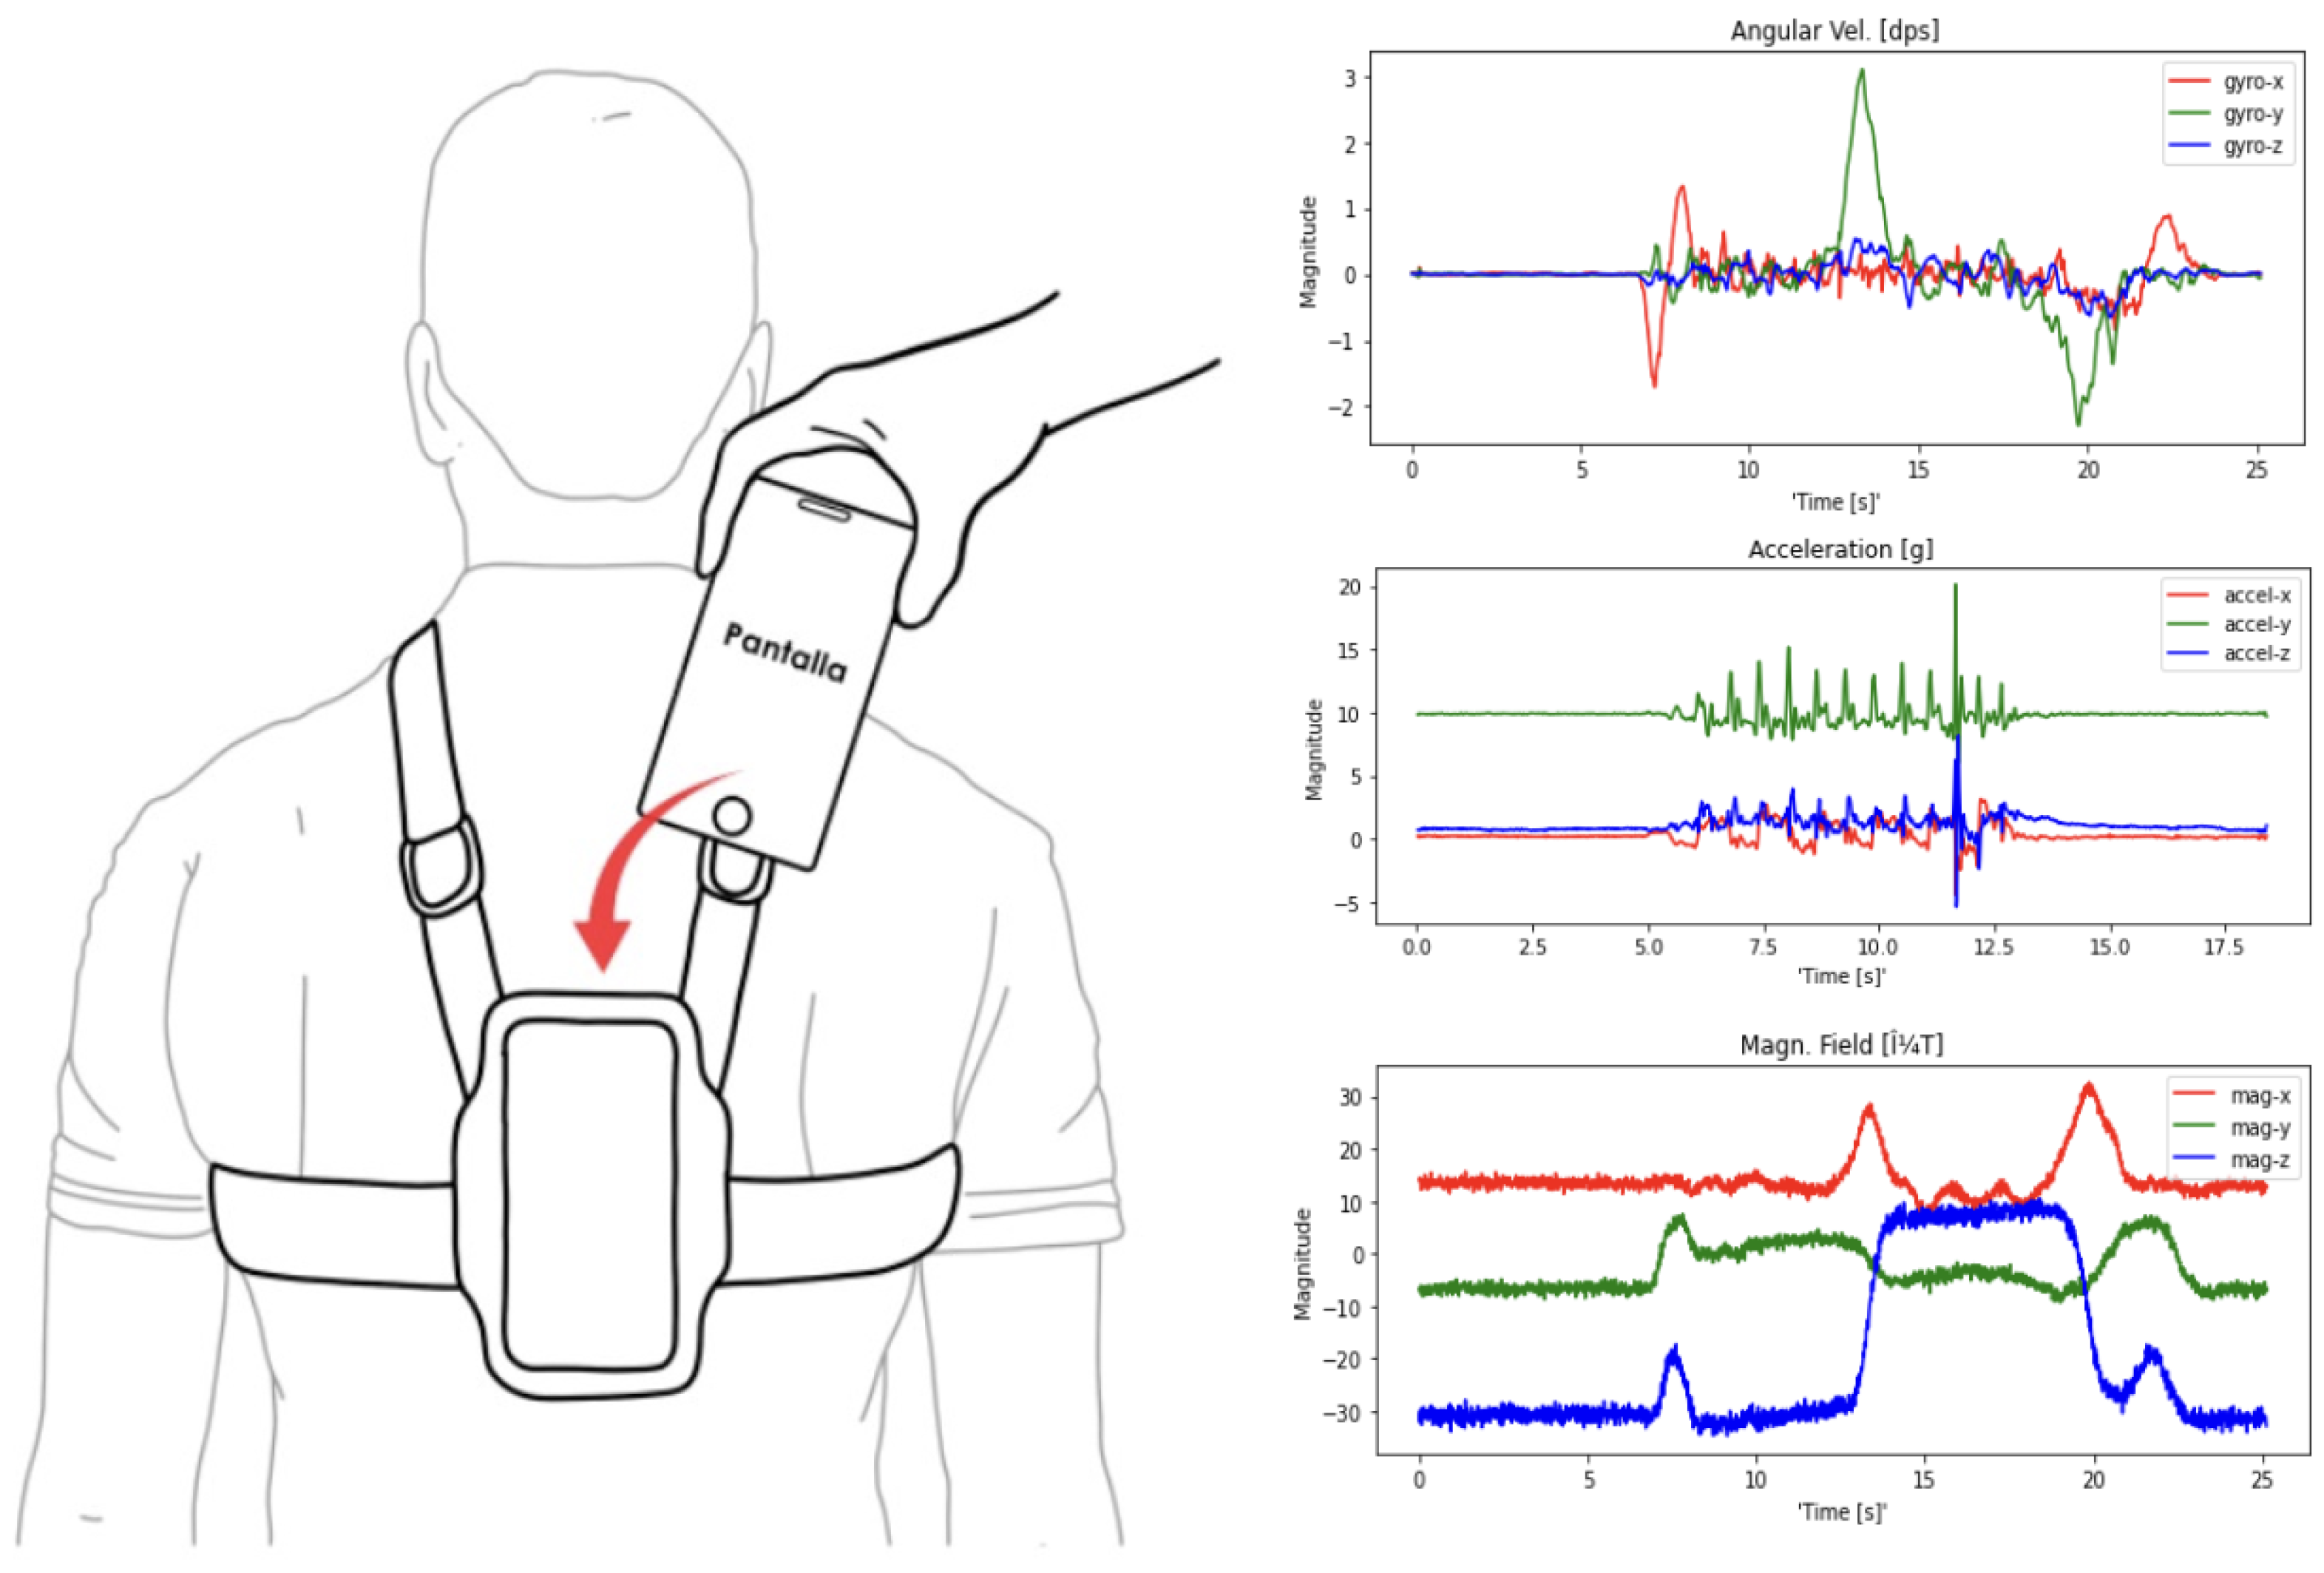
3.3. Smartphones for Monitoring System

Smartphones come equipped with sensors such as accelerometers, gyroscopes, and magnetometers. The availability of this low-cost and universally accessible technology presents an opportunity to address public health challenges related to assessing the mobility levels of older adults. The Samsung Galaxy phone model A14 (Suwon-si, Republic of Korea) was used. Its features allowed for adequate registration and monitoring of older adults. The accuracy and reliability of smartphones equipped with MEMS-based inertial sensors, such as the Samsung Galaxy A14’s accelerometer and gyroscope, have been demonstrated in laboratory tests [70,71]. Studies show acceptable accuracy in measuring movement and orientation, making them viable for non-clinical applications such as gait analysis and fall prediction [72,73]. The phone was placed on the torso at the level of the dorsal spine, firmly attached to the person’s body by means of a harness (Figure 1). The sampling rate for the accelerometer it was 50 datas per second.

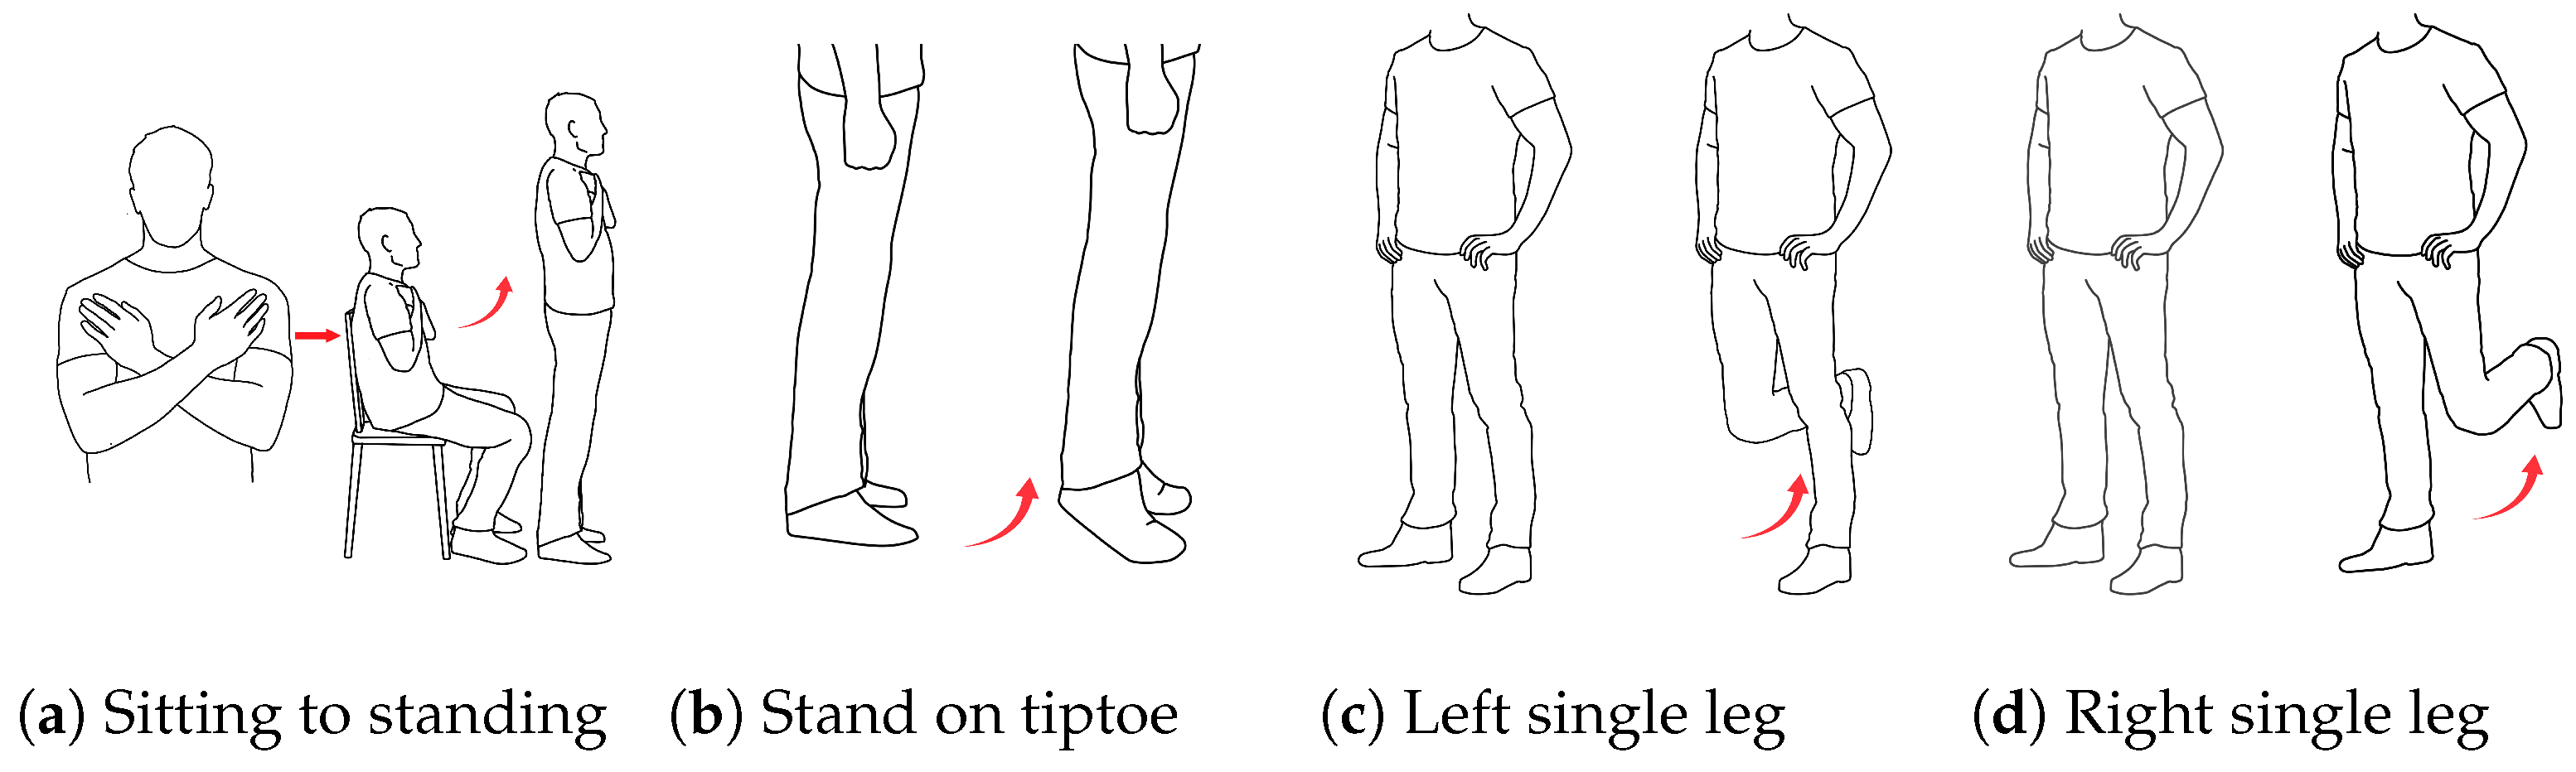
3.4. Assessment of Postural Control

In this study, we implemented an approach based on the Mini-BESTest, which is routinely used by healthcare professionals to assess fall risk [74]. BESTest is a balance assessment and training tool developed by Fay Horak, which provides a sensitive and quantitative assessment of balance, allowing identification of subtle deficits and monitoring of progress during treatment. The original test consists of 27 items, and a shortened version with 14 items (Mini-BESTest) is available and implemented in this application.
By applying the Mini-BESTest and recording the trunk movement patterns of older people, using an accelerometer, a gyroscope and a magnetometer to analyse their movements in the three spatial planes, 14 tests were evaluated to estimate the quality of postural control (See Figure 1 and Figure 2). In this case, the application allowed both qualitative recording by the observer and automated analysis and the extraction of characteristics of the recorded signals.

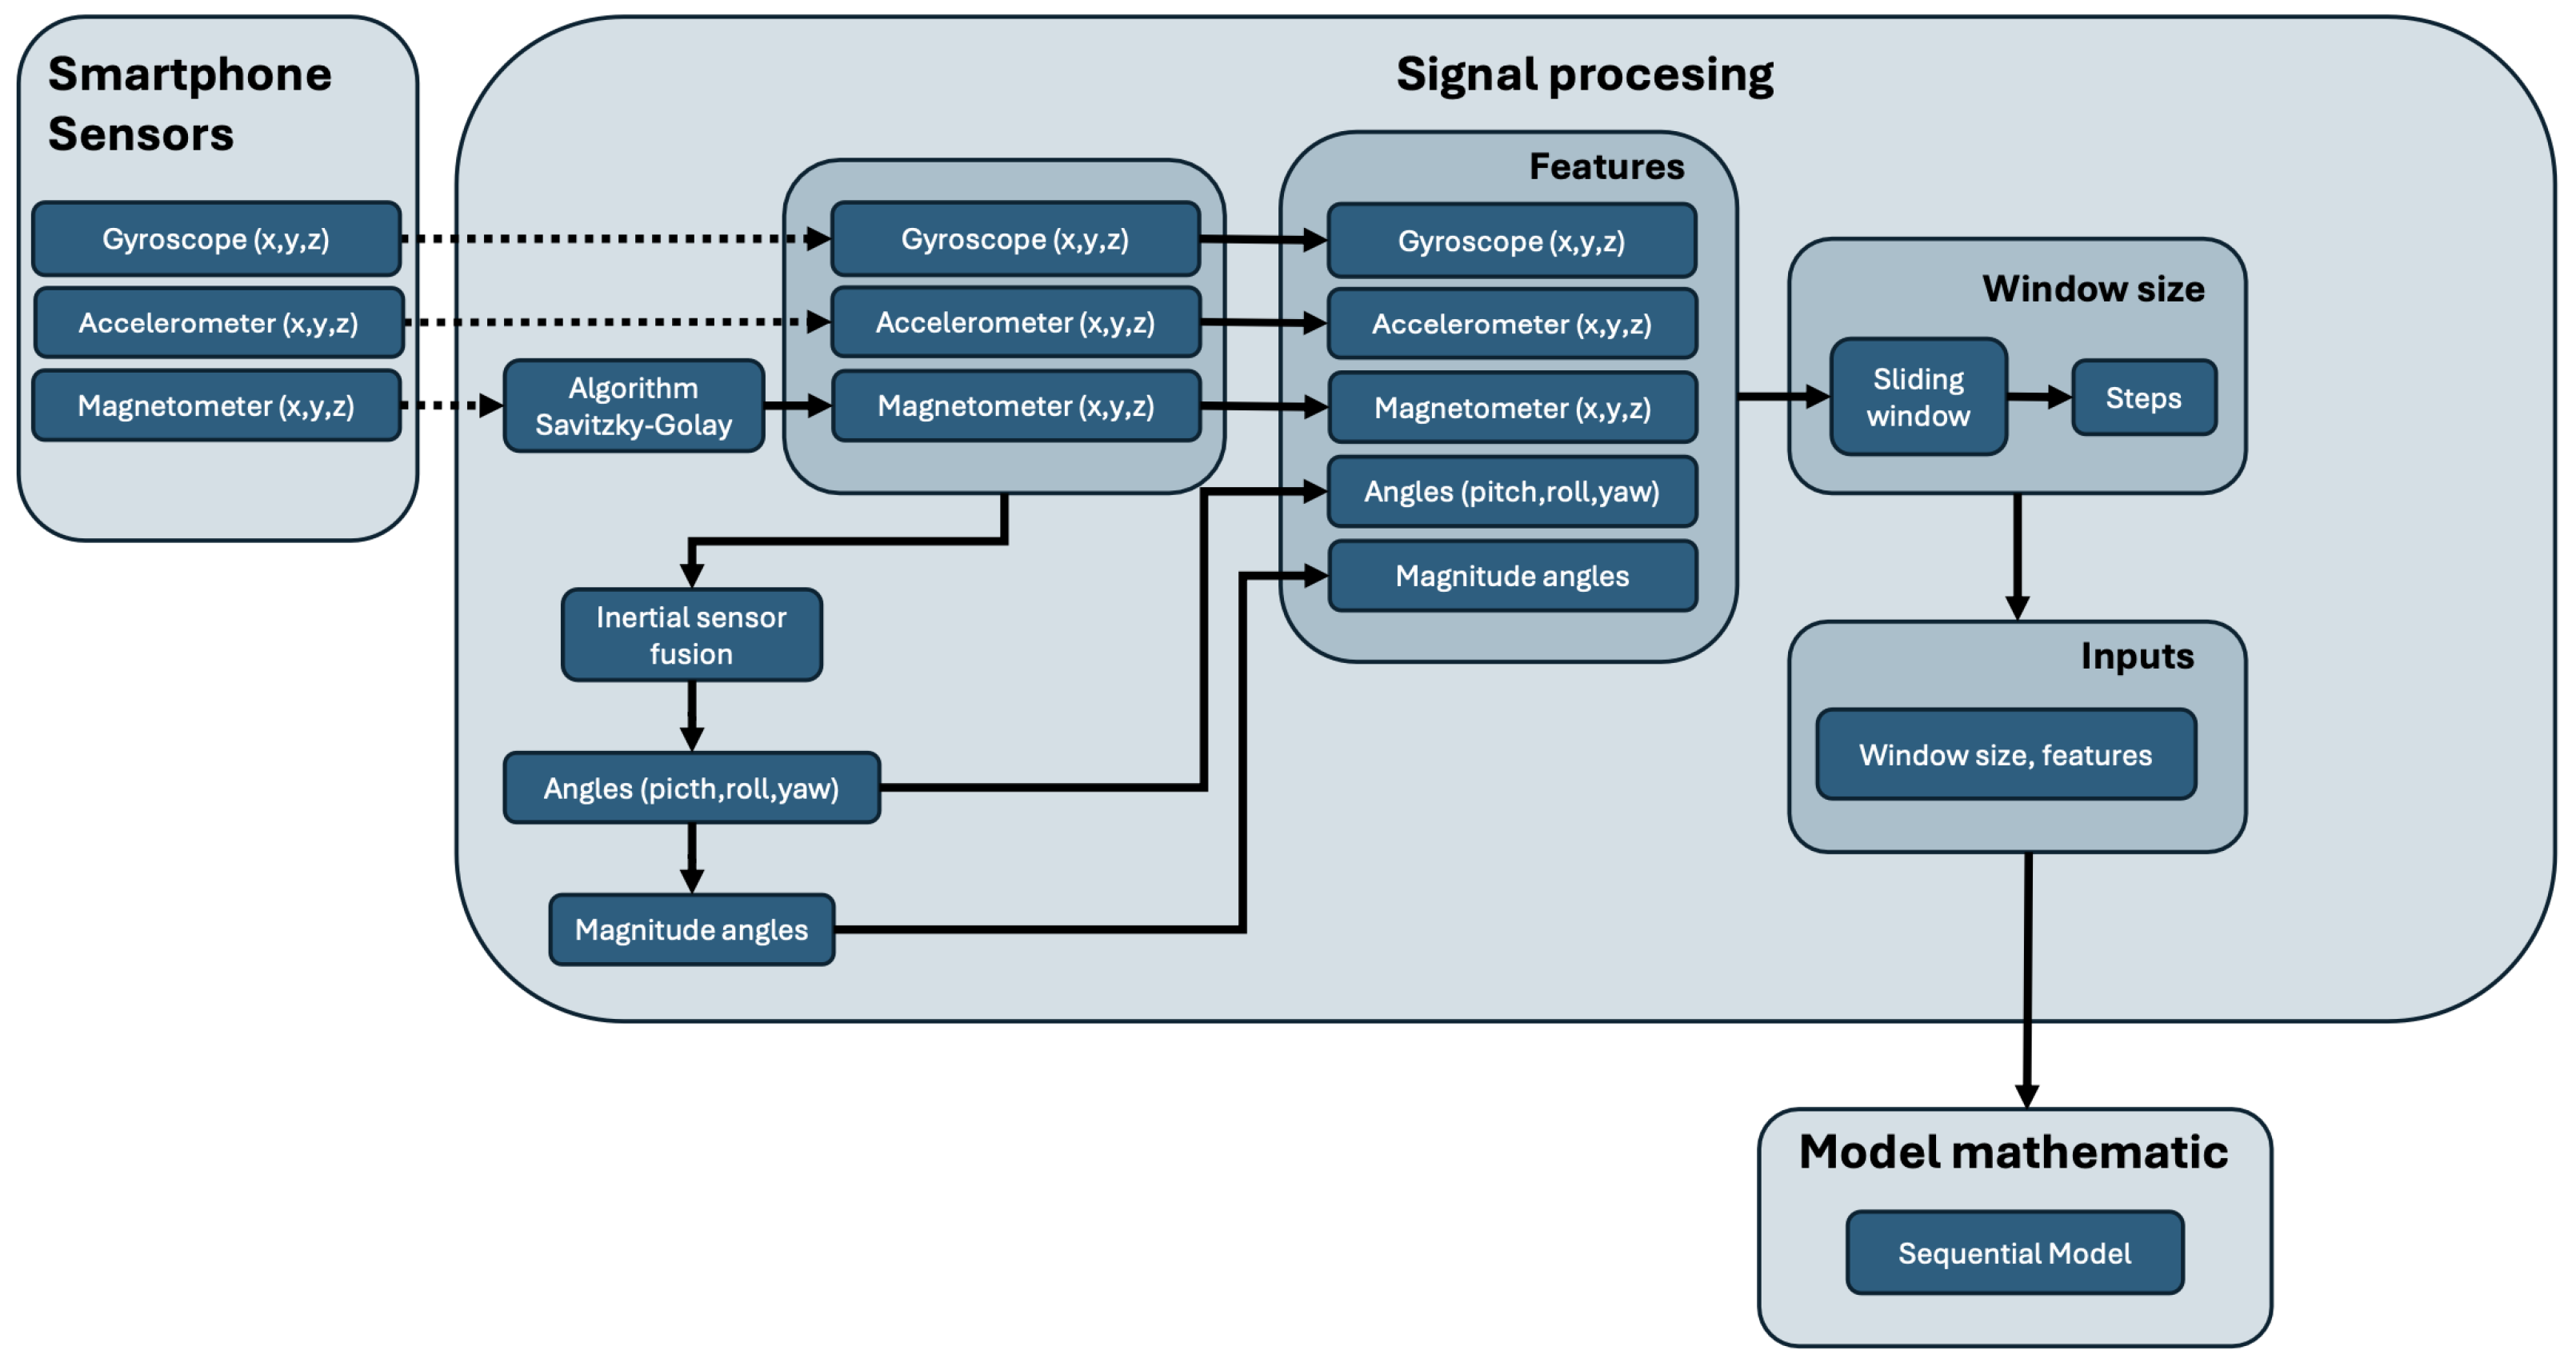
3.5. Signal Processing

The magnetometer signal was subject to noise due to the presence of electromagnetic interference from the environment. To address this, a Savitzky-Golay moving average filter was applied to reduce the noise without compromising the key characteristics of the signal, such as its orientation properties. The magnetometer plays a crucial role in determining the individual’s orientation with respect to the Earth’s magnetic field, which is essential for fall risk detection. To enhance the detection process, sensor fusion techniques were employed to calculate the angular orientation (roll, pitch, and yaw) of the individual. In this process, a weighted fusion was performed, assigning 60% weight to the gyroscope and 40% to the accelerometer. This configuration was designed to balance the information obtained from both sensors—where the accelerometer provides valuable insights into stability, and the gyroscope captures the rapid changes associated with bodily corrections, which are often indicative of fall risks. In addition, the magnitude of the merged signals was calculated to obtain a new signal that reflected overall changes over the time course. This reduced the complexity of the individual signals while preserving critical information about the individual’s movement (See Figure 3).
For input into the deep learning model, several key signals were selected: gyroscope (xyz), accelerometer (xyz), magnetometer (xyz), angular orientation (roll, pitch, yaw), and the computed magnitude. These signals were packaged and labeled based on whether the subject was classified as a faller or non-faller. After packaging the signals, they were processed using a sliding window approach with a window size of 256 samples and a step size of 64 samples. This approach ensured that the temporal dynamics of the signals were adequately captured, while providing sufficient overlap between windows for robust analysis. Since the duration of each task and experiment varied among participants, the number of segments generated from each sample was variable. This segmentation approach provided the model with more data to learn from, allowing it to capture relevant patterns for fall risk prediction. The increased data helped the model generalize better and recognize individuals with fall risk more accurately. With the signal processing pipeline complete, the data were ready for input into the deep learning model for fall risk classification (See Figure 3).

3.6. Neural Network Model
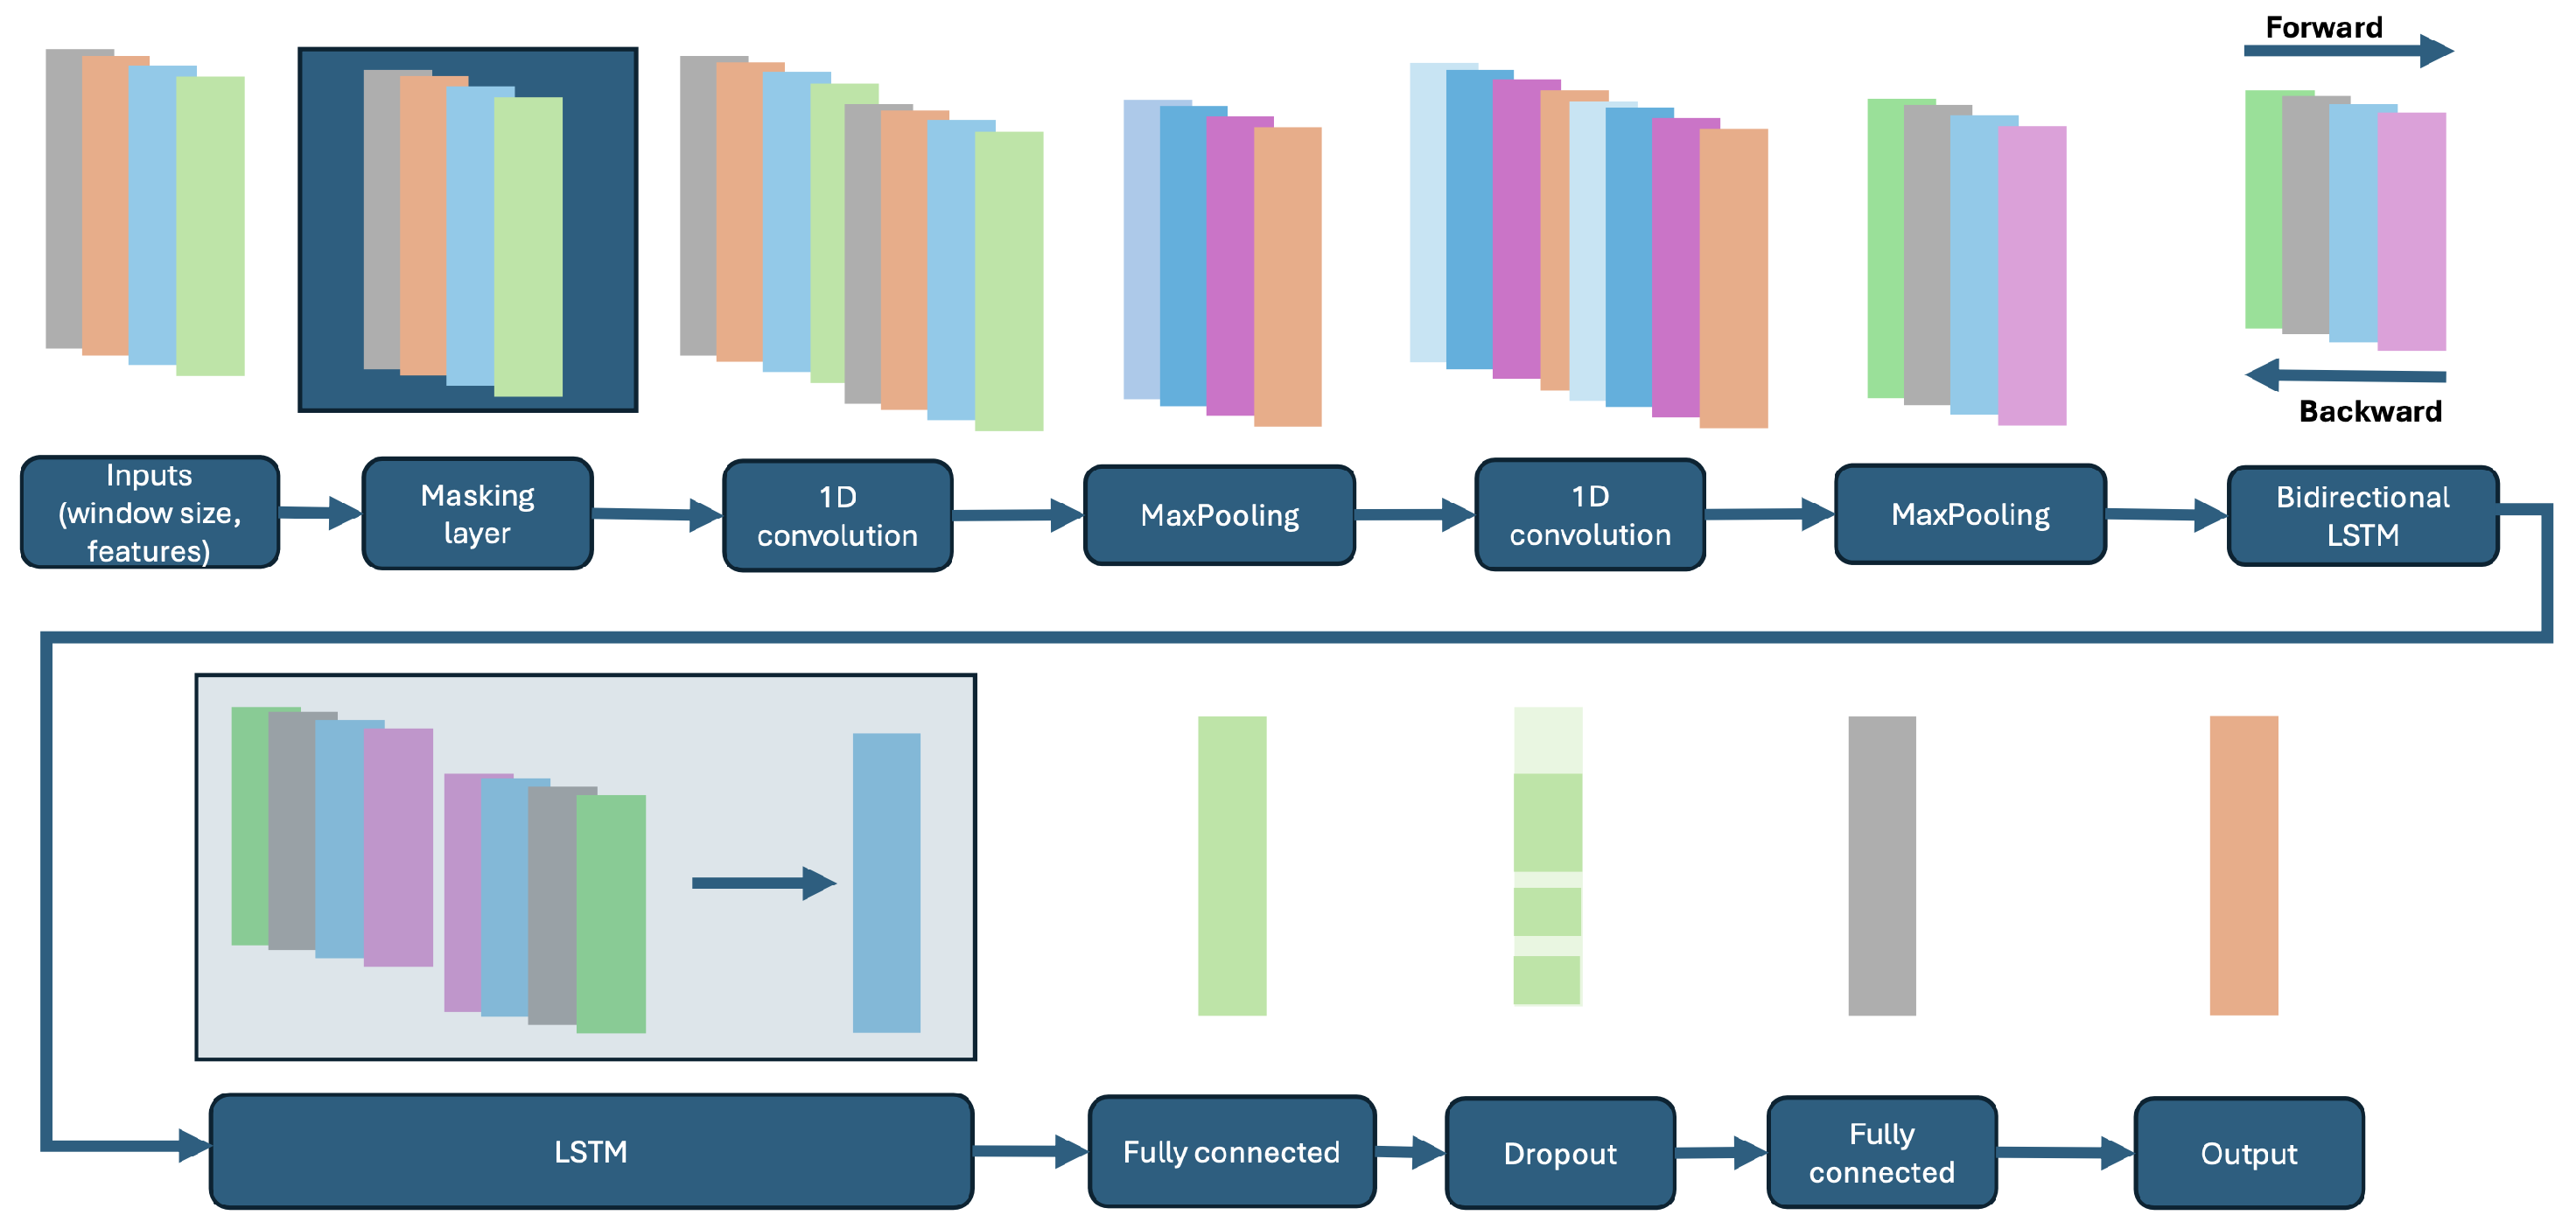
The neural network model implemented in this study consisted of a combination of convolutional layers (CNN) and long short-term memory (LSTM) layers. This hybrid architecture was designed to efficiently extract both spatial–temporal features and capture long-term dependencies within the input data, making it well suited for fall risk prediction based on sequential sensor data (Figure 4).

3.6.1. Architecture

In detail, the architecture was composed of the following layers:
  • Masking Layer: A masking layer was used to ignore padded values in the input sequences, ensuring that padding does not influence the learning process [75].
  • Convolutional Layers: Two convolutional layers (CNN) with ReLU activation functions were applied, followed by max pooling layers. These layers extracted temporal features from the input signals, enabling the network to learn spatial hierarchies and reduce the dimensionality of the data [76].
  • Bidirectional LSTM Layer: A bidirectional LSTM (Long Short-Term Memory) layer was implemented to capture temporal dependencies in both forward and backward directions. This allowed the model to preserve information from both past and future time steps, crucial for processing time-series data related to human movement [75].
  • Standard LSTM Layer: Following the bidirectional LSTM, a standard unidirectional LSTM layer with 256 units was employed to further process the temporal dependencies identified by the previous layer [75].
  • Dense Layer: A fully connected dense layer with 256 units was included to process the output of the LSTM layers, providing the model with the capacity to learn complex representations of temporal features [77].
  • Output Layer: The final output layer was a fully connected dense layer with a sigmoid activation function. This layer was responsible for binary classification, differentiating between individuals with a history of falls and those without [77].

3.6.2. Loss Function, Metrics, and Optimization

  • Loss Function: The binary cross-entropy loss function was used to optimize the model. This function is suitable for binary classification tasks, as it quantifies the difference between the predicted probability and the actual class label [78].
  • Evaluation Metric: The model was evaluated using the F1 score, which is a harmonic mean of precision and recall. This metric is especially useful in imbalanced datasets where both false positives and false negatives need to be carefully accounted for [79].
  • Optimizer: The ADAM (Adaptive Moment Estimation) optimizer was employed to update the network weights. ADAM is well-suited for deep learning models as it adapts the learning rate during training and efficiently handles sparse gradients [79].

3.6.3. Training and Callbacks

To ensure efficient training and avoid overfitting, the following callback method were utilized:
  • EarlyStopping: This callback monitors the validation loss during training and stops the process if no improvements are observed over a set number of epochs. This prevents the model from overfitting by terminating the training when further learning yields diminishing returns [80].

3.7. Data Split

The data for training and validation were divided using the Time Series Split method, a specialized cross-validation technique designed for temporal data. This method preserves the chronological order of the time series, ensuring that the model is trained and validated in a manner that reflects real-world conditions. Time Series Split is particularly advantageous when dealing with sequential data, as it prevents data leakage between training and validation sets, which could compromise the integrity of the model’s performance [81].
In this study, 9 iterations of cross-validation were performed, each with different training and validation sets. This approach allowed for a more robust evaluation of the model by assessing its performance across multiple subsets of the data. Each iteration ensured that the model was exposed to a wider variety of patterns, thus reducing the likelihood of overfitting.
For each iteration, the validation loss criterion was used to assess the model’s performance. This helped in identifying the most robust version of the model, preventing overfitting to the training data and ensuring generalizability to unseen data.

3.8. Data Analysis

In this study, we employed several key metrics to assess the performance of our deep learning model in predicting fall risk. These metrics are commonly used in classification tasks, especially in medical and biomechanical studies, to evaluate the balance between correctly and incorrectly classified instances. Below are the operational definitions of each metric:
  • Accuracy: Accuracy is the ratio of correctly predicted observations to the total observations. It is a measure of how well the model predicts both fallers and non-fallers. The formula for accuracy is
    A c c u r a c y = T P + T N T P + T N + F P + F N
    where TP represents true positives, T N true negatives, F P false positives, and F N false negatives [82].
  • Precision: Also known as positive predictive value, precision is the ratio of correctly predicted fallers (true positives) to all the instances classified as fallers (true positives and false positives). Precision is crucial when the cost of false positives is high [83]:
    P r e c i s i o n = T P T P + F P
  • Recall (Sensitivity): Recall, or sensitivity, measures the model’s ability to correctly identify all the fallers (true positives). A high recall indicates that the model successfully detects most of the actual fallers [84]:
    R e c a l l = T P T P + F N
  • Specificity: Specificity, or true negative rate, refers to the ability of the model to correctly identify non-fallers, i.e., the proportion of true negatives among all the actual non-fallers [84]:
    S p e c i f i c i t y = T N T N + F P
  • F 1 Score: The F 1 score is the harmonic mean of precision and recall, providing a single metric that balances both:
    F 1 = 2 × P r e c i s i o n × R e c a l l P r e c i s i o n + R e c a l l
    This metric is especially useful when dealing with imbalanced datasets, as it accounts for both false positives and false negatives [85].
  • Balanced Accuracy: Balanced accuracy is the average of recall and specificity. It is used to handle imbalanced datasets by considering both fallers and non-fallers equally [86]:
    B a l a n c e d A c c u r a c y = R e c a l l + S p e c i f i c i t y 2

Operational Definitions of Performance Thresholds

The classification of model performance was defined based on specific metric thresholds that indicate varying levels of effectiveness in predicting fall risk. These thresholds were categorized as follows:
Low: A metric value below 70% was considered as low, indicating that the model’s performed is suboptimal, with significant room for improvement in terms of classification or prediction accuracy. This suggests that the model may have high misclassification rates, failing to correctly identify a substantial number of cases [83].
Moderate: Metric values between 70% and 85% were classified as moderate, meaning the model performed satisfactorily, but still risked missing a significant portion of true positives or introducing false positives. Although the model functions reasonably well, there were areas where improvements could be made, especially in increasing sensitivity or specificity [84].
High: Metric values above 85% were defined as high, reflecting robust model performance with strong precision and recall. This level of accuracy indicates that the model was reliable in predicting outcomes, reducing both false positives and false negatives, and capturing complex patterns effectively [86].
These thresholds were aligned with common practices in machine learning, where higher classification performance was generally marked by values close to 1 (or 100%) across multiple metrics, while lower performance was represented by values closer to 0. This scale provided a standardized way to assess the predictive ability of models and allows for a consistent comparison across different studies [82].

3.9. Variability Measurement

In this study, variability in the model’s performance was assessed by examining the range and standard deviation of the key performance metrics, including accuracy, precision, recall, and F1-score. These metrics were calculated across multiple iterations of cross-validation using the Time Series Split method, which ensured that the model was tested on diverse subsets of the data while maintaining temporal order. This method allowed for a robust evaluation of the model’s ability to generalize across different conditions.
To further assess variability, we used standard deviation (SD) as a measure of dispersion around the mean performance for each metric. For example, variability in the model’s ability to identify fallers and non-fallers was analyzed across each Mini-BESTest task. Additionally, the model’s sensitivity to different input signals was captured by calculating the coefficient of variation (CV), providing a normalized measure of variability for each task. These measures of variability ensured that the reported results accounted for potential fluctuations in the model’s predictions due to differences in the task, participant, or signal characteristics [87,88].

4. Results

4.1. Model Training and Evaluation Process

The study methodology included two types of labels: positive, which indicated the presence of a history of falls, and negative, which indicated the absence of such a history. To obtain the results presented in Figure 5 and Table 2, we followed a two-step process, which involved training neural networks for each individual task in the Mini-BESTest, as well as a combined model that utilized data from all tasks. Training of individual models for each task: Each task in the Mini-BESTest (e.g., “Sitting to standing”, “Gait speed change”) was treated independently during the model training phase. For each task, a dedicated neural network was trained using only the sensor data corresponding to that specific gesture. This approach allowed the model to focus on identifying fall-risk patterns derived from the unique characteristics of each movement. After the training process, each task-specific model was evaluated based on several performance metrics, including precision, recall, specificity, and F1-score. The results for each task are presented in Table 2, reflecting the model’s ability to classify fallers and non-fallers based on the individual task data.
Model trained with all tasks combined: In addition to the individual models, a separate model was trained using data from all tasks combined. The sensor data for each task were aggregated into a single dataset, allowing the neural network to learn from a wider range of movement patterns. This approach aimed to capture a more comprehensive view of the subject’s balance and gait characteristics by integrating multiple functional movements into a single model. The combined model was evaluated using the same performance metrics as the individual models, and its results are presented in Table 2 under the title “All Combined”. This method provides a more holistic assessment of fall risk, potentially improving the model’s predictive power by leveraging information from multiple tasks. The primary objective of training both individual models and a combined model was to compare their performance in predicting fall risk. This comparison allowed us to evaluate whether the integration of multiple functional movements offers advantages over task-specific assessments in terms of predictive accuracy and generalization to broader contexts.

4.2. Postural Control Tasks

-
Sitting to Standing showed a moderate accuracy of 0.6503, but stood out with a high recall of 0.9610, indicating that the model was very effective in identifying positive cases (individuals with the condition being evaluated). However, the low specificity (0.2672) suggested that the model struggled to correctly identify negative cases. This could indicate that the model tended to over-predict risk.
-
Stand on Tiptoe showed perfect accuracy (1.0000) and specificity, meaning that the model had no false positives for this task. However, its recall of 0.5290 indicated that almost half of the positive cases were not correctly identified. This suggested that while the model is accurate, it struggled to detect all possible falls.
-
Left-leg and right-leg support tasks presented more homogeneous results, with balanced accuracies of 0.8278 and 0.7386, respectively. Both had a good combination of precision and recall, indicating reasonable performance in correctly identifying positive and negative cases.

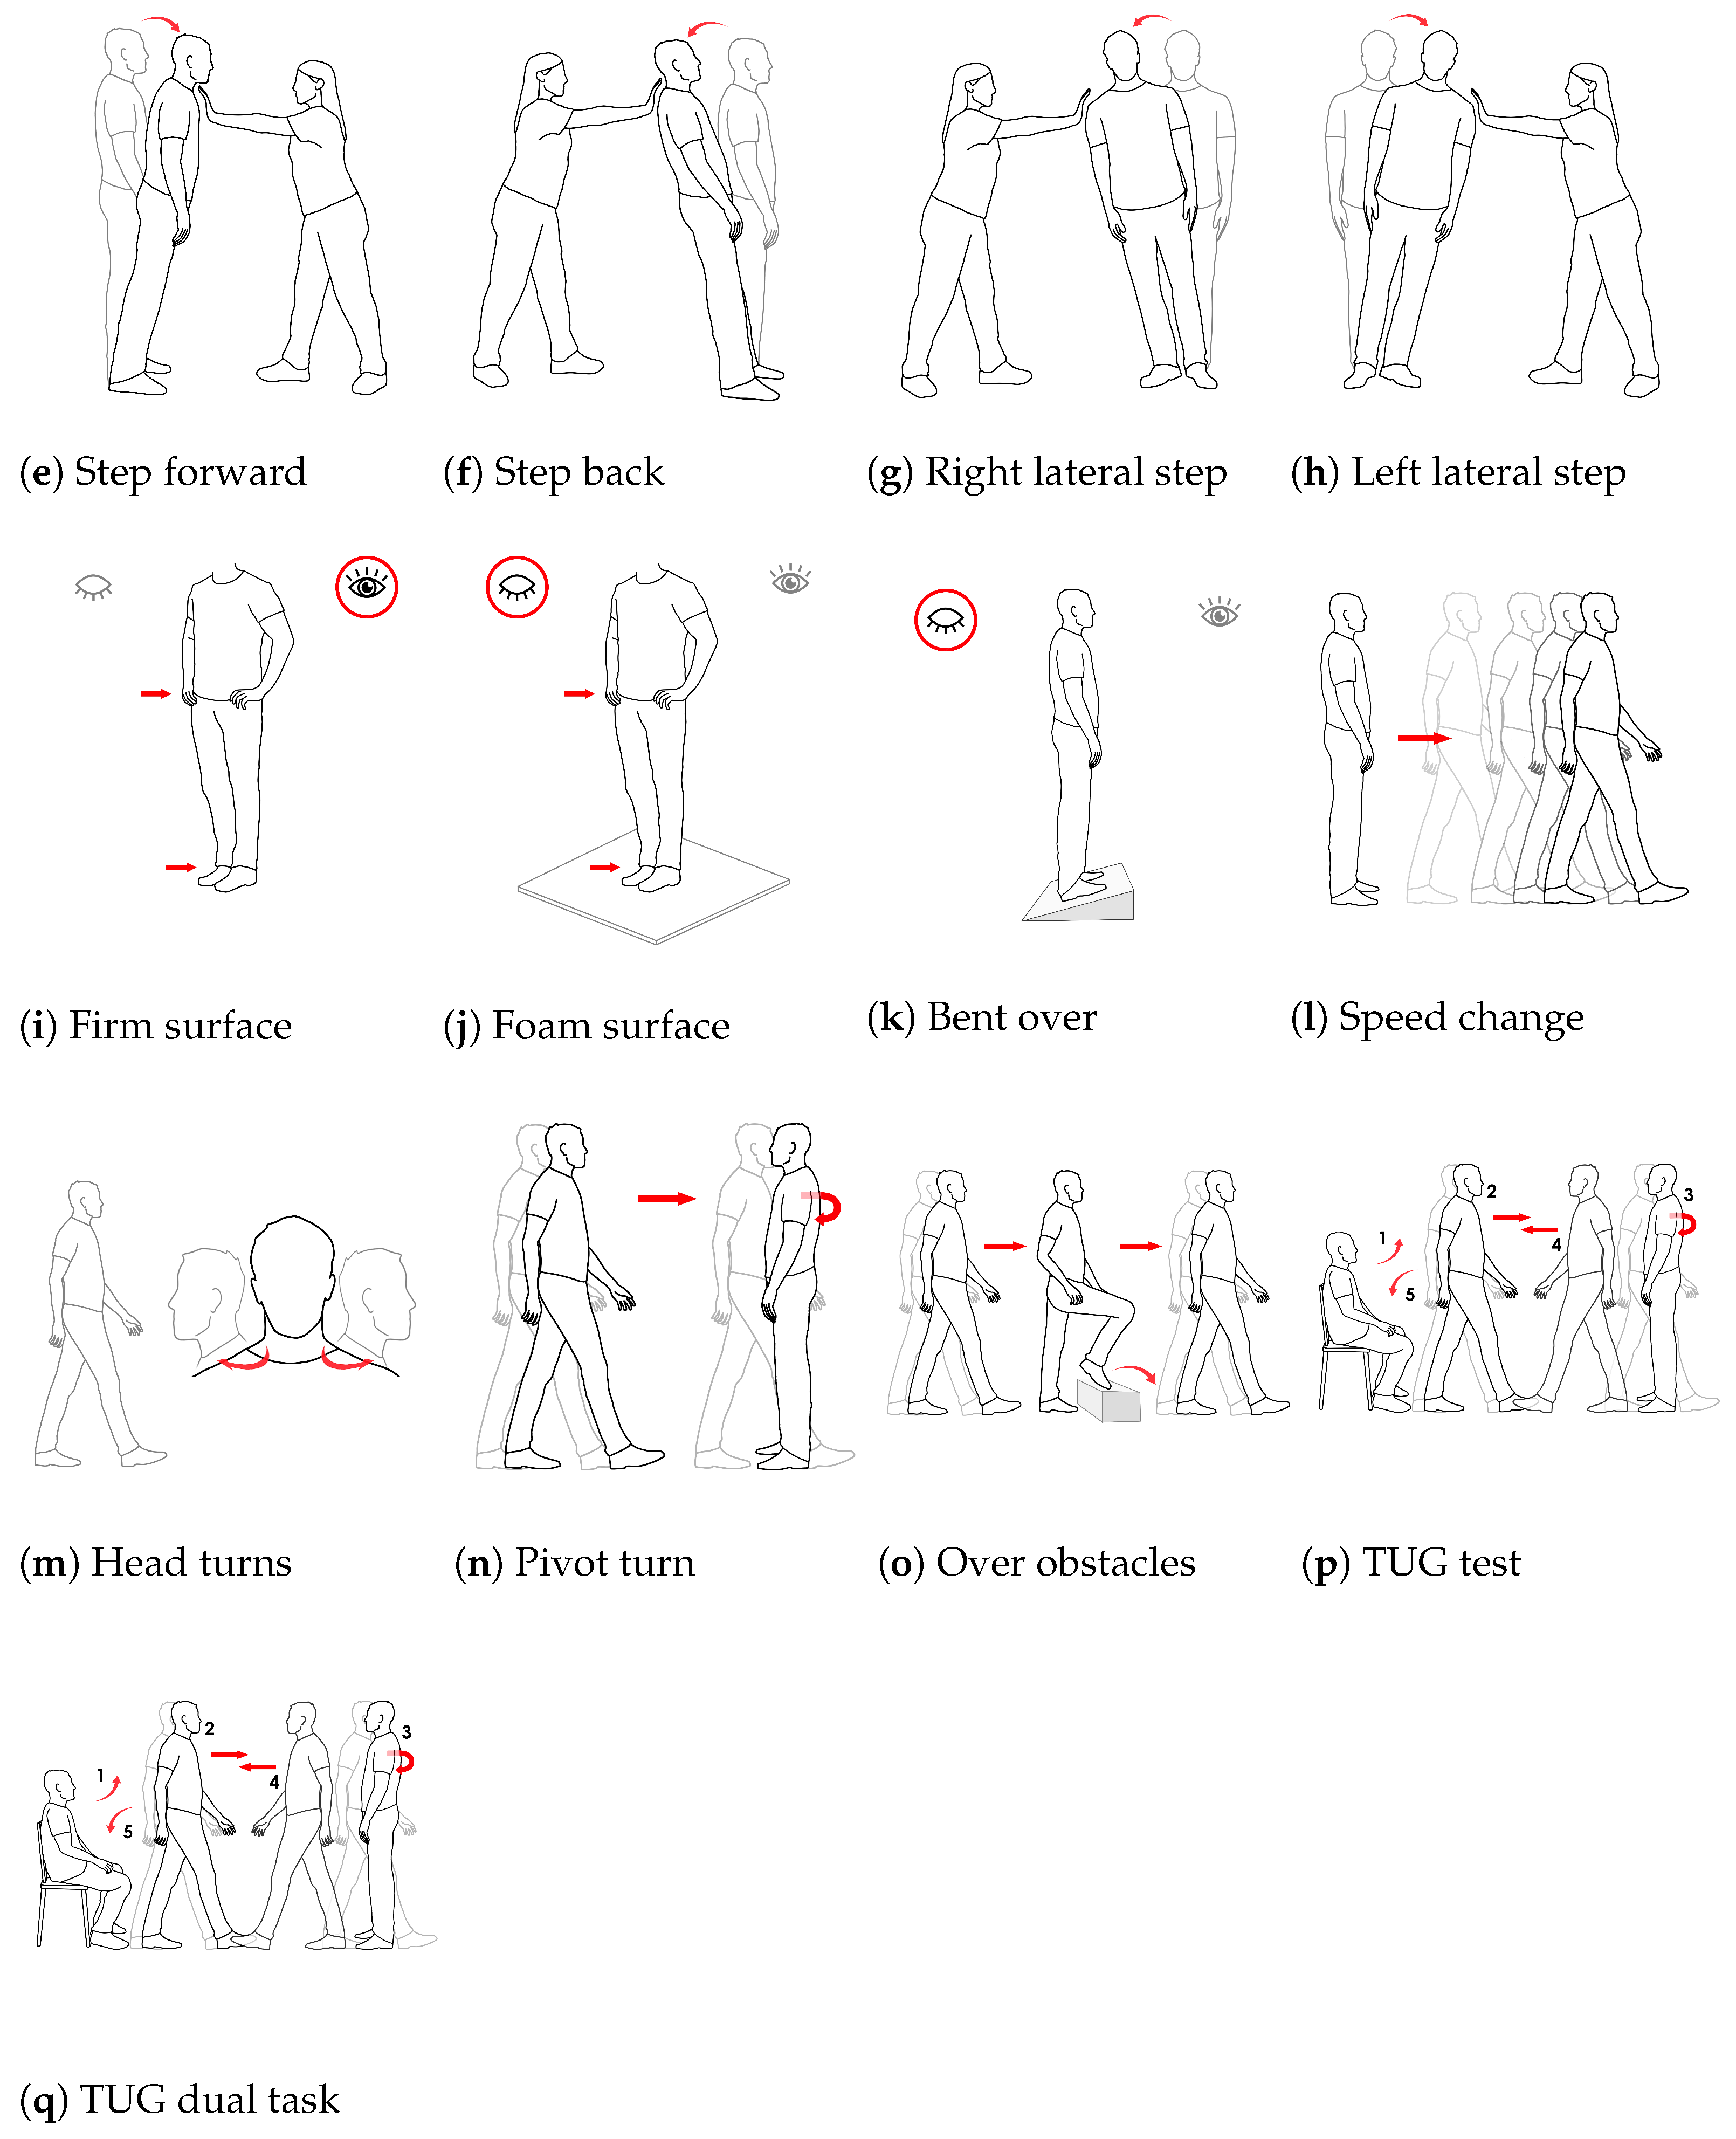
4.3. Reactive Control Tasks (Compensatory Corrections)

-
Correction with a Step Forward: The precision and recall values were close to 0.81, indicating task consistency and ability to handle both positive and negative cases well. This was reflected in a balanced precision of 0.8097.
-
Correction with a Step Back: This stood out for its high F1 score of 0.8917 and good specificity (0.9371), indicating a strong overall performance. It is one of the best tasks for predicting falls, with a solid balance between sensitivity and specificity.
-
Corrections with Left and Right Lateral Steps: This demonstrated lower balanced accuracies (0.6696 and 0.7220), which indicated that the model had difficulty correctly differentiating between positive and negative cases under these lateral corrections.

4.4. Sensory Orientation Tasks

-
Standing, Eyes Open, Firm Surface: Perfect recall (1.0000) was observed, meaning the model detected all positive cases, but its low specificity (0.3220) suggestsa high number of false positives. The model tended to be very conservative, misclassifying negative cases as positive.
-
Standing, Eyes Open, Foam Surface: This demonstrated a more balanced performance, with a balanced accuracy of 0.7816, indicating a better ability to distinguish between positive and negative cases.
-
Bent Over, Eyes Closed: This showed excellent precision (0.9986) and specificity (0.9987), meaning almost no false positives are predicted. However, the relatively low recall (0.6207) indicated that it failed to detect some positive cases, which could be concerning in fall prediction contexts.

4.5. Dynamic Gait Tasks

-
Gait Speed Change and Walking with a Pivot Turn: These exhibited strong balanced accuracies (0.8487 and 0.8729), with good values for both precision and recall. This suggested that the model performed effectively in predicting falls based on changes in gait speed and pivot turns during walking.
-
Walking Over Obstacles: This had an excellent recall of 0.9922, meaning the model detected almost all positive cases. However, lower specificity (0.6725) may result in some false positives.
-
Timed Up and Go (TUG) Test: These showed high recall (0.9670), suggesting it was effective in identifying those at risk, although a specificity of 0.5918 suggested some false positives.
-
Dual Task over Three Meters: This had the lowest balanced accuracy (0.6077), indicating that the model struggled to make accurate predictions on this task, with less effectiveness in distinguishing between positive and negative cases.

4.6. Performance Analysis with Combined Signals

When comparing the results obtained by combining all signals from the Mini-BESTest tasks to classify fallers and non-fallers with the individual task results, we observed several key differences that indicate improved model performance when aggregating all signals.
-
Accuracy: The model achieved an accuracy of 0.8855, which was higher than most of the individual tasks, except for a few tasks such as “Walking over obstacles” and “One-step back correction”, which also demonstrated high accuracy. Combining all the signals improved the model’s ability to generalize between fallers and non-fallers, resulting in better overall performance.
-
Precision: An accuracy of 0.9014 was remarkably high, which indicated that the model was very effective in correctly predicting positive cases (fallers) while minimizing false positives when all signals were used together.
-
Recall: The recall of 0.8793 was also high, suggesting that the model was effective in identifying most positive cases (fallers), which is crucial in fall prevention contexts.
-
F1 Score: With an F1 score of 0.8902, the model demonstrated a good balance between precision and recall, which is critical in classification tasks like fall risk, where both correct detection and reduction of false positives are essential.
-
Specificity: The specificity of 0.8924 indicated that the model was also very effective at correctly identifying negative cases (non-fallers), reducing the number of false positives.
-
Balanced Accuracy: With a balanced accuracy of 0.8859, the overall model performance was significantly improved compared to individual tasks. This suggested that combining all signals provided a more complete and robust assessment of fall risk by integrating various aspects of postural control, sensory orientation, and dynamic gait.

4.7. Comparison with Individual Task Results

-
Overall Improved Performance: When combining all signals, the model showed better precision, recall and F1 score metrics compared to most individual tasks. This suggested that signals from multiple tasks contributed complementarily to improving classification between fallers and non-fallers.
-
Reduced Variability in Metrics: The results for individual tasks showed more variability in metrics, with some tasks showing high precision but low recall or low specificity. By combining all signals, these discrepancies appeared to be reduced, suggesting that using all signals together provided a more balanced and stable model.
-
Higher Specificity and Recall Together: Individual tasks showed challenges with either specificity or recall in several cases. For example, “Sitting to Standing” had a high recall (0.9610) but low specificity (0.2672), while “Correction with a Step Back” had a recall of 0.8248 and excellent specificity of 0.9371. By combining all signals, the model achieved high specificity (0.8924) and recall (0.8793) simultaneously, which was a significant improvement in overall performance.
The radar chart (Figure 5) illustrates the classification performance metrics (accuracy, precision, recall, F1 score, specificity, and balanced accuracy) for each task in the Mini-BESTest, grouped by task type (Postural Control, Reactive Control, Sensory Orientation, Dynamic Gait, and All Combined). Tasks within each group share a common color, with different line styles distinguishing individual tasks. The radial axis represents the performance of each task across the six metrics, allowing for a clear comparison of their effectiveness in distinguishing fallers from non-fallers.

5. Discussion

Falls among older adults are a significant public health concern, contributing to high rates of morbidity and mortality in this population. The early identification of individuals at risk of falls is crucial to implementing preventative strategies and reducing the incidence of falls. However, traditional fall risk assessments, though widely used in clinical settings, often lack precision in predicting future falls, particularly when it comes to capturing complex postural adjustments and movement patterns. The primary purpose of this study was to evaluate the effectiveness of using deep learning models in conjunction with inertial sensor data from smartphone-based assessments to improve the accuracy of fall risk prediction. By leveraging the Mini-BESTest functional tasks, we aimed to determine which specific tasks or combined signals are most effective in identifying fall risk among older adults.
The findings suggest that the deep learning models performed effectively in tasks such as forward and backward step corrections and gait speed changes, demonstrating high accuracy in detecting fall risk (refer to Table 2 and Figure 5 in the Results section). However, sensory orientation and dual-task gait posed greater challenges, with lower specificity indicating a higher incidence of false positives (see Section 4.4 and Section 4.5 for detailed metrics). This demonstrates that while some tasks are highly predictive of fall risk, others may require further refinement of the model to improve discriminatory power.
On the other hand, the analysis of the combined signals from all Mini-BESTest tasks demonstrated a more robust and balanced performance compared to evaluating each task individually; see Table 2 and Figure 5). Specifically, the model achieved notable improvements in accuracy (88.55%), precision (90.14%), and F1 score (89.02%) when incorporating data from multiple functional tasks. These metrics improved significantly by leveraging a broader range of movement data, enhancing the model’s ability to correctly classify both fallers and non-fallers. The integration of diverse data sources, such as acceleration, angular velocity, and magnetic signals, allowed the model to provide a more comprehensive view of fall risk. This finding underscores the value of fusing signals from different measurement domains to achieve more accurate and reliable predictions.
Furthermore, the use of multiple data sources enabled the model to capture the complexities of postural control, gait, and other factors influencing fall risk more deeply. By integrating information from various tasks, the model could identify subtle patterns that might otherwise be overlooked in individual task evaluations. This suggests that approaches based on signal combination have the potential to offer more holistic and accurate assessments compared to models that analyze a single task or metric.
In comparison to traditional fall risk prediction approaches such as logistic regression, decision trees, and random forests, the proposed deep learning model offers significant advantages in capturing complex movement patterns. For instance, previous studies have shown that logistic regression models achieve an average accuracy of 70–75% in fall risk prediction [55], while decision trees and random forests typically have accuracies in the range of 75–80% [56]. However, these traditional approaches tend to rely on pre-selected variables and show limitations in their ability to capture temporal and non-linear dependencies.
In contrast, the use of convolutional neural networks (CNNs) and long short-term memory (LSTM) models allows for automatic feature extraction and a richer representation of temporal sequences, resulting in significant improvements in predictive performance. In this study, the CNN-LSTM model achieved an accuracy of 88.55%, with an F1 score of 89.02%, outperforming methods that focus solely on individual tasks from the Mini-BESTest. Additionally, while approaches such as support vector machines (SVMs) and k-nearest neighbors (k-NNs) have demonstrated accuracies close to 80% [89], they are less effective at handling the temporal variability of fall risk data compared to LSTM models, which are capable of capturing long-term dependencies in time series data.
Despite the promising results, this study has some limitations that should be considered. First, the accuracy of the model may be affected by variability in the placement of the mobile device on patients, as improper sensor positioning could distort the measurement of movement patterns. Second, the sample used in the study may not fully represent the heterogeneity of the older adult population, which could limit the generalizability of the results to other populations with different physical characteristics or health conditions. Additionally, the study was conducted in a controlled environment, which does not fully reflect real-life conditions, where environmental and behavioral factors could influence fall risk. Lastly, although the deep learning model demonstrated good performance, its “black box” nature makes it difficult for healthcare professionals to directly interpret the results, potentially limiting its clinical applicability without additional mechanisms to explain the model’s decisions.

6. Conclusions

This study proposed a new low-cost methodology for identifying movement pattern anomalies and fall risk in the older adult population, with the potential for impact on various scales. The primary impact is observed in preventive medicine, where this technology enables continuous and timely monitoring of older adults, facilitating early interventions that could significantly reduce the adverse effects associated with falls, and consequently, decrease morbidity and mortality.
Moreover, the use of deep learning algorithms in this context has proven may be crucial for enhancing the accuracy of fall risk classification. Deep neural networks allow for the processing of large volumes of complex data, identifying patterns that traditional methods cannot capture, resulting in greater sensitivity and specificity. The combination of multiple signals along with deep learning’s ability to capture temporal dependencies in the data has significantly optimized the model’s performance.
This methodology also enables the precise evaluation of the effectiveness of therapeutic interventions targeted at each individual, benefiting both patients by personalizing more effective therapeutic strategies, and healthcare systems. Health administrations will be able to manage human and financial resources more efficiently by focusing on individuals who truly require attention, contributing to the reduction of costs associated with unnecessary curative treatments.
While the results suggest that the deep learning approach may enhance the prediction of fall risk, particularly when multiple signals are combined, it is important to recognize that one study cannot confirm clinical applicability. Multiple studies with similar methodologies are required to replicate these findings before the approach can be considered for clinical trials or large-scale applications. Therefore, we suggest that this approach may enable improved fall risk monitoring in clinical settings, but further research, including real-world trials, is essential to establish its validity and efficacy.

Author Contributions

D.R.C., S.P.Q., A.L.B., D.Q.F., M.R.H. and C.T.T. conceptualization, writing—original draft preparation, visualization, methodology and software. All authors have read and agreed to the published version of the manuscript.

Funding

This research received no external funding.

Institutional Review Board Statement

This study was conducted in accordance with the Declaration of Helsinki. The research was approved by the Scientific Ethics Evaluation Committee of the Universidad Central de Chile; see registration number 115-2018.

Informed Consent Statement

Each Written informed consent has been obtained from the patient(s) to publish this paper.

Data Availability Statement

The data presented in this study are available on request from the corresponding author (the data are not publicly available due to privacy restrictions).

Conflicts of Interest

The authors declare no conflicts of interest.

Abbreviations

The following abbreviations are used in this manuscript:
EPElderly People
CoMCenter of Mass
LSTMLong Short-Term Memory
CNNConvolutional Layers
Bidir-LSTMBidirectional Residual Deep Short-Term Memory
BiLSTMBidirectional Long Short-Term Memory Network
HARHuman Activity Recognition

References

  1. Ganz, D.; Latham, N. Prevention of falls in community-dwelling older adults. N. Engl. J. Med. 2020, 382, 734–743. [Google Scholar] [CrossRef] [PubMed]
  2. James, S.; Lucchesi, L.; Bisignano, C.; Castle, C.; Dingels, Z.; Fox, J.; Hamilton, E.; Henry, N.; Krohn, K.; Liu, Z.; et al. The global burden of falls: Global, regional and national estimates of morbidity and mortality from the Global Burden of Disease Study 2017. Inj. Prev. 2020, 26, i3–i11. [Google Scholar] [CrossRef] [PubMed]
  3. Montero-Odasso, M.; Van Der Velde, N.; Martin, F.; Petrovic, M.; Tan, M.; Ryg, J.; Aguilar-Navarro, S.; Alexander, N.; Becker, C.; Blain, H.; et al. World guidelines for falls prevention and management for older adults: A global initiative. Age Ageing 2022, 51, afac205. [Google Scholar] [CrossRef] [PubMed]
  4. Salari, N.; Darvishi, N.; Ahmadipanah, M.; Shohaimi, S.; Mohammadi, M. Global prevalence of falls in the older adults: A comprehensive systematic review and meta-analysis. J. Orthop. Surg. Res. 2022, 17, 334. [Google Scholar] [CrossRef]
  5. Plaut, P.; Shach-Pinsly, D.; Schreuer, N.; Kizony, R. The reflection of the fear of falls and risk of falling in walking activity spaces of older adults in various urban environments. J. Transp. Geogr. 2021, 95, 103152. [Google Scholar] [CrossRef]
  6. Reider, L.; Falvey, J.; Okoye, S.; Wolff, J.; Levy, J. Cost of US emergency department and inpatient visits for fall injuries in older adults. Injury 2024, 55, 111199. [Google Scholar] [CrossRef]
  7. Wu, J.; Mu, Z.; Jiang, S.; Miao, Y.; Tang, Y.; Wang, J.; Wang, S.; Zhao, Y. Trends in all-cause mortality and leading causes of death from 2009 to 2019 among older adults in China. BMC Geriatr. 2023, 23, 645. [Google Scholar] [CrossRef]
  8. World Health Organization. Step Safely: Strategies for Preventing and Managing Falls Across the Life-Course; World Health Organization: Geneva, Switzerland, 2021. [Google Scholar]
  9. Bouvard, B.; Annweiler, C.; Legr, E. Osteoporosis in older adults. Jt. Bone Spine 2021, 88, 105135. [Google Scholar] [CrossRef]
  10. Meng, S.; Tong, M.; Yu, Y.; Cao, Y.; Tang, B.; Shi, X.; Liu, K. The prevalence of osteoporotic fractures in the elderly in China: A systematic review and meta-analysis. J. Orthop. Surg. Res. 2023, 18, 536. [Google Scholar] [CrossRef]
  11. Rath, R.; Wade, M. The two faces of postural control in older adults: Stability and function. EBioMedicine 2017, 21, 5–6. [Google Scholar] [CrossRef]
  12. Kanekar, N.; Aruin, A. Aging and balance control in response to external perturbations: Role of anticipatory and compensatory postural mechanisms. Age 2014, 36, 1067–1077. [Google Scholar] [CrossRef] [PubMed]
  13. Martinikorena, I.; Martínez-Ramírez, A.; Gómez, M.; Lecumberri, P.; Casas-Herrero, A.; Cadore, E.L.; Millor, N.; Zambom-Ferraresi, F.; Idoate, F.; Izquierdo, M. Gait variability related to muscle quality and muscle power output in frail nonagenarian older adults. J. Am. Med. Dir. Assoc. 2016, 17, 162–167. [Google Scholar] [CrossRef]
  14. Michalska, J.; Kamieniarz, A.; Sobota, G.; Stania, M.; Juras, G.; Słomka, K. Age-related changes in postural control in older women: Transitional tasks in step initiation. BMC Geriatr. 2021, 21, 17. [Google Scholar] [CrossRef] [PubMed]
  15. Van Humbeeck, N.; Kliegl, R.; Krampe, R. Lifespan changes in postural control. Sci. Rep. 2023, 13, 541. [Google Scholar] [CrossRef] [PubMed]
  16. Wleklik, M.; Uchmanowicz, I.; Jankowska, E.; Vitale, C.; Lisiak, M.; Drozd, M.; Pobrotyn, P.; Tkaczyszyn, M.; Lee, C. Multidimensional approach to frailty. Front. Psychol. 2020, 11, 564. [Google Scholar] [CrossRef]
  17. Fried, L.; Cohen, A.; Xue, Q.; Walston, J.; Bandeen-Roche, K.; Varadhan, R. The physical frailty syndrome as a transition from homeostatic symphony to cacophony. Nat. Aging 2021, 1, 36–46. [Google Scholar] [CrossRef]
  18. Dlima, S.; Hall, A.; Aminu, A.; Akpan, A.; Todd, C.; Vardy, E. Frailty: A global health challenge in need of local action. BMJ Glob. Health 2024, 9, e015173. [Google Scholar] [CrossRef]
  19. Guo, X.; Pei, J.; Ma, Y.; Cui, Y.; Guo, J.; Wei, Y.; Han, L. Cognitive frailty as a predictor of future falls in older adults: A systematic review and meta-analysis. J. Am. Med. Dir. Assoc. 2023, 24, 38–47. [Google Scholar] [CrossRef]
  20. Porta, M. A Dictionary of Epidemiology; Oxford University Press: Oxford, UK, 2014. [Google Scholar]
  21. Ríos-Fraustro, C.; Galván-Plata, M.E.; Gómez-Galicia, D.L.; Giraldo-Rodríguez, L.; Agudelo-Botero, M.; Mino-León, D. Intrinsic and extrinsic factors associated with falls in older adults: A case-control study in Mexico. Gac Med Mex. 2021, 157, 127–132. [Google Scholar] [CrossRef]
  22. Nugraha, S.; Sabarinah, S.; Susilowati, I.; Rahardjo, T. Intrinsic and extrinsic risk factor for fall among community dwelling Indonesian elderly. Open Access Maced. J. Med. Sci. 2022, 10, 619–624. [Google Scholar] [CrossRef]
  23. Ambrose, A.; Paul, G.; Hausdorff, J. Risk factors for falls among older adults: A review of the literature. Maturitas 2013, 75, 51–61. [Google Scholar] [CrossRef] [PubMed]
  24. Yingyongyudha, A.; Saengsirisuwan, V.; Panichaporn, W.; Boonsinsukh, R. The Mini-Balance Evaluation Systems Test (Mini-BESTest) demonstrates higher accuracy in identifying older adult participants with history of falls than do the BESTest, Berg Balance Scale, or Timed Up and Go Test. J. Geriatr. Phys. Ther. 2016, 39, 64–70. [Google Scholar] [CrossRef]
  25. Magnani, P.; Genovez, M.; Porto, J.; Zanellato, N.; Alvarenga, I.; Freire, R., Jr.; Abreu, D. Use of the BESTest and the Mini-BESTest for fall risk prediction in community-dwelling older adults between 60 and 102 years of age. J. Geriatr. Phys. Ther. 2020, 43, 179–184. [Google Scholar] [CrossRef] [PubMed]
  26. Weinstein, M.; Booth, J. Preventing falls in older adults: A multifactorial approach. Home Health Care Manag. Pract. 2006, 19, 45–50. [Google Scholar] [CrossRef]
  27. Kim, T.; Park, J.; Heo, S.; Sung, K.; Park, J. Characterizing dynamic walking patterns and detecting falls with wearable sensors using Gaussian process methods. Sensors 2017, 17, 1172. [Google Scholar] [CrossRef] [PubMed]
  28. Kim, T.; Xiong, S. Comparison of seven fall risk assessment tools in community-dwelling Korean older women. Ergonomics 2017, 60, 421–429. [Google Scholar] [CrossRef]
  29. Park, S. Tools for assessing fall risk in the elderly: A systematic review and meta-analysis. Aging Clin. Exp. Res. 2018, 30, 1–16. [Google Scholar] [CrossRef]
  30. Tinetti, M.; Williams, T.; Mayewski, R. Fall risk index for elderly patients based on number of chronic disabilities. Am. J. Med. 1986, 80, 429–434. [Google Scholar] [CrossRef]
  31. Berg, K. Balance and its measure in the elderly: A review. Physiother. Can. 1989, 41, 240–246. [Google Scholar] [CrossRef]
  32. Whitney, S.; Hudak, M.; Marchetti, G. The dynamic gait index relates to self-reported fall history in individuals with vestibular dysfunction. J. Vestib. Res. 2000, 10, 99–105. [Google Scholar] [CrossRef]
  33. Horak, F.B. Postural orientation and equilibrium: What do we need to know about neural control of balance to prevent falls? Age Ageing 2006, 35 (Suppl. S2), ii7–ii11. [Google Scholar] [CrossRef] [PubMed]
  34. Bet, P.; Castro, P.; Ponti, M. Fall detection and fall risk assessment in older person using wearable sensors: A systematic review. Int. J. Med. Inform. 2019, 130, 103946. [Google Scholar]
  35. Wang, K.; Delbaere, K.; Brodie, M.; Lovell, N.; Kark, L.; Lord, S.; Redmond, S. Differences between gait on stairs and flat surfaces in relation to fall risk and future falls. IEEE J. Biomed. Health Inform. 2017, 21, 1479–1486. [Google Scholar] [CrossRef]
  36. Najafi, B.; Aminian, K.; Loew, F.; Blanc, Y.; Robert, P. Measurement of stand-sit and sit-stand transitions using a miniature gyroscope and its application in fall risk evaluation in the elderly. IEEE Trans. Biomed. Eng. 2002, 49, 843–851. [Google Scholar] [CrossRef] [PubMed]
  37. Di Rosa, M.; Hausdorff, J.; Stara, V.; Rossi, L.; Glynn, L.; Casey, M.; Burkard, S.; Cherubini, A. Concurrent validation of an index to estimate fall risk in community dwelling seniors through a wireless sensor insole system: A pilot study. Gait Posture 2017, 55, 6–11. [Google Scholar] [CrossRef]
  38. Nait Aicha, A.; Englebienne, G.; Van Schooten, K.; Pijnappels, M.; Kröse, B. Deep learning to predict falls in older adults based on daily-life trunk accelerometry. Sensors 2018, 18, 1654. [Google Scholar] [CrossRef] [PubMed]
  39. Drover, D.; Howcroft, J.; Kofman, J.; Lemaire, E. Faller classification in older adults using wearable sensors based on turn and straight-walking accelerometer-based features. Sensors 2017, 17, 1321. [Google Scholar] [CrossRef]
  40. Hua, A.; Quicksall, Z.; Di, C.; Motl, R.; LaCroix, A.; Schatz, B.; Buchner, D. Accelerometer-based predictive models of fall risk in older women: A pilot study. NPJ Digit. Med. 2018, 1, 1–8. [Google Scholar]
  41. Sun, R.; Sosnoff, J. Novel sensing technology in fall risk assessment in older adults: A systematic review. BMC Geriatr. 2018, 18, 1–10. [Google Scholar]
  42. Howcroft, J.; Kofman, J.; Lemaire, E. Prospective fall-risk prediction models for older adults based on wearable sensors. IEEE Trans. Neural Syst. Rehabil. Eng. 2017, 25, 1812–1820. [Google Scholar] [CrossRef]
  43. Greene, B.; McGrath, D.; Walsh, L.; Doheny, E.; McKeown, D.; Garattini, C.; Cunningham, C.; Crosby, L.; Caulfield, B.; Kenny, R. Quantitative falls risk estimation through multi-sensor assessment of standing balance. Physiol. Meas. 2012, 33, 2049. [Google Scholar] [CrossRef] [PubMed]
  44. Senden, R.; Savelberg, H.; Grimm, B.; Heyligers, I.; Meijer, K. Accelerometry-based gait analysis, an additional objective approach to screen subjects at risk for falling. Gait Posture 2012, 36, 296–300. [Google Scholar] [CrossRef] [PubMed]
  45. Doi, T.; Hirata, S.; Ono, R.; Tsutsumimoto, K.; Misu, S.; Ando, H. The harmonic ratio of trunk acceleration predicts falling among older people: Results of a 1-year prospective study. J. Neuroeng. Rehabil. 2013, 10, 7. [Google Scholar] [CrossRef]
  46. Farshchiansadegh, A.; Others Engineering in Medicine and Biology Society (EMBC). A body machine interface based on inertial sensors. In Proceedings of the 2014 36th Annual International Conference of the IEEE, Chicago, IL, USA, 26–30 August 2014. [Google Scholar]
  47. Kargar, B.; Mollahosseini, A.; Struemph, T.; Pace, W.; Nielsen, R.; Mahoor, M. Automatic measurement of physical mobility in get-up-and-go test using kinect sensor. In Proceedings of the 2014 36th Annual International Conference of The IEEE Engineering In Medicine And Biology Society, Chicago, IL, USA, 26–30 August 2014; pp. 3492–3495. [Google Scholar]
  48. Yamada, M.; Aoyama, T.; Nakamura, M.; Tanaka, B.; Nagai, K.; Tatematsu, N.; Uemura, K.; Nakamura, T.; Tsuboyama, T.; Ichihashi, N. The reliability and preliminary validity of game-based fall risk assessment in community-dwelling older adults. Geriatr. Nurs. 2011, 32, 188–194. [Google Scholar] [CrossRef] [PubMed]
  49. Kwok, B.; Clark, R.; Pua, Y. Novel use of the Wii Balance Board to prospectively predict falls in community-dwelling older adults. Clin. Biomech. 2015, 30, 481–484. [Google Scholar] [CrossRef]
  50. Nishiguchi, S.; Yamada, M.; Uemura, K.; Matsumura, T.; Takahashi, M.; Moriguchi, T.; Aoyama, T. A novel infrared laser device that measures multilateral parameters of stepping performance for assessment of all risk in elderly individuals. Aging Clin. Exp. Res. 2013, 25, 311–316. [Google Scholar] [CrossRef]
  51. Poggio, T.; Girosi, F. Networks for approximation and learning. Proc. IEEE 1990, 78, 1481–1497. [Google Scholar] [CrossRef]
  52. Cortes, C.; Vapnik, V. Support-vector networks. Mach. Learn. 1995, 20, 273–297. [Google Scholar] [CrossRef]
  53. Makino, K.; Lee, S.; Bae, S.; Chiba, I.; Harada, K.; Katayama, O.; Tomida, K.; Morikawa, M.; Shimada, H. Simplified Decision-Tree Algorithm to Predict Falls for Community-Dwelling Older Adults. J. Clin. Med. 2021, 10, 5184. [Google Scholar] [CrossRef]
  54. Chen, M.; Wang, H.; Yu, L.; Yeung, E.H.K.; Luo, J.; Tsui, K.-L.; Zhao, Y. A Systematic Review of Wearable Sensor-Based Technologies for Fall Risk Assessment in Older Adults. Sensors 2022, 22, 6752. [Google Scholar] [CrossRef]
  55. Shany, T.; Redmond, S.J.; Narayanan, M.R.; Lovell, N.H. Toward the development of a falls risk prediction system using wearable sensors: A systematic review. J. Biomed. Health Inform. 2015, 19, 1216–1227. [Google Scholar]
  56. Islam, M.M.; Tayan, O.; Islam, M.R.; Islam, M.S.; Nooruddin, S.; Kabir, M.N.; Islam, M.R. Deep Learning-Based Systems Developed for Fall Detection: A Review. IEEE Access 2020, 8, 166117–166137. [Google Scholar] [CrossRef]
  57. Hannink, J.; Kautz, T.; Pasluosta, C.F.; Gaßner, H.; Klucken, J.; Eskofier, B.M. Sensor-based gait parameter extraction with deep convolutional neural networks. IEEE J. Biomed. Health Inform. 2017, 21, 85–93. [Google Scholar] [CrossRef]
  58. Savadkoohi, M.; Oladunni, T.; Thompson, L.A. Deep Neural Networks for Human’s Fall-risk Prediction using Force-Plate Time Series Signal. Expert Syst. Appl. 2021, 182, 115220. [Google Scholar] [CrossRef] [PubMed]
  59. Chen, C.; Pan, X. Deep Learning for Inertial Positioning: A Survey. IEEE Trans. Intell. Transp. Syst. 2023, 25, 10506–10523. [Google Scholar] [CrossRef]
  60. Li, Y.; Wang, L. Human Activity Recognition Based on Residual Network and BiLSTM. Sensors 2022, 22, 635. [Google Scholar] [CrossRef]
  61. Zhao, Y.; Yang, R.; Chevalier, G.; Xu, X.; Zhang, Z. Deep Residual Bidir-LSTM for Human Activity Recognition Using Wearable Sensors. Math. Probl. Eng. 2018, 2018, 7316954. [Google Scholar] [CrossRef]
  62. Lee, P.; Chen, T.-B.; Wang, C.-Y.; Hsu, S.-Y.; Liu, C.-H. Detection of Postural Control in Young and Elderly Adults Using Deep and Machine Learning Methods with Joint–Node Plots. Sensors 2021, 21, 3212. [Google Scholar] [CrossRef]
  63. Meyer, B.M.; Tulipani, L.J.; Gurchiek, R.D.; Allen, D.A.; Adamowicz, L.; Larie, D.; Solomon, A.J.; Cheney, N.; McGinnis, R.S. Wearables and Deep Learning Classify Fall Risk From Gait in Multiple Sclerosis. IEEE Trans. Inf. Technol. Biomed. 2021, 25, 1824–1831. [Google Scholar] [CrossRef]
  64. Tunca, C.; Salur, G.; Ersoy, C. Deep Learning for Fall Risk Assessment with Inertial Sensors: Utilizing Domain Knowledge in Spatio-Temporal Gait Parameters. IEEE J. Biomed. Health Inform. 2020, 24, 1994–2005. [Google Scholar] [CrossRef]
  65. Kiprijanovska, I.; Dimitrova, G.; Kiprovski, T. Predictive models for time-series forecasting: Case study for production planning. In Proceedings of the 2020 43rd International Convention on Information, Communication and Electronic Technology (MIPRO), Opatija, Croatia, 28 September–2 October 2020; pp. 1098–1103. [Google Scholar] [CrossRef]
  66. Yıldız, A. Towards Environment-Aware Fall Risk Assessment: Classifying Walking Surface Conditions Using IMU-Based Gait Data and Deep Learning. Brain Sci. 2023, 13, 1428. [Google Scholar] [CrossRef] [PubMed]
  67. Cubuk, E.D.; Zoph, B.; Shlens, J.; Le, Q.V. AutoAugment: Learning Augmentation Policies from Data. In Proceedings of the IEEE/CVF Conference on Computer Vision and Pattern Recognition (CVPR), Long Beach, CA, USA, 15–20 June 2019. [Google Scholar]
  68. Wen, Q.; Sun, L.; Yang, F.; Song, X.; Gao, J.; Wang, X.; Xu, H. Time Series Data Augmentation for Deep Learning: A Survey. arXiv 2020, arXiv:2002.12478. [Google Scholar]
  69. Casolaro, A.; Capone, V.; Iannuzzo, G.; Camastra, F. Deep Learning for Time Series Forecasting: Advances and Open Problems. Information 2023, 14, 598. [Google Scholar] [CrossRef]
  70. Chandrasekaran, V.; Goeckner, D.; Wang, J.; Mayeux, R. Inertial Sensors for Smartphones: Capabilities and Accuracy. Sensors 2020, 20, 1650. [Google Scholar] [CrossRef]
  71. Oshin, S.; Wixted, J.; Burchell, B.; Hale, J.; Vaughan, N. Accuracy of Accelerometer and Gyroscope in Smartphones: Evaluation and Sensor Fusion. J. Mob. Technol. Med. 2014, 3, 28–34. [Google Scholar] [CrossRef]
  72. Del Rosario, M.B.; Redmond, S.J.; Lovell, N.H. Tracking the evolution of smartphone sensing for monitoring human movement. Sensors 2015, 15, 18901–18933. [Google Scholar] [CrossRef]
  73. Caruso, M.; Mariani, B. Smartphone-based accelerometers for gait analysis: A validation study with older adults. Gait Posture 2020, 81, 127–133. [Google Scholar] [CrossRef]
  74. Horak, F.B.; Wrisley, D.M.; Frank, J. The Balance Evaluation Systems Test (BESTest) to differentiate balance deficits. Phys. Ther. 2009, 89, 484–498. [Google Scholar]
  75. Ullah, A.; Ahmad, J.; Muhammad, K.; Sajjad, M.; Baik, S.W. Action recognition in video sequences using deep bi-directional LSTM with CNN features. IEEE Access 2017, 6, 1155–1166. [Google Scholar] [CrossRef]
  76. Muhammad, K.; Hussain, T.; Tanveer, M.; Sannino, G.; de Albuquerque, V.H.C. Cost-effective video summarization using deep CNN with hierarchical weighted fusion for IoT surveillance networks. IEEE Internet Things J. 2020, 7, 4455–4463. [Google Scholar] [CrossRef]
  77. Sun, W.; Qin, N.; Huang, D.; Liu, Z.; Ni, S. QN-S3VM method for evaluation of liver functional reserve. In 2020 Chinese Automation Congress (CAC); IEEE: Shanghai, China, 2020; pp. 5629–5634. [Google Scholar]
  78. DataCamp. Cross-Entropy Loss Function in Machine Learning: Enhancing Model Accuracy. 2023. Available online: https://www.datacamp.com (accessed on 15 September 2023).
  79. Analytics Vidhya. Binary Cross Entropy/Log Loss for Binary Classification. Analytics Vidhya. 2024. Available online: https://www.analyticsvidhya.com (accessed on 15 September 2023).
  80. Brownlee, J. How to Stop Training Deep Neural Networks at the Right Time Using Early Stopping. Machine Learning Mastery, 2019. Available online: https://machinelearningmastery.com/early-stopping-to-avoid-overtraining-neural-network-models/ (accessed on 15 September 2023).
  81. Cerqueira, V.; Torgo, L.; Mozetic, I. Evaluating time series forecasting models: An empirical study on performance estimation methods. Mach. Learn. 2020, 109, 1997–2028. [Google Scholar] [CrossRef]
  82. Baldi, P.; Brunak, S.; Chauvin, Y.; Andersen, C.A.; Nielsen, H. Assessing the accuracy of prediction algorithms for classification: An overview. Bioinformatics 2000, 16, 412–424. [Google Scholar] [CrossRef] [PubMed]
  83. Sokolova, M.; Lapalme, G. A systematic analysis of performance measures for classification tasks. Inf. Process. Manag. 2009, 45, 427–437. [Google Scholar] [CrossRef]
  84. Powers, D.M. Evaluation: From precision, recall and F-measure to ROC, informedness, markedness and correlation. J. Mach. Learn. Technol. 2011, 2, 37–63. [Google Scholar]
  85. Sasaki, Y. The Truth of the F-Measure; University of Manchester: Manchester, UK, 2007; Volume 1, pp. 1–5. [Google Scholar]
  86. Brodersen, K.H.; Ong, C.S.; Stephan, K.E.; Buhmann, J.M. The balanced accuracy and its posterior distribution. In Proceedings of the 2010 20th International Conference on Pattern Recognition, Istanbul, Turkey, 23–26 August 2010; pp. 3121–3124. [Google Scholar]
  87. Benavoli, A.; Corani, G.; Mangili, F. Time-series cross-validation. J. Mach. Learn. Res. 2017, 18, 1–35. [Google Scholar]
  88. Michie, D.; Spiegelhalter, D.J.; Taylor, C.C. Machine Learning, Neural and Statistical Classification; Ellis Horwood: Hertfordshire, UK, 1994. [Google Scholar]
  89. Chakraborty, P.R.; Sorwar, G. A Machine Learning Approach to Identify Fall Risk for Older Adults. Smart Health 2022, 26, 100303. [Google Scholar] [CrossRef]
Figure 1. Phone positioning and example of recorded signals.
Applsci 14 09170 g001
Figure 2. Evaluation of Mini-BESTest. (ad) Anticipatory Postural Adjustments. Postural control tasks: (a) Sitting to standing, (b) Stand on tiptoe, (c) Left single leg stance, and (d) Right single leg stance.(eh) Reactive Postural Control. (ik) Sensory Orientation. (lq) Dynamic Gait.
Applsci 14 09170 g002aApplsci 14 09170 g002b
Figure 3. Flow Diagram of Sensor Data Processing Pipeline for Fall Risk Assessment. This diagram outlines the steps of data processing in the proposed system. Signals from the smartphone’s inertial sensors (accelerometer, gyroscope, and magnetometer) are acquired and processed to obtain Euler angles (pitch, roll, yaw), and the resultant magnitude of these angles is also calculated. A moving average filter was applied using the Savitzky–Golay algorithm to reduce noise in the signals without altering their characteristic shape, yielding a total of 13 signals as features. The sliding window method is employed to segment these features; by adjusting the window size, the amount of data along the sequence is increased, making the data redundant and thus providing the deep learning model.
Applsci 14 09170 g003
Figure 4. Diagram of the neural network model, consisting of convolutional and LSTM layers, with an output for binary classification of fall risk.
Applsci 14 09170 g004
Figure 5. Radar chart comparing the classification performance metrics across Mini-BESTest tasks grouped by type. The radial axis represents values for six metrics: Accuracy, Precision, Recall, F1 Score, Specificity, and Balanced Accuracy. Each axis ranges from 0 to 1, where 1 represents the highest possible value. Tasks are grouped by category (Postural Control, Reactive Control, Sensory Orientation, Dynamic Gait, and All Combined), and within each category, different line styles distinguish individual tasks. Larger areas on the chart correspond to stronger performance across all metrics, while smaller areas indicate weaknesses in certain metrics.
Applsci 14 09170 g005
Table 1. Characteristics of the subjects who were included in the study.
Age (Years)Body Mass (kg)Height (cm)
Non FallersFallersNon FallersFallersNon FallersFallers
Mean 72.447 71.375 69.317 69.604 152.609 156.356
Std. Deviation 6.723 7.251 13.123 11.805 25.408 8.245
Table 2. Classification performance metrics between fallers and non-fallers for each task in the Mini-BESTest.
TaskAccuracyPrecisionRecallF1-ScoreSpecificityBalanced Accuracy
Sitting to standing0.65030.60090.96100.74960.26720.6317
Stand on tiptoe0.75481.00000.52900.68931.00000.7630
Left single leg support0.74910.98800.68120.80660.97440.8278
Right single leg support0.73330.80240.69310.74380.78410.7386
Correction with a step forward0.81020.80790.81170.83400.80770.8097
Correction with a step back0.83620.96550.82480.89170.93710.8828
Correction with a left lateral step0.72290.83610.77950.80680.55970.6696
Correction with a right lateral step0.72430.86400.72750.79020.71660.7220
Standing, eyes open, firm surface0.76350.73351.00000.84630.32200.6610
Standing, eyes open, foam surface0.79580.72480.99480.83860.56480.7816
Bent over, eyes closed0.77270.99860.62070.76560.99870.8097
Gait speed change0.83300.94130.80590.86830.89160.8487
Walk with horizontal head turns0.72310.81630.75380.78380.66210.7079
Walking with a pivot turn0.87130.90380.84930.87570.89660.8729
Walking over obstacles0.89430.87280.99220.92870.67250.8324
Timed Up and Go (TUG) test0.78410.71350.96700.82110.59180.7794
Dual task over 3 m0.67440.74170.79630.76800.41900.6077
All combined0.88550.90140.87930.89020.89240.8859
Note: The values in this table are expressed in decimal form, with numbers like 0.87 representing 87%. These values reflect performance metrics such as accuracy, precision, recall, and specificity.
Disclaimer/Publisher’s Note: The statements, opinions and data contained in all publications are solely those of the individual author(s) and contributor(s) and not of MDPI and/or the editor(s). MDPI and/or the editor(s) disclaim responsibility for any injury to people or property resulting from any ideas, methods, instructions or products referred to in the content.

