Article

Are There Seven Symbols for the Nucleotide-Based Genetic Code?

by
Adam Kłóś
1,2,
Przemysław M. Płonka
1,* and
Krzysztof Baczyński
1
1
Department of Biophysics and Cancer Biology, Faculty of Biochemistry, Biophysics and Biotechnology, Jagiellonian University, 31-007 Krakow, Poland
2
Faculty of Philosophy, The Pontifical University of John Paul II in Krakow, 31-002 Krakow, Poland
*
Author to whom correspondence should be addressed.
Appl. Sci. 2024, 14(20), 9176; https://doi.org/10.3390/app14209176 (registering DOI)
Submission received: 19 August 2024 / Revised: 25 September 2024 / Accepted: 1 October 2024 / Published: 10 October 2024

Abstract

:
The common assumption is that genetic information is built on a four-symbol alphabet, i.e., DNA nucleotides, the smallest meaningful blocks of genomes are codon triplets, and the record of genetic information does not contain any asserted symbols playing the role of the space. It is, however, well known that some nucleotides in some codons are redundant. Our study, therefore, tests the alternative scenario. As the same nucleotide may play various semiotic roles, the genomic alphabet actually contains seven semiotic symbols. Consequently, the meaningful fragments of genomes (words) can be of different sizes, and there are asserted symbols in the record of genomic information. If this is true, then, similarly to natural languages, the frequency-range of these genomic words should follow the power-law distribution. The presented hypothesis was tested, in comparison to competitive (codon-based and n-tuple) forms of tokenization, on a wide range of genomic texts.

1. Introduction

1.1. The Power-Law Phenomena

The power-law distribution has attracted the attention of scientists from different disciplines. This interest is justified as it usually indicates some interesting feature: an underlying structure, an aberration from the norm, or a critical transformation of the examined system. For example in physics, the power law may indicate self-organized criticality [1,2]; in linguistics, it is used for recognition of natural languages [3,4,5]; in economics, the power-law distribution indicates a few agents responsible for generating the most of income in the market (the Pareto principle); in epidemiology, it explains the spatio-temporal dynamics of virus spread [6]; and in the case of neurobiology, it explains the neuronal avalanches of cortical networks [7]. In general, it characterizes scale-free phenomena and complex adaptive systems [8].
The power law has also been proved to be helpful in a broad area of genomic research. It was used as a mean to determinate the size of gene families [9], a metric of gene diversifiability and duplicability [10], an indicator of network size [11], and gene expression in cancer [12]. Its functionality as a marker of sex-biased genetic networks [13] and networks controlling cell ontogeny [14] has also been demonstrated. Even the Gene Ontology annotations seem to obey the power-law principle, which can improve catalogs’ functionality [15].

1.2. The Linguistic Approach in Genome Studies

The similarity of genomes and natural languages has been fascinating scientists from the early stages of genome studies [16,17,18,19]. Thus, the idea comes up to apply methods developed in computational linguistics to decode genetic information. This approach also influenced our study. The remarkable feature of known natural languages is that their corpora follow Zipf’s law [20]. The Zipf distribution is a variation of the more general power-law phenomenon and states that the frequency of any word is linearly proportional to its range in a text written in a natural language.
F r r α
In Zipf’s corpus analysis, the most common word has a range of r = 1, the second most common has a range of 2, and so on, up to the least used word. The distribution is represented on the double logarithmic scale, where the frequency decays linearly as the rank increases. In our approach, we followed the linguistic metaphors as it is easier to understand the method of genome analysis applied in our studies and achieved results. For us, the power-law distribution is more a detector of some kind of meaningful order hidden in analyzed texts [21]. Whether this structure meets all language requirements of or not, for our purpose, is a secondary matter that will not be addressed here.
Having established that, we can ask in what respect does the genome resemble language? The most obvious answer is that as in the English language, there are 26 letters (used as building blocks for meaningful words and sentences), the genetic alphabet contains a four-nucleotide alphabet (A, G, C, T) which in proper rearrangement codes information. However, differently from most natural languages, genomic “texts” have no obvious way to distinguish words. Application of the sequence–rank analysis thus requires some method of word extraction, i.e., tokenization. In natural languages, words are separated by whitespaces and punctuation marks such as commas, semicolons, full stops, and others. The genomic text or randomly generated sequences of unknown punctuation marks need a different approach. For structural reasons, it cannot be a break in the nucleotide chain.
The sliding window method [22] (more recognizable as the n-tuple method) was designed to resolve that problem. This technique, further called “frame tokenization” (TF), uses the frame of the size of n-characters to cut n-size words (Figure 1 and Figure 2). It was shown that the corpus of natural language merged in continuous text and analyzed with the sliding window method preserves the Zipf distribution [22]. Frame tokenization (TF) is commonly used with text of unknown tokenization characters (deprived of whitespaces or other punctuation symbols), and according to the literature, it can be a proper tool for language detection [22,23,24]. Therefore, the frame method serves as a baseline for comparing other methods and an initial procedure for examining texts of unknown tokenization procedure like genomes.
The second technique of tokenization is more specific to the genome as it utilizes the properties of the genetic code. Each codon consists of three nucleotides; therefore, it seems natural to assume that triplets are basic words in genomic texts. This approach we called triplet tokenization (TT).
The application of these (and similar) methods of tokenization in genome studies has returned ambiguous results and consequently raised doubts of whether the linguistic strategy is the right choice for extracting genetic information [25]. However, the problem may lay not in the approach itself, but the presumptions commonly shared by researchers. These premises are calling for our attention.

1.3. The Hypothesis Statements

The first presupposition, commonly shared by researchers, is that the genomic alphabet contains four letters. The second equally common statement is that the basic building blocks carrying the meaning (words) have to be triplets or triplets’ combinations. Finally, a frequent belief is that there are no punctuation marks in genomic text. We are about to challenge all of those claims. We propose that the genomic alphabet, while still containing only four nucleotides, consists of seven symbols, the meaningful entities, or “words”, are not necessarily triplets, and the genetic code does possess punctuation marks that serve as a means for tokenization.
The new kind of analysis proposed in this paper is called “contextual analysis”. It takes into consideration the degeneracy of codons. Depending on the “context”, i.e., preceding nucleotides in the codon, the third character is transformed (Table 1). As a result of that, we end up with a seven-letter alphabet, that is, the nucleotides “A”, “T”, “C”, and “G”, plus “Y” (any purine), “X” (any pyrimidine), and the “*” (any nucleotide) character. Therefore, even the physical basis of the four nucleotides remains the same; on the semiotic level (or level of biological function), there are seven symbols. Our main claim is thus that some nucleotides may have a double or even triple function. At the same time, we accept that the “any nucleotide” characters operate similarly to white spaces in our languages, providing a natural way of contextual tokenization. We hypothesized that if that is true, then genomic texts subject to contextual analysis would have follow the Zipf distribution better than when exposed to alternative methods of tokenization.
To our knowledge, the approach proposed in this study was not previously applied in genome analyses. To ensure the objectivity and universality of the results for our analyses, we used 60 uniform genomic texts of the same length (3 Mbp) derived from a wide variety of species.
The primary objectives of this study are to (1) investigate this alternative representation of nucleotide sequences using a seven-character alphabet derived from genetic code degeneracy, (2) assess whether coding sequences (CDSs) rewritten using a seven-symbol alphabet and tokenized accordingly exhibit a power-law distribution in their frequency-range analysis, indicating meaningful informational structures, (3) evaluate the effectiveness of triplet tokenization and frame tokenization in detecting this semiotic information within genomic sequences by examining the conformity of their texts’ frequency distributions to the Zipf plot, and (4) differentiate between genuine genomic patterns and randomly generated texts, thereby validating that the observed results are not due to chance.

2. Materials and Methods

2.1. Data

The study material consists of 60 coding fragments of genomes (CDSs) derived from different organisms. Data were downloaded via from the NCBI website in the form of fna and gff files (see Table S1). The coding sequences from each organism were extracted in random order and merged into one continuous text of 3 Mbp in size. Files prepared in this way were the starting point for analyses and will be addressed further as “genomes” or “texts” and “genomic texts”. In several cases, the downloaded files contained several incorrectly identified nucleotides. These characters were filled with the nucleotides semi-randomly chosen according to the frequency of their appearance in a given genomic text.
In this preliminary study, we used CDS sequences because of their availability across species. Further exploration of genomic features, as well as the development of toy genome models, will be left for potential future works. The organisms for studies were chosen in such a way as to ensure the greatest diversity of genomes so that every domain, kingdom, phylum, and most of the classes have been represented. For the list of organisms involved in our study and their taxonomy, see the Supplementary Materials (Figure S1).
As a reference, artificially produced genomes were analyzed. The pseudo-genomes, likewise, called “random texts”, were generated by repetitively drawing (with the same probability) the symbols from the sets of four nucleotides (A, T, C, G). The procedure went on until the size of the text reached 3 × 10 6 symbols, which is the size of the genomic text. Sixty texts were tested per analysis, corresponding to the number of genomic texts.
To ensure a reliable comparison of genomes from different species, we were forced in our study to use relatively short genomic texts of 3 × 10 6 bp in length. This size has been chosen to avoid the risk of excluding organisms with smaller genomes (some bacteria and archea) and, at the same time, to guarantee the accuracy of calculations. Additional tests were conducted to investigate the relation between the text size and the F(r) dependency (for details, see Supplementary Figure S2). This examination showed that the distribution curve, within a certain range, is the same regardless of the genome size. The 3 Mbp length of the text appears to be adequate to secure the proper power-law analysis.

2.2. The Experiment Design

The study was conducted similarly to the linguistic analysis. The basic level of every text is “alphabet”, i.e., characters lying on the language foundation. However, the meaningful structure of the language emerges at higher levels of organization, starting from words (tokens) and sentences. In our study, we analyzed genomic texts in the context of two different alphabets and various tokenization methods. Figure 1 illustrates the process of generating each type of text (analysis). The input sequences are CDSs of the 60 organisms included in the study. Subsequently, the generated texts (S0TTAN, S0TFAN, SNTTAN, SNTFAN, SNTTAC, SNTFAC, SNTCAC, S0TTAC, S0TFAC, S0TCAC, SCTTAC, SCTFAC, SCTCAC) were subjected to verification for compliance with Zipf’s law.
Figure 1. The experiment design. The diagram using the toy genomic text “TGTACGAGG” explains how a particular method of analysis works. For illustrative purposes, the same shuffled texts are maintained between different analyses, whereas during the experiment each analysis shuffles the text individually.
Applsci 14 09176 g001

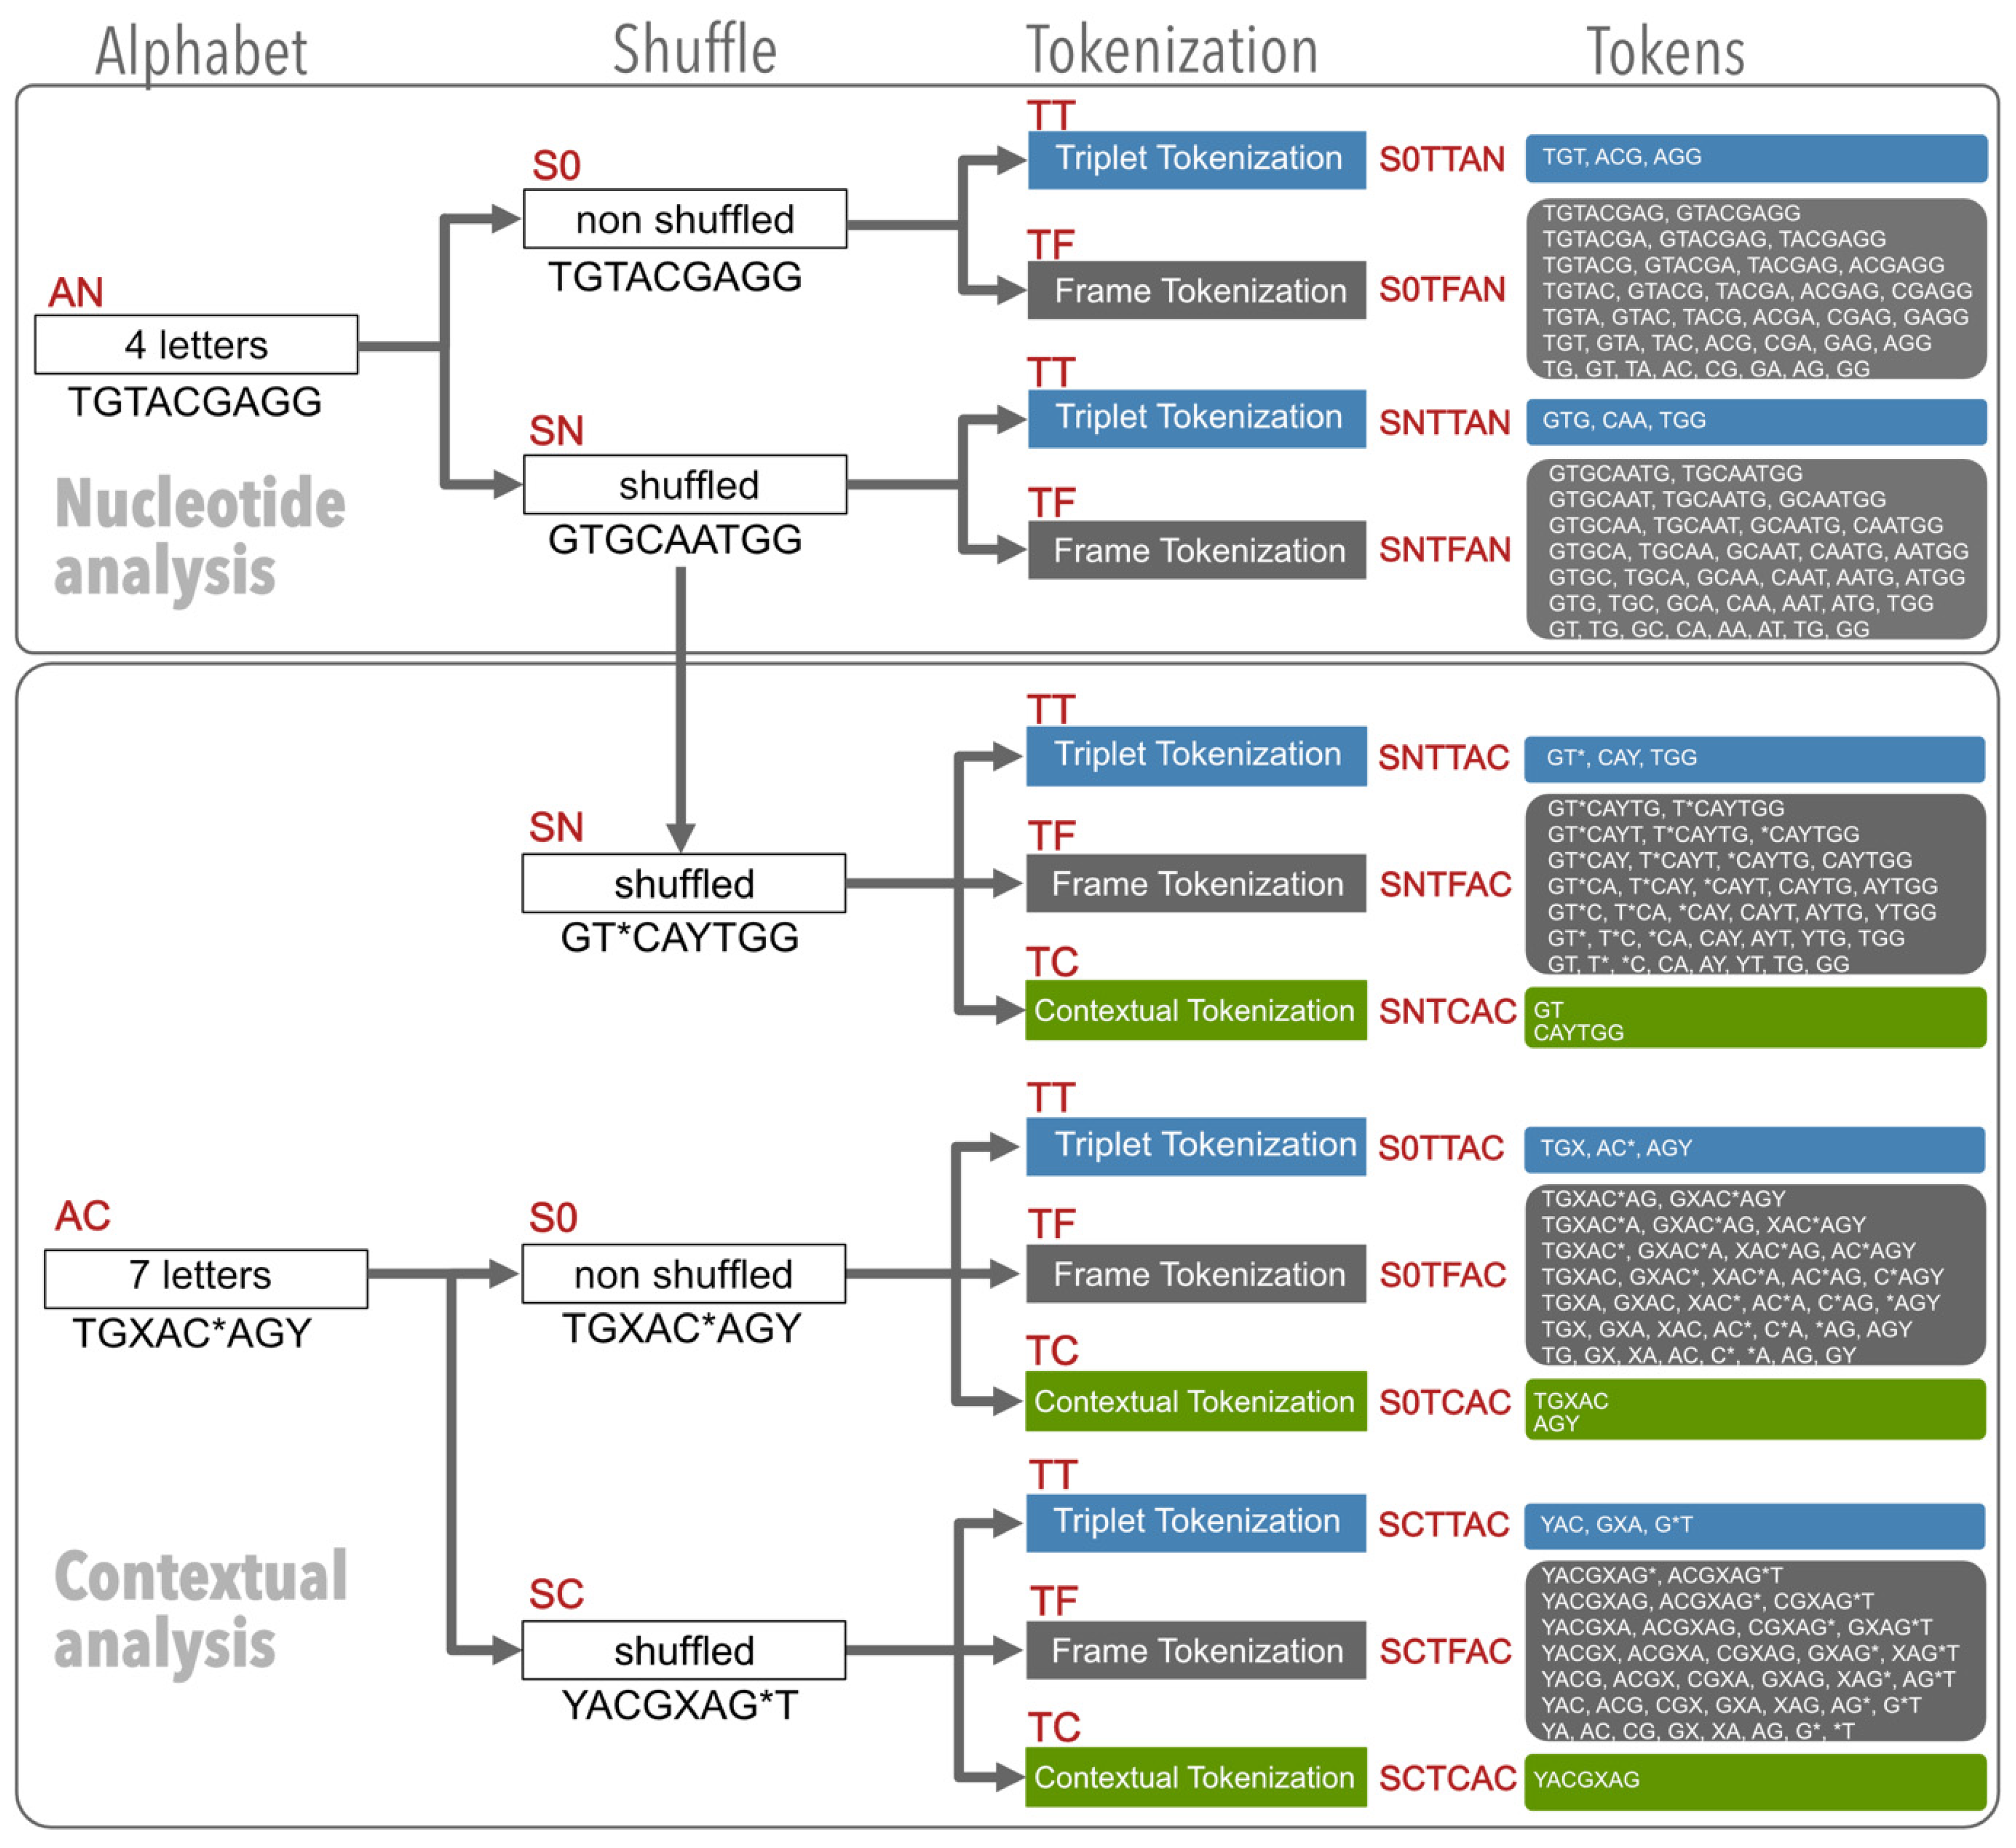
2.2.1. The Nucleotide Analysis

The first approach, called nucleotide analysis (AN), assumes the traditional 4-letter alphabet consisting of nucleotides: A, G, C, T. The nucleotide analysis is conducted by two methods of tokenization. In the frame analysis, the words (i.e., blocks of text of size n) are obtained by shifting the window of the length of n-characters by one nucleotide at a time. In our case, we used frames of length from 2 to 8 characters (Figure 2). In other words, from the 3 Mbp text first, the dimers were extracted by moving the 2-nucleotide frame character by character; next, the trimers were provided similarly and so on up to octamers. Therefore, the genomic text corpus in this method contains words of length 2, 3, …, 8. Frame tokenization is the most general approach.
The second method of tokenization relies on the characteristics of the genetic code. As codons consist of three nucleotides, which are later translated into appropriate amino acids, the triplet tokenization (TT) uses a frame of 3 letters in size. However, this time the shifting window moves by 3-character steps. Consequently, the corpus achieved by applying the triplet tokenization consists only of three-nucleotide-long words (triplets). Both methods of nucleotide analysis were executed on unshuffled, original texts (S0) and randomly shuffled texts (SN).
Figure 2 graphically illustrates the three types of tokenization used in this study.
Figure 2. Explanation of tokenization methods.
Applsci 14 09176 g002

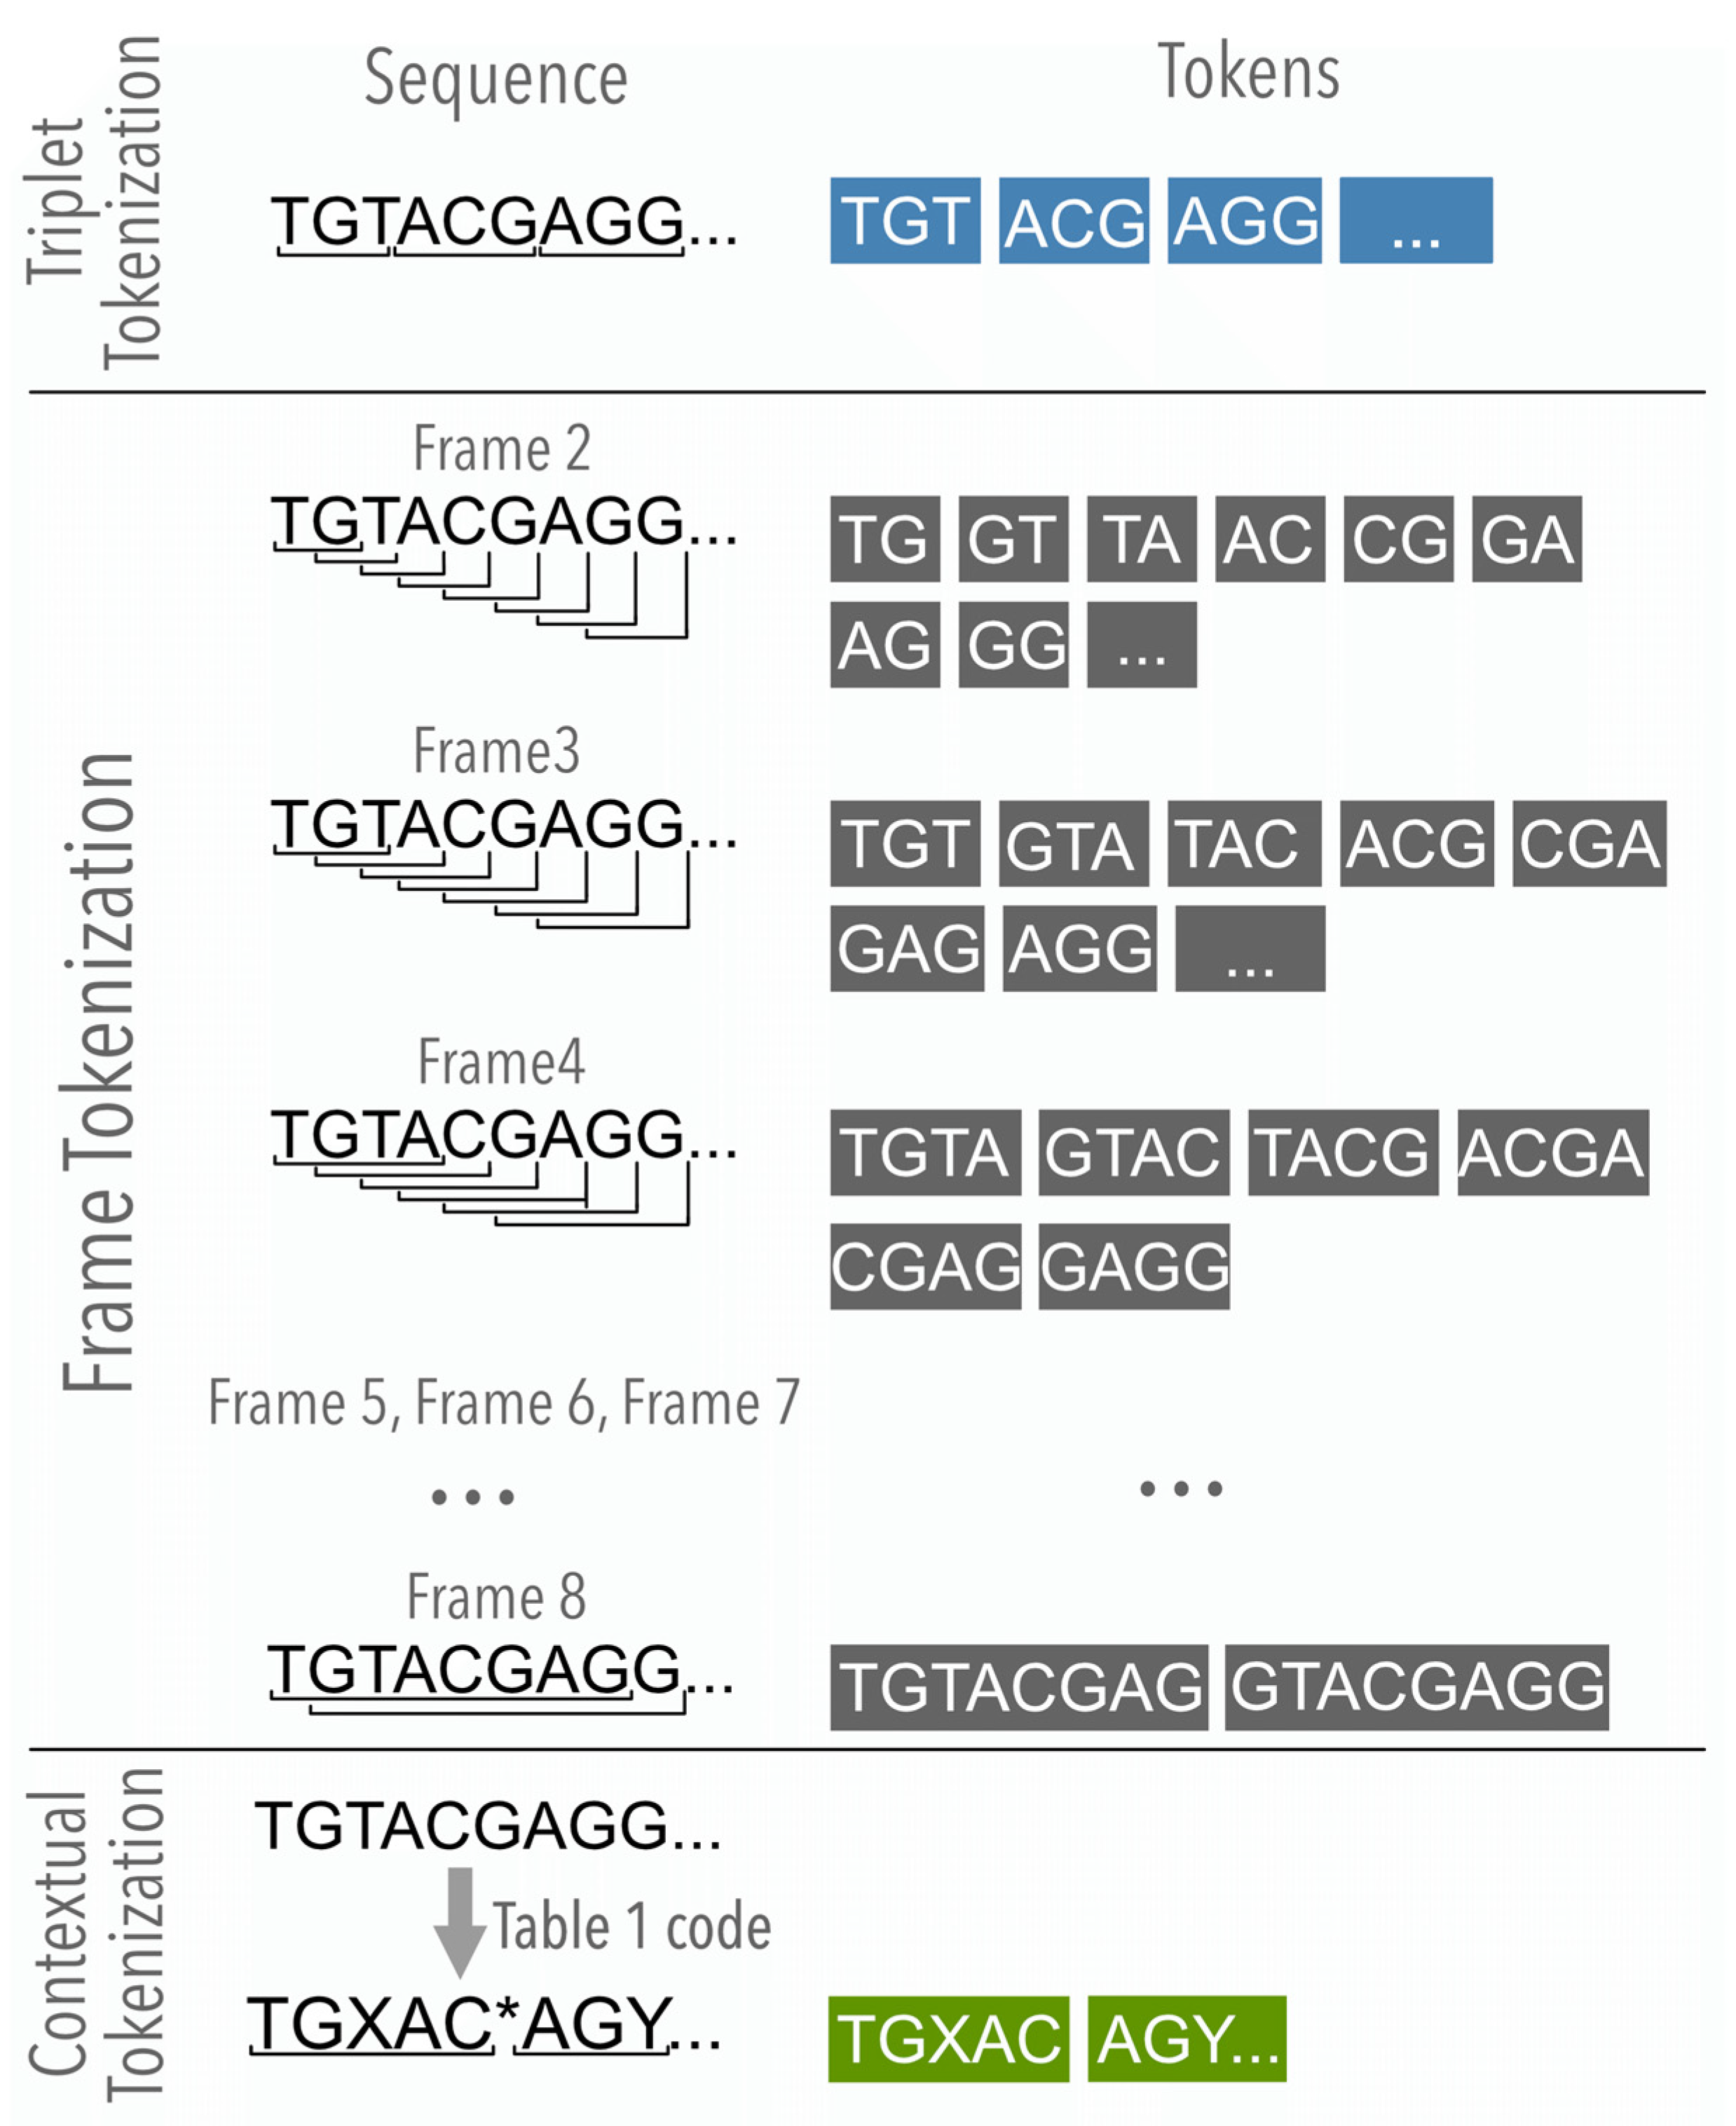
2.2.2. The Contextual Analysis

A new kind of analysis introduced in this paper is contextual analysis (AC). Contrary to the previous one, it accepts the seven-letter alphabet, consisting of the four DNA nucleotides, any purine, any pyrimidine, and any nucleotide character. The original texts were translated into contextual texts based on the rules shown in Table 1. The biological justification for that procedure lies in the genetic code degeneracy. It assumes the indeterminacy of the third nucleotide in a codon (the so-called wobble position). To be more precise, for some codons to be correctly translated into a given amino acid on the third position requires purine (i.e., allow A, G), others need any pyrimidine (C, T), but some of them permit any nucleotide. Therefore, it is not unreasonable to incorporate those “new characters” into the meta-representation of the genomic alphabet and rewrite the genomic text according to rules provided by the translational apparatus, that is, nature itself. Contextual analysis serves this purpose.
Contextual transformation plays an important additional role. It provides a natural method of text tokenization, which we call contextual tokenization (Figure 2). The “any nucleotide” (*) character performs a similar function as the whitespace does in most languages, i.e., it separates each word from another. As nature does not allow for “whitespace” in DNA or RNA, a special character indicating a break in the chain is needed. “Any purine” (Y) and “any pyrimidine” (X) can be treated as a half-space in the manner of the semicolon (however, this function was not implemented in our study). Using the “*” symbol, one can separate words and access the corpus for frequency-range examination.
As a frame of reference, two other methods, i.e., triplet and frame tokenization, were also applied during contextual analysis. The procedure for both modes of tokenization remained the same, and the only difference was that the sliding window and the triplet tokenizer were operated on the text containing “A, T, C, G, X, Y, *” metacharacters. As previously, both the original (S0) and the shuffled texts were examined. However, contextual analysis allowed two different methods of text randomization. The text could be shuffled on the nucleotide level (SN) and then translated into the 7-character alphabet before tokenization was applied. Alternatively, the original text could be translated according to the 7-letter alphabet rule and then shuffled at the contextual level (SC). The summary of all operations conducted in this study and the manual of how to read the analyses’ shortcuts are shown in Table 2.

2.3. Computational Programs and Statistical Tools Applied

The programs required for analyses were written in python v. 3.6.4 in the Anaconda 1.9.2. distribution. The corpus text was extracted from CDS files with the help of biopython v. 1.73. For text analyses, the scikit-learn 0.21 module was used, and the graphs were produced by the matoplotlib 3.1.0, seaborn 0.9.0, and plotly 5.1.0 libraries.
To decide whether empirical data follow the power-law distribution is, in many cases, technically challenging [27]. In our first approach, we used the Kolmogorov–Smirnov statistics with parameter D as the threshold for the statistically significant outcome. The D parameter measures the distance between the data distribution against the theoretical power law. The smaller the parameter D, the more closely the studied data approach the theoretical distribution.
The second step in the statistical analysis was designed to distinction the power-law distribution from the alternatives. This method was developed by Clauset [28] and Klaus [7] and implemented in the “powerlaw” python package written by Alstott [29]. The powerlaw-1.4.6 version of that program was used in our study. The program compares in pairs the power-law fit with other alternative distributions (lognormal, exponential, truncated power law). The likelihood ratio method is used to identify which of the two fits better. A positive log-likelihood ratio (R) signifies that the first distribution is favored over the second one, whereas negative R values imply otherwise. The statistical significance in both cases is estimated by the p-value, with p < 0.05 being reported.

3. Results

The Results Section is divided into two main parts devoted to analyzing the genomic texts and the artificially produced pseudo-genomic random texts. Overall, the results presented below show that texts translated into the seven-letter alphabet and shuffled after that (SCTCAC) followed the power law. The results of the negative control for this experiment, that is triplet tokenization, ruled out the power law, whereas the positive control, namely frame tokenization, mostly confirmed it. The results are consistent for both genomic and random texts.

3.1. The Genomic Texts Analysis

The visual examination of genomic texts analyses was accompanied by K-S statistical tests. The aim of this initial procedure was to exclude the results that did not follow the power-law distribution. The texts that have passed the statistical test were subjected to the distribution comparison.

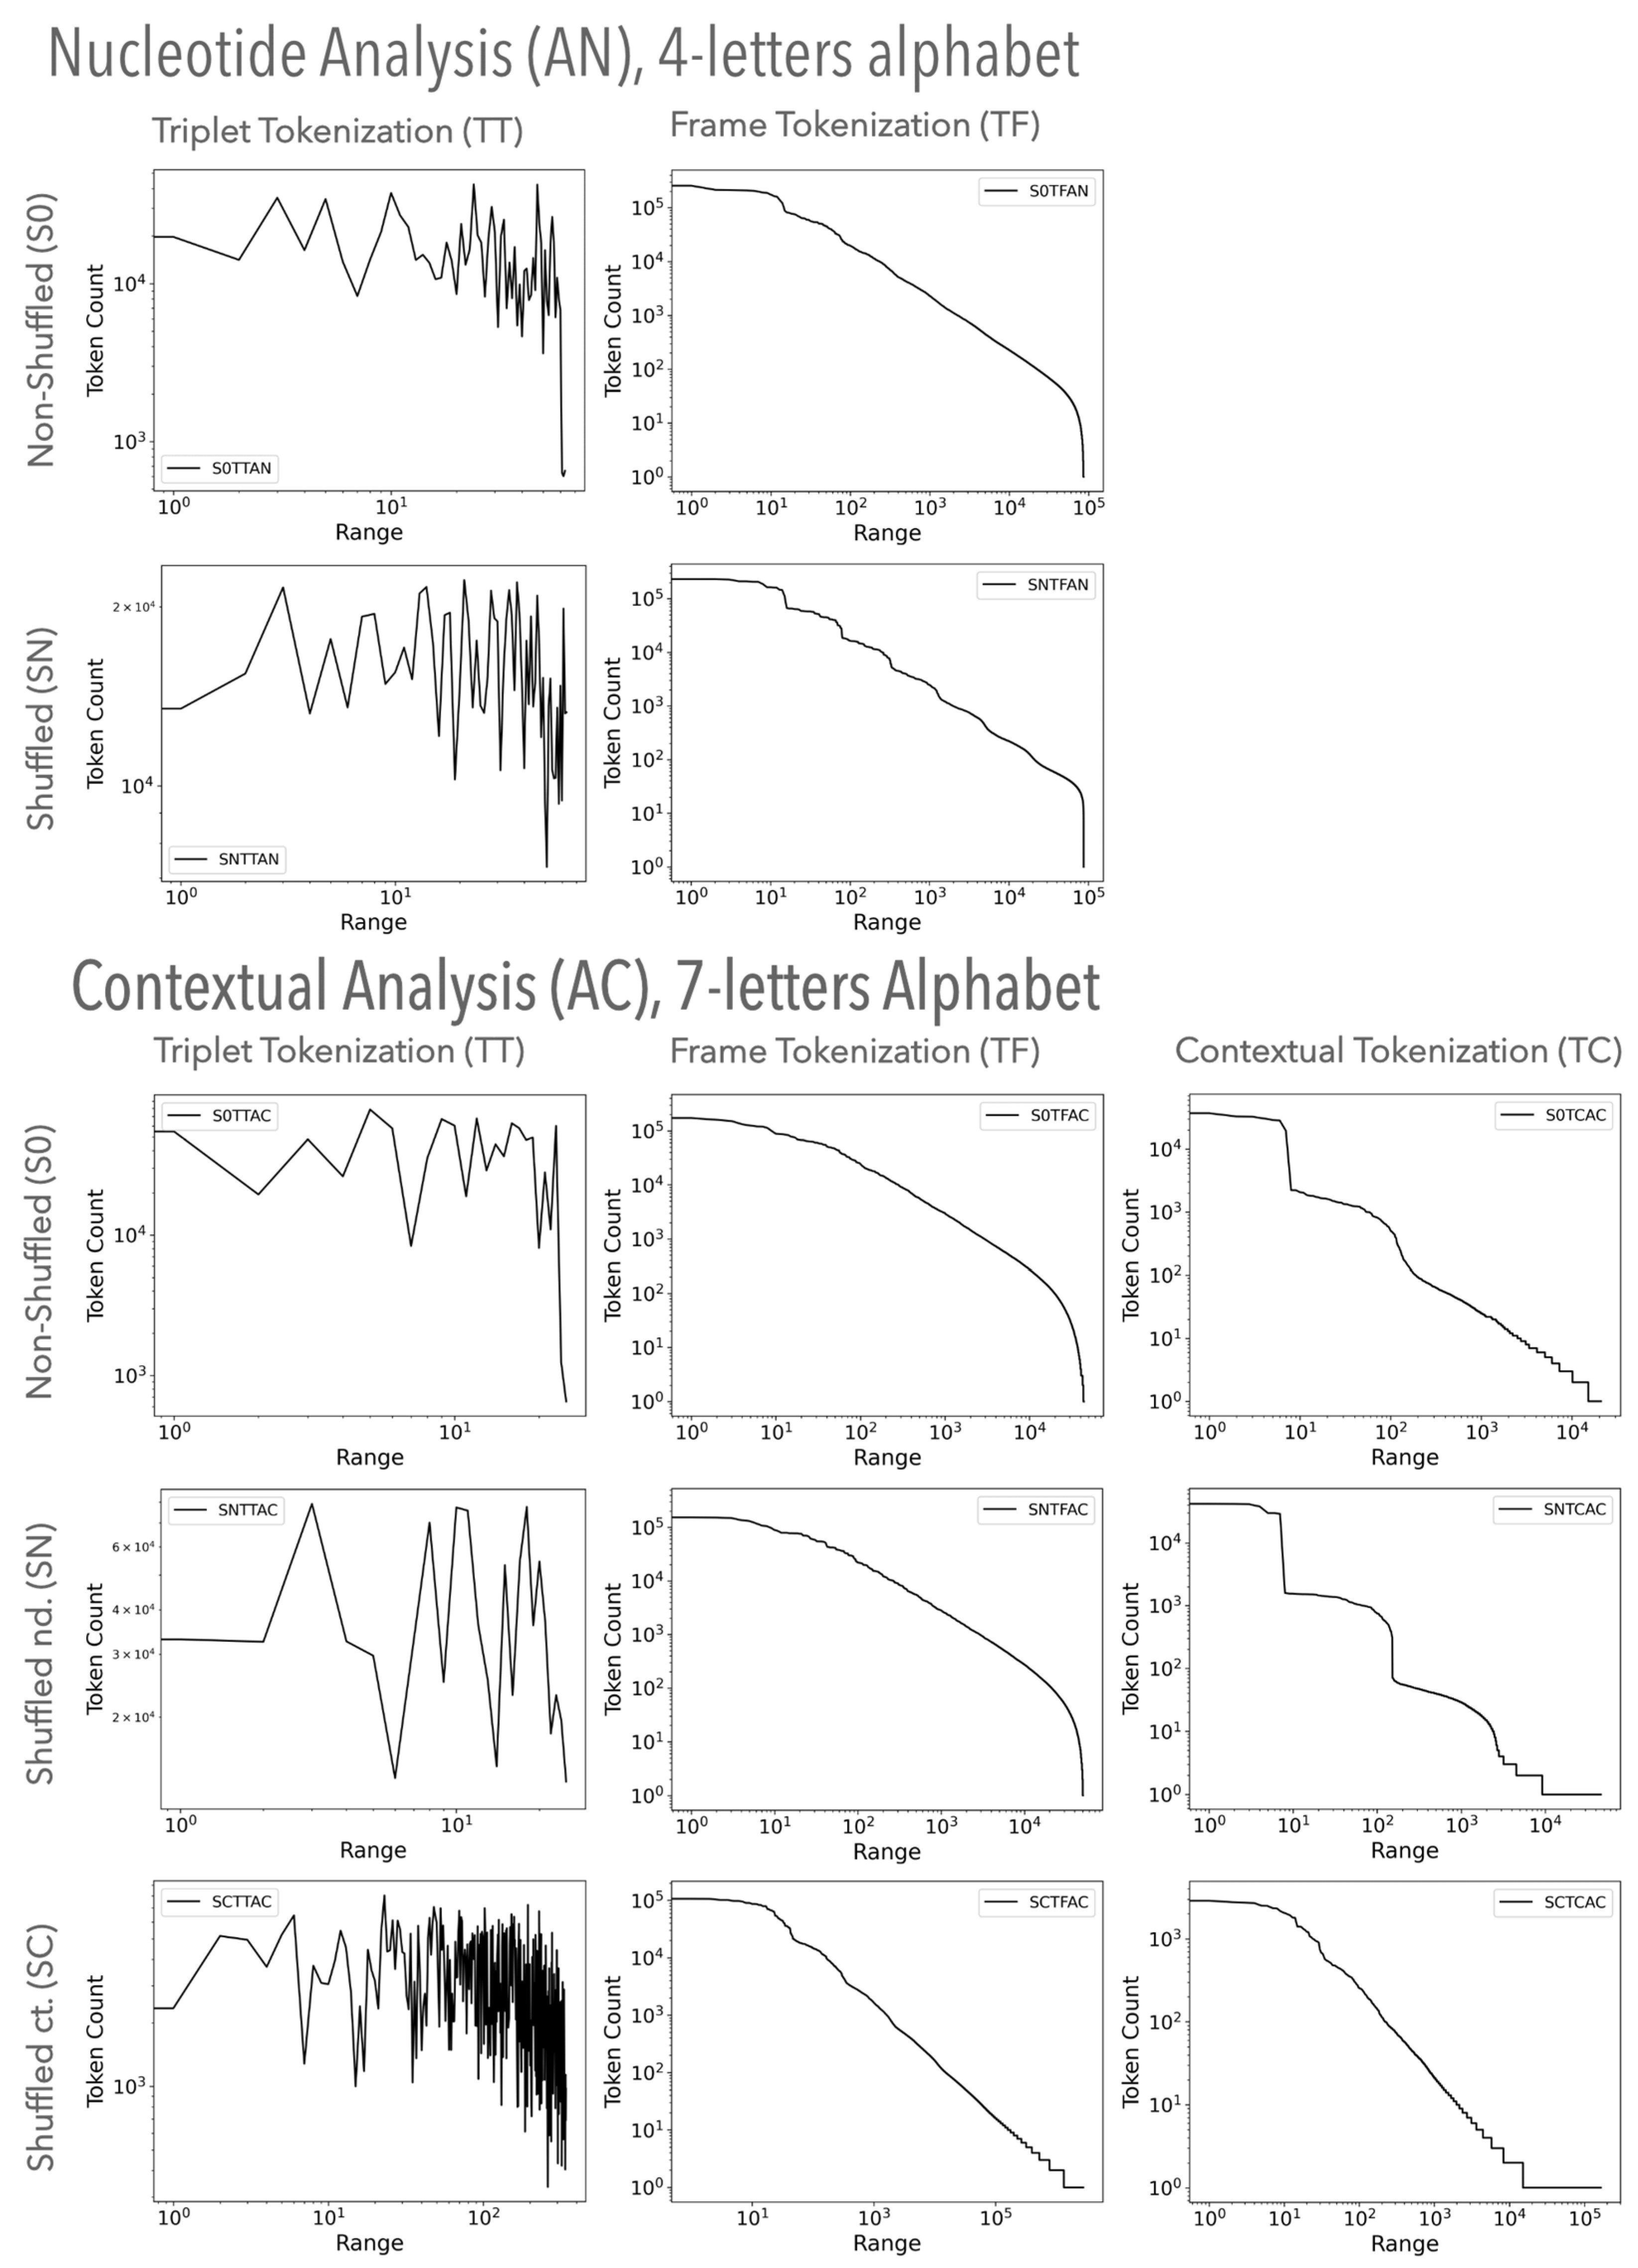
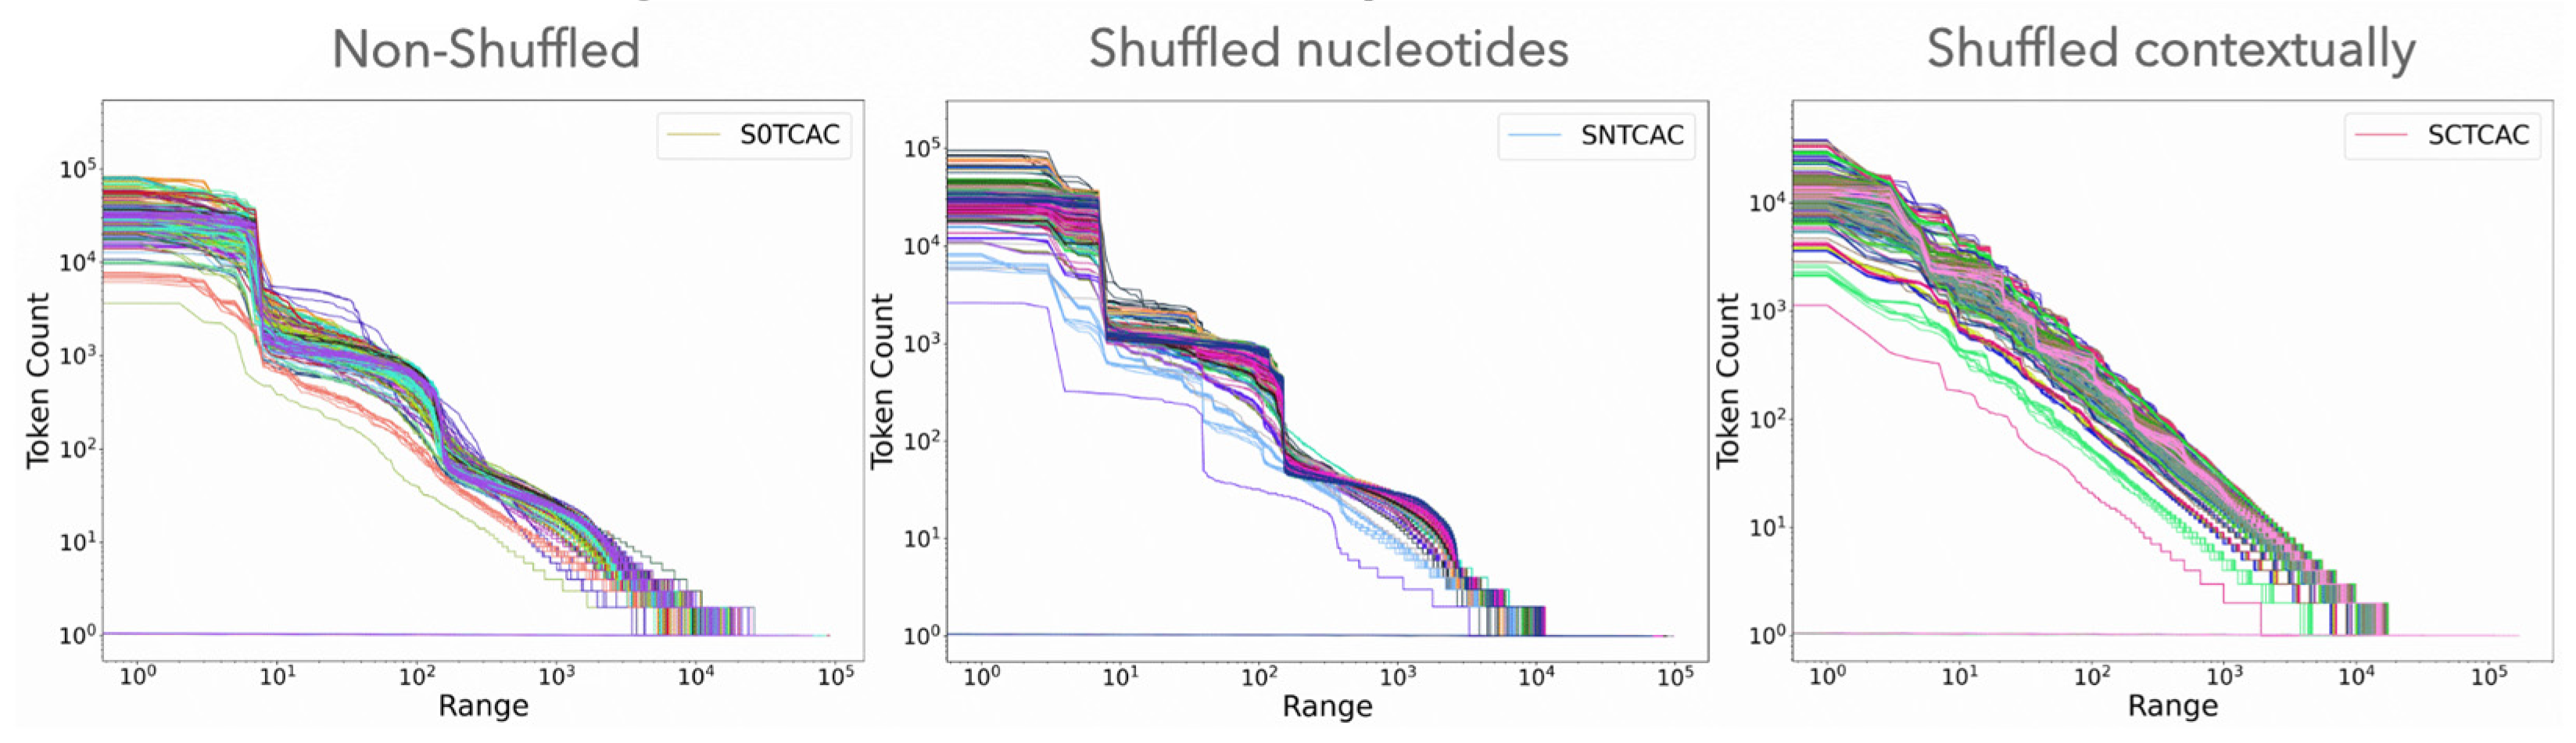
3.1.1. Visual Examination of Genomic Texts

Figure 3 shows analyses of the exemplary genome text (here, a 3 Mbp fragment of Drosophila melanogaster genome). The upper part of the panel presents the frequency-ratio dependency of words resulting from the nucleotide analysis. The bottom part of Figure 1 demonstrates the F(r) relation of words from the contextual analysis. The figure follows the types of analyses explained in Figure 1 and described in Table 1 (see Section 1.3). The same procedure was used in all 60 genomic texts’ analysis.
Judging from the appearance of the graphs in Figure 3, at first glance, we can rule out all plots representing triplet tokenization as they do not resemble the power law at all. Similarly, in the first two cases of contextual tokenization (SNTCAC and S0TCAC), the graph is waving and most likely does not follow the scale-free distribution. A not so obvious but still ambiguous situation is the SNTFAN of frame tokenization. In other cases, the graphs show (at least in some scope) the straight-line log–log plots indicating the potential power-law distribution. The scrutiny of all the genomic texts studied shows a strikingly similar pattern to those in Figure 3 (see Supplementary Materials Figure S3).

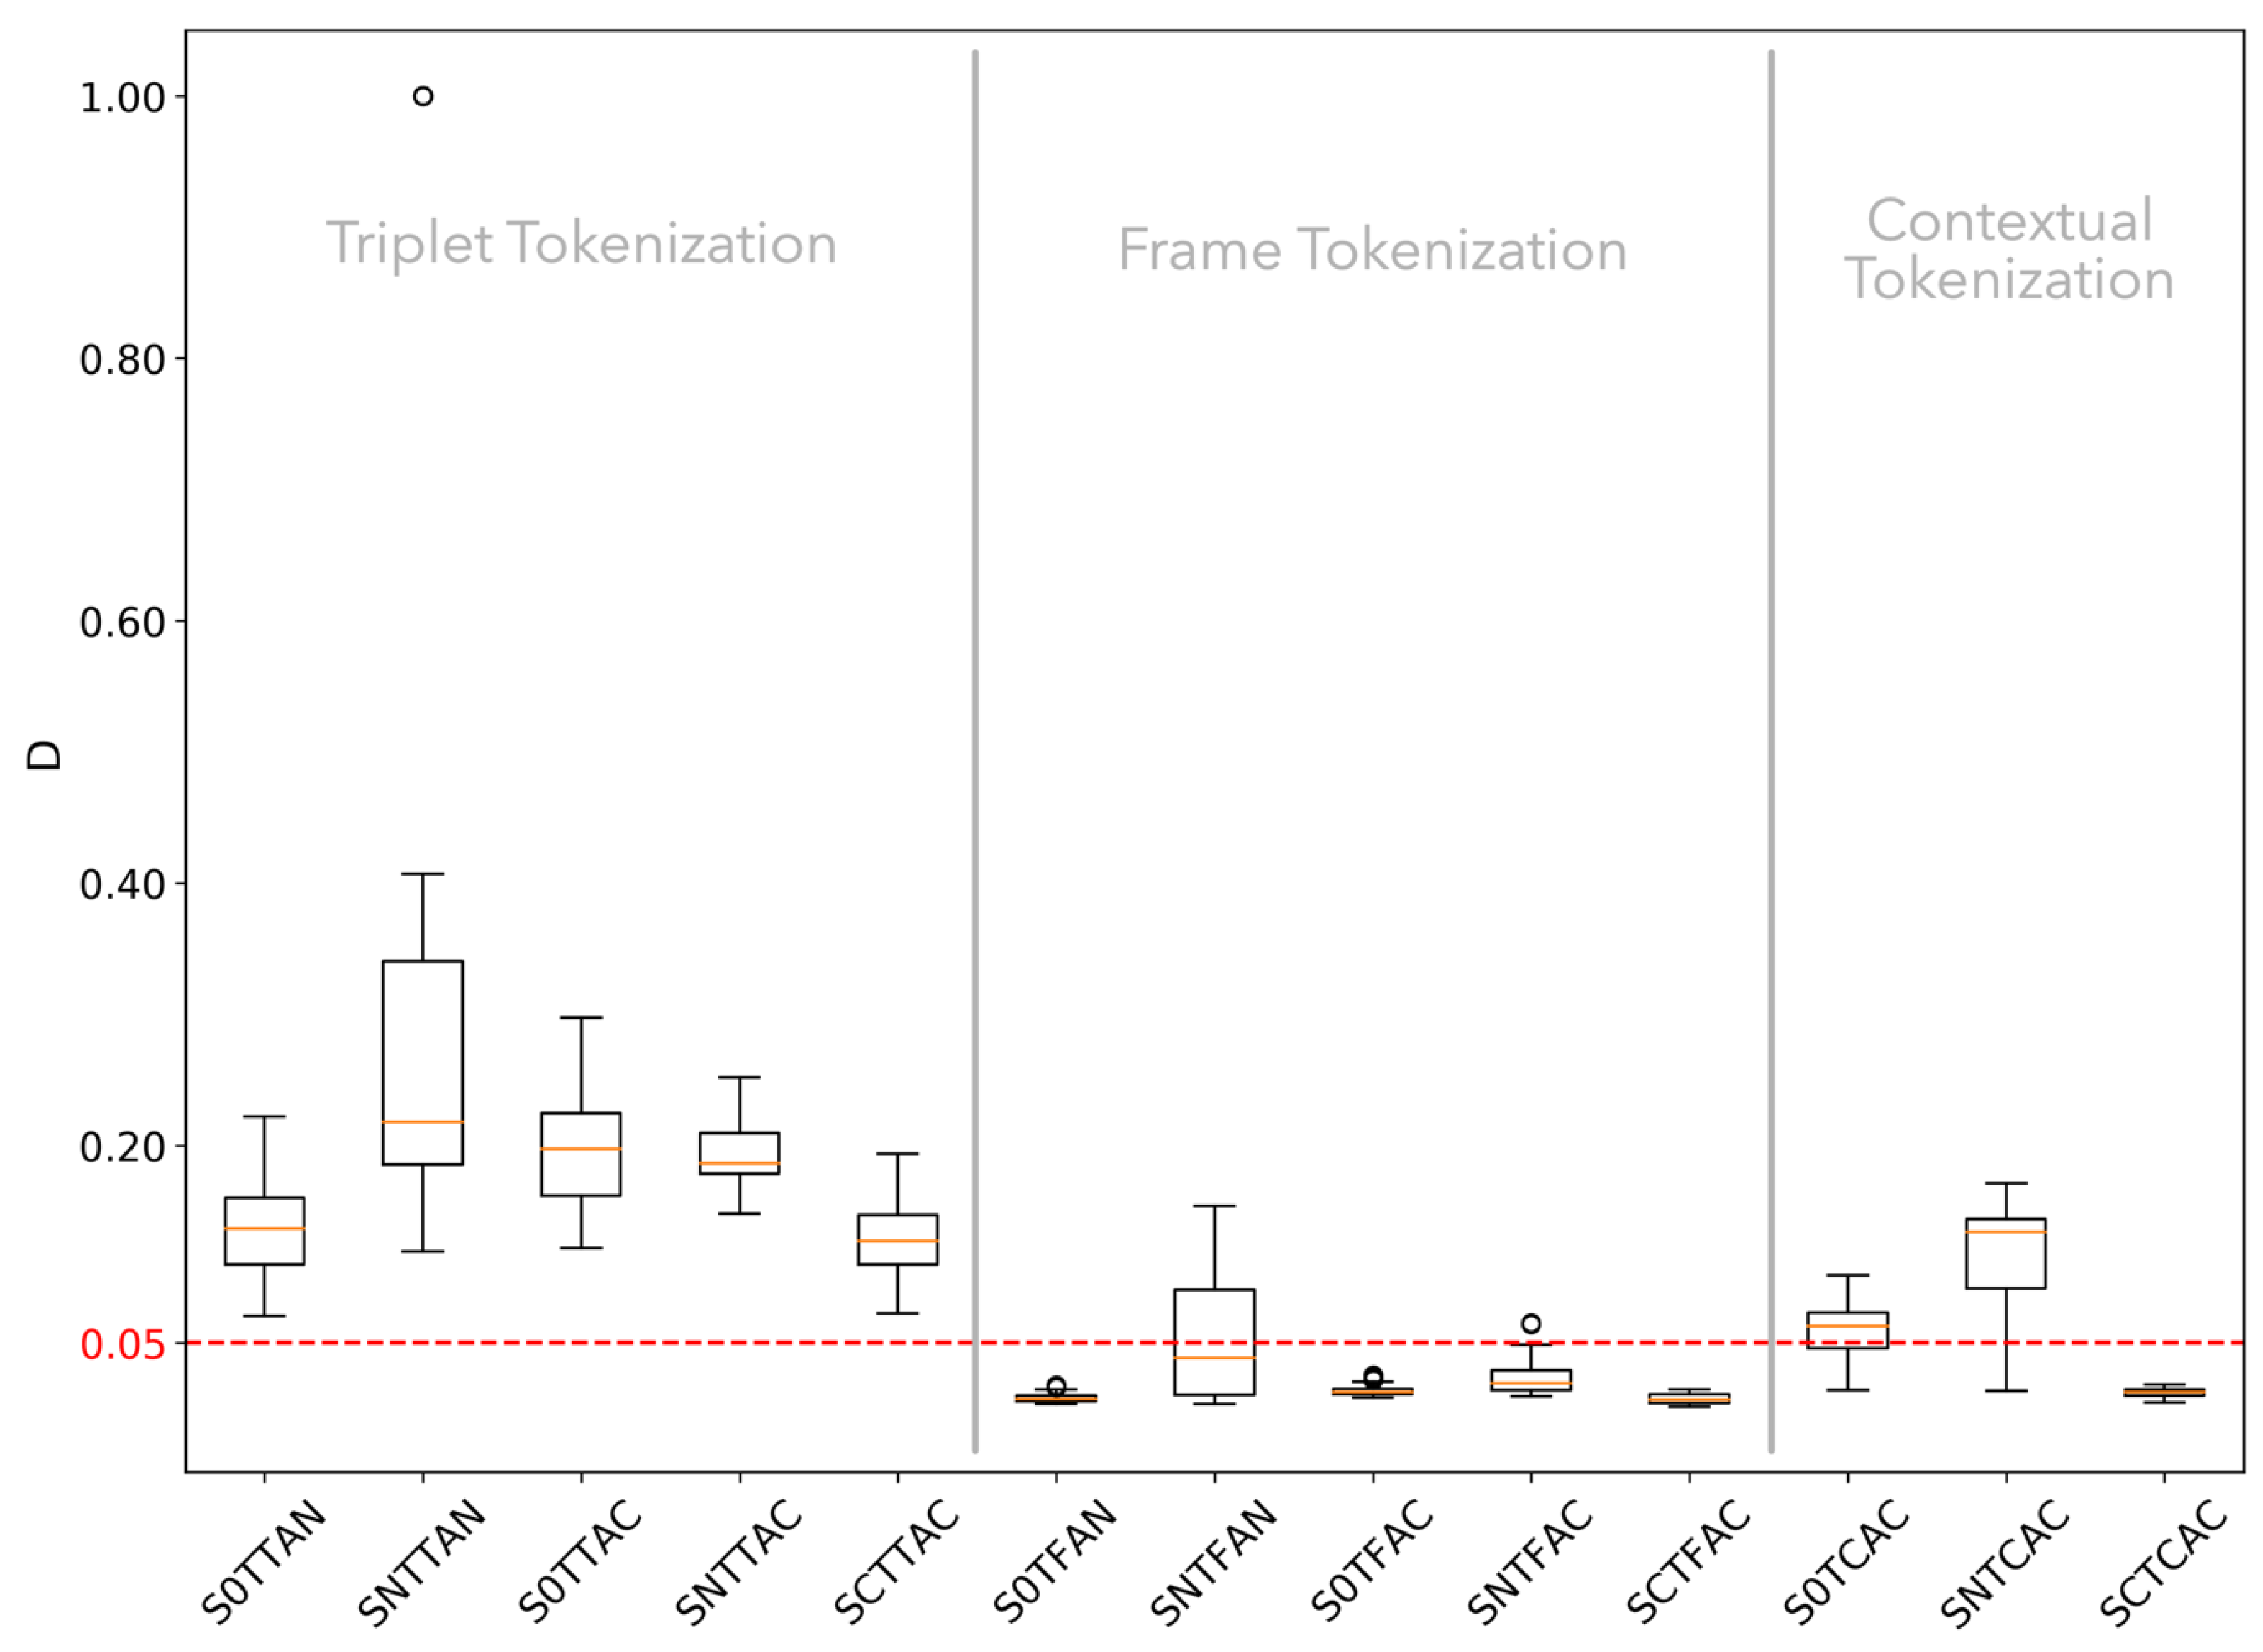
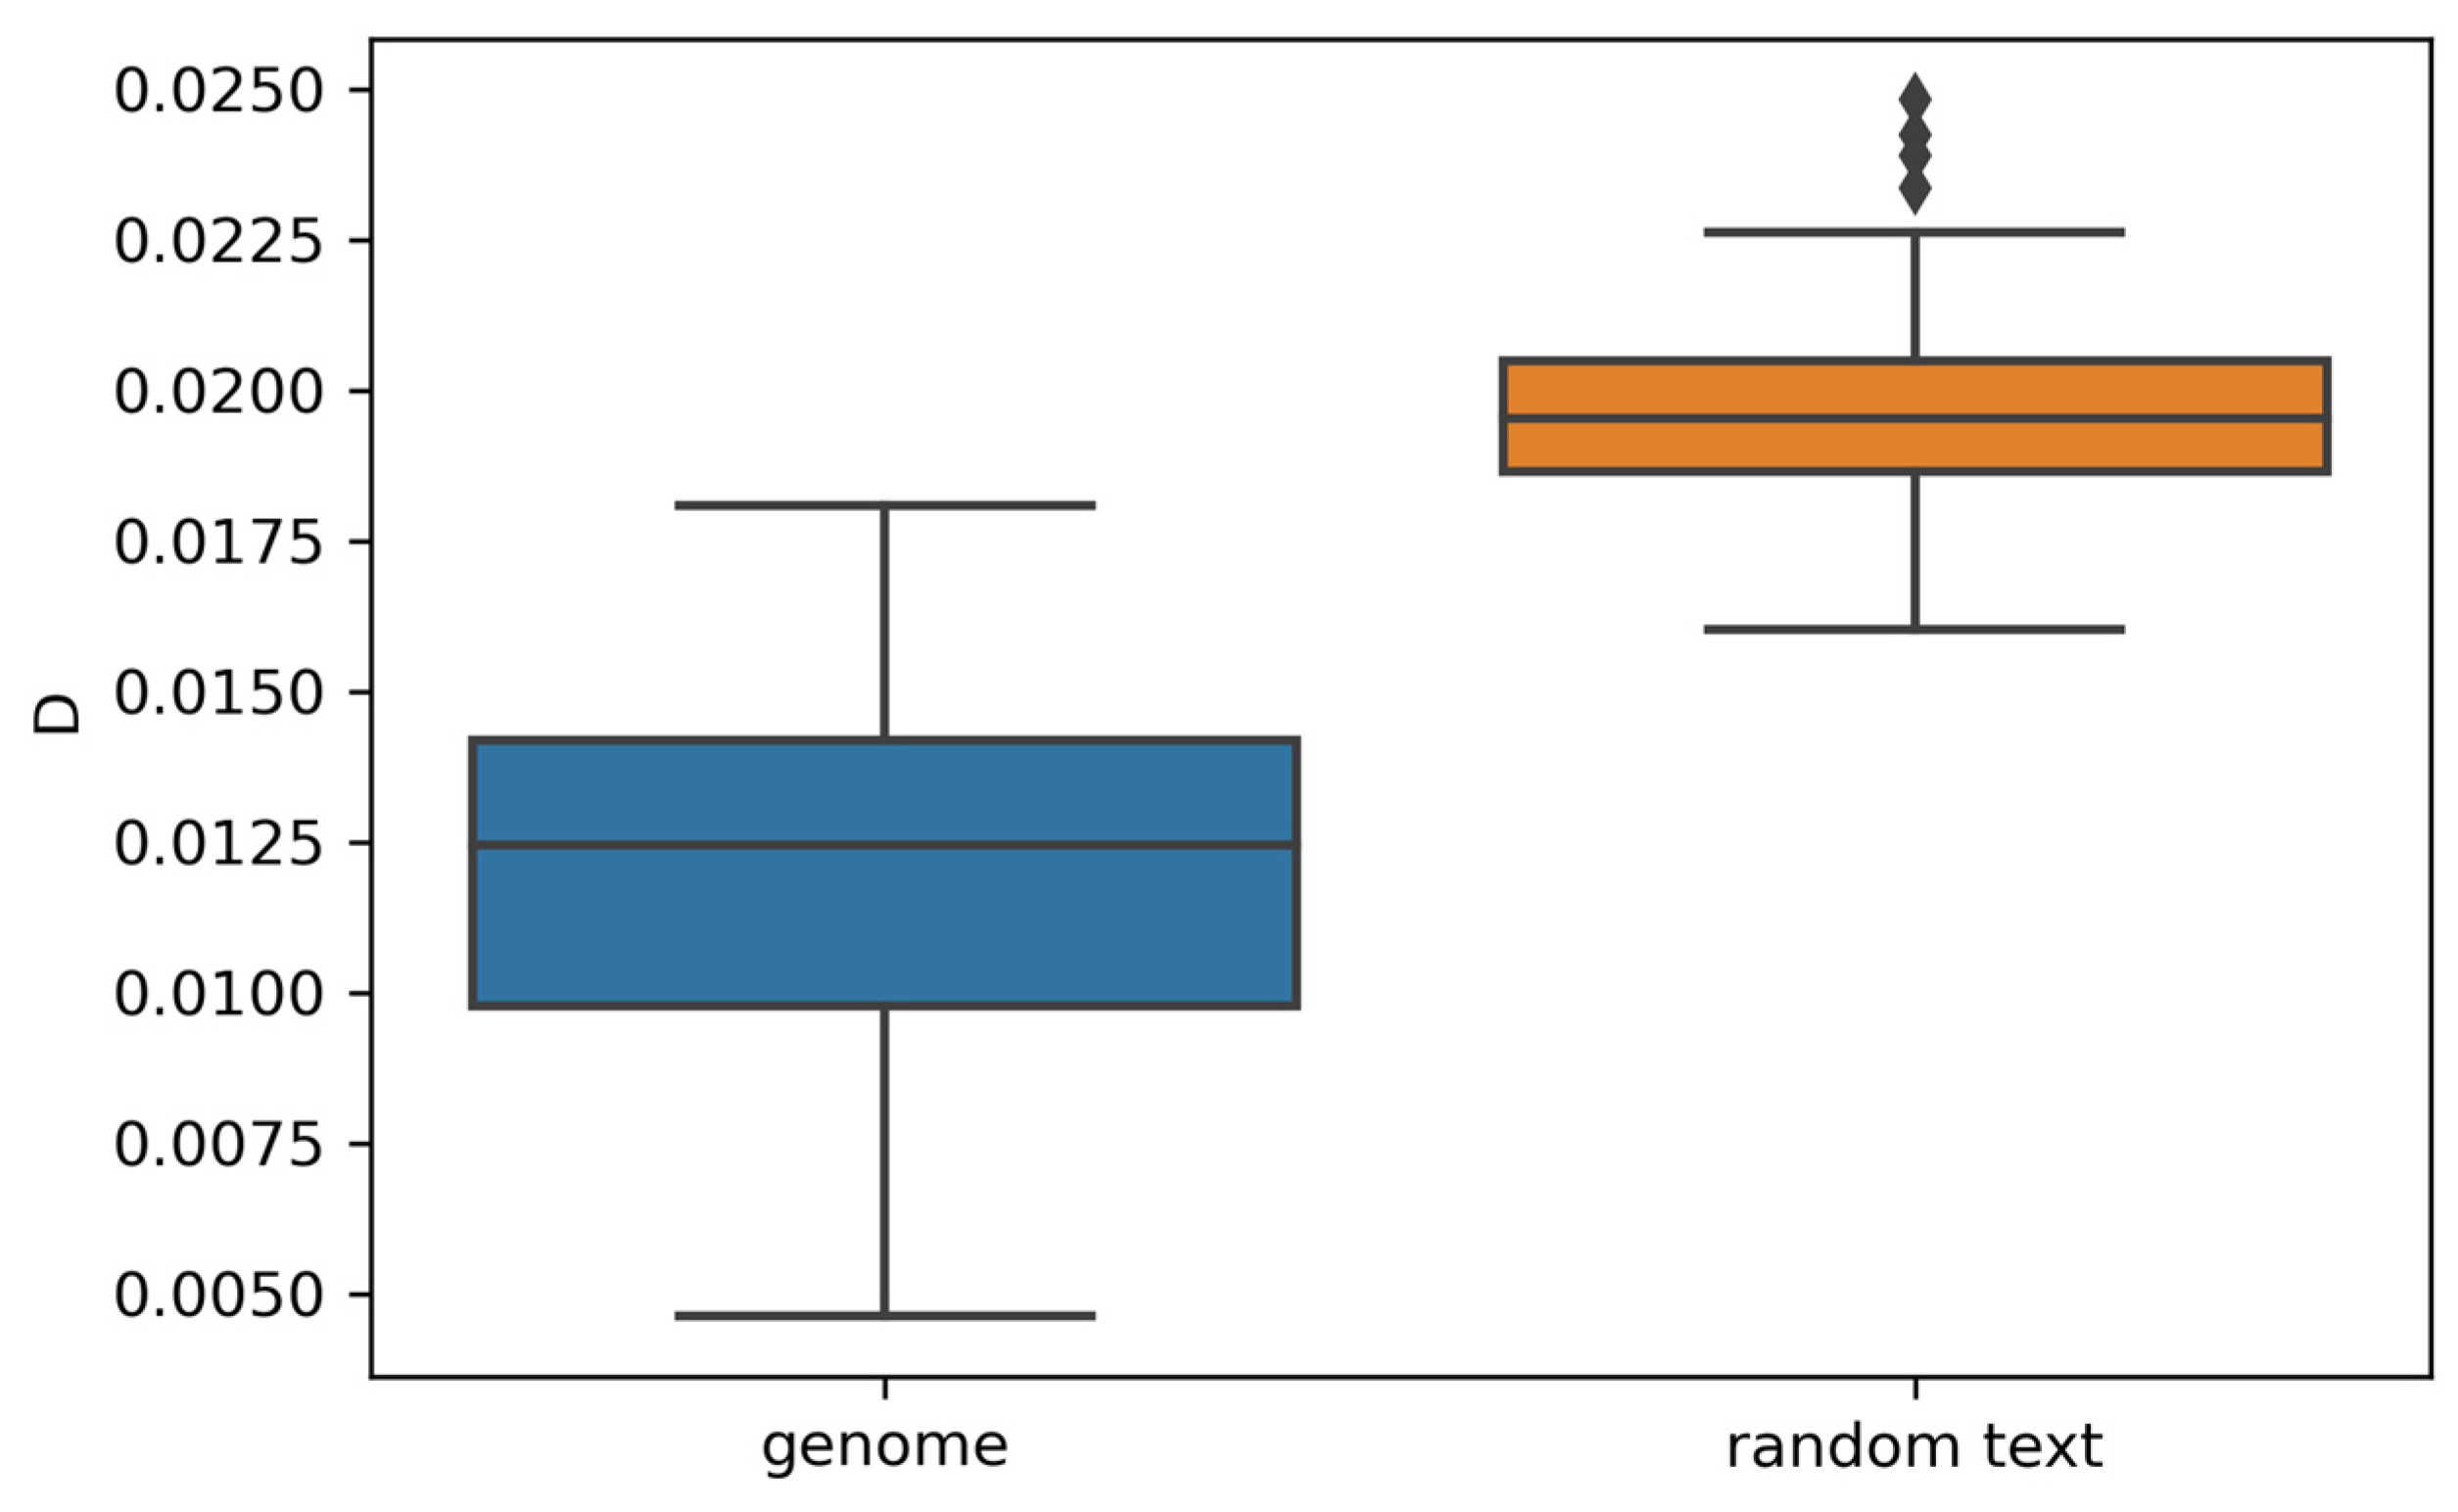
3.1.2. K-S Statistic Test of Genomic Texts

The D parameter of the Kolmogorov–Smirnov statistic reflects the closeness of the data to the theoretical power-law distribution. We decided on a threshold of 0.05 as the limit below which distributions would be further considered as likely to be subject to power-law distributions. This threshold is presented in Figure 4.
As expected, none of the analyses involving the triplet tokenization method (S0TTAN, SNTTAN, S0TTAC, SNTTAC, SCTTAC) met the criterion of D < 0.05. The opposite is true in the case of frame tokenization. Here, almost all of the texts contextually analyzed met the requirement (60/60 of S0TFAN, S0TFAC and 58/60 of SNTFAC), and the majority of them analyzed at the nucleotide level (60/60 of S0TFAN, 33/60 SNTFAN). The most divergent situation was observed with contextual tokenization. Only 19 of 60 genomes translated into the seven-letter alphabet and contextually tokenized (S0TCAC) potentially followed the power law. This poor outcome was even worse for texts shuffled at the nucleotide level (4/60 of SNTCAC). However, this trend was completely reversed for genomes shuffled at the contextual level (60/60 of SCTCAC). It is clear that shuffling the seven-letter sequences at the contextual level improves their fit to the power-law distribution. For more details regarding the data that passed the K-S test, see the Supplementary Materials (Table S2).

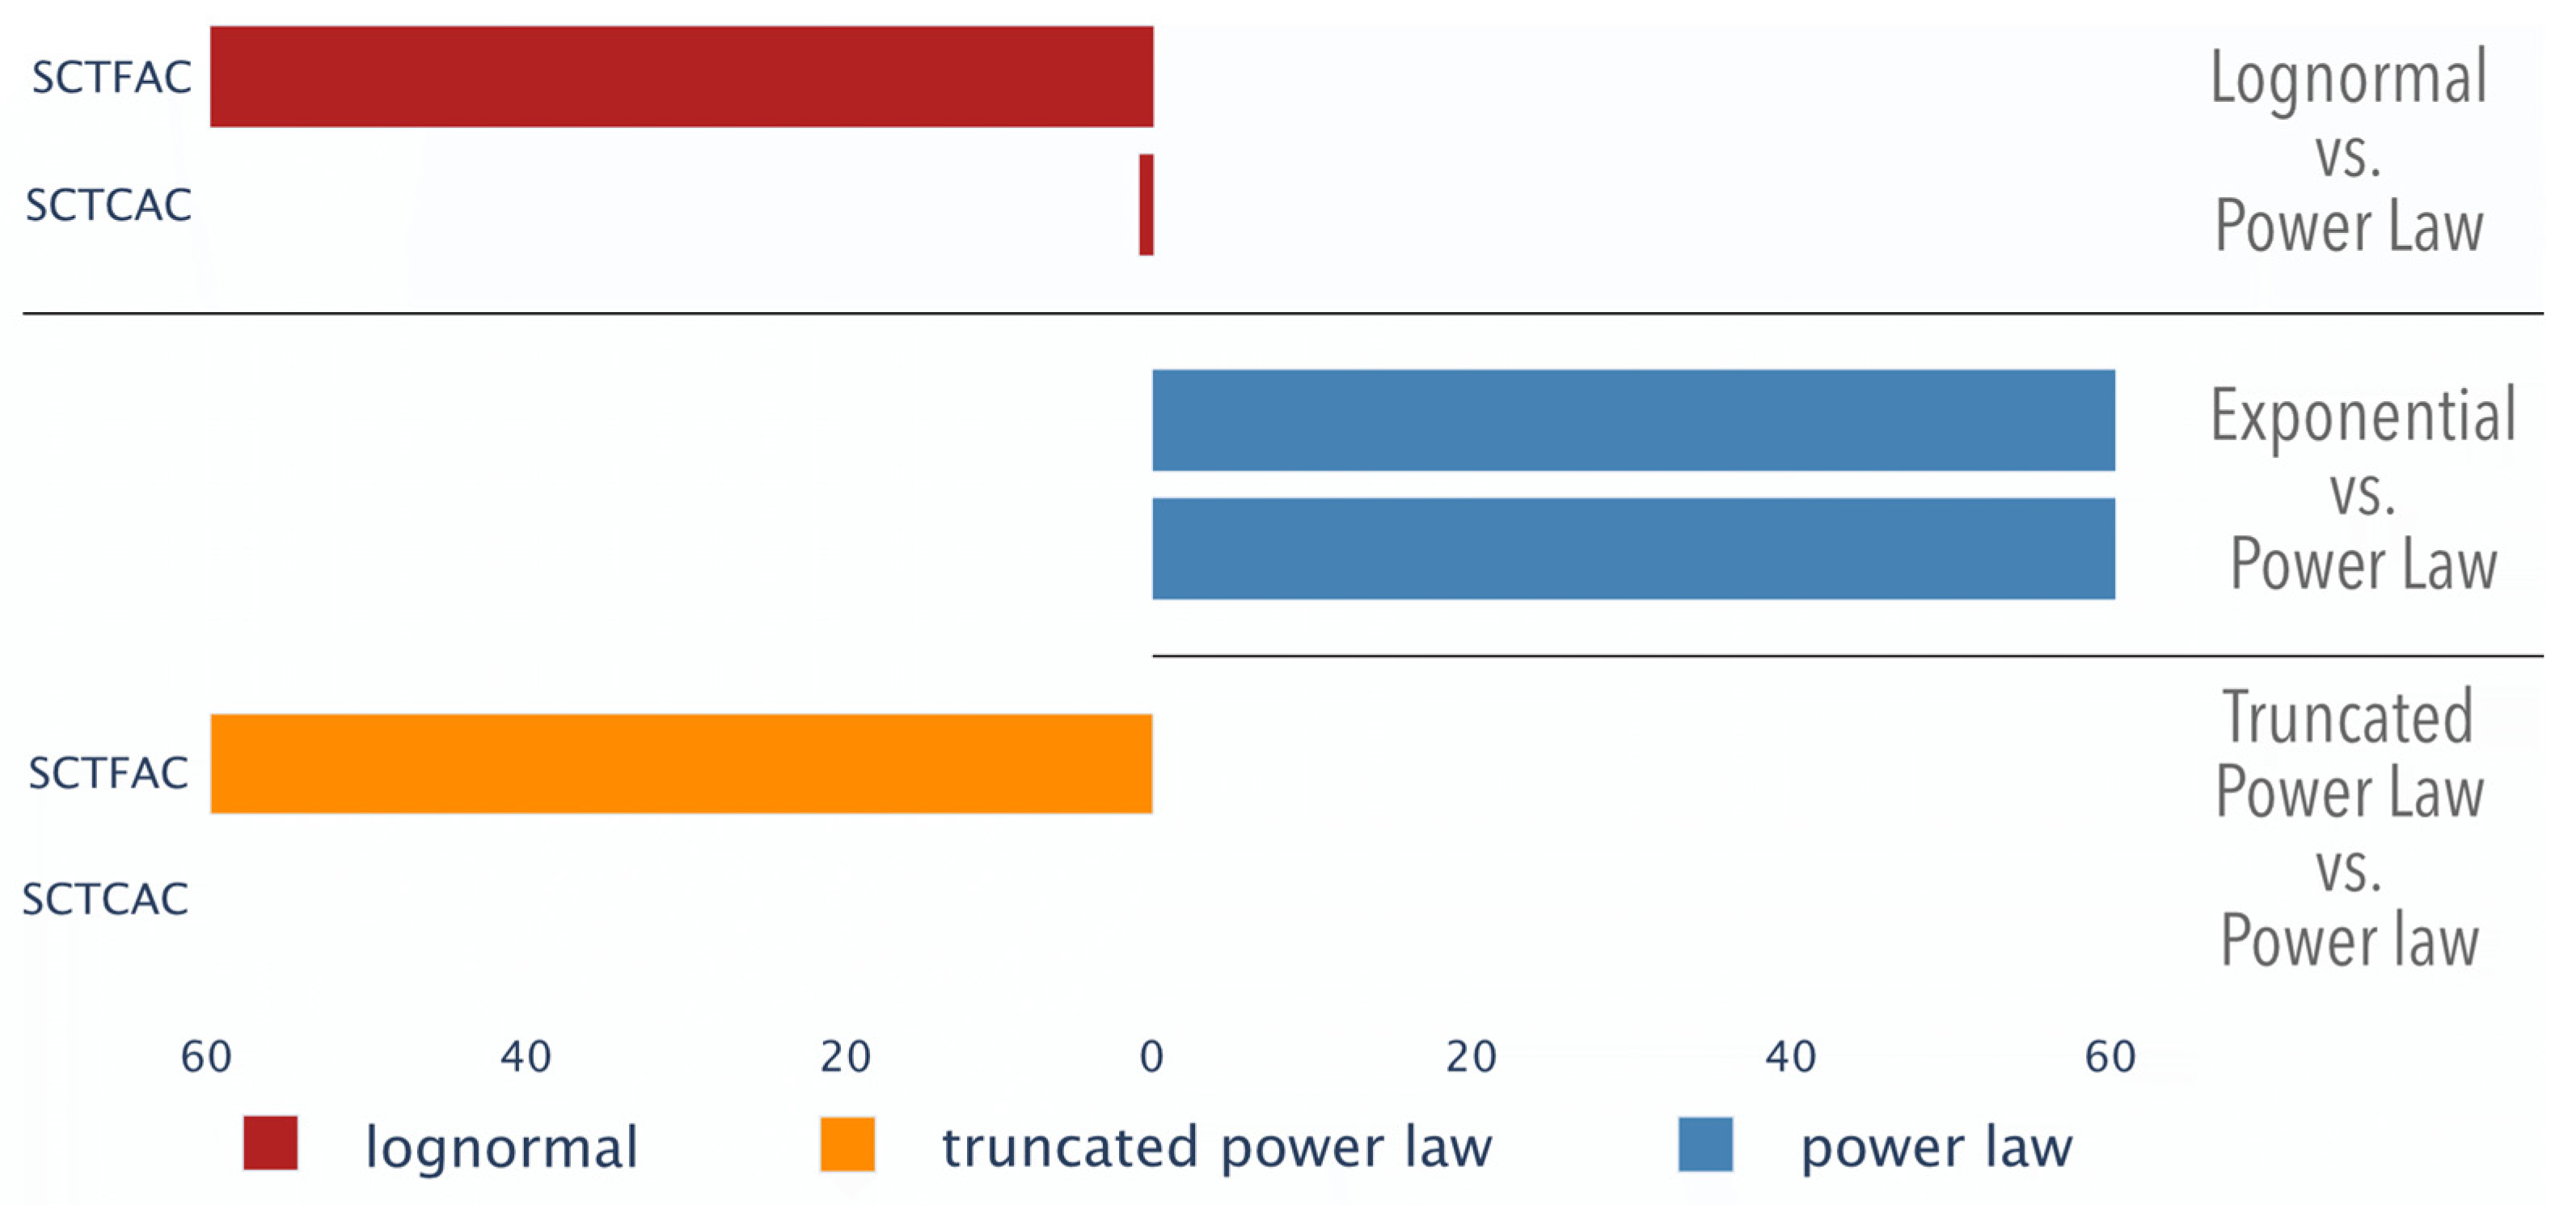
3.1.3. Distribution Comparison of Genomic Texts

Because there are many objections in the literature questioning the plausibility of the power-law distribution, additional tests were undertaken to compare the power-law distribution with its competitors. From all 780 analyses (60 genomes × 13 analysis types), only 354 passed the power-law requirements stated by the K-S test. These corpora were further compared to the lognormal, the exponential, and the truncated power-law distribution. Figure 5 represents the results of this pair-distribution comparison.
Comparing the power law vs. the lognormal distribution, we observed that the power law was not favored in any text, whereas the lognormal distribution was preferred in 55 cases (frame tokenization: 19 × S0TFAC, 17 × SCTFAC, 7 × SNTFAC, 6 × S0TFAN, 1 × SNTFAN, and contextual tokenization 5 × S0TCAC). The rest of the analyzed texts returned statistically irrelevant results. A much clearer situation was with the power law vs. the exponential test. Here, all 354 analyses that passed the K-S statistics exhibited the power law. The last case compares the power law with the truncated power law. The first of these two was not selected, whereas the truncated power law was favored in 313 of 354 cases (57 × S0TFAC, 57 × SCTFAC, 56 × S0TFAN, 53 × SNTFAC, 52 × SCTCAC, 31 × SNTFAN, 7 × S0TACA).
The statistical tools recommended in the literature for the power-law comparison were not entirely satisfying. Although it improved the K-S outcome by eliminating some analyses that went better with the logarithmic distribution, for the majority of texts the method did not provide us with statistically relevant results.

3.1.4. Hypothesis Testing

The main focus of our study is on contextual tokenization. Our hypothesis claims that if genomic texts are written in the seven-letter alphabet, where one of its characters provides the method of text tokenization, then genomes tokenized in that way (similarly to the natural languages) will follow the power-law distribution. Figure 6 shows the contextual analyses of all examined genomes.
The following results show the number of contextually analyzed texts that passed the K-S test and did not fall under an alternative (lognormal or exponential) distribution. Let us start with the original text without shuffling (S0TCAC). For 14 of 60 analyzed texts, the power-law distribution is not statistically excluded. The second approach, where the texts were first randomized at the nucleotide level and then translated into the seven-letter alphabet (SNTCAC), makes the situation much worse. The analyses both visually as well as statistically (four texts) receded further from the power-law distribution. However, the most interesting thing happened when the original texts were first translated into the seven-letter alphabet, then randomized and contextually tokenized (SCTCAC). Here, the graphs straighten, and the plots show clear similarity to the power-law distribution. Also, the statistical analysis points in that direction. According to the K-S statistics, all 60 genomes analyzed by the SCTCAC method passed the power-law test, and none of them manifested itself as a lognormal or exponential distribution in the comparative test. Yet, for full disclosure, neither did they indicate the power law in the power law–lognormal comparison.

3.2. Random Texts Analysis

The same procedures of visual examination and statistical analyses were applied for the examination of pseudo-genomic random texts.

3.2.1. Visual Examination of Random Texts

Figure 7 compiles graphs of all types of analyses for all ten random texts. The difference in the patterns between the genomes and randomly generated pseudo-genomes is evident. Almost all the plots represented in Figure 7 are stepped or somehow disrupted in comparison to Figure 3. Visual examination with high probability can rule out the power law in most cases, which is additionally confirmed by the statistical approach. The only unclear situation appears in the last cases of the frame (SCTFAC) and the contextual tokenization (SCTCAC). Nevertheless, even they do not show such a linear dependency as genomic texts. Still, these two types of analyses have been at the center of random texts’ statistical examination.

3.2.2. K-S Statistic of Random Texts

From 780 analyses (60 texts that underwent 13 types of analyses), only 120 met the statistical requirements that indicate the power law, that is SCTFAC (60) and SCTCAC (60), which is consistent with visual analysis. For more details, see the Supplementary Materials (Table S3).

3.2.3. Distribution Comparison of Random Texts

These 120 statistically significant analyses that passed the K-S examination were further scrutinized regarding the potential preference for the competitive distribution (Figure 8). In the comparison of the power law to the lognormal distribution, the latter was favored in all 60 cases of SCTFAC analyses and 1 case of SCTCAC. This means that the frame tokenization analyses of the artificial pseudo-genomes were closer to a lognormal distribution than to a power law. None of the texts seemed to favor the exponential distribution. Finally, in all 60 cases of SCTFAC, the power law should be regarded as truncated. Concerning contextual tokenization (SCTCAC), the comparison was inconclusive, neither confirming nor denying the power law.

3.3. Random vs. Genomic Texts

The examination carried out show a difference between genomic texts and artificially created pseudo-genomes. The genome corpora subjected to frame tokenization and the SCTCAC case of contextual tokenization seem to follow the power law. Meanwhile, the pseudo-genes exhibit this property only for SCTCAC. Therefore, the random pseudo-gene texts seemed to be resilient for frame tokenization and only the SCTCAC method of contextual tokenization with 100% corresponded to the power law for both genomic and pseudo-genomic texts. Taking into account this last method, we specified which distributions came closer to the ideal power-law dependency. In order to do that, we compared the D parameters of the K-S for both groups. As shown in Figure 9, the SCTCAC of genomic texts noticeably better reflected the power-law distribution than the random texts. However, the difference was not statistically significant.

3.4. Summary of Results

Table 3 contains the summary of evaluation. The empty cells show analyses that do not meet the threshold D ≤ 0.05. The “no” columns display the number of texts that pass the adopted K-S statistic threshold. D ¯ columns show their mean K-S statistic value. “Visual” represents the visual evaluation of the Zipf resemblance (Figure 3 and Figure 7). The percentage values represent the proportion of texts that prefer other distributions (lognormal, exponential, and truncated power law, respectively) in comparison to the power law. The final verdict summarizing all these factors is in the “PL fit” column. The best performance on the genomic side is found in the analyses S0TFAN, SCTFAC, and SCTCAC. On the random text side, only the frequency range of the SCTCAC texts resembles the power-law distribution.

4. Discussion

This study aimed to examine the consequences of the assumption that the seven-symbol code is used in the recording of genomic information. The authors assume that if it is true, then the frequency-range dependency of words derived by contextual tokenization would follow the power law. To verify this hypothesis, we juxtapose the contextual tokenization method with the other most commonly used forms of tokenization, i.e., triplet tokenization and frame tokenization. The hypothesis was tested on genomic texts of different species and random pseudo-genomic texts.
Our study yields several significant findings:
  • The frequency-range dependency of tokens generated via triplet tokenization consistently fails to follow a power-law distribution, suggesting that the conventional nucleotide sequence tokenization method is inadequate for representing semiotic information in genomic sequences.
  • The genomic corpora generated by frame tokenization in most cases followed the Zipf distribution, supporting the claim of hidden informational structures within genomic sequences.
  • The excellent power-law performance of shuffled contextual genomic texts (SCTCAC) corroborates our hypothesis that genomic sequences should be analyzed using a seven-character alphabet system.
  • The moderate performance of original contextual tokenization genomic corpora (S0TCAC) indicates notable differences between genomic texts and natural language structures.
  • Observed differences in word frequency distributions between random texts and genomes provide evidence that our findings regarding genomic sequences are not attributable to random chance.
  • These results collectively suggest that novel tokenization methods, particularly those employing a seven-character alphabet, may offer insightful approaches to analyzing the informational content of genomic sequences.

4.1. Triplet Tokenization Does Not Represent Semiotic Information

Triplet tokenization represents the conventional method of nucleotide sequence tokenization employed by biologists. We can think of it as the “negative control” in our experimental design, as it fails to capture the dimension of semiotic information postulated by our hypothesis. Both the visual representation of frequency-range distributions of triplet corpora and their statistical analysis conclusively rule out the possibility that texts created by codon tokenization follow a power-law distribution. Since the Zipf distribution of texts serves as a tool for detecting semiotic information, our analysis demonstrates that triplet tokenization methods fail to represent it at all.

4.2. Frame Tokenization Detects Semiotic Information

Frame tokenization serves as a “positive control” in our experiment. We posit that if genomes contain information encoded in a seven-symbol alphabet, frame tokenization should reveal it, thus validating our hypothesis. Indeed, the frequency-range distribution of genomic words created by the moving frame method exhibits a linear arrangement on a double logarithmic graph, consistent with Zipf’s law. This observation is supported by Kolmogorov–Smirnov statistics and comparative analyses of power-law distributions against alternatives. While frame tokenization does not elucidate the specific characteristics of this alternative genomic encoding, it demonstrates the capacity to detect its presence, lending credence to our hypothesis of hidden informational structures within genomic sequences.

4.3. Contextual Tokenization Represents Semiotic Information

The core of our study lies in a novel representation of genomic sequences through contextual analysis and tokenization. This method yields genomic words whose frequency distribution closely resembles that of natural languages. Specifically, the frequency-rank F(r) dependency of corpora produced by shuffled contextual tokenization (SCTCAC) exhibits a clear power-law tendency. This distribution demonstrates one of the highest quality-of-fit parameters for the power law, and SCTCAC texts do not favor alternative distributions over the power-law distribution in pairwise comparisons. This conformity supports our hypothesis that genomic sequences, despite being represented by four nucleotides, should be analyzed using a seven-character alphabet. In this system, meaningful information chunks (tokens) are delineated by the “any character” (“*”) symbol, with token length determined by context rather than being restricted to three-letter words. However, it is noteworthy that not all contextual tokenization analyses demonstrate such high performance. The relative failure of other contextual tokenization types (S0TCAC and SNTCAC) to produce similar results warrants further investigation and explanation.

4.4. Differences between Genomic and Natural Languages Texts

The original genomic texts subjected to contextual tokenization (S0TCAC) favor the power law in 23% of cases. When the translation to seven-letter characters is preceded by nucleotide shuffling, this result decreases to 7%. This behavior may be explained as follows. By introducing randomization on the nucleotide level (the four-letter alphabet), we are disturbing the original structure of genomic texts. To be more precise, we interfere with the nucleotides’ order and function in codons. As the additional letters in the contextual analysis are determined by the two preceding nucleotides, there is no sense in introducing these special characters after shuffling. The genetic information is lost, and translation to the seven-letter alphabet is thus entirely random. This explains the poor performance of the SNTCAC texts with respect to the power-law exhibition. The opposite is true when we shuffle texts that have been already contextually transformed. Here (SCTCAC), the additional letters like “any purine”, “any pyridine”, and “any nucleotide” are correctly introduced in texts, so their numbers, function, and statistical distribution remain unchanged. Now, shuffling only improves the power-law quality of the examined texts. According to our view, increasing the randomization of genomes makes them more language-like [30,31,32]. This is because we believe that language originates from random phonetic sequences that appear at first with an equal probability. For example, the sound “cow” was initially equally likely as “daf”. With time, the senseless sounds have acquired the meaning that gave birth to the language. The least-effort law governed the creation of these primitive languages ensuring optimal communication within them [20,21]. It aimed to minimize the entropy and simultaneously to maximize the transfer of information [33]. A similar process must have governed the emergence of the genetic language. The probable scenario is that the first nucleotide sequences were completely random [34,35,36]. In this “raw material”, the biological meaning has become embedded (the sequences have gained biological functions). When that happened, evolution came into play. Evolution in turn favored some sequences more and more, reusing them extensively, thereby causing a departure from the uniformly random distribution. It is no wonder that after billions of years, only a quarter of contextual tokenization genomes (S0TCAC) follow the power-law distribution. However, shuffling these texts (SCTCAC) smooths evolutionarily driven irregularities and draws corpora closer to their original proto-language state. The power law of contextual texts is restored.
Following this logic nevertheless raises some questions. If the random texts are more likely to follow the power law, why has this presumption not worked out for pseudo-genomes? One of the possible answers may lay in text complexity. The pseudo-genome texts, contrary to linguistically analyzed texts, are based on the four-letter alphabet. As such, they may be too rudimentary to mimic the complex structure of language. This could be a reason why random pseudo-genomes failed to exhibit Zipf’s distribution to the same extent as previously examined random texts did.
The strength of the presented study lay in the conceptual value of the proposed hypothesis. The greatest changes in science have often not been performed by simple observation, but by a paradigm shift that experiments provoke. We are not inventing any new paradigm, only helping to realize the present one. The fact that genomes have a semiotic dimension is, after all, nothing new. The genetic code reminds us of it on a daily basis. One step further is that this semiotic system is language-like. As such, it is dual (a two-level system structure, double articulation), where a small number of meaningless elements (cenemes) create a broad spectrum of meaningful words (plerems) [37,38,39]. The grammatical rules allowing for different combinations of morphemes enrich the information capacity of the language. Our hypothesis may describe a very rudimentary example of this phenomenon. On the material basis, we have only four nucleotides; however, these bases depending on the contextual rule may have double or even triple functions on the semiotic level. These extra signs (extending the initial alphabet to seven symbols) are responsible for creating a variety of meaningful chunks of information (words’ formation). This phenomenon can be envisioned as part of the broader conception of code biology introduced by Barbieri, which posits that there is not just one genetic code, but rather multiple codes operating at various levels of biological organization, each crucial for carrying meaningful information [40,41].

4.5. Comparative Analysis of Random Texts and Genomes

There is always a suspicion that the obtained resultsmay merely be artifacts of the text manipulation method employed. It is known from the very long time that the random text reproduce Zipf’s law [42,43,44]. In fact, it was the main reason for questioning the relevance and utility of the power law in linguistic studies [45,46]. Later research showed that the allevations were not well-grounded., the powerlaw returned the favor [47,48]. Still, the question remains: how are pseudogenes different from previously examined genomic texts? To address this concern, the same analyses were conducted on random texts designed to mimic genomes. The observed differences between these random texts and actual genomic sequences provide strong evidence for the authenticity of our findings. The frequency-rank distribution F(r) of random texts (Figure 7) exhibits notable differences from that of genomic words (Figure 3). While genomic distributions present a smooth curve, random texts display distinct step-like patterns. Furthermore, only 15% of random texts demonstrated sufficient quality parameters to be considered as potentially following a power-law distribution. Further statistical analysis revealed that approximately half of these cases (in-frame tokenization) had to be excluded because they actually conform to a lognormal distribution. Among all of the random texts, only SCTCAC showed a semblance of power-law behavior. However, closer examination (Figure 9) reveals subtle yet consistent differences between genomic and random texts. In summary, genomes and random texts show different characteristics, and the distribution of their word frequencies is not the same. Therefore, we can conclude that the results of this study are not artifacts of the methods used to perform analyses on the texts.

4.6. Possible Practical Applications

The presented hypothesis touches on the very foundation of biology and, therefore, may have profound consequences for biological studies. The seven-symbol approach may reshape genetic text analysis, deeply influencing bioinformatics, biophysics, systems biology, and, more broadly, a substantial part of biological science. Several potential applications are envisioned below.
Firstly, the method introduced in this study could be used to characterize genomic sequences. For instance, our results indicate that the frequency-range distribution of genomes significantly differs from that of pseudo-genomes constructed from random text. This difference could potentially be quantified to develop a “randomness” scale. Estimating the degree of similarity between a sequence and random text may provide valuable insights into the amount of potentially useful information it carries, and thus its functionality and importance. While this study focused on coding sequences (CDSs), it is plausible that analyses of other genomic features such as introns, untranslated regions (UTRs), promoters, and others may yield distinct results. These differences could potentially serve as a tool for the initial classification of unknown sequences, guiding researchers towards their putative functions and characteristics.
In the realm of bioinformatics and genomic data management, the proposed seven-symbol alphabet (A, T, C, G, X, Y, “*”) could streamline genome analysis by reducing sequence data complexity while preserving its functional significance. This codon compression approach could prove particularly beneficial for large-scale comparative genomics studies. Moreover, it might enhance the performance and accuracy of sequence alignment algorithms, especially for distantly related sequences, and could lead to the more efficient compression and storage of genomic data. Consequently, the development of novel bioinformatics tools and algorithms designed to work with this simplified representation of genetic information would be possible.
The rapidly evolving field of pattern recognition and artificial intelligence in genomic studies could also benefit from this method. The extended alphabet could potentially improve the performance of machine-learning algorithms in genomics. For instance, capturing essential information about amino acid properties (hidden in code degeneracy) might enhance predictions of protein structure and function from genomic sequences. Furthermore, this genomic representation might reveal patterns or motifs in genomic sequences that are not easily detectable in the standard four-letter code.
In evolutionary studies, the seven-symbol representation of genomic information could provide novel insights into phylogenetic relationships by focusing on more fundamental aspects of sequence conservation. This approach could be particularly valuable for analyzing highly divergent sequences, where traditional methods may be less effective. On a more fundamental level, this simplified representation might offer new perspectives on the evolution of the genetic code and the underlying principles of its organization. Finally, should the seven-symbol code representation prove useful, its implementation would need to be considered in synthetic biology, potentially leading to the design of artificial genetic systems with reduced complexity but retained functionality.
Importantly, demonstrating the links between linguistic and genomic analysis, as presented in this proposition, could renew interest in alternative approaches to genome examination, such as linguistic genomics, and foster further exchange of ideas and methodologies between these fields.

5. Conclusions

Our study proposes a new type of analysis (contextual analysis) within the linguistic approach to genome study. Its basic assumptions are as follows. There are seven characters in the genomic alphabet (A, T, C, G, purine, pyrimidine, any nucleotide). The same nucleotide can turn into multiple symbols, e.g., “A” may play the role of “purine” as well as the “any nucleotide” symbol depending on the context. The “any nucleotide” character plays a similar role as white space in natural languages and provides natural ways of tokenization. Contextual analysis proved to be superior to alternative methods in creating corpora that follow the power-law distribution, which confirms the validity of the extended genetic alphabet proposed in this study.

Supplementary Materials

The following supporting information can be downloaded at https://www.mdpi.com/article/10.3390/app14209176/s1, Figure S1: The taxonomy of organisms used in the study; Table S1: Genome assembly used in the study; Figure S2: Comparison of different text lengths; Table S2: Additional information regarding genomic texts that met the KS statistic criteria D < 0.05; Figure S3: Frequency-rank plots for all studied organisms; Table S3: Additional information regarding random texts that met the KS statistic criteria D < 0.05.

Author Contributions

Conceptualization, A.K., P.M.P. and K.B.; methodology, A.K., P.M.P. and K.B.; validation, A.K. and P.M.P.; formal analysis, A.K.; investigation, A.K.; resources, A.K.; data curation, A.K.; writing—original draft preparation, A.K.; writing—review and editing, P.M.P.; visualization, A.K.; supervision, P.M.P.; project administration, P.M.P. All authors have read and agreed to the published version of the manuscript.

Funding

This research received no external funding.

Institutional Review Board Statement

Not applicable.

Informed Consent Statement

Not applicable.

Data Availability Statement

Data are accessible through the NCBI databank. For more information, see Supplementary Materials Table S1: Genome assemblies used in the study.

Conflicts of Interest

The authors declare no conflicts of interest.

References

  1. Chapman, S.; Watkins, N. Avalanching and Self Organised Criticality, a paradigm for geomagnetic activity? Space Sci. Rev. 2001, 95, 293–307. [Google Scholar] [CrossRef]
  2. Manor, A.; Shnerb, N.M. Multiplicative noise and second order phase transitions. Phys. Rev. Lett. 2009, 103, 030601. [Google Scholar] [CrossRef] [PubMed]
  3. Landini, G. Evidence of linguistic structure in the Voynich manuscript using spectral analysis. Cryptologia 2001, 25, 275–295. [Google Scholar] [CrossRef]
  4. Smith, R. Investigation of the Zipf-plot of the extinct Meroitic language. arXiv 2008, arXiv:0808.2904. [Google Scholar]
  5. Ferrer-I-Cancho, R.; Elvevåg, B. Random texts do not exhibit the real ZIPF’s Law-Like rank distribution. PLoS ONE 2010, 5, e9411. [Google Scholar] [CrossRef]
  6. Gustafson, K.B.; Proctor, J.L. Identifying spatio-temporal dynamics of Ebola in Sierra Leone using virus genomes. J. R. Soc. Interface 2017, 14, 20170583. [Google Scholar] [CrossRef]
  7. Klaus, A.; Yu, S.; Plenz, D. Statistical analyses support power law distributions found in neuronal avalanches. PLoS ONE 2011, 6, e19779. [Google Scholar] [CrossRef] [PubMed]
  8. Lopes, A.M.; Machado, J.A.T. Power law behaviour in complex systems. Entropy 2018, 20, 671. [Google Scholar] [CrossRef]
  9. Huynen, M.A.; van Nimwegen, E. The frequency distribution of gene family sizes in complete genomes. Mol. Biol. Evol. 1998, 15, 583–589. [Google Scholar] [CrossRef]
  10. Guo, Z.; Jiang, W.; Lages, N.; Borcherds, W.; Wang, D. Relationship between gene duplicability and diversifiability in the topology of biochemical networks. BMC Genom. 2014, 15, 577. [Google Scholar] [CrossRef]
  11. Baek, S.K.; Bernhardsson, S.; Minnhagen, P. Zipf’s law unzipped. New J. Phys. 2011, 13, 043004. [Google Scholar] [CrossRef]
  12. Jung, H.C.; Kim, S.H.; Lee, J.H.; Kim, J.H.; Han, S.W. Gene Regulatory Network Analysis for Triple-Negative Breast neoplasms by using gene expression data. J. Breast Cancer 2017, 20, 240. [Google Scholar] [CrossRef]
  13. Hansen, M.E.B.; Kulathinal, R.J. Sex-Biased networks and nodes of sexually antagonistic conflict in Drosophila. Int. J. Evol. Biol. 2013, 2013, 1–7. [Google Scholar] [CrossRef] [PubMed]
  14. Bornholdt, S.; Kauffman, S. Ensembles, dynamics, and cell types: Revisiting the statistical mechanics perspective on cellular regulation. J. Theor. Biol. 2019, 467, 15–22. [Google Scholar] [CrossRef] [PubMed]
  15. Kalankesh, L.R.; Stevens, R.; Brass, A. The language of gene ontology: A Zipf’s law analysis. BMC Bioinform. 2012, 13, 127. [Google Scholar] [CrossRef]
  16. Monod, J. Chance and Necessity; Vintage Books: New York, NY, USA, 1971. [Google Scholar]
  17. Pollack, R. Signs of Life: The Language and Meanings of DNA; Penguin: Harmondsworth, UK, 1995. [Google Scholar]
  18. Ratner, V.A. The genetic language: Grammar, semantics, evolution. Genetika 1993, 29, 709–719. [Google Scholar]
  19. Yandell, M.D.; Majoros, W.H. Genomics and natural language processing. Nat. Rev. Genet. 2002, 3, 601–610. [Google Scholar] [CrossRef]
  20. Zipf, K.G. Human Behavior and the Principle of Least Effort: An Introduction to Human Ecology; Addison-Wesley Press: New York, NY, USA, 1949. [Google Scholar]
  21. Cancho, R.F.I.; Solé, R.V. Least effort and the origins of scaling in human language. Proc. Natl. Acad. Sci. USA 2003, 100, 788–791. [Google Scholar] [CrossRef]
  22. Mantegna, R.N.; Buldyrev, S.V.; Goldberger, A.L.; Havlin, S.; Peng, C.K.; Simons, M.; Stanley, H.E. Linguistic features of noncoding DNA sequences. Phys. Rev. Lett. 1994, 73, 3169–3172. [Google Scholar] [CrossRef]
  23. Czirók, A.; Stanley, H.E.; Vicsek, T. Possible origin of power-law behavior inn-tuple Zipf analysis. Phys. Rev. E 1996, 53, 6371–6375. [Google Scholar] [CrossRef]
  24. Gan, X.; Wang, D.; Han, Z. N-Tuple ZIPF analysis and modeling for language, computer program and DNA. arXiv 2009. [Google Scholar] [CrossRef]
  25. Tsonis, A.A.; Elsner, J.B.; Tsonis, P.A. Is DNA a language? J. Theor. Biol. 1997, 184, 25–29. [Google Scholar] [CrossRef] [PubMed]
  26. Naranan, S.; Balasubrahmanyan, V.K. Information Theory and Algorithmic Complexity: Applications to linguistic discourses and DNA sequences as complex systems Part I: Efficiency of the genetic code of DNA. J. Quant. Linguist. 2000, 7, 129–151. [Google Scholar] [CrossRef]
  27. Malevergne, Y.; Pisarenko, V.; Sornette, D. Gibrat’s Law for Cities: Uniformly most powerful unbiased test of the pareto against the lognormal. SSRN Electron. J. 2009, 09-40. [Google Scholar] [CrossRef]
  28. Clauset, A.; Shalizi, C.R.; Newman, M.E.J. Power-Law distributions in empirical data. SIAM Rev. 2009, 51, 661–703. [Google Scholar] [CrossRef]
  29. Alstott, J.; Bullmore, E.; Plenz, D. powerlaw: A Python Package for Analysis of Heavy-Tailed Distributions. PLoS ONE 2014, 9, e85777. [Google Scholar] [CrossRef]
  30. De Boer, B. Self-organization in vowel systems. J. Phon. 2000, 28, 441–465. [Google Scholar] [CrossRef]
  31. DeGiuli, E. Random Language Model. Phys. Rev. Lett. 2019, 122, 128301. [Google Scholar] [CrossRef]
  32. Ke, J.; Holland, J.H. Language Origin from an Emergentist Perspective. Appl. Linguist. 2006, 27, 691–716. [Google Scholar] [CrossRef]
  33. Grzybek, P.; Köhler, R. Exact Methods in the Study of Language and Text; De Gruyter Mouton: Berlin, Germany, 2007. [Google Scholar] [CrossRef]
  34. Eigen, M. Selforganization of matter and the evolution of biological macromolecules. Sci. Nat. 1971, 58, 465–523. [Google Scholar] [CrossRef]
  35. Eigen, M.; Schuster, P. The Hypercycle: A Principle of Natural Self-Organization; Springer: Berlin/Heidelberg, Germany, 1979. [Google Scholar]
  36. Joyce, G.F. RNA evolution and the origins of life. Nature 1989, 338, 217–224. [Google Scholar] [CrossRef] [PubMed]
  37. Hockett, C. The problem of universals in language. In Universals of Language; Greenberg, J.H., Ed.; MIT Press: Cambridge, MA, USA, 1963; pp. 1–29. [Google Scholar]
  38. Milewski, T. Jezykoznawstwo; Panstwowe Wydawnictwo Naukowe: Warsaw, Poland, 1967. [Google Scholar]
  39. Martinet, A. Double articulation as a criterion of linguisticity. Lang. Sci. 1984, 6, 31–38. [Google Scholar] [CrossRef]
  40. Barbieri, M. The Organic Codes: An Introduction to Semantic Biology; Cambridge University Press: Cambridge, UK, 2003. [Google Scholar]
  41. Barbieri, M. Code Biology: A New Science of Life; Springer International Publishing: Berlin/Heidelberg, Germany, 2015. [Google Scholar] [CrossRef]
  42. Miller, G.A.; Newman, E.; Friedman, E. Some effects of intermittent silence. Am. J. Psychol. 1957, 70, 311–314. [Google Scholar] [CrossRef] [PubMed]
  43. Mandelbrot, B. Information Theory and Psycholinguistics; Oldfield, R.C., Marchall, J.C., Eds.; Penguin Books: Harmondsworth, UK, 1968. [Google Scholar]
  44. Li, W. Random texts exhibit Zipf’s-law-like word frequency distribution. IEEE Trans. Inf. Theory 1992, 38, 1842–1845. Available online: http://sfi-edu.s3.amazonaws.com/sfi-edu/production/uploads/sfi-com/dev/uploads/filer/a5/07/a507be1c-7232-422b-8657-d24dcf24a35d/91-03-016.pdf (accessed on 1 August 2024). [CrossRef]
  45. Rapoport, A. Zipf’s law re-visited. Quant. Linguist. 1982, 16, 1–28. [Google Scholar]
  46. Wolfram, S. A New Kind of Science; Wolfram Media: Champaign, IL, USA, 2002. [Google Scholar]
  47. Ferrer-I-Cancho, R.; Forns, N.; Hernández-Fernández, A.; Bel-Enguix, G.; Baixeries, J. The challenges of statistical patterns of language: The case of Menzerath’s law in genomes. Complexity 2012, 18, 11–17. [Google Scholar] [CrossRef]
  48. Piantadosi, S.T. Zipf’s word frequency law in natural language: A critical review and future directions. Psychon. Bull. Rev. 2014, 21, 1112–1130. [Google Scholar] [CrossRef]
Figure 3. The analyses of the 3 Mbp CDS fragments of Drosophila melanogaster genome. The upper part of the figure shows analyses of texts written in 4-nucleotide characters, whereas the bottom part examines the same texts expressed in the 7-symbol manner. The nucleotide analysis contains the triplet and frame tokenization methods, while the contextual analysis provides the additional method of tokenization. Tokenization methods occupy columns, whereas rows separate the non-randomized texts from shuffled on the nucleotide or the contextual level. The graphs represent the F(r) relation of genomic words in double logarithmic diagrams.
Applsci 14 09176 g003
Figure 4. The Kolmogorov–Smirnov statistical test of genomes. The x-axis shows the type of analysis (shortcut explanation in Table 2) and the y-axis the normalized distribution of the D parameters for all (60) texts. The box shows the quartiles of the dataset, and the whiskers extend for the rest of the distribution.
Applsci 14 09176 g004
Figure 5. The distribution comparison of the genomic texts. The graphs represent the summary of three pair-distribution comparisons. The upper part of the figure shows the power law vs. the lognormal test, the middle part the power law vs. the exponential test, and the lower section the power law vs. the truncated power law. The horizontal bars represent the number of analyzed texts that favor the particular distribution (i.e., texts with a statistically significant log-likelihood ratio score), and the colors of that bars are assigned accordingly: red indicates the lognormal distribution, blue the power-law distribution, and orange the truncated power-law distribution. The graphs should be read in the following manner: select the desire pair-distribution comparison (from the right bar) and within it the method analysis (from the left bar). The horizontal bars in the same row show the results. The blue bar expanding on the right side shows texts that favor the power law, whereas the bars in other colors expanding on the left represent texts that favor the competitive distribution. The lack of the analysis type, or the absence of the bar within a row, means that none of the text passed the K-S test, or there were no texts that favored this particular distribution.
Applsci 14 09176 g005
Figure 6. The comparison of contextually tokenized genomic text. The log–log representation of F(r) determinacy of all 60 examined genomic texts undergoing contextual analysis. The plot on the left contains non-shuffled contextually analyzed texts. The second plot shows the clear disturbance caused by shuffling at the nucleotide level (SNTCAC). Randomization at the contextual level (SCTCAC) flattens the plots (the graph on the right). The last method of analysis delivers the results that resemble the power-law distribution with the highest accuracy.
Applsci 14 09176 g006
Figure 7. The random text analyses. The graphs in the double logarithmic diagram show the F(r) dependency of words derived from the 60 randomly generated pseudo-genomic texts. Except for the triplet tokenization cases, the close similarity of the output data results in plots overlapping. The analyses are sorted in the same manner as in Figure 3.
Applsci 14 09176 g007
Figure 8. The distribution comparison of random texts. The results are presented similarly to Figure 5; see Figure 5 for a more detailed description.
Applsci 14 09176 g008
Figure 9. The comparison of the K-S test for SCTCAC analysis of genomic and random texts. D marks the distance parameter of the K-S test.
Applsci 14 09176 g009
Table 1. Interpretation of the standard genetic code used as a matrix for the contextual analysis of genomes. Symbol explanation: “*” = {A, G, C, T}; “X” = {C, T} (pyrimidine); “Y” = {A, G} (purine) [26].
Codon SetAmino AcidCodon SetAmino Acid
AC *ThreonineAAXAsparagine
CC *ProlineCAXHistidine
GC *AlanineGAXAspartic acid
GG *GlycineTGXCysteine
GT *ValineTTXPhenylalanine
CG *ArginineAGXSerine
CT *LeucineATXIsoleucine
UC *SerineTAXTyrosine
AAYLysineATGMethionine
CAYGlutamineTGGTryptophan
GAYGlutamic acidATAIsoleucine
AGYArginineTGAStop
TTYLeucine
TAYStop
Table 2. Explanation of methods used for text analyses sorted according to the type of analyses and tokenization modes.
ShuffleTokenizationAlphabet
STA
0non-shuffledTtripletNnucleotide
Nshuffled
nucleotides
FframeCcontextual
Cshuffled
contextually
Ccontextual
Nucleotide analysis:
(A) triplet tokenization
S0TTAN—the original (non-shuffled) text tokenized by triplet tokenization and analyzed at the nucleotide level
SNTTAN—the shuffled text tokenized by triplet tokenization and analyzed at the nucleotide level
(B) frame tokenization
S0TFAN—the original text tokenized via frame tokenization and analyzed at the nucleotide level
SNTFAN—the text shuffled on the nucleotide level, then tokenized with the frame method and analyzed at the nucleotide level
Contextual analysis:
(A) triplet tokenization
S0TTAC—the original text tokenized according to triplet tokenization and contextually analyzed
SNTTAC—the text shuffled at the nucleotide level, then translated into the 7-letter alphabet and tokenized by triplet tokenization
SCTTAC—the text contextually analyzed (using the 7-letter alphabet), then shuffled and subjected to triplet tokenization
(B) frame tokenization
S0TFAC—the non-shuffled text translated into the 7-letter alphabet and then tokenized by the frame method
SNTFAC—the original (using the 4-letter alphabet) text shuffled at the nucleotide level; next contextually analyzed (using the 7-letter alphabet) and then tokenized by the frame method
SCTFAC—the text contextually analyzed (the 7-letter alphabet) and then shuffled, tokenized by the frame method
(C) contextual tokenization
S0TCAC—the original text contextually analyzed (using the 7-letter alphabet) and tokenized (by the “any nucleotide” character)
SNTCAC—the original text shuffled at the nucleotide level, then contextually analyzed (using the 7-letter alphabet) and contextually tokenized
SCTCAC—the text contextually analyzed (using the 7-letter alphabet), then shuffled and contextually tokenized
Table 3. Comparison of goodness-of-fit for power-law frequency-rank distributions in random and genomic texts with D ≤ 0.05.
Random Texts Genomes
PL Fit%
PT
%
EXP
%
LN
Visual D ¯ NoAnalysisNo D ¯ Visual%
LN
%
EXP
%
PT
PL Fit
--------------0/60S0TTAN0/60--------------
--------------0/60SNTTAN0/60--------------
--------------0/60S0TTAC0/60--------------
--------------0/60SNTTAC0/60--------------
--------------0/60SCTTAC0/60--------------
----------+---0/60S0TFAN60/600.008 ± 0.003+++10%0%100%+++
----------+---0/60SNTFAN33/600.019 ± 0.014++3%0%94%+
----------++---0/60S0TFAC60/600.013 ± 0.004+++32%0%100%++
----------++---0/60SNTFAC58/600.022 ± 0.010++12%0%100%+
-100%0%100%+++0.017 ± 0.00060/60SCTFAC60/600.008 ± 0.004+++28%0%100%+++
----------+---0/60S0TCAC19/600.038 ± 0.010+26%0%5%+
----------+/−---0/60SNTCAC4/600.029 ± 0.011+/-0%0%0%-
++0%0%2%+++0.020 ± 0.00260/60SCTCAC60/600.012 ± 0.003+++0%0%88%+++
Disclaimer/Publisher’s Note: The statements, opinions and data contained in all publications are solely those of the individual author(s) and contributor(s) and not of MDPI and/or the editor(s). MDPI and/or the editor(s) disclaim responsibility for any injury to people or property resulting from any ideas, methods, instructions or products referred to in the content.

