

Train-Induced Unsteady Airflow in a Metro Tunnel with a Ventilation Shaft


Abstract
:1. Introduction
2. Theoretical Analysis
2.1. The Premise of Theoretical Analysis
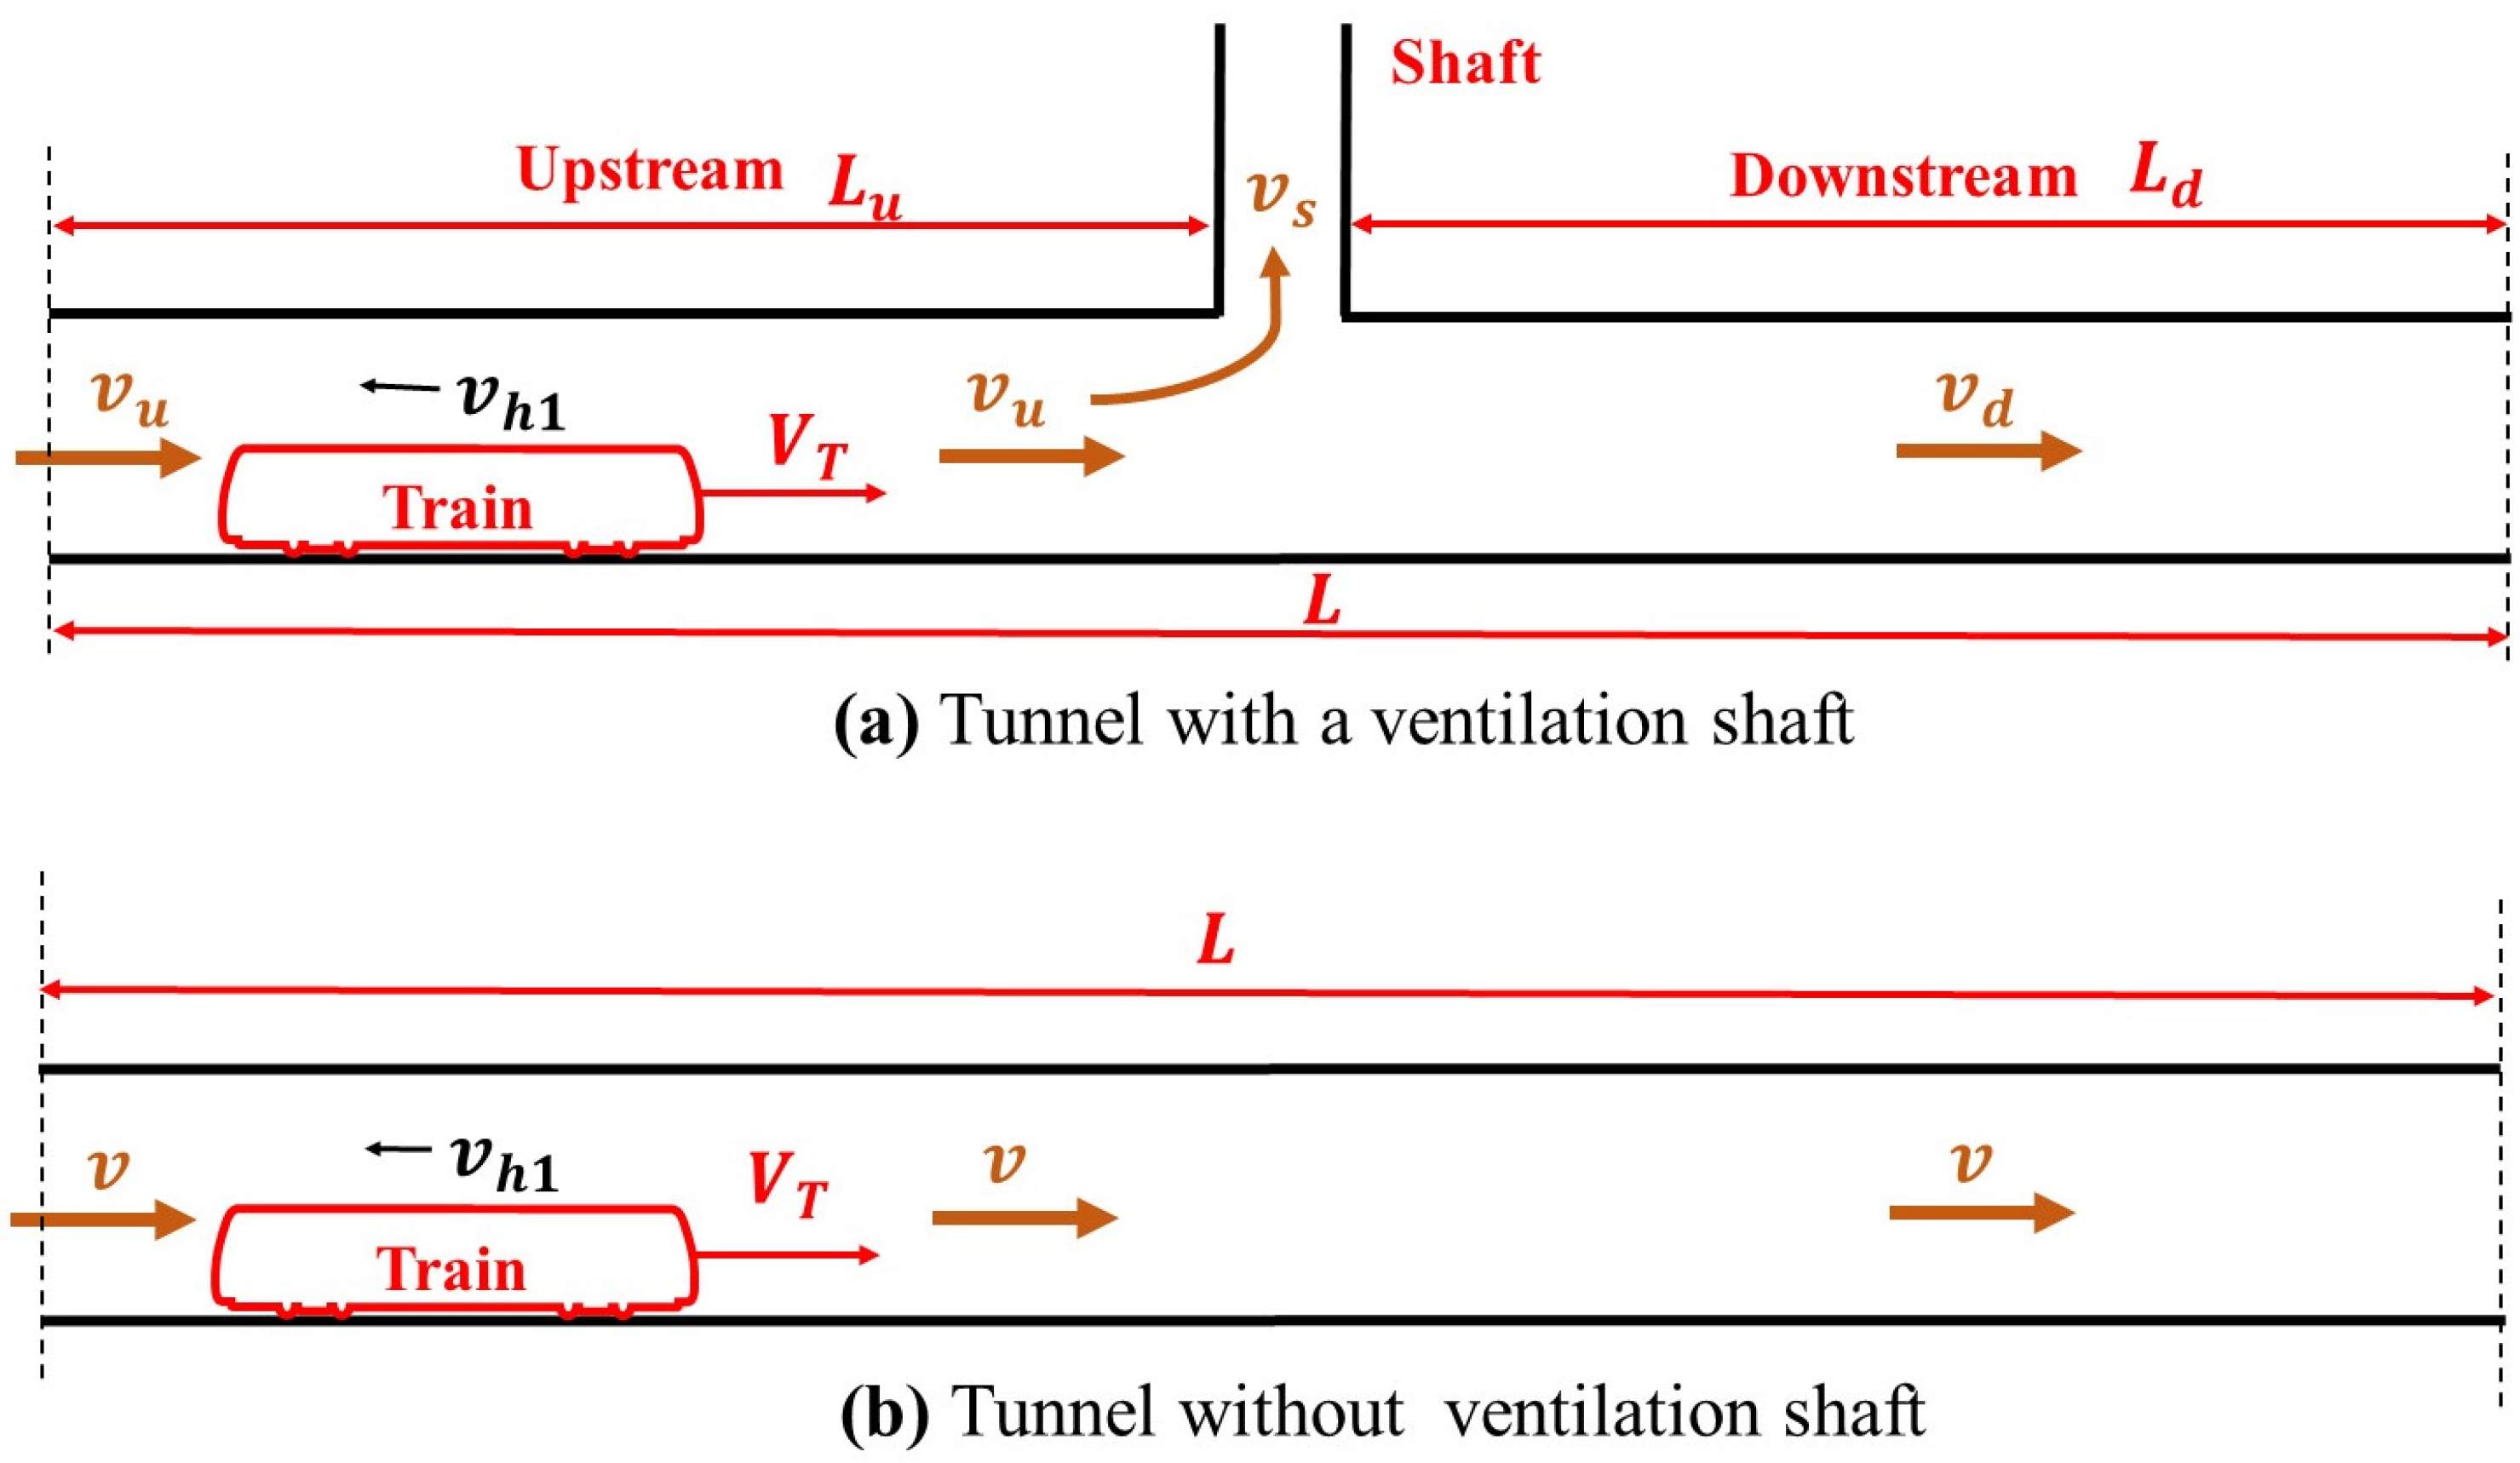
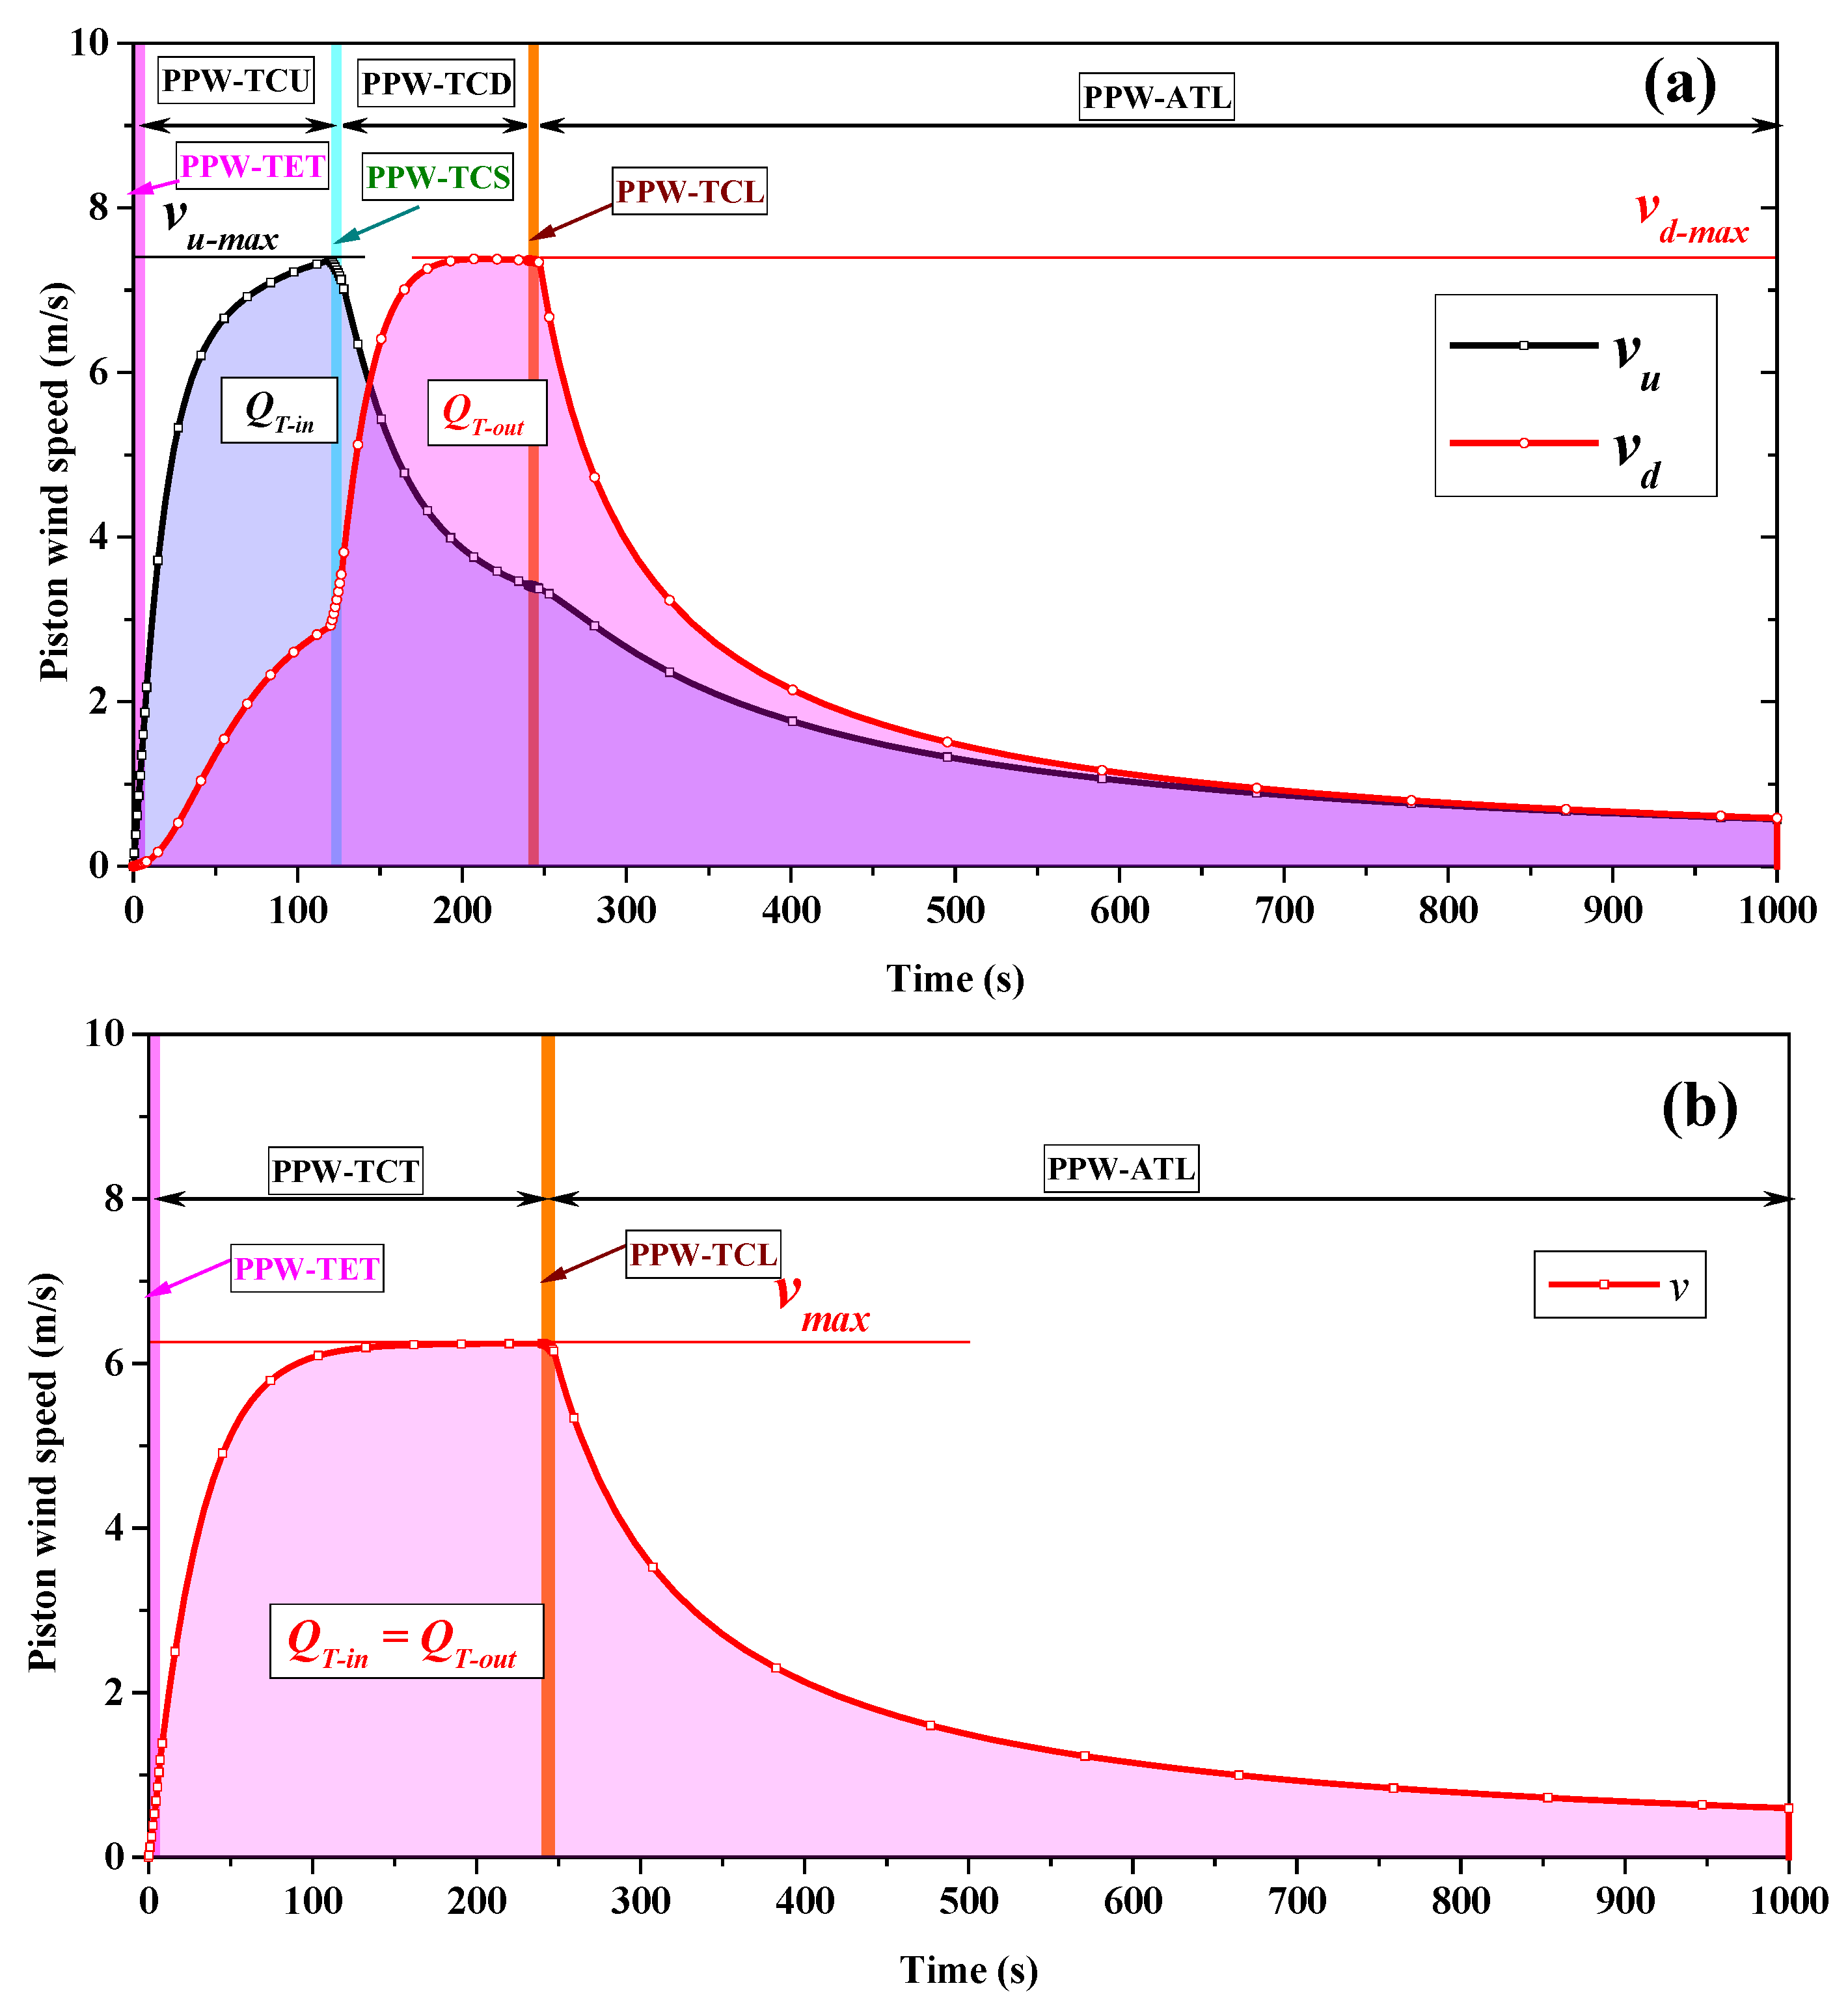
2.2. PW-WVS
2.2.1. PPW-TET
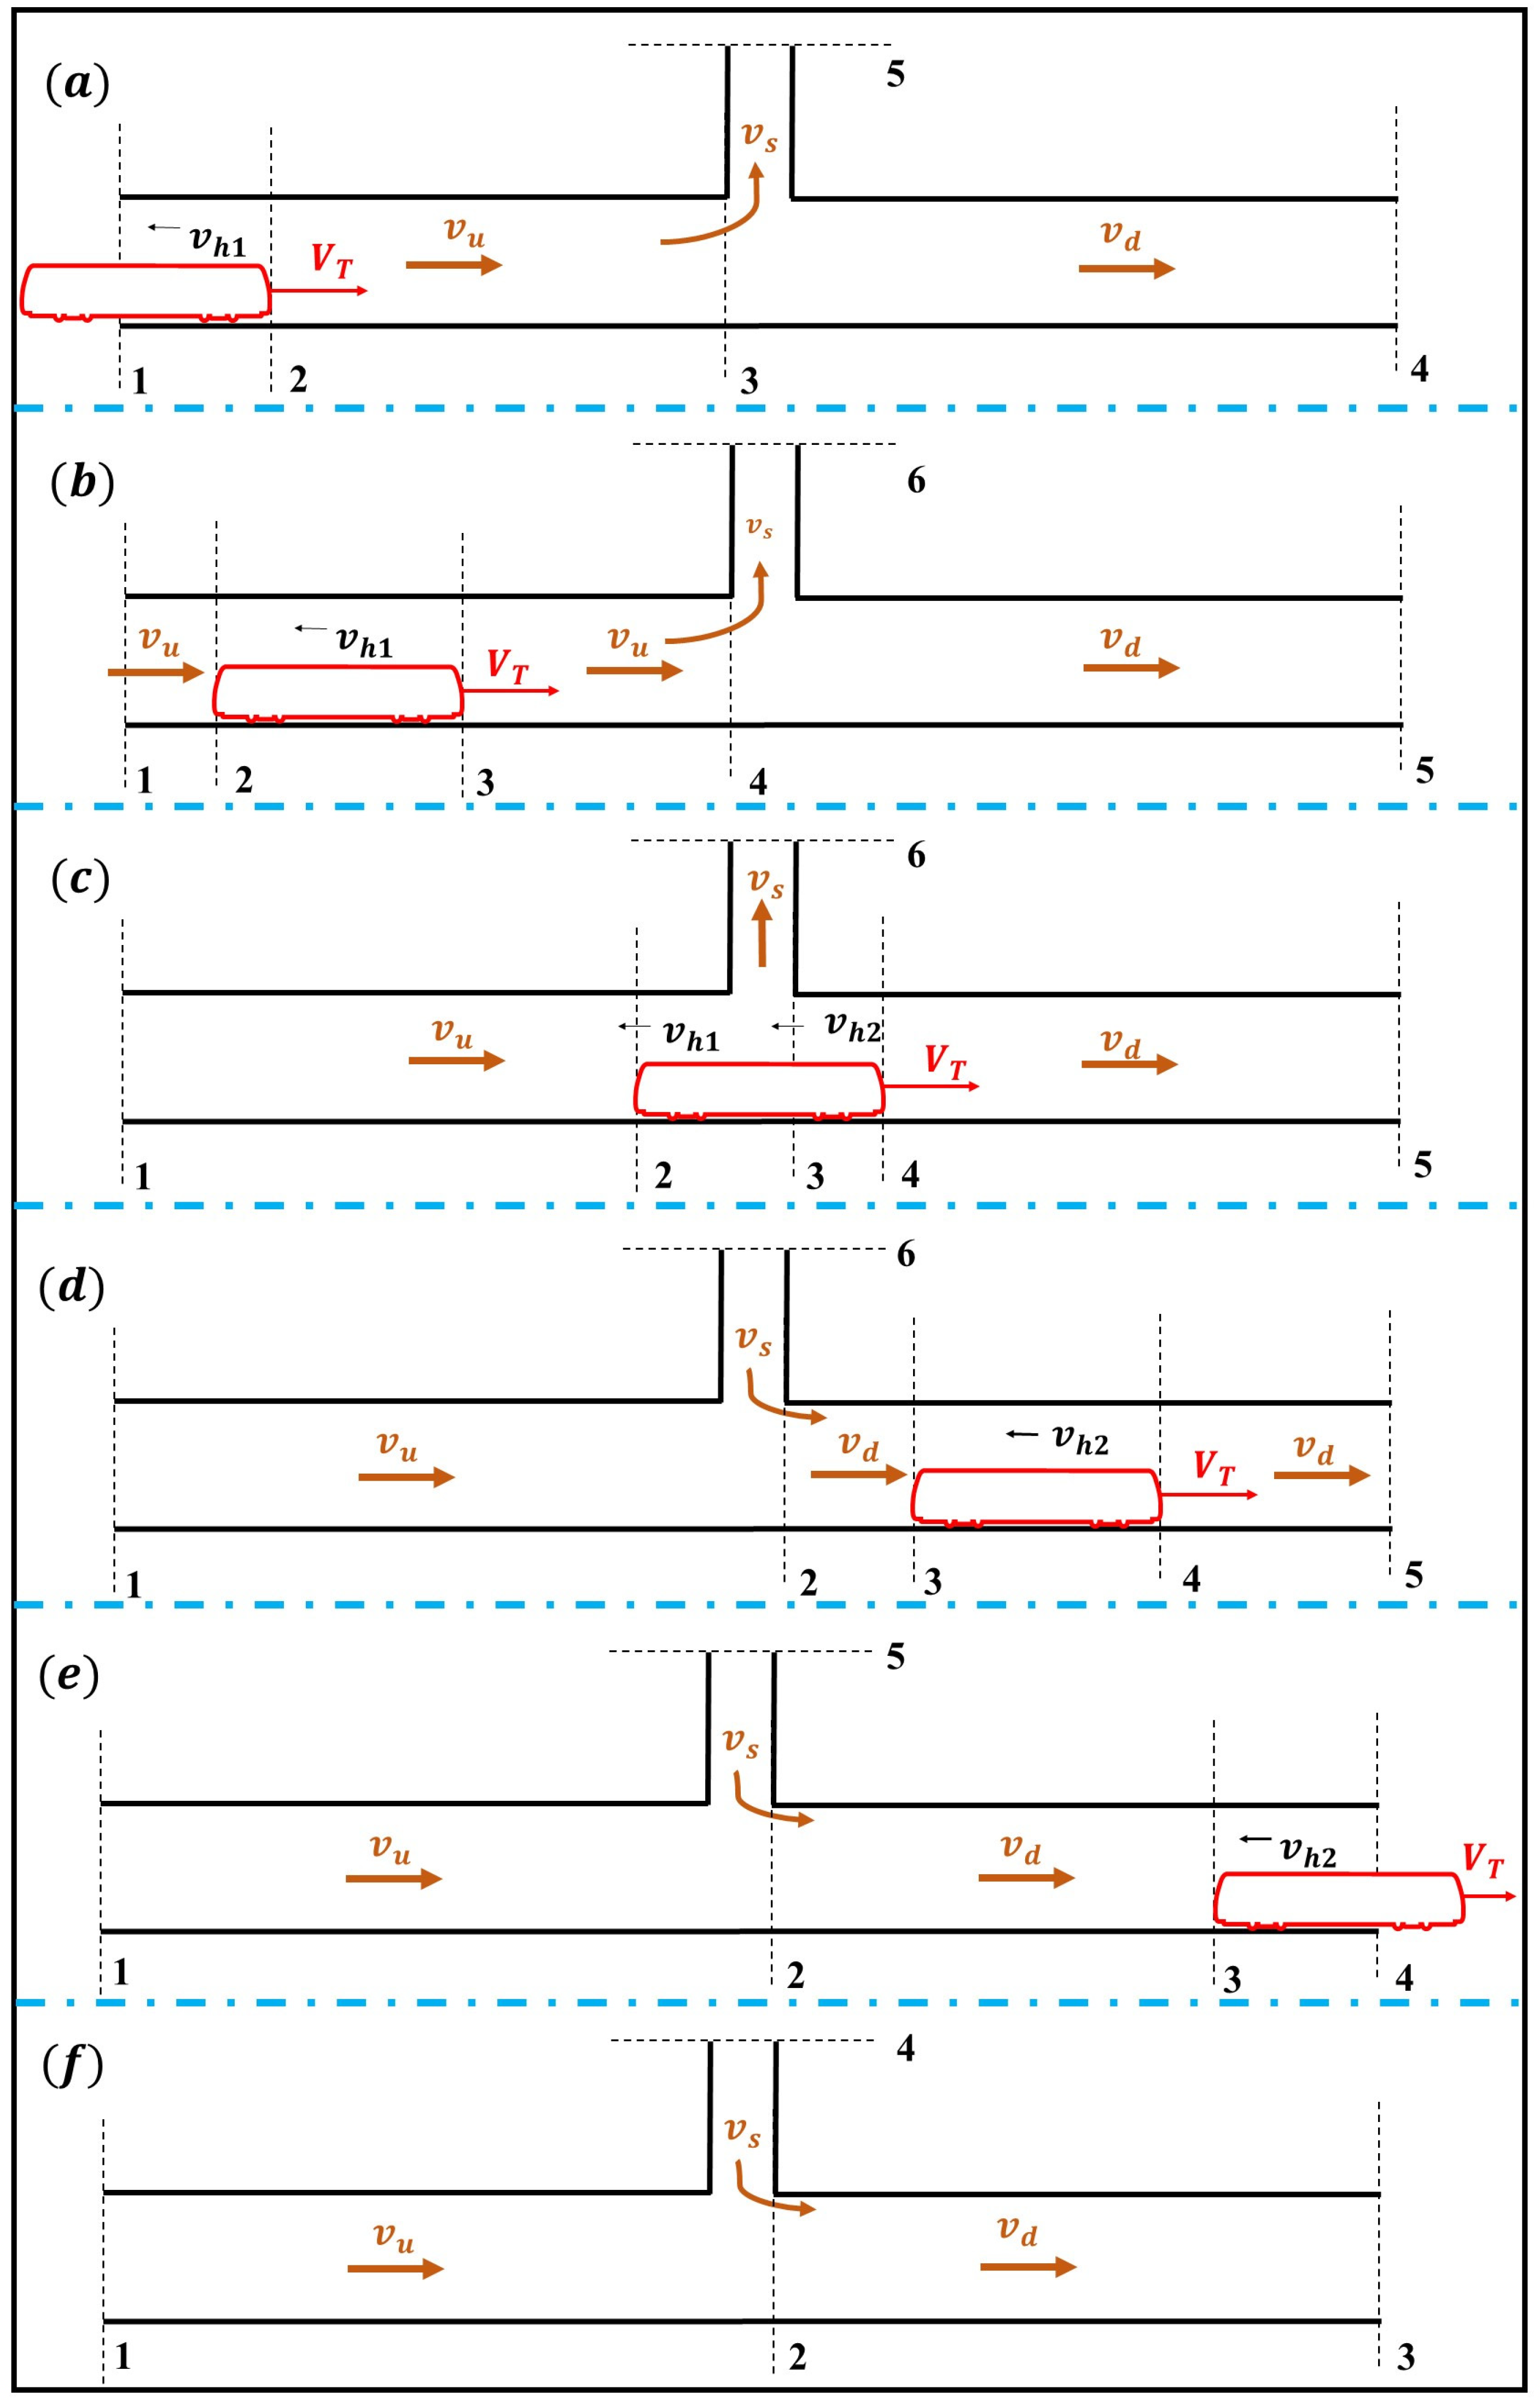
2.2.2. PPW-TCU
2.2.3. PPW-TCS
2.2.4. PPW-TCD
2.2.5. PPW-TCL
2.2.6. PPW-ATL
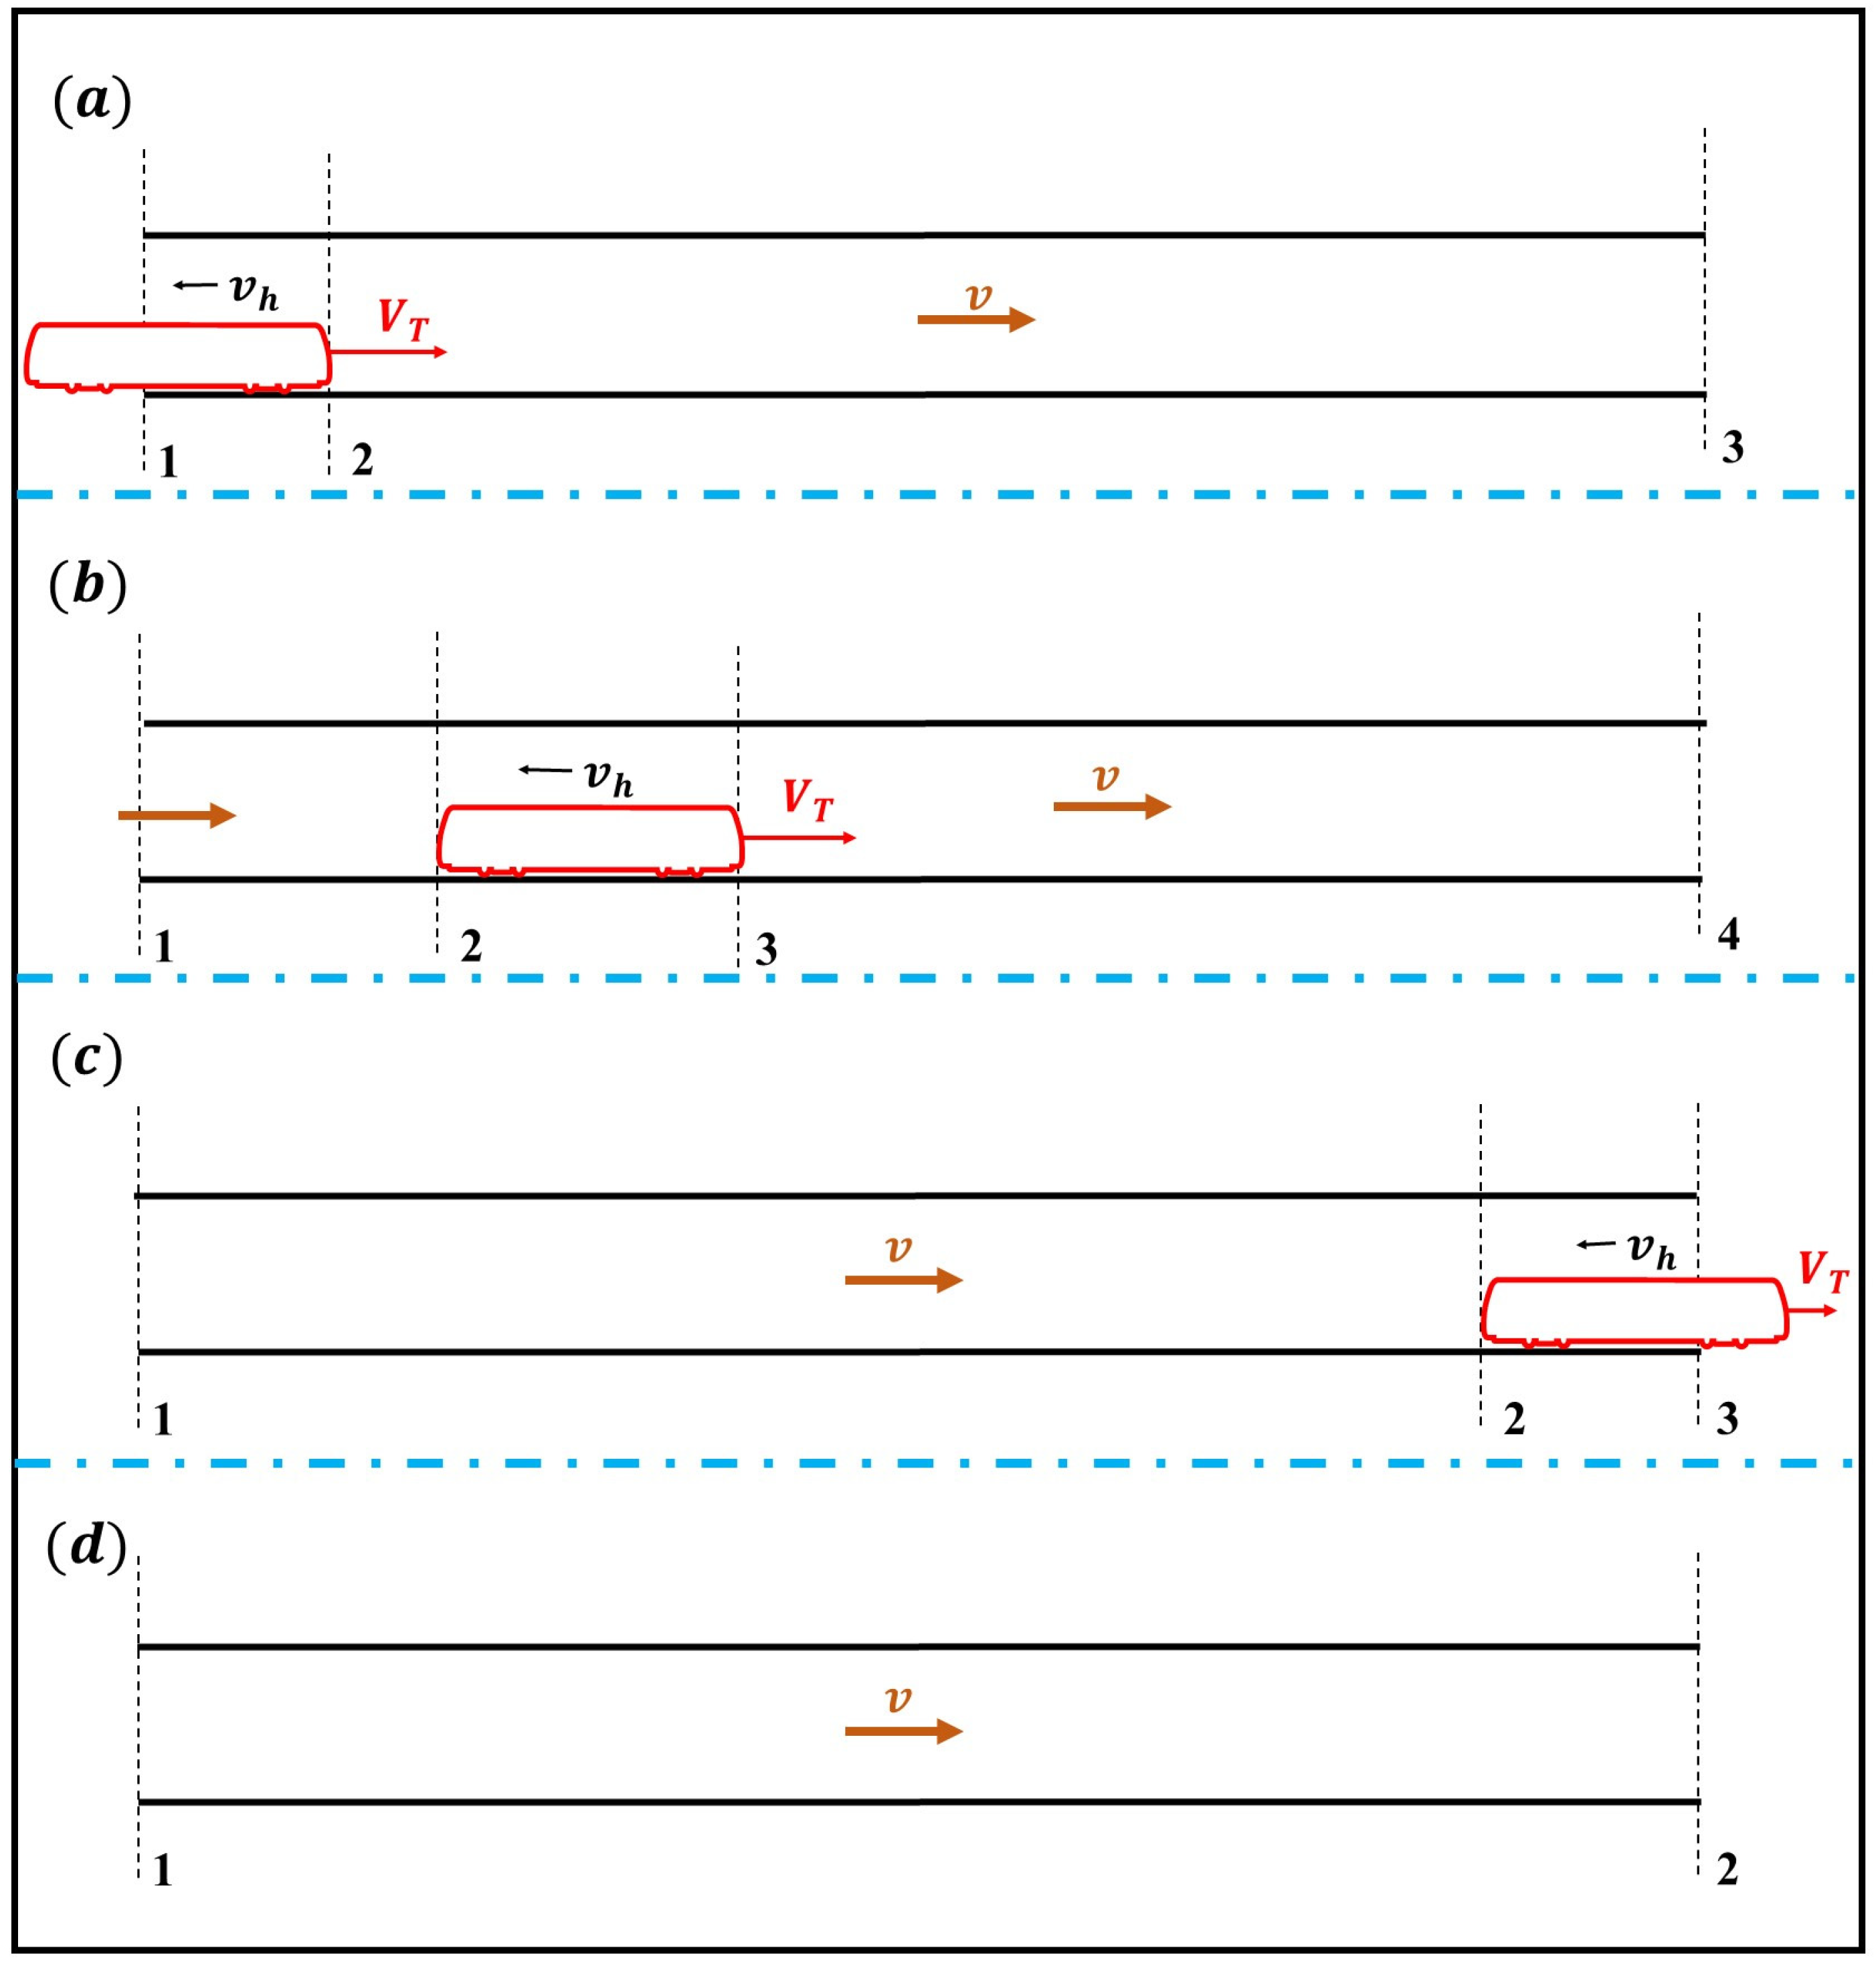
2.3. PW-NVS
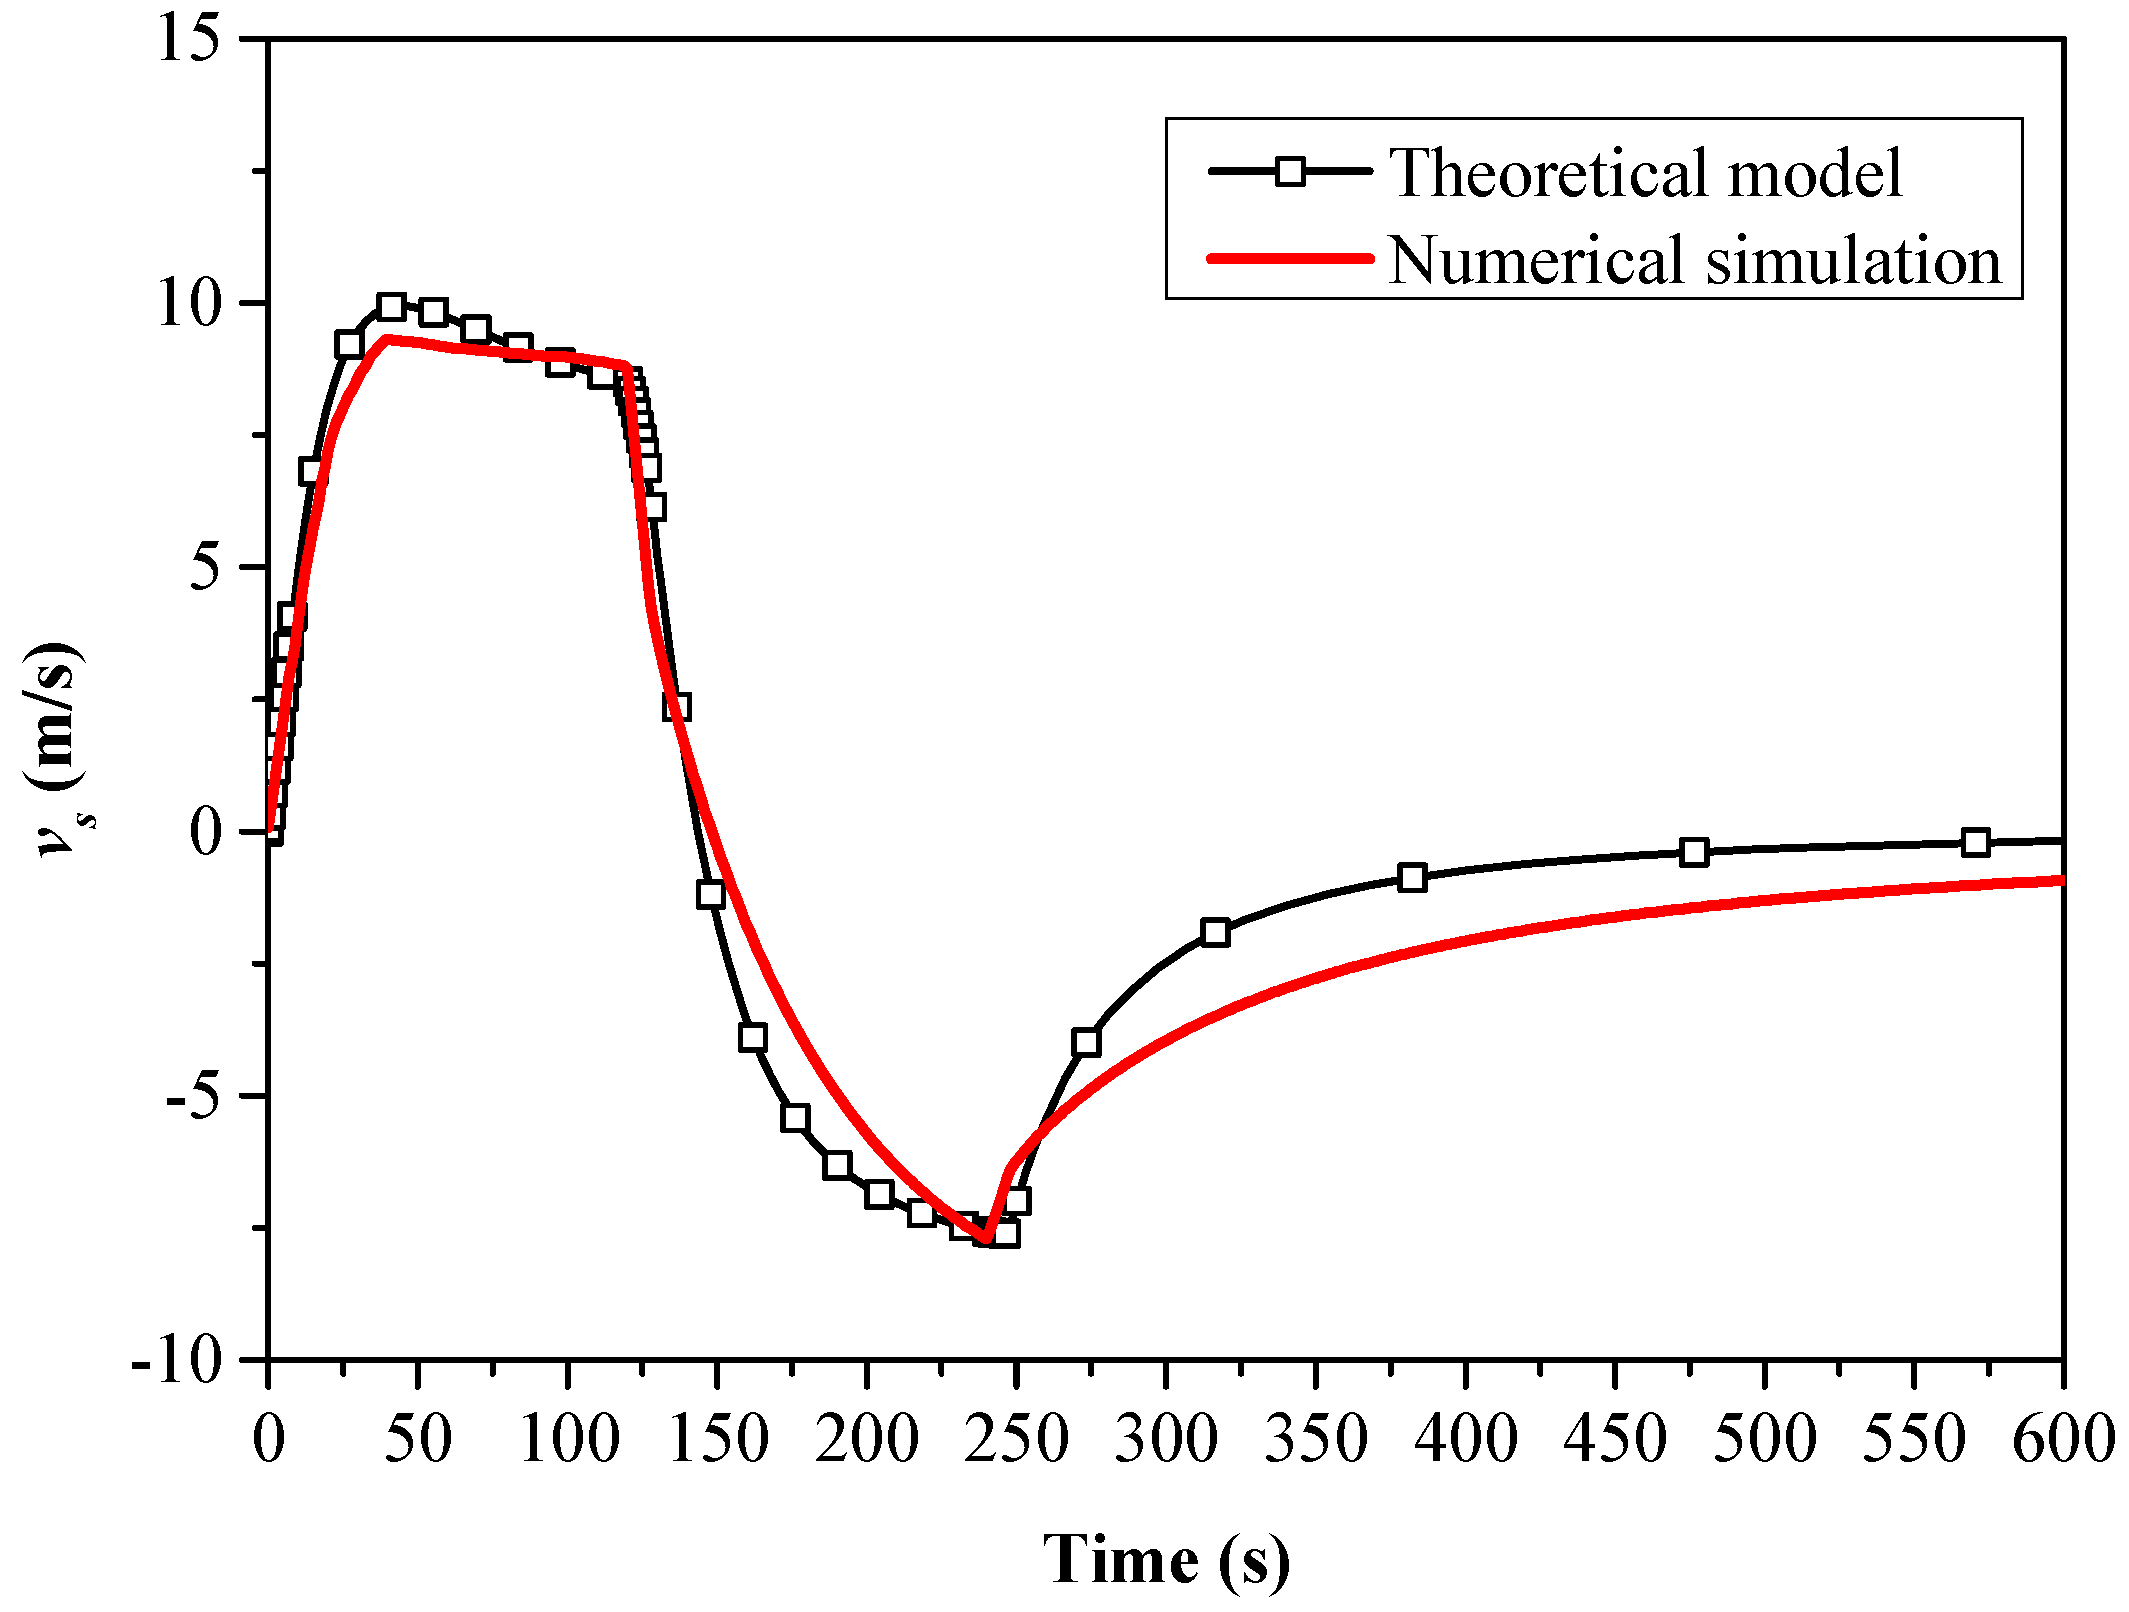
2.4. Validation
3. Results and Discussions
3.1. The Development Law of Piston Wind Speed
3.1.1. PW-WVS
3.1.2. PW-NVS
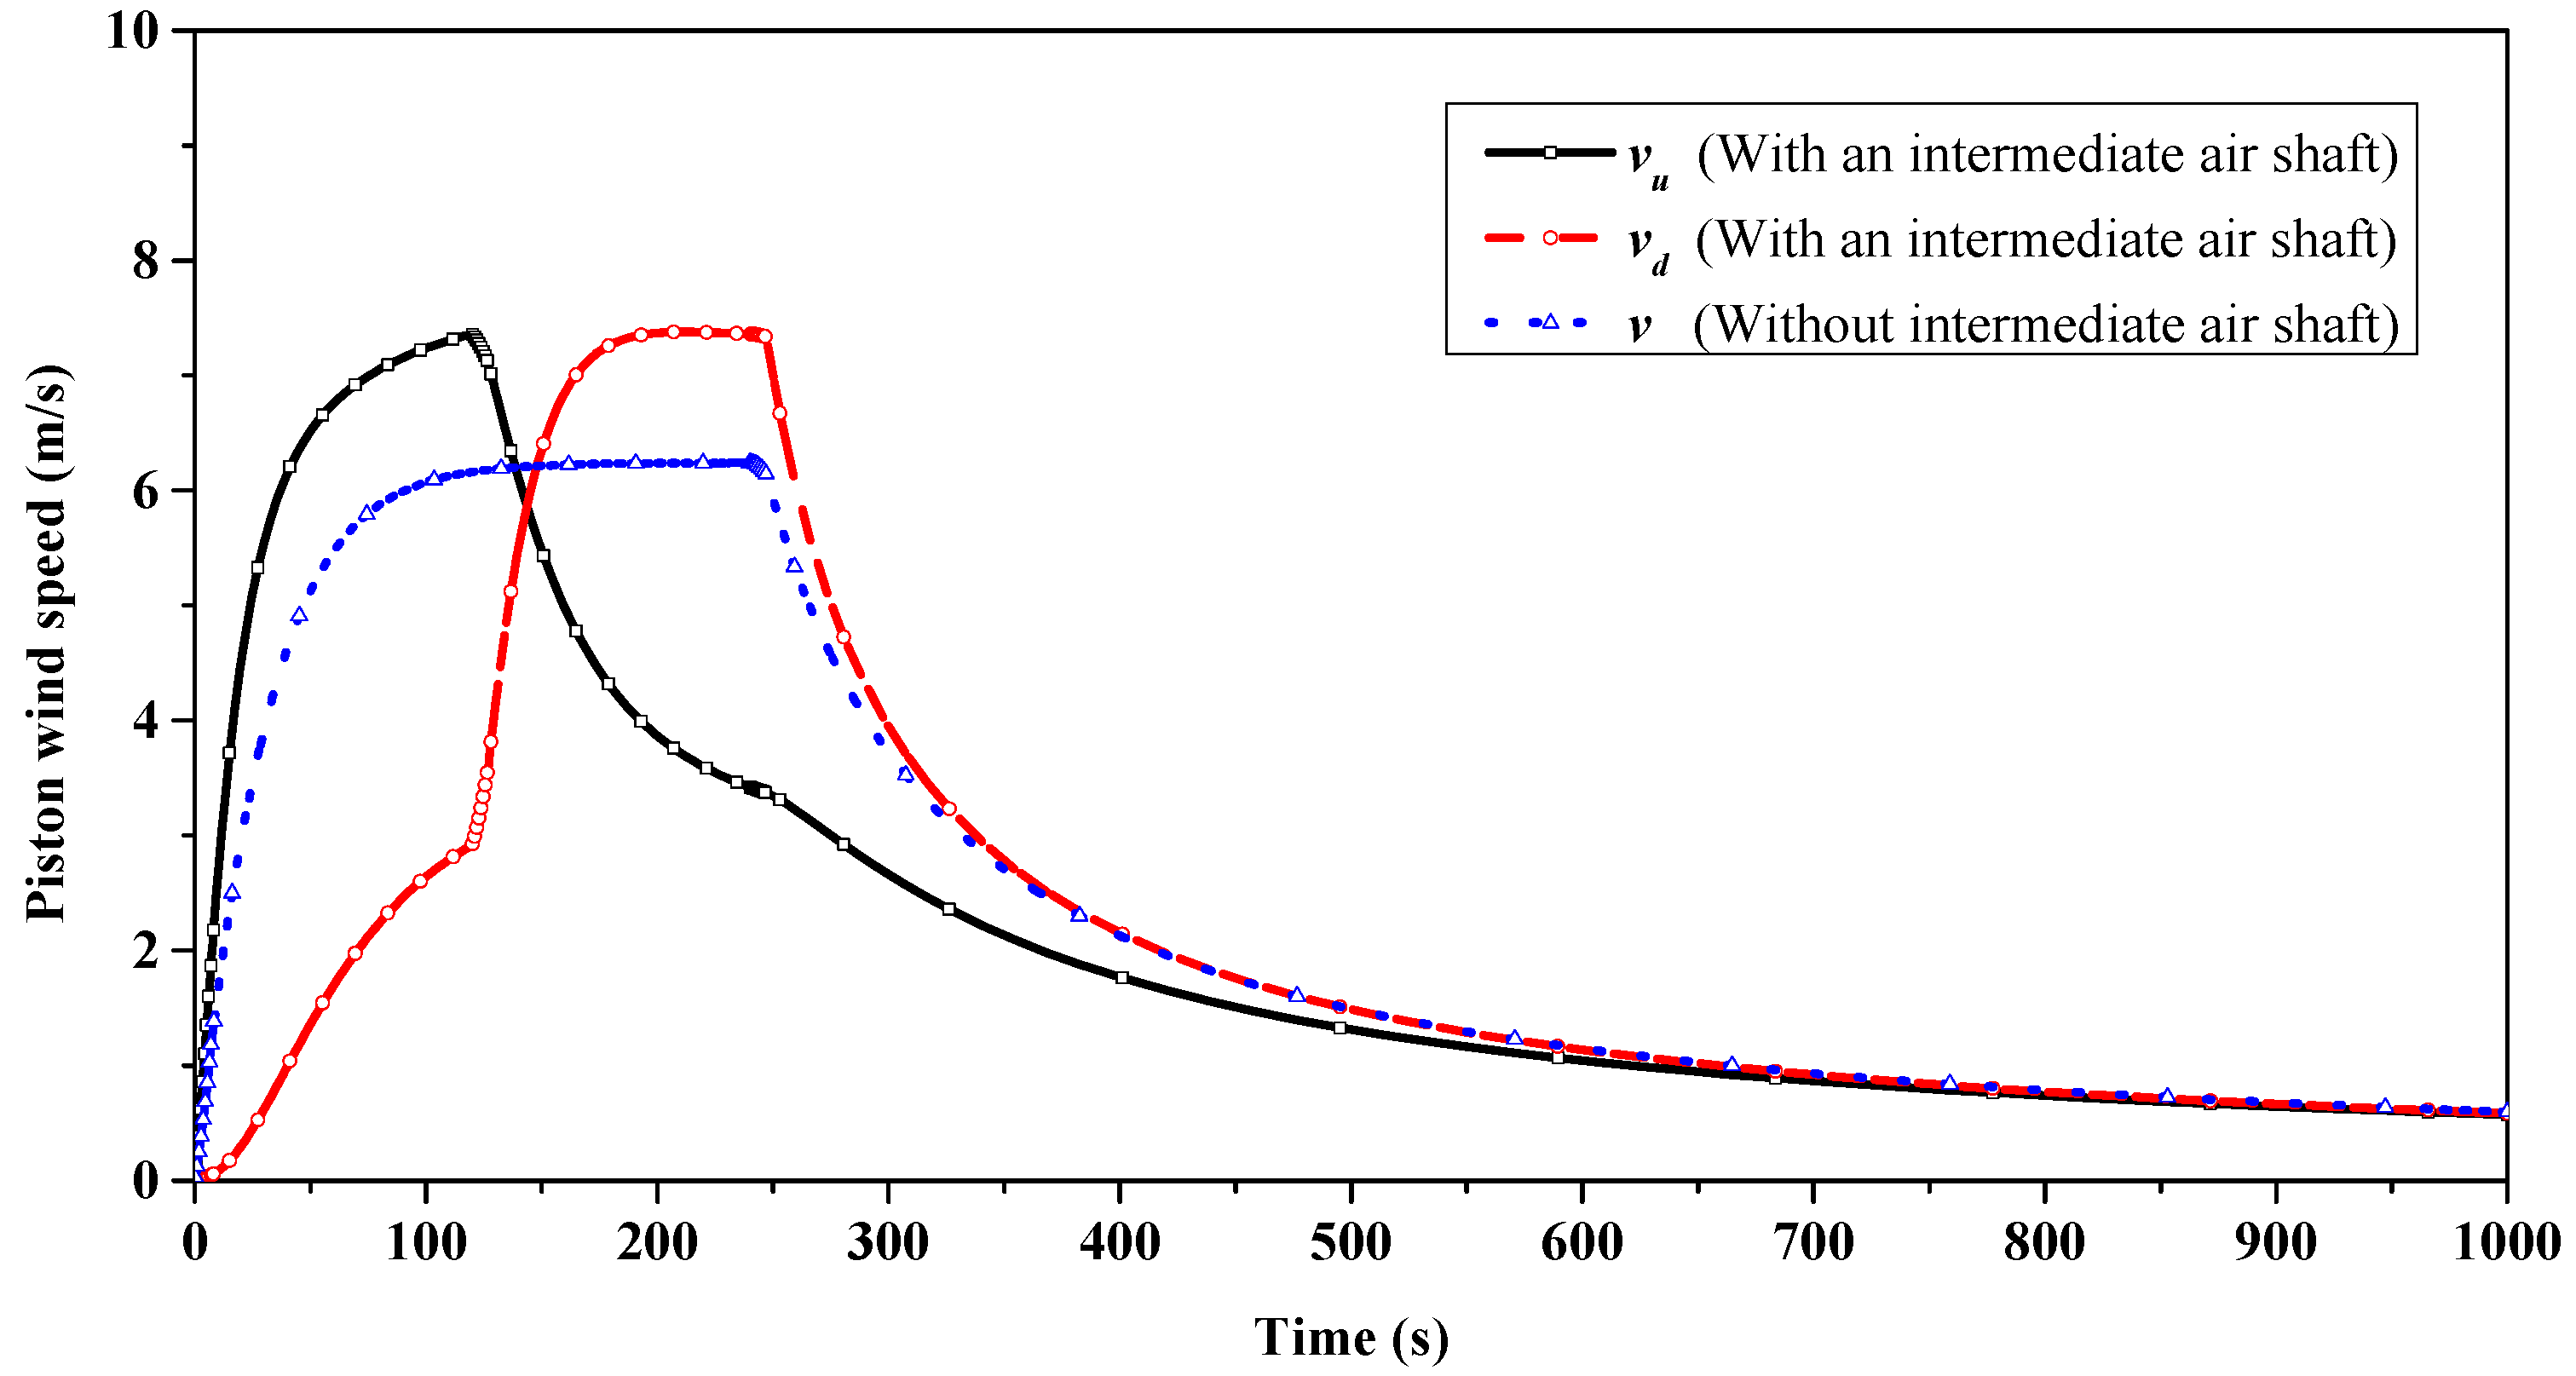
3.1.3. Comparison of PW-WVS and PW-NVS
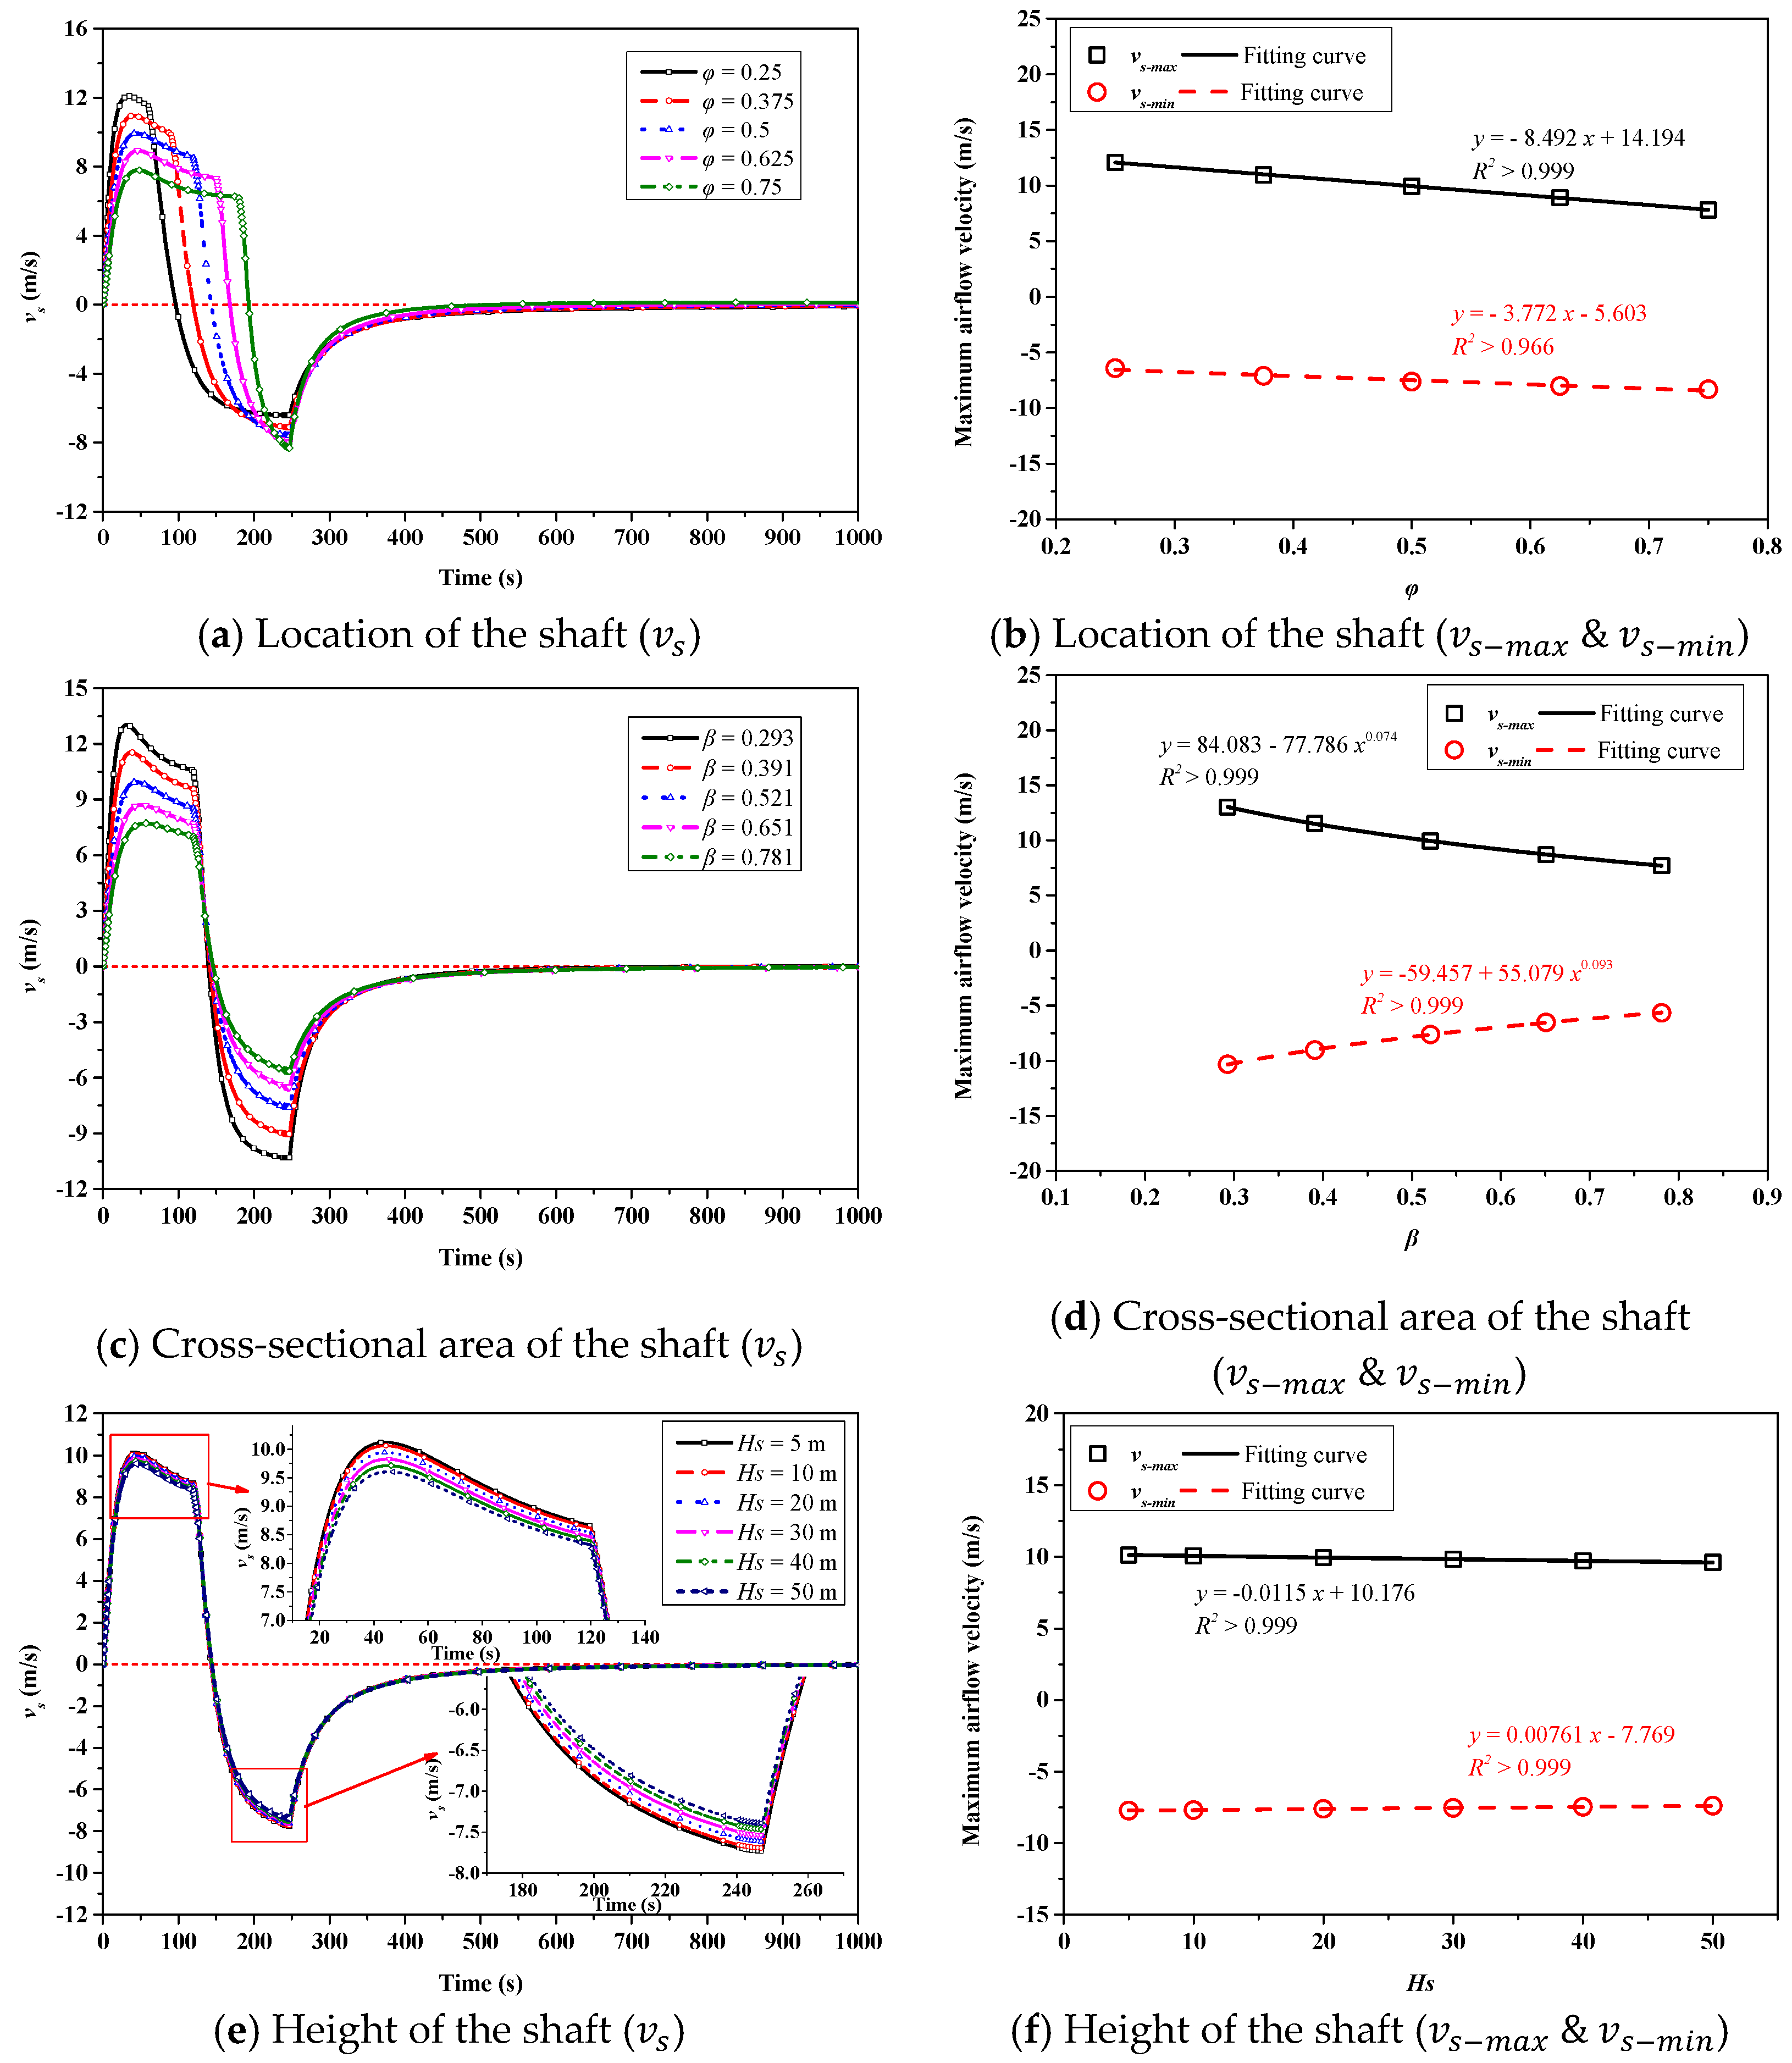
3.1.4. Development Law of Airflow in the Ventilation Shaft
3.2. Influencing Factor
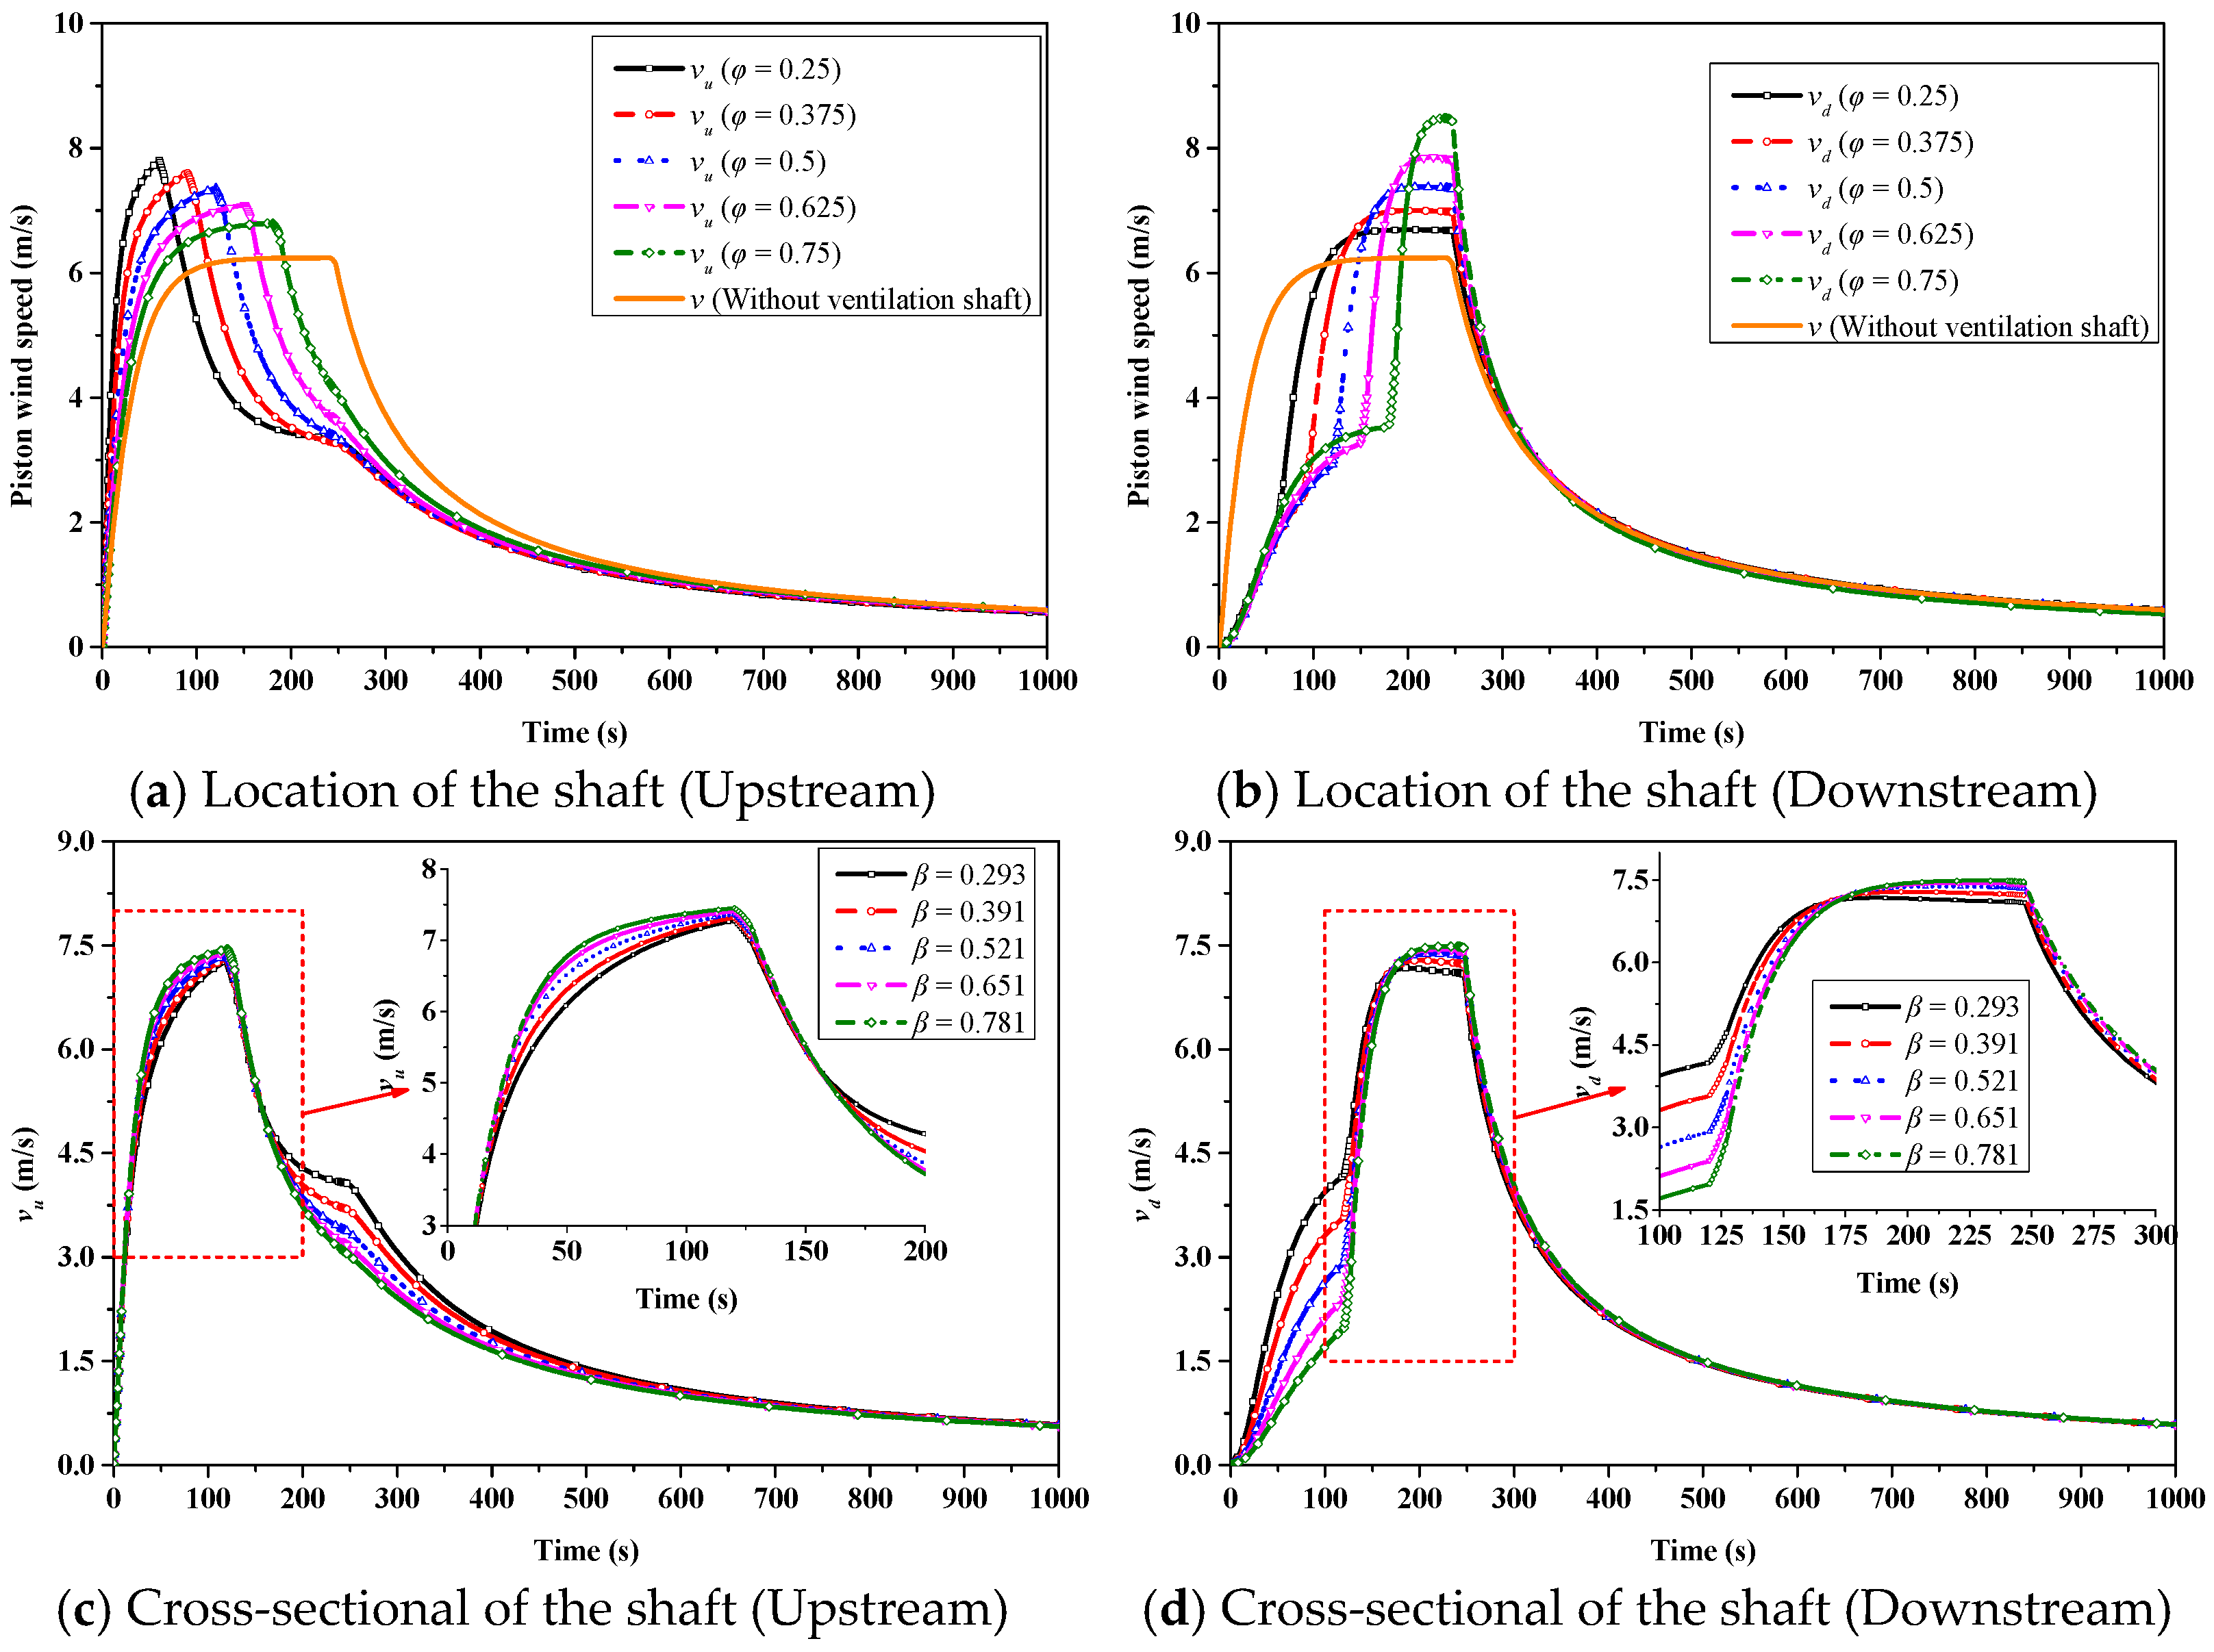
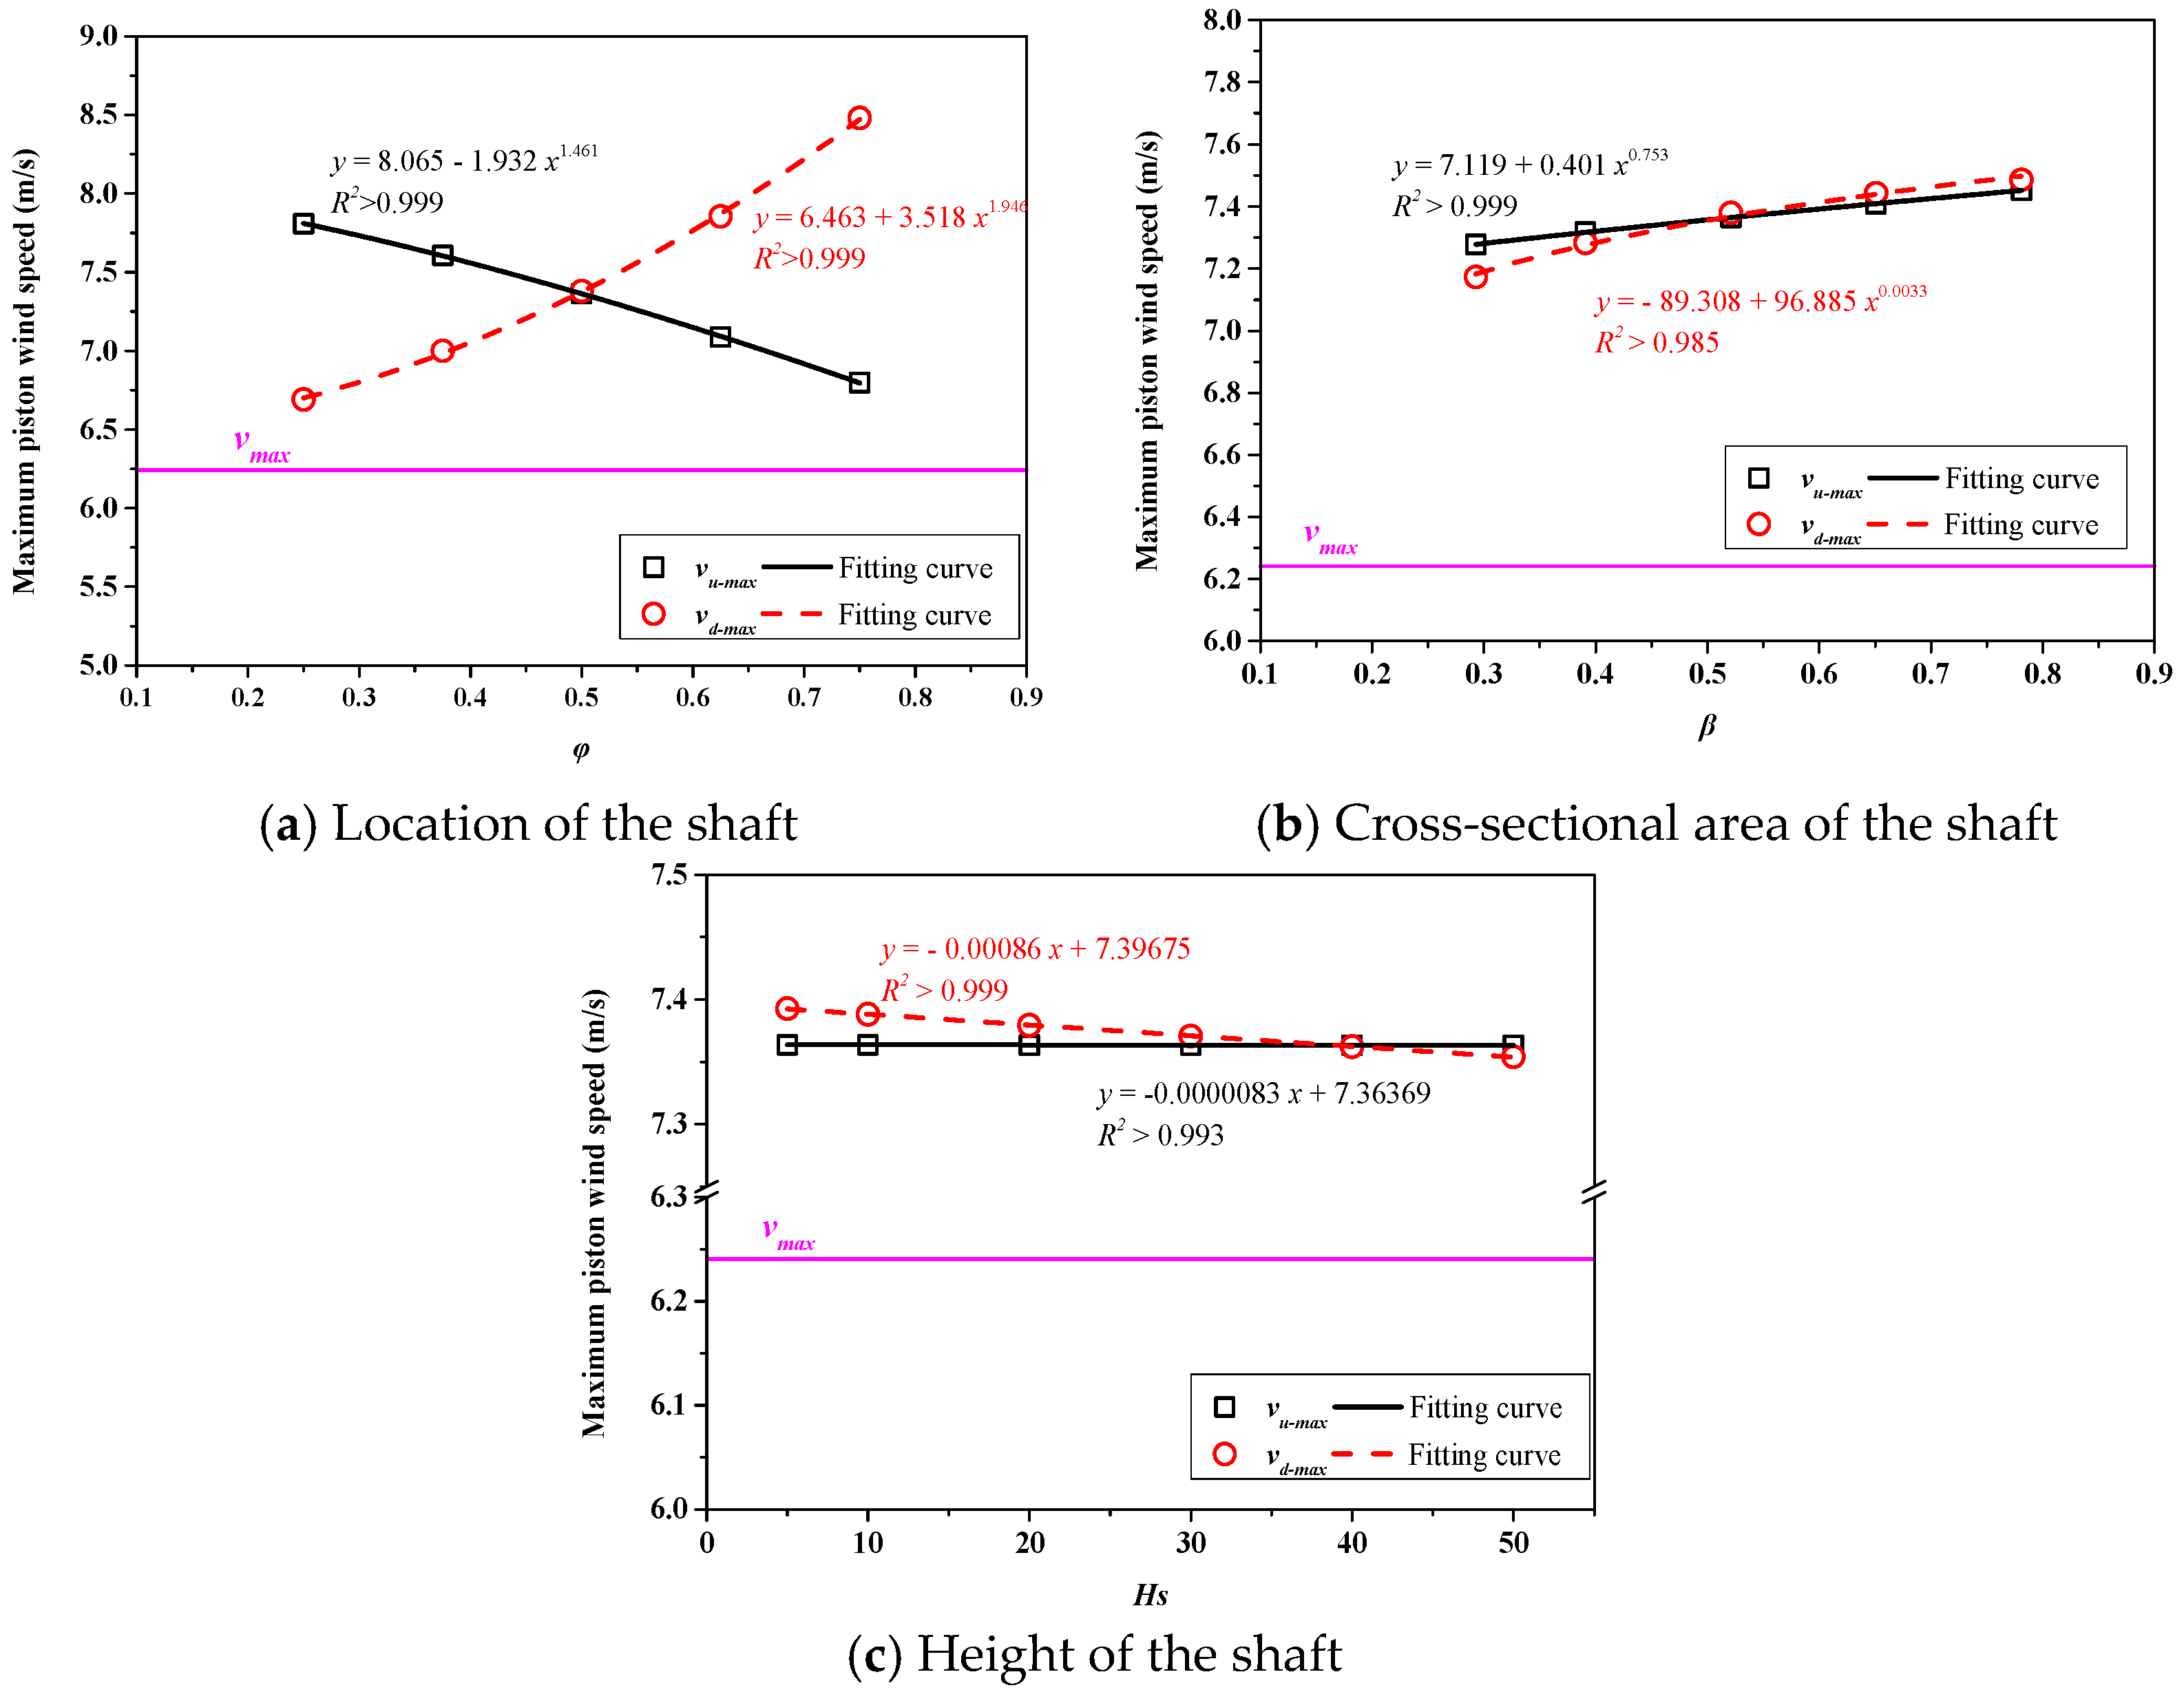
3.2.1. Location of the Shaft
3.2.2. Cross-Sectional Area of the Shaft
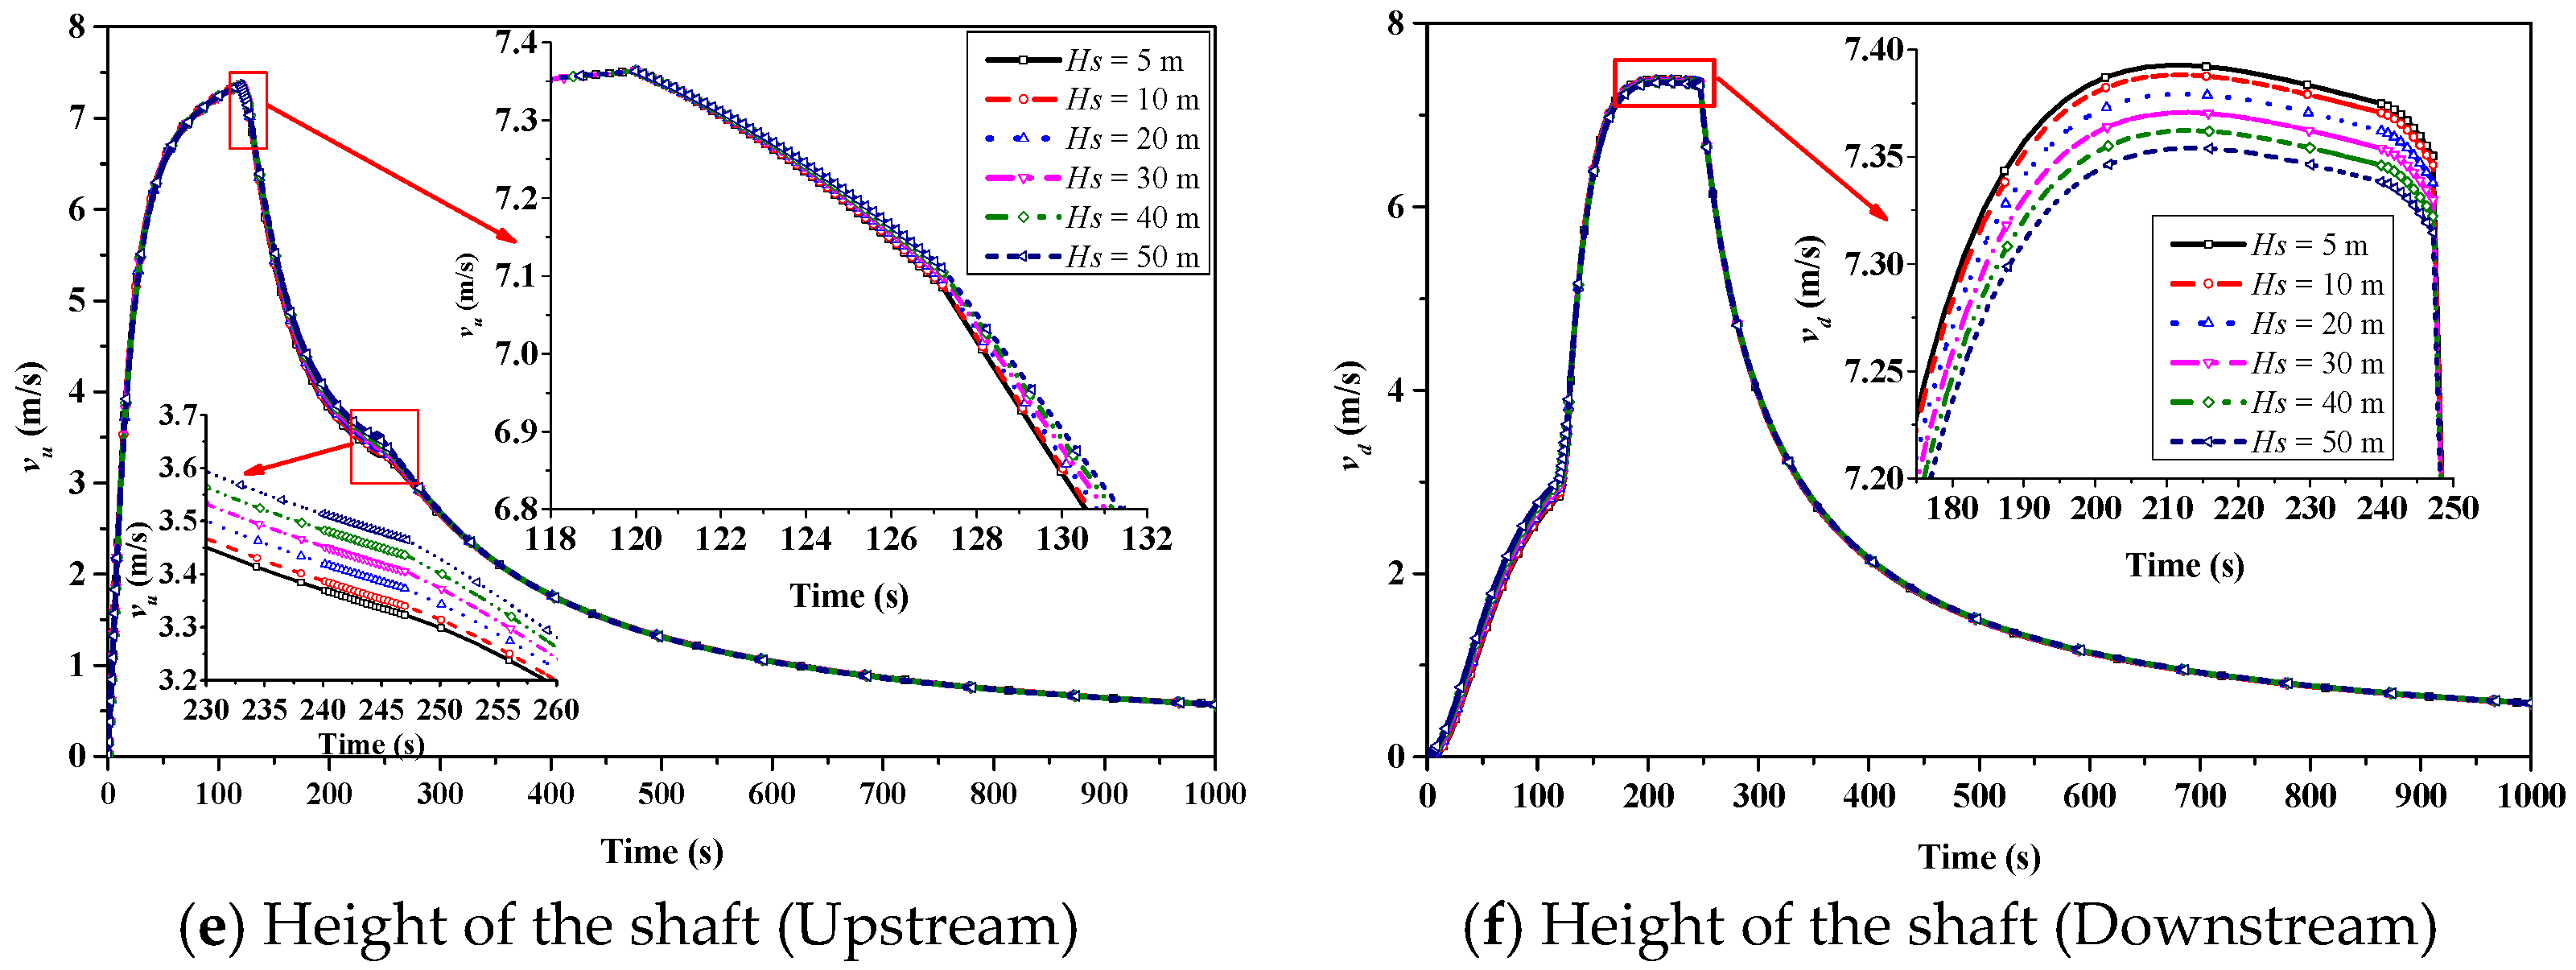
3.2.3. Height of the Shaft
3.3. Ventilation Rate
4. Conclusions
- The ventilation shaft has a significant impact on the piston wind. The maximum piston wind speed in a tunnel with a ventilation shaft is greater than the value in a tunnel without ventilation shaft. Similarly, the presence of a shaft increases the ventilation rate.
- The maximum stable piston wind speed, decreases with the increase in , and increases with the increase in . Changes in the and versus can be well represented by power functions. Meanwhile, as increases, the maximum piston wind speed ( and ) increases following the power function law. However, the changes in the and are negligible with the increase in .
- The airflow in the shaft is affected by the shaft location and the shaft cross-section, but shaft height has no obvious effect on it. Both the and linearly decrease with the increase in . decreases with in power function, while the increases with following the power function.
- The location of the shaft and its cross-section have an obvious influence on the ventilation rate, but the influence of the height of the shaft is very small. The ventilation rate first increases and then decreases with the increase in φ. The varying trend in ventilation rates versus φ can be well represented by a quadratic function. Meanwhile, the attenuation of ventilation rates varies in the power function when increases.
Author Contributions
Funding
Institutional Review Board Statement
Informed Consent Statement
Data Availability Statement
Acknowledgments
Conflicts of Interest
References
- Shi, C.; Li, J.; Xu, X. Full-scale tests on smoke temperature distribution in long-large subway tunnels with longitudinal mechanical ventilation. Tunn. Undergr. Space Technol. 2021, 109, 103784. [Google Scholar] [CrossRef]
- Pan, S.; Fan, L.; Liu, J.; Xie, J.; Sun, Y.; Cui, N.; Zhang, L.; Zheng, B. A Review of the Piston Effect in Subway Stations. Adv. Mech. Eng. 2013, 5, 950205. [Google Scholar] [CrossRef]
- GB 50157-2013; Code for Design of Metro. Ministry of Housing and Urban-Rural Development: Beijing, China, 2013.
- Zhang, H.; Zhu, C.G.; Liu, M.Z.; Zheng, W.D.; You, S.J.; Li, B.J.; Xue, P. Mathematical modeling and sensitive analysis of the train-induced unsteady airflow in subway tunnel. J. Wind Eng. Ind. Aerodyn. 2017, 171, 67–78. [Google Scholar] [CrossRef]
- Wang, F.; Yin, Z.; He, K. A Study on Subway Tunnel Ventilation for Piston Effects. In Proceedings of the International Conference on Pipelines & Trenchless Technology, Shanghai, China, 18–21 October 2009. [Google Scholar]
- Qiao, S.; Zhang, R.; He, Q.; Zhang, L. Theoretical modeling and sensitivity analysis of the car-induced unsteady airflow in super high-speed elevator. J. Wind Eng. Ind. Aerodyn. 2019, 188, 280–293. [Google Scholar] [CrossRef]
- Chen, T.Y.; Lee, Y.T.; Hsu, C.C. Investigations of piston-effect and jet fan-effect in model vehicle tunnels. J. Wind Eng. Ind. Aerodyn. 1998, 73, 99–110. [Google Scholar] [CrossRef]
- Gilbert, T.; Baker, C.J.; Quinn, A. Gusts caused by high-speed trains in confined spaces and tunnels. J. Wind Eng. Ind. Aerodyn. 2013, 121, 39–48. [Google Scholar] [CrossRef]
- Xue, P.; You, S.; Chao, J.; Ye, T. Numerical investigation of unsteady airflow in subway influenced by piston effect based on dynamic mesh. Tunn. Undergr. Space Technol. 2014, 40, 174–181. [Google Scholar] [CrossRef]
- Yang, W.; Deng, E.; Lei, M.; Zhang, P.; Yin, R. Flow structure and aerodynamic behavior evolution during train entering tunnel with entrance in crosswind. J. Wind Eng. Ind. Aerodyn. 2018, 175, 229–243. [Google Scholar] [CrossRef]
- Li, W.; Liu, T.; Martinez-Vazquez, P.; Chen, Z.; Huo, X.; Guo, Z. Influence of blockage ratio on slipstreams in a high-speed railway tunnel. Tunn. Undergr. Space Technol. 2021, 115, 104055. [Google Scholar] [CrossRef]
- Izadi, T.; Mehrabian, M.A.; Abouali, O.; Ahmadi, G. 3-D numerical analysis of train-induced flow inside four ventilated underground subway stations and connecting tunnels. J. Wind Eng. Ind. Aerodyn. 2019, 193, 103974. [Google Scholar] [CrossRef]
- Kim, J.Y.; Kim, K.Y. Experimental and numerical analyses of train-induced unsteady tunnel flow in subway. Tunn. Undergr. Space Technol. 2007, 22, 166–172. [Google Scholar] [CrossRef]
- Wang, F.; Liu, F.; Han, J.; Jin, H.; Weng, M.; Zeng, Z. Study on the train-induced unsteady airflow in a metro tunnel with multi-trains. Tunn. Undergr. Space Technol. 2020, 106, 103565. [Google Scholar] [CrossRef]
- Yan, W.; Naiping, G.; Lihui, W.; Xiping, W. A numerical analysis of airflows caused by train-motion and performance evaluation of a subway ventilation system. Indoor Built Environ. 2013, 23, 854–863. [Google Scholar] [CrossRef]
- Iliadis, P.; Hemida, H.; Soper, D.; Baker, C. Numerical simulations of the separated flow around a freight train passing through a tunnel using the sliding mesh technique. Proc. Inst. Mech. Eng. Part F J. Rail Rapid Transit 2019, 234, 638–654. [Google Scholar] [CrossRef]
- Huang, Y.-d.; Gao, W.; Kim, C.-N. A Numerical Study of the Train-Induced Unsteady Airflow in a Subway Tunnel with Natural Ventilation Ducts Using the Dynamic Layering Method. J. Hydrodyn. 2010, 22, 164–172. [Google Scholar] [CrossRef]
- Huang, Y.; Hong, T.H.; Kim, C.N. A numerical simulation of train-induced unsteady airflow in a tunnel of Seoul subway. J. Mech. Sci. Technol. 2012, 26, 785–792. [Google Scholar] [CrossRef]
- Huang, Y.-d.; Li, C.; Kim, C.N. A Numerical Analysis of the Ventilation Performance for Different Ventilation Strategies in a Subway Tunnel. J. Hydrodyn. 2012, 24, 193–201. [Google Scholar] [CrossRef]
- Król, A.; Król, M. Numerical Investigation on the Piston Effect in Subway Tunnels. In Advanced Solutions and Practical Applications in Road Traffic Engineering; Springer: Cham, Switzerland, 2023; pp. 108–119. [Google Scholar]
- Faugier, L.; Marinus, B.G.; Bosschaerts, W.; Laboureur, D.; Limam, K. CFD model to assess parameters influencing piston wind in a subway tunnel and station. J. Phys. Conf. Ser. 2021, 2042, 012076. [Google Scholar] [CrossRef]
- Cross, D.; Hughes, B.; Ingham, D.; Ma, L. A validated numerical investigation of the effects of high blockage ratio and train and tunnel length upon underground railway aerodynamics. J. Wind Eng. Ind. Aerodyn. 2015, 146, 195–206. [Google Scholar] [CrossRef]
- Liu, M.; Zhu, C.; Zhang, H.; Zheng, W.; You, S.; Campana, P.E.; Yan, J. The environment and energy consumption of a subway tunnel by the influence of piston wind. Appl. Energy 2019, 246, 11–23. [Google Scholar] [CrossRef]
- Zarnaghsh, A.; Abouali, O.; Emdad, H.; Ahmadi, G. A numerical study of the train-induced unsteady airflow in a tunnel and its effects on the performance of jet fans. J. Wind Eng. Ind. Aerodyn. 2019, 187, 1–14. [Google Scholar] [CrossRef]
- Wang, F.; Liu, F.; Obadi, I.; Weng, M. Study on the smoke propagation characteristics of metro tunnel fire under the effects of piston wind. Indoor Built Environ. 2021, 32, 149–169. [Google Scholar] [CrossRef]
- Wang, Z.; Zhou, D.; Krajnovic, S.; Liu, H. Moving model test of the smoke movement characteristics of an on-fire subway train running through a tunnel. Tunn. Undergr. Space Technol. 2020, 96, 103211. [Google Scholar] [CrossRef]
- Lin, C.-J.; Chuah, Y.K.; Liu, C.-W. A study on underground tunnel ventilation for piston effects influenced by draught relief shaft in subway system. Appl. Therm. Eng. 2008, 28, 372–379. [Google Scholar] [CrossRef]
- Kim, J.-Y.; Kim, K.-Y. Effects of vent shaft location on the ventilation performance in a subway tunnel. J. Wind Eng. Ind. Aerodyn. 2009, 97, 174–179. [Google Scholar] [CrossRef]
- Zhang, Z.; Zhang, H.; Tan, Y.; Yang, H. Natural wind utilization in the vertical shaft of a super-long highway tunnel and its energy saving effect. Build. Environ. 2018, 145, 140–152. [Google Scholar] [CrossRef]
- Zhang, R.; Qiao, S.; Zhang, Q.; Liu, L. Universal modeling of unsteady airflow in different hoistway structures and analysis of the effect of ventilation hole parameters. J. Wind Eng. Ind. Aerodyn. 2019, 194, 103987. [Google Scholar] [CrossRef]
- Liu, M.; Zhang, H.; Zhu, C.; Zheng, W.; You, S. Theoretical modeling of piston wind induced by multiple trains in longitudinal tunnel. Sustain. Cities Soc. 2020, 57, 102127. [Google Scholar] [CrossRef]
- Jin, X.; Chen, W. Tunnel Ventilation and Tunnel Aerodynamics; China Railway Publishing House: Beijing, China, 1983. [Google Scholar]
- Liu, F.; Wang, F.; Han, J.; Zhao, S.; Weng, M. Effects of ambient pressure on aerodynamic pressures induced by passing metro trains in tunnels. Tunn. Undergr. Space Technol. 2022, 126, 104540. [Google Scholar] [CrossRef]
- Wang, F.; Weng, M.; Xiong, K.; Han, J.; Obadi, I.; Liu, F. Study on aerodynamic pressures caused by double-train tracking operation in a metro tunnel. Tunn. Undergr. Space Technol. 2022, 123, 104434. [Google Scholar] [CrossRef]


| Symbol | Physical Meaning |
|---|---|
| Cross-sectional area of the metro train () | |
| Cross-sectional area of the tunnel () | |
| Cross-sectional area of the ventilation shaft () | |
| Height of the air shaft () | |
| Velocity of the train running at a constant speed () | |
| Velocity of the train (variable) () | |
| Velocity of the piston wind () | |
| Velocity of the piston wind upstream of the tunnel () | |
| Velocity of the piston wind downstream of the tunnel () | |
| Velocity of airflow in ventilation shaft () | |
| Velocity of airflow relative to the tunnel walls in the annular space () | |
| Velocity of airflow relative to the train in the annular space () | |
| Velocity of airflow relative to the train in the annular space upstream () | |
| Velocity of airflow relative to the train in the annular space downstream () | |
| Blockage ratio of the train to the tunnel | |
| Ratio of shaft cross-sectional area to tunnel cross-sectional | |
| Frictional resistance coefficient of airflow along the tunnel walls | |
| Frictional resistance coefficient of airflow along the annular space | |
| Frictional resistance coefficient of airflow along the ventilation shaft walls | |
| Hydraulic diameter of the tunnel () | |
| Hydraulic diameter of the annular space () | |
| Hydraulic diameter of the ventilation shaft () | |
| Length of the tunnel () | |
| Length of the train () | |
| Length of the tunnel upstream () | |
| Length of the tunnel downstream () | |
| Distance between cross-sections i and j () | |
| Local drag coefficient at the inlet of the tunnel | |
| Local drag coefficient at the outlet of the tunnel | |
| Local drag coefficient at the inlet of the annular space | |
| Local drag coefficient at the outlet of the annular space | |
| Local drag coefficient at the inlet of the ventilation shaft | |
| Local drag coefficient at the outlet of the ventilation shaft | |
| Local drag coefficient of the airflow from cross-section i to cross-section j |
| Governing Equation | |||||
|---|---|---|---|---|---|
| Steps | PPW-TET | PPW-TCT | PPW-TCL | PPW-ATL | |
| Time | |||||
| Equation parameters | A | 0 | |||
| B | 0 | ||||
| C | |||||
| 0 | |||||
| Remark | |||||
| Typical Tunnel | Typical Train | Typical Shaft | |||||||
|---|---|---|---|---|---|---|---|---|---|
| Length (m) | Width (m) | Height (m) | Length (m) | Width (m) | Height (m) | Speed (km/h) | Length (m) | Width (m) | Height (m) |
| 4000 | 4.8 | 6.4 | 120 | 2.8 | 3.8 | 60 | 4 | 4 | 20 |
Disclaimer/Publisher’s Note: The statements, opinions and data contained in all publications are solely those of the individual author(s) and contributor(s) and not of MDPI and/or the editor(s). MDPI and/or the editor(s) disclaim responsibility for any injury to people or property resulting from any ideas, methods, instructions or products referred to in the content. |
© 2024 by the authors. Licensee MDPI, Basel, Switzerland. This article is an open access article distributed under the terms and conditions of the Creative Commons Attribution (CC BY) license (https://creativecommons.org/licenses/by/4.0/).
Share and Cite
Wang, F.; He, X.; Xu, L.; Zhao, S.; Weng, M. Train-Induced Unsteady Airflow in a Metro Tunnel with a Ventilation Shaft. Appl. Sci. 2024, 14, 9177. https://doi.org/10.3390/app14209177
Wang F, He X, Xu L, Zhao S, Weng M. Train-Induced Unsteady Airflow in a Metro Tunnel with a Ventilation Shaft. Applied Sciences. 2024; 14(20):9177. https://doi.org/10.3390/app14209177
Chicago/Turabian StyleWang, Fei, Xingsen He, Lin Xu, Shengzhong Zhao, and Miaocheng Weng. 2024. "Train-Induced Unsteady Airflow in a Metro Tunnel with a Ventilation Shaft" Applied Sciences 14, no. 20: 9177. https://doi.org/10.3390/app14209177