Article

Machine Learning Accelerated Design of High-Temperature Ternary and Quaternary Nitride Superconductors

Department of Materials Design and Innovation, University at Buffalo, Buffalo, NY 14260, USA
*
Author to whom correspondence should be addressed.
Appl. Sci. 2024, 14(20), 9196; https://doi.org/10.3390/app14209196
Submission received: 16 September 2024 / Revised: 5 October 2024 / Accepted: 8 October 2024 / Published: 10 October 2024
(This article belongs to the Special Issue Data and Text Mining: New Approaches, Achievements and Applications)

Abstract

:
The recent advancements in the field of superconductivity have been significantly driven by the development of nitride superconductors, particularly niobium nitride (NbN). Multicomponent nitrides offer a promising platform for achieving high-temperature superconductivity. Beyond their high superconducting transition temperature (Tc), niobium-based compounds are notable for their superior superconducting and mechanical properties, making them suitable for a wide range of device applications. In this work, machine learning is used to identify ternary and quaternary nitrides, which can surpass the properties of binary NbN. Specifically, Nb0.35Ta0.23Ti0.42N shows an 84.95% improvement in Tc compared to base NbN, while the ternary composition Nb0.55Ti0.45N exhibits a 17.29% improvement. This research provides a valuable reference for the further exploration of high-temperature superconductors in diversified ternary and quaternary compositions.

1. Introduction

Transition metal nitrides like niobium nitride (NbN), zirconium nitride (ZrN), hafnium nitride (HfN), and titanium nitride (TiN) are recognized for their structural strength and exhibit superconducting properties surpassing the critical temperature of liquid helium (4.2 K) [1]. Discovered by Aschermann et al. in 1941 [2], NbN is a top candidate for cryoelectronic applications due to higher superconducting transition temperature (17 K) [3,4,5] and stability [6].
Experiments investigating the replacement of other transition metals, such as titanium and tantalum, for niobium have been conducted in an attempt to enhance the superconducting properties of niobium nitride [7,8,9,10]. One of the earlier attempts was made by Gavaler et al. using a high-purity reactive sputtering process on a collection of Nb-Ti-N films with varying Nb/Ti ratios, achieving the highest transition temperature (~15.5 K) at a Nb0.5Ti0.5N composition [11]. Notably, this pioneering study revealed that incorporating Ti resulted in decreased critical current (Jc) and critical magnetic field (Hc2) in thin-film samples [11] of NbN, a finding in contrast to other reports that suggested potential enhancements in superconducting properties with similar modifications (Figure 1).
Niobium titanium nitride (NbTiN) is a noteworthy variation that shares material properties and superconducting uses with NbN [9,10,12]. Through Ti integration, NbTiN improves device efficiency while retaining a Tc that is equivalent to NbN. Compared to NbN, NbTiN displays lower resistivity at room temperature and material characteristics that are less sensitive to the subtleties of the deposition environment [12,13]. NbTiN is attractive for superconducting radio-frequency (SRF) applications because of its low secondary electron emission coefficient and radiation damage resistance, both of which help to achieve greater accelerating fields [14]. In addition, NbTiN has been shown to have a lower surface resistance than NbN, meaning that losses in superconductor–insulator–superconductor (SIS) mixers would be reduced [15]. NbTiN provides advantages for superconducting nanowire single-photon detectors (SNSPDs) such as a reduction in the dark count rate and preservation of the NbN detector’s quantum efficiency, which improves the detector’s overall performance and signal-to-noise ratio [13].
Several research works have examined the behavior of NbTiN devices and examined the consequences of adding a new element to the NbN matrix. However, the final property is not dependent solely on composition but also on the manufacturing process [3,9,10,11,14]. Manually exploring the wide range of potential elemental additions and their corresponding concentrations is a time-consuming process, and to accelerate the identification of target experiments, computational methods and machine learning approaches are valuable. There is a growing impetus to develop innovative approaches, with machine learning emerging as a powerful ally capable of managing complex datasets and transcending disciplinary borders to enhance the discovery and characterization of potential superconductors [16,17,18,19].
Although the earlier findings provided mixed results regarding the benefits of Ti substitution, they opened avenues for further exploration using advanced tools and methodologies. By employing a data-driven approach, we aim to systematically evaluate the effects of substituting various transition metals, such as Ti, Ta, Zr, Hf, Re, and Sc, for niobium within the NbN matrix.
We previously developed a machine learning framework to optimize key processing parameters, such as film thickness, substrate chemistry, and deposition conditions, to enhance the superconducting transition temperature of niobium nitride films. This approach resulted in a predicted 16.4% increase in Tc, demonstrating that superconducting performance is significantly influenced by both the material form (bulk or films) and the specific processing conditions. Building on these findings, the current study extends our methodology using machine learning to explore more complex ternary and quaternary nitride systems, with the goal of identifying new compositions that achieve further enhancements in Tc. Most existing studies focus predominantly on simpler binary compounds (like NbN, TiN), with little attention given to the more complex ternary and quaternary nitride systems. This scarcity presents both a challenge and an opportunity: on one hand, it restricts the ability to develop highly accurate predictive models due to a lack of comprehensive experimental input; on the other hand, it motivates the exploration of these less-understood materials as potential high-temperature superconductors. The lack of extensive data necessitates leveraging broader datasets to identify potential candidates among these nitrides, but it also introduces challenges, such as increased uncertainty in model predictions and potential biases toward more well-studied materials. Therefore, this study aims to bridge the knowledge gap by using machine learning to identify promising new compositions and guide future experimental work.

2. Materials and Methods

2.1. Data Description

The data used for training the ML models is extracted from the SuperCon database. The ‘Superconductivity2018’ dataset, compiled by Stanev et al. [20], comprises 16414 experimental records of superconducting critical temperatures. The critical temperatures and related properties in the ‘Superconductivity2018’ dataset were originally collected from the SuperCon database, a comprehensive repository maintained by the National Institute for Materials Science (NIMS) in Japan [21]. The data were sourced from peer-reviewed experimental studies, spanning several decades and encompassing a wide range of superconducting materials. Tc values were determined using standard experimental techniques, such as resistivity, magnetic susceptibility, and specific heat measurements, and were validated through rigorous quality control processes to ensure consistency and reliability.
The distribution and spread of Tc in the Superconductivity2018 dataset is shown in Figure 2. The dataset shows a wide range of Tc values, with a mean of approximately 17.97 K and a standard deviation of 26.98 K, indicating substantial variability in the superconducting properties of the materials included. The minimum recorded Tc is 0 K, while the maximum Tc reaches up to 143 K. Notably, the distribution of Tc values is heavily skewed towards lower temperatures, with 50% of the data (median) below 5 K. The 25th percentile is at 0.095 K, and the 75th percentile is at 22.5 K, suggesting that a significant portion of the dataset comprises materials with relatively low critical temperatures. This variability highlights the diversity of the materials in the dataset, encompassing both conventional and high-temperature superconductors, and underlines the challenge of developing predictive models.
To prepare the data for building a predictive model, we first filtered out all entries where the Tc values were less than or equal to 0 K, as these values are not meaningful in the context of predicting superconducting properties. Next, to handle potential outliers that could skew the model, we applied the Interquartile Range (IQR) method. By calculating the IQR (the difference between the 75th and 25th percentiles) and removing values that fall below the first quartile minus 1.5 times the IQR or above the third quartile plus 1.5 times the IQR, we effectively minimized the impact of extreme values on the model’s performance. After filtering out records with zero TC values, removing outliers and duplicates, and performing the feature selection process, the final dataset consists of 11,968 records, each containing 73 features.

2.2. Feature Engineering

We employed the ‘matminer’ library to generate a comprehensive set of features from the material compositions for our ML model. Initially, we utilized the ElementProperty featurizer [22] with the “magpie” preset to extract a wide array of elemental properties from the compositions. Following this, additional feature sets were generated using various featurizers: AtomicOrbitals [22] to capture information related to atomic orbitals, BandCenter [22] to derive features related to the band center, and Stoichiometry to analyze the material’s compositional makeup. We also applied the ValenceOrbital featurizer [22] to obtain insights into the valence electron configurations. After generating these features, we ensured the dataset’s integrity by removing duplicates and handling non-numeric and missing values. To refine our feature set, we computed a correlation matrix and established thresholds to identify features with significant correlations to the Tc and to detect highly inter-correlated features. By applying these thresholds, we isolated the most relevant features that have a strong correlation with Tc while minimizing multicollinearity. We applied a comprehensive feature selection strategy based on correlation analysis. First, we calculated the correlation matrix for all numerical features and established two key thresholds to guide the selection process. A threshold of |0.1| was set to identify features with significant correlation to the target variable, the critical temperature TC. Only those features that exhibited a correlation greater than this threshold were retained. In order to manage multicollinearity, we implemented a second threshold of |0.9| for inter-feature correlations. For pairs of features where the correlation exceeded this threshold, we evaluated the correlation of each feature with the target variable and retained the one with the stronger correlation, while discarding the other. The clustered heatmap provided in Figure 3 supports this approach by visually illustrating the correlations among the selected features that are most highly correlated. After applying our selection criteria, multicollinearity has been reduced, with fewer widespread clusters of highly correlated features. Some localized clusters of correlated features remain, but the selection process has successfully minimized redundant information while retaining features most relevant to the target variable.

2.3. Model Selection and Hyperparameter Optimization

We selected the optimal regression algorithm and hyperparameters to model the relationship between the composition of materials and their superconducting critical temperatures. We employed a diverse array of regression models, including KNeighborsRegressor, DecisionTreeRegressor, RandomForestRegressor, XGBoostRegressor, BayesianRidge, SGDRegressor, AdaBoostRegressor, and MLPRegressor, each with a specific set of hyperparameters to fine-tune. For each regressor, we utilized RandomizedSearchCV to explore a wide range of hyperparameter values, conducting a systematic search to identify the best-performing combination based on cross-validation scores. We evaluated each model’s effectiveness by assessing performance metrics such as the root mean squared error (RMSE) and the coefficient of determination (R2 score) on the test data. We quantified the prediction uncertainty of our model using two key statistical learning metrics: the 85th percentile error and the mean absolute error (MAE). The 85th percentile error, calculated as 4.56 K, indicates that 85% of the model’s predictions deviate from the actual Tc values by no more than this amount, providing a robust estimate of uncertainty by focusing on the central portion of the error distribution. Additionally, the MAE of 2.40 K represents the average error across all predictions, offering a measure of how much the model deviates from the actual Tc values on average. The performance metrics are provided in the Supplementary Document (Table S1).

3. Results and Discussion

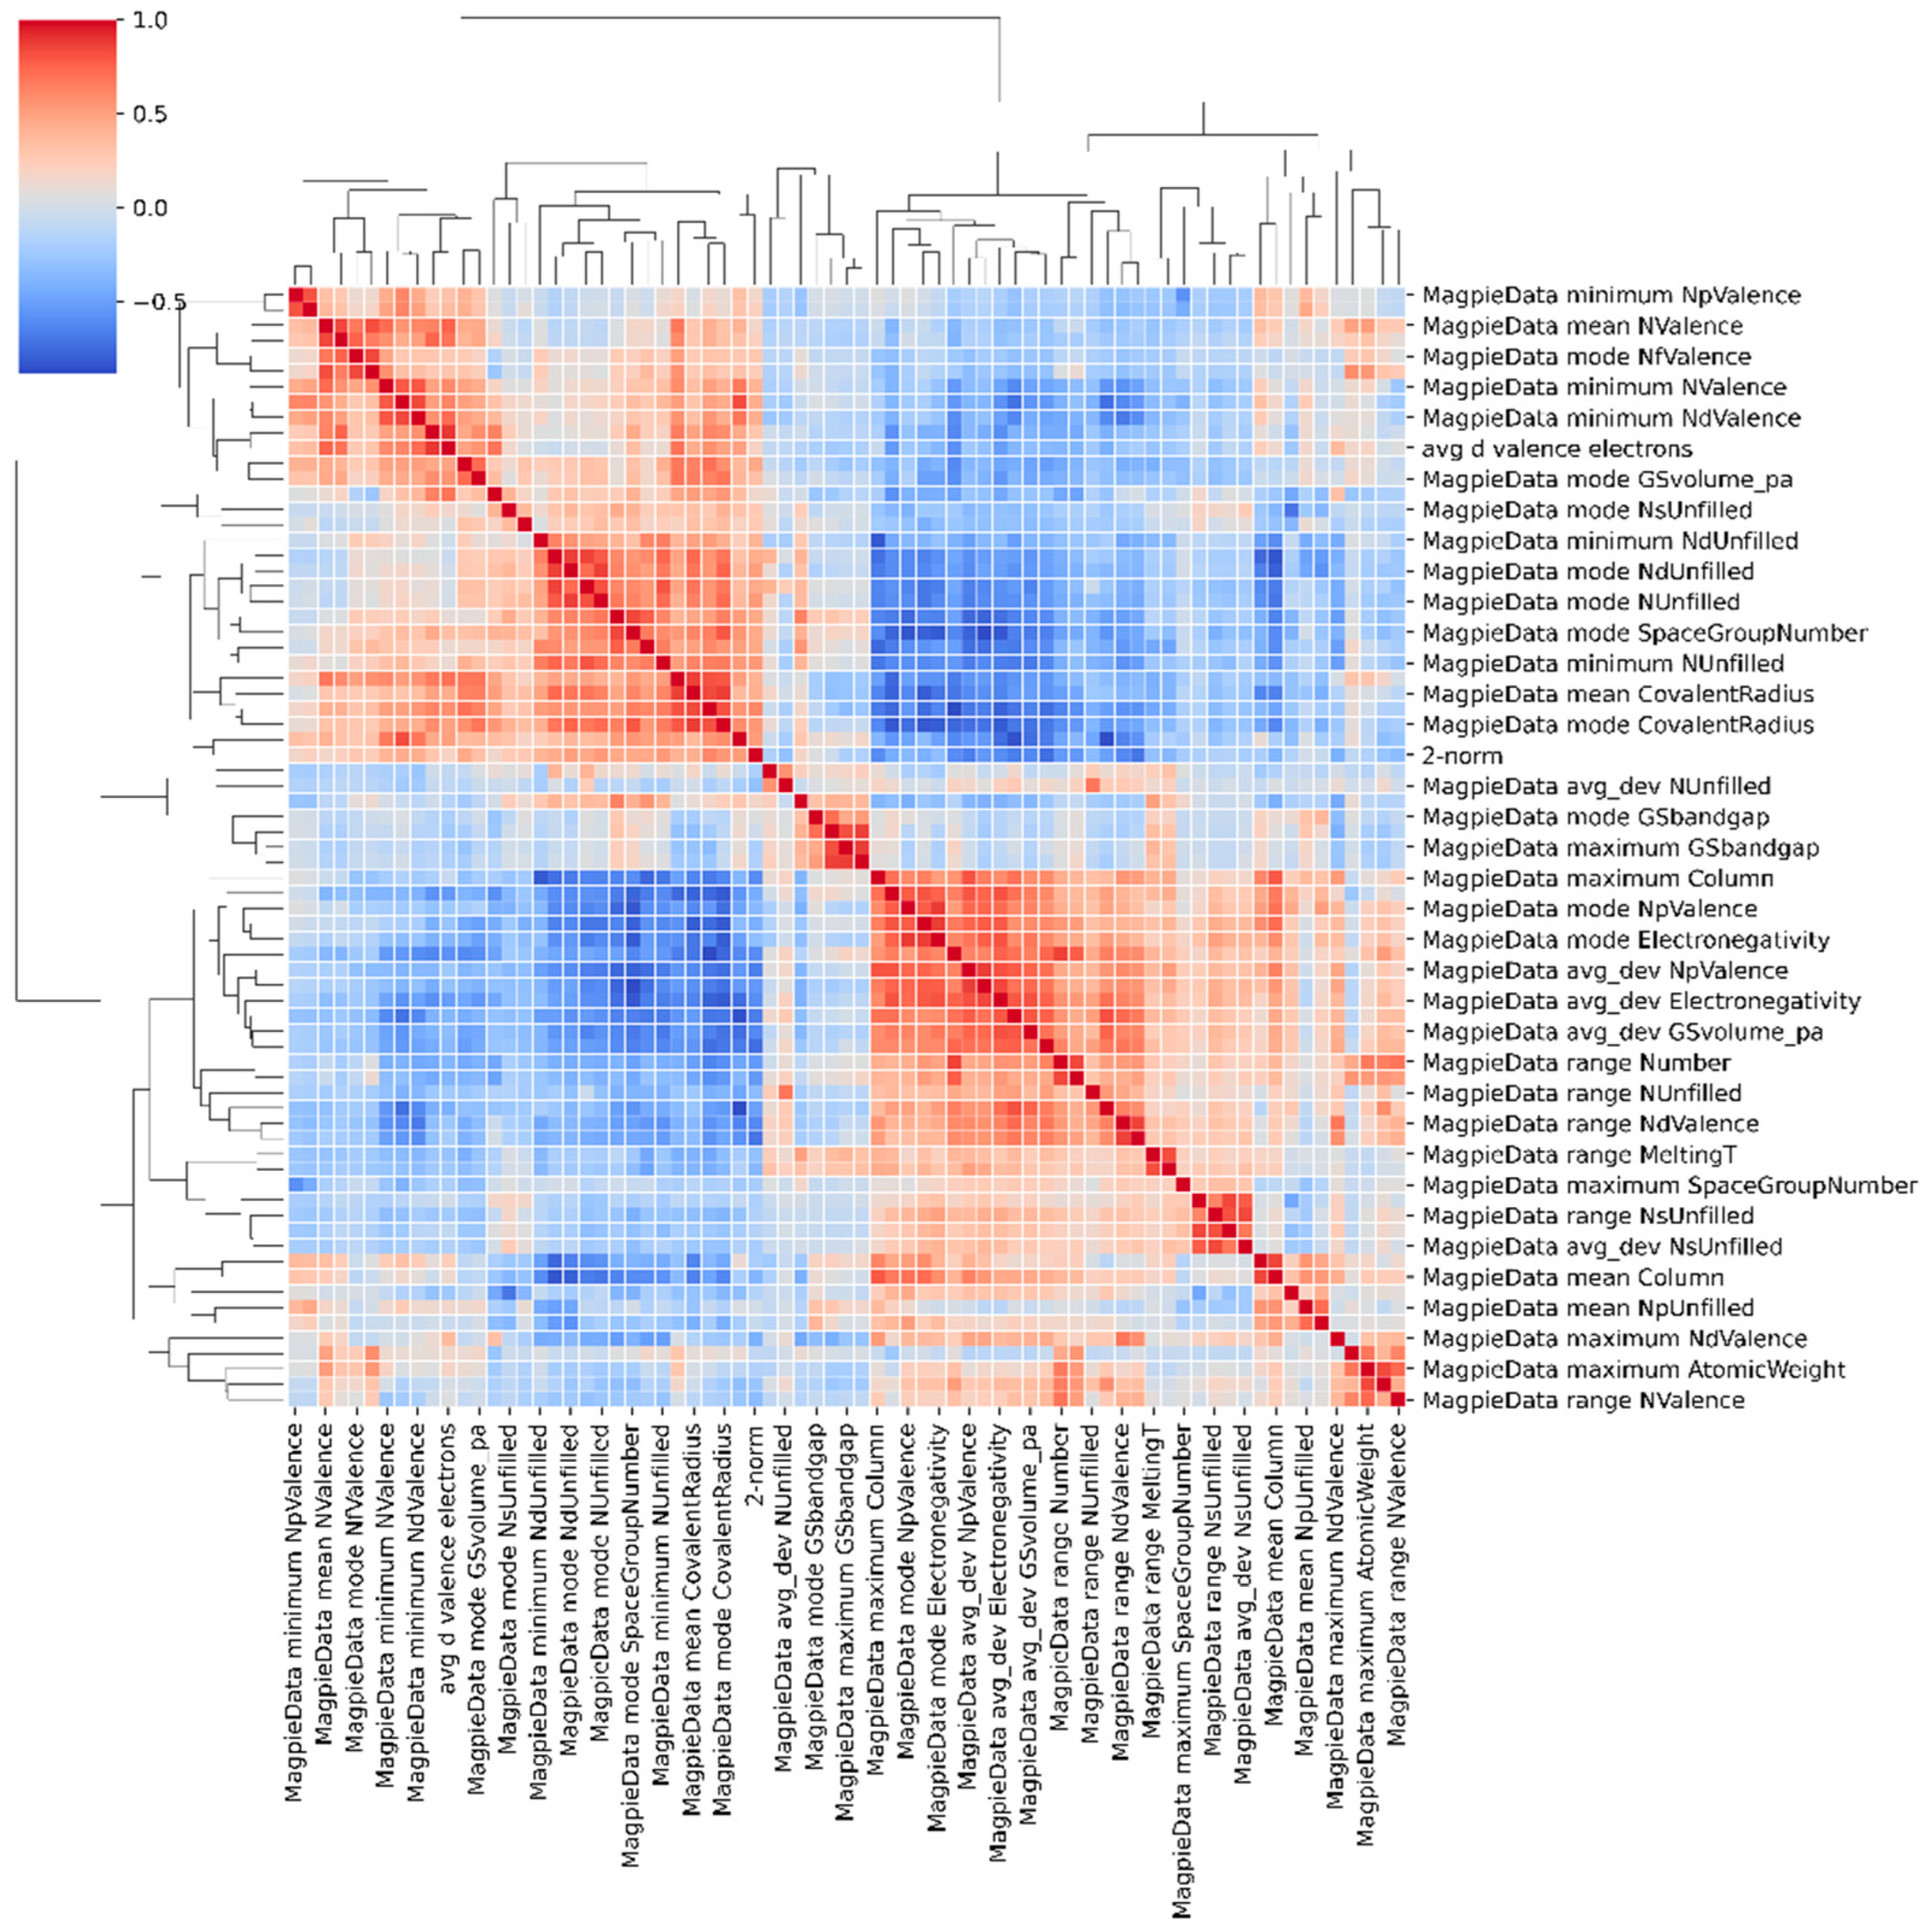
3.1. Chemistry—Property Correlation

We established a quantitative correlation between Tc in the materials’ chemistry, specifically their compositions. The ML model, built on the carefully selected features, illuminates the underlying chemical dependencies that govern the superconducting characteristics of these materials. In Figure 4, we showcase the efficacy of our regression model using Random Forest, which was found to perform the best of all models. The first panel (a) illustrates the model’s performance on the training dataset, displaying a scatter plot where the actual Tc is plotted against the predicted values. The coefficient of determination (R2 = 0.98) signifies the model’s accuracy in capturing the underlying patterns of the training data. Similarly, the second panel (b) depicts the model’s predictions compared to the actual Tc values for the test dataset, achieving a notable R2 value of 0.92, which demonstrates the model’s robust generalization capabilities for unseen data. R2 values for both training and test datasets are close to each other and high, which suggests that the model not only fits the training data well but also generalizes effectively on unseen data.

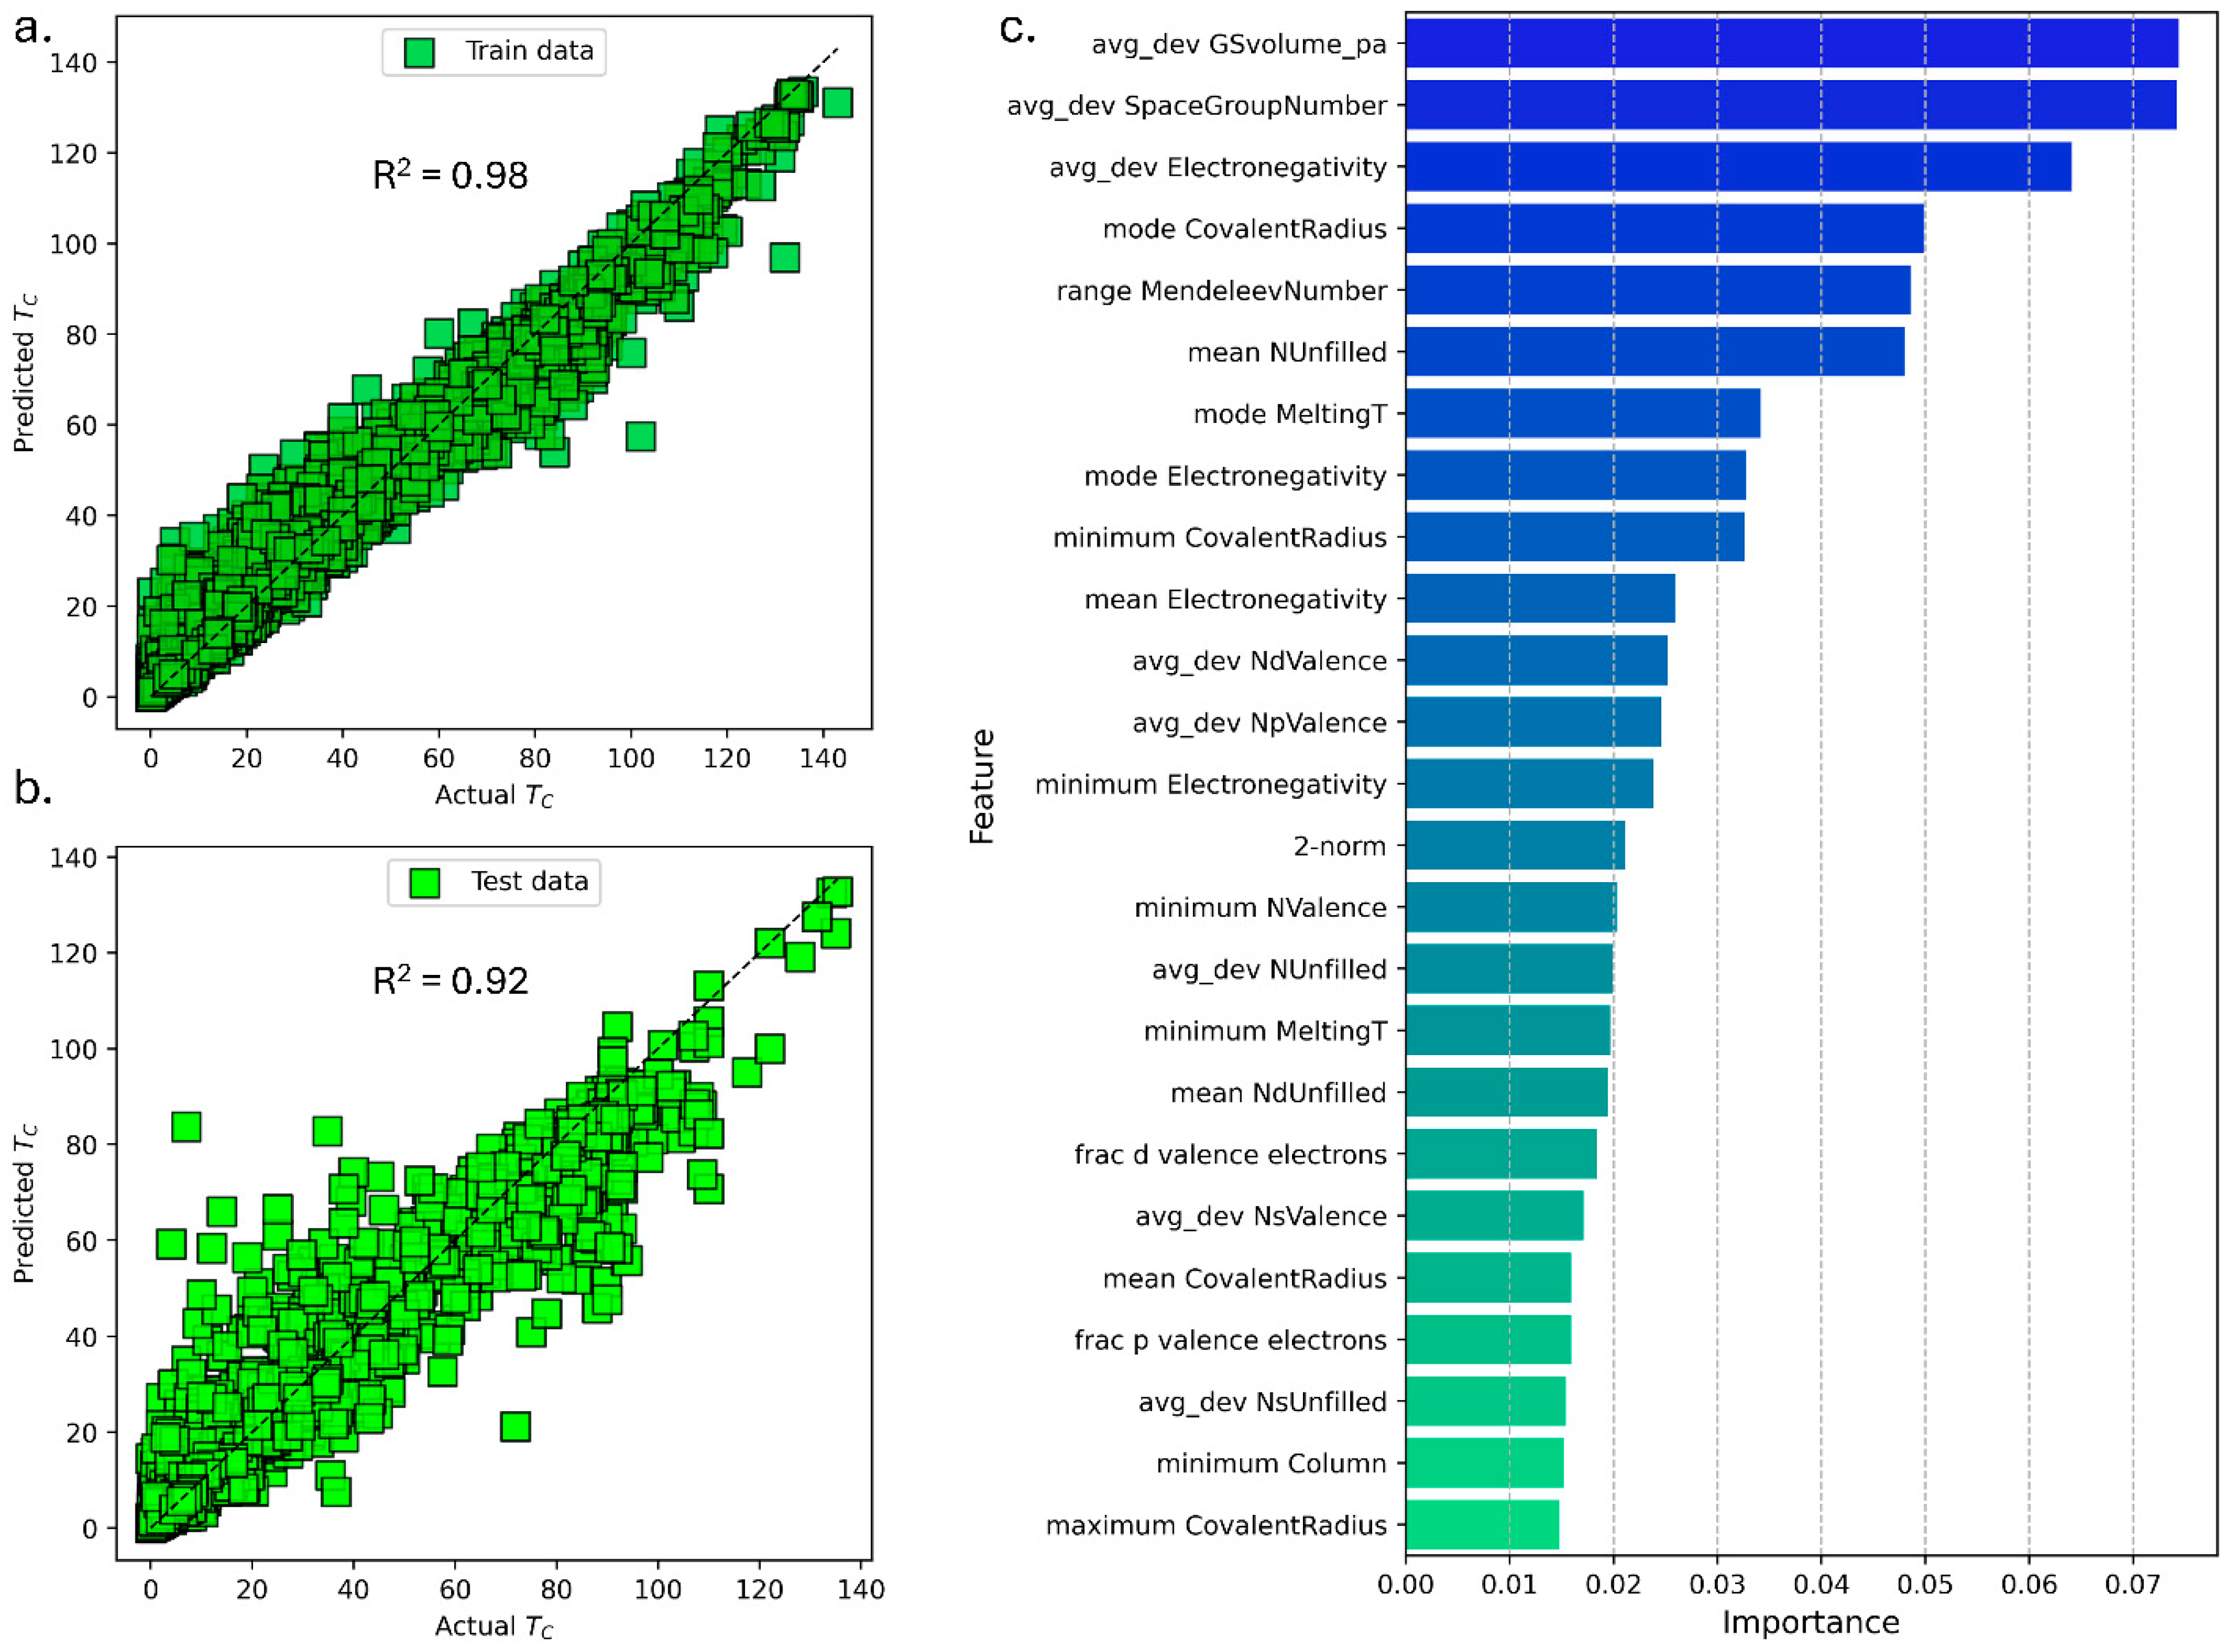
3.2. Feature Importance

Table 1 provides the description of some selected features from the list of topmost important features. Using the Random Forest model, the importance of different material properties on the superconductor critical temperature prediction was examined. In Figure 4c, the top 25 features are displayed in the bar plot, which makes it evident which features, in accordance with the model, have the greatest influence on Tc. Features like average deviation in the Goldschmidt volume per atom and average deviation of the space group numbers are at the top of the list, indicating that atomic volume changes and crystal structure symmetry are important factors in determining Tc. Notable is the feature average variation in electronegativity, which suggests that superconducting behavior can be strongly predicted by the average difference in element electronegativities within a compound. Some prominent features highlight the significance of atomic sizes and periodic table trends, respectively: ‘mode CovalentRadius’ and ‘range MendeleevNumber’.
Figure 5 presents a set of scatter plots (panels a–f) that demonstrate the performance of our trained model across different groups of superconducting materials categorized by their composition types, such as Oxide, Stannide, Telluride, Nitride, Fluoride, and Sulfide. Incorporating data from a diverse range of superconducting materials beyond nitrides—including oxides, halides, and sulfides—allows the model to learn more generalized patterns. While the dataset could have been increased even further by adding other types of well-studied superconducting structures, such as cuprates, kagomes, and Fe-based structures, this initial study has sought to include only similar classes of materials to maintain the underlying physics of NbN-based systems. This approach enhances the model’s prediction ability by making it more adaptable and less dependent on specific composition types or stoichiometries. Although this strategy introduces some uncertainty due to differences between material classes, it also strengthens the model’s capability to predict Tc for less-represented systems like nitrides, where data are currently limited.
Each panel on the figure compares the actual Tc of the materials with the Tc predicted by the model, with the identity line representing perfect prediction. The purpose of these plots is twofold. Firstly, they validate the model’s ability to generalize across a range of material classes, ensuring that the patterns learned are not specific to a single type of composition. Secondly, the plot corresponding to nitrides (panel d) is of particular interest as it provides assurance that the model can reliably predict the behavior of the superconductors within the composition type central to our focus. With confidence in the model’s generalization capability, we apply it to a virtual search space within the nitride group.

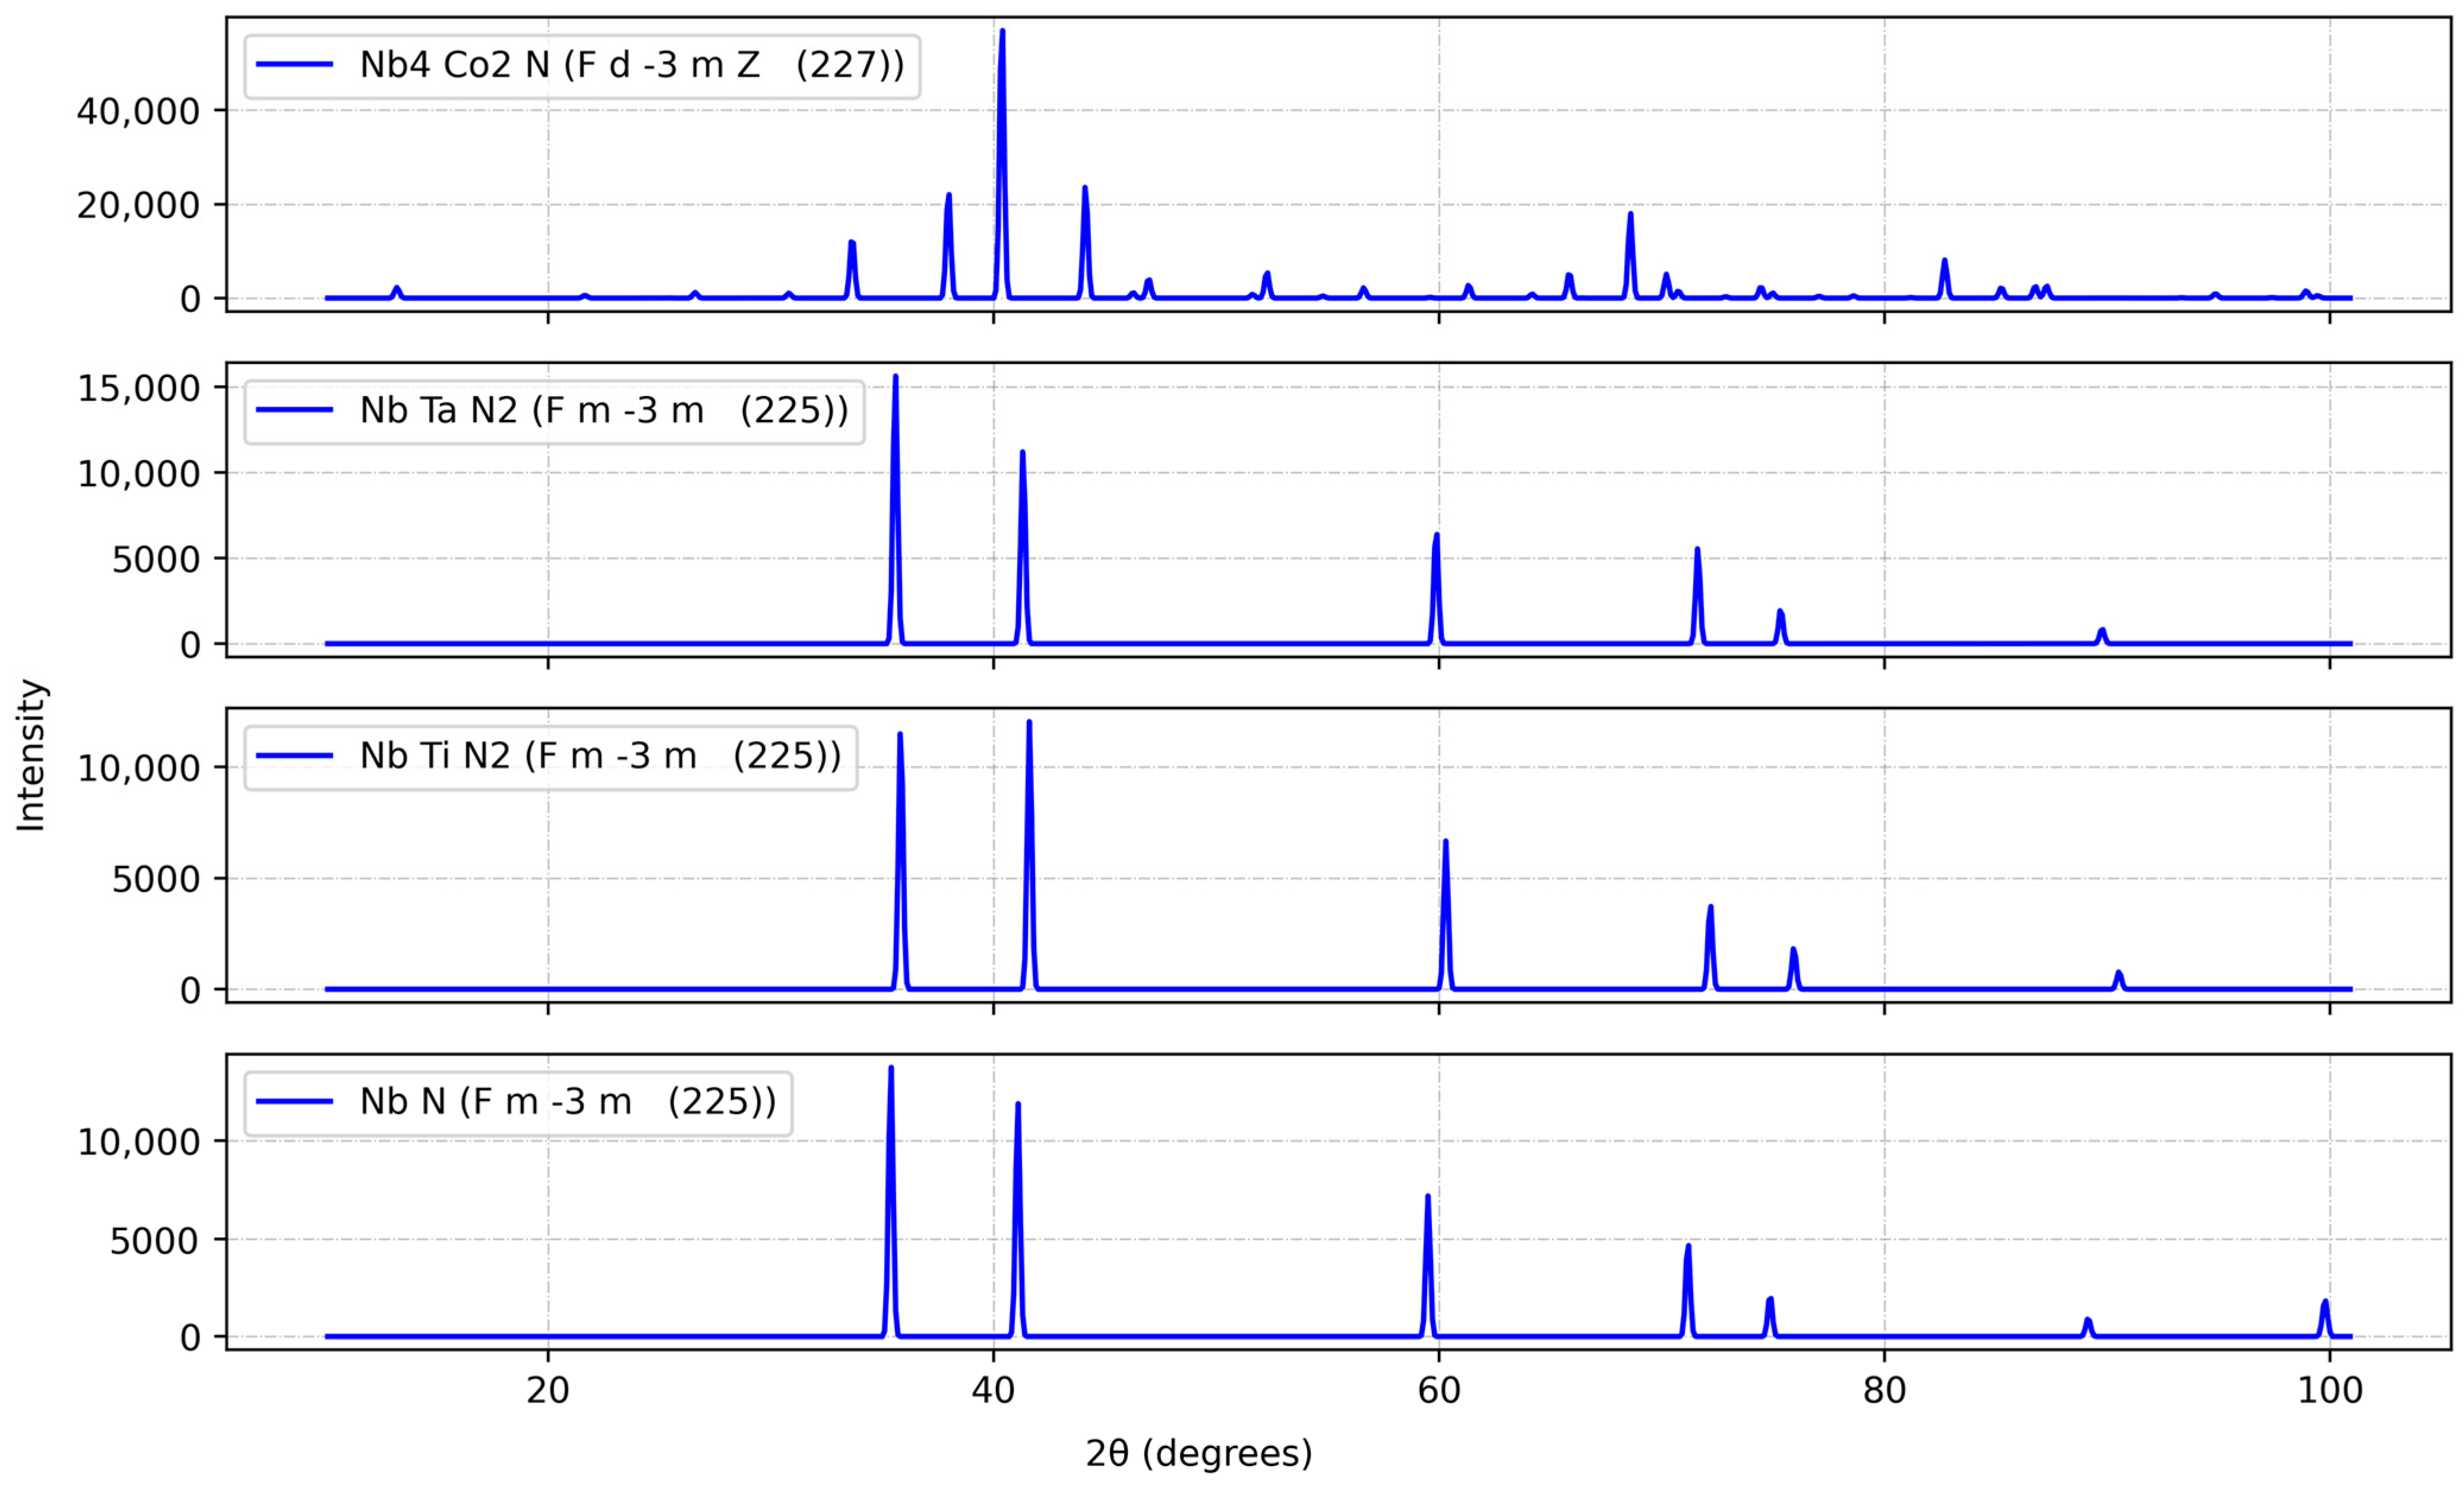
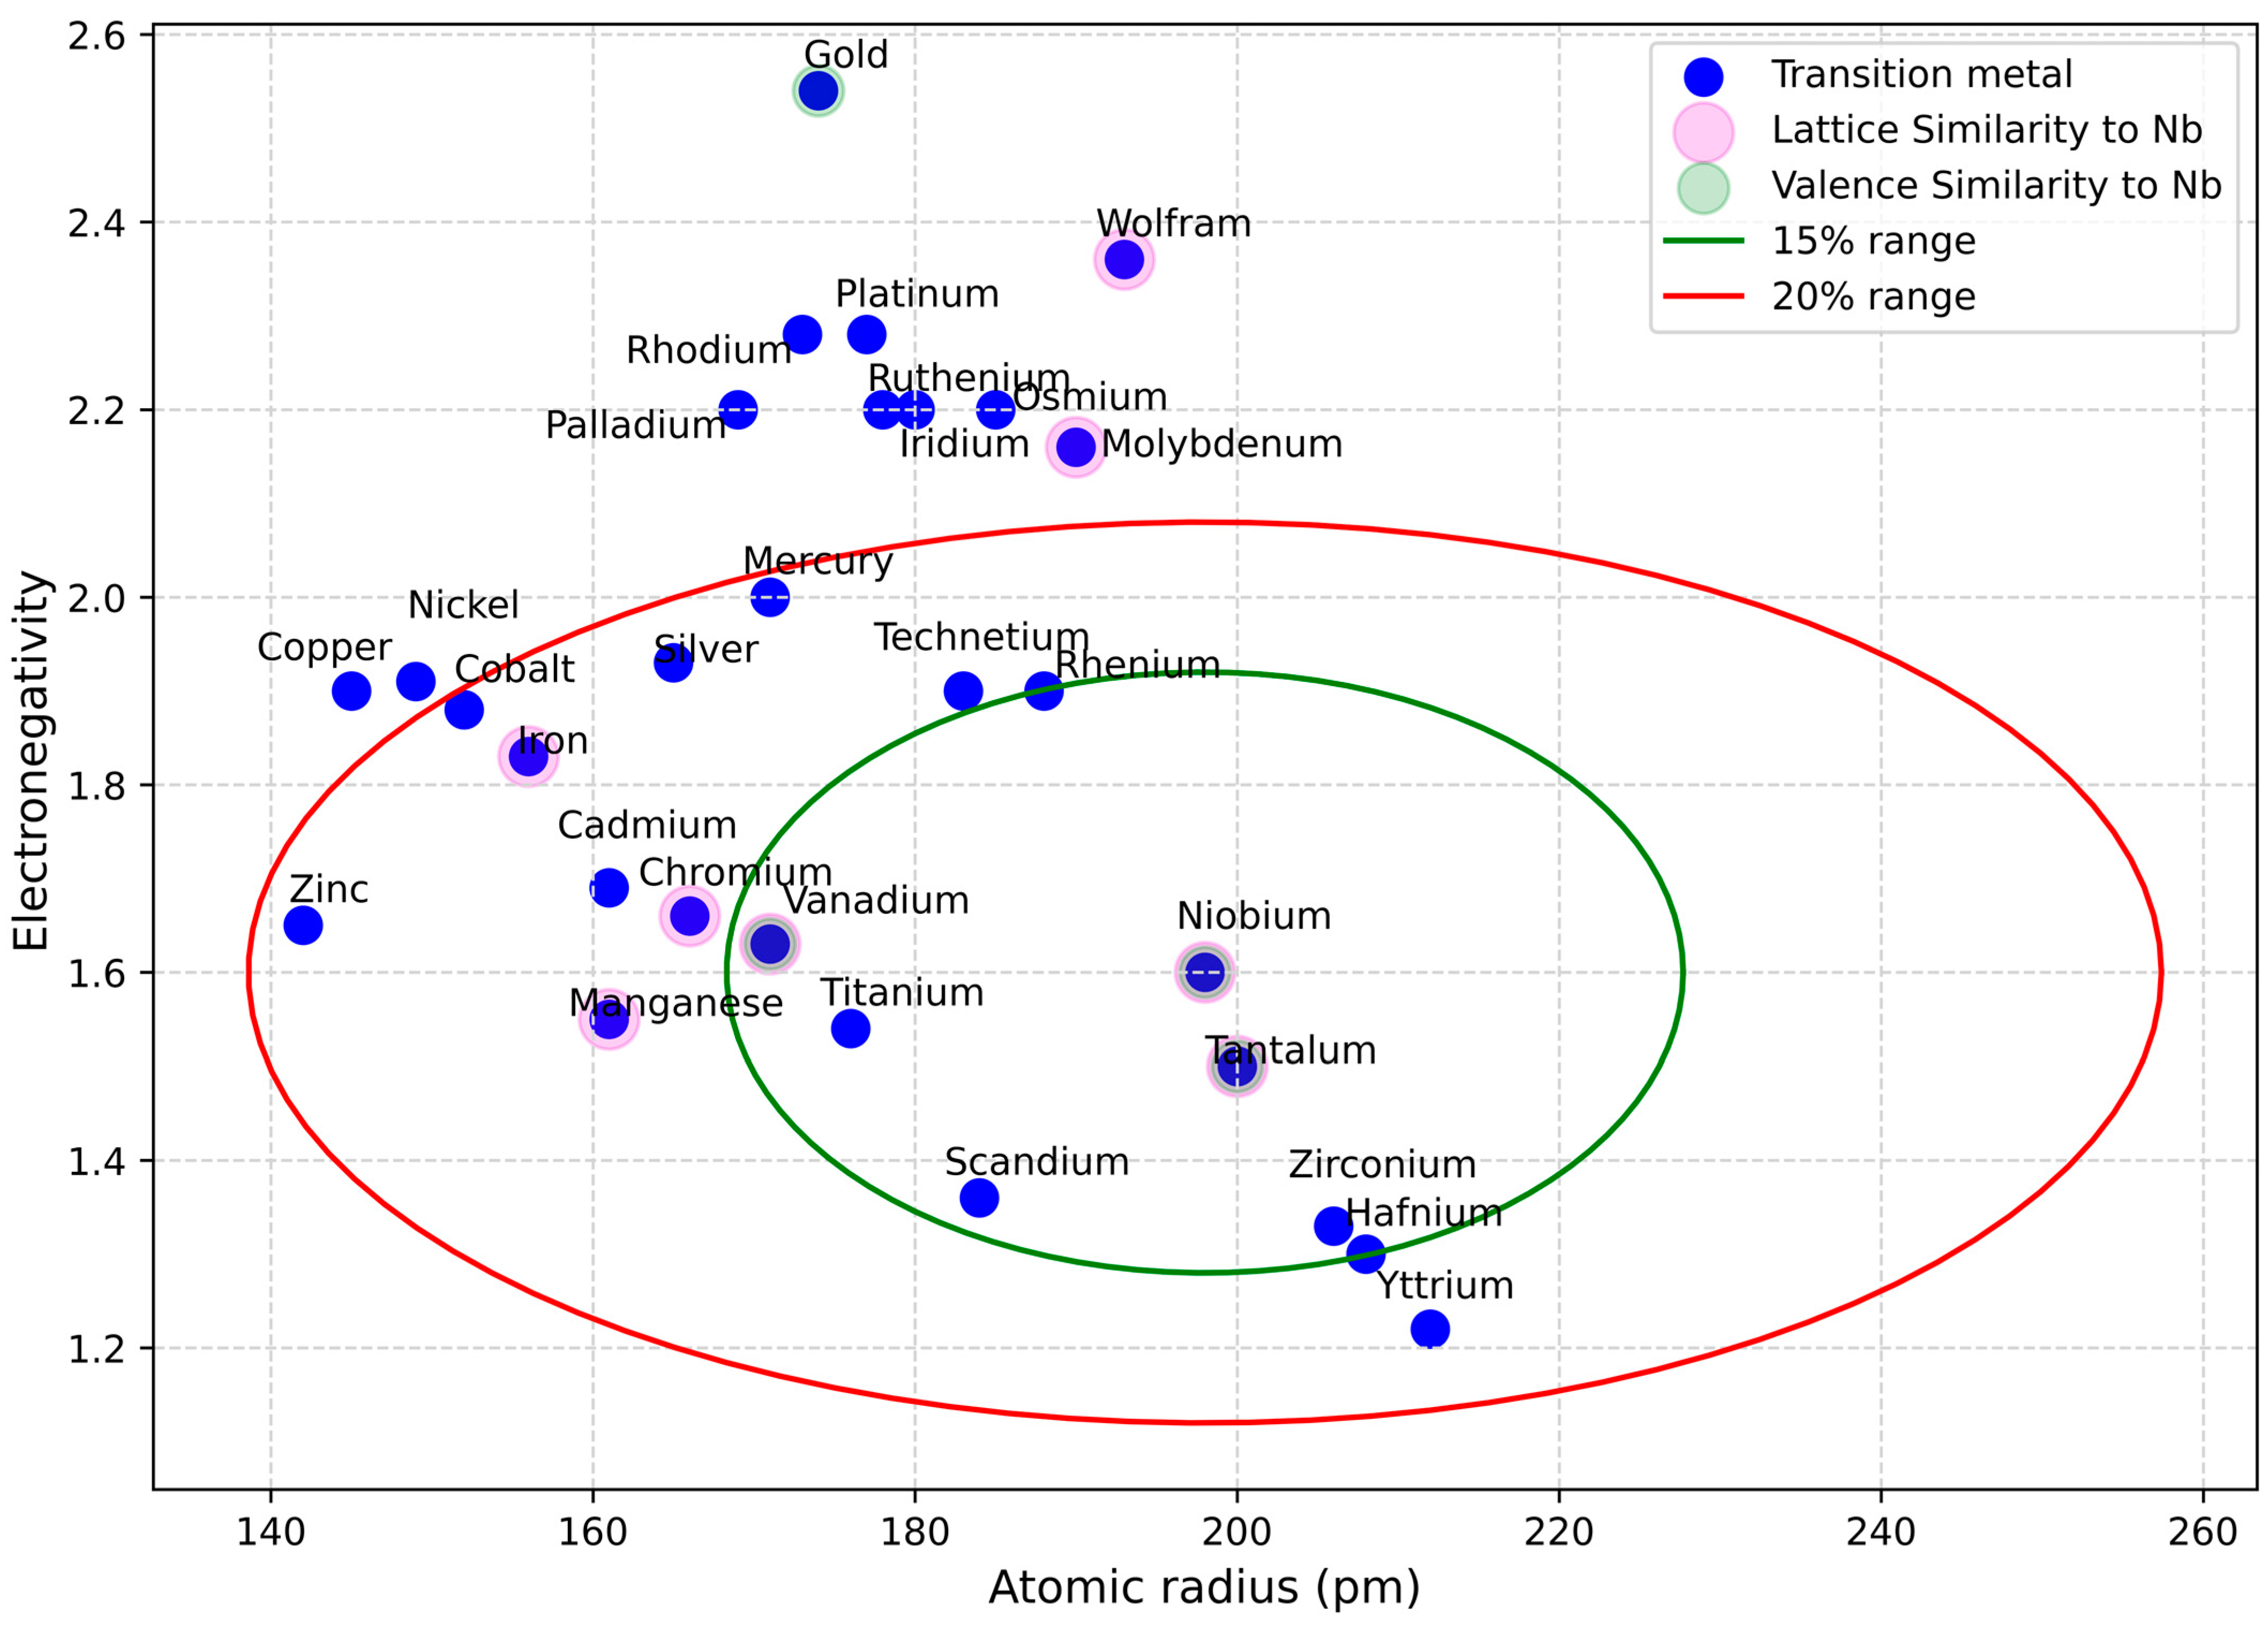
3.3. Effects of Elemental Substitution on NbN Structure

While not explicitly defined within the models discussed, crystal structure has a significant impact on property, and the crystal structure is significantly impacted by chemistry. Substituting different elements into the NbN matrix can significantly impact its crystallinity and phase stability, as seen in Figure 6. The X-ray diffraction (XRD) patterns, ingested from the ICSD database [23,24,25], for NbN with various elemental substitutions demonstrate the impact on crystallinity, phase stability, and peak intensity, with Ti and Ta additions having minor impact as compared to Co. Even if the impact is embedded in the analysis, as demonstrated by the model accuracy, for prediction of new systems, this issue must still be considered.
Transition from theoretical predictions to practical application requires a careful examination of whether the identified substitutions truly maintain or enhance the structural features necessary for optimal superconductivity. To address the structural issues, we follow the Hume–Rothery (HR) rules [26,27,28] to identify substitutional elements which have closer solubility with Nb and have higher likelihood to maintain stability when substituted for Nb (Figure 7).
We explored the substitutional potential within the NbN superconductor system, aiming to enhance Tc by invoking the HR rules as a theoretical scaffold. Initially, we addressed the atomic size factor by comparing the atomic radii differences, ensuring that the discrepancy between the host and the substituting atoms did not exceed the critical 15% threshold that could lead to significant lattice distortion and impede solubility. Furthermore, we took into account the electrochemical factor by examining the electronegativity of the elements in question. In line with HR’s guidance, we considered the propensity for elements with differing electronegativities to form compounds rather than solid solutions. The atomic size factor is essential for maintaining the integrity of the NbN crystal lattice. A substitute with a significantly different atomic radius could distort the lattice, affecting the electronic properties crucial for superconductivity. Additionally, we evaluated the relative valency factor, acknowledging that metals with lower valency have a higher likelihood of dissolving metals with higher valency, as per historical observations in alloys containing copper, silver, or gold with higher-valency metals. Through these HR parameters, we filtered and identified suitable candidates for substitution in the NbN matrix. Ta is seen to be most similar to Nb by these rules, and then Ti, Sc, Zr, Hf, and V are also similar. Numerous other elements including Co are found in the second layer of similarity, which would suggest structural change with some addition. These findings match the XRD patterns in Figure 6.

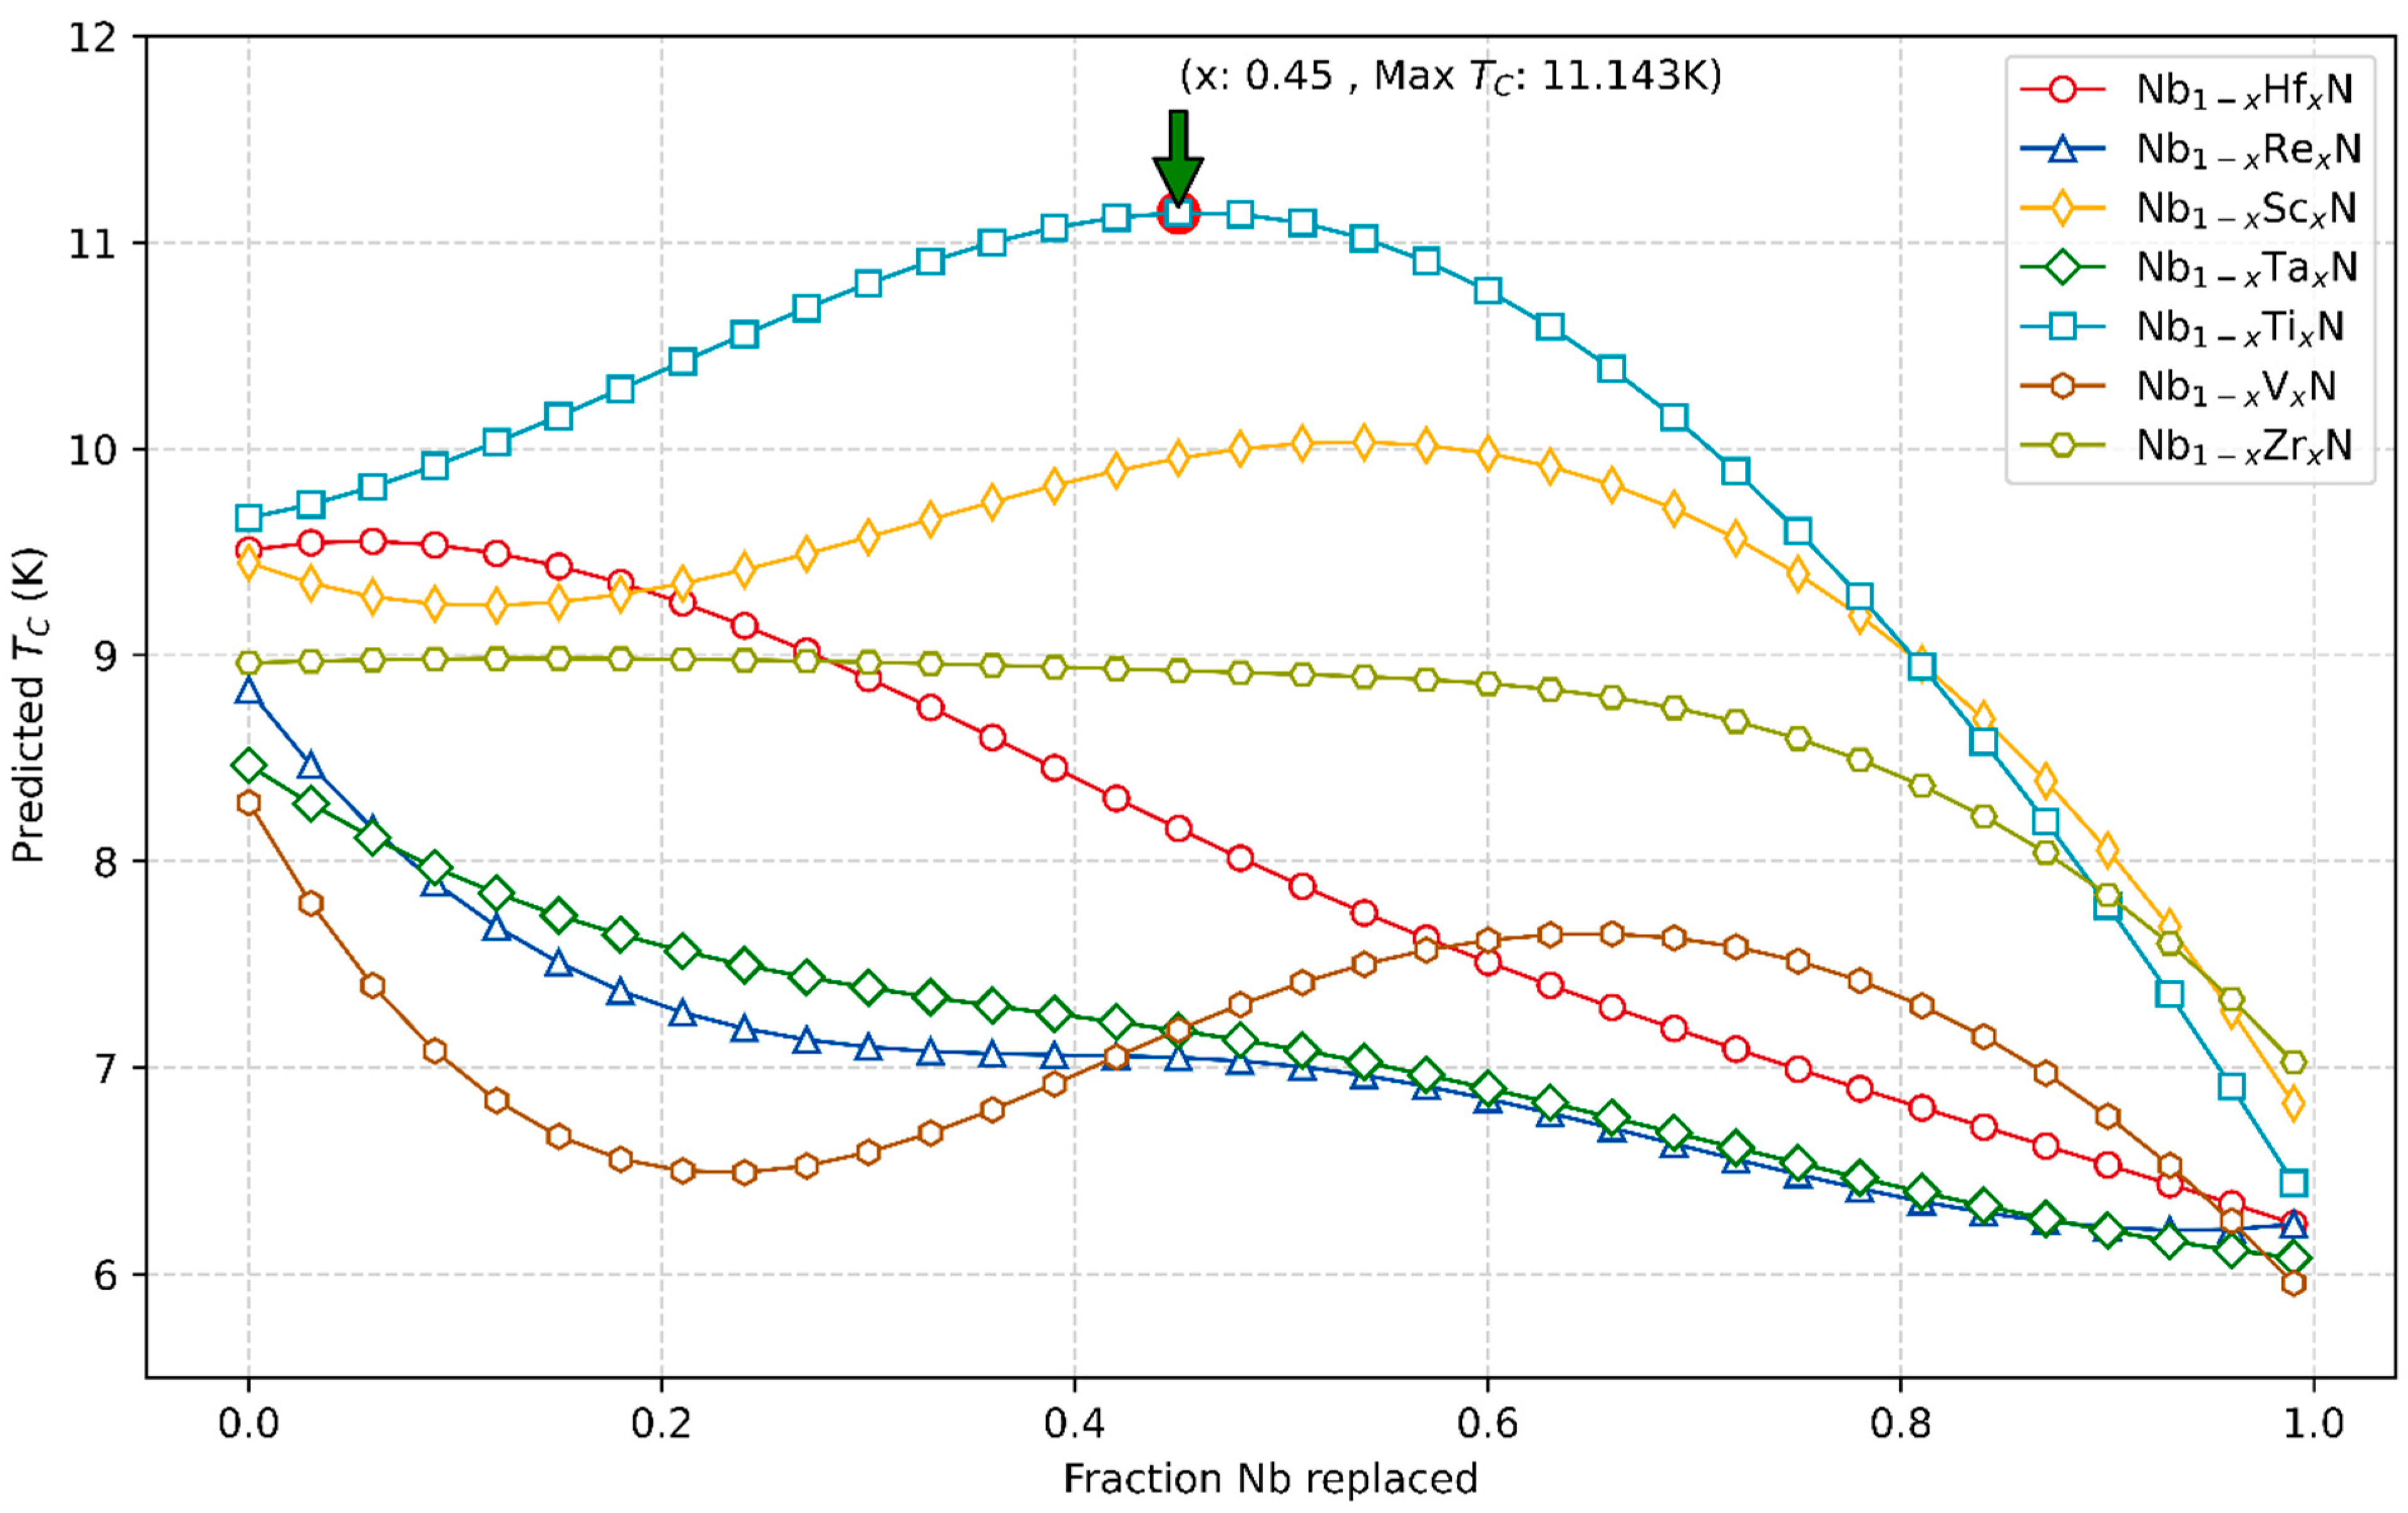
3.4. Ternary Transition Metal Nitrides as Superconductor

Figure 8 illustrates the impact of substituting different elements in place of niobium (Nb) within the NbN compound on the predicted Tc. The graph showcases how Tc varies with the level of substitution for several dopants, each represented by a unique color and symbol on the plot (smoothened using Spline interpolation). For each dopant, the x-axis indicates the proportion of Nb that has been replaced by the doping element, ranging from 0 (pure NbN) to 1 (completely substituted). The y-axis displays the predicted Tc values, highlighting how each element’s incorporation influences the superconducting behavior of NbN.

3.5. Quaternary Nitrides as Superconductor

Our investigation into ternary systems led to an improvement and we want to expand to quaternary systems with the goal of further improving the Tc. This introduces two transition metals along with Nb. We selected the NbTaTiN system as our quaternary system because NbTaN and NbTiN have been extensively studied in experimental investigations. Additionally, in Figure 5, Ta and Ti remain close to Nb in terms of the HR. Figure 9 presents a visualization of how the Tc varies across different compositions within the Nb-Ti-Ta-N system. The corners of the ternary diagram represent the pure nitrides (NbN, TiN, and TaN), with each point within the diagram denoting a unique alloy composition based on its position. The color gradient, ranging from blue (low Tc) to red (high Tc), illustrates the predicted Tc values for each composition, highlighting the compositional trends that govern superconductivity. Higher Tc values are observed in the middle of the triangle, indicating that a balanced composition among the elements (Nb, Ti, Ta) is crucial for Tc enhancement (Table 2).
While our model provides a valuable starting point for identifying potential substitutions in the NbN superconductor, it is important to recognize that it tends to underestimate the actual critical temperatures that have been observed in bulk materials [11]. Experimental validation of these systems would further enhance confidence in this work; although given the large initial dataset, which included multi-component systems, the experimental test set was significant, giving confidence in the model. Additionally, under-prediction of the Tc values is preferred to over-prediction, to ensure that the model does not suggest systems that may not be useful for superconducting applications. Tc does not just depend on the chemical makeup of the material; it is also significantly influenced by the specific processing conditions used during synthesis. Aspects such as the purity of the materials, the heat treatment protocols, and even the microstructure of the final product can all impact superconductivity. In fact, by carefully tuning these processing parameters, researchers have been able to achieve enhanced superconducting properties beyond what might be expected from the chemical composition alone. These experimental successes underscore the potential to elevate the superconducting performance of NbN-based materials when both the chemistry and the processing techniques are optimized in tandem.

4. Conclusions

Ternary and quaternary nitrides are promising for enhanced critical temperature; however, the number of potential compositions is huge, necessitating a strategy to identify the few most promising compositions. To address this challenge, we have developed an efficient model for exploring the NbN space, which overcomes the issues with small data. Our results show that highest Tc increases with an increasing number of constituent elements and provides guidance to explore the high-entropy nitrides. When adding Ti in the NbN matrix, it is expected to improve the Tc, while Re, V, and Hf tend to decrease Tc. In the exploration of the quaternary system Nb-Ta-Ti-N, our study tells us that there is huge potential of Tc and indicates that ternary and quaternary nitrides can potentially improve the superconducting transition temperature and reduce the stabilization issue by increasing the conformational entropy of the system. Our work serves as a reference for tuning and enhancing the properties of the nitrides, as well as guiding which experiments are needed to continue to improve the high-temperature capabilities of superconductors in a broader range of nitride materials.

Supplementary Materials

The following supporting information can be downloaded at: https://www.mdpi.com/article/10.3390/app14209196/s1: Table S1: Hyperparameter optimization and evaluation of trained regression models, along with a brief overview of the evaluation metrics used for the regression models.

Author Contributions

M.T.I. and S.B. wrote the main manuscript text, M.T.I. performed the analysis, M.T.I. and Q.L. collected the data, and S.B. supervised the work. All authors have read and agreed to the published version of the manuscript.

Funding

This research was funded by the Army Research Laboratory grant number [W911NF-23-2-0087].

Institutional Review Board Statement

Not applicable.

Informed Consent Statement

Not applicable.

Data Availability Statement

The data supporting the findings of this study are openly available at https://github.com/tohid-1222/nitride_supercon. This repository includes datasets and codes to facilitate the training of the models. URL accessed on 8 October 2024.

Acknowledgments

This research was supported by the Army Research Laboratory under Cooperative Agreement Number W911NF-23-2-0087. The views and conclusions contained in this document are those of the authors and should not be interpreted as representing the official policies, either expressed or implied, of the Army Research Laboratory or the U.S. Government. The U.S. Government is authorized to reproduce and distribute reprints for Government purposes notwithstanding any copyright notation herein.

Conflicts of Interest

The authors declare no conflict of interest.

References

  1. Cucciniello, N.; Lee, D.; Feng, H.Y.; Yang, Z.; Zeng, H.; Patibandla, N.; Zhu, M.; Jia, Q. Superconducting niobium nitride: A perspective from processing, microstructure, and superconducting property for single photon detectors. J. Phys. Condens. Matter 2022, 34, 374003. [Google Scholar] [CrossRef]
  2. Aschermann, G.; Friederich, E.; Justi, E.; Kramer, J. Supraleitfähige Verbindungen mit extrem hohen Sprungtemperaturen (NbH und NbN). In Technischwissenschaftliche Abhandlungen der Osram-Gesellschaft: 5. Band; Springer: Berlin/Heidelberg, Germany, 1943; pp. 401–416. [Google Scholar]
  3. Jouve, G.; Séverac, C.; Cantacuzène, S. XPS study of NbN and (NbTi)N superconducting coatings. Thin Solid Film. 1996, 287, 146–153. [Google Scholar] [CrossRef]
  4. Krishnan, R.; David, C.; Ajikumar, P.K.; Dash, S.; Tyagi, A.K.; Jayaram, V.; Raj, B. Reactive pulsed laser deposition and characterization of niobium nitride thin films. Surf. Coat. Technol. 2011, 206, 1196–1202. [Google Scholar] [CrossRef]
  5. Hiltunen, L.; Leskelä, M.; Mäkelä, M.; Niinistö, L.; Nykänen, E.; Soininen, P. Nitrides of titanium, niobium, tantalum and molybdenum grown as thin films by the atomic layer epitaxy method. Thin Solid Film. 1988, 166, 149–154. [Google Scholar] [CrossRef]
  6. Groll, N.R.; Klug, J.A.; Cao, C.; Altin, S.; Claus, H.; Becker, N.G.; Zasadzinski, J.F.; Pellin, M.J.; Proslier, T. Tunneling spectroscopy of superconducting MoN and NbTiN grown by atomic layer deposition. Appl. Phys. Lett. 2014, 104, 092602. [Google Scholar] [CrossRef]
  7. Lee, P.J.; Fischer, C.M.; Larbalestier, D.C.; Naus, M.T.; Squitieri, A.A.; Starch, W.L.; Werner, J.; Limon, P.J.; Sabbi, C.; Zlobin, A.; et al. Development of high performance multifilamentary Nb-Ti-Ta superconductor for LHC insertion quadrupoles. IEEE Trans. Appl. Supercond. 1999, 9, 1571–1574. [Google Scholar] [CrossRef]
  8. Yu, L.; Singh, R.; Liu, H.; Wu, S.; Hu, R.; Durand, D.; Bulman, J.; Rowell, J.; Newman, N. Fabrication of Niobium Titanium Nitride Thin Films With High Superconducting Transition Temperatures and Short Penetration Lengths. IEEE Trans. Appl. Supercond. 2005, 15, 44–48. [Google Scholar] [CrossRef]
  9. Burton, M.C.; Beebe, M.R.; Yang, K.; Lukaszew, R.A.; Valente-Feliciano, A.-M.; Reece, C. Superconducting NbTiN thin films for superconducting radio frequency accelerator cavity applications. J. Vac. Sci. Technol. A 2016, 34, 021518. [Google Scholar] [CrossRef]
  10. Andreone, A.; DiChiara, A.; Peluso, G.; Santoro, M.; Attanasio, C.; Maritato, L.; Vaglio, R. Surface impedance measurements of superconducting (NbTi)N films by a ring microstrip resonator technique. J. Appl. Phys. 1993, 73, 4500–4506. [Google Scholar] [CrossRef]
  11. Gavaler, J.R.; Deis, D.W.; Hulm, J.K.; Jones, C.K. Superconducting properties of niobium-titanium-nitride thin films. Appl. Phys. Lett. 1969, 15, 329–331. [Google Scholar] [CrossRef]
  12. Di Leo, R.; Nigro, A.; Nobile, G.; Vaglio, R. Niboium-titanium nitride thin films for superconducting rf accelerator cavities. J. Low Temp. Phys. 1990, 78, 41–50. [Google Scholar] [CrossRef]
  13. Dorenbos, S.N.; Reiger, E.M.; Perinetti, U.; Zwiller, V.; Zijlstra, T.; Klapwijk, T.M. Low noise superconducting single photon detectors on silicon. Appl. Phys. Lett. 2008, 93, 131101. [Google Scholar] [CrossRef]
  14. Yemane, Y.T.; Sowa, M.J.; Zhang, J.; Ju, L.; Deguns, E.W.; Strandwitz, N.C.; Prinz, F.B.; Provine, J. Superconducting niobium titanium nitride thin films deposited by plasma-enhanced atomic layer deposition. Supercond. Sci. Technol. 2017, 30, 095010. [Google Scholar] [CrossRef]
  15. Zmuidzinas, J.; Kooi, J.W.; Kawamura, J.; Chattopadhyay, G.; Bumble, B.; LeDuc, H.G.; Stern, J.A. Development of SIS mixers for 1 THz. In Proceedings of the Advanced Technology MMW, Radio, and Terahertz Telescopes, Kona, HI, USA, 20–28 March 1998; pp. 53–62. [Google Scholar]
  16. He, Y.; Lin, J.; Liu, Z.; Wang, H.; Li, L.-J.; Han, S. AMC: AutoML for Model Compression and Acceleration on Mobile Devices. In Proceedings of the European Conference on Computer Vision (ECCV), Munich, Germany, 8–14 September 2018; Ferrari, V., Hebert, M., Sminchisescu, C., Weiss, Y., Eds.; Springer International Publishing: Cham, Germany, 2018; pp. 815–832. [Google Scholar]
  17. Grigorescu, S.; Trasnea, B.; Cocias, T.; Macesanu, G. A survey of deep learning techniques for autonomous driving. J. Field Robot. 2020, 37, 362–386. [Google Scholar] [CrossRef]
  18. Sutton, R.S.; Barto, A.G. Reinforcement Learning: An Introduction; MIT Press: Cambridge, MA, USA, 2018. [Google Scholar]
  19. LeCun, Y.; Bengio, Y.; Hinton, G. Deep learning. Nature 2015, 521, 436–444. [Google Scholar] [CrossRef]
  20. Stanev, V.; Oses, C.; Kusne, A.G.; Rodriguez, E.; Paglione, J.; Curtarolo, S.; Takeuchi, I. Machine learning modeling of superconducting critical temperature. Npj Comput. Mater. 2018, 4, 29. [Google Scholar] [CrossRef]
  21. Foppiano, L.; Dieb, S.; Suzuki, A.; De Castro, P.B.; Iwasaki, S.; Uzuki, A.; Echevarria, M.G.E.; Meng, Y.; Terashima, K.; Romary, L.; et al. SuperMat: Construction of a linked annotated dataset from superconductors-related publications. Sci. Technol. Adv. Mater. Methods 2021, 1, 34–44. [Google Scholar] [CrossRef]
  22. Ward, L.; Dunn, A.; Faghaninia, A.; Zimmermann, N.E.R.; Bajaj, S.; Wang, Q.; Montoya, J.; Chen, J.; Bystrom, K.; Dylla, M.; et al. Matminer: An open source toolkit for materials data mining. Comput. Mater. Sci. 2018, 152, 60–69. [Google Scholar] [CrossRef]
  23. FIZ Karlsruhe. Inorganic Crystal Structure Database (ICSD); FIZ Karlsruhe. 2024. Available online: https://icsd-fiz-karlsruhe-de.gate.lib.buffalo.edu/search/basic.xhtml (accessed on 8 October 2024).
  24. Brauer, G.; Mohr-Rosenbaum, E. Beitrag zur Kenntnis des Systems Niob–Tantal–Stickstoff. Z. Anorg. Allg. Chem. 1974, 405, 225–229. [Google Scholar] [CrossRef]
  25. Duwez, P.; Odell, F. Phase Relationships in the Binary Systems of Nitrides and Carbides of Zirconium, Columbium, Titanium, and Vanadium. J. Electrochem. Soc. 1950, 97, 299. [Google Scholar] [CrossRef]
  26. Wang, Z.; Huang, Y.; Yang, Y.; Wang, J.; Liu, C.T. Atomic-size effect and solid solubility of multicomponent alloys. Scr. Mater. 2015, 94, 28–31. [Google Scholar] [CrossRef]
  27. Zhang, Y.; Zhou, Y.; Lin, J.; Chen, G.; Liaw, P. Solid-Solution Phase Formation Rules for Multi-component Alloys. Adv. Eng. Mater. 2008, 10, 534–538. [Google Scholar] [CrossRef]
  28. Poletti, M.G.; Battezzati, L. Electronic and thermodynamic criteria for the occurrence of high entropy alloys in metallic systems. Acta Mater. 2014, 75, 297–306. [Google Scholar] [CrossRef]
Figure 1. Impact of titanium substitution on NbN superconducting films. (a) presents critical current (Jc) as a function of the magnetic field (H) for NbN films with varying concentrations of titanium, demonstrating a decline in Jc and the critical field (Hc2) with increasing titanium content. (b) provides experimental data for two NbN films, one pure and the other with titanium substitution (Nb0.5Ti0.5N), detailing their respective critical temperatures (Tc) and other superconducting parameters. The measured Tc values, approximately 15 K for NbN and 15.5 K for Nb0.5Ti0.5N, indicate a slight increase with titanium addition. (Adapted with permission from [11]).
Applsci 14 09196 g001
Figure 2. Distribution and spread of Tc in the Superconductivity2018 dataset. The histogram shows the frequency distribution of Tc values across the dataset, highlighting a significant skew towards lower temperatures, with most data points concentrated below 20 K. The Kernel Density Estimate (KDE) curve (in blue) illustrates the overall shape of the distribution.
Applsci 14 09196 g002
Figure 3. Clustered heatmap of the correlation matrix for the selected features used in the machine learning models. The heatmap illustrates Pearson correlation coefficients between features, with colors representing the strength and direction of the correlations (red indicates positive correlations, blue indicates negative correlations, and white represents no significant correlation). Hierarchical clustering is applied to group features based on their correlation similarity, revealing localized clusters of highly correlated features. The feature selection process reduced multicollinearity by removing redundant features, though some moderate to high correlations remain within specific feature groups.
Applsci 14 09196 g003
Figure 4. Machine learning model performance and feature importance in predicting superconducting critical temperatures. (a) The scatter plot for the training dataset, with the predicted Tc plotted against the actual Tc, achieving a coefficient of determination (R2) of 0.98. (b) A similar scatter plot for the test dataset, achieving an R2 of 0.92, indicates high accuracy of the model on unseen data. Each green square represents a data point, and the proximity of these points to the diagonal line indicates the precision of the predictions. (c) Feature importance bar graph, derived from the machine learning model, which ranks the relative importance of each feature in predicting Tc. Features such as average Goldschmidt volume per atom and space group show the highest importance.
Applsci 14 09196 g004
Figure 5. Actual versus predicted Tc by composition type. Each subplot represents a scatter plot for a specific type of superconducting material composition: (a) Oxide, (b) Stannide, (c) Telluride, (d) Nitride, (e) Fluoride, and (f) Sulfide. The actual Tc values (x-axis) are plotted against the predicted Tc values (y-axis), obtained from a machine learning model. Data points are represented as lime-colored squares with black edges, where each point corresponds to a material within the filtered dataset for the respective composition type. The black dashed line signifies the line of ideal prediction, illustrating where the actual and predicted Tc values would be equal.
Applsci 14 09196 g005
Figure 6. X-ray diffraction (XRD) patterns of NbN and its various elemental substitutions: Nb4Co2N, NbTaN2, NbTiN2, and pure NbN. The patterns illustrate the impact on crystallinity, phase stability, and peak intensity. The reference pattern for pure NbN shows high crystallinity and structural order.
Applsci 14 09196 g006
Figure 7. Figure illustrating the relationship between atomic radius and electronegativity for various transition metals, with a specific focus on identifying potential substitutions for Nb in the NbN. The blue scatter points represent the general population of transition metals, mapping their atomic radius against their electronegativity. In contrast, the magenta and green points highlight transition metals with lattice structures and valence electrons similar to those of Nb, respectively. The magenta points, larger and semi-transparent, denote metals with a crystal structure akin to Nb, while the green points, medium-sized and semi-transparent, indicate metals sharing Nb’s valence. Elliptical contours in green and red outline regions where elements closely adhere to Hume–Rothery rules regarding atomic size and electronegativity compatibility with Nb.
Applsci 14 09196 g007
Figure 8. Predicted variation of Tc with substitutional doping in NbN. The graph depicts the influence of the partial replacement of Nb by various other elements on the predicted Tc of nitride compounds. Each curve corresponds to a different dopant in the NbN matrix, as indicated by the legend. The x-axis represents the fraction of Nb replaced by the dopant, while the y-axis shows the predicted Tc in kelvin (K). The different symbols and colors represent various doped compounds. The peak Tc value is identified by a red arrow, which indicates the optimal doping level for the highest Tc (11.143 K at x = 0.45 for the chosen dopant).
Applsci 14 09196 g008
Figure 9. Phase diagram for predicted Tc in the Nb-Ti-Ta-N alloy system. This diagram represents the compositional dependence of the predicted Tc in the quaternary Nb-Ti-Ta-N system. The predicted Tc values are color-coded, as indicated by the gradient legend on the right, ranging from 4.7 K (blue) to 17.6 K (red).
Applsci 14 09196 g009
Table 1. Significant features for predicting superconductor Tc using the Random Forest model.
Figure 2Description
avg_dev GSvolume_paAverage deviation in the Goldschmidt volume per atom from the dataset mean provides a measure of the variation in atomic volume.
avg_dev SpaceGroupNumberAverage deviation of the space group numbers represents the variances in symmetry and periodicity between crystal structures.
avg_dev ElectronegativityAverage variation in electronegativity of the elements present, giving insight into the distribution of electrons.
mode CovalentRadiusMost frequently occurring covalent radius among the elements in the material, which impacts bonding and electronic structure.
range MendeleevNumberDifference between the highest and lowest Mendeleev numbers in the compound.
mean NUnfilledAverage number of unfilled electron states.
mode MeltingTMost common melting point among the constituent elements
mode ElectronegativityMost common value of electronegativity found among the elements.
minimum CovalentRadiusSmallest covalent radius of the elements present.
mean ElectronegativityAverage electronegativity of the elements.
avg_dev NdValenceAverage deviation in the valence electron counts for the f-block elements (Nd).
avg_dev NpValenceSimilar to NdValence, but for the p-block elements.
minimum ElectronegativityThe lowest value of electronegativity among the elements in the material.
2-normMathematical norm that is used here as a measure of the magnitude of vectors.
minimum NValenceThe smallest valence electron counts of the elements present.
Table 2. Predicted best Tc values for the quaternary superconductors. Compositions in the table show that when there is a balance among the Nb, Ti, and Ta elements of the quaternary systems, it will offer better superconductivity. The table also shows that there is much improvement in the Tc values in the quaternary systems when compared to the binary systems.
Binary NitrideTernary NitrideQuaternary Nitride
CompositionPredicted TC (K)CompositionPredicted TC (K)CompositionPredicted TC (K)
NbN9.5Nb0.51Ti0.49N11.09Nb0.35Ta0.23Ti0.42N17.57
HfN6.6Nb0.89Hf0.11N7.71Nb0.34Ta0.23Ti0.43N17.55
ReN5.7Nb0.9Re0.1N7.90Nb0.28Ta0.26Ti0.46N17.53
ScN5.67Nb0.35Sc0.65N10.39Nb0.32Ta0.34Ti0.34N17.53
TaN5.84Nb0.89Ta0.11N7.91Nb0.34Ta0.21Ti0.45N17.52
TiN4.71Nb0.42Ti0.58N11.11Nb0.32Ta0.28Ti0.40N17.51
VN5.81Nb0.35V0.65N7.90Nb0.32Ta0.26Ti0.42N17.50
ZrN6.52Nb0.83Zr0.17N9.18Nb0.28Ta0.28Ti0.44N17.46
Disclaimer/Publisher’s Note: The statements, opinions and data contained in all publications are solely those of the individual author(s) and contributor(s) and not of MDPI and/or the editor(s). MDPI and/or the editor(s) disclaim responsibility for any injury to people or property resulting from any ideas, methods, instructions or products referred to in the content.

