Abstract
The use of digital image correlation for modal analysis is becoming an appealing option thanks to its non-contact and full-field measurement process. However, frequency response function (FRF) estimation can be challenging due to the limited number of time domain data and heavy measurement noise. Thereby, the present work aims to propose a method which improves the estimation accuracy of point-wise FRFs. Firstly, a Gaussian-process-based spatial-frequency model is proposed, which makes use of the intrinsic properties of the FRF and the local spatial information of field measurements. Then, a Bayesian solution is developed, which is enforced by a stable and efficient numerical procedure. Finally, the effectiveness of the proposed method is verified by making a comparison with the spectral estimator through the use of simulated data, and it is further validated based on an experimental application.
1. Introduction
Image-based displacement measurement, typically with digital image correlation (DIC), is increasingly being used in the areas of structural dynamics and experimental mechanics by virtue of its attractive properties (e.g., non-contact and full-field measurement) [1,2,3,4]. Three-dimensional (3D) DIC, which is a displacement-based approach, measures the 3D motion of surface patterns by analyzing stereo image pairs. This image-based technique can rapidly provide a high-density spatial measurement of a targeted vibrating surface. The use of high-speed cameras for dynamic measurements has attracted great attention in the field of modal testing of flexible structures, such as in the extraction of the modal model from DIC-based frequency response functions (FRFs) [5], the experimental modal analysis (EMA) of an artificial wing [6], EMA using wavelet transform [7], the measurement of mode shapes [8] and operating shapes [9], and the operational modal analysis of a flight [10], just to name a few.
Full-field EMA, which extracts the modal model from DIC-based FRFs, has undergone in-depth study. Several practical aspects of performing an EMA test using 3D DIC have been presented, which include the test planning, setup, execution, and post-processing phases [11]. A few DIC-oriented modal identification methods have also been developed, e.g., Modan 3D [12], an enhanced FRF-based method [13]. Like the classical modal analysis with lumped sensors, the point-wise FRF is the fundamental element used for DIC-based EMA [5,6,11,12,13]. FRFs are calculated to be the Fourier transform of each output response measurement (e.g., displacements from subsets) divided by the Fourier transform of the input force, and the H1 estimator is widely implemented for estimating DIC-based FRFs. The optically acquired FRF measurement has been tested in comparison with an accelerometer and laser Doppler vibrometer [14]; point-wise FRFs obtained by the 3D DIC method were shown to be less accurate at eight chosen specific points. A peculiar point-wise comparison was also addressed for optical technologies, and it was again seen to have a relevant drop in accuracy (by means of the coherence function) of DIC-based FRF measurements [15]. In fact, obtaining highly accurate FRFs from DIC measurements cannot be trivial due to hardware limitations, the intrinsic nature of the vision method, and so on.
Optical measurement has been shown to favor high-displacement and low-frequency vibrations that are typically difficult to measure with accelerometers and laser vibrometers. Conversely, the primary disadvantage of the optical approach is that the measurable displacements diminish as a square of the frequency, and the displacements induced by modal excitation can fall below the noise floor of DIC at relatively high frequencies. The high noise floor can be mitigated in the following ways: (1) By using a shaker with a periodic input (e.g., pseudorandom), image averaging is applied while considering the fact that the corresponding time steps across each averaging frame should result in the same structural response, which, however, collapses the number of image frames that DIC is performed on by a factor equal to the number of averages. (2) Increasing the number of pixels across the areas of interest (AOI), which are defined at locations where measurements are desired, and averaging subset time histories within an AOI together can be carried out to reduce the noise level [11]. AOI averaging can cause bias error by ignoring the spatial variation of the FRF. (3) A lumped measurement (e.g., using an accelerometer) can be used to identify the eigenvalues, while the camera measurement is only used to produce the full-field mode shapes [16]. In addition to the optical sensor noise, the process noise is also present, which is mainly generated by the active cooling system of high-speed cameras. The process noise may not be effectively eliminated by the above-mentioned noise mitigation techniques. The coloring property of this process noise can be troublesome for subsequent applications as it creates spurious peaks for FRF measurement when the H1 estimator is used.
Another difficulty in obtaining accurate DIC-based FRFs is that the length of acquired data (e.g., number of images) can be quite limited due to the finite onboard memory capacity of high-speed cameras even though the DIC technique is able to provide detailed spatial measurements. Usually, only a few thousands of images can be obtained with affordable high-speed cameras, and the number of time domain data used for estimating point-wise FRFs is much smaller compared to that used for spectral FRF estimation with an accelerometer. This can cause significant estimation uncertainty and bias error for the spectral estimation of DIC-based FRFs in the presence of optical sensor noise and process disturbance.
In summary, the way that the FRFs are derived from DIC measurements needs to be improved. This issue is addressed in the present work from a Bayesian perspective by considering the intrinsic properties of the FRF and local AOI data (subset displacements). In the fields of system and control, the impulse response function, which is the time domain counterpart of the FRF, is modeled as a Gaussian process (GP) characterized by a reproducing kernel of the Hilbert space. The impulse response function estimation is obtained as a solution of Tikhonov regularization in the reproducing kernel Hilbert space, which outperforms classical system identification techniques when the training data are limited [17,18]. This GP-based nonparametric modeling method seems optimal for deriving the FRF from limited time domain DIC data, achieving an optimal bias–variance trade-off (i.e., the smallest mean square error). Subset displacements within a local AOI at the desired location are all utilized by considering the spatial variation in FRFs. The idea is that the mode shape can be well approximated by a low-order multivariate polynomial within a local AOI. Thus, a spatial-frequency model of the point-wise FRF is proposed, which not only models the FRF’s properties by a complex-valued GP, but also averages the local AOI data in an optimal manner. A Bayesian approach is developed for the statistical inference of the spatial-frequency model, where a numerically stable and efficient procedure is implemented to tune the hyperparameters and obtain the maximum a posteriori (MAP) of the FRF with the associated covariance matrix. The proposed method is finally justified with a simulated example and an experimental study.
2. Input–Output Data
The hammer test is performed, and the out-of-plane displacement of the structure under test is measured with a pair of high-speed cameras. The present work develops a frequency domain approach for estimating the FRFs utilizing DIC data. The time domain observations of excitation and displacement are transformed into the frequency domain ones. For a sampled temporal sequence x(nTs), where Ts is the sampling period, , and N is the length of the sampled sequence, the discrete Fourier transform (DFT) is defined as
where , . Note that k is the index of the discretized angular frequency , and the Fourier transforms of data at negative frequencies carry the same information for parameter estimation as those at positive frequencies, so k ranges from 0 to N/2.
Due to the limitations of the onboard memory capacity and the lightly damped property of a flexible structure, an exponential window should be applied to both force- and response-time histories to minimize the energy leakage caused by the Fourier transform. When the exponential window is , the decay of the windowed signal x(t) is given by
where . By considering the floor noise level, the left side of Equation (2) is user-determined, and then the decay rate b can be derived.
By applying Equation (1), the DFT Y(k) of the windowed response at a spatial location and the DFT U(k) of the windowed input are related as
where G(ωk) is the (windowed) FRF of the structure under test, U0(k) is the DFT of the noise-free impact, and NU(k) and NY(k) are the DFTs of input and output measurement noises, respectively. By conducting a modal impact hammer test, a high signal-to-noise ratio (SNR) can be achieved once the measurement noise that occurs after the impact is minimized using a window function. As the windowed U(k) approaches U0(k), the windowed input is thereby used in this work for FRF identification.
As mentioned in the introduction section, DIC data are disturbed by optical sensor noises and external vibrations when digital images are acquired, and the potential sources of unwanted camera system vibrations usually include high-speed camera cooling fans and ambient excitations. Under mild conditions, the DFT of output measurement noise (NY) can be considered as zero-mean asymptotically (N→∞) circular complex Gaussian distributed and independent over frequency due to the central limit theorem [19]. The diagonal covariance matrix of NY can be obtained by conducting a preprocessing experiment where the structure under test is in static equilibrium.
In addition to the Gaussian property of DIC measurement noises, the frequency domain formulation allows one to easily choose a frequency band of interest for FRF identification. Let denote the set of frequency indices at which the FRF is estimated, which includes F spectrum lines. The DC component (k = 0) and Nyquist frequency are excluded in this work.
3. Spatial-Frequency Model of the Point-Wise FRF
3.1. Local Spatial Model
In this section, a spatial model is proposed for point-wise FRF estimation by taking into account local field measurements. The FRF at coordinate q0 is of interest, and ∆ is a local AOI centered around q0. The AOI (∆) contains numerous pixel measurements (see Figure 1). The AOI is divided into 2n + 1 parts, and the size of each part is comparable to a miniature accelerometer. Then, the pixel measurements within a part are averaged together, and the averaged time history is assigned to the coordinate ql, yielding the DFT vector Yl, l = -n, ⋯, n. The index l indicates a relative coordinate with respect to q0. The bold Yl is a vector that contains the DFT of the measurement at ql, and with the superscript T being the transpose operator.
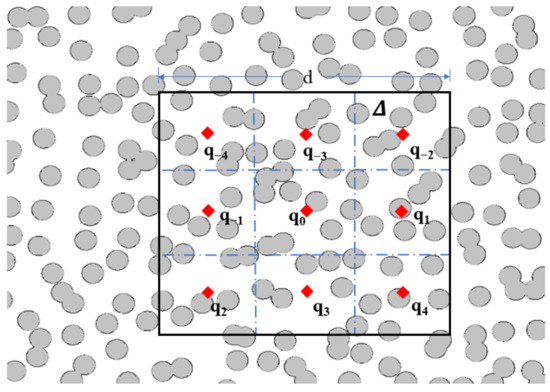
Figure 1.
Local AOI measurements (n = 4). (Red diamond indicates the coordinate ql, which represents the geometric center of each divided part of the AOI.).
For a linear time-invariant structure of structural damping, the FRF at ql with the excitation applied at coordinate f is
where the index f indicates the coordinate f, λ and ψ are the complex natural frequency and modal shape, respectively, and M is the system order.
The mode shape is spatially continuous, which can be modeled sufficiently well by using a low-order multivariate polynomial in the local AOI (∆),
where is the m-th mode shape at q0, the vector , and is the polynomial basis. Let us take a plat surface as an example. for the first-order bivariate polynomial, and (x,y) are the components of the coordinate. Note that Equation (6) is suitable for modeling curved shapes when a trivariate polynomial is used. Refer to [20] for DIC tests of large-scale structures with complex geometry.
By combining Equations (5) and (6), the FRF at coordinate ql is derived as
where G0(ω) is the FRF at q0, is the r-th element of , and the basis function gr(ω) is
Equation (7) provides a spatially parametric model of the FRF in the local AOI ∆, which has unknown functions of frequency. By substituting the expression in Equation (7) into Equation (3), the 2n + 1 responses in the local AOI are assembled in matrix form
where , the extended output vector , and
with the matrix being a square diagonal matrix with the elements of vector U on the main diagonal. NY is constructed in the same way as Y. In order that Equation (9) is not underdetermined, it requires that 2n + 1 ≥ + 1.
The spatial model in Equation (9) provides a systematic way to combine the dense local AOI data for the estimation of point-wise FRFs. The nonparametric modeling of H will be elaborated in the next section from a Gaussian process perspective, and the correlation over frequency is modeled to enhance the estimation accuracy.
3.2. Complex-Valued Gaussian Process
From a function space view, the impulse response function is seen as an element of the reproducing kernel Hilbert space, and it is searched over a possibly infinite-dimensional functional space. The impulse response function is commonly treated as a zero-mean Gaussian stochastic process in the field of system and control [17]. The zero-mean assumption is typically made most probably due to lack of objective prior information. The prior knowledge of the impulse response function, such as its stability and smoothness, is encoded for inference through the use of a suitable covariance (kernel function). Under these standing conditions, the FRF, which is the Fourier transform of the impulse response function, is a zero-mean complex-valued Gaussian process, but it is not circular complex distributed because the impulse response function is a non-stationary Gaussian process.
The probability distribution for a complex-valued Gaussian vector can be obtained as a joint distribution of its real and imaginary parts [21], the probability density function of the FRF is characterized by the covariance matrix of the augmented vector , and with the superscript H being the conjugate transpose. The covariance matrix reads
where the superscript * denotes the complex conjugate, , with being the expectation operator, and
The Hermitian covariance matrix K is complemented by a second complementary covariance matrix C which is called the relation matrix. It can be trivially verified that K(ωk, ωl) = C(ωk, ω−l).
The kernel function of a Gaussian process is crucial to achieve a good bias–variance trade-off for estimation of point-wise FRFs. A few kinds of kernel functions have been invented to embed various types of prior knowledge, such as the smooth and stable properties of the impulse response function. Among these kernels, the so-called stable spline kernel [17] and diagonal correlated (DC) kernel [22] are widely recognized in the system identification community. They are further transformed into the frequency domain using the Fourier transform [23]. Here, the frequency domain DC kernel is adopted for FRF modeling,
where the scaling factor , and the kernel parameters , , which are called hyperparameters of the kernel. controls how markedly the change of G0(ωk) can be correlated with the variation of G0(ωl), and β describes the stability (i.e., the impulse response decays to zero exponentially).
The basis functions gr in Equation (7), r = 1, ⋯, , are also modeled as complex-valued Gaussian processes. As demonstrated in Equation (8), gr has a structure similar to the FRF G0; hence, it can be characterized by the same kernel parameters α and β, but it is described by a different scaling factor .
4. Bayesian Identification
4.1. Prior Probability Distribution
Assume that the functions gr, r = 1, ⋯, , are statistically independent, and the complex-valued vector H follows a multivariate complex Gaussian distribution with zero-mean,
where , and the augmented covariance matrix reads
In Equation (16), the dependence of K and C on is highlighted, and is the scaling coefficient of the kernel function which is attached to the function gr. The kernel hyperparameters that describe H are collected in the vector .
4.2. Likelihood Function
When the data size N→∞, the DFT of output measurement noise is circular (or proper) assuming that the measurement noise is independent and identically distributed in the time domain [19]. This implies that the relation matrix C of the measurement noise process is a zero matrix. The measurement noise across a local AOI is assumed to be independently and identically distributed. The likelihood function of H, equivalently the probability of observing Y given H, is
where D = (4n + 2)F, and the regression matrix and the augmented covariance matrix are, respectively, composed as
The scaling coefficient is introduced to consider the unwanted effects such as the change of experiment condition and low-level nonlinearity of a light-weight structure. Recall that P is obtained during the preprocessing experiment where the structure is in static equilibrium, while the scaling coefficient is unknown and needs to be properly determined from data.
4.3. Posterior Probability Distribution
According to Bayes’ theorem, the posterior probability density function of H is
where denotes “proportional to”. By taking the negative logarithm of the left side of Equation (19), the maximization with respect to the vector H leads to the maximum a posteriori (MAP),
where is the posterior covariance matrix, which reflects the confidence on the estimated FRF. The calculation of Equations (20) and (21) involves the unknown hyperparameters θ and , which will be estimated in the next section.
4.4. Hyperparameter Optimization
The hyperparameter estimation plays a similar role to the model order selection in classic system identification methods and its essence is to determine a suitable model complexity based on measurement data. There exist several methods to optimize the hyperparameters, such as empirical Bayes, cross-validation, and Cp statistics methods [17]. Among them, the empirical Bayes method is a very natural one which utilizes the stochastic property of the output (Y) conditioned on the hyperparameters. The empirical Bayes method relates to the concept of Bayesian evidence and the Occam’s razor principle, i.e., the unnecessarily complex models are automatically penalized [24]. An alternative way to tune hyperparameters is to implement a fully Bayesian approach that is developed by utilizing stochastic simulation techniques, e.g., the Markov chain Monte Carlo (MCMC) method [25]. In such a context, the posterior distribution of the FRF and hyperparameters is recovered in sampled form, from which the sample mean and Bayesian interval are obtained. The empirical Bayes method does not require MCMC simulations and hence uses much less computation; therefore, it is preferred here. The full Bayes approach can be used to verify whether the empirical Bayes method is sufficient for the present problem, and it can be seen as a future interesting extension of the present work.
As H and NY are both Gaussian distributed, Y follows a zero-mean complex Gaussian distribution with the covariance matrix
The probability distribution of Y is known up to θ and , which implies that these hyperparameters can be obtained by the maximum likelihood identification based on the following cost function:
Note that is a non-convex function, and the gradient-based optimization may converge to a local solution. A concentrated cost function of is developed in an attempt to improve the convergence. Let us rewrite as
with having the same form as in Equation (16) except that is replaced by . The estimate of is obtained by fixing other parameters,
Let us insert into Equation (24) to obtain , further define , then
where the parameter vector is redefined as after removing and
It is noted that . The elaborated variant of the cost function in Equation (27) allows reducing the effective number of parameters to be optimized; therefore, this helps to solve the non-convex optimization problem.
Note that is a D × D matrix, and its inversion has a computational complexity O(D). The straightforward computation of V1(θ) can therefore be quite time consuming as is on the order of hundreds or even thousands for a vibration test performed with the DIC technique. The numerical accuracy is another issue since both and might be ill conditioned, and they can possibly have a much larger magnitude than P. The computation of h(θ) and V0(θ) is carried out by implementing an efficient and accurate numerical algorithm [26]. The numerical procedure starts by finding the Cholesky decomposition of
with L being the lower triangular matrix.
Using Equation (29), Sylvester’s determinant theorem, and the Woodbury matrix inversion lemma [27], it is derived that
where IW is a W × W identity matrix. Note that the determinant calculation in Equation (30) and matrix inversion in Equation (31) are independent of the number of data. Moreover, a thin QR decomposition is performed,
where Q is an orthogonal matrix, R1 is a W-dimensional upper triangular matrix, R2 is a column vector of length W, and R3 is a scalar. By virtue of such QR decomposition,
Therefore, h(θ) and V0(θ) are obtained in the following way:
where “Re” takes the real part of a complex variable. This allows the cost function V1(θ) to be efficiently and accurately calculated.
The gradient-based optimization algorithm is applied to minimize the cost function V1(θ). The partial derivative of V1(θ) with respect to the hyperparameters θ is given below:
where , and “trace” denotes the trace operation.
4.5. MAP Calculation
Calculation of the MAP and the posterior covariance matrix involves the inversion of the covariance matrix . If the condition number is too large, the round-off error in matrix computations may lead to inaccurate results. Equations (20) and (21) can be accurately computed via the Cholesky decomposition of . More precisely, the FRF’s MAP is obtained by combining Equations (29), (33), and (34),
The calculation of the posterior covariance matrix is achieved as
where is obtained by Equation (26) with tuned hyperparameters .
5. Method Validation
5.1. Simulated Example
The proposed method is illustrated using the simulation data of a square plate which is simply supported. The side length of the plate is 1 m, and the thickness is 0.002 m. The material properties of the plate are as follows: elastic modulus of 200 GPa, density of 7850 kg/m3, Poisson’s ratio of 0.3. The plate is excited at (0.3 m, 0.4 m) by an impulsive signal. The point-wise FRF of interest is located at q0 = (0.2 m, 0.7 m) from the left-bottom corner.
The response of the plate is calculated using the finite element method based on the mode superposition principle, where the viscous damping is considered. The simulated response is then disturbed by a zero-mean band-limited Gaussian noise. The signal-to-noise ratio of the response is set to be 10 dB. The sampling frequency is 1024 Hz, the frequency band for identification spans from 1 Hz to 140 Hz, and F = 274. The second-order bivariate polynomial is used for the spatial-frequency model presented in Section 3.1.
A classical spectral H1 estimator, which is used as a reference for comparison purposes, is computed as
where the spectral estimate uses AOI averaging to mitigate the effect of measurement noise on FRF estimation.
The estimated FRF is affected by the estimation variance and bias. For a fixed order of the spatial model, the size of the local AOI (d, see Figure 1) plays an important role in finding an optimal trade-off between estimation uncertainty and bias. The root mean square error (RMSE) is therefore introduced to investigate the size effect on estimation accuracy, which is defined via the Monte Carlo simulation
where is the FRF estimate obtained at the m-th Monte Carlo run, G0 stands for the true FRF, and Mc = 100. By definition, the RMSE metric can quantify both estimation uncertainty and bias error.
When the AOI size (d) increases, more data are used, and, accordingly, the estimation uncertainty is reduced. However, the increase in size can lead to a bias increment, as seen in Figure 2. An optimal trade-off between estimation uncertainty and bias error is achieved when d = 10.6 mm. This is justified by Figure 2, which shows that the proposed method can improve the accuracy of FRF measurement in an effective manner, and globally outperforms the classical spectral analysis method for a wide range of local area sizes.

Figure 2.
Size effect of the local AOI on FRF estimation.
The RMSE computed with the proposed method is found to be more pronounced for the first three modes, in which it is basically dominated by the bias error. This is because the implemented DC kernel is incapable of fully representing the complex behavior of the lightly damped structure. The bias error can be decreased by resorting to a multiple-kernel-based regularization [28], which provides more flexibility in model design to describe the spatial-frequency property of the FRF.
With the optimal local area size d = 10.6 × 10⁻³ m, the FRF’s MAP is displayed together with its standard deviation in Figure 3. In the whole frequency band, the predicted standard deviation agrees well with the sample standard deviation estimated over Monte Carlo runs. The residual error between the MAP and the true FRF falls below the standard deviation almost everywhere.
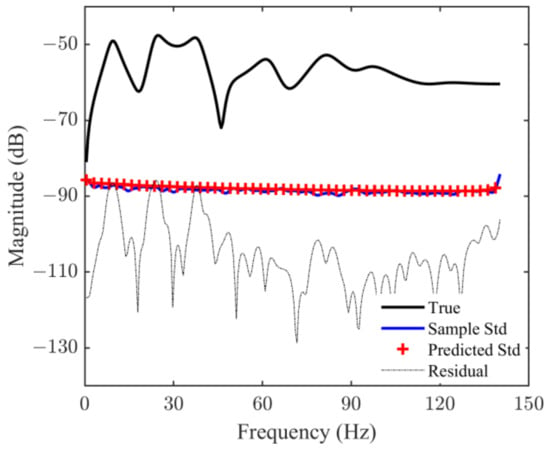
Figure 3.
Estimated results of the point-wise FRF.
5.2. Experimental Application
In this section, the proposed method is demonstrated via a real-impact modal test that is performed on a light-weight carbon-fiber blade. The experimental setup is shown in Figure 4. The light-weight blade is painted with a controlled random speckle pattern and clamped on one end by a universal table vise.
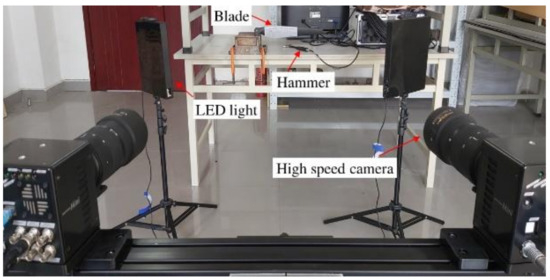
Figure 4.
Vibration measurement of a blade.
The 3D motion displacement of the blade is measured by a CSI VIC-3D system, which is composed of two FASTCAM high-speed cameras (Photron, Tokyo, Japan), a pair of LED surface lights, an NI PXI module that measures the impact load, and also a software package. The motion of the blade is recorded at a rate of 2000 frames per second, and 5000 images are totally acquired with the installed onboard memory of cameras.
The camera resolution is set as 1024 × 576 pixels, and the field of view is adjusted to be 0.21 m × 0.12 m. Therefore, a pixel approximately corresponds to a physical size of 0.2 mm. The measurement accuracy of out-of-plane displacement can reach 6 um as the applied high-speed VIC-3D system has an out-of-plane accuracy up to 0.03 pixels. This is essential to achieve a high signal-to-noise ratio in high frequency bands.
The measurement noise of the vibration test is firstly quantified by conducting a preprocessing test without exciting the blade. In Figure 5, the DFT of the output measurement noise is presented. The floor noise spectrum is found to be flat at most of the frequencies; however, two unwanted sharp peaks are clearly observed within the frequency band from 140 Hz to 150 Hz, which are confirmed to originate from the active cooling systems of the high-speed cameras. Based on the preprocessed data, the covariance matrix P in Equation (18) is estimated.
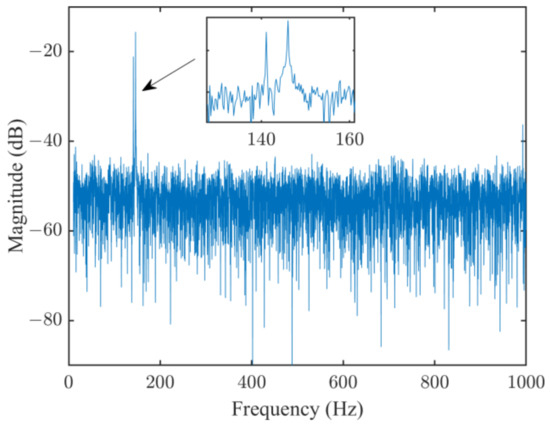
Figure 5.
Spectrum of the measurement noise.
The blade is excited by an ICP impact hammer (model 086C03) (PCB, Depew, NY, USA) at the free end, and the spectrum of the impact load is shown in Figure 6a. The local AOI is selected as a square with a side length of 12 × 10−3 m, which is then equally divided into nine parts by setting n = 4. Within each part, an average of approximately twelve optical measurements is undertaken, and the averaged time history is assigned to the geometric center of the part. A total of nine concentrated responses are thus obtained, as displayed in Figure 6b. In addition, the operational deflection shapes of the blade at four different frequencies are provided in Figure 7, which are obtained from DFTs of full-field DIC data.
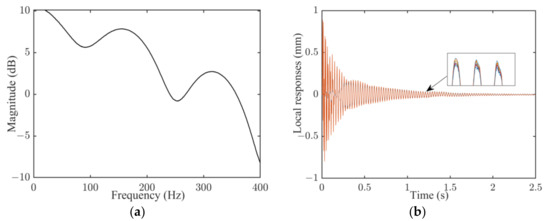
Figure 6.
Input and output data. (a) Spectrum of impact load; (b) impulsive responses.

Figure 7.
Frequency domain operational deflection shape of the blade.
For the point-wise FRF identification, the frequency band that spans from 20 Hz to 380 Hz is chosen, which has the data number F = 451. As stated in Section 4.4, the hyperparameters of the kernel function control the model complexity and thus influence the estimation accuracy. Three sets of hyperparameters are hereby considered, as in Table 1. The corresponding maxima a posteriori of the FRFs calculated with Equation (38) are demonstrated in Figure 8. It is seen that an increment of the stability parameter helps to impose more continuity on the estimated FRF, and the decrease in the scaling parameters , reduces the penalty added to the regularized FRF estimation.

Table 1.
Considered sets of hyperparameters.
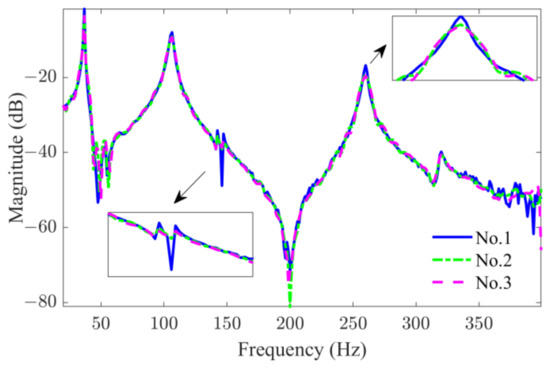
Figure 8.
Effect of hyperparameters on FRF estimation.
The spectral estimate of the FRF by Equation (40) is shown in Figure 9, which is seriously affected by the floor noise in the frequency band from 140 Hz to 150 Hz. This can induce almost indistinguishable non-physical poles for the subsequent modal analysis. Compared to the spectral estimator, the FRF estimated by the proposed method shows an enhanced identification accuracy, in particular a noise-suppressing ability at the frequency ranging from 140 Hz to 150 Hz, as it can make use of the prior spatial-frequency property of the FRF and also consider the floor noise of the DIC test by means of the likelihood function. Additionally, the obtained FRF is characterized by an uncertainty bound, which is valuable for applications such as damage diagnostics and modal identification.
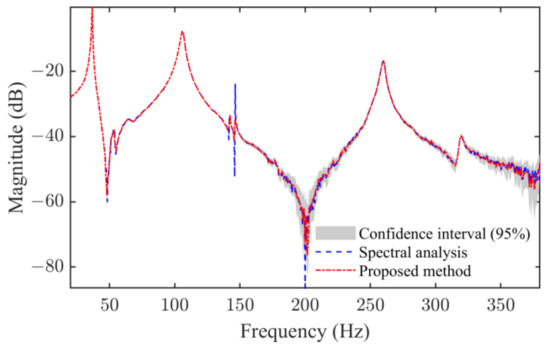
Figure 9.
Estimated point-wise FRF.
6. Conclusions
A Bayesian inference method for the estimation of point-wise FRF using dynamic DIC measurements has been developed. The strengths of this approach consist of taking into account the local AOI information using a spatial model and also making use of the prior property of the FRF via a complex-valued Gaussian process. The MAP and posterior covariance matrix of the FRF are calculated in a numerically stable way. It is shown by the results obtained from Monte Carlo simulations that there exists an optimal size for the local AOI to achieve an optimal trade-off between estimation variance and bias. The proposed method exhibits a higher estimation accuracy than the spectral H1 estimator. The effectiveness of the proposed method is further demonstrated by vibration testing of a blade.
Author Contributions
Conceptualization, H.H. and E.Z.; methodology, E.Z.; software, J.Z., C.R. and E.Z.; validation, C.R., J.Z. and H.H.; formal analysis, E.Z.; investigation, H.H.; resources, C.R.; data curation, J.Z.; writing—original draft preparation, E.Z.; writing—review and editing, H.H.; visualization, E.Z.; supervision, H.H.; project administration, E.Z.; funding acquisition, E.Z. All authors have read and agreed to the published version of the manuscript.
Funding
This research was funded by the National Natural Science Foundation of China, grant number 61873244.
Institutional Review Board Statement
Not applicable.
Informed Consent Statement
Not applicable.
Data Availability Statement
Data are available from the corresponding author upon reasonable request.
Conflicts of Interest
The authors declare no conflicts of interest.
References
- Beberniss, T.J.; Ehrhardt, D.A. High-speed 3D digital image correlation vibration measurement: Recent advancements and noted limitations. Mech. Syst. Signal Process. 2017, 86, 35–48. [Google Scholar] [CrossRef]
- Périé, J.-N.; Passieux, J.-C. Special issue on advances in digital image correlation (DIC). Appl. Sci. 2020, 10, 1530. [Google Scholar] [CrossRef]
- Reu, P.L.; Rohe, D.P.; Jacobs, L.D. Comparison of DIC and LDV for practical vibration and modal measurements. Mech. Syst. Signal Process. 2017, 86, 2–16. [Google Scholar] [CrossRef]
- Helfrick, M.; Niezrecki, C.; Avitabile, P.; Schmidt, T. 3D digital image correlation methods for full-field vibration measurement. Mech. Syst. Signal Process. 2010, 25, 917–927. [Google Scholar] [CrossRef]
- Zanarini, A. Full field optical measurements in experimental modal analysis and model updating. J. Sound Vib. 2018, 442, 817–842. [Google Scholar] [CrossRef]
- Ha, N.S.; Vang, H.M.; Goo, N.S. Modal analysis using digital image correlation technique: An application to artificial wing mimicking beetle’s hind wing. Exp. Mech. 2015, 55, 989–998. [Google Scholar] [CrossRef]
- Régal, X.; Cumunel, G.; Bornert, M.; Quiertant, M. Assessment of 2D digital image correlation for experimental modal analysis of transient response of beams using a continuous wavelet transform method. Appl. Sci. 2023, 13, 4792. [Google Scholar] [CrossRef]
- Jin, M.S.; Kosova, G.; Cenedese, M.; Wei, C.; Singh, A.; Jana, D.; Brake, M.; Schwingshackl, C.; Nagarajaiah, S.; Moore, K.; et al. Measurement and identification of the nonlinear dynamics of a jointed structure using full-field data; Part II—Nonlinear system identification. Mech. Syst. Signal Process. 2022, 166, 108402. [Google Scholar] [CrossRef]
- Poozesh, P.; Sarrafi, A.; Mao, Z.; Avitabile, P.; Niezrecki, C. Feasibility of extracting operating shapes using phase-based motion magnification technique and stereo-photogrammetry. J. Sound Vib. 2017, 407, 350–366. [Google Scholar] [CrossRef]
- Di Lorenzo, E.; Mastrodicasa, D.; Wittevrongel, L.; Lava, P.; Peeters, B. Full-field modal analysis by using digital image correlation technique. In Rotating Machinery, Optical Methods & Scanning LDV Methods; Di Maio, D., Baqersad, J., Eds.; Springer: Cham, Switzerland, 2020; Volume 6, pp. 119–130. [Google Scholar]
- Witt, B.L.; Rohe, D.P. Digital image correlation as an experimental modal analysis capability. Exp. Tech. 2021, 45, 273–286. [Google Scholar] [CrossRef]
- Trebuňa, F.; Hagara, M. Experimental modal analysis performed by high-speed digital image correlation system. Measurement 2014, 50, 78–85. [Google Scholar] [CrossRef]
- Huňady, R.; Hagara, M. A new procedure of modal parameter estimation for high-speed digital image correlation. Mech. Syst. Signal Process. 2017, 93, 66–79. [Google Scholar] [CrossRef]
- Warren, C.; Niezrecki, C.; Avitabile, P.; Pingle, P. Comparison of FRF measurements and mode shapes determined using optically image based, laser, and accelerometer measurements. Mech. Syst. Signal Process. 2011, 25, 2191–2202. [Google Scholar] [CrossRef]
- Zanarini, A. Broad frequency band full field measurements for advanced applications: Point-wise comparisons between optical technologies. Mech. Syst. Signal Process. 2018, 98, 968–999. [Google Scholar] [CrossRef]
- Javh, J.; Slavič, J.; Boltežar, M. High frequency modal identification on noisy high-speed camera data. Mech. Syst. Signal Process. 2018, 98, 344–351. [Google Scholar] [CrossRef]
- Pillonetto, G.; Dinuzzo, F.; Chen, T.S.; Nicolao, G.; Ljung, L. Kernel methods in system identification, machine learning and function estimation: A survey. Automatica 2014, 50, 657–682. [Google Scholar] [CrossRef]
- Ljung, L.; Chen, T.S.; Mu, B. A shift in paradigm for system identification. Int. J. Control 2020, 93, 173–180. [Google Scholar] [CrossRef]
- Pintelon, R.; Schoukens, J. System Identification: A Frequency Domain Approach, 2nd ed.; Wiley-IEEE Press: Hoboken, NJ, USA, 2012; pp. 601–605. [Google Scholar]
- Janeliukstis, R.; Chen, X. Review of digital image correlation application to large-scale composite structure testing. Compos. Struct. 2021, 271, 114143. [Google Scholar] [CrossRef]
- Schreier, P.J.; Scharf, L.L. Statistical Signal Processing of Complex-Valued Data: The Theory of Improper and Noncircular Signals; Cambridge University Press: New York, NY, USA, 2010; pp. 30–57. [Google Scholar]
- Chen, T.S. On kernel design for regularized LTI system identification. Automatica 2020, 90, 109–122. [Google Scholar] [CrossRef]
- Lataire, J.; Chen, T.S. Transfer function and transient estimation by Gaussian process regression in the frequency domain. Automatica 2016, 72, 217–229. [Google Scholar] [CrossRef]
- MacKay, D. Bayesian interpolation. Neural Comput. 1992, 4, 415–447. [Google Scholar] [CrossRef]
- Gilks, W.; Richardson, S.; Spiegelhalter, D. Markov Chain Monte Carlo in Practice; Chapman and Hall: London, UK, 1996; pp. 115–127. [Google Scholar]
- Chen, T.S.; Ljung, L. Implementation of algorithms for tuning parameters in regularized least squares problems in system identification. Automatica 2013, 49, 2213–2220. [Google Scholar] [CrossRef]
- Harville, D.A. Matrix Algebra from a Statistician’s Perspective; Springer: New York, NY, USA, 2008; pp. 427–432. [Google Scholar]
- Hallemans, N.; Pintelon, R.; Joukovsky, B.; Peumans, D.; Lataire, J. FRF estimation using multiple kernel-based regularization. Automatica 2022, 136, 110056. [Google Scholar] [CrossRef]
Disclaimer/Publisher’s Note: The statements, opinions and data contained in all publications are solely those of the individual author(s) and contributor(s) and not of MDPI and/or the editor(s). MDPI and/or the editor(s) disclaim responsibility for any injury to people or property resulting from any ideas, methods, instructions or products referred to in the content. |
© 2024 by the authors. Licensee MDPI, Basel, Switzerland. This article is an open access article distributed under the terms and conditions of the Creative Commons Attribution (CC BY) license (https://creativecommons.org/licenses/by/4.0/).