Abstract
This work investigates the mechanical behaviour of sandwich beams with cellular cores using a multiscale approach combined with a meshless method, the Natural Neighbour Radial Point Interpolation Method (NNRPIM). The analysis is divided into two steps, aiming to analyse the efficiency of NNRPIM formulation when combined with homogenisation techniques for a multiscale computational framework of large-scale sandwich beam problems. In the first step, the cellular core material undergoes a controlled modification process in which circular holes are introduced into bulk polyurethane foam (PUF) to create materials with varying volume fractions. Subsequently, a homogenisation technique is combined with NNRPIM to determine the homogenised mechanical properties of these PUF materials with different porosities. In this step, NNRPIM solutions are compared with high-order FEM simulations. While the results demonstrate that RPIM can approximate high-order FEM solutions, it is observed that the computational cost increases significantly when aiming for comparable smoothness in the approximations. The second step applies the homogenised mechanical properties obtained in the first step to analyse large-scale sandwich beam problems with both homogeneous and functionally graded cores. The results reveal the capability of NNRPIM to closely replicate the solutions obtained from FEM analyses. Furthermore, an analysis of stress distributions along the beam thickness highlights a tendency for some NNRPIM formulations to yield slightly lower stress values near the domain boundaries. However, convergence towards agreement among different formulations is observed with mesh refinement. The findings of this study show that NNRPIM can be used as an alternative numerical method to FEM for analysing sandwich structures.
1. Introduction
In the domain of modern engineering, composite materials have become a frequent solution for constructing lightweight laminated structures. These structures offer improved mechanical performance across various applications, including naval, automotive, aerospace, and aeronautics [1]. Sandwich structures, a specific type of laminate, stand out within the framework of laminated solutions. They are characterised by two thin high-rigid face sheets (e.g., aluminium or fibre-reinforced composite) that enclose a comparatively thick, low-stiffness, and low-density core material. Despite the core’s inherent properties, confinement by the rigid face sheets enables them to contribute significantly to the overall bending rigidity of the structure. This is achieved while maintaining a low overall weight for the sandwich panel [1,2]. Several factors influence the mechanical behaviour of sandwich structures, including the core material’s microstructure, the relative thicknesses of the core and face sheets, the fibre volume fraction within the face sheets, and the material selection and orientation of the fibres in the face sheets [1,2]. Due to this inherent complexity, the development of efficient and accurate numerical methods for predicting the structural response of sandwich structures remains an ongoing challenge.
The most common approach for analysing sandwich panels and laminates involves equivalent single-layer (ESL) theories [3]. These theories employ a 2D discretisation and model the laminate thickness using a transverse deformation theory. When compared to a full 3D deformation elasticity theory applied to 3D discretisations, this dimensional simplification offers a significant reduction in computational cost. However, 3D solutions provide a more realistic representation of physical phenomena and offer more accurate predictions than 2D ESL theories, particularly when dealing with thick plates and shells [4].
Various analytical approaches employing 3D elasticity theory have been proposed to explore the bending behaviour of sandwich plates. In the seminal research by Pagano [5], exact 3D solutions were formulated for stress analysis of simply supported rectangular sandwich plates. Subsequently, Zenkour [6] utilised 3D elasticity equations to derive analytical bending solutions for rectangular multilayer plates subjected to distributed transverse loading. Regarding sandwich plates featuring functionally graded cores, Kashtalyan and Menshykova [7] introduced a 3D exact elasticity solution to calculate their bending response under sinusoidal distributed transverse loads. Expanding this approach, Woodward and Kashtalyan extended the 3D exact elasticity equations to obtain the bending solution of sandwich plates under localised transverse loads [8] and various other pertinent transversal loading scenarios [9].
A detailed discretisation of the cellular material comprising the sandwich core would result in computational analysis with a significant computational cost. Consequently, to mitigate this challenge, multiscale homogenisation techniques are commonly employed to accelerate structural analyses, while yielding reasonably accurate solutions [10]. These techniques facilitate multiscale analysis by assuming the presence of multiple spatial scales within materials and structures. Typically, the analysis of heterogeneous materials involves the determination of effective properties obtained through homogenising the response at microscopic scales, which are subsequently extrapolated to macroscopic analyses. Numerous analytical models have been developed within the framework of small deformation linear elasticity to obtain the homogenised constitutive response of heterogeneous materials at the macroscopic level, including the attributes of their microstructure [10]. These models are founded on the Hill–Mandel condition for homogeneity [11,12], which posits that the volume-averaged strain energy within a representative volume element (RVE) can be expressed as the product of the volume-averaged stress and strain fields within the same RVE, thereby demonstrating energy equivalence between homogeneous and heterogeneous materials [11,12]. Micromechanical analysis of composite materials frequently employs discretisation-based approaches to extrapolate the overall response from their microstructure [13]. Addressing this, the Generalised Method of Cells (GMC) offers a solution by defining a repeating unit cell (RUC) within the periodic composite structure and further subdividing it into orthogonal subcells [14]. As a mature numerical technique, the GMC framework has been effectively applied across various composite types, including fibre-reinforced composites [14], metal matrix composites [15], and woven polymer matrix composites [16].
Within computational mechanics, the finite element method (FEM) is the most commonly used discretisation technique, possessing a long history of successful applications across various engineering domains [17]. Nonetheless, the computational mechanics research community continuously investigates and explores advanced new discretisation methodologies capable of offering enhanced efficiency and accuracy. Meshless methods, also known as meshfree methods, emerge as promising alternatives capable of supplanting FEM in numerous applications [18,19]. Unlike FEM, which relies on a standard element mesh for domain discretisation, meshless methods employ an unstructured nodal set to discretise the solid domain [20,21]. While FEM establishes nodal connectivity through the element concept, meshless methods achieve this connectivity via the influence domain concept [22].
The Diffuse Element Method (DEM), introduced by Nayroles et al. [23], emerged as a pioneering meshless technique. It applies moving least square (MLS) approximants, offering a generalisation of FEM but without the constraints of a pre-defined mesh [23]. Belytschko et al. further developed DEM, refining it and extending its applicability to elasticity problems [24]. Their key innovation involved the incorporation of a background integration mesh based on the Gauss–Legendre quadrature scheme. Belytschko et al. also coupled DEM with Lagrange multipliers for enforcing boundary conditions, forming the well-known Element Free Galerkin Method (EFGM) [24], the most popular meshless method ever created. The late 1990s witnessed a surge in meshless method development. The meshless method’s portfolio was enriched with robust formulations, such as the Reproducing Kernel Particle Method (RKPM) [25] or the Meshless Local Petrov–Galerkin (MLPG) method [25]. These methods, by exploiting the advantages of approximation shape functions and higher nodal connectivity, were able to deliver more accurate solutions and smoother variable fields [22].
Despite their advantages, meshless methods based on approximation shape functions face a fundamental impairment: the absence of the delta Kronecker property. Unlike the FEM, this characteristic impedes the straightforward imposition of essential (displacement) and natural (traction) boundary conditions [22]. Thus, in approximation meshless methods, Lagrange multipliers are the primary numerical tool for handling boundary conditions. However, Lagrange multipliers require the introduction of additional constraint equations, leading to a larger system of equations and consequently, to an increase in the computational cost [22]. As a consequence, the lack of the delta Kronecker property tempered the enthusiasm for meshless methods.
This difficulty drives the computational mechanics research community to employ their efforts in the development and enhancement of interpolating shape functions. The Natural Element Method (NEM), introduced by Sukumar et al. [26], stands as a pioneering example of a successful interpolating meshless methods. The NEM’s shape functions are interpolating, allowing for the direct imposition of boundary conditions, as in the FEM. Following the success of the NEM, a multitude of interpolating meshless methods emerged, including the Point Interpolation Method (PIM) [27], the Radial Point Interpolation Method (RPIM) [28], the Meshless Finite Element Method (MFEM) [29], and the Natural Radial Element Method (NREM) [30]. Further advancements in interpolating meshless methods were achieved by Dinis et al. with the development of the Natural Neighbour Radial Point Interpolation Method (NNRPIM) [31]. This method combines the connectivity strategy of the NEM with the radial point interpolating technique of the RPIM. Using only the nodal discretisation information (the Cartesian coordinates of the nodes) of the problem’s domain, the NNRPIM is capable to autonomously calculate the position and weight of the background integration points and enforce the nodal connectivity using the natural neighbour concept. Lke the NEM, the NNRPIM is a truly meshless method.
Meshless methods have demonstrated their potential for analyzing sandwich structures, particularly when combined with equivalent single-layer (ESL) deformation theories [32], which offers a computationally efficient alternative to full 3D analyses. For this reason, 3D meshless formulations for sandwich structures remain less prevalent in the literature [4,33,34]. Concerning meshless methods combined with multiscale homogenisation techniques, the most common applications are for composite structures. Rodrigues et al. successfully extended the capabilities of the RPIM [35] and NNRPIM [36] to perform multiscale analyses of laminated composites. Similarly, Wang et al. developed a multiscale approach using a different meshless technique to model the mechanical behaviour of carbon nanotube-reinforced cement composites [37].
The research on advanced computational methods for the design of sandwich structures allows us to develop and deliver light-weight structures with high stiffness/mass ratios. Sah et al. present an extensive review on sandwich structures for the construction industry [38]. Their work focus on five types of sandwich panels: lightweight timber-framed panels, light-gauge-steel-framed panels, structural insulated panels, cross-laminated timber panels, and precast concrete sandwich panels [38], showing the large variety of applications that prefabricated sandwich structures possess in the construction industry. Nevertheless, sandwich structures are the focus of attention in other demanding engineering areas, such as the aeronautics and aerospace industry. For instance, in the work Tewari et al., the bending response of laminated composite sandwich structures with corrugated and spiderweb-inspired cores for aircraft flaps is analysed [39]. Simulations included the effects of hail impact, leading to a final design incorporating the spiderweb core with optimal fibre orientation and ply thickness and allowing for higher load resistance and bending stiffness. In the research study of Pashazadeh et al., the dynamic behaviour of a new flexible sandwich structure for morphing aircraft capable of shape adaptation during flight [40] was examined. The structure was experimentally tested and numerically validated with finite element simulations. The literature also possesses impact studies on sandwich structures, such as the work of Ren et al. [41], in which the impact resistance of metallic sandwich structures is analysed and explored by encasing the foam core with ultra-high strength composite fabric. Experimental and numerical tests show that the encasement significantly improves energy absorption and reduces damage, enhancing overall impact resistance while maintaining lightweight properties and offering new perspectives on improving structural protection against complex impact loading [41]. Another very recent trend is the production of sandwich structures using 3D printing or additive manufacturing technologies. As shown in the works of Acanfora et al. [42] and Vellaisamy et al. [43], 3D printing is a suitable manufacturing technique to produce efficient lightweight sandwich structures. Aiming to reduce the weight of sandwich panels for shock absorption, Acanfora et al. [42] were able to produced panels with 3D printing showing 28% weight reduction while improving energy absorption. The sandwich panels demonstrated enhanced structural effectiveness through comparative analysis of absorption indices, force–time and force–displacement graphs, and CT scans. On the other hand, Vellaisamy et al. [43] mechanically characterised honeycomb sandwich structures fabricated with 3D printing, demonstrating very high energy absorption and, at the same time, preventing delamination and debonding.
The research study here presented proposes a novel approach for analysing the macroscale behaviour of sandwich structures by integrating in the NNRPIM a multiscale homogenisation technique. The proposed framework takes advantage of both techniques: the NNRPIM flexible and organic discretisation procedure allows us to analyse unstructured nodal distributions, while multiscale homogenisation simplifies the analysis of complex microstructures by capturing their homogenised mechanical properties. The proposed methodology starts with the estimation of the homogenised mechanical properties of the cellular unit, which are then correlated with the foam density. Subsequently, at the macroscale level, various sandwich structures with varying density distributions throughout the thickness are modelled using the NNRPIM. The resulting solutions are then compared with those obtained with FEM analyses. This research aims to achieve a two-fold objective: first, to assess the performance and efficiency of the NNRPIM compared to the FEM in terms of computational cost, accuracy, and stress field distribution, and second, to explore the potential of meshless multiscale analysis for sandwich structures with both homogeneous and functionally graded foam cores.
This manuscript comprises four distinct sections. The initial section delineates the state of the art of sandwich structures, alongside corresponding mathematical formulations, multiscale homogenisation methodologies, and typical discretisation approaches. The subsequent section shows the mathematical formulation of the meshless method for elasticity, coupled with the employed homogenisation technique. Next, the third section presents the numerical findings. Initially, the homogenised mechanical properties of cellular foams are correlated with its apparent density. Subsequently, the results of macroscale numerical examples of sandwich structures are presented, accompanied by the respective discussion. Ultimately, the most relevant conclusions and observations of this study are documented within the Section 4.
2. Natural Neighbour Radial Point Interpolation Method
Meshless methods are advanced discretisation techniques capable of discretising the problem domain using only a nodal or point distribution [21,22]. Such a nodal distribution, which can be regular or irregular, does not form a mesh because there is no pre-established nodal connectivity. Since elasticity problems are addressed by solving a system of equations built based on integro-differential equations, it is necessary to numerically integrate such equations. The most common solution is the use of a background set of integration points capable of numerically integrate those integro-differential equations. Thus, after the nodal discretisation, in elasticity problems, meshless methods need to discretise the problem domains with a set of integration points, which can be dependent or independent of the initial nodal distributions [22]. Generally, if an independent set of integration points is constructed, the meshless method is called a non-truly meshless method because the set of integration points are obtained based on a structured grid of integration cells, leading to a background integration mesh. On the other hand, if the meshless method is capable of constructing a set of integration points dependent on the nodal distribution, the meshless method is called a truly meshless method [22]. The main advantage of non-truly meshless methods is their straightforward capability of being incorporated into any generic FEM software. In these methods, for example, the FEM’s element meshes can be directly used as background integration cells, and the FEM’s nodal meshes are naturally the meshless method’s nodal distributions. The main advantage of dependent meshless methods is their ability to construct all the required mathematical entities (background integration points, nodal connectivity, shape functions, etc.) using only the information of the nodal distribution. After the construction of the background integration mesh, meshless methods must establish the nodal connectivity. For this, the most widespread technique is the influence domain concept, applied to various meshless formulations, such as the RPIM, EFGM, MLPG, and RKPM. Each integration point radially searches for its closed nodes, whose set will form its “influence domain” [22]. Afterwards, for each integration point , shape functions are constructed. Once again, the literature offers several techniques to build shape functions [22], such as moving least squares, radial basis functions, polynomial basis functions, Taylor’s expansion functions, Sibson functions, etc. These shape functions permit us to approximate/interpolate the variable field at an integration point with
being the number of nodes within the influence domain of the integration point defined as n. Vector contains the field variable components of each node inside the influence domain of , and is the component of the shape function constructed for . After constructing the shape functions and their partial derivatives, they are applied to the integro-differential equations of elasticity, leading to the system of algebraic equations. Then, the solution variable field across the domain is obtained by solving the system of algebraic equations.
2.1. Nodal Connectivity and Numerical Integration
Since the NNRPIM uses the mathematical concept of natural neighbours to construct the background set of integration points and to establish the nodal connectivity, it is necessary first to present it briefly. The natural neighbour concept requires the construction of the Voronoï diagram of the problem’s nodal discretisation [44]. Thus, assuming a 2D domain, discretised with N nodes: , the Voronoï diagram, , of is formed by a set of sub-regions , closed and convex, defined in (and defining) the same sub-space . Each node possesses its own Voronoï cell , which is defined as the geometric place where all points in its interior are closer to than any other , being . Thus, the Voronoï diagram of is defined by . The distinct Voronoï cells do not overlap or leave gaps between each other, allowing us to verify: . Figure 1 shows the Voronoï diagram of a given nodal discretisation. The natural neighbours of node are all the nodes whose Voronoï cells share an edge with the Voronoï cell of node (light grey cells in Figure 1a surrounding the dark grey cell in node ).
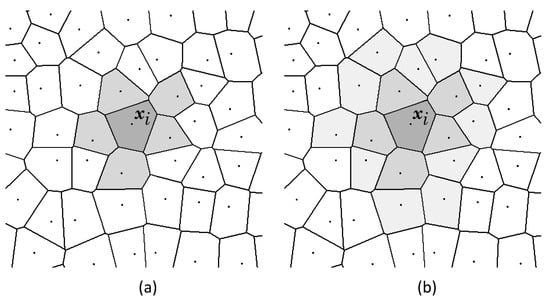
Figure 1.
Voronoï diagram of a given nodal discretisation. (a) First-degree influence cell. (b) second-degree influence cell.
Using the natural neighbour concept, it is possible to automatically establish influence domains, i.e., the nodal connectivity. Thus, in the NNRPIM, integration points inside Voronoï cell will inherit the nodal connectivity of node . In the NNRPIM, the “influence domain” concept is substituted by the similar “influence cell” concept. Instead of searching for the closest nodes, the influence domain of node is formed by the natural neighbours of node , which were already defined by the Voronoï diagram. Thus, two kinds of influence cells are possible: first-degree influence cells, Figure 1a, and second-degree influence cells, Figure 1b. The first-degree influence cells of node are formed by the natural neighbours of node and node themselves. The second-degree influence cells of node are formed by node itself, plus the natural neighbours of node (as a first-degree influence cell) and also the natural neighbour of those first natural neighbours.
In the NNRPIM, the construction of the background set of integration points also uses the information of the Voronoï diagram. As Figure 2 represents, for a generic irregular nodal distribution, the Voronoï cell of node can be sub-divided in quadrilaterals. Then, using the Gauss–Legendre quadrature integration scheme, it is possible to define the position and weight of each integration point inside the quadrilateral.

Figure 2.
Generic procedure for the construction of the background set of integration points based on the Voronoï diagram.
The procedure follows the following steps. First, each quadrilateral of a given Voronoï cell is transformed into a unit isoparametric square, allowing for the distribution of integration points within the isoparametric square respecting the Gauss–Legendre integration scheme [22].
Afterwards, as Figure 2 shows, the Cartesian coordinates of the integration points are defined from their isoparametric coordinates with Equation (2).
in which . Being isoparametric quadrilateral with four nodes, the generic equation of is defined as
with and being
The seminal study on the NNRPIM suggests using or integration points per quadrilateral sub-area [31]. The main disadvantage of using a integration scheme (as the one represented in Figure 2) is the inherent prohibitive computational cost. In general, using a integration scheme leads to computational analysis about times slower than the integration scheme. Moreover, the gain in accuracy of a integration scheme is not significant when compared with the integration scheme [22,31].
If the integration scheme per quadrilateral sub-cell is considered, the isoparametric coordinates and weight are these: . On the other hand, if the integration scheme per quadrilateral sub-cell is assumed, the following isoparametric coordinates and weights must be assumed,
Subsequently, it is possible to calculate the Cartesian integration weight of each integration point with the following expression:
in which the area of the quadrilateral sub-area is defined by and the area of the isoparametric cell is identified as . Notice that in this 2D case, is always .
Consequently, assuming a generic function defined inside a quadrilateral sub-area domain, , it is possible to integrate using a Gauss–Legendre integration scheme with integration points:
considering the Cartesian coordinates and integration weights of the corresponding integration points calculated with Equations (2) and (6), respectively.
This procedure is repeated for each sub-area of the Voronoï cell , and then the complete process is repeated again for each Voronoï cell of the Voronoï diagram . In the end, a background set of integration points is obtained, allowing us to integrate any function defined within the problem’s domain . Since , thus .
The formal construction of the Voronoï diagram and the background set of integration points is described with detail in the literature [22].
2.2. Shape Functions
NNRPIM shape functions are constructed using the radial point interpolating technique, presented next. Assuming a 2D domain, , in which a field function is discretised with N nodes, , the interpolated value of an given integration point, , can be calculated with:
in which is a radial basis function (RBF) and the polynomial basis function with m monomials is represented as . Vectors and are the vectors of the non-constant coefficients of and , respectively, defined as and .
Adding a polynomial basis function to the interpolation assures robustness and stability to NNRPIM shape functions. For example, including of a polynomial of order 2 confers consistency and allows the NNRPIM to pass the standard patch test. The literature on the NNRPIM [22,31] shows that it is enough to add a low-order polynomial basis, such as a constant polynomial basis () or a linear polynomial basis (). High-order polynomials increase the analysis’s overall computational cost without improving the final NNRPIM solution.
Since its early works [31], the NNRPIM uses a modified version of the initially proposed Multiquadratic Radial Basis Function (MQ-RBF) of Hardy [45], capable of taking into account the spatial dimension of the problem’s domain:
Regarding the MQ-RBF shape parameters c and p, for 2D analyses, the literature recommends that c should be close to zero, but not zero, and p should be close to one, but not one [22], with and being generally used.
Using only Equation (8) does not allow us to build a system of equations capable of providing the shape function of integration point . Hence, previous works on radial point interpolators [28,46] show that it is necessary to add an extra equation to build the required system of equations to assure a unique solution:
in which . In the end, a new equation matrix can be established joining both Equations (8) and (10):
The vector of the nodal parameters is defined as
and RBF matrix and polynomial basis matrix can be computed with
Manipulating Equation (11) allows us to obtain the vectors of the non-constant coefficients:
By back-substitution of , in Equation (8), the interpolation of can be defined:
in which represents the interpolation function of ,
The calculation of the partial derivatives of is required by the integro-differential equations ruling elasticity. Thus, assuming a general direction :
With the partial derivatives of the MQ-RBF defined as
As the literature shows, with the NNRPIM it is possible to impose directly natural and essential boundary conditions because its shape functions possess the Kronecker delta property and satisfy the partition of unity [22].
2.3. Discrete System of Equations
The global system of equations for an elasticity problem can be obtained with the virtual work principle. Assuming that the work produced by external forces is equal to the work produced by the internal forces, , the following expression can be written:
with the problem’s domain represented by . As the expression shows, on the domain’s surface boundary , natural and essential boundaries, and , respectively, can be defined. Thus, external forces can be applied on and displacement constrains can be imposed at . The solid domain can also be under the influence of body forces , acting uniformly on . Since Equation (20) requires both displacement components , they can be defined simultaneously:
leading to the following representation of the deformation vector:
in which the deformation matrix is defined as
Considering Hooke’s law, it is possible to calculate the stress at the integration point with:
In a 2D problem, the material constitutive matrix can be defined for for plane stress or plane stress conditions [47]. If plane stress is considered, the material constitutive matrix is defined with
If plane strain conditions are being considered, the constitutive matrix should be
in which , , and . Notice that is the Young’s modulus in material direction i, and and are the elastic shear modulus and Poisson’s ratio in the material plane , respectively.
Thus, considering how the stress and strain vectors were defined, it is possible to manipulate Equation (20) and obtain:
In this work, only small strains will be assumed ( and ), which allows us to simplify Equation (27) to:
allowing us to define the final system of equations of elasticity,
and, consequently, calculate the problem’s global displacement field:
It is possible to define the global stiffness matrix in its discretised form
as well as the global external force and body vectors, respectively, with:
The thickness of the 2D solid at the location of integration point is defined as . Since the NNRPIM uses interpolating shape functions, the imposition of essential and natural boundary conditions can be numerically implemented using the direct imposition method or the penalty methods.
2.4. Material Homogenisation Technique
First presented by Hill [11], the concept of Representative Volume Element (RVE) aims to characterise the microstructure of a material through a representative sub-region. An RVE represents a statistically significant sub-region of the material that captures the essential microstructural features. It is crucial for the RVE to be statistically representative, including a sufficient sampling of all microstructural heterogeneities within the multi-phase material. The appropriate size of the RVE is a critical parameter in multi-scale modelling. It needs to be large enough to capture the relevant heterogeneities but remain small compared to the overall macroscopic domain size. This section uses the RVE concept to present a micromechanical approach for determining the effective elastic properties of an one-phase material with distinct volume fractions.
An RVE, with volume domain , is associated with a macroscale material point (whose Cartesian coordinates are defined at the macroscale). Then, at the microscale, there are infinitesimal points , whose set represent the macroscale point . A local deformation at point leads to a perturbation of the RVE equilibrium. In the deformed configuration, the Cartesian coordinates of material point are represented by , which can be written as , with the motion of represented by function . Thus, it is possible to define the displacement of material point with:
which leads to,
This expression allows us to define the deformation gradient, , as a function of the displacement:
where is the second-order identity tensor. Assuming the microscale coordinates of a deformed point belonging to the RVE defined as , and if a macroscale deformation gradient at material point (i.e., to an RVE) is applied, a microscopic displacement field is produced [48],
in which the first term is the linear displacement field and the second term is the displacement fluctuation field.
The RVE displacement field is obtained with the equilibrium equations assuming a specific macroscale deformation gradient to the RVE. Then, with , the corresponding RVE’s strain and stress fields are obtained for each RVE’s integration point, .
Using the homogenisation principle, the macroscale stress, , and strain, , at material point can be calculated with the volume average of the stresses, , and strains, , on the RVE’s volume ,
with being the number of microscale integration points discretising the RVE and their corresponding microscale integration weight.
A fundamental principle in sub-scale modelling, the Hill–Mandel principle, ensures consistency between the macroscopic and microscopic energy states [11]. It stipulates that for a model to be energetically valid, the deformation energy at the macroscopic level must be equivalent to the average work performed by the stresses at the microscale. Mathematically, this relationship can be expressed as
which means that the virtual work expressed in Equation (29) is valid for the RVE. Thus, considering a microscopic virtual displacement and neglecting body forces, applying the virtual work principle to the RVE leads to
with being the traction force applied in the RVE’s boundary surface . Knowing that , it is possible to write
This relation allows us to impose macroscale deformation fields into the RVE and obtain corresponding equivalent forces.
In order to obtain the homogenised elastic properties of the 2D RVE, the plane strain problem will be assumed. This simplification is valid as long as one of the dimensions is much larger than the other two. In this work, at the macroscale, it will be assumed that the solid direction is much larger than the or directions. Consequently, the 2D RVE also possesses a theoretical infinite length. For example, if a circular void exists in the RVE, the void will be extended along direction, creating an infinite cylinder. Thus, the plain strain condition considers that , and . However, . Using Voigt notation, it is possible to write the generalised Hooke’s law for the plane strain condition as [35]
which can be presented as
with
and and the elasticity modulus in the plane material directions 1 and 2, and the elasticity modulus along the normal direction to the 1 and 2 plane (i.e., ). The plane shear elasticity modulus is represented by , and the Poisson ratio represents the ratio between the deformation observed in direction j, when a force is applied in direction i. Equation (45) is useful to obtain the stress field. However, due to the matrix size of the deformation matrix , notice that in order to establish the system of equations and obtain the displacement field, Equation (31), at the microscale or at the macroscale, the constitutive matrix used to build the stiffness matrix is defined as
In this work, the adopted procedure to obtain the homogenised elastic properties of the RVE can be summarised as follows:
- 1.
- Since only 2D examples are analysed in this work, it is only necessary to define three deformation fields:
- 2.
- 3.
- For each equivalent force obtained with Equation (49), impose at the RVE the following essential boundary conditions:with being the length of the RVE along the direction and and the imposed displacements along the and directions, respectively.
- 4.
- Using Equation (31), solve the system of equations and obtain the RVE’s displacement field for each load case considered: , and .
- 5.
- 6.
- 7.
- Using Equation (44), establish a system of equations:Three of these twelve equations are linear dependent and lead to the same result: , allowing us to obtain: . The remaining nine components , with , are obtained solving the other nine equations.
- 8.
- After obtaining all , it is possible to use Equation (45) to obtain the elastic mechanical properties:being
Since the homogenised mechanical properties will be estimated using the 2D plane strain assumptions, it is necessary to pre-estimate the elasticity modulus in the transversal direction (notice that in Equation (51) is always multiplied by zero). Thus, the rule of mixtures (ROM) is used [35],
where n is the number of fractions of material (in this case, there are only two fractions: material and absence of material, i.e., the void), is the volume fraction of fraction i, and is the Young’s modulus in material direction 3 of fraction i.
3. Numerical Results
Next, microscale and macroscale numerical examples are studied with the proposed meshless technique, and the produced results are analysed and discussed. Firstly, following the homogenisation procedure described in Section 2.4, the homogenised mechanical properties of a polyurethane foam (PUF) with circular voids are calculated. Afterwards, the obtained homogenised mechanical properties are then applied to a macroscale sandwich cantilever beam with aluminium top layers and PUF core. In order to study the influence of the PUF core density, distinct PUF cores are analysed: PUF cores with constant density and approximated functionally graded PUF cores.
In this work, the following two NNRPIM formulations are considered:
- NNRPIMv1: first-degree influence cell.
- NNRPIMv2: second-degree influence cell.
Regarding the integration scheme, for both NNRPIM formulations, one () integration point per quadrilateral sub-area was considered in all NNRPIM analyses. Concerning the construction of the shape functions, for both NNRPIM formulations, we considered the following: shape parameters and and a constant polynomial basis.
For comparison purposes, finite element formulations are applied [47], such as:
- FEM-3n: constant-strain linear triangular elements (three-node elements), with one integration point per element.
- FEM-6n: quadratic triangular elements (six-node elements), with full integration.
- FEM-4n: Lagrangian four-node elements, with full integration.
Regarding the software and hardware resources used in this work, all the NNRPIM and finite element method codes were fully written by the author using MatlabTM R2017b, and the nodal and element meshes were built with Simcenter Femap Student Edition SoftwareTM. All the analyses were performed with a standard laptop computer (Samsung, Suwon, Korea), with an Intel© CoreTM i5-3230M CPU, 2.60 GHz, and 8 GB of RAM.
3.1. Microscale Analysis
In order to obtain the homogenised mechanical properties of PUF with microscale cylindrical holes, the 2D parametric RVE represented in Figure 3 is considered with mm and unitary thickness. The circular hole parameters are , and the radius R of the central hole is defined as
with , the volume fraction of the RVE, defined as
with as the volume of the RVE: mm3 and as the volume occupied by effective PUF mass. For the microscale numerical analysis, the 2D plane strain deformation theory is considered.
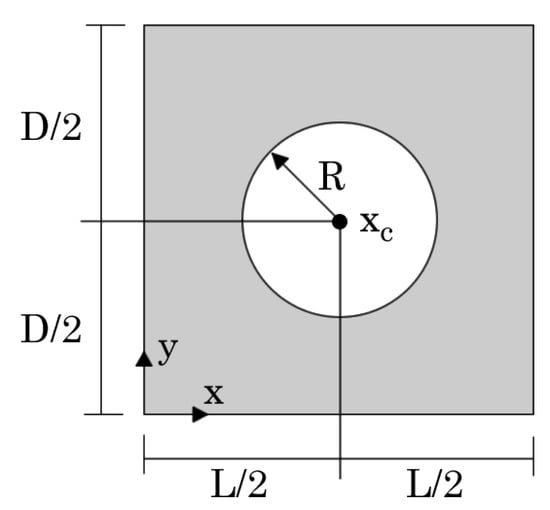
Figure 3.
Parametric representation of the analysed RVE.
As documented in the literature [49], the following isotropic elastic mechanical properties of bulk PUF () were assumed: MPa, MPa, and .
3.1.1. Convergence Study
Being this one of the first works on meshless methods combined with a multiscale analysis, particularly using void subdomains, it is necessary to understand if the technique under such assumptions shows a convergent behaviour. Thus, considering a radius of mm (corresponding to a volume fraction of ), five distinct meshes with an increasing number of nodes are built; see Figure 4.
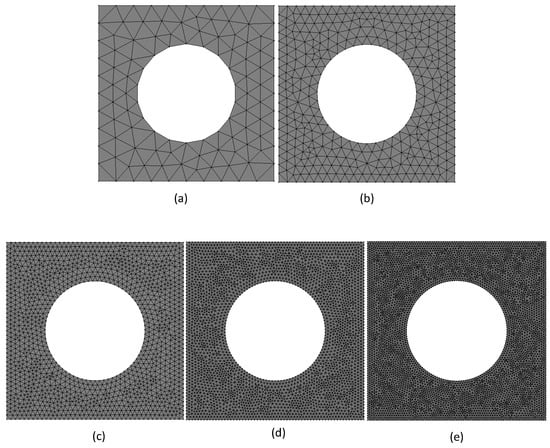
Figure 4.
Numerical discretisation models used for the NNRPIM and FEM analyses: (a) 234 triangular elements and 138 nodes; (b) 884 triangular elements and 483 nodes; (c) 3408 triangular elements and 1785 nodes; (d) 7768 triangular elements and 4005 nodes; (e) 13,664 triangular elements and 6993 nodes.
After constructing the models represented in Figure 4, the homogenised mechanical properties of each model (RVE) were obtained applying the procedure described in Section 2.4. Thus, the following elastic components of the homogenised constitutive material matrix, Equation (44), were obtained: , , , , , . Additionally, the homogenised material properties of the RVE were calculated, such as the Young’s modulus , , and ; the in-plane elastic shear modulus, ; and the Poisson’s ratio, . The results obtained with each mesh, for each formulation, are shown in Figure 5.
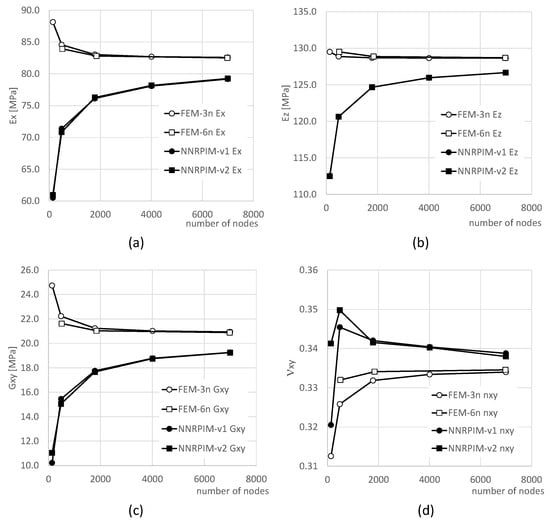
Figure 5.
Convergence study of the nodal discretisation for the elastic mechanical properties: (a) , (b) , (c) , and (d) .
With Figure 5, it is possible to visualise that all formulations converge. The FEM presents an upper bound convergence path, and, in opposition, the NNRPIM possesses a lower bound convergence path. The final converged value is not the same for the FEM and NNRPIM formulations. However, both FEM formulations converge to the same value, as well as both NNRPIM versions. It is possible to observe with Figure 5 that FEM-6n possesses the highest convergence rate. Regarding NNRPIM formulations, the results show that both approaches allow us to obtain very similar results.
Table 1 and Table 2 show the final converged values considering only the denser mesh shown in Figure 4e.

Table 1.
Elastic mechanical properties of the RVE for .

Table 2.
Elastic constitutive constants of the RVE for . in MPa.
Observing the numerical results of Table 1 and comparing the NNRPIM and FEM solutions, it is possible to understand that the difference between the NNRPIM and FEM solutions is about % for the Young’s modulus and , and % for . Regarding the elastic shear modulus and the Poisson’s ratio, the differences are about % and %, respectively. Such differences were expected because the NNRPIM and FEM formulations are very different from each other (background integration scheme, nodal connectivity, base functions of the shape functions). Similarly, for the elastic constitutive constants , differences between the results of the NNRPIM and FEM formulations can be found. With Table 2, it is possible to visualise the following differences: % for and , % for , % for , and % for .
Regarding the stress field distribution, in Figure 6 the Von Mises equivalent stress () field is presented for FEM-6n, FEM-3n, NNRPIMv1, and NNRPIMv2.
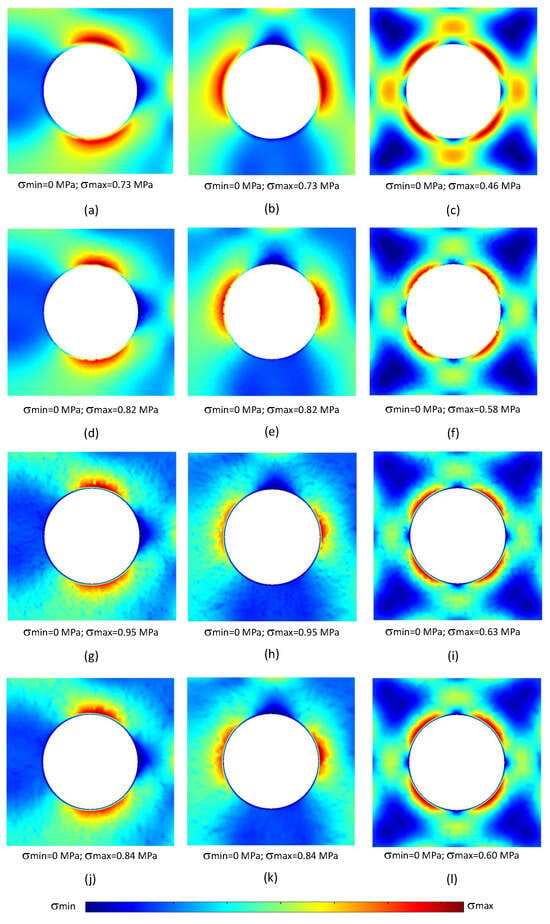
Figure 6.
Von Mises equivalent stress distribution for the formulations considered: FEM-6n (a–c), FEM-3n (d–f), NNRPIMv1 (g–i), and NNRPIMv2 (j–l). The results corresponding to are shown in (a,d,g,j), the results corresponding to are shown in (b,e,h,k), and the results corresponding to are shown in (c,f,i,l).
Analysis of Figure 6 reveals a clear distinction in stress distribution patterns. As anticipated, the FEM-6n formulation exhibits a remarkably smooth stress field. This behaviour is in accordance with the presence of quadratic terms within its shape functions, which inherently promote smoothness. Conversely, the stress distributions obtained for both NNRPIMv2 and NNRPIMv1 formulations display a level of granularity similar to FEM-3n.
Previous studies [22,24] have demonstrated the ability of meshless methods to achieve smoother stress fields compared to lower-order finite element methods. However, the results presented in Figure 6 for the effective stress fields obtained using NNRPIMv1 and NNRPIMv2 formulations appear to contradict such expectation. Both NNRPIMv1 and NNRPIMv2 formulations exhibit stress distributions with a similar level of granularity as the three-node triangular finite element method (FEM-3n). This behaviour becomes even more pronounced with NNRPIMv1, which uses a lower number of nodes within its influence domains.
The primary factor contributing to this lack of smoothness lies in the adopted integration scheme. To prioritise computational efficiency and flexibility, the NNRPIM formulation employs a single integration point within each sub-quadrilateral area of each Voronoï cell (recall Section 2.3 for details). While this approach may not significantly impact the average accuracy of the variable fields themselves, it does compromise its smoothness. As demonstrated in Figure 7, employing a higher-order integration scheme, such as the Gauss–Legendre integration detailed in Section 2.3, leads to a marked improvement in the smoothness of the stress fields. The stress distribution as improved significantly, being now more smooth and continuous (the granulated distributions has disappeared).
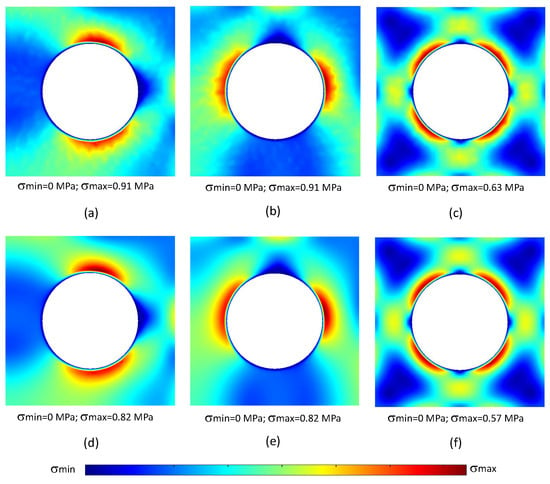
Figure 7.
Von Mises equivalent stress distribution obtained with NNRPIM considering an higher-order integration scheme: NNRPIMv1 with integration scheme per sub-area (a), (b) , and (c) . NNRPIMv2 with integration scheme per sub-area (d) , (e) , and (f) .
Comparing the results obtained with NNRPIMv1 (Figure 6g–i) and the NNRPIMv1* version with an higher integration order (Figure 7a–c), it is possible to visualise significant differences in the smoothness of the solution. Such a smoothness difference is more pronounced for the NNRPIMv2 formulation. Comparing the NNRPIMv2 stress distributions of Figure 6j–l with the NNRPIMv2* stress distribution (Figure 7d–f), it is possible to understand the effect of considering more integration points.
Although using a higher-order integration scheme demonstrably enhances the smoothness of the stress field (and potentially other variable fields), its impact on the homogenised material properties appears not to be relevant. Table 3 shows the results obtained with the NNRPIMv1* and NNRPIMv2* versions (with an higher integration order), and comparing such results with the solutions presented in Table 1 and Table 2, it is possible to observe that the homogenised values are not significantly affected by the integration scheme.

Table 3.
Elastic homogenised mechanical properties and constitutive constants of the RVE with obtained with NNRPIMv1* and NNRPIMv2* formulations considering an higher-order integration scheme. in MPa.
While the enhanced smoothness achieved with the higher-order integration scheme is desirable, it comes at the expense of increased computational cost. Employing a single integration point per sub-quadrilateral area within each Voronoï cell allows for significantly faster analysis (approximately times faster) compared to the integration scheme. This becomes particularly relevant for computationally demanding problems, such as nonlinear analyses. Consequently, the subsequent examples will continue to use the single integration point approach to maintain computational efficiency.
3.1.2. Homogenised Material Properties
One of the main goals of the present research work is to study the influence of the volume fraction () of the PUF on the final homogenised mechanical properties. Therefore, the increasing volume fractions presented in Table 4 were considered for the PUF core. Then, applying Equation (55), for each volume fraction considered, a corresponding radius for the circular hole was calculated; see Table 4.

Table 4.
Relation between the volume fraction and the circular hole radius.
Concerning the nodal discretisation to adopt for this analysis, the results of the previous convergence test, Figure 5, allowed us to understand that a nodal density with approximately 4000 nodes for is sufficiently dense, permitting us to obtain solutions very close to the theoretical converged value. Hence, the RVEs of each volume fraction were discretised with nodal meshes respecting a proportional nodal density; see Figure 8.
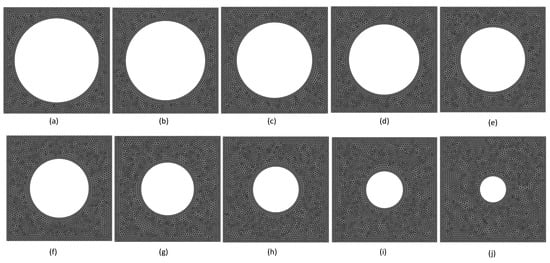
Figure 8.
Discretisation meshes used with the NNRPIM and FEM analyses. (a) , 2671 nodes, and 5178 triangular elements. (b) , 2937 nodes, and 5696 triangular elements. (c) , 3205 nodes, and 6214 triangular elements. (d) , 3472 nodes, and 6732 triangular elements. (e) , 3739 nodes, and 7249 triangular elements. (f) , 4005 nodes, and 7767 triangular elements. (g) , 4273 nodes, and 8285 triangular elements. (h) , 4539 nodes, and 8803 triangular elements. (i) , 4807 nodes, and 9321 triangular elements. (j) , 5073 nodes, and 9839 triangular elements.
All the constructed models follow the same geometry of Figure 3, with mm and unitary thickness, and the same bulk PUF mechanical properties: MPa, MPa, and . Then, using the same homogenisation procedure and considering plane strain deformation theory, the homogenised mechanical properties for each volume fraction were calculated. The results are shown in Figure 9.
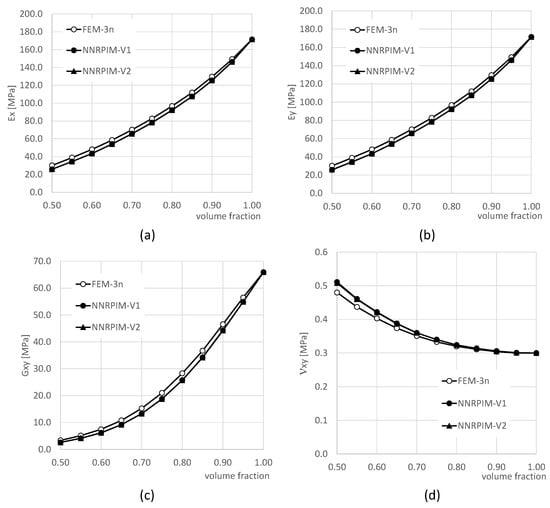
Figure 9.
Influence of the volume fraction on the homogenized elastic mechanical properties: (a) , (b) , (c) , and (d) .
The influence of PUF volume fraction on its homogenised elastic properties can be observed in Figure 9. Polynomial curves can be effectively fitted to each property as a function of volume fraction, indicating a predictable relationship. Also, FEM and NNRPIM predictions exhibit good agreement and follow similar trends. However, the most significant discrepancy is observed in Poisson’s ratio, particularly at lower volume fractions.
These findings pave the way for the development of macroscale models of sandwich beams or plates incorporating a PUF core. By employing the homogenised mechanical properties of PUF with varying volume fractions (due to the presence of cylindrical holes), such models can be used to analyse large-scale applications. Table 5 summarises the homogenised mechanical properties of PUF obtained from FEM-3n, NNRPIMv1, and NNRPIMv2 formulations for different volume fractions.

Table 5.
Homogenised mechanical properties with respect the volume fraction.
For NNRPIM formulations, it is possible to observe that the homogenised Poisson’s ratio for is higher than . This observation aligns with findings reported by Luo et al. (2021) for similar foams in sandwich plates [50]. A Poisson’s ratio greater than 0.5 violates the assumptions of plane strain, making macroscale applications utilising these homogenised properties impossible. However, alternative approaches such as 2D plane stress deformation and full 3D deformation theories remain viable options. Consequently, to maintain consistency in the numerical framework of the macroscale analysis, only the homogenised mechanical properties obtained from the FEM-3n formulation will be employed.
3.2. Macroscale Analysis
In this section, sandwich cantilever beams are analysed considering for the PUF cores the homogenised mechanical properties presented in Table 5. First, beams with homogeneous PUF cores bounded by aluminium face sheets are studied. Afterwards, gradually modifying the homogenised mechanical properties of the PUF core along the core thickness, approximated functionally graded sandwich cantilever beam models are constructed and numerically analysed. Regarding the mechanical properties of the aluminium face sheets, the following linear elastic isotropic material properties are considered: Young’s modulus GPa and Poisson’s ratio . Considering for all models a regular mesh with divisions (corresponding to a uniform regular mesh of 3751 nodes and 3600 quadrilateral elements), all the studied models were analysed with FEM-4n, NNRPIMv1, and NNRPIMv2.
This study is a pure numerical research work. No experimental or practical applications were produced or tested. Since in this work all static analyses were performed assuming linear elastic material behaviour, with small strains and no contact assumptions, it was not possible to capture or address some practical problems that recurrently appear in sandwich structures [51], such as the detection, propagation, and mitigation of damage to the sandwich core and at the interface; fatigue and creep testing; delamination and debounding between the core and face sheets; nonlinear material and geometric response; and temperature and humidity effects. Additionally, this paper assumes aluminium face sheets and a PUF core, which can lead to catastrophic scenarios, like the ones documented in the work of Florence et al. [52] for bending of honeycomb PUF cores: the core fails and delaminates from the face sheets; the core and traction face sheet fracture; and the core is crushed, losing thickness and bending stiffness.
3.2.1. Sandwich Cantilever Beam
A sandwich cantilever, with the the geometry and boundary conditions shown in Figure 10, is analysed. The beam presents the dimensions: m, m and m, and a unitary thickness ( m) along direction. At the beam’s right edge, all degrees of freedom are constrained (clamped condition) and at its left-top corner, a localised load is applied: N. Six distinct volume fractions () were considered for the PUF core, which will allow us to analyse the influence on the beam’s displacement and stress fields of using PUF cores with distinct volume fractions. For each considered volume fraction, the corresponding homogenised mechanical properties (obtained with FEM-3n) are extracted from Table 5.
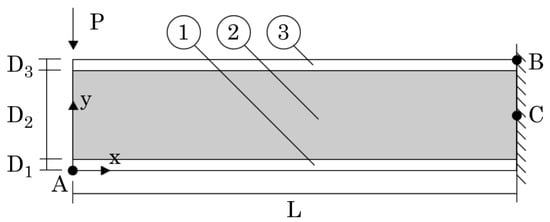
Figure 10.
Sandwich cantilever beam, with aluminium face sheets (layers 1 and 3) and PUF core (layer 2). The geometric characteristics, essential and natural boundary conditions and material distribution are indicated, as well as the interest points A, B and C.
Respectively, in Table 6 and Table 7 are presented the displacement components along (u) and (v) obtained in point A (represented in Figure 10). The last two columns correspond to the difference between the NNRPIM and FEM solutions following the expression
being and the variable values obtained with FEM and NNRPIMv1, respectively. For NNRPIMv2, the same Equation (57) is applied considering NNRPIMv2 instead NNRPIMv1.

Table 6.
Displacement obtained at point A along direction for sandwich cantilever beams with PUF cores with distinct volume fractions. u in [mm].

Table 7.
Displacement obtained at point A along direction for sandwich cantilever beams with PUF cores with distinct volume fractions. v in [mm].
It is possible to observe that NNRPIM solutions present lower displacement values than FEM solutions. Thus, the NNRPIM leads consistently to more rigid solutions than the FEM. Regarding the vertical displacement v, depending on the density of the PUF core, the solutions of the FEM and NNRPIMv1 present differences between 5.6% and 6.1% and between 5.5% and 6.6% for NNRPIMv2. Comparing the NNRPIMv1 and NNRPIMv2 results, it is possible to find lower differences, around 1%. On the other hand, observing the horizontal displacement u, the overall difference between the FEM and NNRPIM techniques is significantly reduced to 3% to 7.6%.
Local stress values were also documented and analysed. The normal stress at point B (in the top aluminium layer) and the shear stress at point C (in the PUF core, at m), both represented in Figure 10, were obtained and included in Table 8 and Table 9.

Table 8.
Normal stress obtained at point B for sandwich cantilever beams with PUF cores with distinct volume fractions. in MPa.

Table 9.
Shear stress obtained at point C for sandwich cantilever beams with PUF cores with distinct volume fractions. in kPa.
As expected, being more rigid when compared with the FEM, the NNRPIM presents lower stress values. In this case, the differences are significant. Regarding the normal stress , the difference is about 8.4% to 11.2% for NNRPIMv1 and between 15.5% and 20.7% for NNRPIMv2. For the shear stress , NNRPIMv1 shows differences of around 2.0% to 7.6% to FEM solutions, and NNRPIMv2 presents differences of about 3.1% to 6.7% to FEM results.
Although the formulation of NNRPIMv1 leads to much smaller influence domains than NNRPIMv2, both formulations deliver very close results. In the FEM-4n formulation, shape functions are constructed using four nodes (the nodes comprising the finite element). In the NNRPIMv1 and NNRPIMv2 formulations, shape functions are constructed using approximately 5 to 10 nodes and 16 to 32 nodes, respectively. Thus, the NNRPIM possesses a larger nodal connectivity than the FEM. This additional connectivity can have an unwanted effect. When the strain/stress fields are being calculated, an integration point within material 1 domain use nodes belonging to material 2 to construct its shape function because those nodes are inside its influence domain. Thus, the strain/stress fields are averaged by both materials, smoothing (lowing) the strain/stress at the transition zone. Furthermore, since corner nodes posses a lower number of natural neighbours, their integration points will possess influence domains with a lower number of nodes, leading to the construction of shape functions with lower complexity than the shape functions of integration points within the middle of the domain (which possess more nodes inside their influence domains). All these factors contribute to the higher rigidity of the NNRPIM formulations and their lower stress values.
An additional factor explaining the lower stress value of normal stress is the geometric position of the integration point closest to point B. Actually, the normal stress is obtained on the integration point closer to point B, not at point B exactly. Due to the difference in the construction procedure of the background integration mesh of the FEM-4n and NNRPIM, the closest integration point will be placed in a very different position. In the FEM, the integration point closer to point B will be much closer to point B than the integration point closer to point B of the NNRPIM. Thus, the documented normal stress near point B of the FEM and NNRPIM will be significantly different. This effect can be observed in the following figures.
In Figure 11, Figure 12 and Figure 13 are presented the variation in the normal stress along the edge of the beam thickness on the clamped edge (the closest integration points to the clamped edge are selected, and their stress values are documented). It was observed that the magnitude of the normal stress varies significantly from the aluminium face sheets to the PUF core. Thus, the thickness was divided in three sections: in Figure 11 and Figure 13, the normal stress on the top and bottom aluminium layers is shown, respectively, and Figure 12 shows the normal stress on the PUF core.
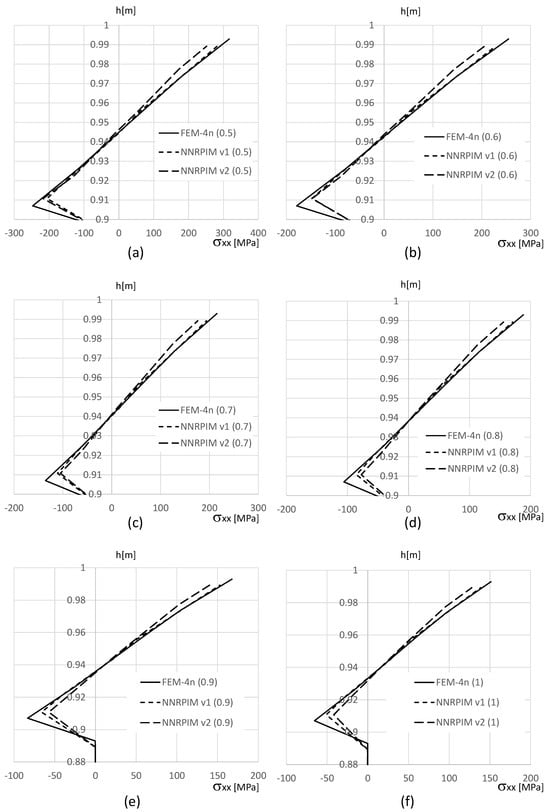
Figure 11.
Variation in the normal stress along the aluminium top face sheet for distinct PUF cores. (a) . (b) . (c) . (d) . (e) . (f) .
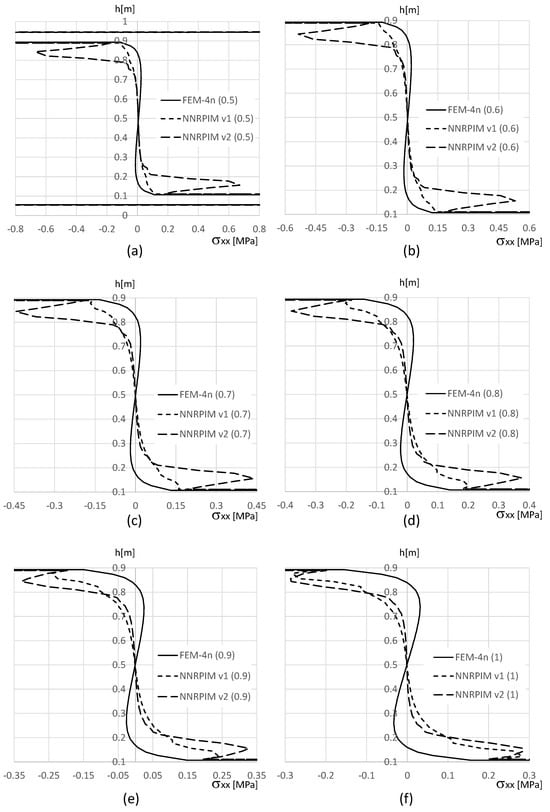
Figure 12.
Variation in the normal stress along the PUF core, for distinct PUF cores. (a) . (b) . (c) . (d) . (e) . (f) .
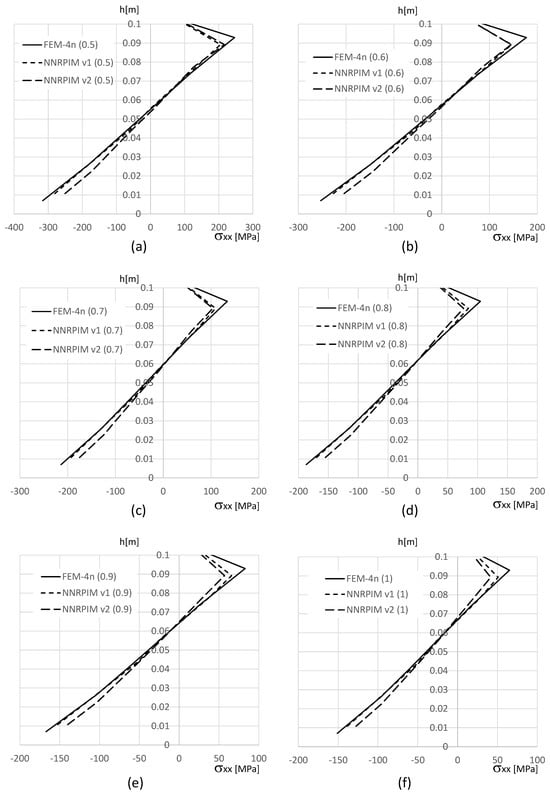
Figure 13.
Variation in the normal stress along the aluminium bottom face sheet for distinct PUF cores. (a) . (b) . (c) . (d) . (e) . (f) .
Understanding the variation in the in-plane shear stress, , across the beam thickness, particularly at the clamped edge, is of particular interest. Figure 14, Figure 15 and Figure 16 show this variation. Similar to the observations for the normal stress, , a significant disparity exists between the magnitude of in the top and bottom aluminium layers compared to the PUF core. Consequently, the results are presented separately: Figure 15 depicts the distribution of within the PUF core, while Figure 14 and Figure 16 present the distribution of in the top and bottom aluminium layers, respectively.
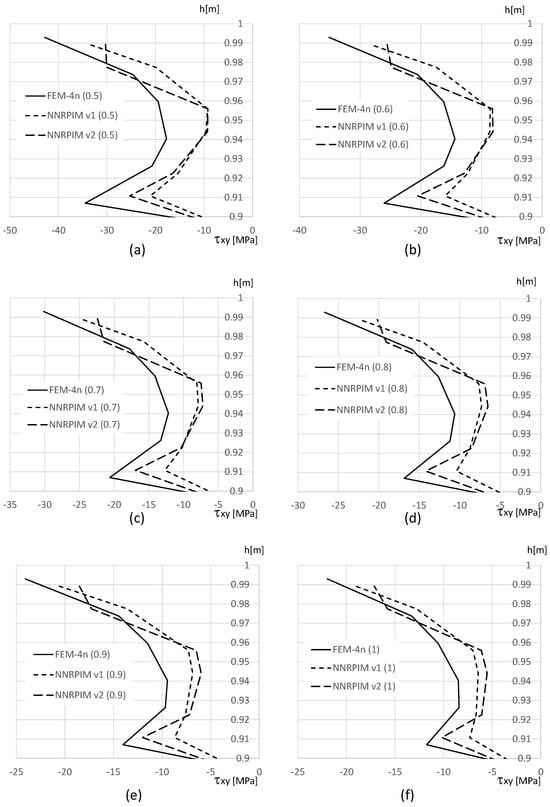
Figure 14.
Variation in the shear stress along the aluminium top face sheet for distinct PUF cores. (a) . (b) . (c) . (d) . (e) . (f) .
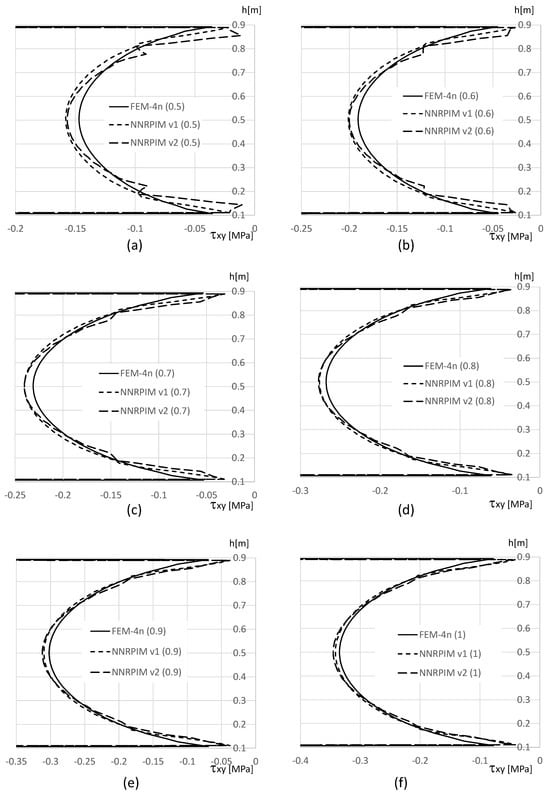
Figure 15.
Variation in the shear stress along the PUF core, for distinct PUF cores. (a) . (b) . (c) . (d) . (e) . (f) .
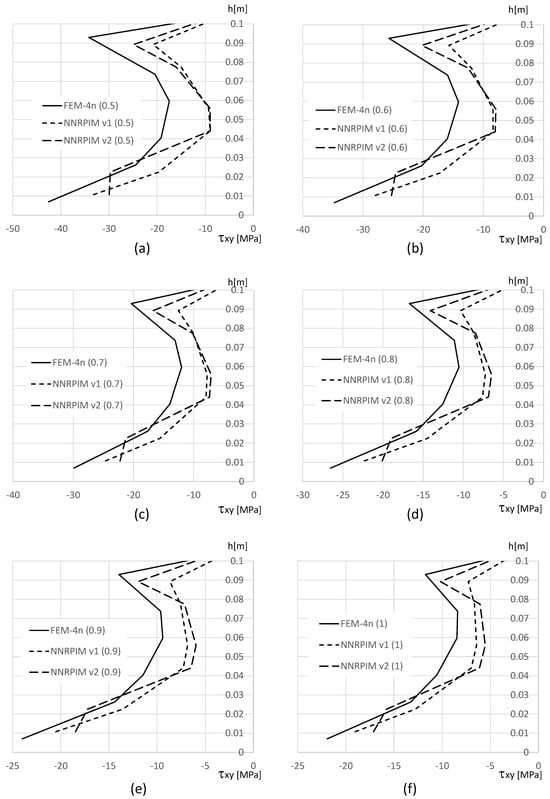
Figure 16.
Variation in the shear stress along the aluminium bottom face sheet for distinct PUF cores. (a) . (b) . (c) . (d) . (e) . (f) .
With Figure 11 and Figure 13 (normal stress at the top and bottom aluminium layer, respectively), it is possible to observe that FEM-4n and NNRPIMv1 produce very close solutions. Regarding NNRPIMv2, the results are not so different from the FEM-4n solutions, as Table 8 initially suggested. With Figure 11 and Figure 13, it is possible to understand that because the integration points of FEM-4n are closer to the top (and bottom) surface of the top (and bottom) aluminium layers, they allow for higher magnitudes for than the NNRPIM solutions. Regarding the PUF core, Figure 12, it is possible to visualise that for lower PUF densities, NNRPIMv1 is closer to FEM-4n, but for higher PUF densities, NNRPIMv1 starts to approximate the NNRPIMv2 solution. It is also visible that the NNRPIMv2 solution is disturbed in the interface between the PUF core and the top (and bottom) aluminium layers. This stress perturbation is due the nature of the influence domains. The integration points belonging to the PUF core near the interface start to possess nodes inside their influence domains that belong to the aluminium layer. As the PUF core rigidity starts to increase (by increasing the PUF core density), the effect starts to dissipate because the rigidity of the core material starts to approximate the rigidity of the face sheet material. Nevertheless, the magnitude of the normal stress level within the PUF core is very low, with the highest magnitudes observed in the top and bottom aluminium layers.
Regarding the shear stress distribution along the beam thickness, the results show that the highest values can be found at the top and bottom aluminium layers (Figure 14 and Figure 16). Notice that, as for , also shear stress on the integration points closer to the top (and bottom) surface of the top (and bottom) aluminium layers present lower magnitudes than FEM-4n. This can be explained with the position of the integration point. The integration points of FEM-4n are closer to the beam’s top (and bottom) surfaces, allowing us to predict higher stress magnitudes. Concerning the PUF core, shown in Figure 15, as expected, the distribution is approximately parabolic and all the formulations allow us to obtain very similar results. The same disturbance effect observed for the normal stress near the aluminium/PUF interface is visible although highly attenuated.
3.2.2. Functionally Graded Sandwich Cantilever Beam
In this subsection, two cantilever beams with aluminium face sheets with approximately functionally graded PUF cores are analysed. As Figure 17 shows, the PUF core possesses eight distinct layers, each one with its own volume fraction. With its right side clamped, the beam is submitted to a localised load N at the top-left corner and it possesses the following dimensions: m and m, for .

Figure 17.
Sandwich cantilever beam, with aluminium face sheets (sheets 1 and 10) and a functionally graded PUF core (sheets from 2 to 9). The geometric characteristics, essential and natural boundary conditions and material distribution are indicated, as well as the interest points A, B and C.
For the PUF core, two different approximately functionally graded PUF are considered (FG1 and FG2). The volume fractions and corresponding mechanical properties of each layer are indicated in Table 10 for both FG1 and FG2 beam models.

Table 10.
Mechanical properties of each layer (Al—aluminium; PUF—polyurethane foam).
Using the FEM-4n and both NNRPIM formulations, the and displacements of point A (indicated in Figure 17) were obtained and documented in Table 11 and Table 12, respectively. The results show that the difference between the FEM-4n and NNRPIM formulations is around 3.5% for the u displacement and slightly lower for the v displacement component. Thus, despite being distinct numerical formulations, these results show that the FEM-4n and NNRPIM provide similar solutions.

Table 11.
Displacement obtained at point A along direction for sandwich cantilever beams with functionally graded PUF cores. u in [mm].

Table 12.
Displacement obtained at point A along direction for sandwich cantilever beams with functionally graded PUF cores. v in [mm].
In Table 13 and Table 14 are shown the normal stress obtained at point B and shear stress from point C, respectively. Both points B and C are depicted in Figure 17.

Table 13.
Normal stress obtained at point B for sandwich cantilever beams with functionally graded PUF cores. in MPa.

Table 14.
Shear stress obtained at point B for sandwich cantilever beams with functionally graded PUF cores. in kPa.
Regarding the normal stress at point B and the shear stress at point C, both represented in Figure 17, the obtained results are shown in Table 13 and Table 14, respectively.
The results show a similar trend with the previous numerical example. The normal stress obtained with NNRPIMv1 differs about 9% from the FEM-4n solution, and the NNRPIMv2 presents higher differences: 16.9% and 17.8% for FG1 and FG2, respectively. As in the previous numerical examples, these differences can be explained by the position of the integration point for which the stress is being obtained (in the following results, this idea can be validated). Regarding the shear stress , the difference between the FEM-4n and both NNRPIM formulations is around 5%.
This observed disparity in normal and shear stress confirms an established notion in meshless methods [22]: when employing a large number of nodes within the influence domain, integration points situated near boundaries (such as point B) tend to encompass larger support domains. This characteristic can introduce a smoothing effect, leading to a reduction in the local magnitude of the variable field. Conversely, integration points positioned further within the physical domain (such as point C) generally possess smaller support domains, leading to sharper approximations of the field values.
The distributions along the thickness of the beam of the stress fields and on the clamped edge (obtained for the integration points near the clamped edge, not at the edge itself) are shown in Figure 18 and Figure 19, respectively.
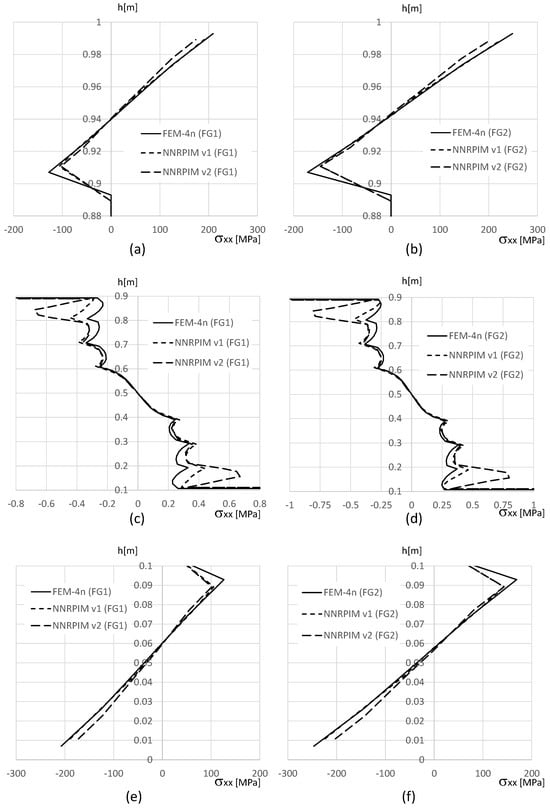
Figure 18.
Variation in the normal stress along the beam thickness. (a) FG1 beam, for m. (b) FG2 beam, for m. (c) FG1 beam, for m. (d) FG2 beam, for m. (e) FG1 beam, for m. (f) FG2 beam, for m.
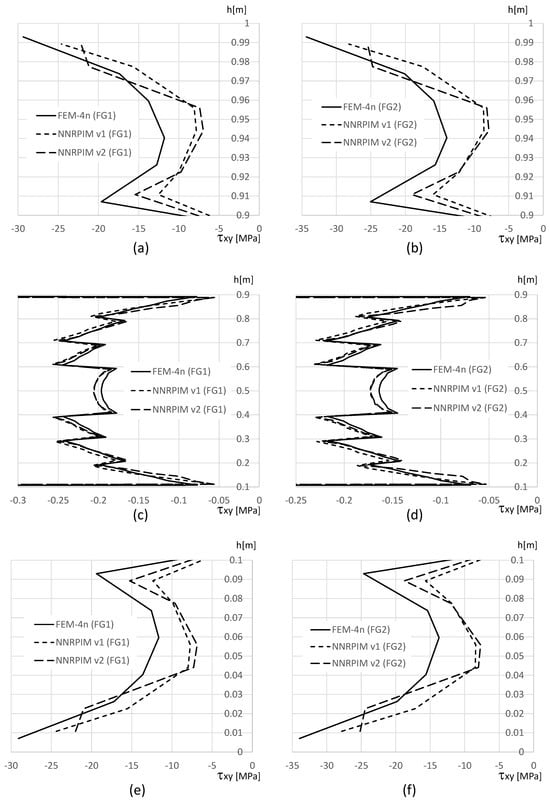
Figure 19.
Variation in the shear stress along the beam thickness. (a) FG1 beam, for m. (b) FG2 beam, for m. (c) FG1 beam, for m. (d) FG2 beam, for m. (e) FG1 beam, for m. (f) FG2 beam, for m.
In Figure 18a,b,e,f, it is possible to observe that the NNRPIMv2 values near the edge surface of the beam ( and ) are smoothed. This effect, in addition to the difference between the location of the integration points of the FEM-4n and NNRPIM formulations, explains why the localised results of the NNRPIM, shown in Table 13, are so different from the ones obtained with the FEM-4n. Furthermore, with Figure 18, it is possible to visualise that NNRPIMv1 provides very similar results to the FEM-4n. Concerning the normal stress along m, in Figure 18c,d, all solutions are acceptably close to each other.
Regarding the shear stress , shown in Figure 19, the FEM-4n and NNRPIM solutions are in accordance with previous studies. In Figure 19a,b,e,f, it is visible that at the free edges of the beam ( and ) due to the size of the support domain, the FEM-4n solutions differ from the NNRPIM solutions. Nevertheless, at the PUF core, Figure 19c,d, the FEM-4n and NNRPIM solutions are actually very close to each other.
4. Conclusions
In this work, a full multiscale study involving sandwich beams with a polyurethane foam (PUF) core is presented. First, the bulk PUF was modified through the inclusion of circular holes, allowing us to create PUFs with distinct volume fractions. Then, the homogenised mechanical properties of the PUF, with respect to its volume fraction, were obtained using a homogenisation technique combined with finite element methods (FEMs) and two versions of the natural neighbour radial point interpolation method (NNRPIM): one using influence domains with the first natural neighbours (NNRPIMv1) and another considering influence domains with the first and second natural neighbours (NNRPIMv2). The obtained results show that the NNRPIM formulations are capable to deliver solutions close to high-order FEM formulations, such as quadratic triangular elements (FEM-6n). However, to achieve variable fields with the same level of smoothness of the FEM-6n, the NNRPIM formulations require an increase in the number of integration points per quadrilateral sub-area integration cell, leading to a very high computational cost and, consequently, decreasing the overall NNRPIM numerical efficiency. Next, after calculating the homogenised mechanical properties of PUFs with respect to their volume fractions, those mechanical properties were applied to large-scale problems: a sandwich cantilever beam with a homogeneous PUF core and a sandwich cantilever beam with an approximated functionally graded PUF core. It was found that near the domain edge, the NNRPIMv2 formulation, having larger influence domains, leads to local lower stress values. However, stress distributions obtained with all the distinct formulations studied tend to agree along the thickness of the beam. The results obtained for the macroscale examples consistently show that NNRPIMv1 is capable to produce results very close to FEM-4n. Such findings are very interesting, since NNRPIMv1 appears to be more efficient than the NNRPIMv2 formulation by showing lower computational costs. The results documented in this work allow us to verify that the NNRPIM formulations, especially the NNRPIMv1 version, are a solid alternative to the FEM. Particularly in the microscale examples, the results also show that if the objective is to obtain a smooth representation of the stress field, the number of integration points per quadrilateral sub-area integration cell should be increased. However, this approach is not very numerically interesting, since it increases the computational cost of the analysis without a significant gain in accuracy.
This study presents a comprehensive multiscale investigation of sandwich beams using a polyurethane foam (PUF) core. The research adopts a two-step approach. First, a micromechanical numerical characterisation and then a macroscale analysis were performed.
- Micromechanical characterisation: The bulk PUF was modified by incorporating circular holes, enabling the creation of PUFs with varying volume fractions. Subsequently, a homogenisation technique, coupled with finite element methods (FEMs) and two distinct natural neighbour radial point interpolation methods (NNRPIMs), was employed to determine the homogenised mechanical properties of the PUF with respect to its volume fraction. The NNRPIM formulations differed in the consideration of neighbouring nodes within their influence domains: NNRPIMv1 uses only first natural neighbours, while NNRPIMv2 incorporated both first and second natural neighbours. The results demonstrated that both NNRPIM formulations delivered solutions comparable to high-order FEM formulations (e.g., quadratic triangular elements, FEM-6n). However, to achieve variable fields exhibiting a smoothness level equivalent to FEM-6n, NNRPIM formulations require a significant increase in the number of integration points per quadrilateral sub-area integration cell. This resulted in a substantial rise in computational cost, ultimately compromising the overall numerical efficiency of the NNRPIM.
- Macroscale analysis: The homogenised mechanical properties obtained for PUFs with varying volume fractions were then implemented in large-scale simulations. These simulations involved a sandwich cantilever beam with a homogeneous PUF core and another with an approximated functionally graded PUF core. The analysis revealed that near the domain boundary, NNRPIMv2, with its larger influence domains, yielded lower local stress values. However, the stress distributions across the beam thickness exhibited convergence among all the investigated formulations. The findings consistently indicated that NNRPIMv1 generated results closely matching FEM-4n for the macroscale examples. Comparing the displacement obtained with the FEM and both NNRPIM versions, it can be concluded that for uniform PUF cores, NNRPIMv1 provides results with ] 3.0%, 6.6% [ and for the u and v components, respectively, and for the same u and v components, NNRPIMv2 is capable to deliver results with and , respectively. Regarding the approximated functionally graded PUF cores, the difference between the FEM and both NNRPIM versions is much lower. For the u and v displacement components, the results obtained with NNRPIMv1 are and , respectively, and for the NNRPIMv2 it was observed that and , respectively, for the u and v displacement components.
To conclude, the obtained results show that both NNRPIM formulations, especially the NNRPIMv1 version, are solid alternatives to the FEM. Particularly in the microscale examples, the results also show that if the objective is to obtain a smooth representation of the stress field, the number of integration points per quadrilateral sub-area integration cell should be increased. However, this approach is not very interesting numerically, since it increases the computational cost of the analysis without a significant gain in accuracy.
Funding
This research received no external funding.
Institutional Review Board Statement
Not applicable.
Informed Consent Statement
Not applicable.
Data Availability Statement
The original contributions presented in the study are included in the article, further inquiries can be directed to the corresponding author.
Acknowledgments
The author acknowledges the funding provided by Ministério da Ciência, Tecnologia e Ensino Superior—Fundação para a Ciência e a Tecnologia (Portugal) and LAETA, under internal project UIDB/50022/2020.
Conflicts of Interest
The author declares no conflicts of interest.
References
- Castanie, B.; Bouvet, C.; Ginot, M. Review of composite sandwich structure in aeronautic applications. Compos. Part C Open Access 2020, 1, 100004. [Google Scholar] [CrossRef]
- Garg, A.; Belarbi, M.; Chalak, H.; Chakrabarti, A. A review of the analysis of sandwich FGM structures. Compos. Struct. 2021, 258, 113427. [Google Scholar] [CrossRef]
- Caliri, M.; Ferreira, A.; Tita, V. A review on plate and shell theories for laminated and sandwich structures highlighting the Finite Element Method. Compos. Struct. 2016, 156, 63–77. [Google Scholar] [CrossRef]
- Vaghefi, R. Thermo-elastoplastic analysis of functionally graded sandwich plates using a three-dimensional meshless model. Compos. Struct. 2020, 242, 112144. [Google Scholar] [CrossRef]
- Pagano, N. Exact Solutions for Rectangular Bidirectional Composites and Sandwich Plates. J. Compos. Mater. 1970, 4, 20–34. [Google Scholar] [CrossRef]
- Zenkour, A. Three-dimensional Elasticity Solution for Uniformly Loaded Cross-ply Laminates and Sandwich Plates. J. Sandw. Struct. Mater. 2007, 9, 213–238. [Google Scholar] [CrossRef]
- Kashtalyan, M.; Menshykova, M. Three-dimensional elasticity solution for sandwich panels with a functionally graded core. Compos. Struct. 2009, 87, 36–43. [Google Scholar] [CrossRef]
- Woodward, B.; Kashtalyan, M. Bending response of sandwich panels with graded core: 3D elasticity analysis. Mech. Adv. Mater. Struct. 2010, 17, 586–594. [Google Scholar] [CrossRef]
- Woodward, B.; Kashtalyan, M. 3D elasticity analysis of sandwich panels with graded core under distributed and concentrated loadings. Int. J. Mech. Sci. 2011, 53, 872–885. [Google Scholar] [CrossRef]
- Ghosh, S. Micromechanical Analysis and Multi-Scale Modeling Using the Voronoi Cell Finite Element Method, 1st ed.; CRC Press: Boca Raton, FL, USA, 2011. [Google Scholar] [CrossRef]
- Hill, R. Elastic properties of reinforced solids: Some theoretical principles. J. Mech. Phys. Solids 1963, 11, 357–372. [Google Scholar] [CrossRef]
- Hill, R. The essential structure of constitutive laws for metal composites and polycrystals. J. Mech. Phys. Solids 1967, 15, 79–95. [Google Scholar] [CrossRef]
- Kheyabani, A.; Massarwa, E.; Kefal, A. Multiscale structural analysis of thick sandwich structures using parametric HFGMC micromechanics and isogeometric plate formulation based on refined zigzag theory. Compos. Struct. 2022, 297, 115988. [Google Scholar] [CrossRef]
- Paley, M.; Aboudi, J. Micromechanical analysis of composites by the generalized cells model. Mech. Mater. 1992, 14, 127–139. [Google Scholar] [CrossRef]
- Pahr, D.; Arnold, S. The applicability of the generalized method of cells for analyzing discontinuously reinforced composites. Compos. Part B 2002, 33, 153–170. [Google Scholar] [CrossRef]
- Bednarcyk, B.; Arnold, S. Micromechanics-based modeling of woven polymer matrix composites. AIAA J. 2003, 41, 1788–1796. [Google Scholar] [CrossRef]
- Rao, S. The Finite Element Method in Engineering, 6th ed.; Butterworth-Heinemann: Oxford, UK, 2018. [Google Scholar] [CrossRef]
- Patel, V.; Rachchh, N. Meshless method—Review on recent developments. Mater. Today Proc. 2020, 26, 1598–1603. [Google Scholar] [CrossRef]
- Zhang, M.; Abidin, A.; Tan, C. State-of-the-art review on meshless methods in the application of crack problems. Theor. Appl. Fract. Mech. 2024, 131, 104348. [Google Scholar] [CrossRef]
- Gu, Y. Meshfree methods and their comparisons. Int. J. Comput. Methods 2005, 2, 477–515. [Google Scholar] [CrossRef]
- Nguyen, V.; Rabczuk, T.; Bordas, S.; Duflot, M. Meshless methods: A review and computer implementation aspects. Math. Comput. Simul. 2008, 79, 763–813. [Google Scholar] [CrossRef]
- Belinha, J. Meshless Methods in Biomechanics—Bone Tissue Remodelling Analysis, 1st ed.; Springer: Berlin/Heidelberg, Germany, 2014. [Google Scholar] [CrossRef]
- Nayroles, B.; Touzot, G.; Villon, P. Generalizing the finite element method: Diffuse approximation and diffuse elements. Comput. Mech. 1992, 10, 307–318. [Google Scholar] [CrossRef]
- Belytschko, T.; Lu, Y.; Gu, L. Element-free Galerkin methods. Int. J. Numer. Methods Eng. 1994, 37, 229–256. [Google Scholar] [CrossRef]
- Liu, W.; Jun, S.; Zhang, F. Reproducing kernel particle methods. Int. J. Numer. Methods Fluids 1995, 20, 1081–1106. [Google Scholar] [CrossRef]
- Sukumar, N.; Moran, B.; Belytschko, T. The natural element method in solid mechanics. Int. J. Numer. Methods Eng. 1998, 43, 839–887. [Google Scholar] [CrossRef]
- Liu, G.R.; Gu, Y.T. A point interpolation method for two-dimensional solids. Int. J. Numer. Methods Eng. 2001, 50, 937–951. [Google Scholar] [CrossRef]
- Wang, J.G.; Liu, G.R. A point interpolation meshless method based on radial basis functions. Int. J. Numer. Methods Eng. 2002, 54, 1623–1648. [Google Scholar] [CrossRef]
- Idelsohn, S.; Onate, E.; Calvo, N.; Del Pin, F. The meshless finite element method. Int. J. Numer. Methods Eng. 2003, 58, 893–912. [Google Scholar] [CrossRef]
- Belinha, J.; Dinis, L.; Natal Jorge, R. The natural radial element method. Int. J. Numer. Methods Eng. 2013, 93, 1286–1313. [Google Scholar] [CrossRef]
- Dinis, L.; Natal Jorge, R.; Belinha, J. Analysis of 3D solids using the natural neighbour radial point interpolation method. Comput. Methods Appl. Mech. Eng. 2007, 196, 2009–2028. [Google Scholar] [CrossRef]
- Neves, A.; Ferreira, A.; Carrera, E.; Cinefra, M.; Roque, C.; Jorge, R.; Soares, C. Static, free vibration and buckling analysis of isotropic and sandwich functionally graded plates using a quasi-3D higher-order shear deformation theory and a meshless technique. Compos. Part B 2013, 44, 2657–2674. [Google Scholar] [CrossRef]
- Dinis, L.; Natal Jorge, R.; Belinha, J. A 3D shell-like approach using a natural neighbour meshless method: Isotropic and orthotropic thin structures. Compos. Struct. 2010, 92, 1132–1142. [Google Scholar] [CrossRef]
- Dinis, L.; Natal Jorge, R.; Belinha, J. Composite Laminated Plates: A 3D Natural Neighbor Radial Point Interpolation Method Approach. J. Sandw. Struct. Mater. 2010, 12, 119–138. [Google Scholar] [CrossRef]
- Rodrigues, D.; Belinha, J.; Pires, F.; Dinis, L.; Natal Jorge, R. Material homogenization technique for composites: A meshless formulation. Sci. Technol. Mater. 2018, 30, 2603–6363. [Google Scholar] [CrossRef]
- Rodrigues, D.; Belinha, J.; Pires, F.; Dinis, L.; Natal Jorge, R. Homogenization technique for heterogeneous composite materials using meshless methods. Eng. Anal. Bound. Elem. 2018, 92, 73–89. [Google Scholar] [CrossRef]
- Wang, J.; Zhang, L.; Liew, K. A multiscale modeling of CNT-reinforced cement composites. Comput. Methods Appl. Mech. Eng. 2016, 309, 411–433. [Google Scholar] [CrossRef]
- Sah, T.; Lacey, A.; Hao, H.; Chen, W. Prefabricated concrete sandwich and other lightweight wall panels for sustainable building construction: State-of-the-art review. J. Build. Eng. 2024, 89, 109391. [Google Scholar] [CrossRef]
- Tewari, K.; Pandit, M.; Budarapu, P.; Natarajan, S. Analysis of sandwich structures with corrugated and spiderweb-inspired cores for aerospace applications. Thin-Walled Struct. 2022, 180, 109812. [Google Scholar] [CrossRef]
- Pashazadeh, J.; Zakerzadeh, M.; Baghan, M. Nonlinear vibrational response of a deformable sandwich structure for morphing wing applications: Modeling, construction, and experimental tests. Structures 2024, 59, 105717. [Google Scholar] [CrossRef]
- Ren, J.; Zhou, Y.; Qiang, L.; Gao, W.; Meng, H.; Zhao, Z. Enhancing impact resistance of metallic foam core sandwich constructions through encasing high-strength fibrous composites. Thin-Walled Struct. 2024, 196, 111546. [Google Scholar] [CrossRef]
- Acanfora, V.; Sellitto, A.; Russo, A.; Zarrelli, M.; Riccio, A. Experimental investigation on 3D printed lightweight sandwich structures for energy absorption aerospace applications. Aerosp. Sci. Technol. 2023, 137, 108276. [Google Scholar] [CrossRef]
- Vellaisamy, S.; Munusamy, R. Experimental study of 3D printed carbon fibre sandwich structures for lightweight applications. Def. Technol. 2024, 36, 71–77. [Google Scholar] [CrossRef]
- Voronoi, G. Nouvelles applications des parametres continus a la theorie des formes quadratiques. Deuxieme memoire. Recherches sur les parallelloedres primitifs. J. Fur Die Reine Und Angew. Math. 1908, 134, 198–287. [Google Scholar] [CrossRef]
- Hardy, R. Theory and applications of the multiquadric-biharmonic method 20 years of discovery 1968–1988. Comput. Math. Appl. 1990, 19, 163–208. [Google Scholar] [CrossRef]
- Wang, J.G.; Liu, G.R. On the optimal shape parameters of radial basis functions used for 2-D meshless methods. Comput. Methods Appl. Mech. Eng. 2002, 191, 2611–2630. [Google Scholar] [CrossRef]
- Zienkiewicz, O.; Taylor, R. The Finite Element Method, 5th ed.; Butterworth-Heinemann: Oxford, UK, 2000. [Google Scholar]
- Reis, F.; Pires, F. A mortar based approach for the enforcement of periodic boundary conditions on arbitrarily generated meshes. Comput. Methods Appl. Mech. Eng. 2014, 274, 169–191. [Google Scholar] [CrossRef]
- Dhaliwal, G.; Newaz, G. Flexural Response of Degraded Polyurethane Foam Core Sandwich Beam with Initial Crack between Facesheet and Core. Materials 2020, 13, 5399. [Google Scholar] [CrossRef] [PubMed]
- Luo, Y.; Yuan, K.; Shen, L.; Liu, J. Sandwich panel with in-plane honeycombs in different Poisson’s ratio under low to medium impact loads. Rev. Adv. Mater. Sci. 2021, 60, 145–157. [Google Scholar] [CrossRef]
- Birman, V.; Kardomateas, G. Review of current trends in research and applications of sandwich structures. Compos. Part B Eng. 2018, 142, 221–240. [Google Scholar] [CrossRef]
- Florence, A.; Jaswin, M.; Prakash, M.; Jayaram, S. Effect of energy-absorbing materials on the mechanical behaviour of hybrid FRP honeycomb core sandwich composites. Mater. Res. Innov. 2019, 24, 244–255. [Google Scholar] [CrossRef]
Disclaimer/Publisher’s Note: The statements, opinions and data contained in all publications are solely those of the individual author(s) and contributor(s) and not of MDPI and/or the editor(s). MDPI and/or the editor(s) disclaim responsibility for any injury to people or property resulting from any ideas, methods, instructions or products referred to in the content. |
© 2024 by the author. Licensee MDPI, Basel, Switzerland. This article is an open access article distributed under the terms and conditions of the Creative Commons Attribution (CC BY) license (https://creativecommons.org/licenses/by/4.0/).