Article

Turning Waste into Wealth: Optimization of Microwave/Ultrasound-Assisted Extraction for Maximum Recovery of Quercetin and Total Flavonoids from Red Onion (Allium cepa L.) Skin Waste

by
Zeinab Jabbari Velisdeh
1,2,
Ghasem Najafpour Darzi
1,
Fatemeh Poureini
1,
Maedeh Mohammadi
1,
Armin Sedighi
3,
Mohammad Jabed Perves Bappy
4,
Meysam Ebrahimifar
5 and
David K. Mills
2,6,*
1
Biotechnology Research Laboratory, Department of Chemical Engineering, Babol Noshirvani University of Technology, Babol 47148-71167, Iran
2
Molecular Science and Nanotechnology, Louisiana Tech University, Ruston, LA 71272, USA
3
Department of Electrical and Computer Engineering, Wayne State University, Detroit, MI 48202, USA
4
Micro and Nanoscale Systems Engineering, Louisiana Tech University, Ruston, LA 71272, USA
5
Department of Toxicology, Faculty of Pharmacy, Islamic Azad University, Shahreza Branch, Shahreza 14778-93855, Iran
6
School of Biological Sciences, Louisiana Tech University, Ruston, LA 71272, USA
*
Author to whom correspondence should be addressed.
Appl. Sci. 2024, 14(20), 9225; https://doi.org/10.3390/app14209225
Submission received: 15 August 2024 / Revised: 20 September 2024 / Accepted: 29 September 2024 / Published: 11 October 2024

Abstract

:
This study optimized the extraction conditions to maximize the recovery yields of quercetin and total flavonoids from red onion skin waste using sequential microwave/ultrasound-assisted extraction. Five effective factors of quercetin extraction yield were investigated using response surface methodology. The method was successfully performed under optimal 60 s microwave irradiation conditions followed by 15 min sonication at 70 °C with 70% (v/v, water) ethanol with a solvent-to-solid ratio of 30 mL/g. The variance analysis of the model for both quercetin (Y1) and total flavonoid (Y2) recovery from DOS demonstrated that ultrasound temperature (X2) was the most highly significant and influential factor, with a p-value of <0.0001 for both responses. Additionally, three key interaction terms—X1X2, X2X4, and X2X5—were identified as highly significant, further underscoring the critical role of ultrasound temperature in optimizing the extraction process for both quercetin and total flavonoids. The maximum recovery yields of quercetin and total flavonoids from red onion skin were 10.32% and 12.52%, respectively. The predicted values for quercetin (10.05%) and total flavonoids (12.72%) were very close to the experimental results. The recovery yields obtained from different extraction methods under the identical experimental conditions mentioned earlier were ultrasound/microwave-assisted extraction (7.66% quercetin and 10.18% total flavonoids), ultrasound-assisted extraction (5.36% quercetin and 8.34% total flavonoids), and microwave-assisted extraction (5.03% quercetin and 7.91% total flavonoids). The ANOVA confirmed highly significant regression models (p-values < 0.0001), with an insignificant lack of fit (p = 0.0515 for quercetin, p = 0.1276 for total flavonoids), demonstrating the robustness and reliability of the optimization. This study provides valuable insights for improving the extraction of bioactive compounds, which is critical for developing effective cancer treatments and advancing medical research. Additionally, the model shows potential for scaling up food processing applications to recover valuable products from red onion skin waste.

Graphical Abstract

1. Introduction

Quercetin, with the molecular formula C15H10O7 and molecular weight of 302.236 g/mol, is known as a natural flavonoid (polyphenolic group) in various parts of onions (Allium cepa L.). In addition to quercetin’s anti-inflammatory and antibacterial properties [1,2], flavonoids, renowned for their antioxidant properties, showcase a broad spectrum of biological activities and anticancer effects [3,4,5,6,7]. As an industrial waste, onion skin is produced from different food processing plants and culinary services [8]. Although a waste, onion skin contains significant amounts of valuable compounds, including natural flavonoids such as quercetin and kaempferol [9]. Among different varieties of onion, red and yellow have the major flavonoid contents [10]. In addition, studies have shown that the onion’s outer layer (skin) has a higher quercetin content than the inner and middle layers [11].
Several methods exist for retrieving quercetin in the context of addressing cancer. The introduction of a microfluidic device customized for point-of-care applications, particularly focused on acoustic blood cell separation, presents a promising avenue with the capability to improve the precision and effectiveness of anticancer treatments. This innovative approach guarantees the effective isolation of therapeutic agents and cancer cells from blood samples [12,13]. Among the various techniques for quercetin extraction, the integration of this microfluidic device signifies a notable advancement, underscoring the evolving role of quercetin in influencing and advancing strategies for cancer treatment [14]. Conventional solvent extraction methods suffer from deficiencies such as high solvent consumption, long extraction time, and thermal degradation of some sensitive compounds. Hence modern extraction methods have been utilized recently to recover various compounds from plant materials [15]. For the recovery of the flavonoid compounds like quercetin from onion skin, various extraction techniques such as subcritical fluid extraction (SFE) [16], conventional solvent extraction [17], microwave-assisted extraction (MAE), and ultrasound-assisted extraction (UAE) [18] have been employed. However, the reported extraction yield of flavonoids using SFE and MAE is relatively low [16,18]. Among the advanced extraction methods, UAE and MAE have always proved to be efficient and eco-friendly methods due to their short extraction time and low solvent consumption for the recovery of flavonoids [19,20]. In addition to these modern techniques, traditional methods such as maceration (MAC) and Soxhlet extraction (SOX) are commonly used, although they often involve longer extraction times and higher energy consumption. MAC is a passive, solvent-based process, while SOX provides better yields but requires continuous heating, making them less efficient compared to newer techniques like UAE and MAE [15,16,17].
Ultrasound-assisted extraction employs ultrasonic waves to disrupt the cell wall by creating cavitation bubbles. These bubbles grow and explode, which facilitates the process of solvent diffusion into the plant cell and enhances the extraction of the targeted compound [21,22]. An advanced method is needed to extract flavonoids rapidly and effectively from onion skin wastes. While the combination of MAE and UAE as a sequential technique is one of the most efficient and speedy extraction methods [23], to the best of our knowledge, no previous studies have been conducted on the use of sequential microwave/ultrasound-assisted extraction (MUAE) for the recovery of quercetin from onion skin. To date, several research studies have reported the extraction of valuable products from plant materials using UAE and MAE as a sequential technique such as sage by-products for antioxidant recovery [24], flavones from Vaccinium bracteatum Thunb. leaves [25], natural colorants from sorghum husk [26], and Piperine from Black Pepper [27]. Microwave-assisted extraction, as an eco-friendly, effective, and green extraction technique, uses electromagnetic energy and direct heating to evaporate volatile compounds in the plant sample, which causes cell deformation and allows the solvent to penetrate the cell wall, thus preparing the cell for the subsequent extraction process [28]. Exposure of these inflamed cells immediately after MAE to UAE can destroy the cell wall and thus extract the desired compounds with higher yield and efficiency. We hypothesized that combining MAE and UAE could shorten the extraction time and reduce the possibility of the decomposition of flavonoid structure, hence enhancing both the stability and recovery yield of the extracted compounds. Therefore, MAE can be considered a practical pre-treatment step before the primary treatment (UAE) for the recovery process [29]. However, prolonged exposure to microwave irradiation and ultrasonic waves can destroy flavonoids, but an optimized exposure time can dramatically increase the extraction yield.
The present study aimed to enhance the recovery yields of quercetin and total flavonoid from red onion skin by optimizing the extraction condition and investigating the influential extraction factors. For this, the effects of different factors of each method, such as solvent type, solvent concentration, solvent-to-solid ratio, microwave power, microwave irradiation time, ultrasound power, ultrasound time, ultrasound temperature, ultrasound frequency, and particle size, on the extraction yield were investigated. Various experiments were performed for two sets: single-factor design and the response surface methodology (RSM). RSM is a statistical and mathematical tool that explains the interaction between significant factors and their effects on the extraction process [30,31]. Furthermore, the Box–Behnken design (BBD) was applied to define the extraction conditions. To validate the results and the proposed method, the recovery yields of quercetin and total flavonoids extracted using MUAE, UMAE, UAE, MAE, and the traditional extraction method were compared to evaluate their efficacy.

2. Materials and Methods

2.1. Raw Materials and Solvents

Red onion skins were obtained from a local grocery market (Amol, Iran). The collected skins were washed with cold distilled water and subsequently dried at 60 °C for 15 min. The ash and moisture contents of the skins (g/100 g, dried at 130 °C) were 8.7 ± 0.84 and 8.9 ± 0.42%, respectively. The dried onion skins (DOSs) were ground using an electric grinder and sieved through mesh no. 50 to 140 (100–600 µm) using standard sieves, then stored in glass jars and kept in a cold room (−4 °C) for further use. Chemicals such as potassium acetate (>99%), aluminum chloride (>95%), quercetin (>95%) (Figure 1), isorhamnetin (>95%), and kaempferol (>97%) standards were purchased from Sigma-Aldrich (St. Louis, Mo, USA). Solvents such as ethanol, acetone, water, and ethyl acetate (>99.9%) were obtained from Scharlau (Barcelona, Spain). HPLC-grade methanol, orthophosphoric acid, and water were purchased from Merck (Darmstadt, Germany).

2.2. Sequential Microwave/Ultrasound-Assisted Extraction

For the extraction process, a commercial microwave oven (Samsung, CQ4250, Seoul, Republic of Korea) with a frequency of 2.45 GHz and maximum input power of 1150 W was used. One gram of DOS was thoroughly mixed with a specific amount of the desired solvent in an Erlenmeyer flask. To prevent any possible thermal degradation of the sample and the loss of solvent during MAE, an intermittent heating-cooling process was used where after 10 s of irradiation, the flask was placed in an ice-bath and cooled down.
This intermittent heating/cooling process was continued until the specified extraction time was passed. A digital temperature controller (Autonics, TCN4L-24R, Busan, Republic of Korea) was used to specify the actual temperature of the sample during the experiment. Then, the flask was closed with a rubber stopper and immersed in an ultrasonic bath (Elmasonic, P30H, Singen, Germany) and sonicated. For efficient sonication, the level of water in the bath was always above the level of solvent in the immersed flask. To prevent the excessive heating of the sample during the UAE process, the sample was cooled by adding ice cubes into the water bath, and the temperature was continuously monitored during the process. The manufacturer rated the apparatus with a peak power and effective power rating of 480 and 120 W, respectively; it had a proprietary algorithm for power adjusting based on system impedance. At a fixed bath volume (1.4 L) for 50, 60, 70, 80, 90, and 100% power settings, the peak powers were 171, 206, 240, 274, 309, and 343 W/cm2, respectively, and the ultrasonic effective powers were 42, 51, 60, 69, 77, and 86 W/cm2, respectively.
After sonication, the sample was filtered through a Whatman filter paper (0.45 µm). The sample was dried in an oven at 60 °C for 12 h till all the solvent evaporated. The dried sample was dissolved in 1 mL of methanol and placed in a microtube and centrifuged by a microcentrifuge (Labnet, C1301-P, Seoul, Republic of Korea) at 6000 rpm for 5 min. The samples were then analyzed to identify quercetin and total flavonoids concentration using a high-performance liquid chromatograph (HPLC). The optimal points at which the highest extraction yield was obtained were determined for the sequential extraction method (MUAE). The results were compared with those obtained by ultrasound-microwave-assisted extraction (UMAE) and the single extraction methods (MAE and UAE). The amounts of quercetin and total flavonoid content (TFC) were calculated based on a standard calibration curve developed using different concentrations of quercetin (1 to 100 mg/L) in methanol.
The extraction yields were calculated with Equation (1):
Y i e l d % = W e i g h t   o f   e x t r a c t e d   q u e r c e t i n   o r   t o t a l   f l a v e n o i d   ( m g )   W e i g h t   o f   D O S   ( g ) × 100

2.3. Total Flavonoid Content (TFC)

The total flavonoid content of the onion skin extract was determined according to the colorimetric method [32]. For this, 0.5 mL of extract solution was mixed with 1.5 mL of methanol, followed by the addition of 0.1 mL (10%) aluminum chloride, 0.1 mL potassium acetate (1 M), and 2.8 mL distilled water. Then, the mixture was incubated at room temperature for 30 min. The absorbance of the sample was recorded at 370 nm using a spectrophotometer (Analytik Jena AG, SPEKOL 1500, Jena, Germany). TFC was determined according to the standard calibration curve of quercetin and expressed as quercetin equivalents (mg QE/g DOS). Furthermore, for the analysis of quercetin, the absorbance of the extracted sample was read at a wavelength of 370 nm. All experiments were performed in triplicates.

2.4. High-Performance Liquid Chromatography (HPLC)

HPLC (Smartline, Knauer, Germany) equipped with a Eurospher I 100-5 C18 (KNAUER, Berlin, Germany) column with dimensions of 250 × 4.6 mm and UV detector 2500 series was used. The column temperature was 30 °C. The detector was set to scan from 200 to 600 nm to monitor the retention time of flavonoids, and the two wavelengths for detecting target compounds were 295 and 365 nm. The injection volume was 20 μL, and the mobile phases were 0.5% orthophosphoric acid in water (solvent A) and methanol (solvent B) with a solvent gradient elution program: 40 to 60% solvent B from 0 to 10 min, 60% B from 10 to 21 min, 60 to 40% B from 21 to 23 min, 40% B from 23 to 26 min, and then held at 40% solvent B until the end of the run at 30 min for column equilibration [33]. The elution flow rate was 1.0 mL/min.

2.5. Experimental Design for RSM

In order to optimize the MUAE process, RSM as an optimization method was employed to determine the optimum conditions for the maximum recovery yield of quercetin and total flavonoids from red onion skin waste using the Box–Behnken design (BBD). The main factors for RSM design were selected based on the most effective factors on the results obtained from the single-factor experiments. The five effective variables on the extraction, namely ultrasound time (min, X1), ultrasound temperature (°C, X2), solvent-to-solid ratio (mL/g, X3) microwave time (s, X4), and ethanol concentration (% (v/v, water), X5) are summarized in Table 1 at three levels (−1, 0, +1), with X1 (15, 30, and 45 min), X2 (60, 70, and 80 °C), X3 (20, 30, and 40 mL/g), and X4 (30, 60, and 90 s), and X5 (50, 60, and 70%). In general, 46 experimental runs (in triplicates) were carried out. The dependent variables (responses) were quercetin (Y1) and total flavonoid (Y2) yields.
The design conditions and results of the 46 experimental runs to optimize quercetin and total flavonoid extraction conditions are summarized in Table 2. According to the variance analysis of the regression model, a p-value less than 0.05 indicates the significance of terms and a p-value less than 0.0001 indicates the high significance of the regression model terms. Moreover, p-values greater than 0.10 indicate that the model terms are insignificant. The regression analysis of the extraction responses was fitted using a second-order polynomial equation as expressed in Equation (2):
Y n = β 0 + i = 1 k β i x i   +   i = 1 k β i i   x i 2   + i k 1 j k β i j   x i   x j    
where Yn represents the extraction responses, β0 is the intercept, βi denotes the coefficient of the linear, βii is the quadratic term, βij represents the cross-product term, xi and xj denote the independent variables, and k is the number of variables (k = 5).

2.6. Statistical Analysis

The statistical analyses of data obtained from one-factor experiments were performed by one-way analysis of variance (ANOVA) and Tukey’s test. Each experiment was carried out in triplicate, and the results were expressed as the mean values ± SD. Optimization and modeling of RSM for the recovery process were performed using the software Design-Expert (Version 7.0.0, Stat-Ease Inc., Minneapolis, MI, USA). The significance of independent factors was specified using analysis of variance (ANOVA).

3. Results and Discussion

3.1. Effect of MUAE Parameters on the Recovery Yield of Quercetin from DOS

The analysis of variance (ANOVA) of response 1 (Y1) is summed up in Table 3. The model p-value of <0.0001 indicates the high significance of the regression model. The lack of fit result was insignificant with the p-value of 0.0515, which implies a significant fitting of the regression model with the data. The model terms of X1X2, X22, X32 and X52 were highly significant (p < 0.0001). The terms X1X4, X1X5, X2X4, X2X5, X12, X42 were significant (p < 0.05). The other terms were insignificant (p > 0.10). The variance analysis of the model indicated the ultrasound temperature, which had three terms with significant interactions (X1X2, X2X4, and X2X5), and ultrasound time with three significant interaction terms (X1X2, X1X4, and X1X5) followed by ethanol concentration with two significant interaction terms (X1X5 and X2X5) were the most highly significant terms for recovery of quercetin from DOS. The quadratic equation relating the time and temperature of ultrasound, solvent-to-solid ratio, microwave time, and ethanol concentration is shown in Equation (3):
Y1 = 8.41 − 0.99X1 − 0.65X2 + 0.42X5 + 0.39X1X2 + 0.16X1X4 − 0.17X1X5 − 0.25X2X4 − 0.24X2X5 + 0.11X12 − 0.79X22 + 0.32X32 + 0.14X42 + 0.31X52
where Y1 is the yield of quercetin, and X1, X2, X3, X4, and X5 are the coded variables for ultrasound time, ultrasound temperature, solvent-to-solid ratio, microwave time, and ethanol concentration, respectively.
The correlation coefficient R for the statistical relationship between actual and predicted points was measured. The R for response 1, with an absolute value of 98.55%, indicates a very strong relationship, and the adjusted R2 of 97.40% for Y1 indicates a strong influence of experimental factors. Also, for Y1, the predicted R2 of 94.41% is in reasonable agreement with the adjusted R2.
The quercetin yield for all 46 extraction tests was between 6.51 and 10.32%. The maximum extraction yield (10.32%) was achieved at the conditions of run number 28, with an ultrasound time of 15 min, an ultrasound temperature of 70 °C, a solvent-to-solid ratio of 30 mL/g, a microwave time of 60 s, and an ethanol concentration of 70% (v/v, water). In addition, the minimum extraction yield of quercetin from the MUAE method (6.51%) was obtained from run number 17.

3.2. Effect of MUAE Parameters on the Recovery Yield of Total Flavonoids from DOS

The ANOVA of response 2 (Y2) is summed up in Table 4. The model p-value of <0.0001 implies the high significance of the regression model. An insignificant result in the lack of fit with a p-value of 0.1276 indicated the model fitted the data very well. In this case, the model terms of X1, X2, X5, X1X2, X22, X32 and X52 were highly significant (p < 0.0001). The terms of X1X4, X2X4, X2X5, X12 were significant (p < 0.05). The other terms were insignificant (p > 0.10). For recovery of total flavonoids from DOS, the variance analysis of the model based on Table 2 suggested ultrasound temperature with three important interaction terms (X1X2, X2X4, and X2X5) and the ultrasound time with two terms of interactions (X1X2, X1X4) followed by ethanol concentration with one interaction term (X2X5) were the most highly significant terms. The quadratic equation relating time and temperature of ultrasound, solvent-to-solid ratio, microwave time, and ethanol concentration is shown in Equation (4):
Y2 = 10.42 − 1.02X1 − 0.68X2 + 0.36X5 + 0.64X1X2 + 0.19X1X4 − 0.23X2X4 − 0.26X2X5 + 0.17X12 − 0.58X22 + 0.27X32 + 0.30X52
where Y2 is the yield of total flavonoids and X1, X2, X3, X4, and X5 are the coded variables for ultrasound time, ultrasound temperature, solvent-to-solid ratio, microwave time, and ethanol concentration, respectively.
For the second response (Y2), the correlation coefficient R2 and adjusted R2 of the model were evaluated. R2 with a value of 0.9812 indicates a good prediction for the response model and the adjusted R2 with a value of 0.9661 also represents a significant adjustment for the model. The R2 and adjusted R2 indicate a close relationship between the predicted and actual values. Also, in this case, for Y2, the predicted R2 of 0.9287 reasonably agrees with the adjusted R2.
The total flavonoid yield for all 46 extraction tests was in the range of 8.84–12.52%. The highest extraction yield for total flavonoids (12.52%) was achieved at the conditions of run number 1, with ultrasound time of 15 min, ultrasound temperature of 60 °C, solvent-to-solid ratio of 30 mL/g, microwave time of 60 s, and ethanol concentration of 60% (v/v, water). In addition, the minimum yield of total flavonoids from MUAE (8.84%) was achieved in run number 17.

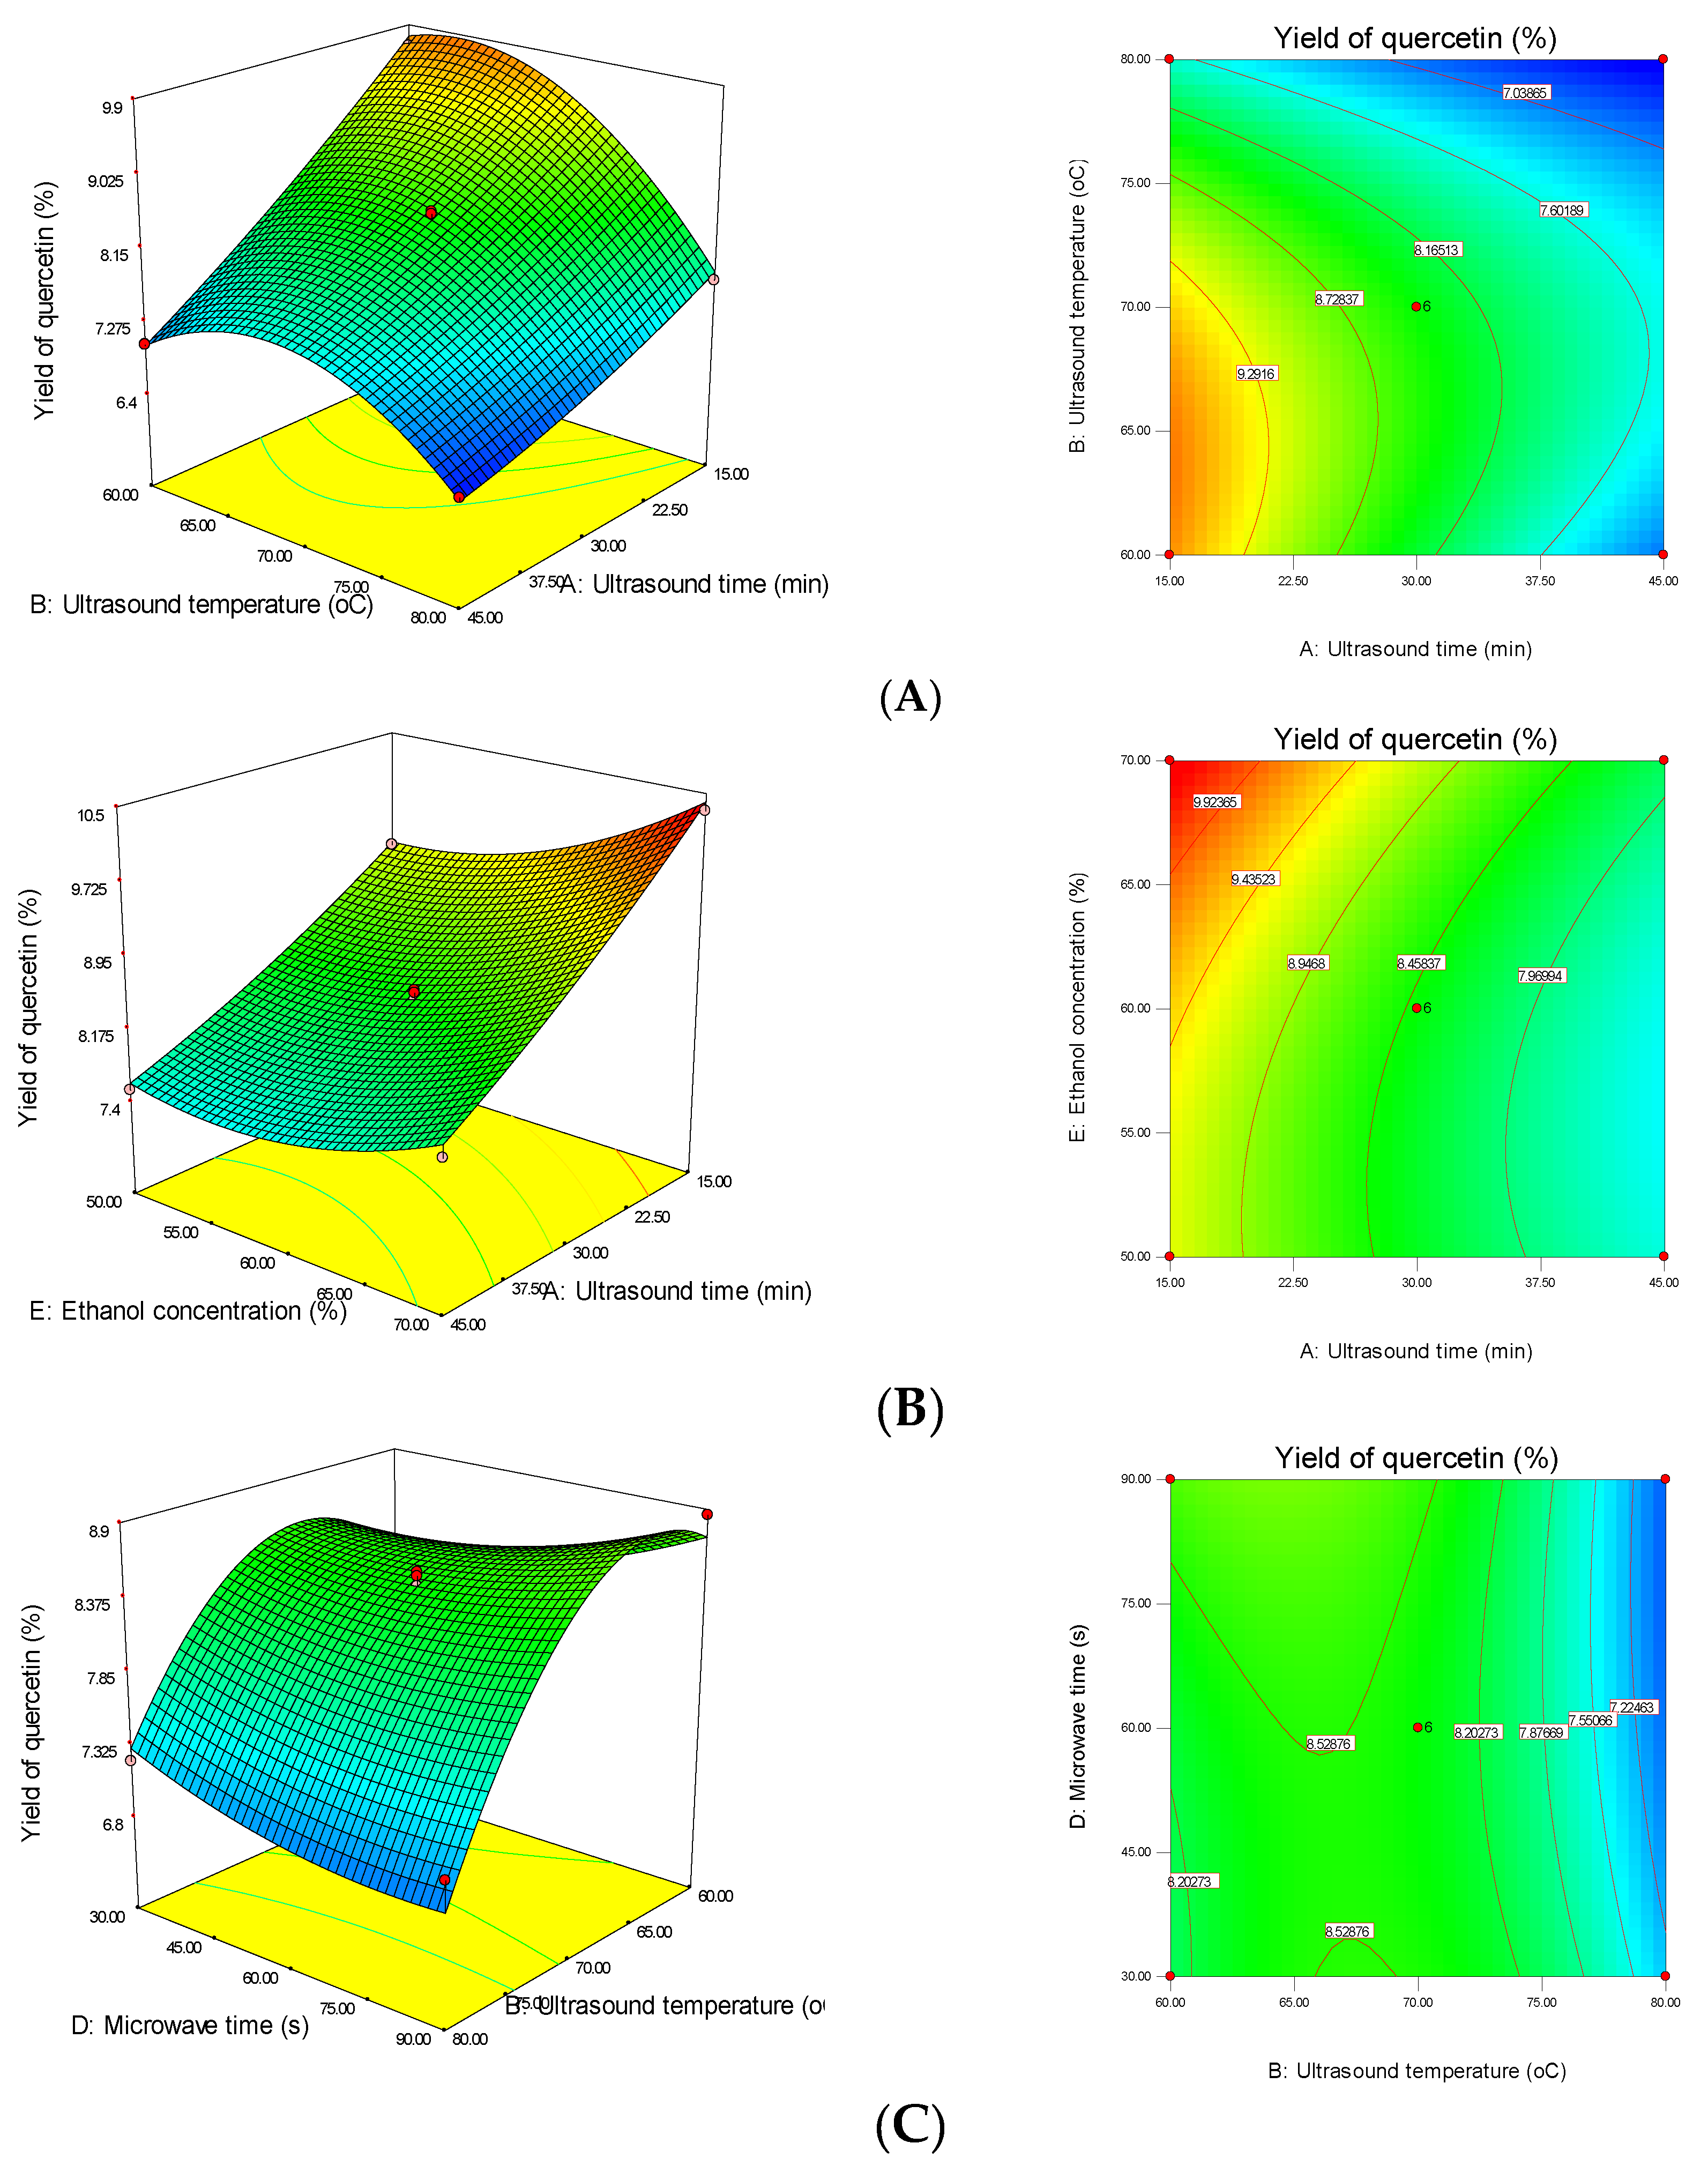
3.3. Interactions between MUAE Factors of Response Surface

The three-dimensional response surfaces and contour plots for quercetin extraction demonstrate the effects and interactions between the extraction factors (Figure 2A–D). The surface showed an interaction between ultrasound temperature and ultrasound time. It indicated that the extraction yield of quercetin decreased when both ultrasound temperature and time were increased simultaneously (Figure 2A). It is speculated that increasing the ultrasonication time may lead to continuous product release, causing the extraction solvent to become saturated with the extracted products [34]. In addition, an increase in the temperature can accelerate the process of solvent evaporation. It can reduce the contact surface between the solvent and the solid, thereby decreasing the extraction yield of quercetin.
Figure 2B examines the interactions between the two parameters of ethanol concentration and ultrasound time. Considering the ethanol concentration at an ultrasound time of 5 min, increasing the ethanol concentration increased the yield of quercetin extraction. However, in general, the simultaneous decrease in both parameters indicated an increase in the maximum value of extraction yield. The possible reason is reducing evaporation by decreasing temperature and adding water as a co-solvent, which may increase the swelling degree of the onion skins in the solvent medium and enhance the contact surface between the solvent and the solid [35]. Hence, it can raise the yield.
The response surface in Figure 2C shows an effective interaction between microwave time and ultrasound temperature. Nevertheless, microwave time alone did not significantly affect the quercetin extraction yield. At an ultrasound temperature of 60 °C, decreasing the microwave time led to a reduction in extraction yield. This is likely due to insufficient microwave energy being applied to break down the cell walls of the onion skin, limiting the release of quercetin into the solvent. However, at an ultrasound temperature of 80 °C, reducing the microwave time improved the extraction yield. At higher temperatures, prolonged microwave exposure may lead to thermal degradation of bioactive compounds like quercetin, reducing the yield. The reduction in contact between the solvent and the solid sample, along with an increase in the concentration of solid load due to solvent evaporation, can also contribute to decreased yield. Additionally, excessive microwave energy at higher temperatures may destroy or alter the structure of bioactive compounds, further lowering the extraction yield [36].
The slope of the response surface in the 3-D graph (Figure 2D) analyzes the effects of ethanol concentration and ultrasound temperature on quercetin extraction yield. In the temperature range of 60–80 °C, a decrease in ethanol concentration (50–70% v/v, water) at higher temperatures, such as 80 °C, led to a reduction in extraction yield. However, at lower temperatures (closer to 60 °C), increasing the ethanol concentration improved the extraction yield. This effect occurs because, at higher temperatures, the structure of bioactive compounds may degrade, while at lower temperatures, increasing the ethanol concentration enhances the solvent’s ability to dissolve and interact with these compounds, thus improving the extraction yield. In general, reducing the ultrasound temperature while increasing ethanol concentration improves the extraction yield. At higher temperatures, the structure of bioactive compounds and flavonoids may be decomposed, leading to a lower extraction yield [37].
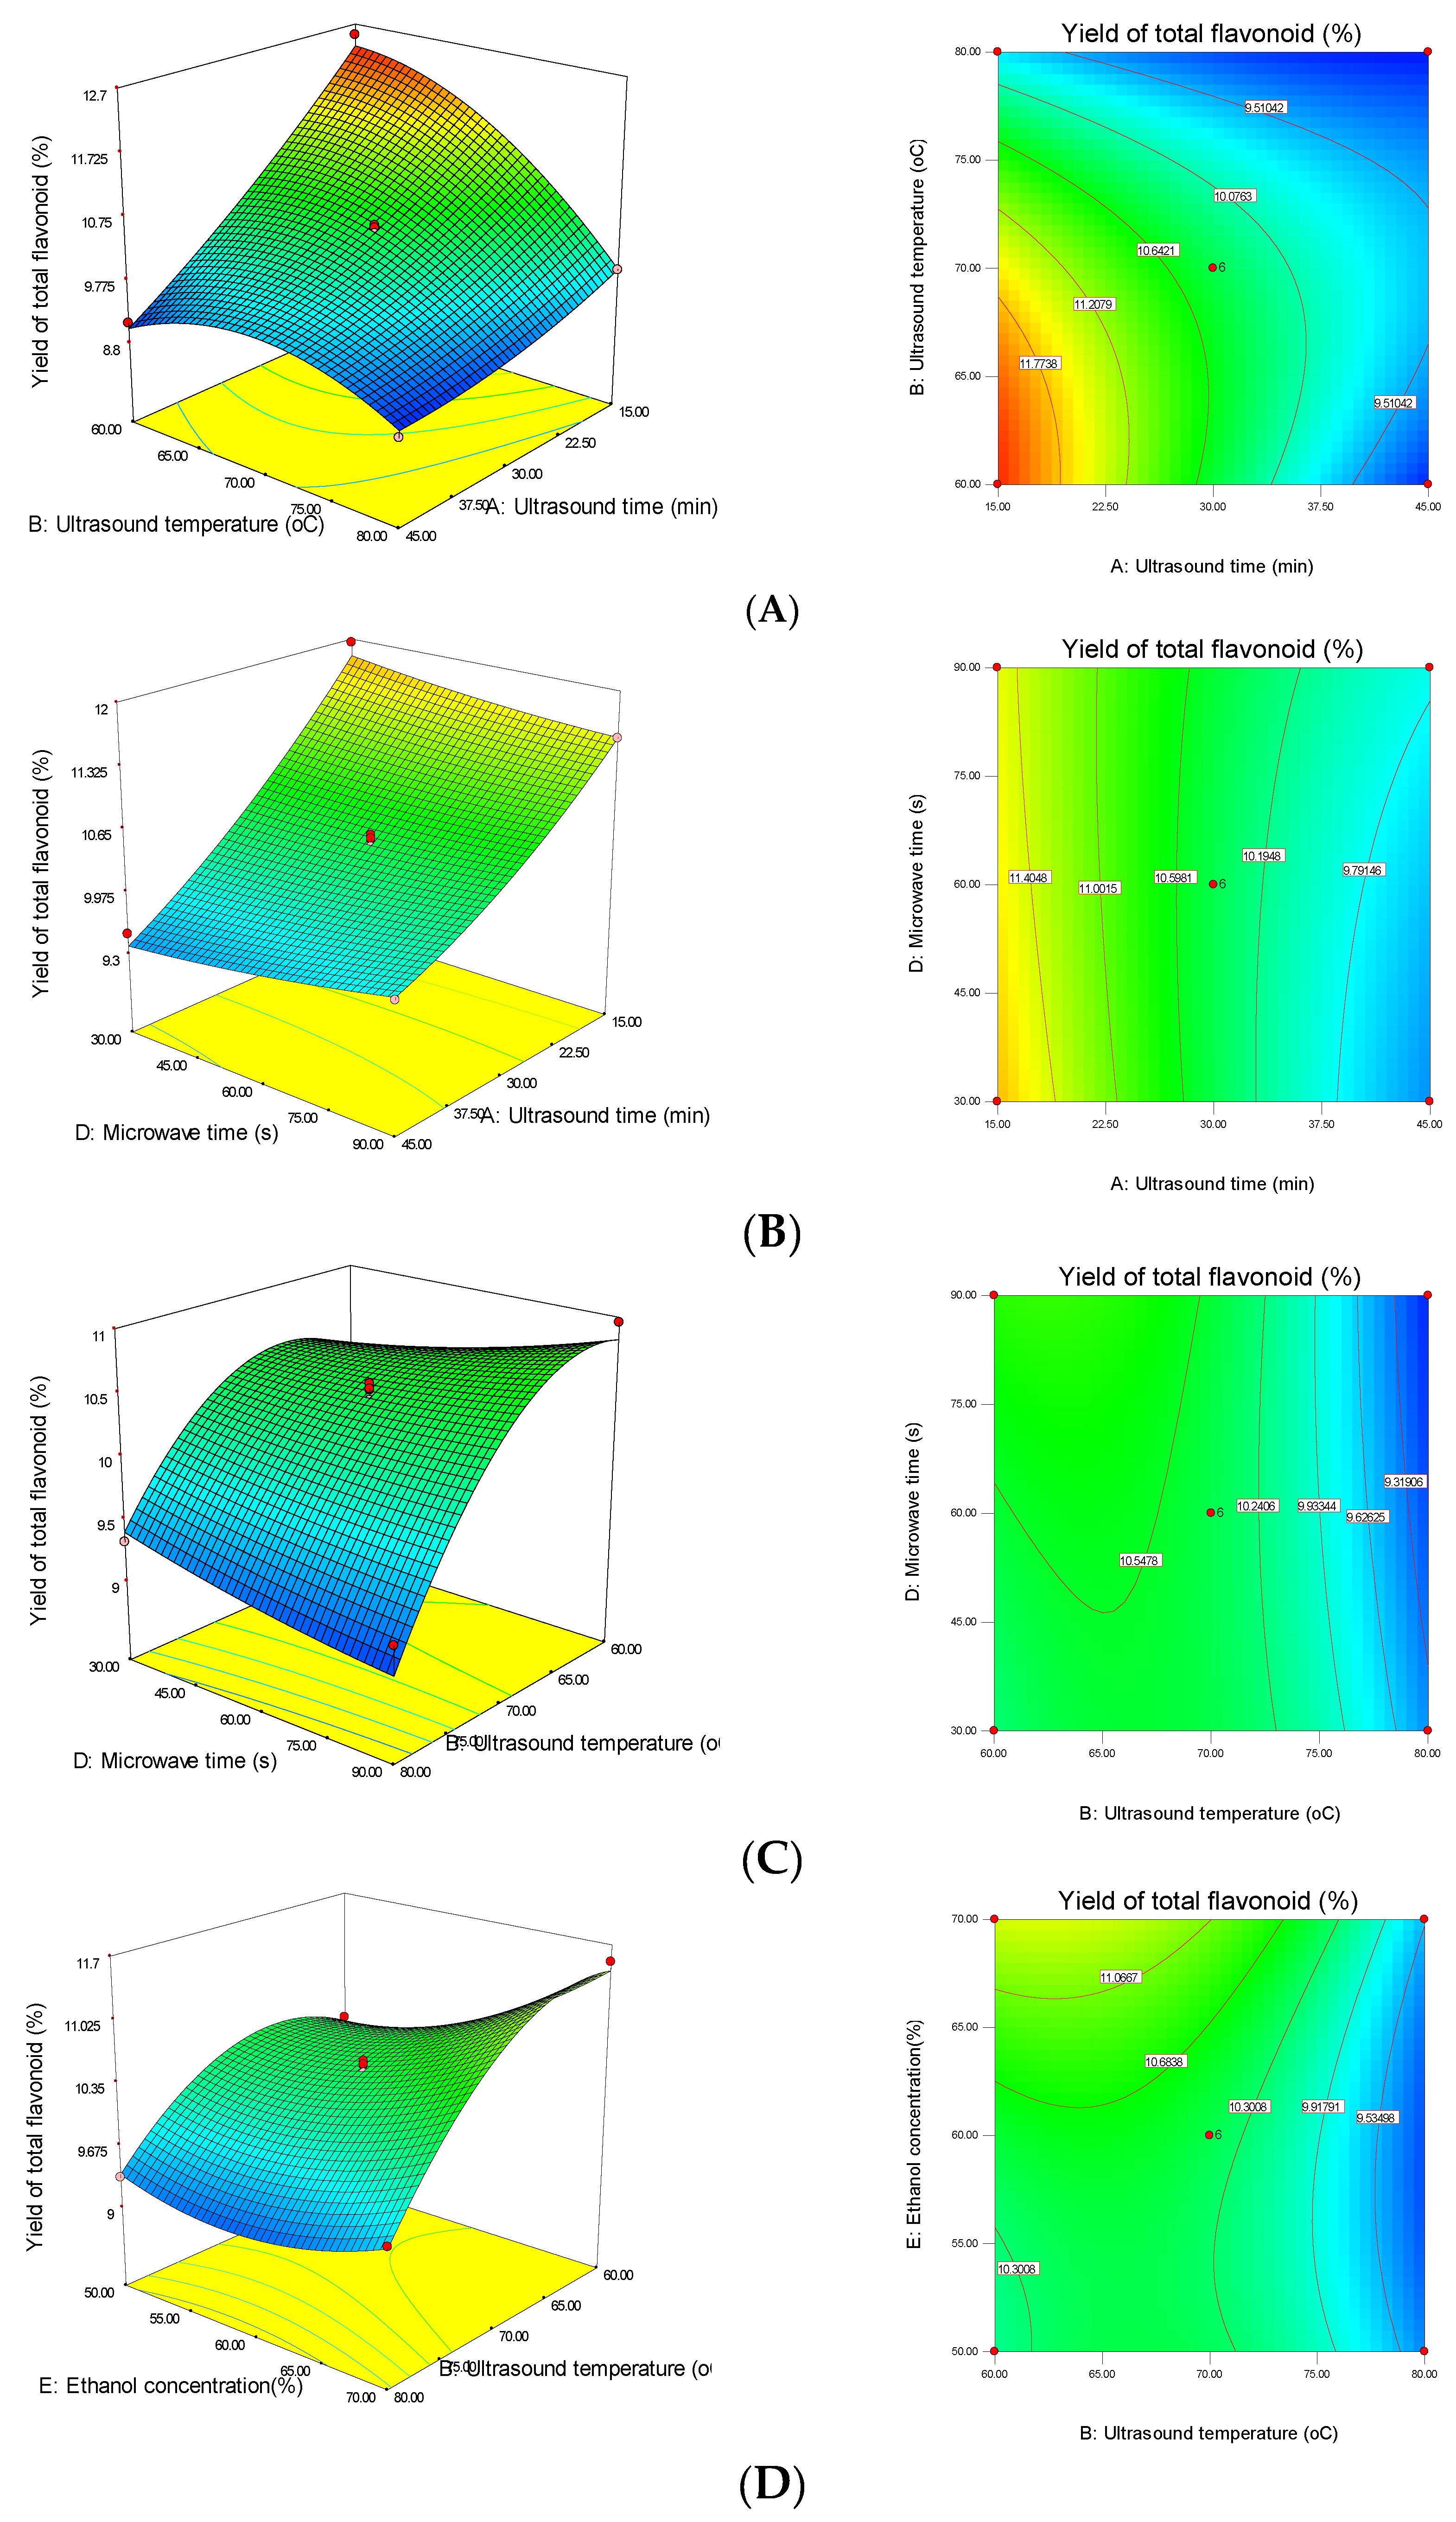
The response surfaces and contour plots for total flavonoid extraction show the interaction of extraction factors (Figure 3A–D). The response surface in Figure 3A indicates the interaction between the ultrasound temperature and the ultrasound time. The rate of flavonoid extraction decreased as the two factors increased simultaneously. In addition, it shows the maximum value of extraction yield for total flavonoids increased at low temperatures, but at temperatures above 70 °C the yield decreased. The explanation for this observation is that high extraction temperatures may degrade the structure of flavonoids during the experiment [38].
In the 3-D graph considering the microwave time (Figure 3B), it is observed that increasing the microwave time led to an enhancement in the extraction yield when the ultrasound time was at its maximum value of 45 min. However, in general, the maximum value of the total flavonoid extraction yield was reduced with an increase in microwave time. This is because of the long time exposure to microwave irradiation, and immediately after that, exposure to ultrasonic waves can destroy the sensitive compounds in the sample [39]. Also, reducing the extraction time to the optimum value and achieving a desirable fit between the two extraction times can increase the response surface of the total flavonoid extraction yield.
The response surface, which exhibits the interaction between microwave time and ultrasound temperature on the yield of total flavonoid extraction, is depicted in Figure 3C. It indicates that the maximum yield occurs at high microwave time and low ultrasound temperature. However, by raising the temperature to 80 °C, the increase in the microwave time resulted in a decrease in the extraction yield. Even though increasing the temperature enhances the mass transfer and recovery yield, using high ultrasound temperature can cause a lower rate of cavitation bubbles and weak collapses due to the solvent vapors created in the blank environment [40].
The slope of the response surface in Figure 3D shows that the maximum total flavonoid yield coincides with an enhancement in the ethanol concentration and a decrease in the ultrasound temperature. It is also observed that at very high temperatures, as the ethanol concentration increases, the recovery yield also increases. Hence, it indicates a significant interaction of these two parameters on the response surface in total flavonoid extraction.

3.4. Validation of the Model and the MUAE Efficiency

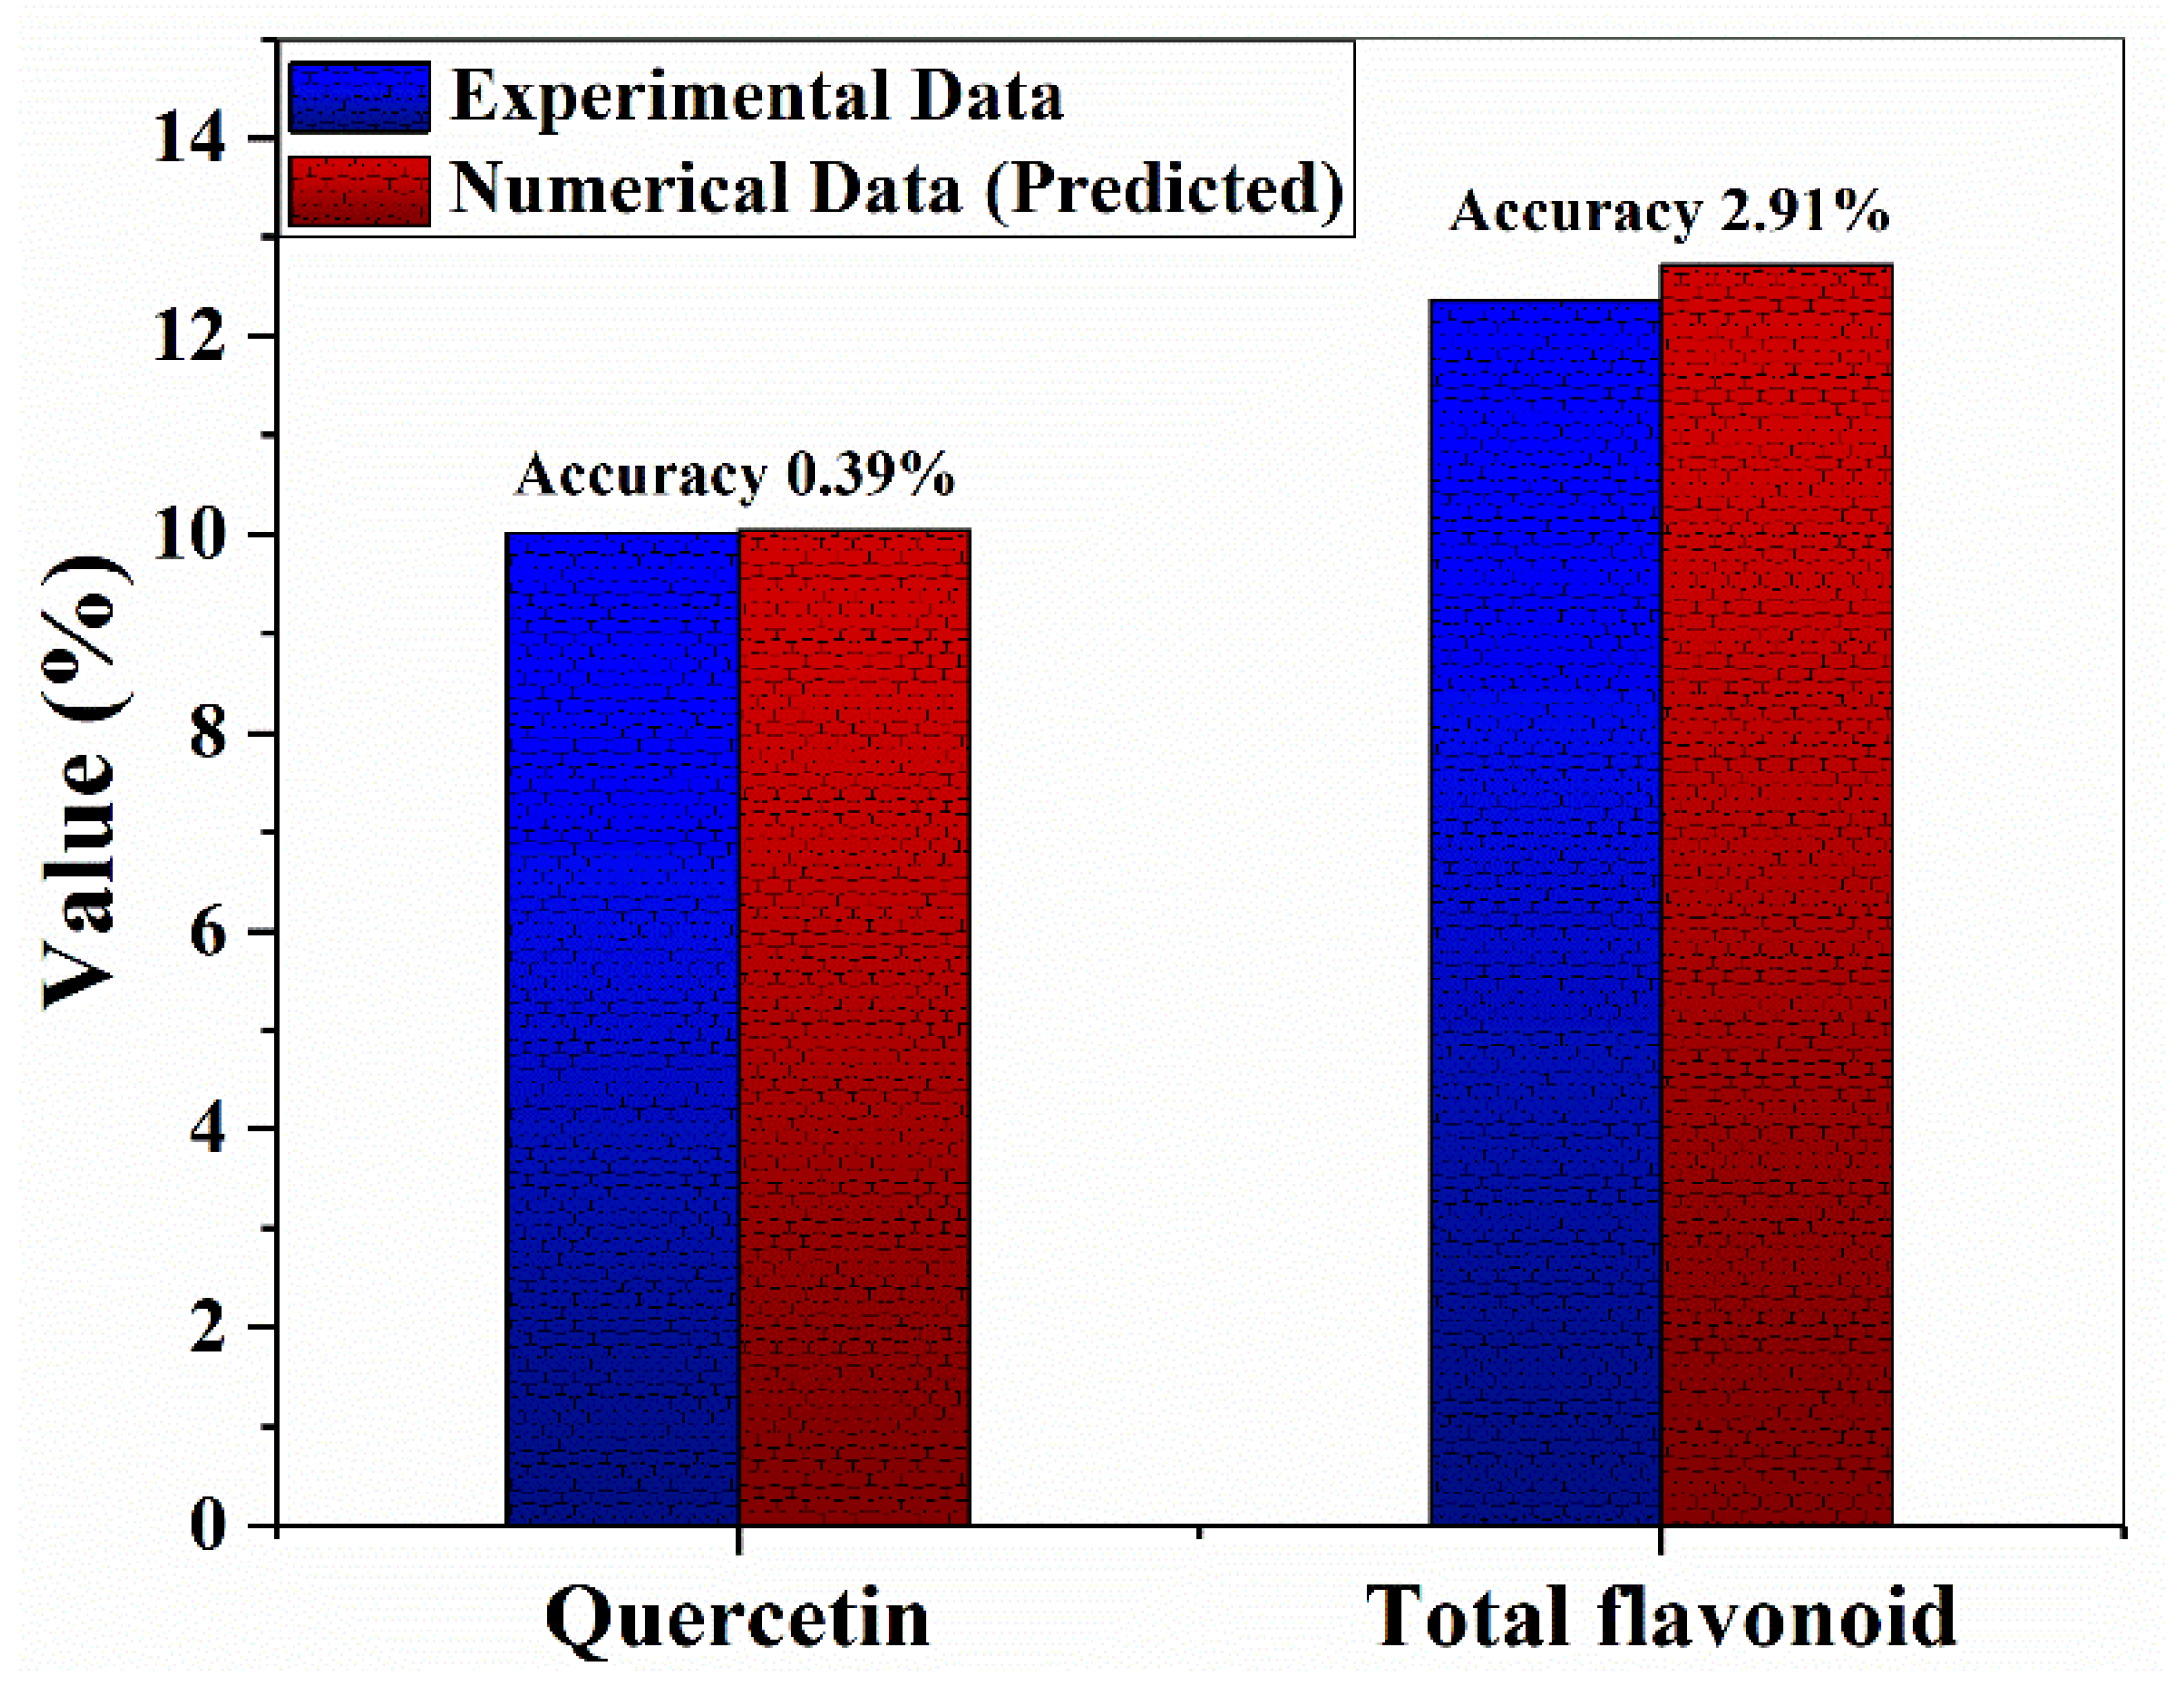
The maximum extraction yield of quercetin at the predicted conditions (10.85%) was achieved at an ultrasound time of 15.49 min, ultrasound temperature of 67.31 °C, solvent-to-solid ratio of 20.33 mL/g, microwave time of 46.83 s, and ethanol concentration of 69.34% (v/v, water). The predicted condition for the extraction of total flavonoids at an ultrasound time of 16.45 min, ultrasound temperature of 64.86 °C, solvent-to-solid ratio of 28.00 mL/g, microwave time of 38.34 s, and ethanol concentration of 69.50% (v/v, water) provided the maximum extraction yield of 12.90%. To verify the validity of the model, the specific conditions for the maximum responses were predicted using response surfaces with numerical optimization as follows: ultrasound time 15.02 min, ultrasound temperature 61.56 °C, solvent-to-solid ratio 39.87 mL/g, microwave time 40.57 s and ethanol concentration 62.43% (v/v, water). The extraction factors were adjusted to be 15.00 min, 60 °C, 40 mL/g, 40 s, and 60% to consider practical limitations and convenient operation. The predicted values for recovery yields were 10.05% for quercetin and 12.72% for total flavonoids. These predicted points were very close to the experimental results for Y1 (10.01%) and Y2 (12.36%), with relative percent deviations of 0.39 and 2.91%, respectively (Figure 4). This strong correlation signifies the suitability of the model to predict the responses at optimal conditions. This study suggests these accurate models and optimal conditions could be significantly helpful for further scale-up of the MUAE process for quercetin and total flavonoid extraction from red onion skin.

3.5. Comparison of the Utilized Extraction Methods in This Study

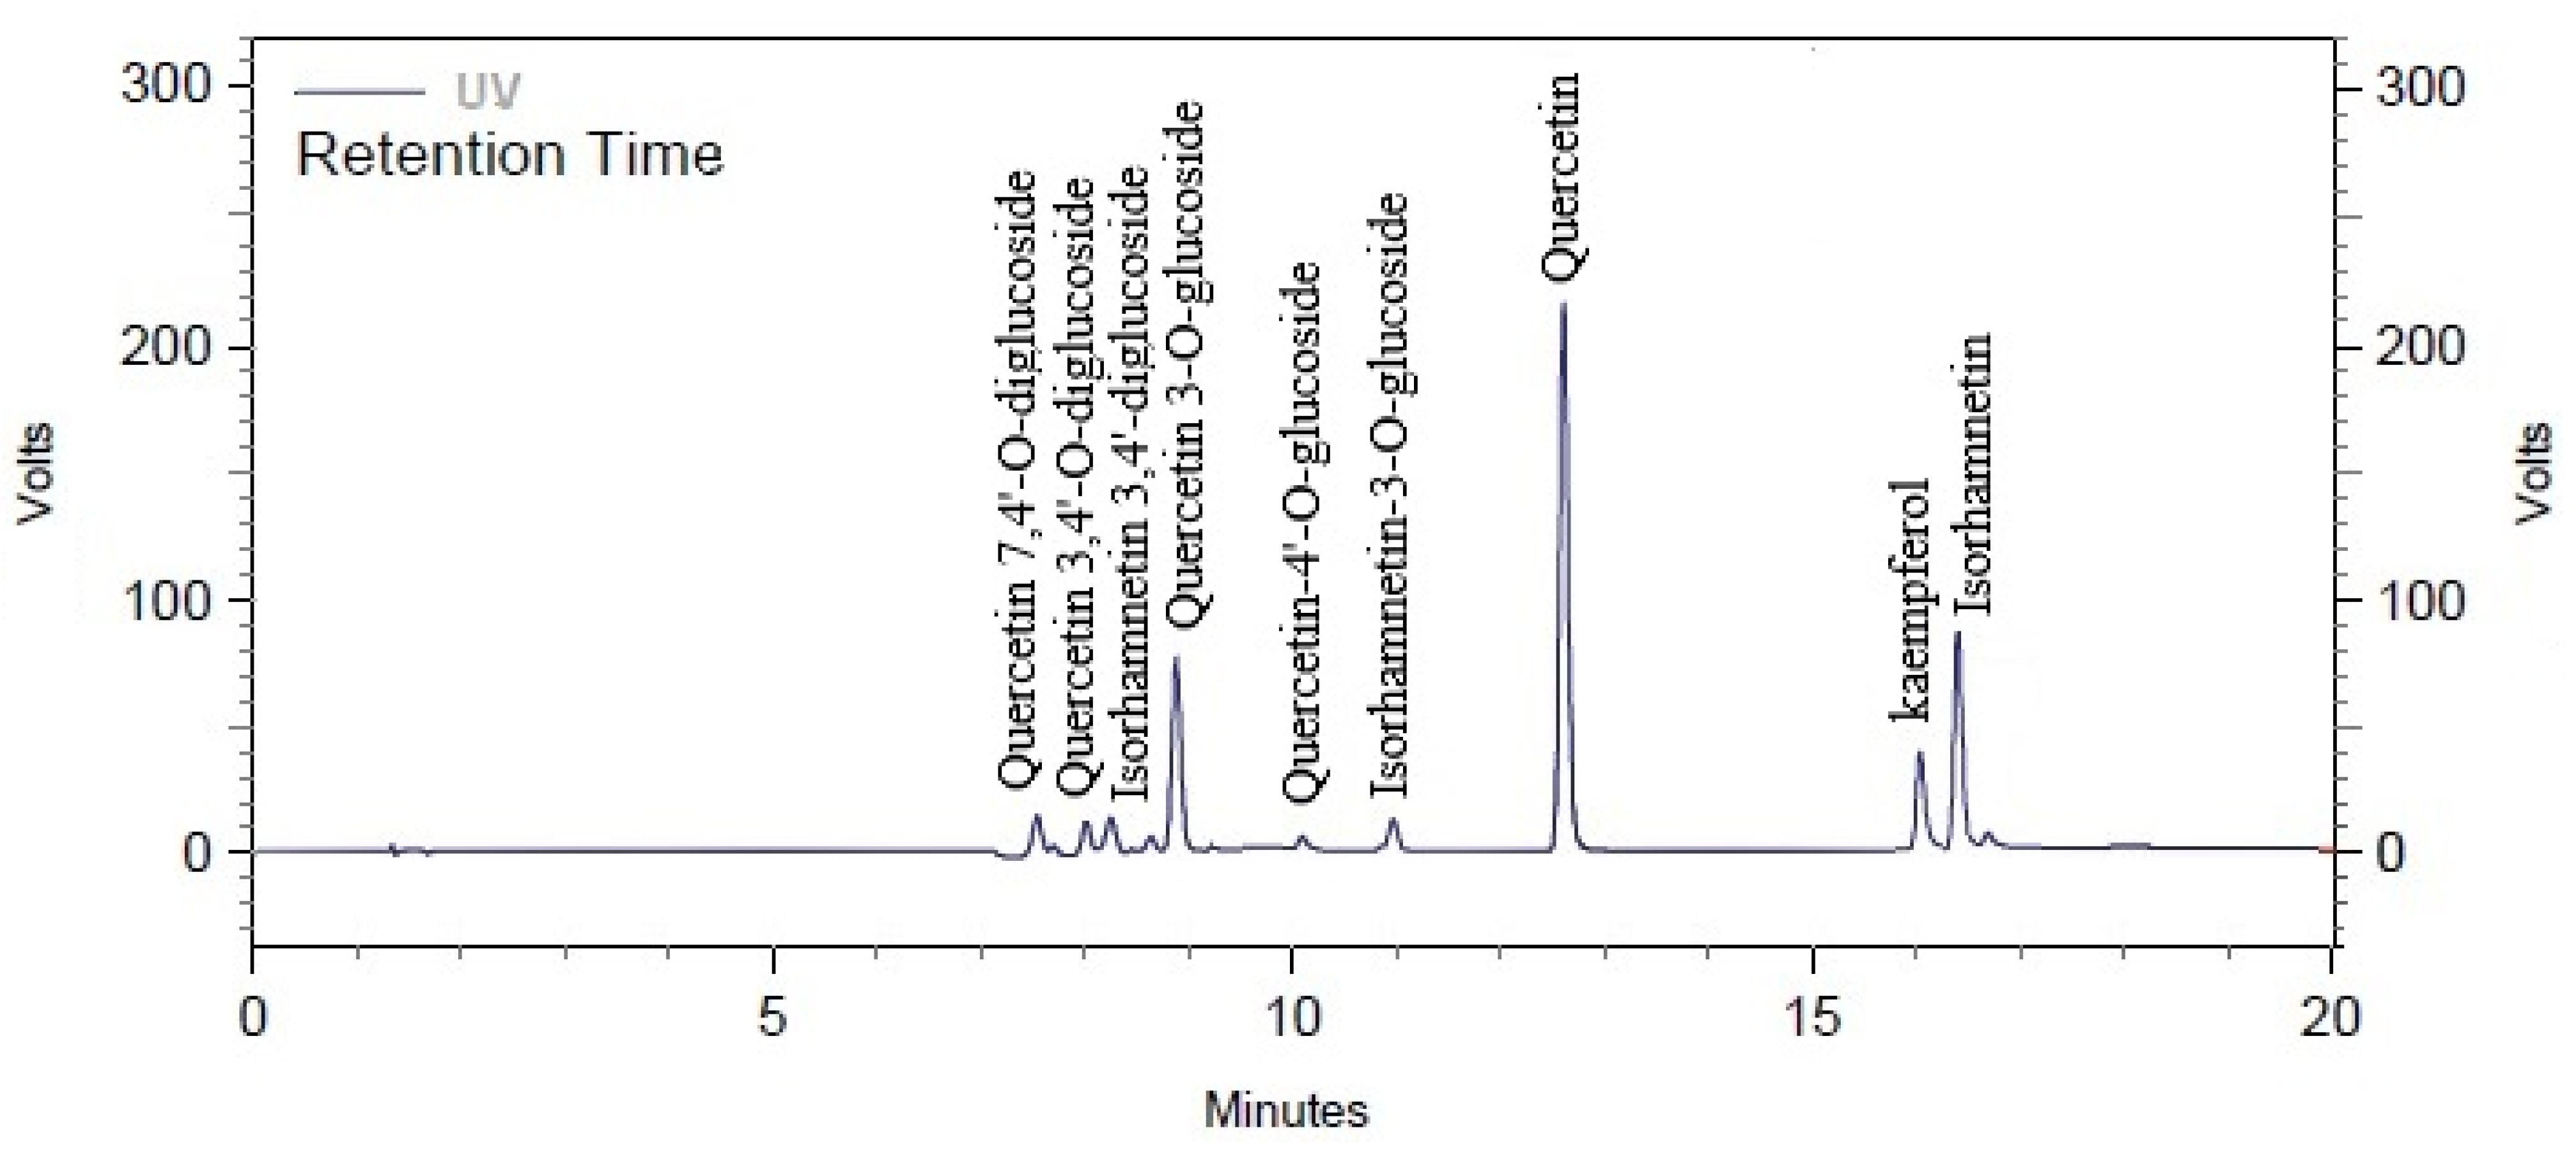
Different extraction methods (MAC, SOX, MAE, UAE, UMAE, and MUAE) were used in this study to extract quercetin and total flavonoids from red onion skin. Optimum extraction conditions include microwave time of 60 s, ultrasound time of 15 min, ultrasound temperature of 70 °C, ethanol concentration of 70% (v/v, water), solvent-to-solid ratio of 30 mL/g, microwave power of 180W, ultrasound power of 100%, ultrasound frequency of 37 kHz and particle size of 180 µm were applied for quercetin recovery. In addition, extraction conditions at microwave time of 60 s, ultrasound time of 15 min, ultrasound temperature of 60 °C, ethanol concentration of 60% (v/v, water), solvent-to-solid ratio of 30 mL/g, microwave power of 180 W, ultrasound power of 100%, ultrasound frequency of 37 kHz and particle size of 180 µm were investigated for total flavonoid extraction. The results (Table 5) showed that the highest extraction yield was obtained from the MUAE process, followed by UMAE, UAE, MAE, SOX, and MAC. The classification of different flavonoid content in the extract samples is presented in Table 6. Also, the HPLC analysis result of the extracted sample is shown in Figure 5. The analysis highlights the variety and concentration of key compounds, such as quercetin and its derivatives, in the extracted samples. For instance, quercetin (C15H10O7) had the highest concentration at 5.43 ± 0.06% with a retention time of 13.60 min, indicating its significant presence in the extract. Other notable compounds, such as quercetin 4′-O-glucoside (C21H20O12), were found at 3.15 ± 1.20% with a retention time of 10.50 min. While certain compounds like isorhamnetin 3,4′-diglucoside (C28H32O17) and kaempferol (C15H10O6) were identified, some, including isorhamnetin derivatives, were not detected (ND), which could be attributed to their instability or low concentrations in the extraction process. This detailed flavonoid profile provides insights into the effectiveness of the extraction method and highlights the significant recovery of quercetin and its derivatives in the samples.

3.6. Cost Efficiency of Extraction Methods

Based on our observations, there are notable differences in the cost efficiency of the extraction methods employed in this study. MUAE exhibited the highest cost efficiency for potential large-scale operations, primarily due to its ability to significantly reduce both processing time and solvent consumption through the synergistic effects of microwave and ultrasound. UMAE closely follows in terms of extraction efficiency, although it requires slightly higher energy consumption compared to MUAE. UAE, while utilizing less expensive equipment, is less cost-effective overall due to its longer extraction times and higher solvent requirements, making it less suitable for large-scale applications. MAE, although faster than UAE, is not efficient in terms of extraction yield, and its higher equipment costs and greater energy consumption make it the least favorable method for large-scale operations. Overall, our findings suggest that MUAE provides the best balance between cost and performance for large-scale extractions, followed by UMAE, UAE, and MAE. This ranking aligns with the extraction yields and operational efficiency observed in our study, positioning MUAE as the most appropriate method for maximizing both yield and cost efficiency in industrial-scale applications.

4. Conclusions

This study aimed to optimize the extraction conditions in the MUAE process to maximize the recovery yields of quercetin and total flavonoids from DOS. The results indicated that the optimum extraction conditions for quercetin were achieved with a microwave time of 60 s, ultrasound time of 15 min, ultrasound temperature of 70 °C, ethanol concentration of 70% (v/v, water), and a solvent-to-solid ratio of 30 mL/g. Among the factors studied, ultrasound temperature was found to be a highly influential factor in the recovery of both quercetin and total flavonoids, with higher temperatures leading to decreased yields due to potential degradation of bioactive compounds. The maximum recovery yields obtained were 10.32% for quercetin and 12.52% for total flavonoids under the optimized conditions. A comparison of the recovery yields across different extraction methods revealed that MUAE outperformed the other methods, with UMAE yielding 7.66% quercetin and 10.18% total flavonoids, UAE yielding 5.36% quercetin and 8.34% total flavonoids, and MAE yielding 5.03% quercetin and 7.91% total flavonoids. The highly significant results from the RSM analysis confirm the validity of the model for predicting optimal extraction conditions. Based on our knowledge, the recovery yield obtained in this study is the highest compared to previous works, making this method particularly advantageous for practical applications. This method is especially beneficial due to its shorter extraction time, which significantly reduces both operational costs and solvent consumption compared to other methods.
This study not only provides an efficient method for recovering quercetin but also opens avenues for its use in cancer treatments as its phyto-therapeutic potential has been well documented in recent studies [41]. This work shows strong potential for scale-up in food processing industries, particularly due to its efficiency in reducing extraction time, operational costs, and solvent consumption. These factors make the method highly suitable for large-scale operations aimed at recovering valuable compounds from red onion skin waste. The combination of microwave and ultrasound techniques in the MUAE process allows for more efficient extraction, enabling higher yields in a shorter period while using less solvent. These advantages make the method well-suited for scale-up in food processing industries, offering a sustainable and cost-effective solution for recovering valuable compounds from red onion skin waste.

Author Contributions

Z.J.V.: Investigation; Conceptualization; Visualization; Data Curation; Methodology; Validation; Writing—Original Draft. G.N.D.: Conceptualization; Project Administration; Resources; Writing—Review and Editing. M.M.: Review and Editing. F.P.: Visualization; Review and Editing. A.S.: Writing—Review and Editing; Assistance with Instrumentation. M.J.P.B.: Review and Editing. M.E.: Review and Editing. D.K.M.: Data Curation; Validation; Writing—Review and Editing. All authors have read and agreed to the published version of the manuscript.

Funding

The Biotechnology Research Laboratory, Babol Noshirvani University of Technology, Iran, [Grant Number: BNUT/4150009/1396], supported the present research.

Institutional Review Board Statement

Not applicable.

Informed Consent Statement

Not applicable.

Data Availability Statement

The raw data supporting the conclusions of this article will be made available by the authors on request.

Acknowledgments

We gratefully acknowledge Biotechnology Research Laboratory, Babol Noshirvani University of Technology for facilitating the research and providing the necessary support to conduct the present work.

Conflicts of Interest

The authors declare no conflicts of interest.

References

  1. Nabavi, S.F.; Russo, G.L.; Daglia, M.; Nabavi, S.M. Role of quercetin as an alternative for obesity treatment: You are what you eat! Food Chem. 2015, 179, 305–310. [Google Scholar] [CrossRef] [PubMed]
  2. HHerranz-López, M.; Olivares-Vicente, M.; Gallego, E.R.; Encinar, J.A.; Pérez-Sánchez, A.; Ruiz-Torres, V.; Joven, J.; Roche, E.; Micol, V. Quercetin metabolites from Hibiscus sabdariffa contribute to alleviate glucolipotoxicity-induced metabolic stress in vitro. Food Chem. Toxicol. 2020, 144, 111606. [Google Scholar] [CrossRef]
  3. Mohammadinezhad, F.; Talebi, A.; Allahyartorkaman, M.; Nahavandi, R.; Vesal, M.; Khiyavi, A.A. Preparation, characterization and cytotoxic studies of cisplatin-containing nanoliposomes on breast cancer cell lines. Asian Pac. J. Cancer Biol. 2023, 8, 155–159. [Google Scholar] [CrossRef]
  4. Gorgzadeh, A.; Hheidari, A.; Ghanbarikondori, P.; Arastonejad, M.; Goki, T.G.; Aria, M.; Allahyartorkaman, A.; Moazzam, F. Investigating the properties and cytotoxicity of cisplatin-loaded nano-polybutylcyanoacrylate on breast cancer cells. Asian Pac. J. Cancer Biol. 2023, 8, 345–350. [Google Scholar] [CrossRef]
  5. Hadisadegh, S.N.; Ghanbarikondori, P.; Sedighi, A.; Afyouni, I.; Javadpour, N.; Ebadi, M. Improving Cancer Therapy: Design, Synthesis, and Evaluation of Carboplatin-Based Nanoliposomes against Breast Cancer Cell Lines. Asian Pac. J. Cancer Biol. 2024, 9, 121–127. [Google Scholar] [CrossRef]
  6. Maghsoudloo, M.; Bagheri Shahzadeh Aliakbari, R.; Jabbari Velisdeh, Z. Pharmaceutical, nutritional, and cosmetic potentials of saponins and their derivatives. Nano Micro Biosyst. 2023, 2, 1–6. [Google Scholar]
  7. Shineh, G.; Mobaraki, M.; Afzali, E.; Alakija, F.; Velisdeh, Z.J.; Mills, D.K. Antimicrobial Metal and Metal Oxide Nanoparticles in Bone Tissue Repair. Biomed. Mater. Devices 2024, 2, 918–941. [Google Scholar] [CrossRef]
  8. Gawlik-Dziki, U.; Kaszuba, K.; Piwowarczyk, K.; Świeca, M.; Dziki, D.; Czyż, J. Onion skin—Raw material for the production of supplement that enhances the health-beneficial properties of wheat bread. Food Res. Int. 2015, 73, 97–106. [Google Scholar] [CrossRef]
  9. Ryu, R.; Jung, U.J.; Seo, Y.-R.; Kim, H.-J.; Moon, B.S.; Bae, J.-S.; Lee, D.G.; Choi, M.-S. Beneficial effect of persimmon leaves and bioactive compounds on thrombosis. Food Sci. Biotechnol. 2015, 24, 233–240. [Google Scholar] [CrossRef]
  10. Albishi, T.; John, J.A.; Al-Khalifa, A.S.; Shahidi, F. Antioxidative phenolic constituents of skins of onion varieties and their activities. J. Funct. Foods 2013, 5, 1191–1203. [Google Scholar] [CrossRef]
  11. Beesk, N.; Perner, H.; Schwarz, D.; George, E.; Kroh, L.W.; Rohn, S. Distribution of quercetin-3, 4′-O-diglucoside, quercetin-4′-O-monoglucoside, and quercetin in different parts of the onion bulb (Allium cepa L.) influenced by genotype. Food Chem. 2010, 122, 566–571. [Google Scholar] [CrossRef]
  12. Sharifi, F.; Sedighi, A.; Rehman, M. Design and simulation of a point-of-care microfluidic device for acoustic blood cell separation. Eng. Proc. 2020, 2, 76. [Google Scholar] [CrossRef]
  13. Hatami, A.; Saadatmand, M. Extremely Precise Blood–Plasma Separation from Whole Blood on a Centrifugal Microfluidic Disk (Lab-on-a-Disk) Using Separator Gel. Diagnostics 2022, 12, 2873. [Google Scholar] [CrossRef] [PubMed]
  14. Hatami, A.; Saadatmand, M.; Garshasbi, M. Cell-free fetal DNA (cffDNA) extraction from whole blood by using a fully automatic centrifugal microfluidic device based on displacement of magnetic silica beads. Talanta 2024, 267, 125245. [Google Scholar] [CrossRef]
  15. Nishad, J.; Saha, S.; Kaur, C. Enzyme-and ultrasound-assisted extractions of polyphenols from Citrus sinensis (cv. Malta) peel: A comparative study. J. Food Process. Preserv. 2019, 43, e14046. [Google Scholar] [CrossRef]
  16. Campone, L.; Celano, R.; Piccinelli, A.L.; Pagano, I.; Carabetta, S.; Di Sanzo, R.; Russo, M.; Ibañez, E.; Cifuentes, A.; Rastrelli, L. Response surface methodology to optimize supercritical carbon dioxide/co-solvent extraction of brown onion skin by-product as source of nutraceutical compounds. Food Chem. 2018, 269, 495–502. [Google Scholar] [CrossRef]
  17. Relić, D.; Héberger, K.; Sakan, S.; Škrbić, B.; Popović, A.; Đorđević, D. Ranking and similarity of conventional, microwave and ultrasound element sequential extraction methods. Chemosphere 2018, 198, 103–110. [Google Scholar] [CrossRef]
  18. Jin, E.Y.; Lim, S.; Kim, S.O.; Park, Y.-S.; Jang, J.K.; Chung, M.-S.; Park, H.; Shim, K.-S.; Choi, Y.J. Optimization of various extraction methods for quercetin from onion skin using response surface methodology. Food Sci. Biotechnol. 2011, 20, 1727–1733. [Google Scholar] [CrossRef]
  19. Živković, J.; Šavikin, K.; Ćujić-Nikolić, N.; Janković, T. Optimization of ultrasound-assisted extraction parameters for improving content of acteoside, luteolin-7-O-glucoside, and total polyphenols in extracts of Plantago lanceolata aerial parts. J. Food Process. Preserv. 2021, 45, e15866. [Google Scholar] [CrossRef]
  20. Ngo, T.V.; Scarlett, C.J.; Bowyer, M.C.; Vuong, Q.V. Isolation and Maximisation of Extraction of Mangiferin from the Root of Salacia chinensis L. Separations 2019, 6, 44. [Google Scholar] [CrossRef]
  21. Velisdeh, Z.J.; Najafpour, G.D.; Mohammadi, M.; Poureini, F. Optimization of Sequential Microwave-Ultrasound-Assisted Extraction for Maximum Recovery of Quercetin and Total Flavonoids from Red Onion (Allium cepa L.) Skin Wastes. arXiv 2021, arXiv:210406109. [Google Scholar]
  22. Rodrigues, L.M.; Romanini, E.B.; Silva, E.; Pilau, E.J.; da Costa, S.C.; Madrona, G.S. Camu-camu bioactive compounds extraction by ecofriendly sequential processes (ultrasound assisted extraction and reverse osmosis). Ultrason. Sonochem. 2020, 64, 105017. [Google Scholar] [CrossRef] [PubMed]
  23. Liu, J.; Mu, T.; Sun, H.; Fauconnier, M.L. Optimization of ultrasonic–microwave synergistic extraction of flavonoids from sweet potato leaves by response surface methodology. J. Food Process. Preserv. 2019, 43, e13928. [Google Scholar] [CrossRef]
  24. Zeković, Z.; Pintać, D.; Majkić, T.; Vidović, S.; Mimica-Dukić, N.; Teslić, N.; Versari, A.; Pavlić, B. Utilization of sage by-products as raw material for antioxidants recovery—Ultrasound versus microwave-assisted extraction. Ind. Crops Prod. 2017, 99, 49–59. [Google Scholar] [CrossRef]
  25. Chen, Y.; Zhang, D.; Gao, R.; Gao, L. Experimental and modeling analysis of flavones extraction from Vaccinium bracteatum Thunb. leaves by ultrasound and microwave assisted simultaneously. Chem. Pap. 2019, 73, 783–790. [Google Scholar] [CrossRef]
  26. Wizi, J.; Wang, L.; Hou, X.; Tao, Y.; Ma, B.; Yang, Y. Ultrasound-microwave assisted extraction of natural colorants from sorghum husk with different solvents. Ind. Crops Prod. 2018, 120, 203–213. [Google Scholar] [CrossRef]
  27. Gorgani, L.; Mohammadi, M.; Najafpour, G.D.; Nikzad, M. Sequential microwave-ultrasound-assisted extraction for isolation of Piperine from Black Pepper (Piper nigrum L.). Food Bioproc Technol. 2017, 10, 2199–2207. [Google Scholar] [CrossRef]
  28. Dorneles, M.S.; Noreña, C.P.Z. Microwave-assisted extraction of bioactive compounds from Araucaria angustifolia bracts followed by encapsulation. J. Food Process. Preserv. 2020, 44, e14484. [Google Scholar]
  29. Li, C.; Liu, S.; Song, Y.; Nie, K.; Ben, H.; Zhang, Y.; Han, G.; Jiang, W. A facile and eco-friendly method to extract Apocynum venetum fibers using microwave-assisted ultrasonic degumming. Ind. Crops Prod. 2020, 151, 112443. [Google Scholar] [CrossRef]
  30. De la Lama-Calvente, D.; Fernández-Rodríguez, M.J.; Garrido-Fernández, A.; Borja, R. Process optimization of the extraction of reducing sugars and total phenolic compounds from the invasive alga Rugulopteryx okamurae by response surface methodology (RSM). Algal Res. 2024, 80, 103500. [Google Scholar] [CrossRef]
  31. Shehata, M.G.; Abd El Aziz, N.M.; Youssef, M.M.; El-Sohaimy, S.A. Optimization conditions of ultrasound-assisted extraction of phenolic compounds from orange peels using response surface methodology. J. Food Process. Preserv. 2021, 45, e15870. [Google Scholar] [CrossRef]
  32. Chang, C.C.; Yang, M.H.; Wen, H.M.; Chern, J.C. Estimation of total flavonoid content in propolis by two complementary colorimetric methods. J. Food Drug Anal. 2002, 10, 3. [Google Scholar] [CrossRef]
  33. Olszewska, M. Separation of quercetin, sexangularetin, kaempferol and isorhamnetin for simultaneous HPLC determination of flavonoid aglycones in inflorescences, leaves and fruits of three Sorbus species. J. Pharm. Biomed. Anal. 2008, 48, 629–635. [Google Scholar] [CrossRef] [PubMed]
  34. Chemat, F.; Rombaut, N.; Meullemiestre, A.; Turk, M.; Perino, S.; Fabiano-Tixier, A.-S.; Abert-Vian, M. Review of green food processing techniques. Preservation, transformation, and extraction. Innov. Food Sci. Emerg. Technol. 2017, 41, 357–377. [Google Scholar] [CrossRef]
  35. Huang, W.; Xue, A.; Niu, H.; Jia, Z.; Wang, J. Optimised ultrasonic-assisted extraction of flavonoids from Folium eucommiae and evaluation of antioxidant activity in multi-test systems in vitro. Food Chem. 2009, 114, 1147–1154. [Google Scholar] [CrossRef]
  36. Mansur, A.R.; Song, N.E.; Jang, H.W.; Lim, T.G.; Yoo, M.; Nam, T.G. Optimizing the ultrasound-assisted deep eutectic solvent extraction of flavonoids in common buckwheat sprouts. Food Chem. 2019, 293, 438–445. [Google Scholar] [CrossRef]
  37. Ben-Ali, S.; Akermi, A.; Mabrouk, M.; Ouederni, A. Optimization of extraction process and chemical characterization of pomegranate peel extract. Chem. Pap. 2018, 72, 2087–2100. [Google Scholar] [CrossRef]
  38. Zhang, L.; Fan, G.; Khan, M.A.; Yan, Z.; Beta, T. Ultrasonic-assisted enzymatic extraction and identification of anthocyanin components from mulberry wine residues. Food Chem. 2020, 323, 126714. [Google Scholar] [CrossRef]
  39. Kia, A.G.; Ganjloo, A.; Bimakr, M. A short extraction time of polysaccharides from fenugreek (Trigonella foencem graecum) seed using continuous ultrasound acoustic cavitation: Process optimization, characterization and biological activities. Food Bioprocess Technol. 2018, 11, 2204–2216. [Google Scholar] [CrossRef]
  40. Mushtaq, A.; Roobab, U.; Denoya, G.I.; Inam-Ur-Raheem, M.; Gullón, B.; Lorenzo, J.M.; Barba, F.J.; Zeng, X.; Wali, A.; Aadil, R.M. Advances in green processing of seed oils using ultrasound-assisted extraction: A review. J. Food Process. Preserv. 2020, 44, e14740. [Google Scholar] [CrossRef]
  41. Jenča, A.; Mills, D.K.; Ghasemi, H.; Saberian, E.; Forood, A.M.K.; Petrášová, A.; Jenčová, J.; Velisdeh, Z.J.; Zare-Zardini, H.; Ebrahimifar, M. Herbal Therapies for Cancer Treatment: A Review of Phytotherapeutic Efficacy. Biol. Targets Ther. 2024, 18, 229–255. [Google Scholar] [CrossRef]
Figure 1. Chemical structure of quercetin.
Applsci 14 09225 g001
Figure 2. (AD). Response surface and contour plots for the MUAE of quercetin from red onion skin waste with respect to ultrasound temperature and ultrasound time (A); ethanol concentration and ultrasound time (B); microwave time and ultrasound temperature (C); and ethanol concentration and ultrasound temperature (D). The colors range from blue (lower values) to red (higher values), representing the variation in extraction yield.
Applsci 14 09225 g002aApplsci 14 09225 g002b
Figure 3. (AD). Response surface and contour plots for the MUAE of total flavonoids from red onion skin waste with respect to ultrasound temperature and ultrasound time (A); microwave time and ultrasound time (B); microwave time and ultrasound temperature (C); and ethanol concentration and ultrasound temperature (D). The colors range from blue (lower values) to red (higher values), representing the variation in extraction yield.
Applsci 14 09225 g003
Figure 4. The correlation between numerical and experimental data.
Applsci 14 09225 g004
Figure 5. HPLC chromatograms of onion skin extract.
Applsci 14 09225 g005
Table 1. Specifications of the independent variables.
VariablesCodesUnitsLevels
−10+1
Ultrasound timeX1Min153045
Ultrasound temperatureX2°C607080
Solvent-to-solid ratioX3mL/g203040
Microwave timeX4S306090
Ethanol concentrationX5% (v/v, water)506070
X1: ultrasound time; X2: ultrasound temperature; X3: solvent-to-solid ratio; X4: microwave time; X5: ethanol concentration.
Table 2. Box–Behnken design with coded independent variables and responses.
RunIndependent VariablesResponses (Dependent Variables)
X1: US Time (min)X2: US Temp (°C)X3: S/S Ratio (mL/g)X4: MW Time (min)X5: Ethanol Conc
%
(v/v, Water)
Y1:
Quercetin Yield (%)
Y2:
Flavonoid
Yield (%)
1−1−10009.63 ± 0.1612.52 ± 0.21
20−10019.42 ± 0.2811.52 ± 0.06
30−1−1008.41 ± 0.0910.41 ± 0.7
4100−107.64 ± 0.749.52 ± 0.95
5000008.51 ± 0.4010.49 ± 0.8
6001−108.79 ± 0.4710.74 ± 0.41
7000008.35 ± 0.2710.53 ± 0.16
8−1000−19.21 ± 0.8111.32 ± 0.43
9−100109.43 ± 0.6211.50 ± 0.68
101−10007.01 ± 0.459.11 ± 0.5
11010−107.21 ± 0.129.32 ± 0.35
12001019.51 ± 0.611.74 ± 0.69
13100017.96 ± 0.879.94 ± 0.78
1400−1108.75 ± 0.4410.69 ± 0.08
1500−1−108.62 ± 0.710.53 ± 0.14
16011007.27 ± 0.699.44 ± 0.26
17110006.51 ± 0.518.84 ± 0.82
180001−18.42 ± 0.4210.30 ± 0.35
19000008.40 ± 0.710.48 ± 0.54
20000119.19 ± 0.3111.08 ± 0.3
21−110007.58 ± 0.199.71 ± 0.27
22−100−109.92 ± 0.3611.96 ± 0.46
23010107.13 ± 0.099.24 ± 0.79
241000−17.52 ± 0.559.78 ± 0.61
25001109.16 ± 0.1210.75 ± 0.66
2600−1019.46 ± 0.9411.35 ± 0.29
2701−1007.23 ± 0.89.40 ± 0.76
28−1000110.32 ± 0.312.03 ± 0.51
29101007.95 ± 0.229.93 ± 0.37
300010−18.61 ± 0.7110.62 ± 0.63
31000008.41 ± 0.1710.35 ± 0.51
320−10108.86 ± 0.2310.96 ± 0.78
33−1010010.01 ± 0.3512.01 ± 0.09
340−10−107.95 ± 0.7710.11 ± 0.8
35000−119.34 ± 0.5211.16 ± 0.74
36−10−1009.98 ± 0.6411.91 ± 0.05
370−100−18.11 ± 0.9410.23 ± 0.17
38100107.77 ± 0.99.81 ± 0.39
390100−17.11 ± 0.189.33 ± 0.14
4010−1007.84 ± 0.759.67 ± 0.5
410−11008.52 ± 0.410.79 ± 0.25
42010017.47 ± 0.059.57 ± 0.58
43000008.48 ± 0.9210.40 ± 0.06
44000008.31 ± 0.2410.25 ± 0.28
4500−10−18.62 ± 0.3010.73 ± 0.69
46000−1−18.43 ± 0.5110.38 ± 0.16
% = mg QE/g DOS × 100; X1: US Time (ultrasound time); X2: US Temp (ultrasound temperature); X3: S/S Ratio (solvent-to-solid ratio); X4: MW Time (microwave time); X5: Ethanol Conc (ethanol concentration); Y1: Quercetin Yield; Y2: Flavonoid Yield.
Table 3. ANOVAs for the regression model of Y1.
SourceSum of Squaresdf.Mean SquareF-Valuep-ValueSignificance
ModelY136.97201.8585.15<0.0001**
X1Y115.76115.76726.04<0.0001**
X2Y16.7616.76311.41<0.0001**
X3Y10.1310.133.150.0542
X4Y10.1010.104.910.0614
X5Y12.7612.76126.94<0.0001**
X1X2Y10.6010.6027.67<0.0001**
X1X4Y10.0910.0964.430.0456*
X1X5Y10.1110.115.170.0318*
X2X4Y10.2510.2511.290.0025*
X2X5Y10.2310.2310.390.0035*
X12Y10.1110.115.110.0328*
X22Y15.4815.48252.36<0.0001**
X32Y10.8810.8840.37<0.0001**
X42Y10.1710.177.900.0095*
X52Y10.8610.8639.73<0.0001**
ResidualY10.54250.022
Lack of FitY10.51200.0264.490.0515Not significant
Pure ErrorY10.02955.72 × 10−3
Cor TotalY137.5145
Std. Dev.Y10.15
R2Y10.9855
Adjusted R2Y10.9740
Predicted R2Y10.9441
MeanY18.44
C.V. %Y11.75
df: Degree of freedom; * significant; ** highly significant; X1: Ultrasound time; X2: Ultrasound temperature; X3: Solvent-to-solid ratio; X4: Microwave time; X5: Ethanol concentration; Y1: Quercetin Yield.
Table 4. ANOVAs for the regression model of Y2.
SourceSum of Squaresdf.Mean SquareF-Valuep-ValueSignificance
ModelY234.93201.7565.18<0.0001**
X1Y216.73116.73624.25<0.0001**
X2Y27.2917.29272.05<0.0001**
X3Y20.1610.163.960.0621
X4Y20.0910.094.650.0592
X5Y22.0312.0375.78<0.0001**
X1X2Y21.6111.6160.19<0.0001**
X1X4Y20.1410.145.250.0307*
X1X5Y20.0710.0762.820.1054
X2X4Y20.2210.228.070.0088*
X2X5Y20.2810.2810.290.0037*
X12Y20.2610.269.710.0046*
X22Y22.9612.96110.43<0.0001**
X32Y20.6310.6323.49<0.0001**
X42Y20.0110.0190.720.4056
X52Y20.7810.7829.19<0.0001**
ResidualY20.67250.027
Lack of FitY20.62200.0312.810.1276Not significant
Pure ErrorY20.05551.10 × 10−2
Cor TotalY235.6045
Std. Dev.Y20.16
R2Y20.9812
Adjusted R2Y20.9661
Predicted R2Y20.9287
MeanY210.49
C.V. %Y21.56
df: Degree of freedom; * significant; ** highly significant; X1: Ultrasound time; X2: Ultrasound temperature; X3: Solvent-to-solid ratio; X4: Microwave time; X5: Ethanol concentration; Y2: Total Flavonoid Yield.
Table 5. Comparison of recovery yields from different extraction methods.
Extraction MethodQE (%)TFC (%)
MAC2.96 ± 0.03 f3.64 ± 0.02 f
SOX3.09 ± 0.05 e5.24 ± 0.03 e
MAE5.03 ± 0.02 d7.91 ± 0.06 d
UAE5.36 ± 0.0 c8.34 ± 0.05 c
UMAE 7.66 ± 0.04 b10.18 ± 0.14 b
MUAE 10.32 ± 0.18 a12.52 ± 0.20 a
% = mg QE/g DOS × 100; MAC: maceration; SOX: Soxhlet extraction; MAE: microwave-assisted extraction; UAE: ultrasound-assisted extraction; UMAE: ultrasound/microwave-assisted extraction; MUAE: microwave/ultrasound-assisted extraction; TFC: total flavonoid content; QE: quercetin equivalents; data are expressed as means ± SD (n = 3); mean values with different letters are significantly different (p < 0.05).
Table 6. Flavonoid content in extracts of red onion skin by HPLC.
CompoundChemical FormulaMolecular Weight (g/mol)Retention Time (min)Concentration (%)
Quercetin 7,4′-O-diglucosideC27H30O17626.57.100.65 ± 0.02 c
Quercetin 3,4′-O-diglucosideC27H30O17626.57.400.73 ± 0.02 c
Isorhamnetin 3,4′-diglucosideC28H32O17640.57.60ND
Unknown 8.20ND
Quercetin 3-O-glucosideC21H20O12464.48.440.36 ± 0.01 c
Quercetin-4′-O-glucosideC21H20O12464.410.503.15 ± 1.20 b
Isorhamnetin-3-O-glucosideC22H22O12478.412.60ND
QuercetinC15H10O7302.2313.605.43 ± 0.06 a
kaempferolC15H10O6286.2416.500.46 ± 0.08 c
IsorhamnetinC16H12O7316.2616.80ND
Unknown 17.20ND
% = mg QE/g DOS × 100; ND: not detected; data are expressed as means ± SD (n = 3); mean values with different letters are significantly different (p < 0.05).
Disclaimer/Publisher’s Note: The statements, opinions and data contained in all publications are solely those of the individual author(s) and contributor(s) and not of MDPI and/or the editor(s). MDPI and/or the editor(s) disclaim responsibility for any injury to people or property resulting from any ideas, methods, instructions or products referred to in the content.