
Determination of Compressed Liquid Densities for CO2 + n-Decane Using a Vibrating Tube Densimeter

Abstract
1. Introduction
2. Samples and Methods
2.1. Samples
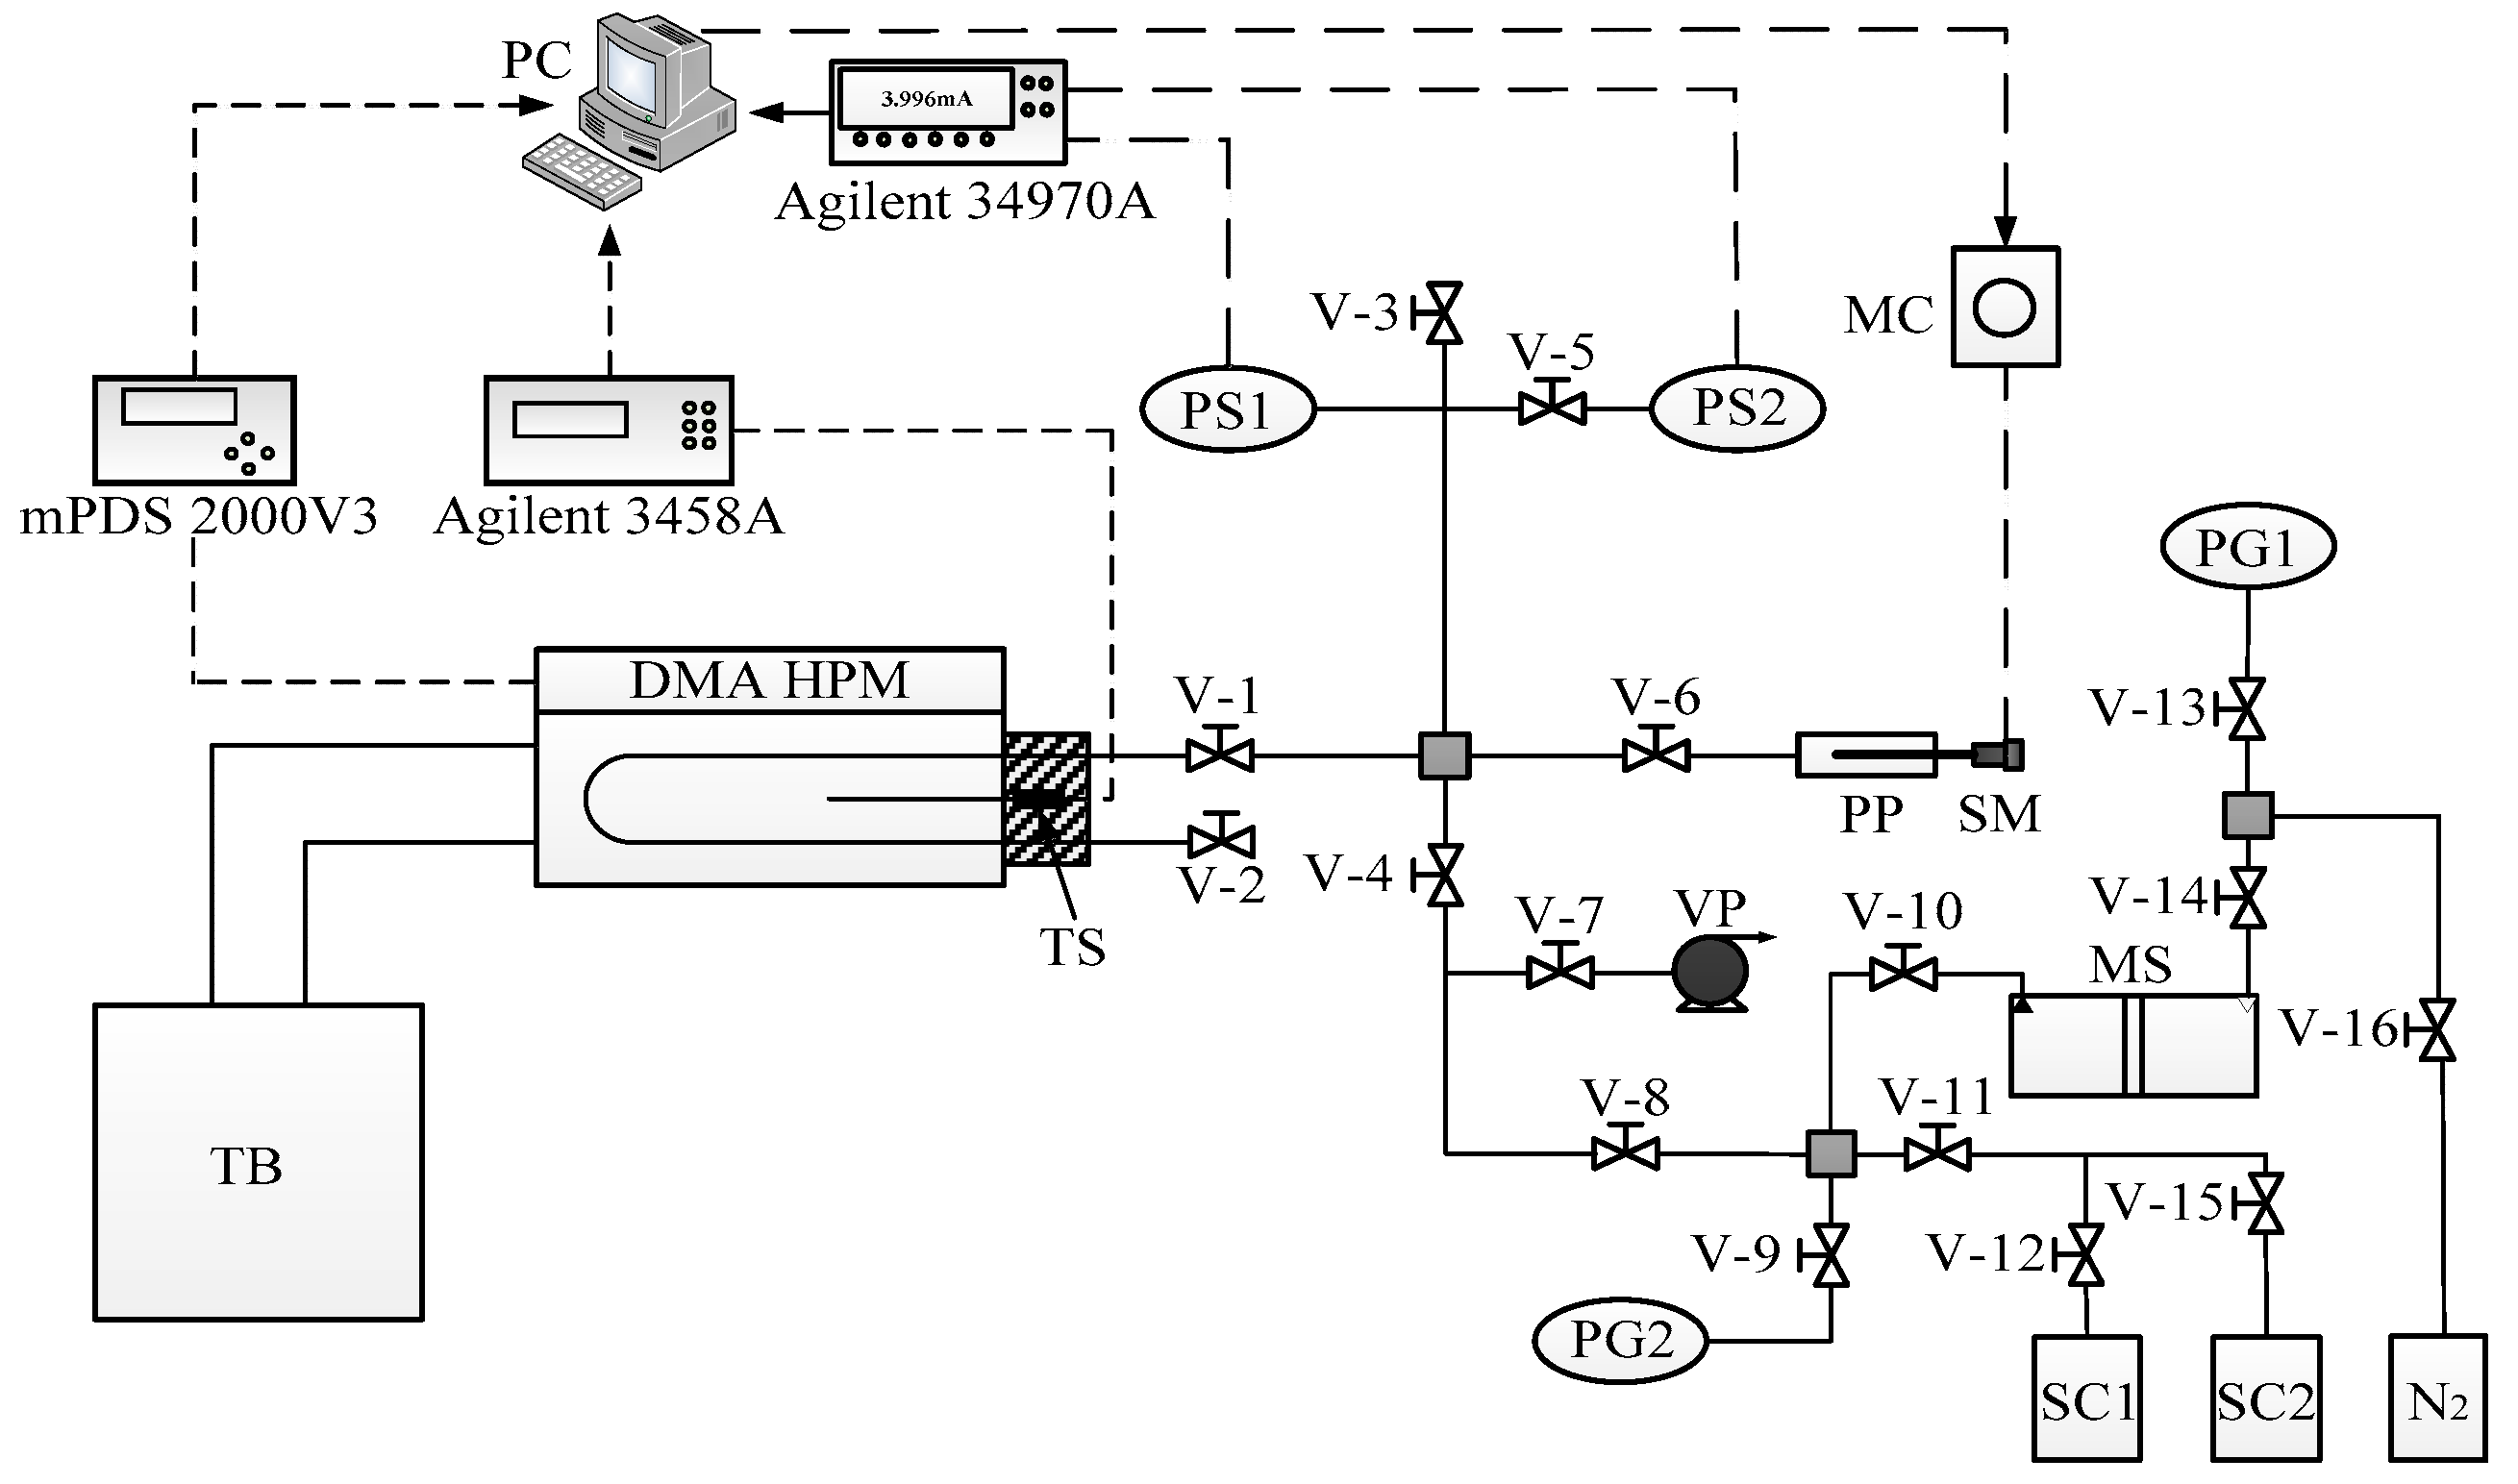
2.2. Apparatus and Sample Preparation
3. Results and Discussion
3.1. Experimental Density Data
3.2. Modified Tait Equation
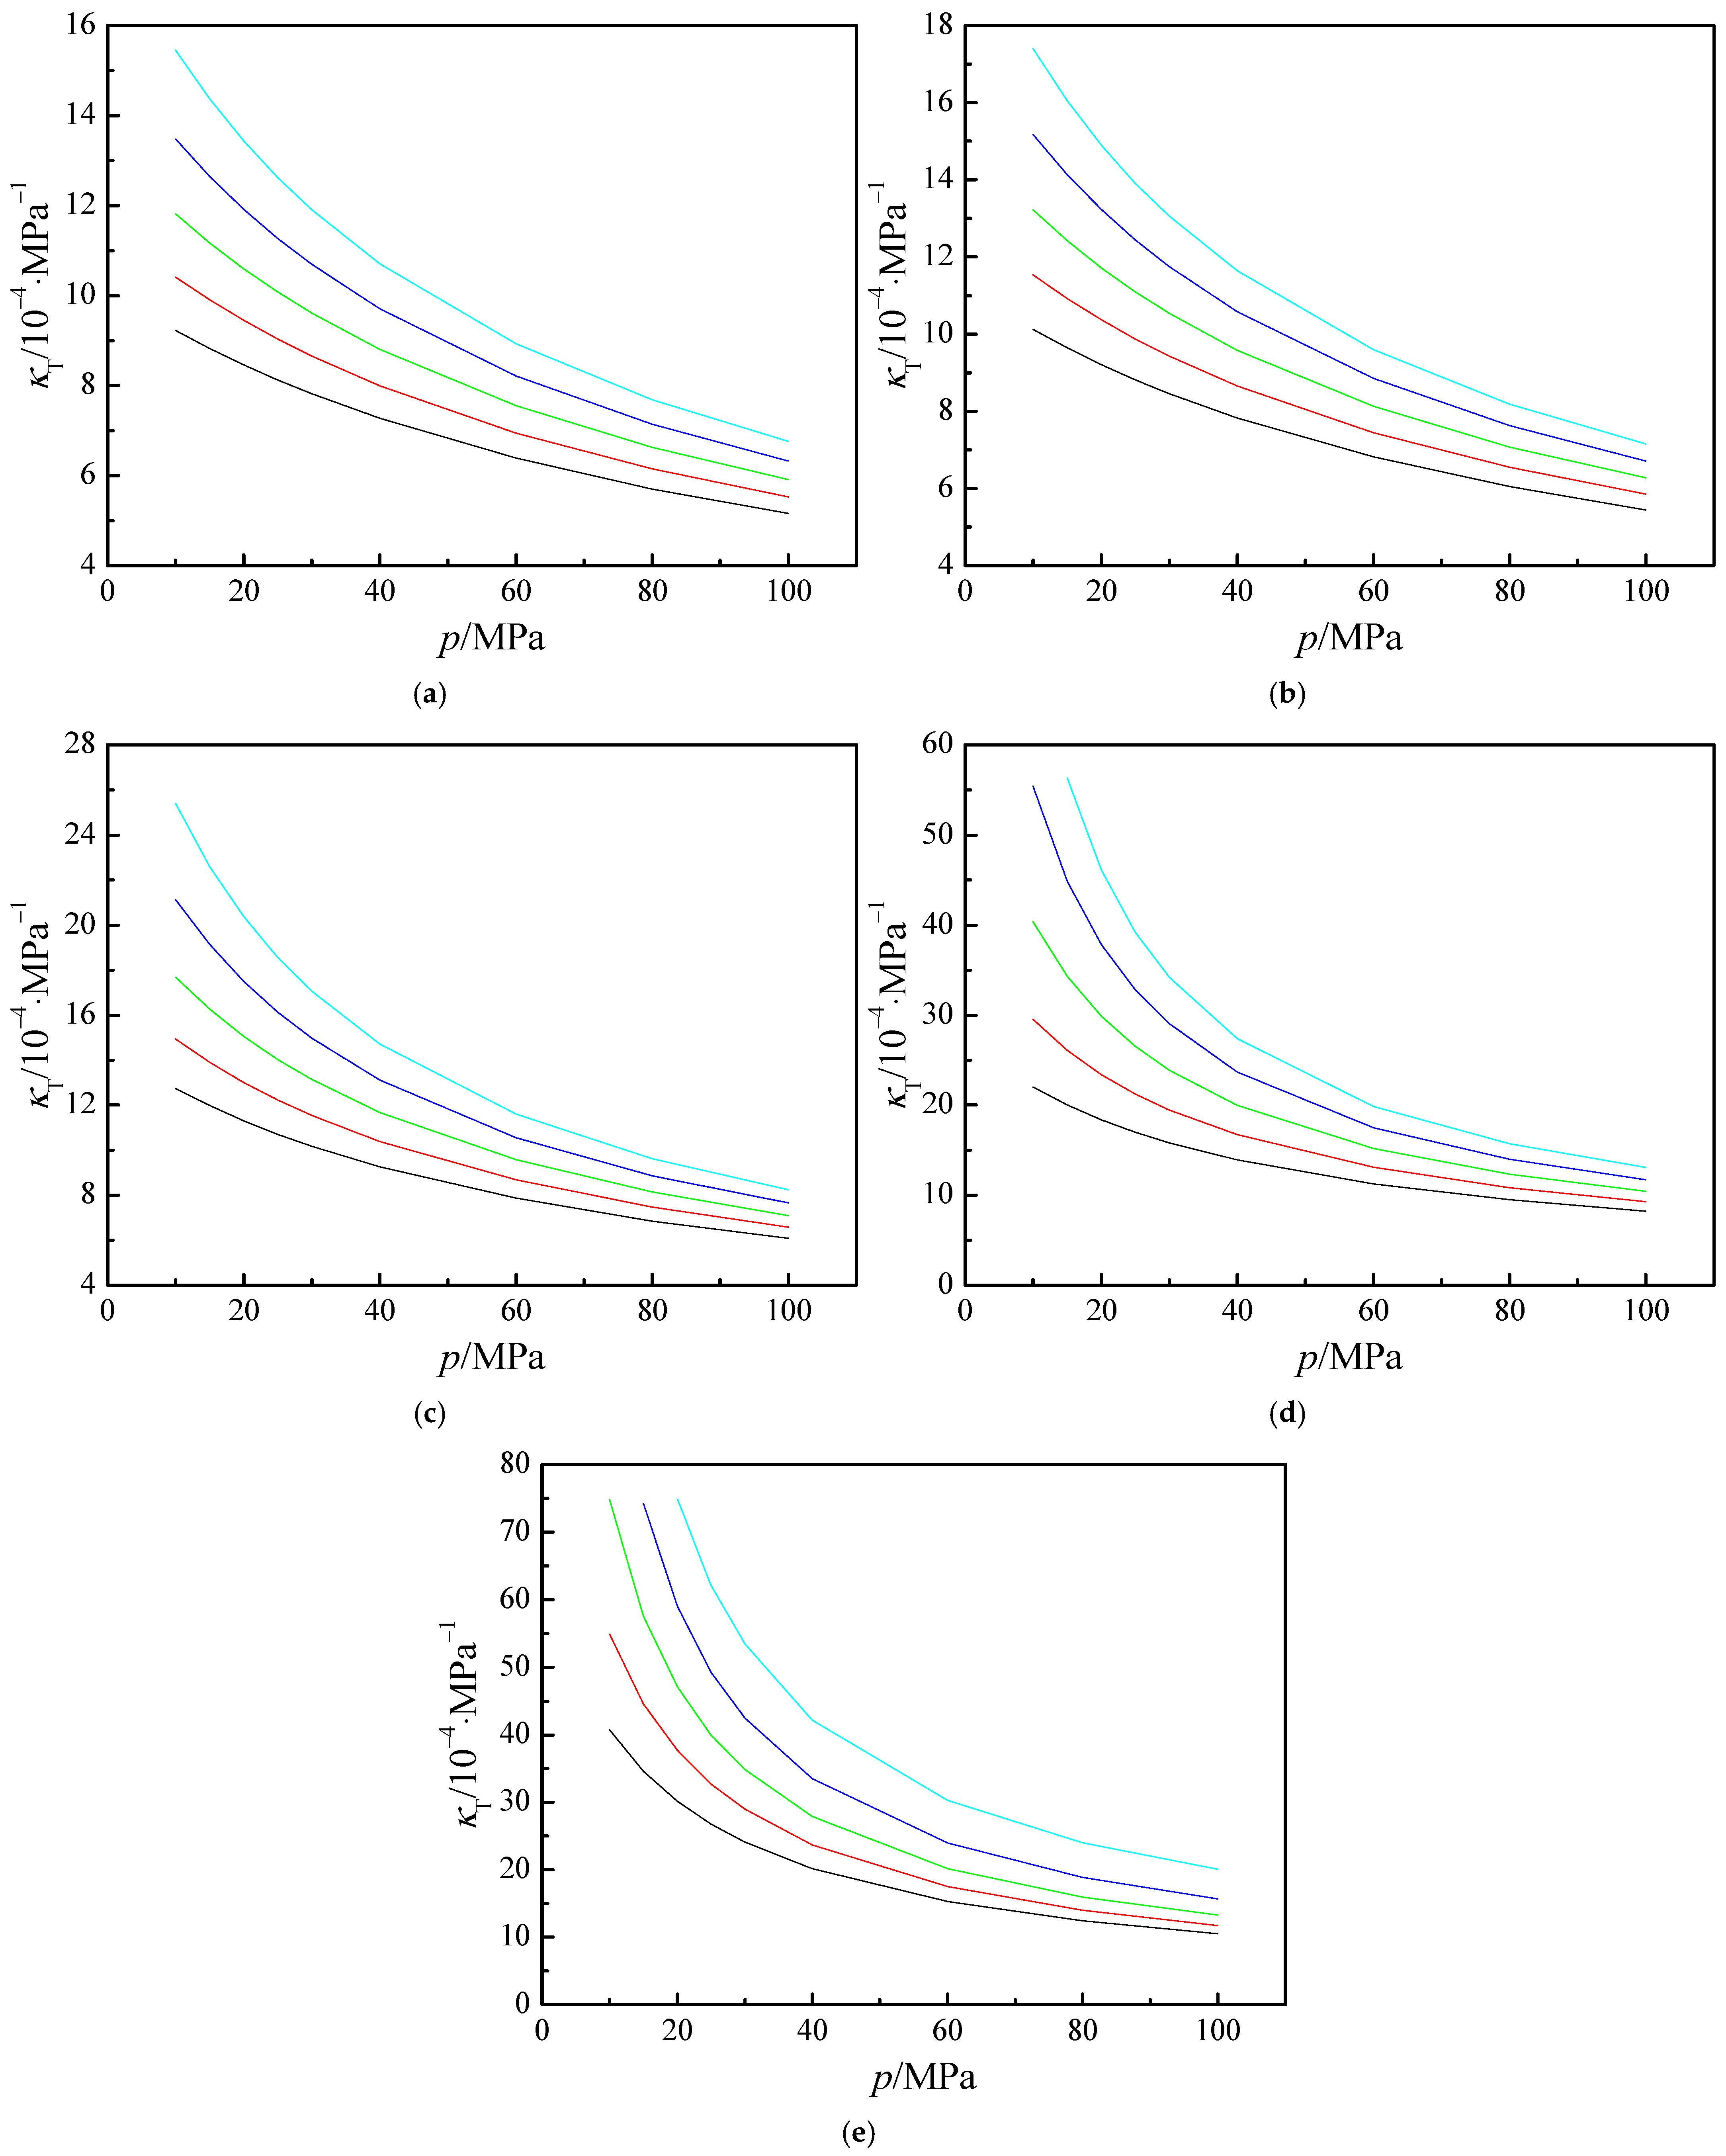
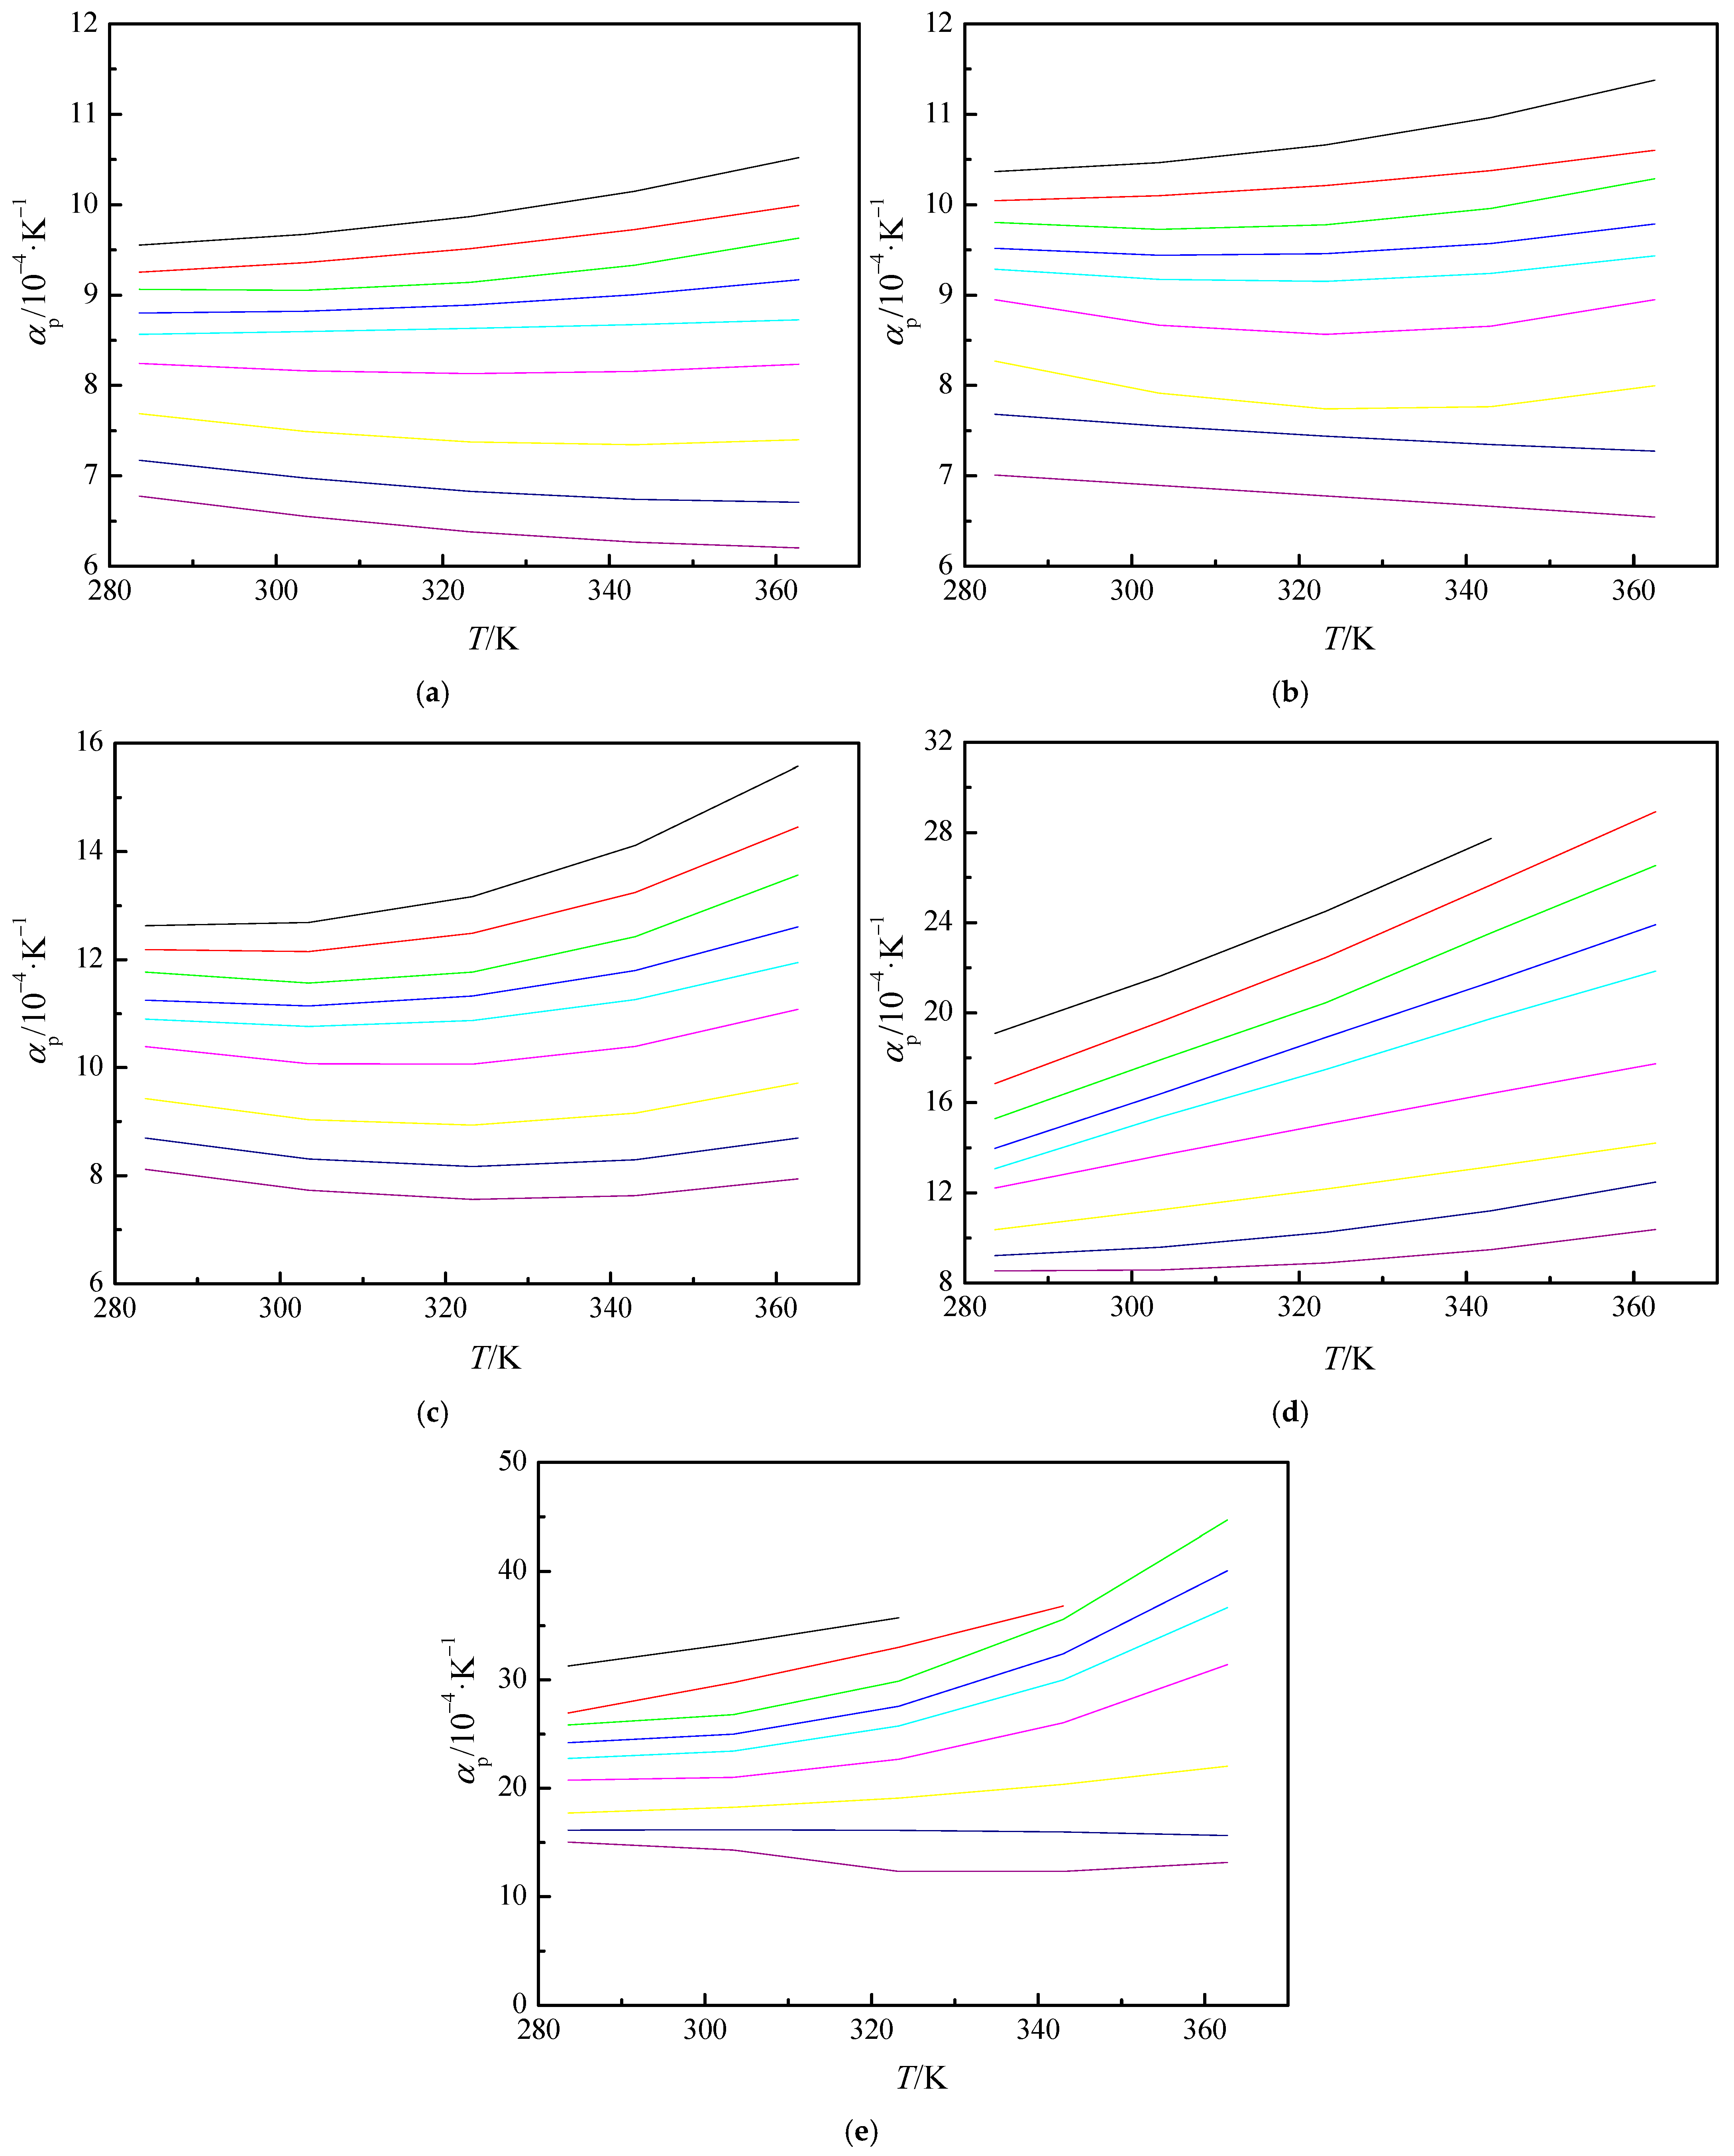
3.3. Derived Thermodynamics Properties
4. Conclusions
- (1)
- The composition of crude oil is complex, and single-component hydrocarbons or simple mixtures are not sufficient to represent crude oil. Therefore, it is necessary to study the densities of CO2 + multicomponent alkane mixtures and CO2 + crude oil using a high-pressure VTD.
- (2)
- In the future, the density equations for CO2 + alkane mixtures can be further developed by combining the Helmholtz equation of state and mixing rules. Specialized mixing rules and applicable equations can thus be developed.
- (3)
- The temperature range, pressure range, and system used in the experimental apparatus can be further expanded. The experimental system used in this work had a temperature range from 283 K to 363 K, and a pressure of up to 100 MPa. In the future, the temperature system can be improved to expand the experiment to a higher temperature range and a higher pressure range. The densities of other mixtures can be obtained by using this experimental apparatus.
Supplementary Materials
Author Contributions
Funding
Institutional Review Board Statement
Informed Consent Statement
Data Availability Statement
Conflicts of Interest
Nomenclature
| ρ | density |
| ρ0(T) | density at p = 0.1 MPa |
| Ai, Bi, C | correlated parameters of modified Tait equation |
| AAD | Absolute Average Deviation |
| MAD | Maximum Absolute Deviation |
| σ | Standard Deviation |
| N | number of experimental data |
| m | number of modified Tait equation parameters |
| κT | isothermal compressibility |
| αp | isobaric thermal expansivity |
| ai | parameters of equation |
| x | mole fracion |
| molar volume | |
| Mi | molar mass |
| Subscripts and superscripts | |
| exp | experimental value |
| calc | calculated value |
| mix | mixture |
References
- Filonchyk, M.; Peterson, M.P.; Yan, H.; Gusev, A.; Zhang, L.F.; He, Y.; Yang, S.W. Greenhouse gas emissions and reduction strategies for the world’s largest greenhouse gas emitters. Sci. Total Environ. 2024, 944, 173895. [Google Scholar] [CrossRef] [PubMed]
- Jiang, K.J.; Zhang, G.M.; Liu, H.; Mu, Z.G.; Wang, Q.H.; Qin, T.Q.; Niu, Y.G.; Wang, X.W.; Zhang, Q. Design and dynamic simulation of flue gas-molten salt heat exchanger in flexible operation coal-fired power plant. J. Energy Storage 2024, 93, 112227. [Google Scholar] [CrossRef]
- Filonchyk, M.; Peterson, M.P.; Zhang, L.F.; Hurynovich, V.; He, Y. Greenhouse gases emissions and global climate change: Examining the influence of CO2, CH4, and N2O. Sci. Total Environ. 2024, 935, 173359. [Google Scholar] [CrossRef] [PubMed]
- Iakovidou, G.; Itziou, A.; Tsiotsias, A.; Lakioti, E.; Samaras, P.; Tsanaktsidis, C.; Karayannis, V. Application of microalgae to wastewater bioremediation, with CO2 biomitigation, health product and biofuel development, and environmental biomonitoring. Appl. Sci. 2024, 14, 6727. [Google Scholar] [CrossRef]
- Wang, W.J.; Scudiero, L.; Ha, S. Recent progress in electrochemical reduction of CO2 into formate and C2 compounds. Korean J. Chem. Eng. 2022, 39, 461–474. [Google Scholar] [CrossRef]
- Ahmed, S.; Irshad, M.; Yoon, W.; Karanwal, N.; Sugiarto, J.R.; Khan, M.K.; Kim, S.K.; Kim, J. Evaluation of MgO as a promoter for the hydrogenation of CO2 to long-chain hydrocarbons over Fe-based catalysts. Appl. Catal. B Environ. 2023, 338, 123052. [Google Scholar] [CrossRef]
- Peddi, K.P.; Ricci, S.; Rizzetto, L. Reduction potential of gaseous emissions in European ports using cold ironing. Appl. Sci. 2024, 14, 6837. [Google Scholar] [CrossRef]
- Walsh, B.; Ciais, P.; Janssens, I.A.; Peñuelas, J.; Riahi, K.; Rydzak, F.; Vuuren, D.P.V.; Obersteiner, M. Pathways for balancing CO2 emissions and sinks. Nat. Commun. 2017, 8, 14856. [Google Scholar] [CrossRef]
- Stefanopoulos, K.L.; Favvas, E.P.; Karanikolos, G.N.; Alameri, W.; Kelessidis, V.C.; Youngs, T.G.; Bowron, D.T. Monitoring the CO2 enhanced oil recovery process at the nanoscale: An in situ neutron scattering study. Energy Adv. 2022, 1, 67–75. [Google Scholar] [CrossRef]
- Kashkooli, S.B.; Gandomkar, A.; Riazi, M.; Tavallali, M.S. Coupled optimization of carbon dioxide sequestration and CO2 enhanced oil recovery. J. Petrol. Sci. Eng. 2022, 208, 109257. [Google Scholar] [CrossRef]
- Song, Y.C.; Jian, W.W.; Zhang, Y.; Shen, Y.; Zhan, Y.C.; Zhao, J.F.; Liu, Y.; Wang, D.Y. Densities and volumetric characteristics of binary system of CO2 + decane from (303.15 to 353.15) K and pressures up to 19 MPa. J. Chem. Eng. Data 2012, 57, 3399–3407. [Google Scholar] [CrossRef]
- Miskov, S.P.; Ivanis, G.R.; Radovic, I.R.; Kijevcanin, M.L. High pressure densities and derived properties of biodiesel fuel produced by heterogeneous transesterification from biowaste. Therm. Sci. 2019, 23, S1757–S1768. [Google Scholar] [CrossRef]
- Mahmoudzadeh, A.; Amiri-Ramsheh, B.; Atashrouz, S.; Abedi, A.; Abuswer, M.A.; Ostadhassan, M.; Mohaddespour, A.; Hemmati-Sarapardeh, A. Modeling CO2 solubility in water using gradient boosting and light gradient boosting machine. Sci. Rep. 2024, 14, 13511. [Google Scholar] [CrossRef] [PubMed]
- Samara, H.; Al-Eryani, M.; Jaeger, P. The role of supercritical carbon dioxide in modifying the phase and interfacial properties of multiphase systems relevant to combined EOR-CCS. Fuel 2022, 328, 124271. [Google Scholar] [CrossRef]
- Moreau, A.; Polishuk, I.; Segovia, J.J.; Tuma, D.; Vega-Maza, D.; Martín, M.C. Measurements and predictions of densities and viscosities in CO2 + hydrocarbon mixtures at high pressures and temperatures: CO2 + n-pentane and CO2 + n-hexane blends. J. Mol. Liq. 2022, 360, 119518. [Google Scholar] [CrossRef]
- Cullick, A.S.; Mathis, M.L. Densities and viscosities of mixtures of carbon dioxide and n-decane from 310 to 403 K and 7 to 30 MPa. J. Chem. Eng. Data 1984, 29, 393–396. [Google Scholar] [CrossRef]
- Bessières, D.; Saint-Guirons, H.; Daridon, J.L. Volumetric behavior of decane + carbon dioxide at high pressures. Measurements and calculation. J. Chem. Eng. Data 2001, 46, 1136–1139. [Google Scholar] [CrossRef]
- Zúñiga-Moreno, A.; Galicia-Luna, L.A.; Camacho-Camacho, L.E. Compressed liquid densities and excess volumes of CO2 + decane mixtures from 313 to 363 K and pressures up to 25 MPa. J. Chem. Eng. Data 2005, 50, 1030–1037. [Google Scholar] [CrossRef]
- Fandiño, O.; Lugo, L.; Segovia, J.J.; López, E.R.; Comuñas, M.J.P.; Fernández, J. High pressure densities of carbon dioxide + dipentaerythritol hexaheptanoate: New experimental setup and volumetric behavior. J. Supercrit. Fluids 2011, 58, 189–197. [Google Scholar] [CrossRef]
- Nourozieh, H.; Kariznovi, M.; Abedi, J. Measurement and correlation of saturated liquid properties and gas solubility for decane, tetradecane and their binary mixtures saturated with carbon dioxide. Fluid Phase Equilib. 2013, 37, 246–254. [Google Scholar] [CrossRef]
- Kariznovi, M.; Nourozieh, H.; Abedi, J. Phase composition and saturated liquid properties in binary and ternary systems containing carbon dioxide, n-decane, and n-tetradecane. J. Chem. Thermodyn. 2013, 57, 189–196. [Google Scholar] [CrossRef]
- Kandil, M.E.; Al-Saif, N.M.; Sultan, A.S. Simulation and measurements of volumetric and phase behavior of carbon dioxide + higher alkanes at high pressure: CO2 + n-decane at temperatures (313–410) K and pressures up to 76 MPa. Int. J. Greenh. Gas Control. 2016, 53, 198–206. [Google Scholar] [CrossRef]
- Zambrano, J.; Gómez-Soto, F.V.; Lozano-Martín, D.; Martín, M.C.; Segovia, J.J. Volumetric behaviour of (carbon dioxide + hydrocarbon) mixtures at high pressures. J. Supercrit. Fluids 2016, 110, 103–109. [Google Scholar] [CrossRef]
- Yang, T.; Sun, Y.K.; Meng, X.Y.; Wu, J.T.; Siepmann, J.I. Simultaneous measurement of the density and viscosity for n-decane + CO2 binary mixtures at temperature between (303.15 to 373.15) K and pressures up to 80 MPa. J. Mol. Liq. 2021, 33, 116646. [Google Scholar] [CrossRef]
- Jia, T.; Bi, S.S.; Hu, X.Z.; Meng, X.Y.; Wu, J.T. Volumetric properties of binary mixtures of {difluoromethane (R32) + trans-1,3,3,3-tetrafluoropropene (R1234ze(E))} at temperatures from 283.15 K to 363.15 K and pressures up to 100 MPa. J. Chem. Thermodyn. 2016, 101, 54–63. [Google Scholar] [CrossRef]
- Jia, T.; Bi, S.S.; Wu, J.T. Compressed liquid densities of binary mixtures of n-decane + n-dodecane at temperatures from 283 K to 363 K and pressures up to 100 MPa. Fluid Phase Equilib. 2018, 459, 65–72. [Google Scholar] [CrossRef]
- Yin, J.G.; Wu, J.T.; Meng, X.Y.; Abdulagatov, I. Compressed liquid density measurements of dimethyl ether with a vibrating tube densimeter. J. Chem. Thermodyn. 2011, 43, 1371–1374. [Google Scholar] [CrossRef]
- Qiu, G.S.; Meng, X.Y.; Wu, J.T. Density measurements for 2,3,3,3-tetrafluoroprop-1-ene (R1234yf) and trans-1,3,3,3-tetrafluoropropene (R1234ze(E)). J. Chem. Thermodyn. 2013, 60, 150–158. [Google Scholar] [CrossRef]
- Yang, J.; Meng, X.Y.; Wu, J.T. Liquid density of n-pentene, n-hexene, and n-heptene at temperatures from 283.15 to 363.15 K and pressures up to 100 MPa. J. Chem. Eng. Data 2018, 63, 2280–2289. [Google Scholar] [CrossRef]
- Jia, X.Y.; Yang, J.; Wu, J.T. Compressed liquid densities of binary mixtures of difluoromethane (R32) and 2,3,3,3-tetrafluoroprop-1-ene (R1234yf) at temperatures from (283 to 363) K and pressures up to 100 MPa. J. Chem. Thermodyn. 2020, 141, 105935. [Google Scholar] [CrossRef]
- Wang, J.; Li, Z.H.; Meng, X.Y.; Wu, J.T. Liquid densities of n-octane, ethylcyclohexane and their binary mixtures {(x) n-octane) + (1 − x) ethylcyclohexane} at temperatures from (283 to 363) K and pressures up to 60 MPa. J. Chem. Thermodyn. 2023, 186, 107121. [Google Scholar] [CrossRef]
- Banipal, T.S.; Garg, S.K.; Ahluwalia, J.C. Heat capacities and densities of liquid n-octane, n-nonane, n-decane, and n-hexadecane at temperatures from 318.15 K to 373.15 K and at pressures up to 10 MPa. J. Chem. Thermodyn. 1991, 23, 923–931. [Google Scholar] [CrossRef]
- Susnar, S.S.; Budziak, C.J.; Hamza, H.A.; Neumann, A.W. Pressure dependence of the density of n-alkanes. Int. J. Thermophys. 1992, 13, 443–452. [Google Scholar] [CrossRef]
- Troncoso, J.; Bessières, D.; Cerdeiriña, C.A.; Carballo, E.; Romanı, L. pρTx data for the dimethyl carbonate + decane system. J. Chem. Eng. Data 2004, 49, 923–927. [Google Scholar] [CrossRef]
- Segovia, J.J.; Fandiño, O.; López, E.R.; Lugo, L.; Martín, M.C.; Fernández, J. Automated densimetric system: Measurements and uncertainties for compressed fluids. J. Chem. Thermodyn. 2009, 41, 632–638. [Google Scholar] [CrossRef]
- Valencia, J.L.; González-Salgado, D.; Troncoso, J.; Peleteiro, J.; Carballo, E.; Romaní, L. Thermophysical characterization of liquids using precise density and isobaric heat capacity measurements as a function of pressure. J. Chem. Eng. Data 2009, 54, 904–915. [Google Scholar] [CrossRef]
- Quevedo-Nolasco, R.; Galicia-Luna, L.A.; Elizalde-Solis, O. Compressed liquid densities for the (n-heptane + n-decane) and (n-octane + n-decane) systems from T = (313 to 363) K. J. Chem. Thermodyn. 2012, 44, 133–147. [Google Scholar] [CrossRef]
- Nysewander, C.S.; Sage, B.H.; Lacey, W.N. Phase equilibria in hydrocarbon systems the propane-n-butane system in the critical region. Ind. Eng. Chem. Res. 1940, 32, 118–123. [Google Scholar] [CrossRef]
- Sage, B.H.; Lavender, H.M.; Lacey, W.N. Phase equilibria in hydrocarbon systems: Methane-decane systems. Ind. Eng. Chem. 1940, 32, 743–747. [Google Scholar] [CrossRef]
- Snyder, P.S.; Winnick, J. Pressure, volume, and temperature properties of liquid n-alkanes at elevated pressures. In Proceedings of the 5th Symposium on Thermophysical Properties; ASME: New York, NY, USA, 1970; pp. 115–129. [Google Scholar]
- Peña, M.D.; Tardajos, G. Isothermal compressibilities of n-alkanes and benzene. J. Chem. Thermodyn. 1978, 10, 19–24. [Google Scholar] [CrossRef]
- Gates, J.A.; Wood, R.H.; Cobos, J.C.; Casanova, C.; Roux, A.H.; Roux-Desgranges, G.; Grolier, J.P.E. Densities and heat capacities of 1-butanol + n-decane from 298 K to 400 K. Fluid Phase Equilib. 1986, 27, 137–151. [Google Scholar] [CrossRef]
- Lemmon, E.W.; Bell, I.H.; Huber, M.L.; McLinden, M.O. NIST reference fluid thermodynamic and transport properties database (Refprop V10.0). In Standard Reference Data Program; National Institute of Standards and Technology: Gaithersburg, MD, USA, 2018. [Google Scholar]
- Fang, D.; Meng, X.Y.; Wu, J.T. Compressed liquid densities of binary mixtures of 1-butanol and diethylene glycol dimethyl ether from (283 to 363) K at pressures up to 100 MPa. J. Chem. Eng. Data 2017, 62, 2937–2943. [Google Scholar] [CrossRef]
 , Zúñiga-Moreno et al. [18];
  , Segovia et al. [35]; ☆, Valencia et al. [36]; ★, Fandino et al. [19];
  , Quevedo-Nolasco et al. [37]; +, Nourozieh et al. [20];
  , Yang et al. [24].
, Zúñiga-Moreno et al. [18]; , Segovia et al. [35]; ☆, Valencia et al. [36]; ★, Fandino et al. [19]; , Quevedo-Nolasco et al. [37]; +, Nourozieh et al. [20]; , Yang et al. [24].
, Yang et al. [24].
, Zúñiga-Moreno et al. [18]; , Segovia et al. [35]; ☆, Valencia et al. [36]; ★, Fandino et al. [19]; , Quevedo-Nolasco et al. [37]; +, Nourozieh et al. [20]; , Yang et al. [24].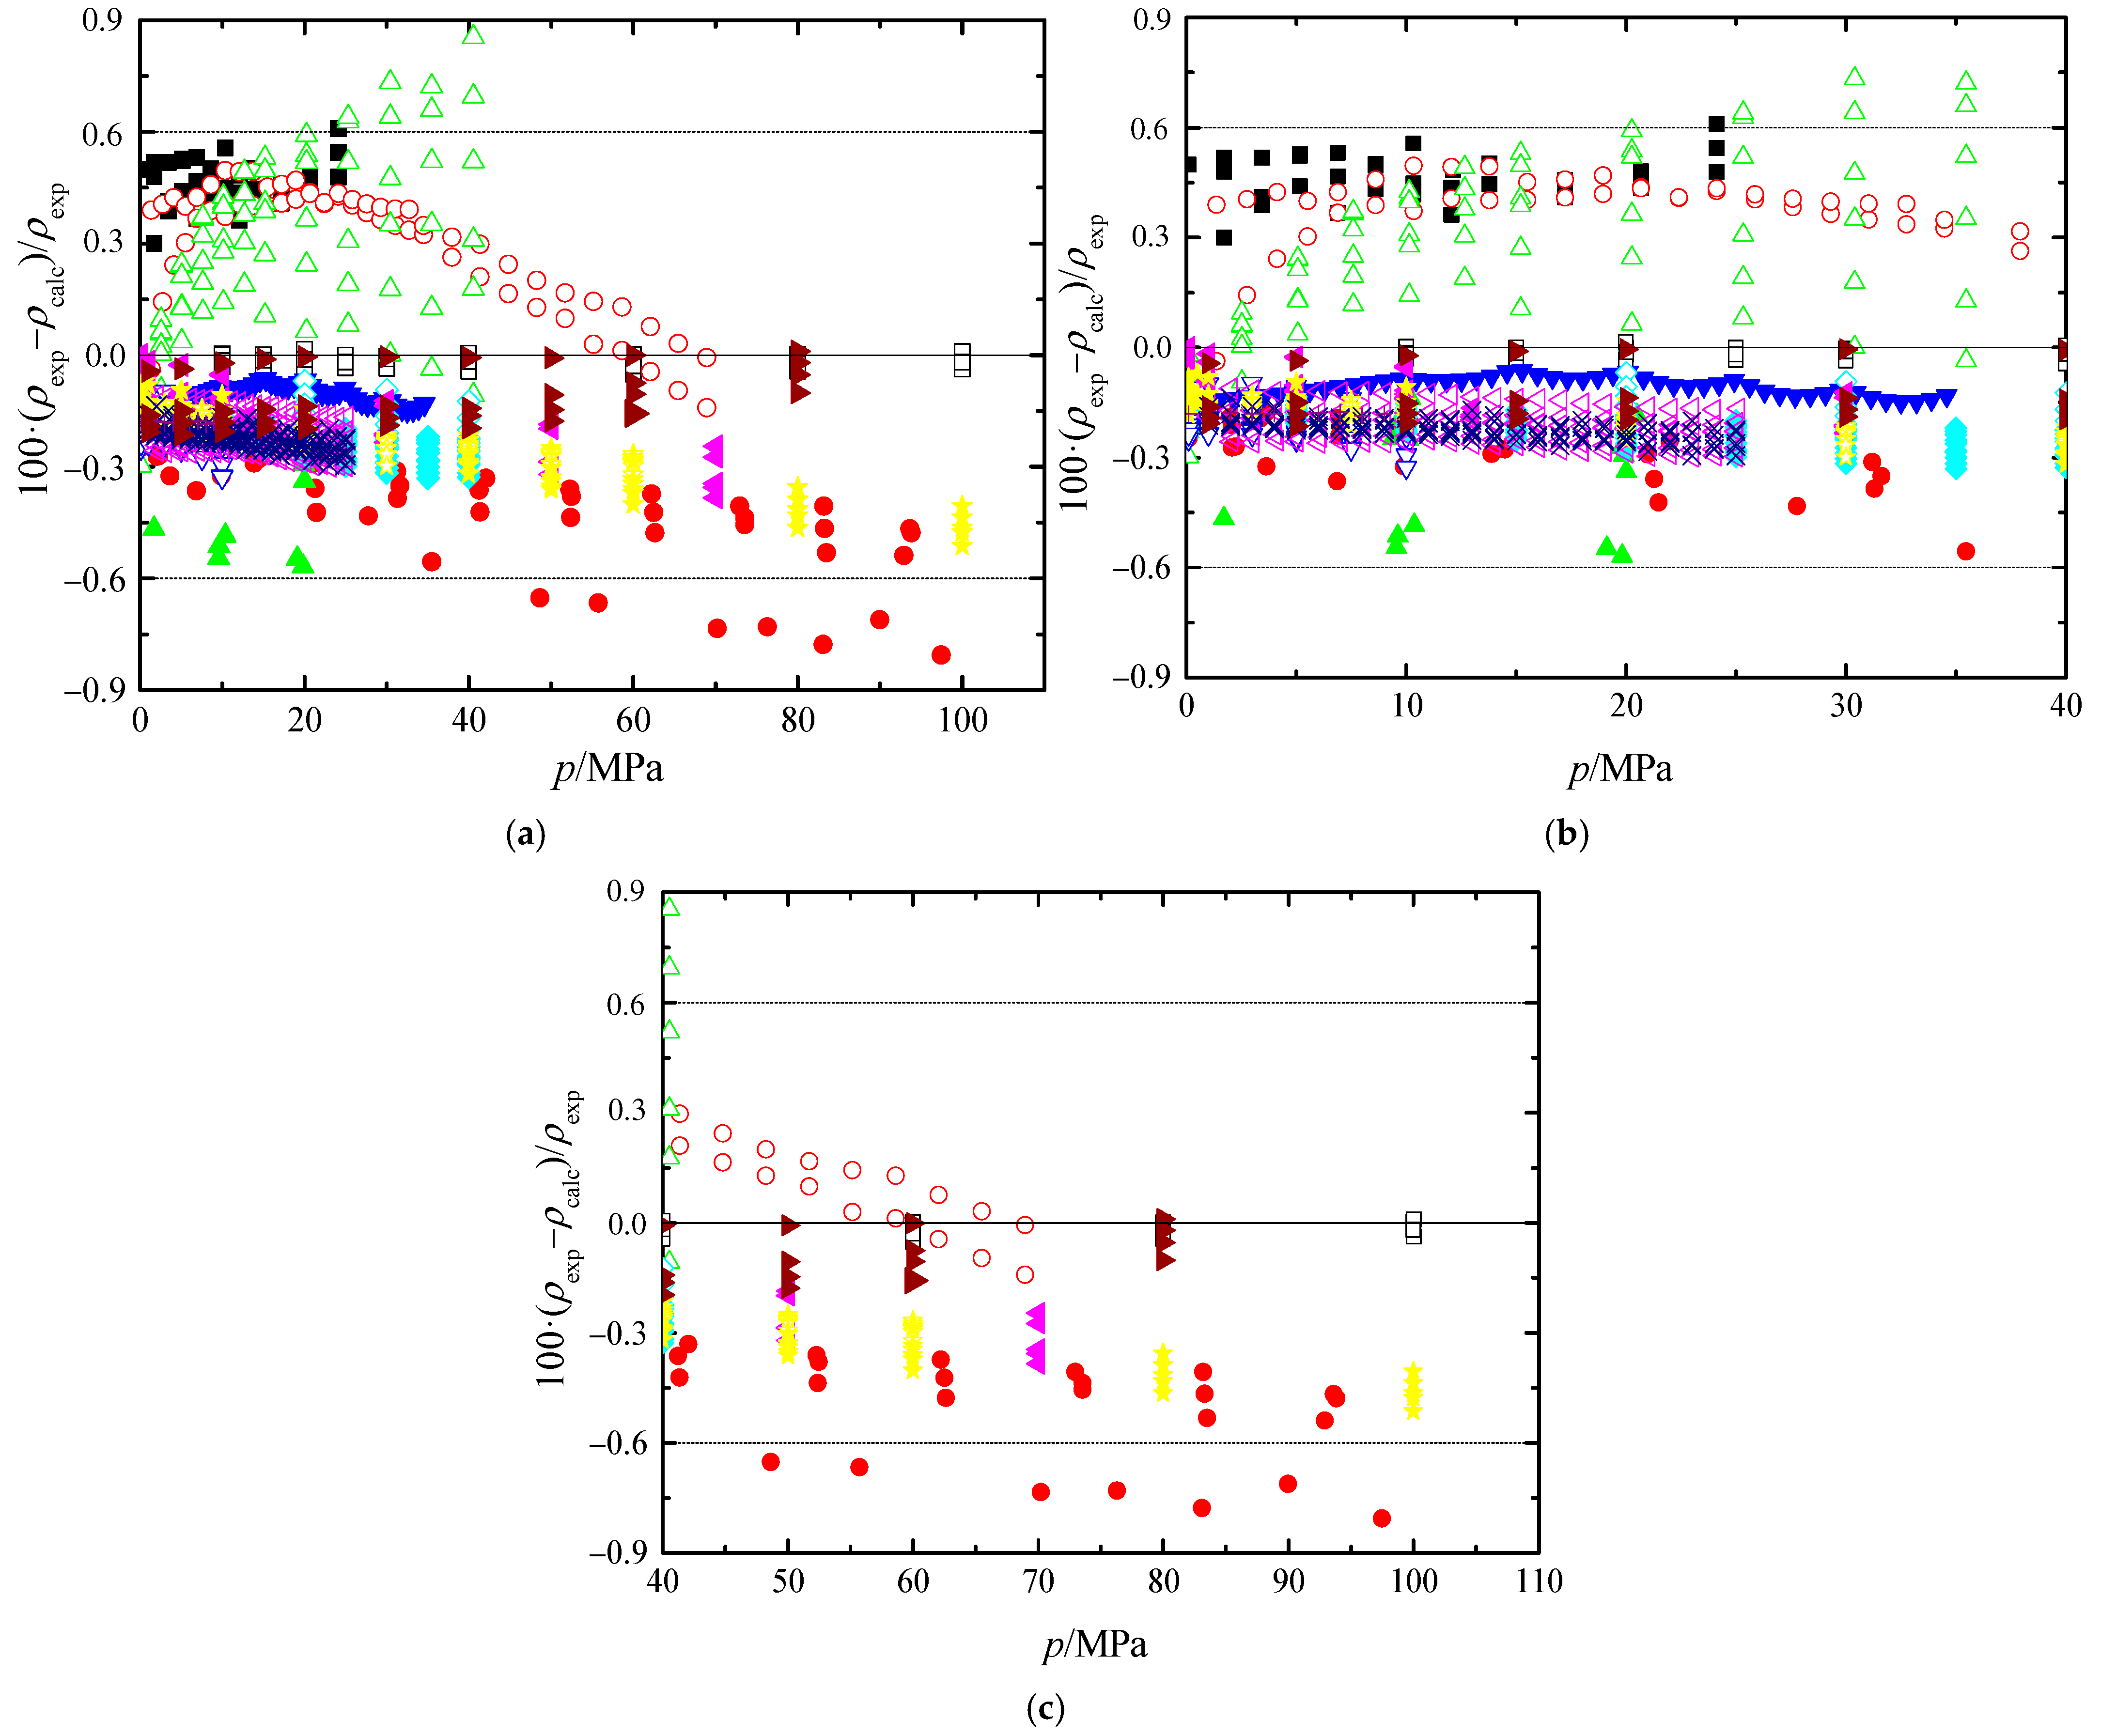
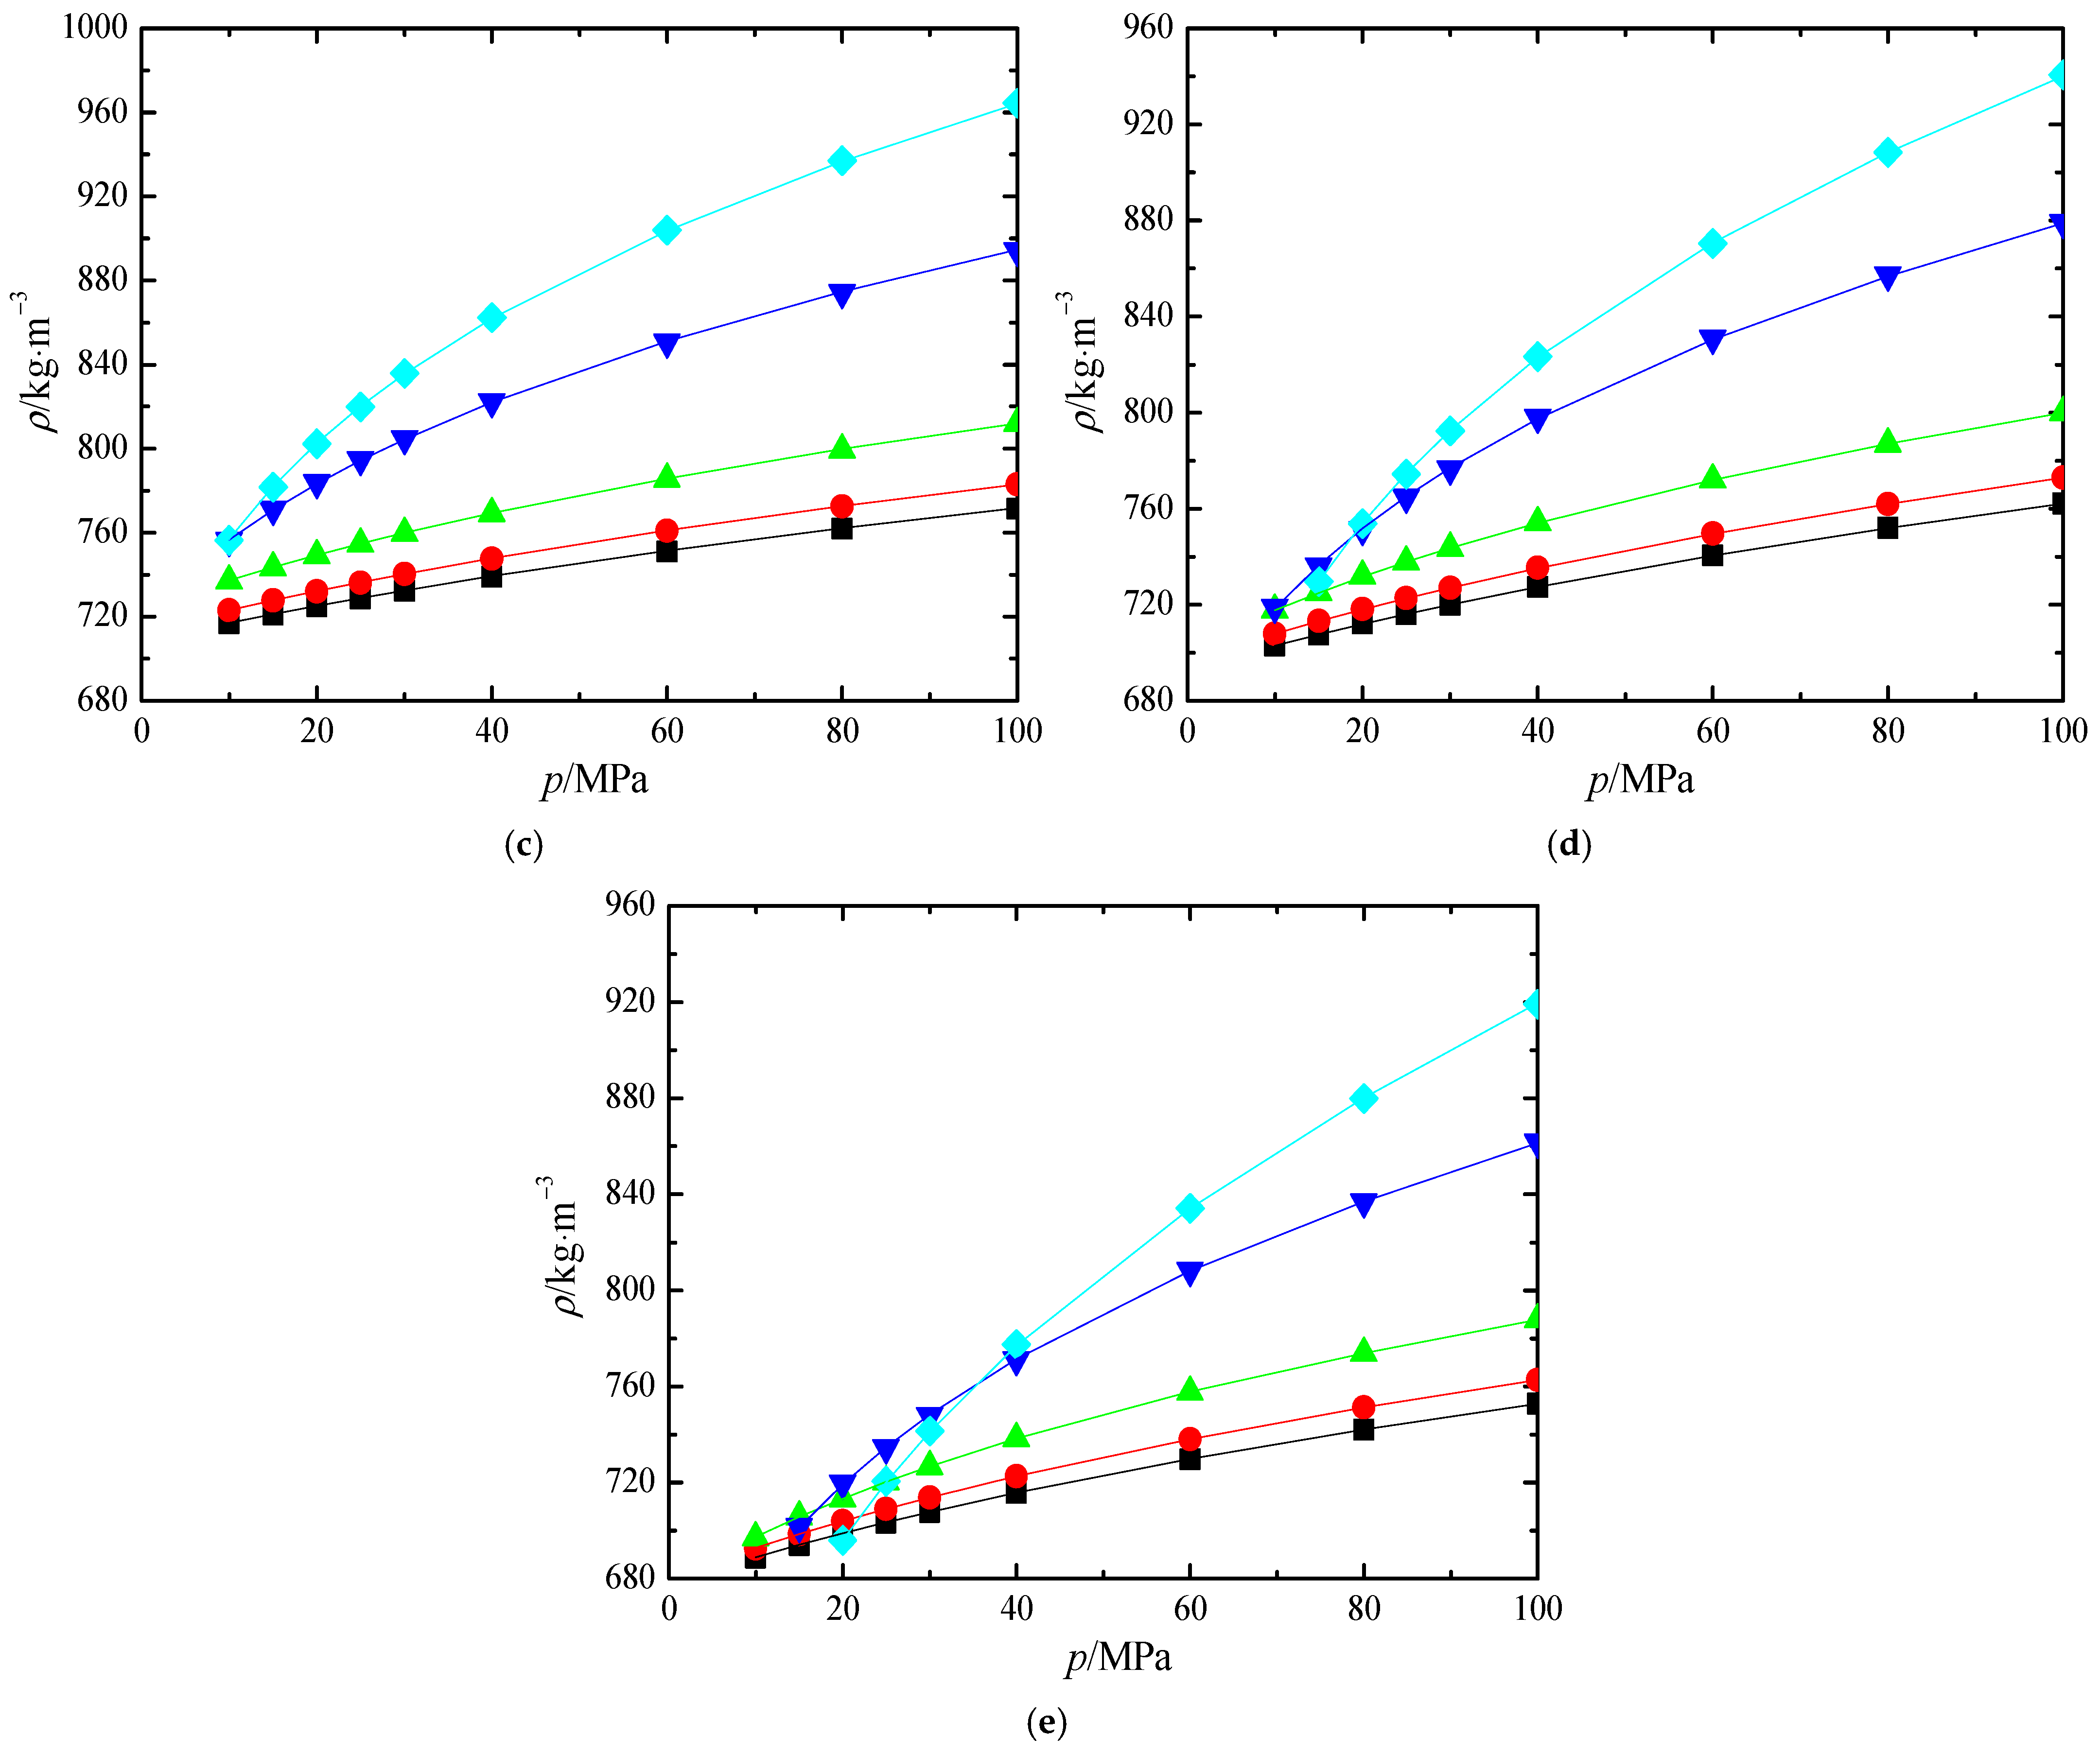
 , x1 = 0; ●, x1 = 0.2032; ▲, x1 = 0.4434; ▼, x1 = 0.7589; ◆, x1 = 0.8947. The solid curves represent the modified Tait Equation (1).
, x1 = 0; ●, x1 = 0.2032; ▲, x1 = 0.4434; ▼, x1 = 0.7589; ◆, x1 = 0.8947. The solid curves represent the modified Tait Equation (1).
, x1 = 0; ●, x1 = 0.2032; ▲, x1 = 0.4434; ▼, x1 = 0.7589; ◆, x1 = 0.8947. The solid curves represent the modified Tait Equation (1).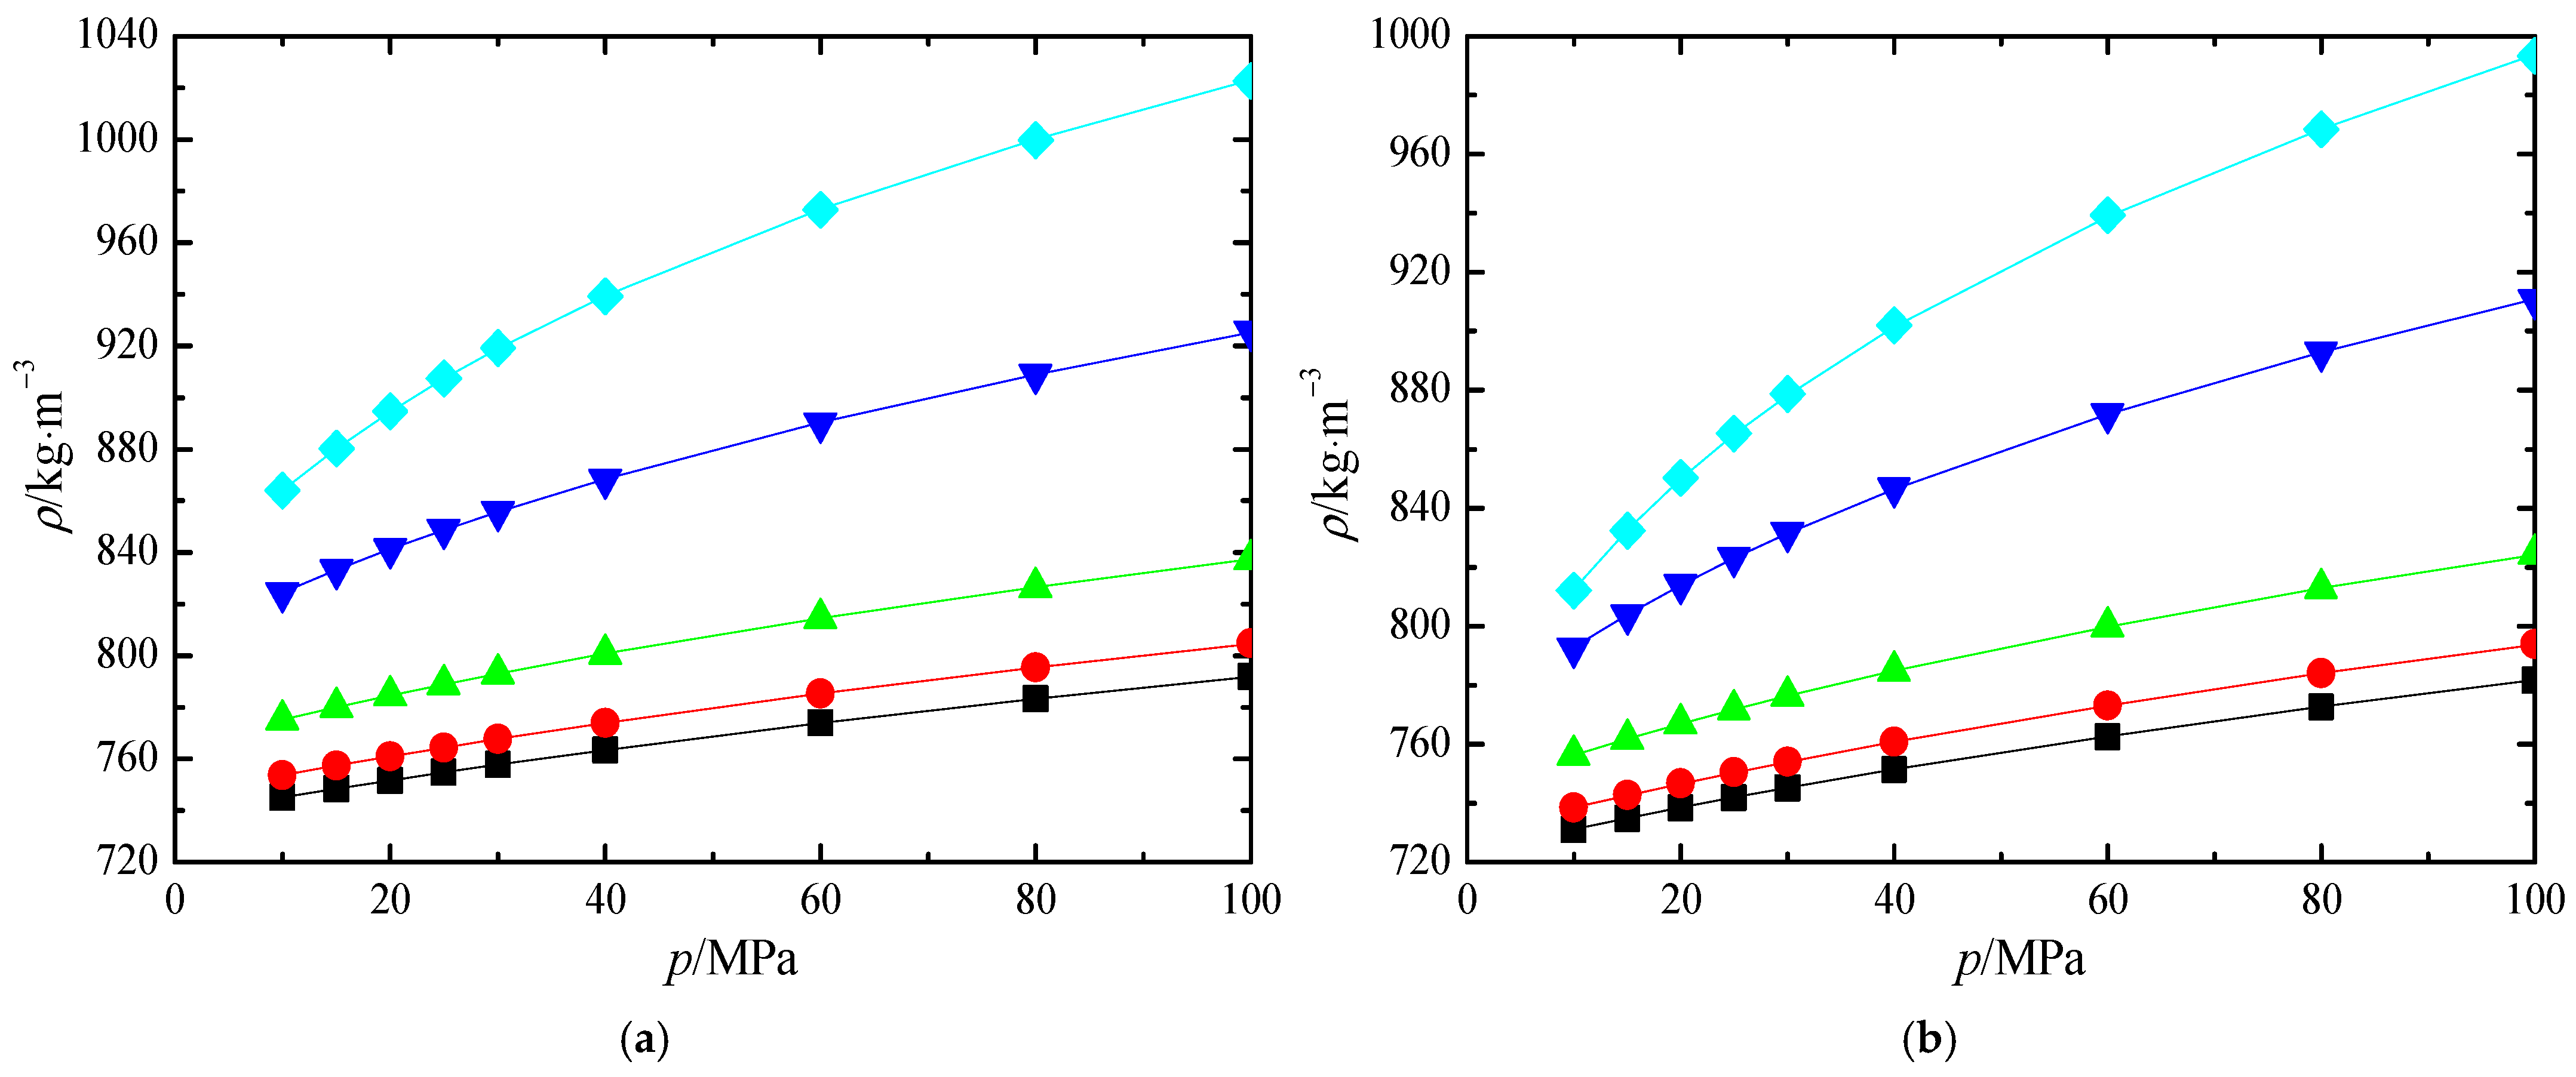
 , Cullick and Mathis [16];
  , Bessiéres et al. [17]; ●, Zúñiga-Moreno et al. [18]; △, Fandiño et al. [19]; ▲, Song et al. [11]; ▽, Kariznovi et al. [21]; ▼, Kandil et al. [22]; ☆, Zambrano et al. [23]; ★, Yang et al. [24].
, Cullick and Mathis [16]; , Bessiéres et al. [17]; ●, Zúñiga-Moreno et al. [18]; △, Fandiño et al. [19]; ▲, Song et al. [11]; ▽, Kariznovi et al. [21]; ▼, Kandil et al. [22]; ☆, Zambrano et al. [23]; ★, Yang et al. [24].
, Bessiéres et al. [17]; ●, Zúñiga-Moreno et al. [18]; △, Fandiño et al. [19]; ▲, Song et al. [11]; ▽, Kariznovi et al. [21]; ▼, Kandil et al. [22]; ☆, Zambrano et al. [23]; ★, Yang et al. [24].
, Cullick and Mathis [16]; , Bessiéres et al. [17]; ●, Zúñiga-Moreno et al. [18]; △, Fandiño et al. [19]; ▲, Song et al. [11]; ▽, Kariznovi et al. [21]; ▼, Kandil et al. [22]; ☆, Zambrano et al. [23]; ★, Yang et al. [24].
 , 15 MPa; ●, 20 MPa; ▲, 25 MPa; ▼, 30 MPa; ◆, 40 MPa; , 60 MPa; ►, 80 MPa;
  , 100 MPa. The solid curves represent the values calculated from Refprop 10.0 [43].
, 15 MPa; ●, 20 MPa; ▲, 25 MPa; ▼, 30 MPa; ◆, 40 MPa; , 60 MPa; ►, 80 MPa; , 100 MPa. The solid curves represent the values calculated from Refprop 10.0 [43].
, 100 MPa. The solid curves represent the values calculated from Refprop 10.0 [43].
, 15 MPa; ●, 20 MPa; ▲, 25 MPa; ▼, 30 MPa; ◆, 40 MPa; , 60 MPa; ►, 80 MPa; , 100 MPa. The solid curves represent the values calculated from Refprop 10.0 [43].

| Reference | x1 | T/K | p/MPa | Method | Expanded Uncertainty/kg∙m−3 |
|---|---|---|---|---|---|
| Cullick and Mathis [16] | 0.15–0.85 | 310–403 | 7–35 | VTD | 0.5 |
| Bessiéres et al. [17] | 0.15–0.84 | 308–368 | 20–40 | VTD | 0.2 |
| Zúñiga-Moreno et al. [18] | 0.05–0.97 | 313–363 | 1–25 | VTD | 0.2 |
| Fandiño et al. [19] | 0.30–0.95 | 283–398 | 10–120 | VTD | 0.7 |
| Song et al. [11] | 0.23–0.87 | 303–353 | 8–19 | MSB | 0.48 |
| Nourozieh et al. [20] | 0.07–0.37 | 373 | 1–6 | VTD | 1.0 |
| Kariznovi et al. [21] | 0.09–0.51 | 323 | 1–6 | VTD | 1.0 |
| Kandil et al. [22] | 0.21–0.73 | 313–410 | 3–76 | VTD | 2.0 |
| Zambrano et al. [23] | 0.30–0.95 | 283–393 | 10–100 | VTD | 1.8 |
| Yang et al. [24] | 0.60–0.87 | 303–373 | 1–80 | VTD | 0.6 |
| Chemical Name | Source | CAS No. | Molar Mass g/mol | Stated Mass Fraction Purity | Purification Method |
|---|---|---|---|---|---|
| CO2 | Jining Xieli Special Gas | 124-38-9 | 44.01 | >0.99999 | Freeze-pump-thaw cycle |
| n-Decane | Aladdin | 124-18-5 | 142.28 | >0.99 | none |
| Year | Author | Purity | Method | T/K | p/MPa | Uncertainty |
|---|---|---|---|---|---|---|
| 1940 | Nysewander et al. [38] | na | Volume measurements | 294–344 | 0.1–25 | na |
| 1940 | Sage et al. [39] | na | Volume measurements | 294–394 | 1–69 | na |
| 1970 | Synder et al. [40] | na | Brideman-type sylphon bellows piezometer | 298–358 | 0.1–656 | na |
| 1978 | Peña et al. [41] | >99 mol% | Piezometer | 298–333 | 0.1–41 | na |
| 1986 | Gate et al. [42] | 99.4 mol% | Two flow VTD | 298–368 | 0.1–20 | na |
| 1991 | Banipal et al. [32] | / | VTD | 318–373 | 0.1–10 | na |
| 1992 | Susnar et al. [33] | 99.6% | VTD | 294.35 | 0.1–35 | 0.02% |
| 2004 | Troncoso et al. [34] | 99 mol% | VTD | 283–328 | 0.1–40 | 0.1% |
| 2005 | Zúñiga-Moreno et al. [18] | >99% | VTD | 313–363 | 1–25 | 0.1% |
| 2009 | Segovia et al. [35] | 99% | VTD | 283–398 | 0.1–70 | 0.2% |
| 2009 | Valencia et al. [36] | 99.9% | VTD | 283–323 | 0.1–60 | 0.2% |
| 2012 | Quevedo-Nolasco et al. [37] | 99.7 mol% | VTD | 313–363 | 1–25 | 0.03% |
| 2013 | Nourozieh et al. [20] | 99 mass% | VTD | 323 | 0.1–10 | 0.3% |
| 2021 | Yang et al. [24] | 99.5 mass% | VTD | 303–373 | 1–80 | 0.2% |
| Parameters | x1 = 0 | x1 = 0.2032 | x1 = 0.4434 | x1 = 0.7589 | x1 = 0.8947 |
|---|---|---|---|---|---|
| A0/g·cm−3 | 0.86080 | 1.03703 | 1.40990 | −0.01853 | 4.40805 |
| A1/g·cm−3·K−1 | −8.51553 × 10⁻⁶ | −1.41571 × 10⁻³ | −4.63320 × 10⁻³ | 8.91860 × 10⁻³ | −3.40563 × 10⁻² |
| A2/g·cm−3·K−2 | −1.95868 × 10⁻⁶ | 2.03202 × 10⁻⁶ | 1.23117 × 10⁻⁸ | −2.61347 × 10⁻⁵ | 1.17519 × 10⁻⁴ |
| A3/g·cm−3·K−3 | 1.62432 × 10⁻⁹ | −2.33131 × 10⁻⁹ | −1.40789 × 10⁻¹⁰ | 1.73563 × 10⁻⁸ | −1.48211 × 10⁻⁷ |
| B0/MPa | 344.951 | 366.422 | 327.392 | 452.091 | 271.332 |
| B1/MPa·K−1 | −1.20993 | −1.41645 | −1.32612 | −2.32403 | −1.466625 |
| B2/MPa·K−2 | 1.09394 × 10⁻³ | 1.45102 × 10⁻³ | 1.36670 × 10⁻³ | 3.00725 × 10⁻³ | 1.98299 × 10⁻³ |
| C | 9.12134 × 10⁻² | 9.15440 × 10⁻² | 8.94176 × 10⁻² | 9.64531 × 10⁻² | 9.71727 × 10⁻² |
| σ/g·cm−3 | 3.456 × 10⁻⁵ | 1.112 × 10⁻⁴ | 1.401 × 10⁻⁴ | 4.567 × 10⁻⁵ | 4.183 × 10⁻⁵ |
| AAD/% | 0.028 | 0.013 | 0.017 | 0.044 | 0.042 |
| MAD/% | 0.075 | 0.033 | 0.040 | 0.065 | 0.059 |
Disclaimer/Publisher’s Note: The statements, opinions and data contained in all publications are solely those of the individual author(s) and contributor(s) and not of MDPI and/or the editor(s). MDPI and/or the editor(s) disclaim responsibility for any injury to people or property resulting from any ideas, methods, instructions or products referred to in the content. |
© 2024 by the authors. Licensee MDPI, Basel, Switzerland. This article is an open access article distributed under the terms and conditions of the Creative Commons Attribution (CC BY) license (https://creativecommons.org/licenses/by/4.0/).
Share and Cite
Jia, T.; Yang, J.; Yu, J. Determination of Compressed Liquid Densities for CO2 + n-Decane Using a Vibrating Tube Densimeter. Appl. Sci. 2024, 14, 9232. https://doi.org/10.3390/app14209232
Jia T, Yang J, Yu J. Determination of Compressed Liquid Densities for CO2 + n-Decane Using a Vibrating Tube Densimeter. Applied Sciences. 2024; 14(20):9232. https://doi.org/10.3390/app14209232
Chicago/Turabian StyleJia, Tao, Jinpeng Yang, and Jia Yu. 2024. "Determination of Compressed Liquid Densities for CO2 + n-Decane Using a Vibrating Tube Densimeter" Applied Sciences 14, no. 20: 9232. https://doi.org/10.3390/app14209232
APA StyleJia, T., Yang, J., & Yu, J. (2024). Determination of Compressed Liquid Densities for CO2 + n-Decane Using a Vibrating Tube Densimeter. Applied Sciences, 14(20), 9232. https://doi.org/10.3390/app14209232