Article

Changing the Position of the Vehicle’s Center of Gravity as a Result of Different Load Distribution

by
František Synák
1,* and
Eva Nedeliaková
2
1
Department of Road and Urban Transport, Faculty of Operation and Economics of Transport and Communications, University of Žilina, 01026 Žilina, Slovakia
2
Department of Railway Transport, Faculty of Operation and Economics of Transport and Communications, University of Žilina, 01026 Žilina, Slovakia
*
Author to whom correspondence should be addressed.
Appl. Sci. 2024, 14(20), 9328; https://doi.org/10.3390/app14209328
Submission received: 12 September 2024 / Revised: 9 October 2024 / Accepted: 11 October 2024 / Published: 13 October 2024

Abstract

:
Dynamical vehicle performances depend on its center of gravity’s position. It is necessary to determine this position as closely as possible. The current methods of determining the center of gravity’s position are either not sufficiently accurate or are very demanding in relation to finances, time and special equipment. At the same time, there is a lack of accurate data on the center of gravity’s position of current vehicles for further research. Therefore, the purpose of this study is to propose such a methodology of measuring the center of gravity’s position, including its height, which is accurate enough and has as low-demand measuring equipment as possible. Another purpose of this study is to obtain data on the change in the centers of gravity’s positions in different vehicles due to various load distributions. Extensive experimental measurements, according to the innovative methodology, were performed with five vehicles. The positions of the center of gravity were determined for various load distributions, and the results were analyzed in detail.

1. Introduction

The position of the center of gravity of a vehicle has a significant impact on its dynamics. Knowing its exact position is essential for various calculations and simulations regarding vehicle dynamics and sizing of individual vehicle parts.
The center of gravity has a direct impact on road safety, vehicle driving performances, stability of the vehicle, its parts wear, emission production, road destruction, driving comfort, dynamics of driving and many other aspects [1,2,3]. When the center of gravity is too close to the front axle, it may lead to its overloading, and the vehicle inclines to oversteer. When the center of gravity is too close to the rear axle, it may result in its overloading and cause the vehicle’s understeering [4,5]. Any axle’s overloading can cause excessive wear on its components or a sudden tire blowout, posing a risk of losing control to drive in a certain direction [6,7]. It can also lead to enormous tire wear, which is connected to increased production of particulate matter from tires while several policies endeavor to reduce such emissions from road transport [8,9]. The axle can be overloaded even without exceeding the vehicle’s load capacity as a result of wrong positioning of the center of gravity [10]. If a vehicle with front-wheel drive has its center of gravity too close to the rear axle, it means that the front, driving axle may have a highly reduced load. The reduction of load on the driving axle can decrease the vehicle’s ability to accelerate, which may lead to car accidents, for example when driving from a side road to a main road [11]. The position of the center of gravity also affects the vehicle’s driving performance when driving off-road and on surfaces with a lower friction coefficient [12]. In addition to the horizontal position of the center of gravity, it is necessary to know its height as well. When the center of gravity is too high, the vehicle tends to lean in the bends, which has an impact on driving comfort and safety as well, as it increases the risk of unwanted cargo movement across the loading area [13]. During deceleration and acceleration, the difference in dynamic weight of particular axle increases with a higher position of the center of gravity [14].
The center of gravity’s position is affected by both the vehicle’s design and the position of the engine or battery as well as the distribution of load and passengers [15]. Given that the position of the center of gravity is one of the fundamental parameters of any vehicle and has a direct impact on many of its characteristics, it is essential to know the center of gravity’s position and to have tools to achieve the easiest determination possible.
One of the goals of this study is to design and verify the improvement of measurement methodology for the center of gravity’s position, which can significantly reduce the requirements for equipment needed for using the method with a lifted axle while having sufficient measurement accuracy. To ensure that the method was substantially modified and the measuring tools and scales that had not been used yet were applied. To determine the weight of each axle, common available devices such as a weight scale pallet truck, or pallet scales with deviation of 0.5 kg, were proposed. The weight scale pallet truck or the pallet scales are commonly used for weighing goods. Thus, the scale of the pallet truck is calibrated and certified for measurement accuracy together with its verification protocol. Common axle scales which are used for this method have a measurement deviation of 5 kg, very occasionally 2 kg, and thus, the deviation of calculation of the center of gravity’s height is substantially higher. Apart from them, special laboratory scales are used, which have higher accuracy but are also of higher price and have substantially lower availability. For axle lifting, it is necessary to use expensive special laboratory devices. One of the contributions of this study is therefore the innovation of measurement methodology, which is simplified, less money-consuming, and more available. It also uses tools that have not been utilized until now. What is more, a significant benefit of this method is the determination of the center of gravity’s position in vehicles with an electric motor, plug-in hybrids specifically, since these vehicles have a completely different position of the center of gravity due to their construction compared to the currently most common types of vehicles with an internal combustion engine. After determining the spring characteristics and tire deformation, which can be determined by measuring the body drop depending on the weight added, it is possible to calculate the change in the center of gravity even without further experimental research. However, it is necessary to know the center of gravity’s position of the empty vehicle. Without experimental measurements, the position of the center of gravity after additional load added can be determined by the calculations or various software and online calculators designed to assess the change in the center of gravity’s position due to different load distributions. Thus, the data may be used as input values for software in this field.
The second goal of the article is to verify the proposed methodology and obtain data on the position of the centers of gravity of several vehicles. There were five vehicles chosen for the experimental measurements. The first one was a hatchback, a main representative of frequently occurring vehicles in road transport. The second was a sport utility vehicle (SUV). Their centers of gravity’s positions were determined without a load, with a load placed in the vehicles, and with a load placed in the roof box. A significant contribution of this study is to determine the impact of cargo distribution in the vehicles on their center of gravity’s position based on experimental measurements. The third vehicle was with an electric motor, and the fourth one was a plug-in hybrid. The fifth vehicle was a light commercial vehicle. Vehicles 1, 2, and 5 were selected to match the most common parameters, such as dimensions and weights, of vehicles in road traffic, ensuring that the results are applicable in the broadest context [16]. Vehicles 3 and 4 (electric vehicle and plug-in hybrid) represent the emerging trend in the composition of the vehicle fleet since the alternative vehicles are becoming more frequent [17]. At the same time, it will be possible to compare Vehicles 2 and 4, as they are very similar, both are Kia Sportage but with different drives (Vehicle 2 has an internal combustion engine and Vehicle 4 is a plug-in hybrid). The data are then analyzed in detail. The data gained by experimental measurements will be able to be used as input data for modeling in the area of vehicle dynamics. Furthermore, the data can be used for comparison of the results from modeling. Currently, data obtained only by estimation are mainly used. The article fills a gap in the field of more accessible and accurate measurement methodology and at the same time provides data obtained by experimental measurements.
The article is divided into five parts. The introduction is followed by a literature review. The literature search shows the need to innovate the measurement methodology as well as the need to add the missing data on the position of the center of gravity obtained based on experimental measurements. The third part of the article is concerned with the methodology. The general methodology is presented first, and then the applied methodology for specific experimental measurements is presented. The results of the measurements, discussed with the results of other authors, are presented in the previous section. The last part of the article is the conclusion.

2. Literature Review

Publication [18] observed the impact of the center of gravity’s position on braking performances. The authors informed that when increasing the inequality of the axle load and the center of gravity’s position with the same vehicle mass, braking deceleration decreases and braking distance lengthens. Such similar results are also shown in Ref. [19]. Assessing the impact of the center of gravity’s position of a semi-trailer truck set on the braking safety indicators is given in the publication [20], and the authors observed a large impact of the center of gravity’s position on braking performances as well. Increasing the center of gravity’s position and the inequality in load distribution on the axles led to an excessive reduction in the load of the semi-trailer while braking, to its wheel blocking, to a lengthening of braking distance, and to a significant decrease in braking deceleration. The authors of publication [20] concluded that the ABS system mitigated this negative phenomenon, but still not removed it. Thus, the center of gravity’s position has a direct impact on the vehicle’s ability to decelerate. Therefore, when reconstructing a car accident or simulating, it is necessary to take into consideration the center of gravity’s position, so it must be determined properly.
If the position of the center of gravity is too high, it may cause the vehicle to overturn while bending or driving on the inclined road [21,22,23]. According to the National Highway Traffic Safety Administration [24], rollover accidents account for approximately 91.4% of class in on-crash fatal and harmful traffic accidents. As follows from the mentioned publication as well as from other literature [25,26,27], vehicle dynamics are affected mostly by the position of the vehicle’s center of gravity. Thus, determining and knowing the center of gravity’s height as precisely as possible is an important tool for understanding the vehicle dynamics.
To determine the height of a center of gravity, either estimation based on modeling or experimental measurements can be used. Based on the literature [28,29,30,31], it may be concluded that research of vehicle dynamics is performed predominantly by modeling, and this leads to several simplifications [32]. However, quality and accuracy of modeling depend directly on the accurately determined position of the center of gravity [33]. In Ref. [34], the center of gravity’s height is estimated via the improved You Only Look Once algorithm and AdaBoost regression is proposed by relying on roadside sensors. In this case, firstly, a vehicle is identified by sensors and machine learning with 97.59% accuracy, and then the center of gravity’s height is estimated after being compared to the database of vehicles and their center of gravity’s heights, with 94.64% accuracy according to the authors. However, this publication only operates with the vehicles alone, and it does not take into consideration the actual vehicle load, presence of passengers, or cargo distribution, which are significant factors that affect the height of a center of gravity. Publication [35] describes a simplified dynamic model of a vehicle used for estimating the center of gravity’s height that considers the revolutions of both front and rear wheel as well as the speed of the vehicle itself, and the suspension and tire parameters were considered insignificant. The suspension and tire parameters are not considered when estimating the center of gravity’s position also in publication [36], and the authors to estimate the center of gravity’s height only require that the vehicle be longitudinally and/or vertically excited. Like in the method described in publication [35], the calculations required the revolution of both front and rear wheel as well as the speed of the vehicle itself. The method for estimating the center of gravity’s position, which also takes into consideration the tire parameters, is described in Ref. [37], in which the authors assess the relation between the tire vertical load transfer and the center of gravity’s height and immediate radius of the tire. Moreover, a Kalman-filter-based estimator was designed to simultaneously identify the center of gravity’s height of a vehicle and the unknown nominal tire effective radius. Parameters and tire load are used for estimating the center of gravity’s position also in publication [38], and it is necessary to have intelligent tires with a load sensor implemented in to calculate the position of the center of gravity [39,40,41]. Ref. [42] focuses on the issue of estimating the center of gravity’s position while using the data from the tires as well. Such estimation is, however, related to several limitations, and the misestimation of the center of gravity’s position using the above-mentioned method can reach up to 30% [43]. To estimate the position of the center of gravity, the method of total least squares is used [44]. The authors of Ref. [45] first estimated the weight of a vehicle based on the dynamic model of driving, and then, after estimating the weight and dynamic rolling model, they estimated the height of the center of gravity. As also mentioned in Ref. [46], estimating the position of the center of gravity by using this method is only possible in a certain range of accuracy, depending on many factors and the accuracy of other estimations. The authors of publication [47] focused on determining the center of gravity’s height via experimental measurements, and they designed and used a device for measuring the moments of inertia of a vehicle. They were inspired by similar devices, such as “VIMM” [48], which can record, besides the moments of inertia, the center of gravity’s position of vehicles in all axes, the vehicle mass, the moments of inertia towards the center of gravity as well as products of inertia, and “VIMF” [49]. “VIMF” can determine the same values as “VIMM” by using a principle of physical pendulum, and this leads to a change in oscillation period during the measurements. However, due to the motion of working fluids and vehicle suspension, the differences in the center of gravity’s height reached more than 20% under the same conditions in each measurement [47]. Another method of experimental measurements is the measurements that consist of two steps. In the first step, the weight applied on the axles in the horizontal position is determined. Then, the weight applied to one of the axles when it is lifted is determined [50]. To ensure the highest accuracy possible, it is appropriate to use this method when the fuel, washer fluid, and other tanks are empty or full, as also follows from Ref. [51]. On the other hand, the disadvantage of this method can be high requirements for measuring devices, such as measuring stand and, predominantly, the scales with sufficient load capacity that equals the minimum axle load of a vehicle—at least 1500 kg—while at the same time having the highest accuracy possible, with a measurement deviation of less than 1 kg, which all increase the costs for equipment as well as the requirements for operation [52,53]. It is also necessary for this method to have lifting equipment for the axle, for instance a pillar jack since, as mentioned in publication [54], the angle between the axles should be at least 15°, which also increases the requirements for the equipment.
Many publications [55,56,57,58,59] consider only an empty vehicle. Publications in which the load in the vehicles is also considered are almost non-existent.
Experimental measurements with a roof box, since as also mentioned in one of the few publications in which the experimental measurements with the roof box were performed [60], the method of least squares estimated the center of gravity’s height with a deviation higher than 10%, which is insufficient accuracy. As identified in the text above, a measurement methodology which is sufficiently accurate and relatively less demanding in time, material, and expenses is highly needed. At the same time, the highest possible accuracy of data on the center of gravity’s position at various load distributions is very much required for its further use.
For better display, the most significant publications in the field of measuring and assessing the center of gravity of vehicles are summarized in Table 1.

3. Materials and Methods

3.1. Proposal of Measurement Methodology

As can be seen from the review of the literature, for many calculations in the field of vehicle dynamics, as well as loads and other objects, it is necessary to know the exact position of their center of gravity. At the same time, currently, the position of the center of gravity is either estimated with large deviations and simplifications or is determined experimentally with expensive devices and equipment. In the next part of this article, a significantly innovative methodology for finding the center of gravity will therefore be presented.
To calculate the position of the center of gravity in the horizontal direction, it is necessary to know as precisely as possible the wheelbase of the axles and the instantaneous weights falling on the axles of the vehicle. The wheelbase, i.e., the distance between the centers of the wheels of two adjacent axles, can be determined from the technical documentation of a specific vehicle or by measuring with ordinary length scales. The instantaneous weight falling on the individual axles of the vehicle—or in the case of the need to calculate the position of the center of gravity in the horizontal transverse direction, the instantaneous weight falling on the individual sides of the vehicle—is determined by weighing. Common axle car weight scales have insufficient measurement accuracy—of around 5 kg—and special laboratory scales with higher measurement accuracy are financially very demanding. For the methodology presented in this article, it is suggested to use a pallet truck with a scale. The pallet truck with scale is a scale with a weighing division of 0.5 kg. Pallet trucks with scales used in logistics and in stores are regularly calibrated and their measurement accuracy verified. The procedure for determining the position of the vehicle’s center of gravity in the horizontal direction is as follows:
  • Ensuring that vehicle tanks—fuel tank, washer fluid tank, etc.—are either full or empty. Ensuring that any cargo in the vehicle cannot move freely.
  • Ensuring correct tire pressure. The correct tire pressure is prescribed by the manufacturer.
  • Determination of the wheelbase value from the vehicle’s technical documentation or by measuring the distance between the wheel centers of adjacent axles.
  • Selection of suitable pallets, prisms, beams, grates, or thick boards strong enough to support the weight of the vehicle.
  • Check the weighing accuracy of the pallet truck with a scale. Verification of the calibration sheet of the pallet truck with a scale and other technical documentation. Checking the accuracy of weighing using weights with a known weight. Instead of a pallet truck with a scale, pallet scales can also be used if they have a weighing division of 0.5 kg or less.
  • Determination of the weight of pallets, prisms, beams, grates, or thick boards to be stored under individual vehicle axles.
  • Positioning the vehicle on pallets, prisms, grates, beams, or thick boards. Let there be a pallet truck with a scale or pallet scales under one of the axles. In that case, there are pallets, prisms, grates, beams, or thick boards between the pallet truck or pallet scale and the wheels of the vehicle. If there are two pallet trucks with scales or pallet scales available, let them be stored under both axles.
  • For the most accurate measurement, it is necessary that the wheels of the front and rear axles are in a horizontal position. Horizontality is also required between the right and left sides of the vehicle. It is advisable to check the horizontality only after the vehicle has been positioned, as deformations of the base may occur. The level can be checked using a spirit level. With a flat surface, horizontality can also be measured as the distance between the lower part of the wheel and the surface, i.e., the floor.
  • Measurement of the weight falling on one of the axles and subsequently on the other axle. If two pallet trucks are available, the weights are determined faster.
  • Measurements of axle weights must be repeated and deviations between individual measurements must be evaluated. To determine the accuracy of the measurements, it is necessary to use the available known statistical methods. Deviations between measurements arise mainly due to failure to maintain the horizontality of the axles during measurements. The levelness must be checked before each weight measurement. If the weighing is carried out with a person or persons in the vehicle, it is necessary that the persons are in the same position and body position every time. The accuracy of the measurement can also be verified by adding a known weight to the vehicle and assessing the difference in the weights of an empty vehicle and a vehicle with a known weight.
  • After determining the weight falling on the axles and the axle wheelbase, the distance of the center of gravity from the front axle is calculated:
L 1 = m 2 . L m
where:
L1 is the distance of the center of gravity from the front axle (m)
m2 is the weight applied to the rear axle (kg)
L is the axle wheelbase (m)
m is the vehicle total mass (kg)
The total mass was calculated through addition of the weights applied to the front and rear axle. Likewise, it is also possible to calculate the distance of the center of gravity from the rear axle:
L 2 = m 1 . L m
where:
L2 is the distance of the center of gravity from the front axle (m)
m1 is the mass applied to the front axle (kg)
L is the axle wheelbase (m)
m is the vehicle total mass (kg) [63]
Similarly, it is possible to calculate the position of the center of gravity in the horizontal transverse direction.
12.
After determining the position of the center of gravity in the horizontal direction, it is also possible to calculate the height of the center of gravity. To calculate the height of the center of gravity, it is necessary to know the difference between the weight of the axles in the plane and the weight of the axles when one of the axles is lifted.
13.
The lifting of one of the axles can be ensured by gradually supporting it by other pallets, prisms, grates or thick boards, according to availability. The weight of the underlying material must be subtracted from the weight of the axle. The lifting angle is as large as possible, but one that does not yet cause visible deformation of the suspension, damping, and tires. After noticing the deformation of suspension, damping or tires, it is necessary to slightly reduce the angle of lift of the axle. The second option is to ensure suspension and damping with stops so that it does not deform. The third option is to record the amount of suspension deformation and then take it into account when calculating the height of the center of gravity.
14.
After lifting one of the axles, it is necessary to determine the weight of one of the axles. Depending on the circumstances, the weight of the axle is determined for which it is easier. If possible, it is advisable to find out the weight of both axles for the sake of greater accuracy, but it is not necessary.
15.
While determining the weight of an axle or both axles, the vehicle must not be braked. There must be a plane under all wheels to prevent the vehicle from moving when the vehicle brakes are released. Measurements cannot be performed on an inclined plane, as it would be necessary to derive braking forces or the need to otherwise secure the vehicle against movement—for example, with wedges.
16.
Determination of the axle’s lift height. A length gauge is needed to determine the lift height of one of the axles. The lifting height of one of the axles needs to be determined as precisely as possible. It is recommended to take measurements on both sides of the vehicle.
17.
In the same way as during measurements in the plane, to verify the accuracy of the measurement, it is necessary to repeat the measurements with the axle raised in order to verify the measurement results. To determine the accuracy of the repeated measurement, it is advisable to use known statistical methods.
18.
After determining the angle of lift of the vehicle and differences in weight on any axle, the height of the center of gravity is calculated as follows:
h c = m 1 m 1 * · L · L 2 h d 2 m · h d + r
where:
hc is the height of the center of gravity (m)
m1 is the mass applied to the front axle in the plane (kg)
m1* is the mass applied to the lifted front axle (kg)
L is the axle wheelbase (m)
hc is the height of lifting of the front axle against the rear axle (m)
m is the vehicle’s total mass (kg)
r is the wheel radius (m)
hd is the height of the lifted axle (m) [64]

3.2. Practical Verification of Measurement Methodology

Due to the need to verify the proposed methodology of measurement and data acquisition, extensive experimental measurements were also carried out according to the proposed methodology.
The measurements’ objective is to determine the center of gravity’s position of two different vehicles with a various load distribution. The vehicles’ technical parameters are given in Table 2.

3.3. Measurements with Hatchback

As mentioned above, the measurements with the hatchback were focused on determining the change in the axle loads and in the height of the center of gravity due to different load distribution.
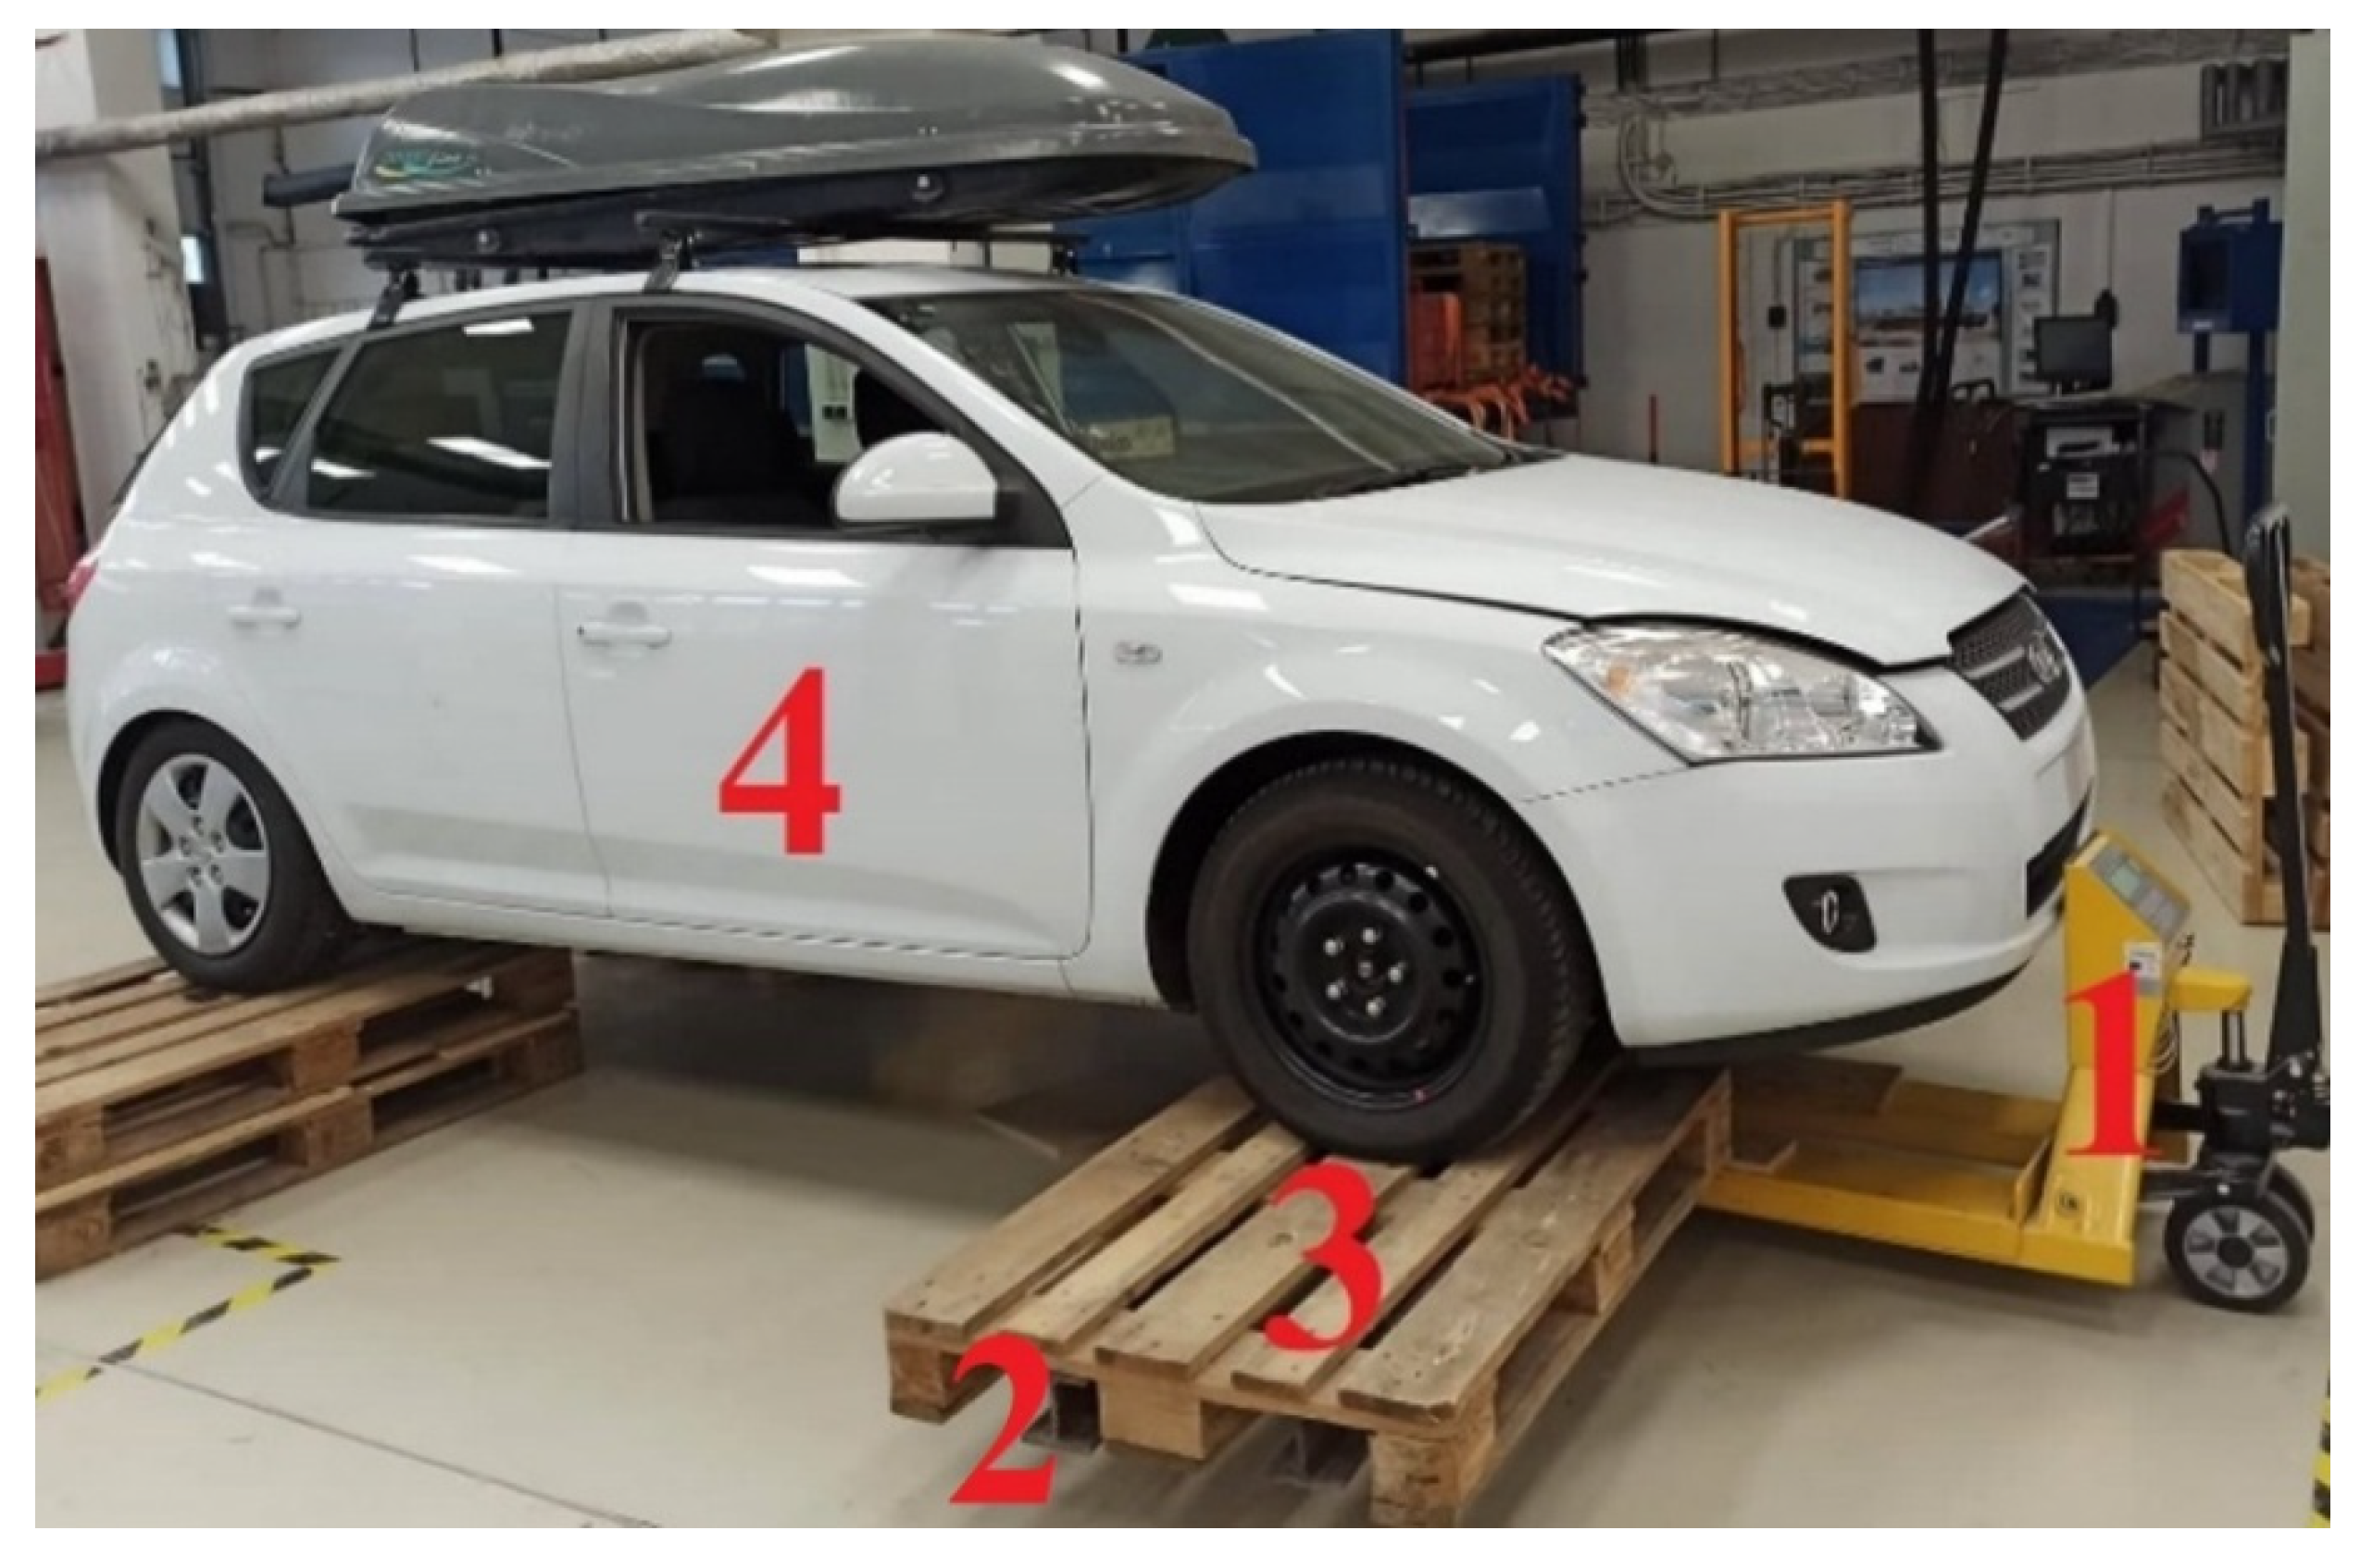
The weight applied to the front and rear axle was determined by newly proposed methodology via a pallet truck with a weight scale KPZ 52E-7/1, Figure 1. The deviation of weighing with the pallet truck is 0.5 kg [67].
The weight scale of the pallet truck (Position 1, Figure 1) carried two beams cross wisely (Position 2). The Euro pallets were located on the beams (Position 3).
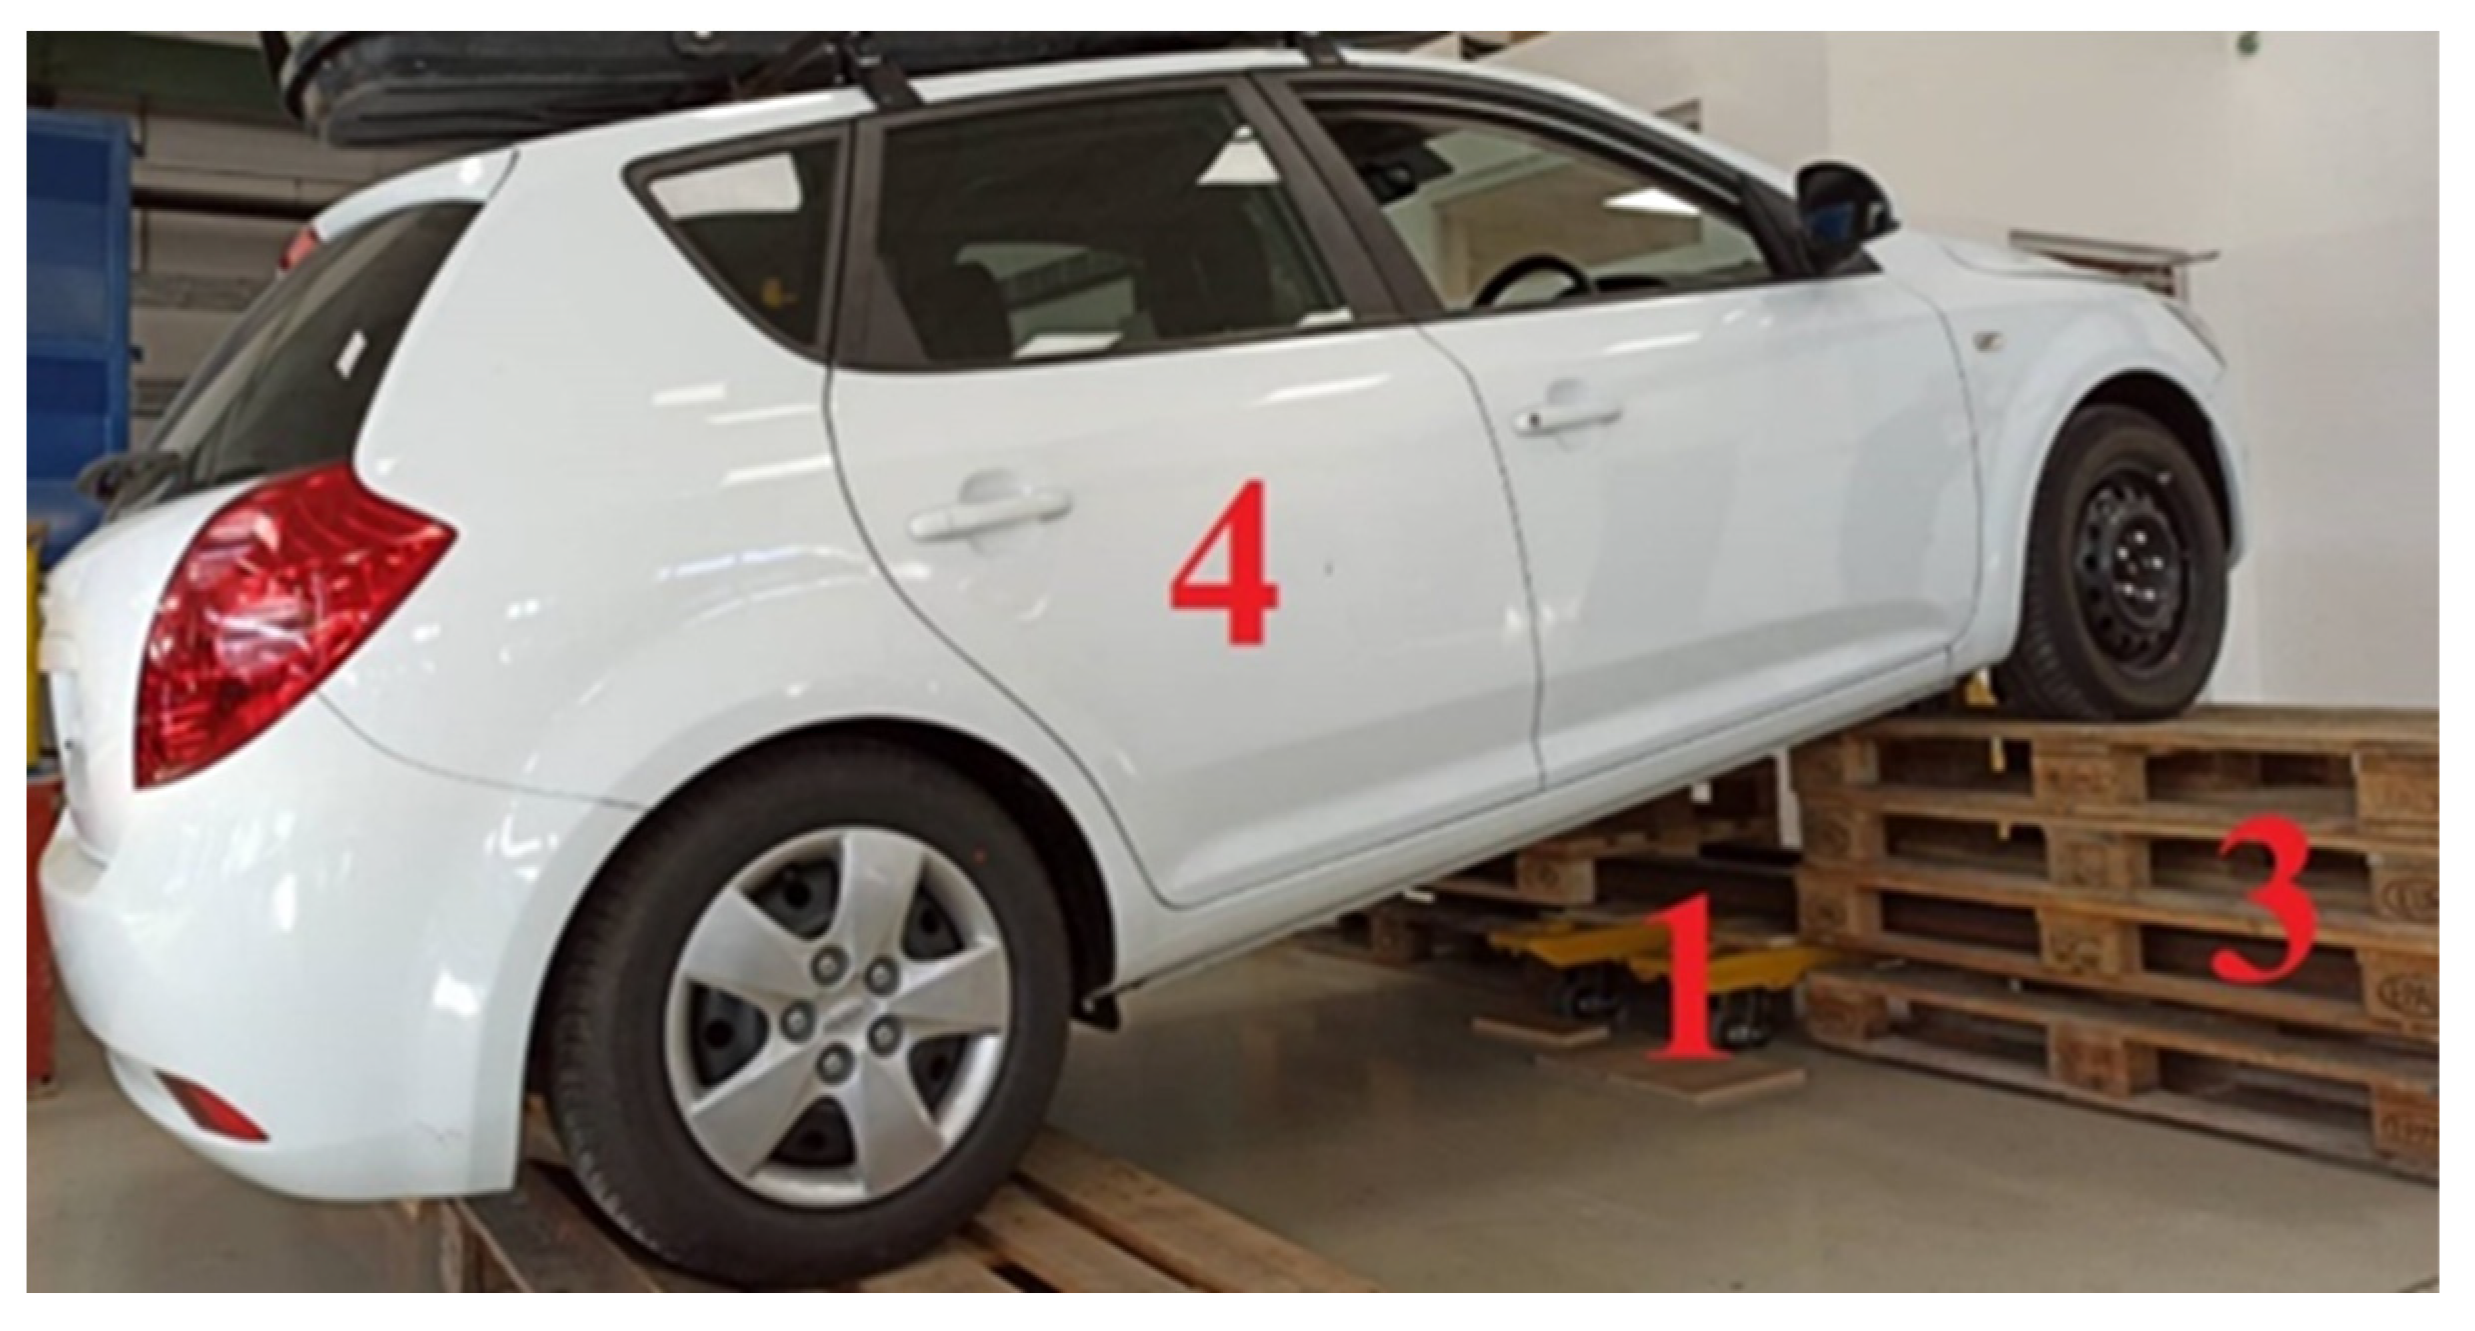
The principle of how the axle loads were determined by the weight scale pallet truck together with pallets is shown in Figure 2.
The vehicle (Position 4, Figure 2) was placed on the Euro pallets (Number 3) under which the beams were located (Number 2). Since it is a Euro pallet, its size is 800 mm x 1200 mm. The wheel centers are located as much as possible in the middle of the Euro pallet transversely, i.e., about 400 mm from the longer edge, in order to prevent deviations from occurring due to pallet bending on the beams. The weight scale truck was located under the front axle (Position 1). The front axle was lifted by the pallet truck and water level to the same height as the rear axle in order to maintain the same height between the top of the pallets. Then, the weight applied to the front axle, including the beams and pallets, was subtracted. The net weight applied to the front axle was determined by subtraction of the beams’ weight with the pallets. Such a procedure was further applied to the rear axle.
To determine the center of gravity’s height, it was necessary to determine the change in the weight applied to the front axle when lifted as well. The measurement with the lifted front axle of the hatchback is displayed in Figure 3.
The front axle was lifted higher by the euro pallets than the rear one (Figure 3, Position 3) and also by using the maximum lift of the pallet truck (Position 1). The height of the lifted front axle was determined as a difference between the distance of the front wheel and the distance of the rear wheel from the axle. The front axle was lifted by about 520 mm higher compared to the rear axle. This value was determined by observing and measuring. At a lower value, there was no sufficient difference in the weights when weighing horizontally and with a lifted rear axle. When the front axle was lifted by more than 630 mm, it led to a greater pressing of the rear suspension and rear wheel tires than when weighing horizontally, which has a negative impact on measurement accuracy and more corrections, or fixation of suspension’s position, would be needed. Thus, the value of lifting by 510 mm showed that at this value the highest accuracy and repeatability are reached. Such value is individual for each vehicle, and it is impossible to determine it generally, since it is necessary to determine it by observing and measuring on the basis of the stiffness of dampers, suspension and tires.
The measurements of the weight applied to the axles were performed as follows:
-
Empty vehicle, with a driver only, weighing 50.5 kg;
-
Load in the luggage compartment;
-
Load on the rear seats;
-
Load on the rear seats and in the roof box;
-
Load in the luggage compartment and the empty roof box;
-
Load on the rear seats and the empty roof box.
The load comprised 16 cartons with a total mass of 205 kg. One carton weighed 12.8 kg.
The weight of the roof box called MobyDick used for measuring was 11.5 kg. During the measurement with the load in the vehicle, in the luggage compartment, or on the seats and in the roof box, there were 11 cartons (i.e., 140.8 kg) in the vehicle, and 6 cartons (i.e., 76.8 kg) in the roof box.
After determining the weights applied to the front and rear axle with the vehicle in a plane and with a lifted axle, it was possible to calculate the distance of the center of gravity from the front and rear axle during all variants of load distribution.
When determining the vehicle weight which is on the beams and pallets, this can lead to measurement deviations due to motions and deformations of the beams. The weight scale pallet truck is designed, calibrated, and officially certified for weighing when the material weighed is directly placed on its holders [68]. For determining the deviation of weighing, the cargo itself and the roof box were placed directly on the pallet truck. After that, they were fitted into the vehicle. Then, the weight of the vehicle together with the cargo and roof box was determined. This weight was compared to the value calculated as an addition of the empty vehicle’s weight and the vehicle weight with the cargo and roof box. The weight determined by weighing was marked as “Measured vehicle mass”, and the weight determined by addition of the empty vehicle and vehicle with the cargo and roof box was marked as “Theoretical vehicle mass”. The difference between “Measured vehicle mass” and “Theoretical vehicle mass” was given in percentages, and this value can be considered as an expression of accuracy in weighing by the weight scale of the pallet truck, i.e., as important values for determining the center of gravity’s position. The second important value for calculating the center of gravity is the value of the lifted axle’s height. To have the highest accuracy possible, the water level was used at the lower part of the front axle’s wheel from which the value was subtracted.
The measurements of the lifted axle’s height were performed with both sides of the vehicle, and the value was averaged. An important factor when weighing in the plane is that the wheels of the front and rear axle should be in the horizontal position transversely as well as longitudinally. To meet this condition, the water level was used, and the horizontality was reached by lifting or lowering the weight scale pallet truck.
The distance of the center of gravity from the front axle was calculated using Equation (1) and from the rear axle using Equation (2).
The height of the center of gravity was defined according to Formula (3).
After determining the center of gravity’s height, it was possible to calculate the theoretical limit speed of bending at the limit overturning according to formula:
V = 3.6 . R · g · 2 · h c · t g α + B 2 · h c B · t g α
where:
V is the theoretical speed of bending at the limit overturning (km/h);
R is the bend radius (m);
g is the gravitational acceleration (m·s−2);
α is the road inclination at the bend (°);
B is the wheel track;
hc is the height of the center of gravity (m) [69].
The bend radius was 40 m. This is a relatively small radius. However, such bending can occur when a sudden obstruction occurs as well.
The angle of the slope at which tipping over to the side may occur is also an important data:
β = a r c t g w h c
where:
β is the theoretical angle of bending at the limit overturning (°);
w is the half the wheel track (°);
hc is the height of the center of gravity (m) [70].
For comparison with other vehicles the static stability factor SSF was calculated as:
S S F = W T 2 h c
where:
SSF is the static stability factor (-);
WT is the wheel track (°);
hc is the height of the center of gravity (m) [71].
As a relative indicator of the vehicle stability, the ratio of the vehicle’s height to the wheel track was calculated as:
H W = H W T
where:
HW is the ratio of the vehicle’s height and the wheel track (-);
H is the vehicle’s height (m);
WT is the wheel track (m) [72].

3.4. Measurements with SUV

The measurements with SUV (Figure 4) focused on determining the change in axle loads and the center of gravity’s height due to different load distribution.
The measurements were performed with the weight scale pallet truck, in the same way as with Kia Ceed 1.6 CVTI. The same roof box MobyDick was used for measuring as well. The front axle was lifted by about 530 mm, which means that there was sufficient difference between the weights applied to the axles during weighing horizontally and with a lifted axle, and at this value, it did not lead to pressing the suspension of the rear axle and to lengthen the suspension of the front axle.
The measurements of the weight applied to the axles were performed as follows:
-
The empty vehicle with the driver only weighing 50.5 kg;
-
Load in the roof box weighing 72.5 kg;
-
Load in the load compartment, on the lowered rear seats and on the floor in front of the lowered rear seats, and on the floor in front of the front seats weighing 472.5 kg;
-
Load in the load compartment, on the lowered rear seats weighing 400 kg, and in the roof box weighing 72.5 kg;
-
Load on the floor in front of the rear seats and on the floor in front of the front seat weighing 72.5 kg.
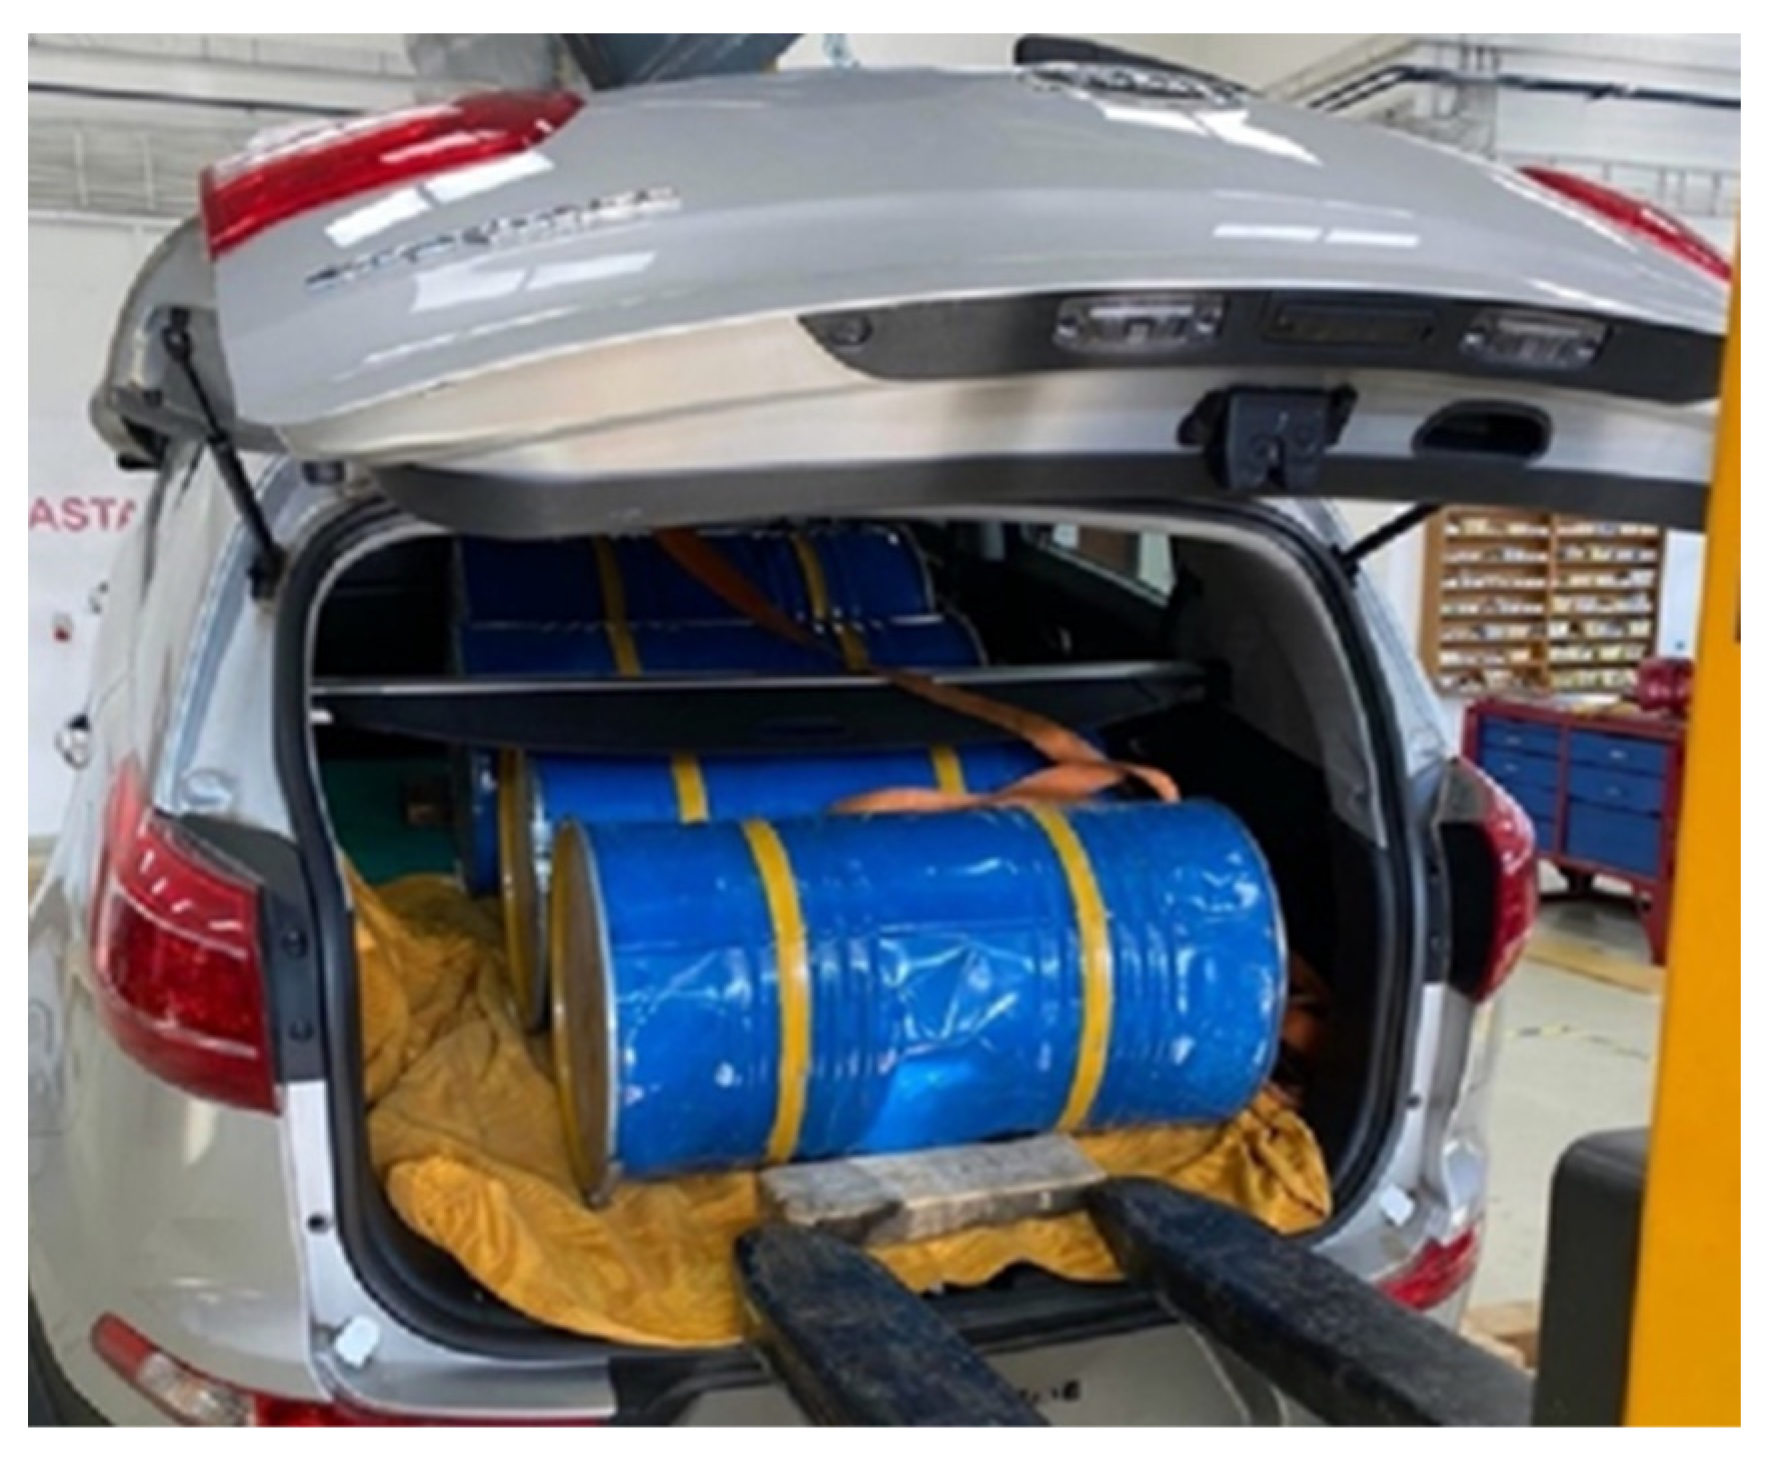
The load of SUV comprised 4 barrels, each weighing 100 kg (Figure 5), and 5 cartons weighing 72.5 kg.
The barrels were secured to avoid their moving during the measurements in the plane or slantwise.

3.5. Measurements with Electric, Hybrid, and VAN

The measurements with electric, hybrid, and VAN focused on determining the center of gravity’s position were performed with the pallet scales, in contrast to two previous vehicles (hatchback and SUV). The measurement scheme is displayed in Figure 6.
The vehicle (Figure 6, Position 1) was placed on the pallet scale (Position 3) on its rear axle. To make the vehicle horizontal, the front axle was underlaid by wooden material (Position 3). After the weight of the rear axle was found, the weight of the front axle was further determined.
The pallet scale’s type was LP7516, with a maximum mass for weighing of 3000 kg and a weighing deviation of 0.5 kg—the same as the weighing scale of the pallet truck [73]. The pallet scales are not mechanically interconnected. They are only connected to the display through cables, so they can be used in any vehicle with any track width. At the same time, there is a possibility to determine the weight individually for the left and for the right wheel, and so the center of gravity’s position can be determined transversely as well.
The height of the scales can be adjusted by set screws. To determine the height of the center of gravity, one of the axles was lifted by the pallet truck with a scale (Figure 1, Figure 2 and Figure 3, Position 1). The front axle was lifted 250 mm higher than the rear axle. The measurements were performed without the driver and with the driver in order to verify the measurement accuracy. The driver weighed 50.5 kg and the measurement accuracy was verified by subtraction.

4. Results and Discussion

4.1. Measurement Results with Hatchback

The measurements with Hatchback were performed to calculate the position of the center of gravity in the horizontal direction as well as in the vertical direction. The observed values of its axle loads are given in Table 3. The weight of two iron beams with two pallets was subtracted from the measured weights, and it was 166.5 kg (Figure 1). When measuring with the lifted axle (Figure 3), 6 pallets were used, and the weight of beams with pallets was 246.5 kg.
Based on the change in the weight applied to the front axle when the vehicle is in the plane and the front axle is lifted (Table 3, comparing the columns 2 and 4), the change in the center of gravity’s height can be estimated as well. The higher the difference in the weight applied to the front axle, the higher the center of gravity [74].
To verify the measurement accuracy, Table 4 shows the calculated measurement deviations. The second column shows the vehicle mass given by the addition of the weight applied to the front and rear axles in the plane (Table 3, Columns 2 and 3). Column 3 shows the theoretical vehicle mass, i.e., the addition of the weight of the empty vehicle with the driver, and separately weighed mass of the load and roof box according to a particular measurement variant. The theoretical mass is considered as “actual weight” since there is an assumption of smaller deviation when weighing the vehicle and load separately, also bearing in mind that one scale division of the pallet truck’s scale is 0.5 kg. Thus, the percentage expression of the difference between the “Measured vehicle mass” and the “Theoretical vehicle mass” can be considered as a measurement deviation as well as a deviation for further determining the center of gravity’s position since the weight applied to the axles is the most important value for the calculation of the center of gravity’s position.
As follows from Table 4, there were very low measurement deviations. The highest measurement deviation was with the load in the roof box, i.e., 0.50%. In the other cases, there was very high measurement accuracy achieved, as it is possible to consider weighing of the vehicle separately and weighing the load separately to be an “etalon”. Thus, the basic and the most important condition for determining the center of gravity’s height and for determining the vehicle mass as close as possible can be regarded as fulfilled.
The mass divided into the front and rear axles and given in percentage is shown in Table 5. Table 5 also shows the distance of the center of gravity from the front and rear axles of the Hatchback, L1 and L2, calculated according to Formulas (1) and (2). The last column shows the calculation of the change in the distance of the center of gravity from the front axle in comparison with the empty vehicle.
To compare with the empty vehicle, it led to the most substantial change in the axle load when unloading the whole load into the luggage compartment, and the roof box was empty, with a difference of about 9%. Such a change in the axle load and reduction of the load of the front driving axle also affects the vehicle’s ability to accelerate, especially on wet or icy surfaces, or mud, with low friction coefficient [75,76]. Moreover, this change in load can lower the risk of oversteer skid, since the load distribution is the closest to the same load of the front and rear axle, and the center of gravity is located approximately in the middle between the front and rear axles [77].
The center of gravity in the horizontal direction shifted towards the rear axle by 25 cm due to unloading into the luggage compartment and fitting the empty roof box, as follows from Table 5 as well. This was achieved by the load weighing 205 kg and the empty roof box weighing 11.5 kg. The load capacity of the hatchback was 447 kg. This means that there was not even half of the load capacity used, and despite this, the shifts in the position of the center of gravity in the horizontal direction do have an impact on the vehicle driving performances, as also mentioned in publication [78]. The authors of Ref. [79] conclude, in relation to a similar tire as used with the Kia Ceed, a strong dependence between the tire load and slip, contact area pressure distribution, tire contact area maximum pressure value, lateral tire deflection, and cornering stiffness.
The height of the center of gravity and its change due to load distribution of the Hatchback with a weight not reaching even half of the load capacity are given in Table 6. The higher the center of gravity, the higher the risk of overturning and the more the axle load changes during braking [80,81].
The load placed on the rear seats and in the roof box caused an increase in the height of the center of gravity by 11 cm, which is 19.64%. The vehicle body dropped by 4.5 cm at maximum load, 216.5 kg. The suspension stiffness is thus 1 cm for every 48 kg.
The driver can affect the risk of overturning by distributing the load to a large extent, as also follows from Table 5. The worst load stowage was when the load was on the rear seats and in the roof box. At the same bend radius, the theoretical speed at the limit of overturning was reduced by 7.66 km.h−1, i.e., 8.74%. Additionally, the authors of publication [82], who have selected a bus for their research, point to the reduction of speed driving at the limit of overturning and to the increase in the center of gravity’s height.
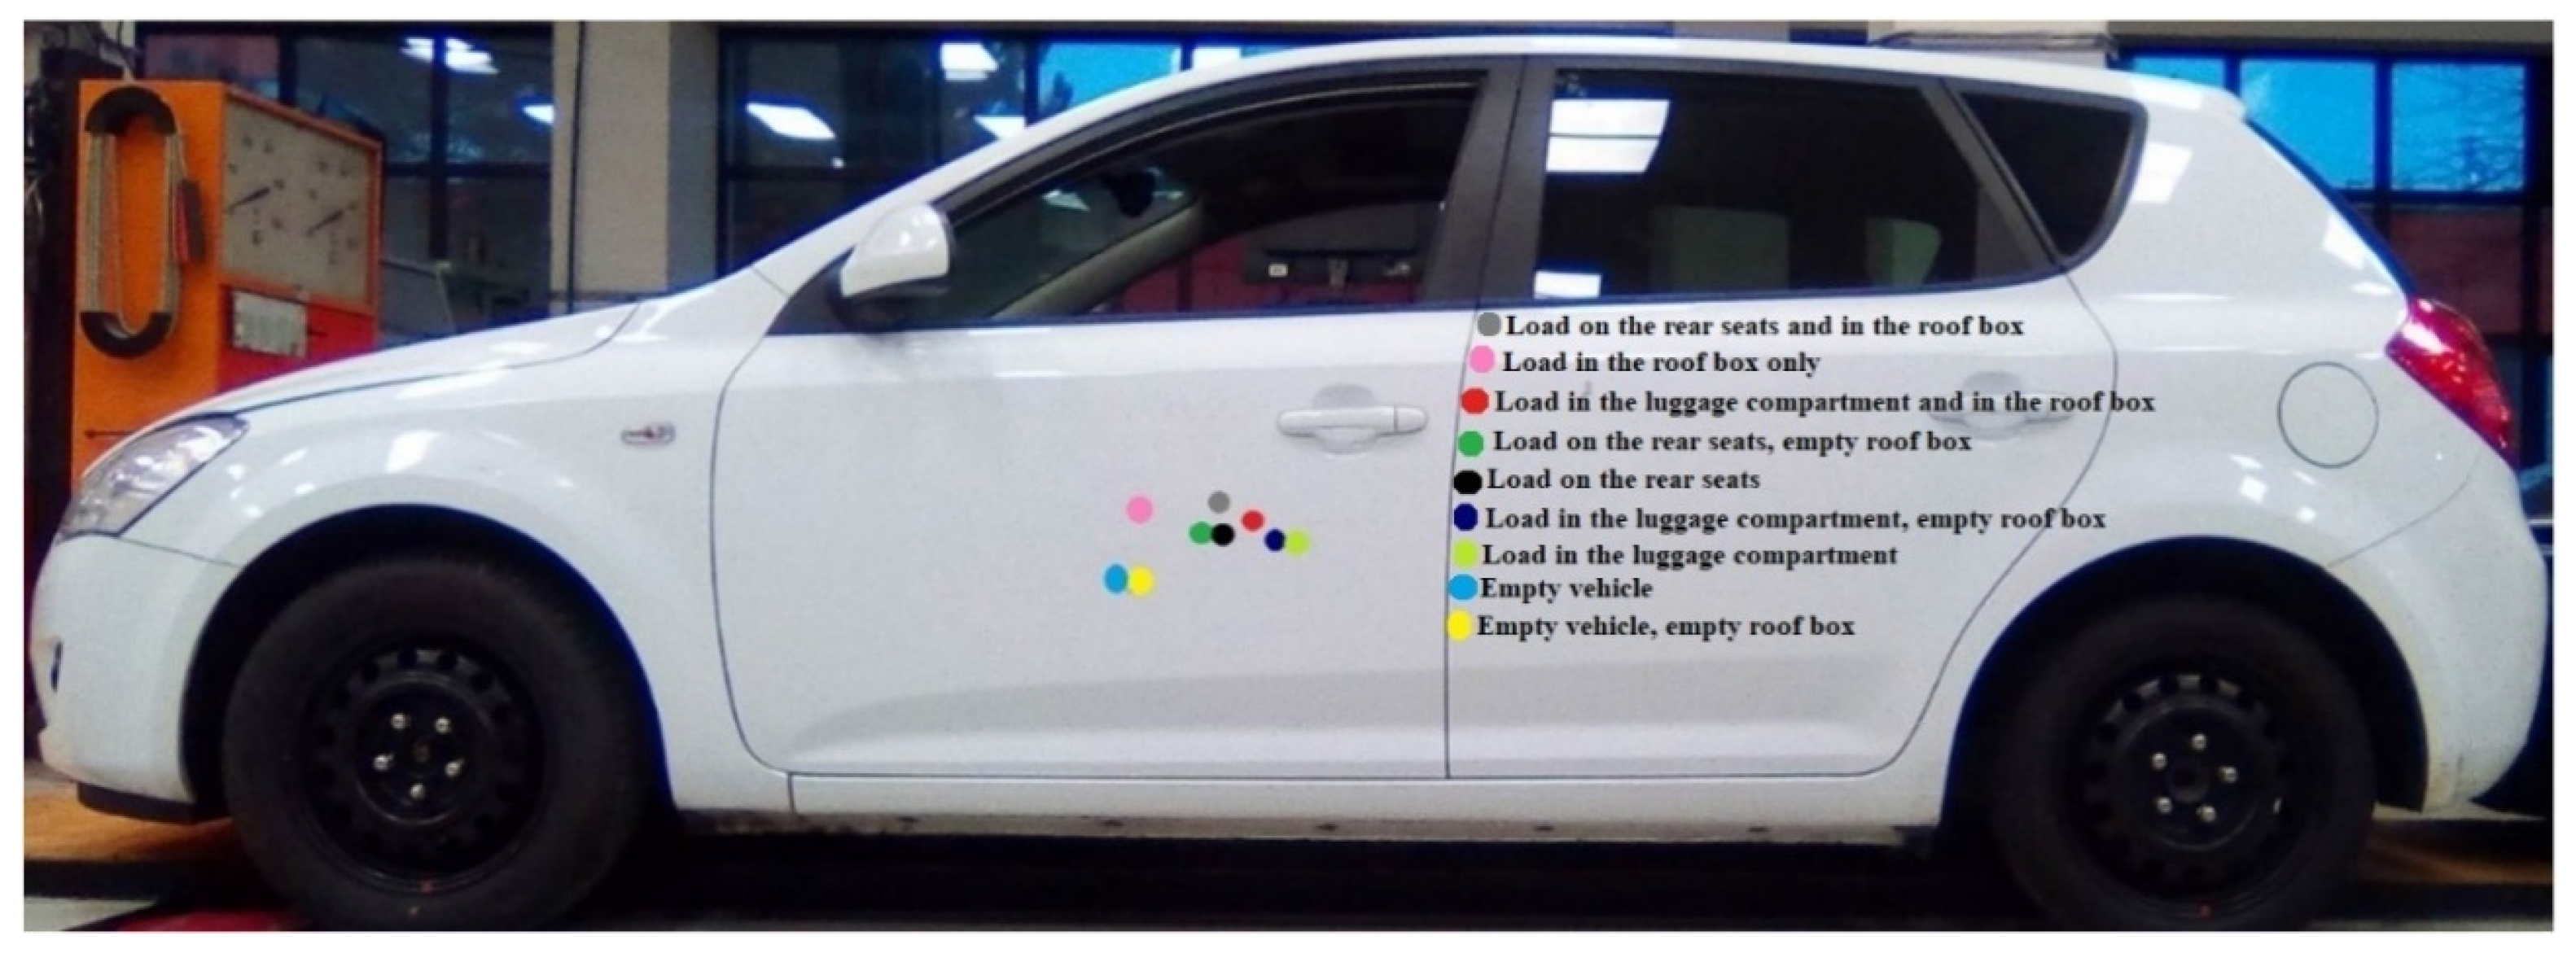
A summary of the results from Table 5 and Table 6 is shown in Figure 7, in which the position of the center of gravity at each type of load stowage of hatchback is displayed. Each color represents the type of load stowage and considers the distance of the center of gravity from the axles as well as its height.
Every time the load was transferred, the center of gravity shifted too, either vertically or horizontally, or both, as also displayed in Figure 7. The lowest center of gravity was in the empty vehicle (Figure 7, light blue color), or in the empty vehicle with a fitted empty roof box (yellow color). However, when driving with the empty roof box, the center of gravity would shift rearward since the air resistance of the roof box would act rearward too. Reducing the load of the front axle and loading the rear axle would increase with increasing speed of driving, which is also described in the publication focused on dynamics of road vehicles [83]. Using the roof box and the center of gravity’s height would also be important for the crosswind’s effect on the vehicle stability while driving in the bend [84]. The empty roof box, although there was not any measurable increase in the center of gravity’s height, would increase the surface of the vehicle’s lateral area [85], which is important for the wind action, and it would also lengthen the arm on which the wind force would have been applied [86,87]. When driving on unpaved terrain or on a slope, it is necessary to choose such a distribution of the load to reduce the risk of the vehicle tipping over.

4.2. Measurement Results with SUV

The measured values of SUV are given in Table 7. The values are given without the weight of the beams with pallets. Since the key aim in relation to SUV was also to determine the center of gravity’s height, the values of weight corresponding to the front axle when it is lifted are given as well.
The weight applied to the rear axle changed from 580 kg with the empty vehicle up to 1029.5 kg with the load placed in the luggage compartment and on the lowered rear seats (Table 7). Based on data from Table 7, there is a presumption of the highest center of gravity with the load in the roof box only, since it led to the reduction of load of the front axle when lifted. At the same time, when the center of gravity is high, the front axle loses its ability to shift forces onto the road while driving uphill to a large extent since it leads to a reduction in load, which is a very important characteristic for an SUV [88]. The relation between the vehicle’s ability to drive uphill and the position of its center of gravity is described in the publication [89] in which the authors mention a high value of correlation.
To verify the measurement accuracy, the measurement deviations from the weight measured by separate weighing of the empty vehicle with the driver and separate weighing of the load are given in Table 8.
Weighing with a weight scale pallet truck was with minimum deviations (Table 8). The deviations could have been caused by a different position of the driver on the seat, or the height of the front and rear axles from the floor were not the same [90,91]. Similarly, low values of differences between the mass determined by weighing the vehicle with a load and the mass determined by an addition of the mass of the vehicle and the load are also given in Table 4. The maximum difference was 7 kg, which is 0.50%. In Table 3 and Table 8, the average difference was 1.7 kg, which is 0.10%. Therefore, the method of determining the vehicle mass by using the weight scale pallet truck and the pallets can be regarded as accurate and reliable enough. For a comparison, in publication [58], the difference between the vehicle mass determined by weighing (1200 kg) and the vehicle mass determined by calculation (1112.7 kg) was up to 7.3%. The authors also mentioned the result of 1283 kg when using another method, so it can be concluded that for determining the vehicle mass and subsequent calculation of the center of gravity’s position, weighing by the weight scale pallet truck is a very suitable method.
The percentage division of the mass into the front and rear axles and the distances of the center of gravity from the front and rear axles, calculated according to Formulas (1) and (2) are given in Table 9. The percentage division of vehicle mass into the front and rear axle is given in the second and third columns. The fourth column shows the change in mass distribution in comparison with the empty vehicle, given in percentages. The distance of the center of gravity from the front and rear axle is given in the fifth and sixth columns, and the last column shows the change in the center of gravity’s position in the horizontal direction in comparison with the empty vehicle, and it is given in meters.
The difference between the empty and loaded vehicles in the division of mass into the front and rear axles of SUV was the highest (13.24%) when the load was placed in the luggage compartment and on the lowered rear seats, and into the roof box. Reducing the axle load by 13% on a surface with a low friction coefficient may weaken the vehicle’s ability to accelerate or bend by approximately the same percentage [92,93]. Kia Ceed and SUV have a relatively short rear overhang. If the measurements were performed with vehicles with a longer overhang, such as in estate cars, the reduction of load of the front axle when the load is in the luggage compartment would have been substantially higher, and it would have led to the overload of the rear axle. Thus, when modeling, it is necessary to take into consideration the real load distribution and its following real axle load as well as the center of gravity’s position in the horizontal plane. The impact of cargo distribution on the center of gravity’s position shall be taken into consideration also when modeling the performance division for each axle, as also mentioned in publication [94], since the load of each axle together with the following traction force is changing due to cargo distribution (Table 9), and considering only the weight distribution in the empty vehicle would lead to miscalculations. It is similar when proposing the adaptive suspension in publication [95] since different cargo distribution changes the suspension characteristics.
Concerning the vehicle with a load of 425.5 kg, its load capacity was used up to 86%. The center of gravity was shifted up to 0.35 m towards the rear axle, as follows from Table 9. A different distribution of the load led to changes in the axle load and in the center of gravity’s position (Table 5 and Table 9). The changes due to different cargo distribution in Table 5 and Table 9 are logical, i.e., there was not any shift of the center of gravity towards the front axle and vice versa when moving the cargo into the rear part of the vehicle. Thus, it can be assumed that the weighing of the vehicles and the following calculations were correct and correspond to the current state. Therefore, the data from Table 5 and Table 9 are applicable for further modeling and comparing as well.
The impact of load and its position on the center of gravity’s height of SUV is given in Table 10. Table 10 shows the impact of the load and its distribution on the theoretical speed of crossing the bend with a radius of 40 m at the limit of overturning, too.
The SUV has in general a higher position of the center of gravity (0.67 m) than the hatchback (0.56 m) since it is a higher vehicle. Placing the load of 72.5 kg on the vehicle’s floor caused a reduction in the height of the center of gravity by 1.5 cm. This also occurred because the center of gravity of the load was probably under the center of gravity of the empty vehicle and also due to the overall drop of the car body in the suspension. When the center of gravity would have been at the peak, the load in the luggage compartment and in the roof box, in the case of air or hydraulic suspension which keeps the same clear height from the vehicle’s load, the center of gravity was even higher [96]. However, the body fell by 9 cm in the suspension owing to load stowage, and thus, it led to moderation of the center of gravity’s increase as well.
Since the body dropped by 9 cm with a load of 472.5 kg, this means that with every 52.5 kg of load, the body drops by 1 cm. The suspension constant of both hatchback and SUV vehicles can be further used in the calculation of the change in the height of the center of gravity due to the loading of additional cargo. Without the use of data on how many cm the vehicle body drops under different loads, the calculation results would be significantly inaccurate.
The theoretical speed at the overturning limit of the empty vehicle is 81.12 km·h−1. Placing the load on the floor slightly increased the theoretical speed. However, in all the other cases the load decreased the speed, as follows from Table 10.
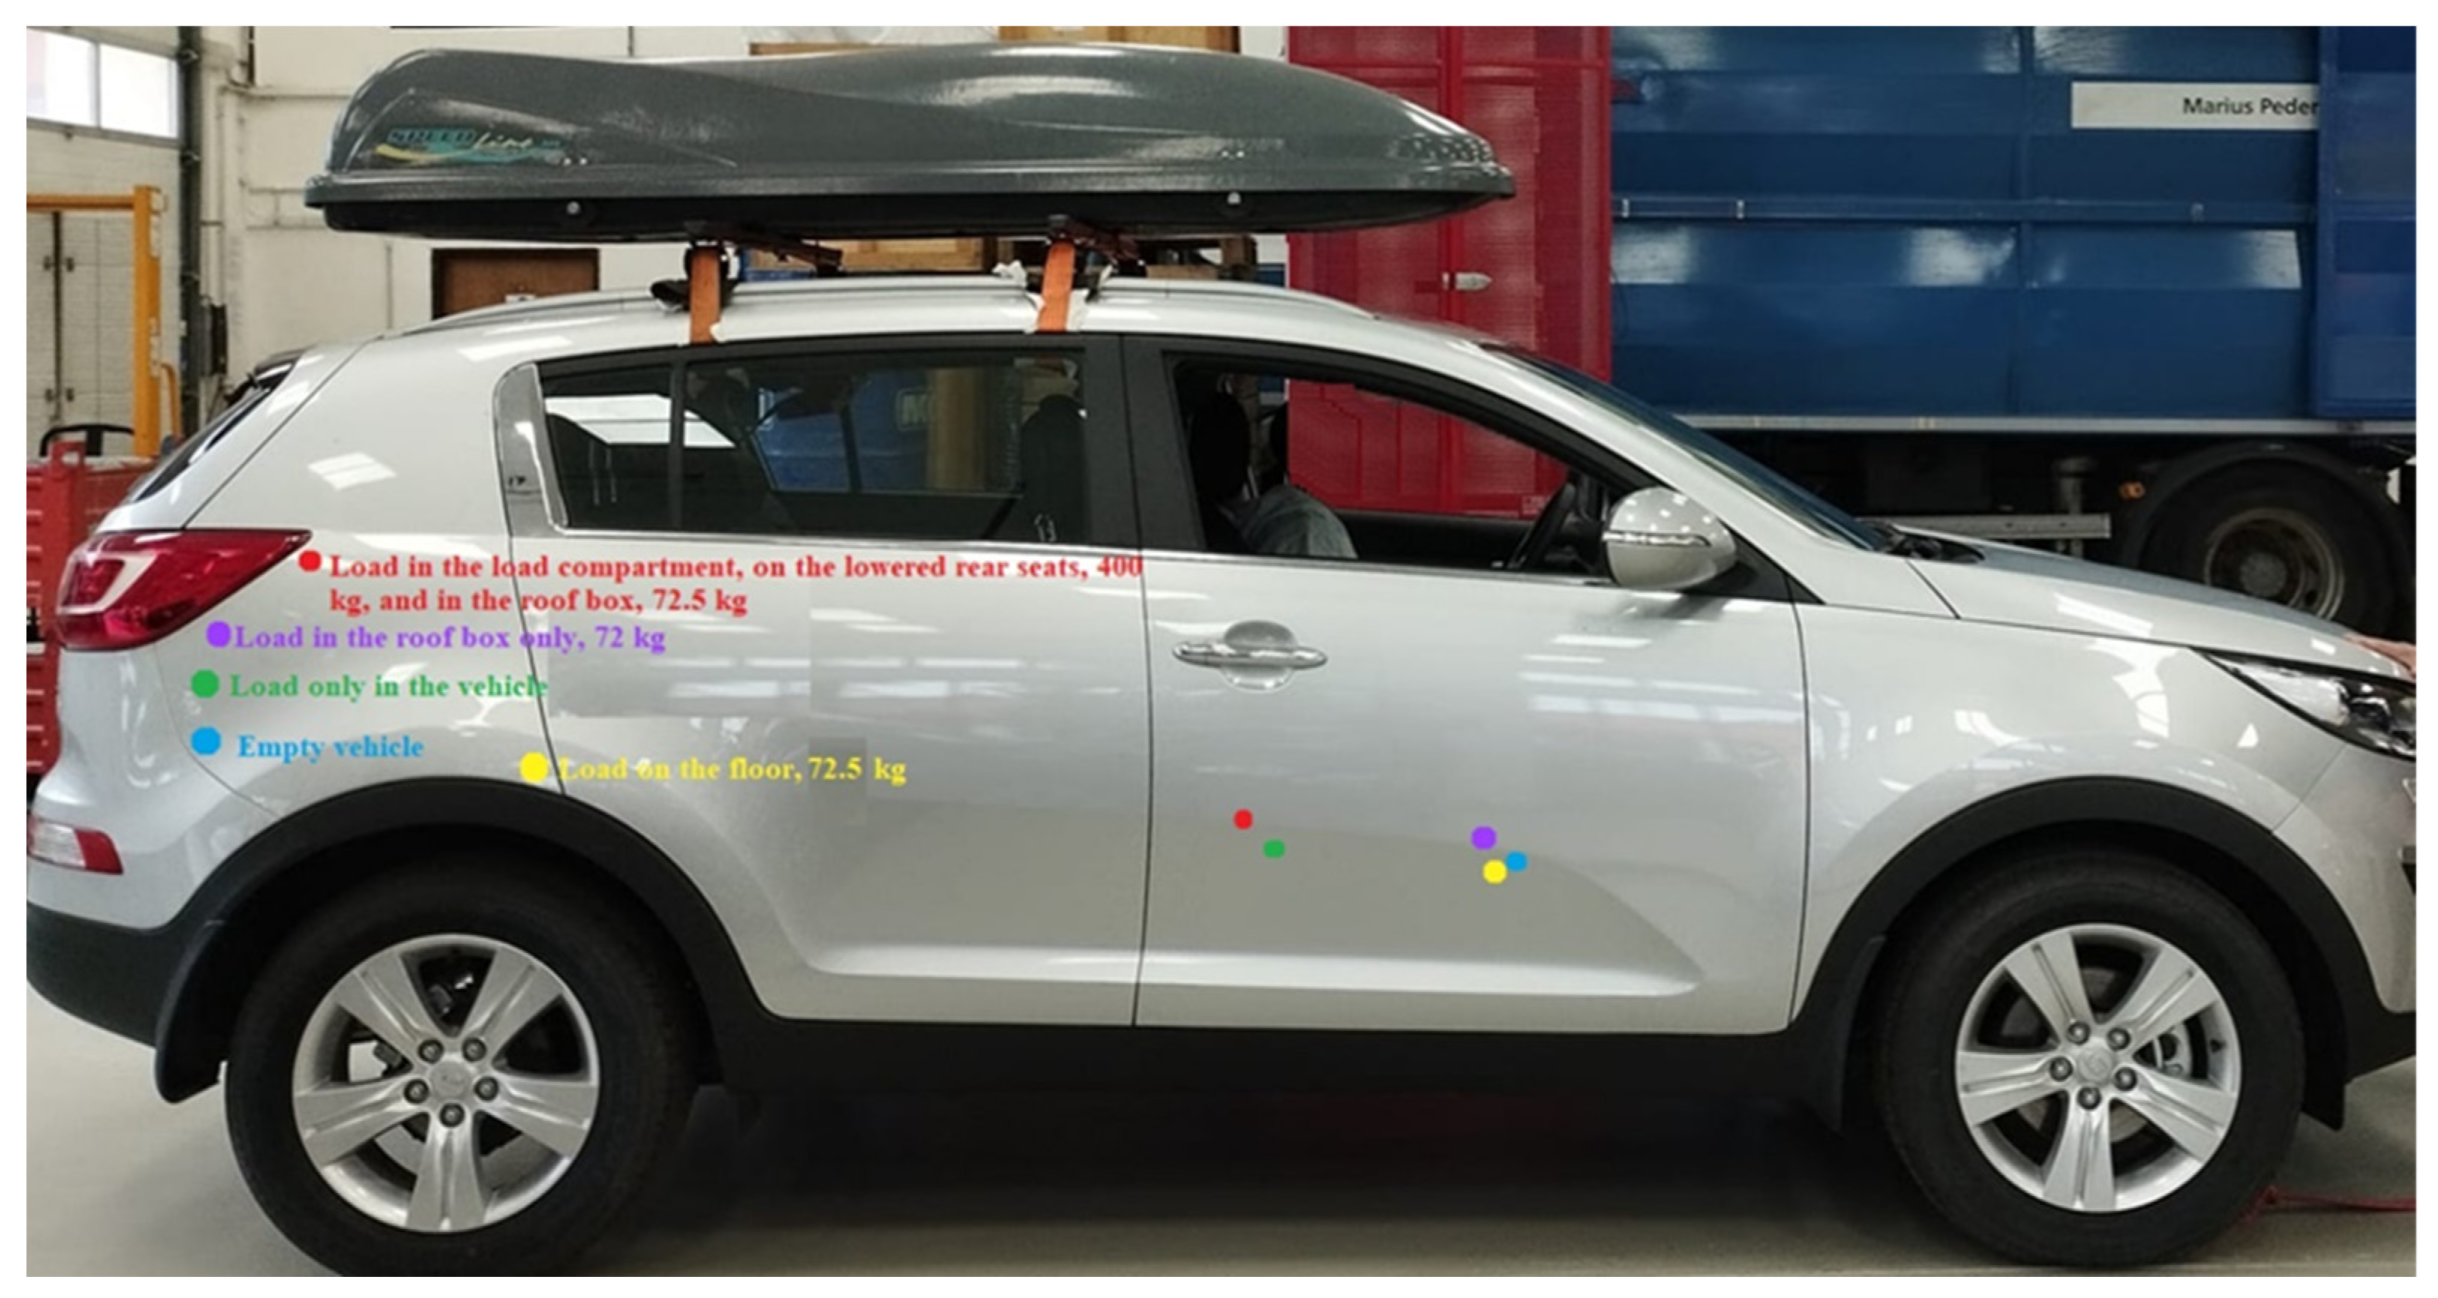
Based on the data from Table 9 and Table 10, Figure 8 shows the positions of the center of gravity depending on the load distribution. Each variant of load distribution has a certain color.
The highest center of gravity and the furthest from the front axle is when the load is in the vehicle and in the roof box (Figure 8, red color). The lowest position of the center of gravity (yellow color) was when the load of 72.5 kg was placed on the vehicle’s floor. However, this caused the center of gravity to be shifted towards the front axle.
The authors of publication [97] determined the center of gravity’s height of a comparable vehicle, i.e., Škoda Yeti, without a load and without a driver. This was accomplished by a device designed for measuring the moment of inertia. When using the roll motion, the authors calculated the center of gravity’s height as 56.42 cm, and when using the pitch motion, it was 71.40 cm. Thus, the difference in heights of the center of gravity was 14.98 cm, resp. 26.6%, and the measurements were performed under the same conditions, i.e., an empty vehicle without a driver. Concerning the empty SUV with a driver, the center of gravity’s height was determined as 67 cm, which corresponds to the interval with the measurement results of Škoda Yety. However, the method mentioned in the publication [97], would not be used for measuring the change in the center of gravity’s height due to different load distribution, since in that situation it led to the shift by 1 cm in some cases, and the above-mentioned method showed the measurement deviation of about 15 cm between two measurements [97]. The methodology presented in this article can thus be considered significantly more accurate and suitable than other compared methodologies.
As can be seen from Figure 7 and Figure 8, each change in the load position caused a different deformation of the tires and suspension. In scientific articles aimed at mathematically determining the position of the center of gravity, the position of the vehicle’s center of gravity is often given with an accuracy of millimeters. In the article [98], the position of the tractor’s center of gravity is given with an accuracy of hundredths of a millimeter. Specifically the mathematically calculated height of the center of gravity is given as 682.06 mm. However, based on the results of the measurements presented in this article, it can be concluded that such a precise indication of the position of the center of gravity is irrelevant, since, as was stated, the position of the center of gravity changes.

4.3. Measurement Results with Electric, Hybrid, and VAN

The measurement results with electric, hybrid, and VAN vehicles are given in Table 11. The value for the empty vehicle is always given before the slash and the value for the vehicle with the driver is always given after the slash. The fourth column shows the real measured vehicle mass including the driver as well as the theoretical vehicle mass including the driver. The theoretical mass is the empty vehicle’s weight together with the weight of the driver determined by individual weighing. The last column shows the difference in kilograms and percentage between the measured vehicle mass, i.e., the mass actually determined, and the theoretical vehicle mass, i.e., the mass that should be determined.
It follows from the last second columns of Table 11 that there were not any deviations between the real measured vehicle mass and the theoretical vehicle mass. Thus, it may be concluded that the measurements with the pallet scales were performed with sufficient accuracy.
Table 12 shows the vehicle mass division. The value for the empty vehicle is always given before the slash, and the value for the vehicle with the driver is given after the slash.
Table 13 shows the center of gravity’s height, the theoretical speed of driving at the limit of overturning and the theoretical rollover angle. The value for the empty vehicle is always given before the slash and the value for the vehicle with the driver is always given after the slash.
Electric and hybrid vehicles have, without the driver, the same center of gravity (0.52 m), as follows from Table 13. The main reason for such low position of the center of gravity is the location of the batteries in the vehicles’ floor.
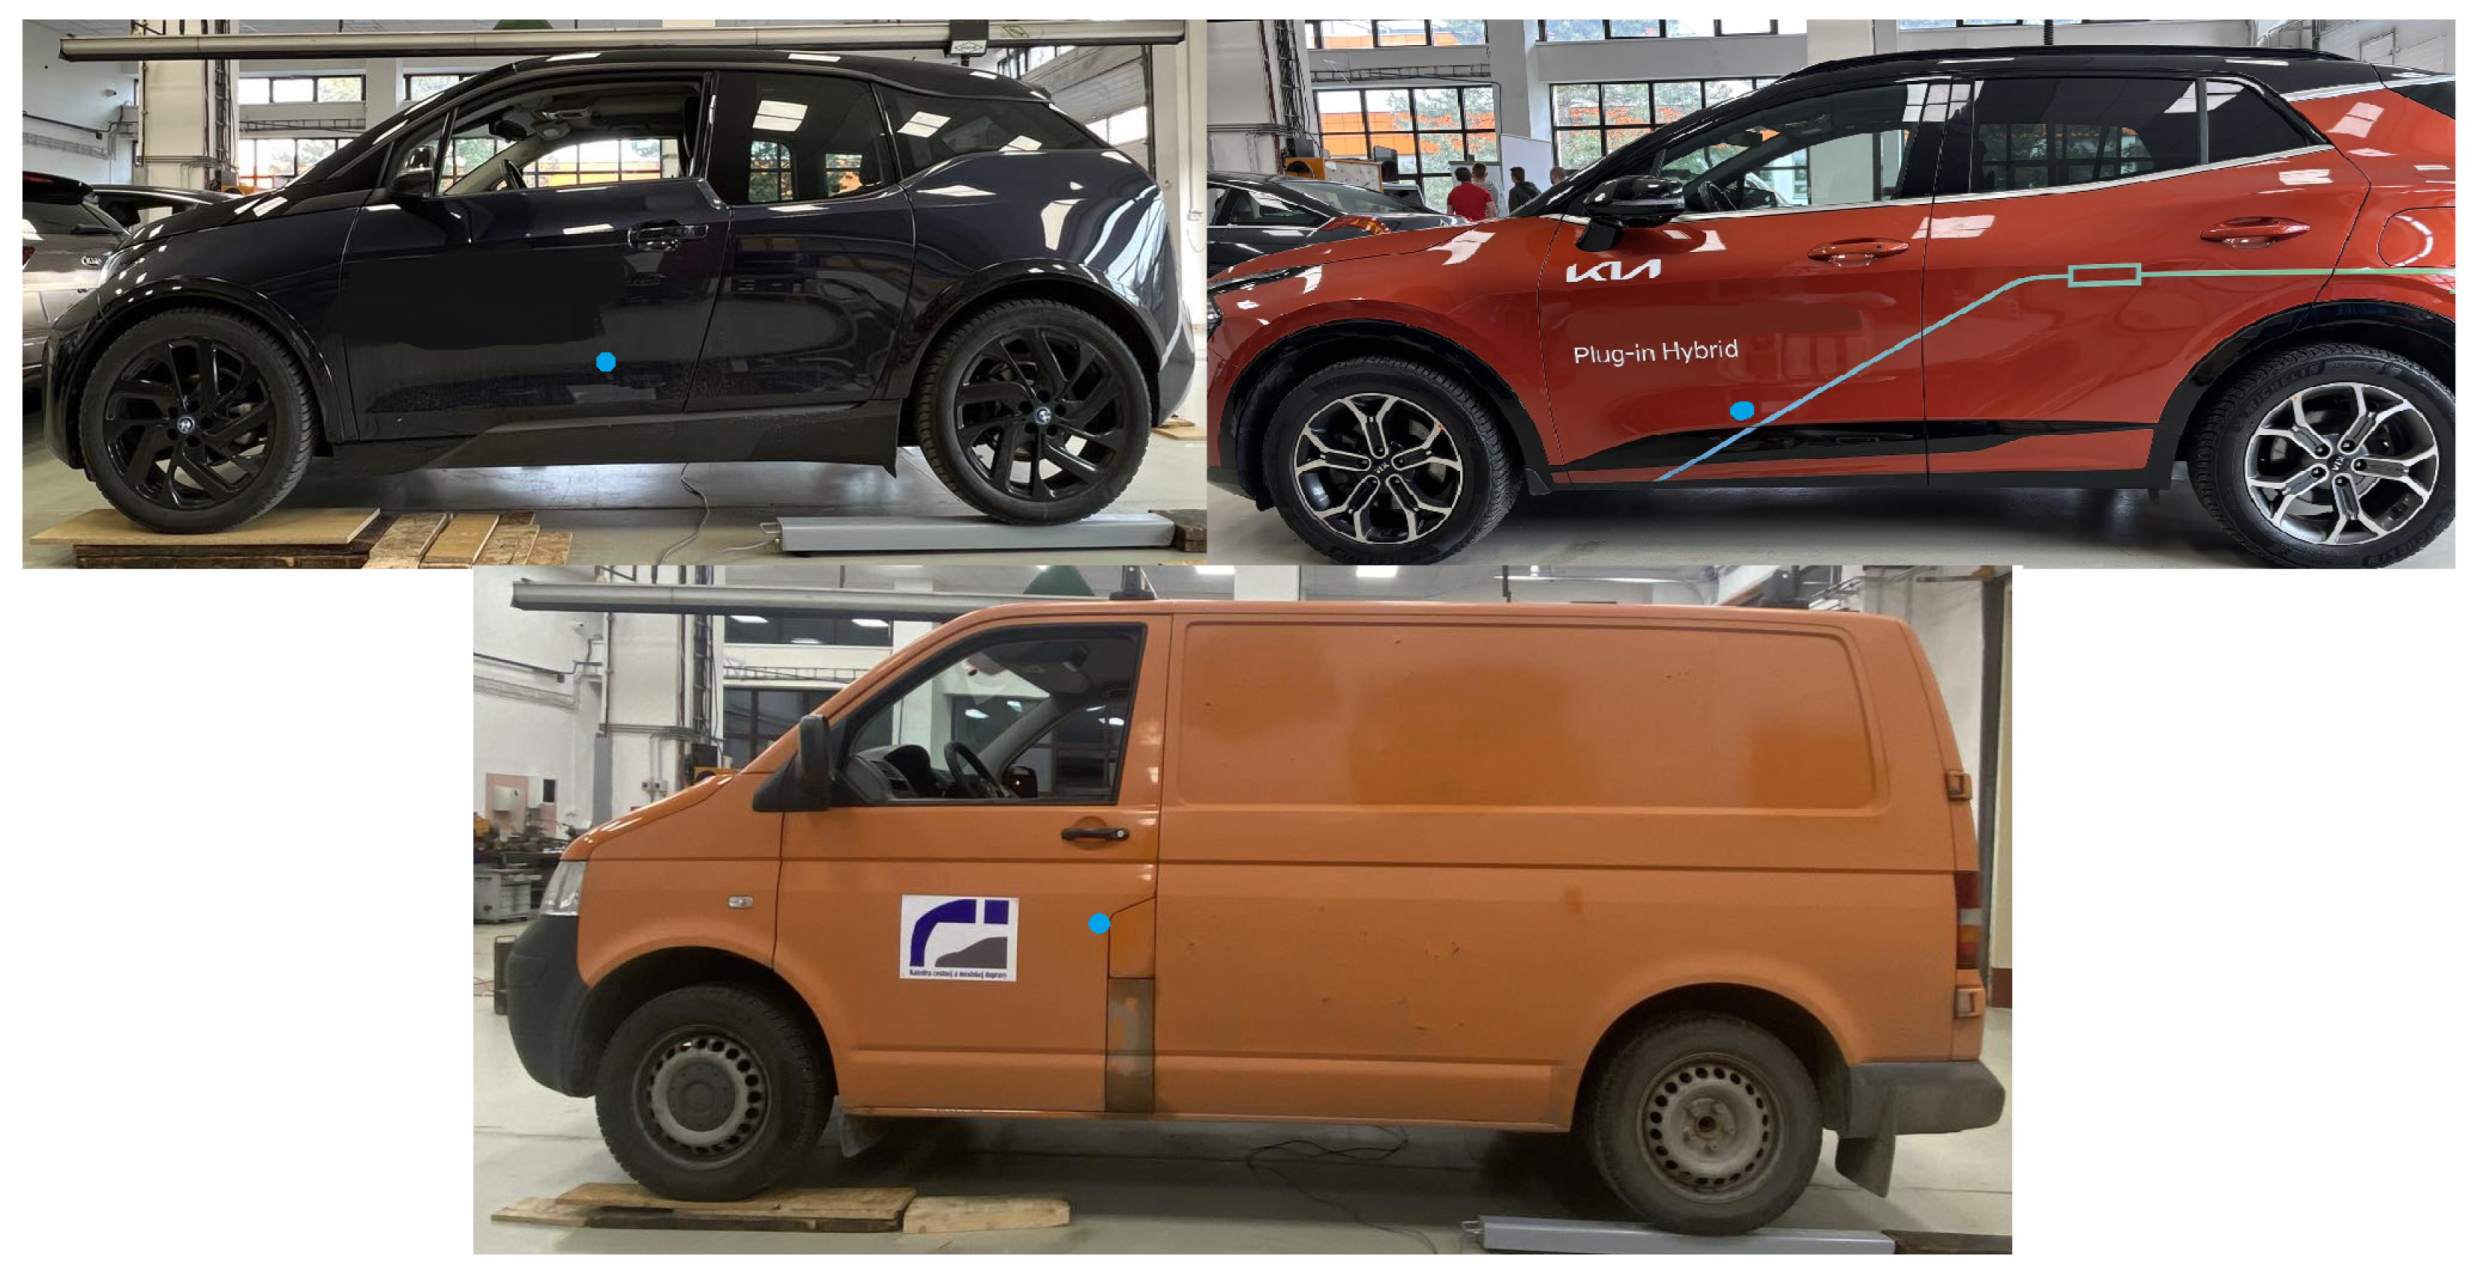
The visual positions of the center of gravity of the empty vehicles are shown in Figure 9 in blue.
There are various software programs available for assessing the impact of load distribution on the change in the center of gravity’s position, such as the “LoadExpert” software [99], which allows users to input different types of vehicles and includes standards applied also in the USA, or other similar software available online or mentioned in references [100,101,102,103]. Additionally, software called Truck Stow, developed at the University of Žilina, which calculates the center of gravity for various vehicles with different load distributions, is also used [104]. However, when working with all the mentioned software, it is necessary to know input values for accurate calculations, specifically the center of gravity’s position of the empty vehicle and the loads on each axle. Furthermore, none of the assessed software enables inputting the body drop due to the cargo load, which relates particularly to passenger cars and vans, since heavy goods vehicles usually have an air suspension system that compensates for the body drop. Thus, the data obtained can be used as input values for software that can determine the center of gravity’s position, or the data on the center of gravity’s position can be used as control data for such software calibration.
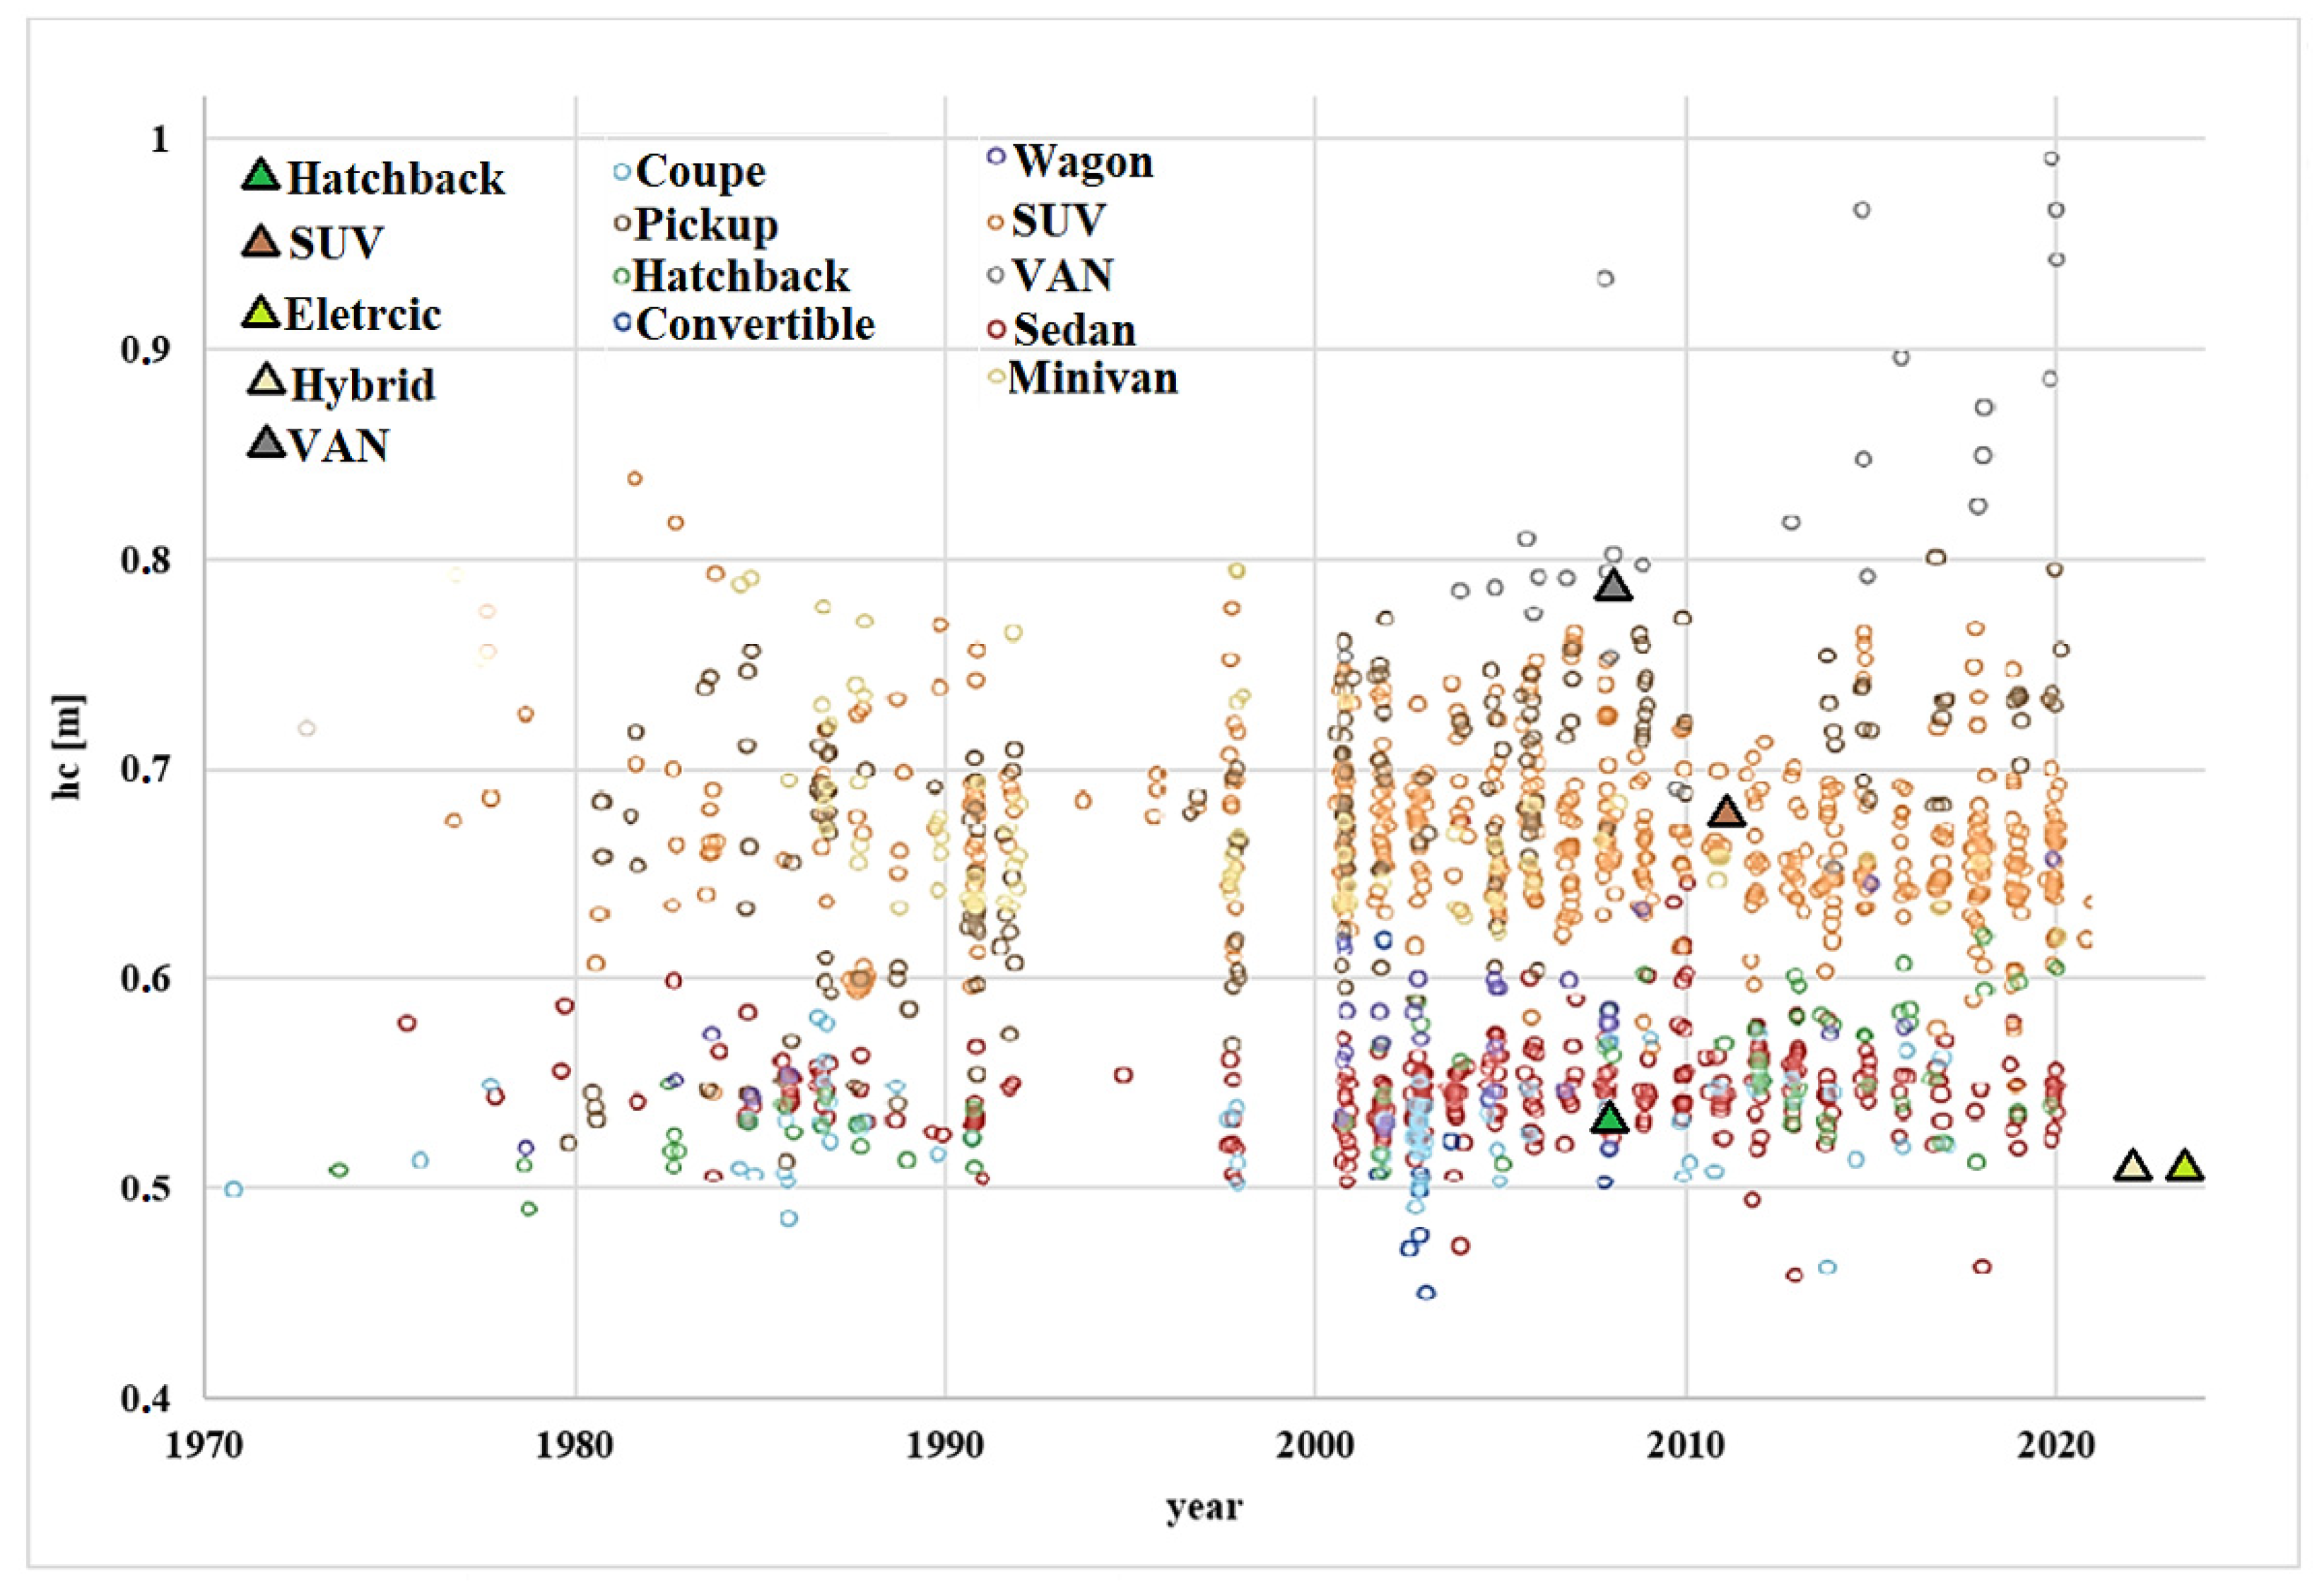
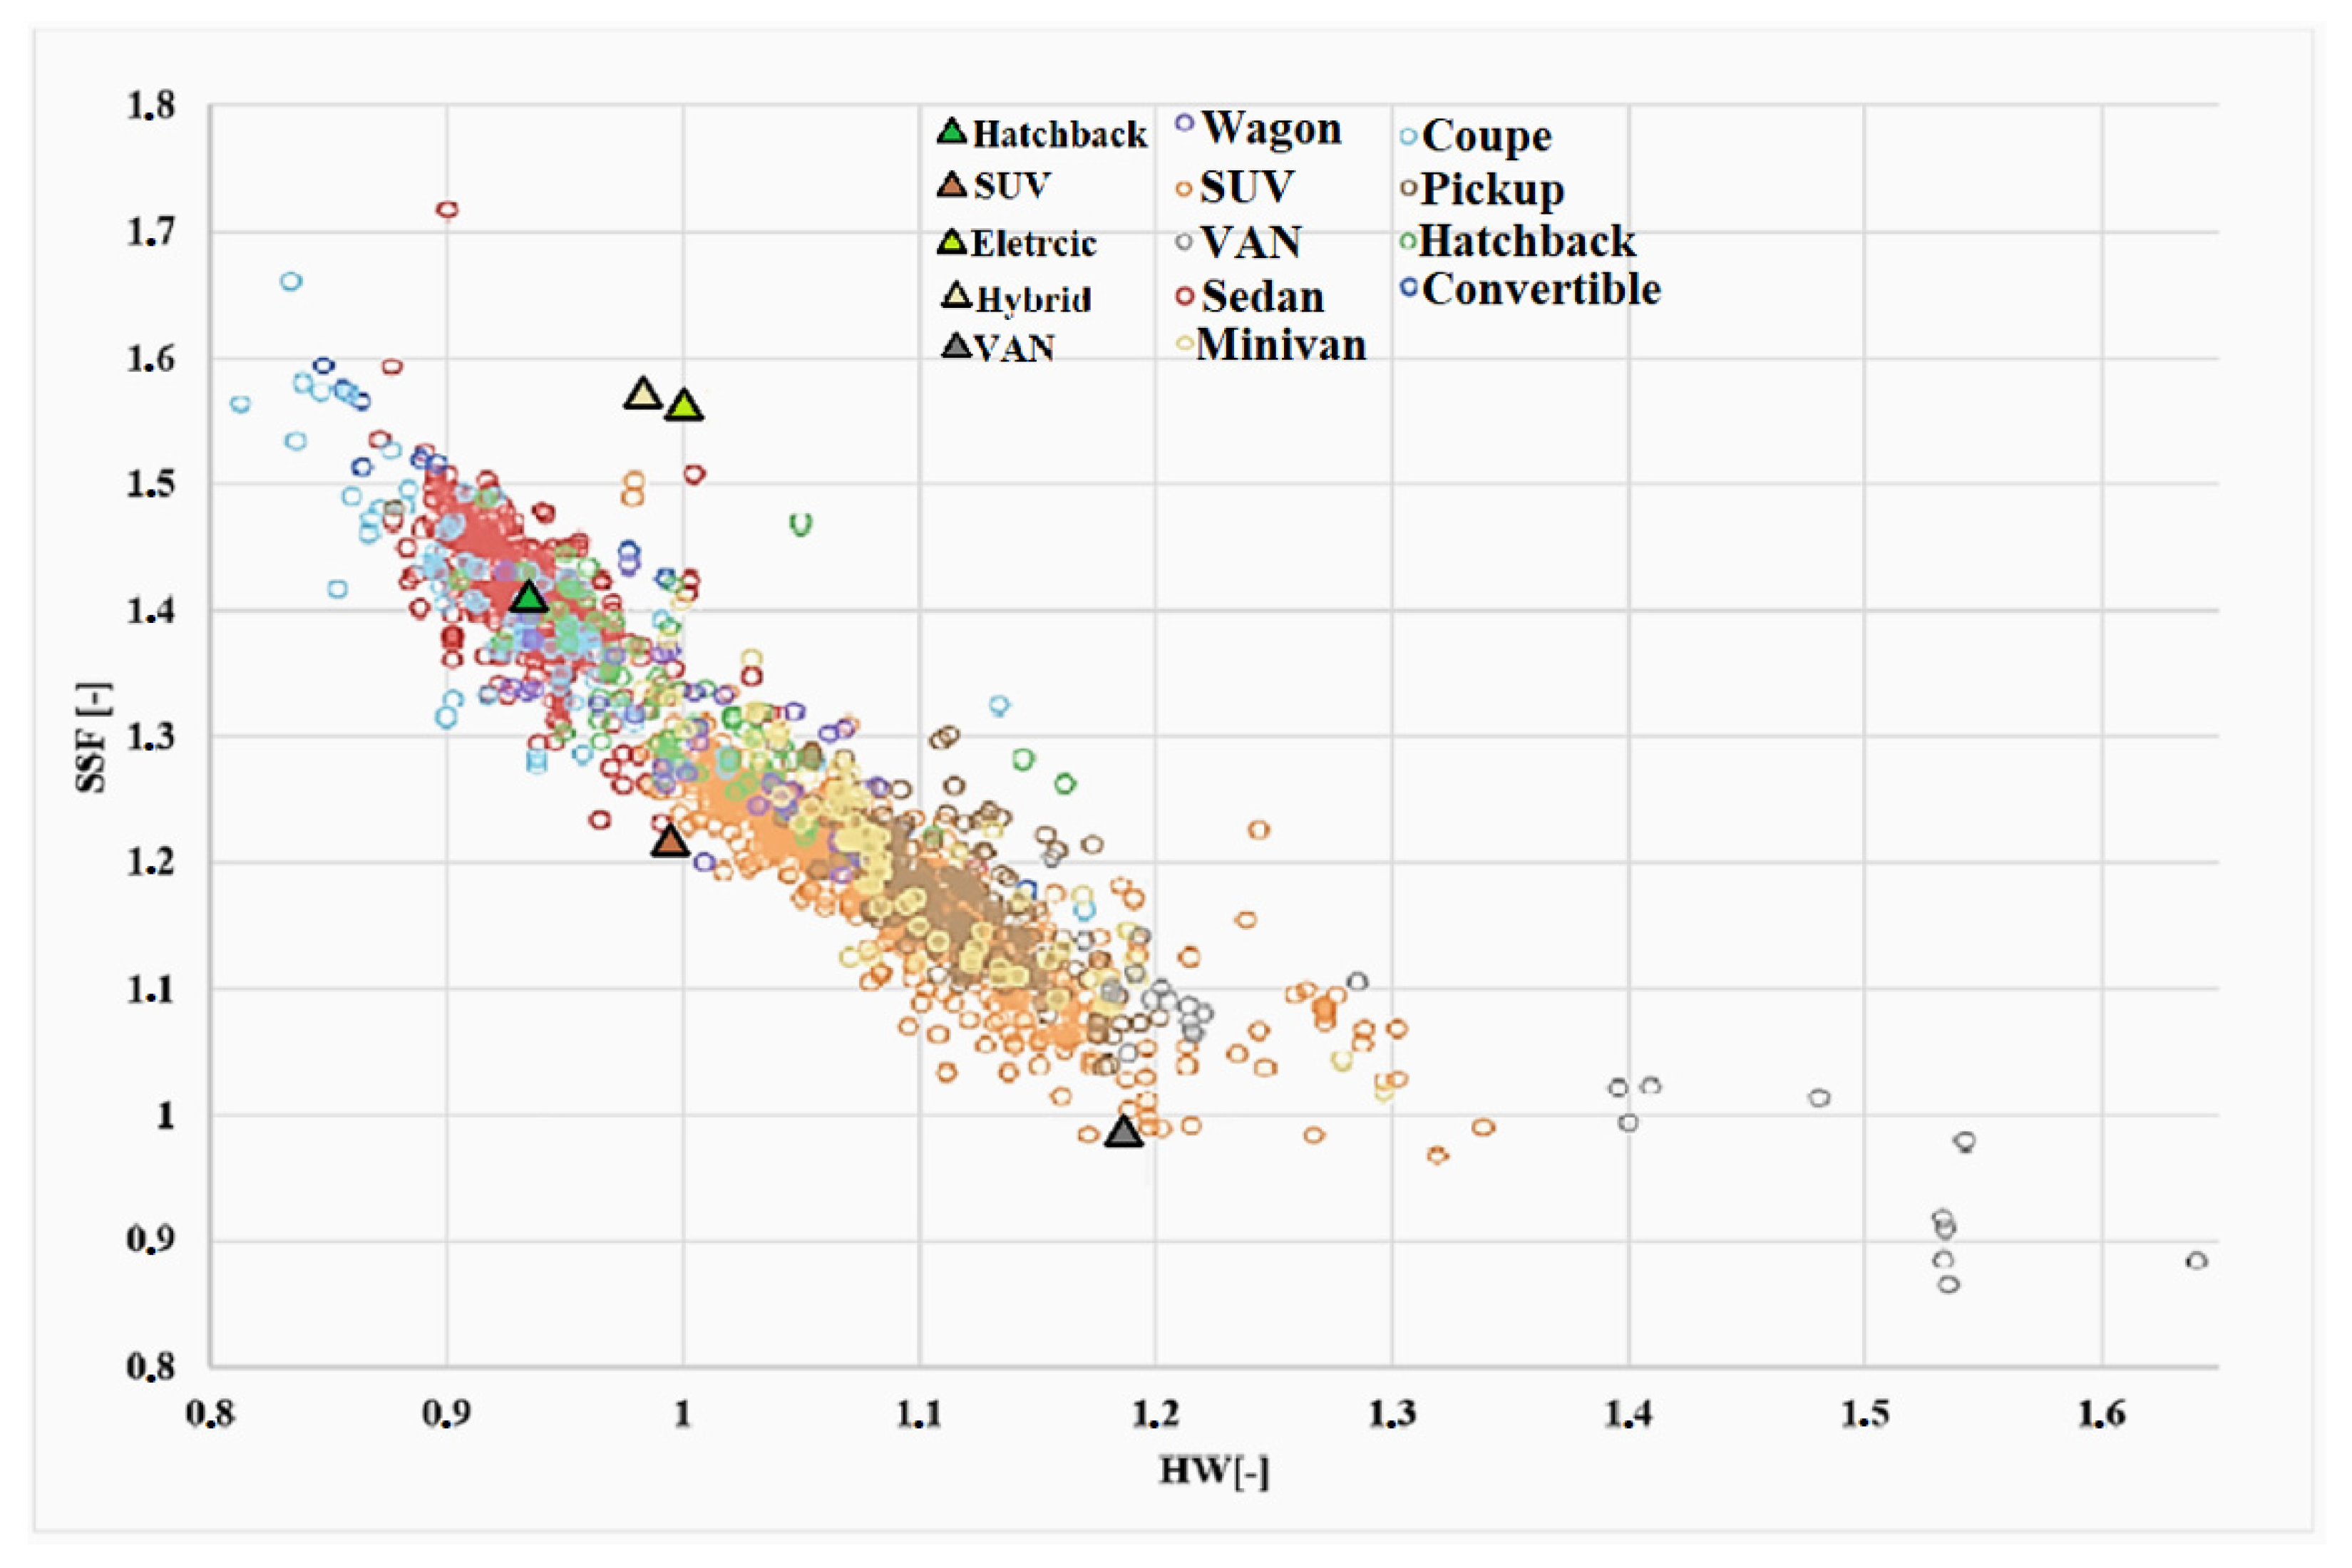
To compare the results, Figure 10, Figure 11 and Figure 12 contain data from publication [105], supplemented with data from the vehicles measured in this paper. Figure 9 shows the center of gravity’s heights depending on the model year. The vehicles are divided by color according to their body type. The figure also includes the center of gravity’s heights of the vehicles measured in this article, and they are marked by the triangle sign.
The hatchback, SUV, and VAN vehicles have average center of gravity heights compared to other vehicles, as follows from Figure 10. These vehicles are equipped with combustion engines. Hybrid and electric vehicles have lower centers of gravity compared to other vehicles. A significant decrease in the center of gravity is in the hybrid, even though it is an SUV. Compared to other SUVs, the center of gravity is substantially lower since the batteries are located in the floor. Although the electric vehicle also has the battery located in its floor, and it is overall lower than the hybrid, the center of gravity’s height is the same. This is owing to the relatively large diameters of the wheels as well as the higher position of the engine. As also follows from Figure 10, a gradual increase in electric cars and hybrids may bring a more radical decrease in the average center of gravity’s height, and it must be reflected in further simulations as well as for reconstructions of car accidents. Thus, in these cases, it will be necessary to have a simple and available methodology for determining the height of the center of gravity as well as data on the center of gravity’s height of the current vehicles.
The height of the vehicles’ center of gravity that depends on their total mass is given in Figure 11. Like in Figure 10, the data of vehicles determined in this publication are marked by the triangle sign.
The center of gravity’s height of the vehicles increases together with their total mass. Such a trend has been approved by the compared vehicles as well as vehicles of which the heights were determined in this article, as follows from Figure 11. The exception was only the hybrid, which has its battery located in the floor.
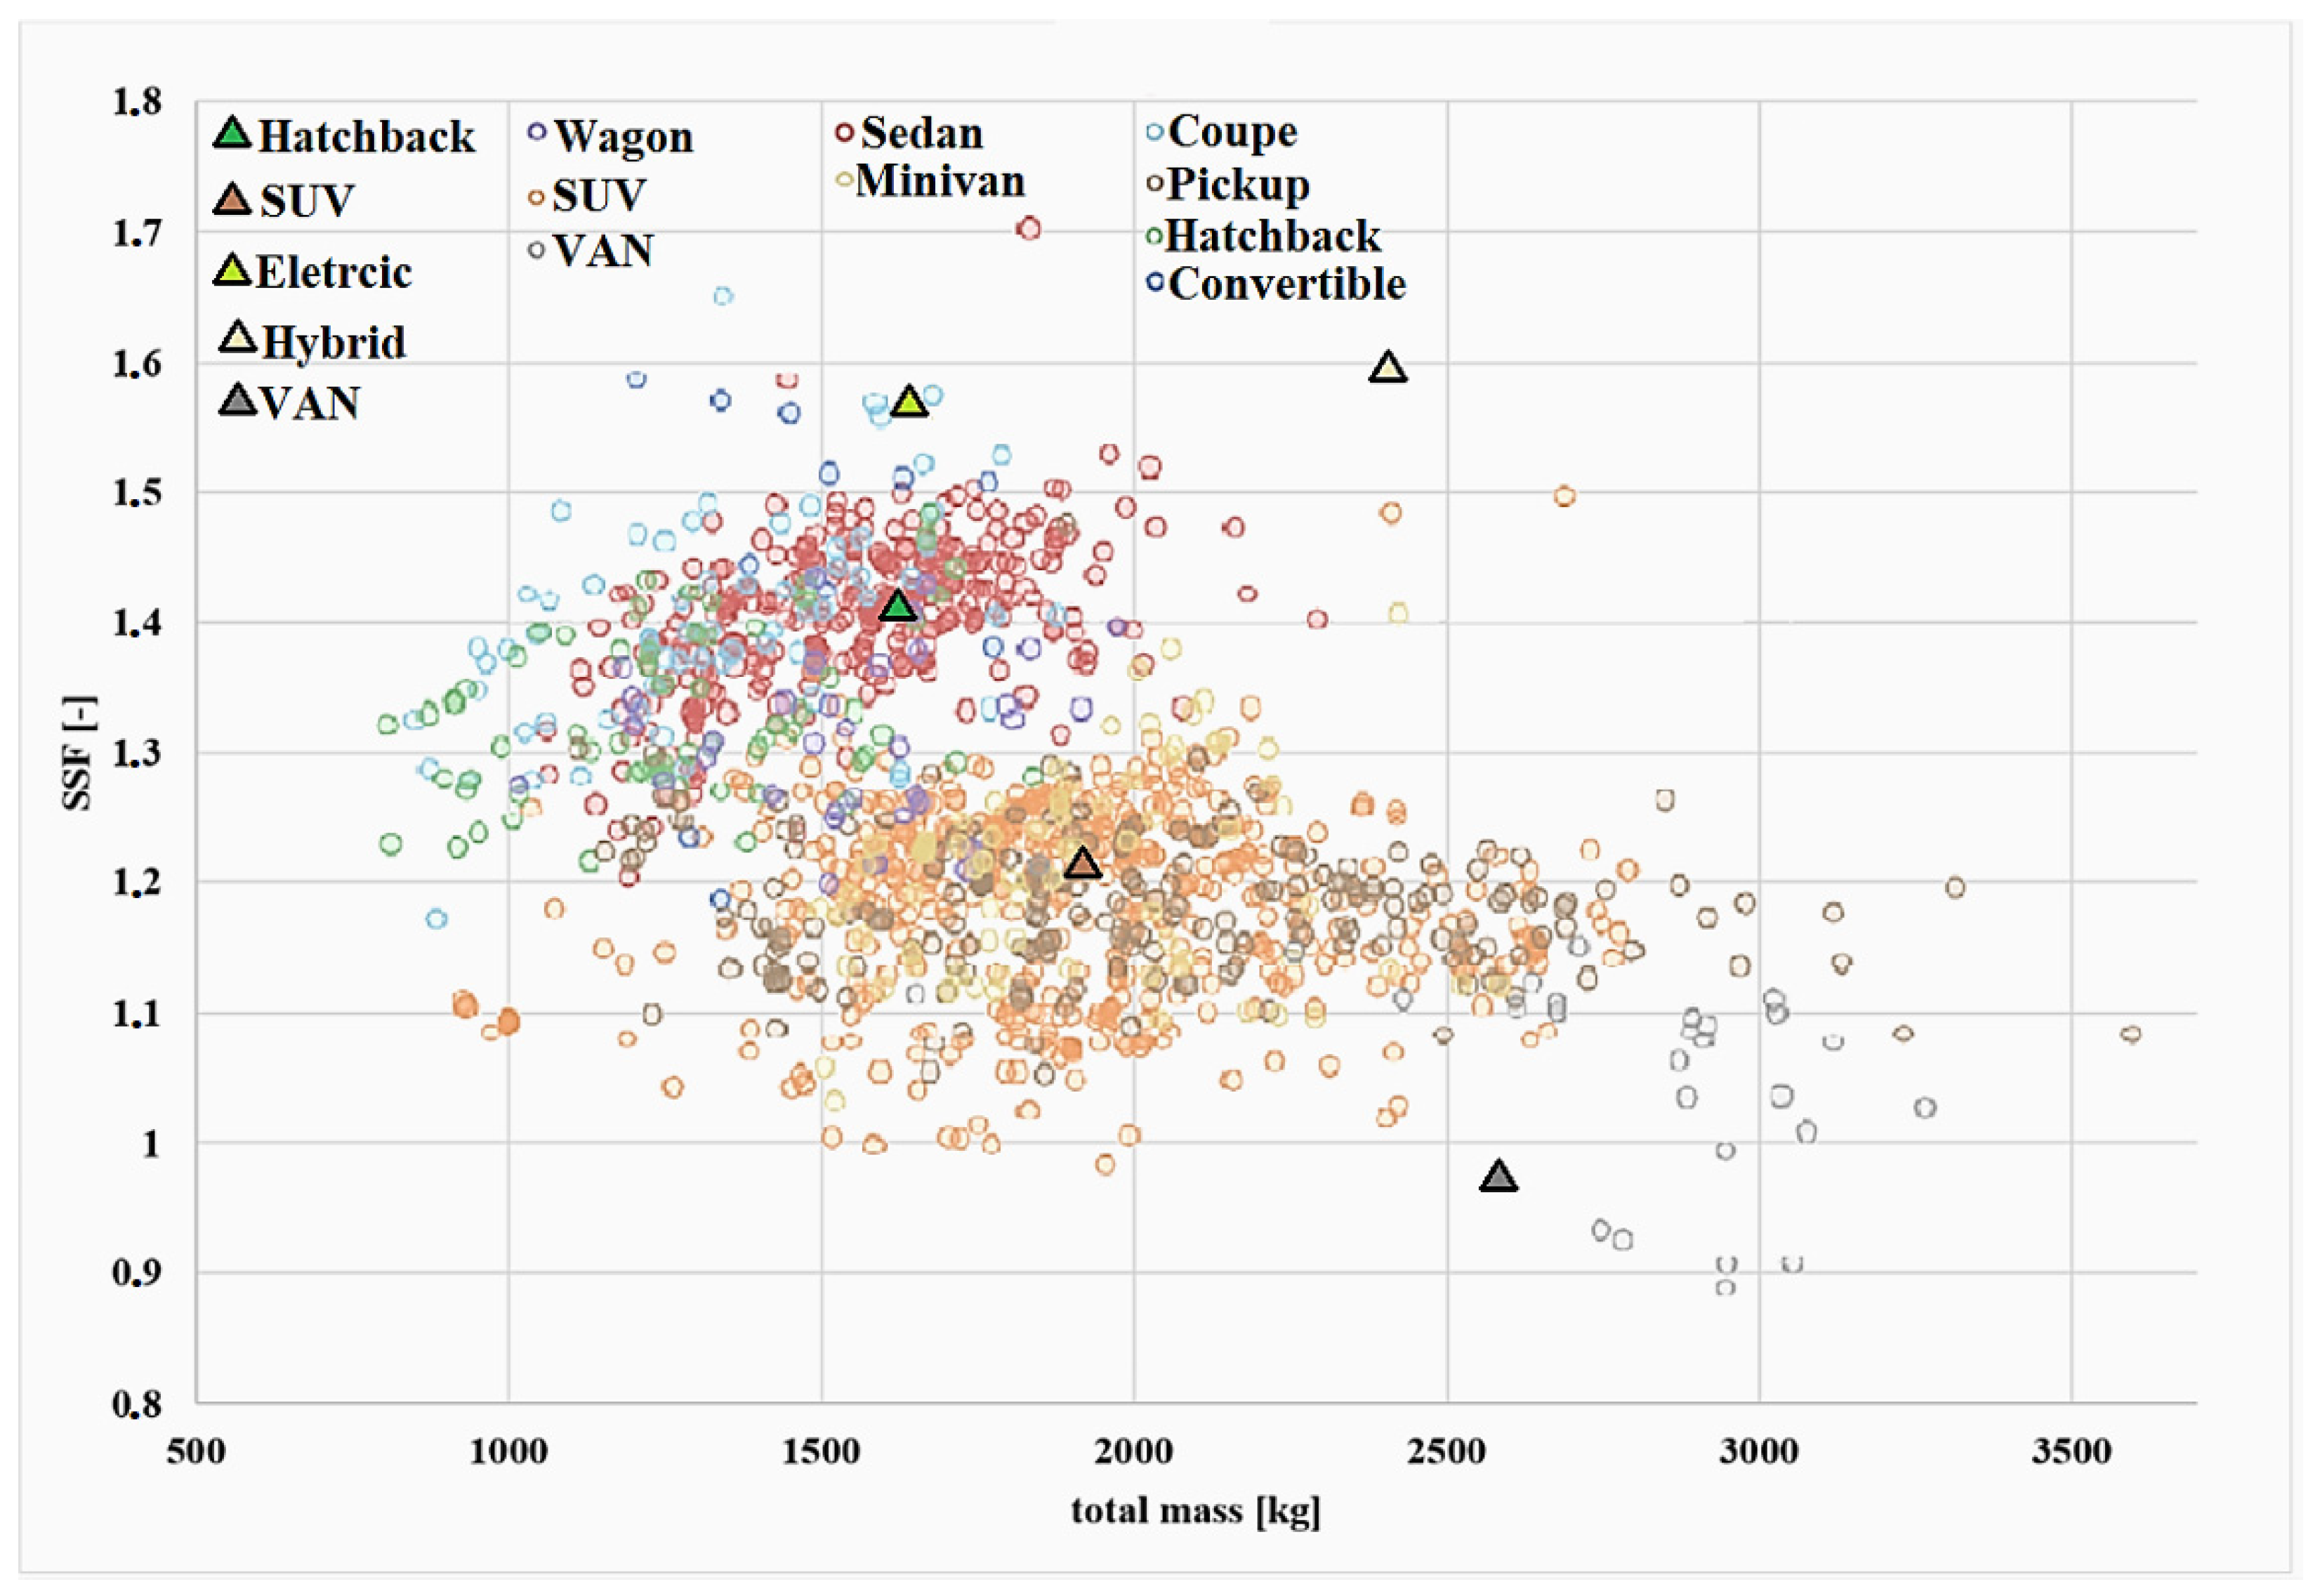
For better comparison, Figure 12 shows the SSF of the vehicles related to the total mass. Like in Figure 10 and Figure 11, Figure 12 shows the values compared to other vehicles. The values of the vehicles assessed in this article are marked by triangle signs.
The highest values of SSF, i.e., the lowest risk of overturning, were in the hybrid vehicles (1.59) and the electric vehicle (1.58).
Another indicator that assesses the impact of the center of gravity’s height on the vehicle driving performances is the dependence of SSF on the roof-height-to-track-width ratio (Figure 13).
The value of SSF decreases visibly together with increasing value of the ratio of the roof height and track width. Again, the hybrid and the electric slightly differs from this trend (Figure 13).

5. Conclusions

The first aim of this study was to simplify, make cheaper, and increase measurement availability, focused on determining the center of gravity’s position through radical innovation of the experimental measurement methodology. The proposed measurement methodology can be, based on the results of extensive experimental measurements, regarded as suitable, repeatable, and applicable for other measurements as well. The advantage of this methodology is also the possibility of smooth regulation of lifting the axle. The contribution of the mentioned methodology is selection of the value of lifting the axle at which it is possible to determine the difference between the weight applied to the axle when weighing in the horizontal position and when weighing with the lifted axle, and, at the same time, without any compensation of body drop due to suspension or without any need of suspension fixation. The measurement methodology can also be used for determining the center of gravity’s position transversely. By using the pallet scales, the weight for each wheel can be determined.
The second—no less important—goal of this article was to quantify the change in the center of gravity’s position in different vehicles due to various load distributions. Based on the result analysis of the measurements, it can be concluded a relatively low risk of the axle overload as a cause of wrong load distribution, even when using the vehicle load capacity more. If the load is placed behind the rear axle, there is a risk of reduction of load of the front axle, which is both steering and driving. However, the main risk is raising the position of the center of gravity, which has a negative impact on safety when bending or applying an avoidance maneuver, decelerating and accelerating. The center of gravity’s height, mainly in relation to the SUV, was also affected by a car body drop on the suspension and tires. Thus, besides depending on the load, the height of the center of gravity also depends on suspension characteristics and the tire stiffness. The car body drop due to the load is problematic for mathematical modeling. The suspension constant, also affected by their technical condition and age, may only be estimated with certain accuracy. Therefore, for this reason, it is justifiable to perform the experimental measurements, which include all the circumstances. Based on the result analysis of the measurements, it may be concluded that even a relatively slight change in load distribution can lead to a substantial change in the axle load, or in the center of gravity’s position. Thus, during the modeling focused on vehicle dynamics or during the investigation of causes and courses of accidents, it is always necessary to take into consideration the load distribution. The centers of gravity’s positions were also determined for vehicles with an electric motor of the plug-in hybrid type as well as for light commercial vehicles. The results were further compared to other vehicles. The measurement results can be used in the modeling of vehicle dynamics as the input values, or values for comparison and discussion, which can be significant practical and scientific contributions of this article. The obtained data can also be used when working with software and calculators focused on load distribution.
By examining the measured results, it was also concluded that it is irrelevant to state the position of the center of gravity with an accuracy of millimeters, let alone hundredths of a millimeter, as the deformation of tires and suspension and different positions of the load affect the position of the center of gravity more than in hundredths of a millimeter.

Author Contributions

Conceptualization, F.S. and E.N.; methodology, F.S.; software, F.S.; validation, F.S. and E.N.; formal analysis, E.N.; investigation, F.S.; resources, F.S.; data curation, F.S.; writing—original draft preparation, F.S. and E.N., writing—review and editing, F.S.; visualization, E.N.; supervision, F.S.; project administration, E.N.; funding acquisition, E.N. All authors have read and agreed to the published version of the manuscript.

Funding

The paper is supported by the VEGA Agency by the Project 1/0485/24 “Increasing the efficiency and sustainability of rail and water transport in the context of environmental impacts” that is solved at Faculty of Operation and Economics of Transport and Communications, University of Žilina.

Institutional Review Board Statement

Not applicable.

Informed Consent Statement

Not applicable.

Data Availability Statement

All the data are already given in this article.

Conflicts of Interest

The authors declare no conflicts of interest.

References

  1. Zhang, S.; Yang, X.; Liu, Y.; Wang, L.; Li, P.; Li, H.; Luo, Y.; Li, Y.; Liu, Q. TruckSim-based study of the rollover accident mechanisms of container semitrailers on freeway interchange loop ramps. PLoS ONE 2024, 19, e0309139. [Google Scholar] [CrossRef] [PubMed]
  2. Lee, D.; Yoo, H.; Shin, M.; Oh, J.; Shim, S.-B. Analysis of Overturning Stability of Small off-Road Vehicle. J. Biosyst. Eng. 2024, 48, 309–318. [Google Scholar] [CrossRef]
  3. Peng, C.; Wei, C.; Solernou, A.; Hagenzieker, M.; Merat, N. User comfort and naturalness of automated driving: The effect of vehicle kinematic and proxemic factors on subjective response. Appl. Ergon. 2025, 122, 104397. [Google Scholar] [CrossRef] [PubMed]
  4. Wiegand, B. Mass properties and automotive directional stability. In Proceedings of the 80th SAWE International Conference on Mass Properties Engineering, Cocoa Beach, FL, USA, 2–6 October 2021. [Google Scholar]
  5. Figueira, M.; Guo, Z. The Influence of Weight Distribution on the Handling Characteristics of Intercity Bus under Steady State Vehicle Cornering Condition. In Proceedings of the 5th International Conference on Transportation and Traffic Engineering (ICTTE), Lucerne, Switzerland, 6–10 July 2016. [Google Scholar]
  6. Wang, X.; Gan, Y.; Lian, M.; Bi, B.; Tang, Y. Identification of Risk Sources of Abnormal Driving Vehicles of Expressway in Port City. J. Coast. Res. 2020, 104, 317–321. [Google Scholar] [CrossRef]
  7. Solmaz, S.; Akar, M.; Shorten, R.; Kalkkuhl, J. Real-time multiple-model estimation of centre of gravity position in automotive vehicles. Veh. Syst. Dyn. 2008, 46, 763–788. [Google Scholar] [CrossRef]
  8. Dontu, A.; Gaiginschi, L.; Barsanescu, P. Reducing the urban pollution by integrating weigh-in-motion sensors into intelligent transportation systems. In Proceedings of the State of the art and future trends, IOP Conference Series: Materials Science and Engineering, Modern Technologies in Industrial Engineering VII (ModTech2019), Iasi, Romania, 19–22 June 2019; Volume 591. [Google Scholar] [CrossRef]
  9. Jablonicky, J.; Tulik, J.; Bártová, S.; Tkáč, Z.; Kosiba, J.; Kuchar, P.; Čorňák, Š.; Kollárová, K.; Kaszkowiak, J.; Tomić, M.; et al. Influence of Decarbonization on Selected Parameters of ICE. Atmosphere 2023, 14, 1271. [Google Scholar] [CrossRef]
  10. Tautkus, A.; Miceviciene, D.; Vaitiekunas, T. Investigation of the load of three axled semi-trailer. In Proceedings of the 11th International Conference on Intelligent Technologies in Logistics and Mechatronics Systems (ITELMS), Panevezys, Lithuania, 28–29 April 2016. [Google Scholar]
  11. Vida, G.; Torok, A. Expected effects of accident data recording technology evolution on the identification of accident causes and liability. Eur. Transp. Res. Rev. 2023, 15, 17. [Google Scholar] [CrossRef]
  12. Gao, X.; Tang, Y.; Xu, H.; Xu, X.; Xu, L.; Yan, L. Vertical load distribution strategy of amphibious wheel-track vehicle using neural network and particle swarm optimization. Proc. Inst. Mech. Eng. Part D J. Automob. Eng. 2024, 238, 563–587. [Google Scholar] [CrossRef]
  13. Imani, M.; Nasyis, T.; Pramujati, B.; Nurahmi, L.; Maulana, H.S.; Faranka, M.A.; Azzuri, M.S.; Wijaya, C.H. Dynamic Analysis of Forklift AGV based on Center of Gravity. In Proceedings of the International Electronics Symposium: Shaping the Future: Society 5.0 and Beyond, IES 2024, Denpasar, Indonesia, 6–8 August 2024. [Google Scholar] [CrossRef]
  14. Khandekar, P.; Badiger, K.; Gautam, A.; Soni, L. A Novel Approach for Combi Braking System Design Considering Tire’s Nonlinear Behavior. In Proceedings of the 18th Symposium on International Automotive Technology, SIAT, SAE Technical Paper, Warsaw, Poland, 23–24 January 2024. [Google Scholar] [CrossRef]
  15. Fan, Y.; Du, C.; Wang, Q. Study on the Influence of the Center of Gravity of Fuel Cell City Bus on its Handling Characteristics. Mechanika 2020, 26, 416–425. [Google Scholar] [CrossRef]
  16. Transport and Environment. Cars Are Getting 1 cm Wider Every Two Years—Research. Available online: https://www.transportenvironment.org/articles/cars-are-getting-1-cm-wider-every-two-years-research (accessed on 7 October 2024).
  17. IEA. Trends in Electric Vehicle Charging, Global EV Outlook 2024. Available online: https://www.iea.org/reports/global-ev-outlook-2024/trends-in-electric-vehicle-charging (accessed on 7 October 2024).
  18. Navarro, H.; Canale, A. Influences of the load center of gravity on heavy vehicle acceleration. Int. J. Heavy Veh. Syst. 2001, 8, 17–47. [Google Scholar] [CrossRef]
  19. Skrucany, T.; Vrabel, J.; Kazimir, P. The influence of the cargo weight and its position on the braking characteristics of light commercial vehicles. Open Eng. 2020, 10, 154–165. [Google Scholar] [CrossRef]
  20. Skrucany, T.; Vrabel, J.; Kendra, M.; Kazimir, P. Impact of Cargo Distribution on the Vehicle Flatback on Braking Distance in Road Freight Transport. In Proceedings of the 18th International Scientific Conference on LOGI, Ceske Budejovice, Czech Republic, 19 October 2017; Volume 134. [Google Scholar] [CrossRef]
  21. Radzajewski, P.; Guzek, M. Assessment of the Impact of Selected Parameters of Tractor-Semitrailer Set on the Braking Safety Indicators. Appl. Sci. 2023, 13, 5336. [Google Scholar] [CrossRef]
  22. Nicolescu, B.; Macarie, T.; Petrescu, T. On the vehicle planar motion. Acta Tech. Napoc. Ser.-Appl. Math. Mech. Eng. 2015, 58, 349–360. [Google Scholar]
  23. Majdan, R.; Abraham, R.; Kollárová, K.; Tkáč, Z.; Matejková, E.; Kubík, Ľ. Alternative Models for Calculation of Static Overturning Angle and Lateral Stability Analysis of Subcompact and Universal Tractors. Agriculture 2021, 11, 861. [Google Scholar] [CrossRef]
  24. TRID. Traffic Safety Facts 2018: A Compilation of Motor Vehicle Crash Data; DOT HS 812 981; National Academies of Sciences, Engineering, and Medicine: Washington, DC, USA, 2020. [Google Scholar]
  25. Tengler, S.; Harlecki, A. Dynamics of vehicles with high gravity center. Theor. Appl. Mech. Lett. 2012, 2, 043014. [Google Scholar] [CrossRef]
  26. Brandt, A.; Jacobson, B.; Sebben, S. High speed driving stability of road vehicles under crosswinds: An aerodynamic and vehicle dynamic parametric sensitivity analysis. Veh. Syst. Dyn. 2021, 60, 2334–2357. [Google Scholar] [CrossRef]
  27. Raessa, M.; Fanni, M.; Mohamed, A. Dynamics Analysis and Control of All-Terrains Wearable Vehicle. In Proceedings of the IEEE International Conference on Industrial Technology (ICET), Taipei, Taiwan, 14–17 March 2016. [Google Scholar] [CrossRef]
  28. Lugner, P.; Edelmann, J. Basics of Vehicle Dynamics, Vehicle Models. Veh. Dyn. Mod. Passeng. Cars 2019, 582, 1–45. [Google Scholar] [CrossRef]
  29. Kutluay, E.; Winner, H. Validation of vehicle Dynamics simulation models—A review. Veh. Syst. Dyn. 2014, 52, 186–200. [Google Scholar] [CrossRef]
  30. Ersal, T.; Kittirungsi, B.; Fathy, H.; Stein, J.L. Model reduction in vehicle Dynamics using importance analysis. Veh. Syst. Dyn. 2009, 47, 851–865. [Google Scholar] [CrossRef]
  31. Yue, H.; Zhang, L.; Shan, H.; Liu, H.; Liu, Y. Estimation of the vehicle’s center of gravity based on a braking model. Veh. Syst. Dyn. 2015, 53, 1520–1533. [Google Scholar] [CrossRef]
  32. Sar, H.; Fundowics, P. Empirical equations for determining the height of the center of mass of a passenger car. In Proceedings of the 11th International Scientific and Technical Conference on Automotive Safety, Casta Papiernicka, Slovakia, 18–20 April 2018. [Google Scholar] [CrossRef]
  33. Krauze, P. Modelling and Identification of Magneto theological Vehicle Suspension. In Proceedings of the 17th International Conference on Methods and Models in Automation and Robotics (MMAR), Miedzyzdroje, Poland, 27–30 August 2012. [Google Scholar] [CrossRef]
  34. Xu, Q.; Fu, R.; Wu, F.; Wang, B. Road side estimation of a vehicle’s center of gravity height based on an improved single-stage detection algorithm and regression prediction technology. IEEE Sens. J. 2021, 21, 24520–24530. [Google Scholar] [CrossRef]
  35. Lin, C.; Gong, X.; Xiong, R.; Cheng, X. A novel H-infinity and EKF joint estimation method for determining the center of gravity position of electric vehicles. Appl. Energy 2017, 194, 609–616. [Google Scholar] [CrossRef]
  36. Huang, X.; Wang, J. Real-time estimation of center of gravity position for light weight vehicles using combined AKF-EKF method. IEEE Trans. Veh. Technol. 2014, 63, 4221–4231. [Google Scholar] [CrossRef]
  37. Huang, X.; Wang, J. Center of gravity height real-time estimation for lightweight vehicles using tire instant effective radius. Control. Eng. Pract. 2013, 21, 370–380. [Google Scholar] [CrossRef]
  38. Jeong, D.; Kim, S.; Lee, J.; Choi, S.B.; Kim, M.; Lee, H. Estimation of TireLoad and Vehicle Parameters Using Intelligent Tires Combined with Vehicle Dynamics. IEEE Trans. Instrum. Meas. 2020, 70, 9502712. [Google Scholar] [CrossRef]
  39. Braghin, H.; Brusarosco, M.; Cheli, F.; Cigada, A.; Manzoni, S.; Mancosu, F. Measurement of contact forces and patch features by means of accelerometers fixed inside the tire to improve future caractive control. Veh. Syst. Dyn. 2006, 44, 3–13. [Google Scholar] [CrossRef]
  40. Jeong, D.; Lee, J.; Choi, S.; Kim, M. Load Estimation of Intelligent Tires Equipped with Acceleration Sensors. In Proceedings of the 2019 IEEE Sensors Applications Symposium (SAS), Conference Proceedings, Sophia Antipolis, France, 11–13 March 2019. [Google Scholar] [CrossRef]
  41. Lee, H.; Tahery, S. Intelligent tires—A review of tire characterization literature. EEE Intell. Transp. Syst. Mag. 2017, 9, 114–135. [Google Scholar] [CrossRef]
  42. Wang, F.; Chen, Y. Vehicle Rollover Propensity Detection Based on a Mass-Center-Position Metric: A Continuous and Completed Method. IEEE Trans. Veh. Technol. 2019, 68, 1. [Google Scholar] [CrossRef]
  43. Doumiati, M.; Victorino, A.; Charara, A.; Lechner, D. Lateral load transfer and normal forces estimation for vehicle safety: Experimental test. Veh. Syst. Dyn. 2009, 47, 1511–1533. [Google Scholar] [CrossRef]
  44. Markovsky, I.; Huffel, V. Overview of total least-squares methods. Signal Procesing 2007, 87, 2283–2302. [Google Scholar] [CrossRef]
  45. Hylier, T.; Bevly, D. Vehicle Load Estimation Using Recursive Total Least Squares for Rollover Detection; SAE Technical Papers; SAE International: Warrendale, PA, USA, 2022. [Google Scholar] [CrossRef]
  46. Wang, L.; Zheng, H.; Zong, C.; Chen, Y. Vehicle Mass Estimation for Heavy Duty Vehicle; SAE Technical Papers; SAE International: Warrendale, PA, USA, 2015. [Google Scholar] [CrossRef]
  47. Kubica, P. Device for Measuring the Height Position of the Center of Gravity of the Vehicle. Available online: http://hdl.handle.net/11012/39436 (accessed on 17 November 2023).
  48. Schiller GmbH: Vehicle Inertia Measuring Machine. Available online: http://cfm-schiller.de/pdf/CFM%20Schiller%20VIMM%20%20Vehicle%20Inertia%20Measuring%20Machine%20en.pdf (accessed on 17 November 2023).
  49. Center of Gravity and Inertia Testing. Available online: https://sealimited.com/capability/center-of-gravity-and-inertia/ (accessed on 17 November 2023).
  50. Win, T.; Alakin, V.; Plakhov, S. Development of a Methodology and Study of the Center of Gravity of a Vehicle. In Lecture Notes in Mechanical Engineering, Proceedings of the 8th International Conference on Industrial Engineering; Springer: Berlin/Heidelberg, Germany, 2023; pp. 411–420. [Google Scholar] [CrossRef]
  51. Khorosandi, F.; Ayers, P.; Freeland, R.; Wang, X. Modeling the effect of liquid movement on the center of gravity calculation of agricultural vehicles. J. Terramechanics 2018, 75, 37–48. [Google Scholar] [CrossRef]
  52. Axle Weighers, Axle Scale by Weigh Capacities. Available online: https://www.cublift.com/axle-scales/ (accessed on 4 May 2023).
  53. Widner, A.; Bári, G. Comparison of Center of Gravity Height Estimation Methods. Lect. Notes Mech. Eng. 2021, 22, 293–301. [Google Scholar] [CrossRef]
  54. Wang, X.; Gao, L.; Ayers, P.D.; Su, S.; Yuan, C. The influence of the lift angle on the center of gravity: Measurements for zero turning radius mowers. Appl. Eng. Agric. 2016, 32, 189–199. [Google Scholar] [CrossRef]
  55. Fuerbeth, U. Centre of gravity of motor vehicles. Forensic Sci. Int. 2024, 31, 112073. [Google Scholar] [CrossRef] [PubMed]
  56. Jin, X.; Wang, Z.; Yang, J.; Ikiela, N.V.O.; Yin, G. A Novel Methodology for Inertial Parameter Identification of Lightweight Electric Vehicle via Adaptive Dual Unscented Kalman Filter. Int. J. Automot. Technol. 2024, 25, 1113–1125. [Google Scholar] [CrossRef]
  57. Wu, F.; Sun, C.; Li, H.; Zheng, S. Real-Time Center of Gravity Estimation for Intelligent Connected Vehicle Based on HEKF-EKF. Electronics 2023, 12, 386. [Google Scholar] [CrossRef]
  58. Lin, C.; Cheng, X.; Zhang, H.; Gong, X. Estimation of Center of Gravity Position for Distributed Driving Electric Vehicles Based on Combined H-infinity-EKF Method. Energy Proc. 2016, 88, 970–977. [Google Scholar] [CrossRef]
  59. Jin, X.; Yang, J.; Xu, L.; Wei, C.; Wang, Z.; Yin, G. Combined Estimation of Vehicle Dynamic State and Inertial Parameter for Electric Vehicles Based on Dual Central Difference Kalman Filter Method. Chin. J. Mech. Eng. 2023, 36, 91. [Google Scholar] [CrossRef]
  60. Reyneh, M.; Enqvist, M.; Gustafsson, F. IMU-based vehicle load estimation under normal driving conditions. In Proceedings of the IEEE Conference on Decision and Control, Los Angeles, CA, USA, 15–17 December 2014; Volume 2015, pp. 3376–3381. [Google Scholar] [CrossRef]
  61. Redl, J.; Boyko, G.; Kalantari, D. Prediction of Machine’s Centre of Gravity Dislocation with Monte Carlo Simulation. Acta Technol. Agric. 2024, 27, 133–141. [Google Scholar] [CrossRef]
  62. Li, X.; Zhang, M.; Yan, X.; Liu, M.; Xu, L. Real-time estimation of barycenter position for fuel cell distributed drive electric tractor based on derived UKF. Veh. Syst. Dyn. 2024, 62, 2661–2685. [Google Scholar] [CrossRef]
  63. Skrúcaný, T.; Synák, F.; Semanová, Š.; Ondruš, J.; Rievaj, V. Detection of road vehicle gravity. In Proceedings of the 2018 11th International Science and Technical Conference Automotive Safety, Casta Papiernicka, Slovakia, 18–20 April 2018; pp. 1–7. [Google Scholar] [CrossRef]
  64. Janosko, I.; Polonec, T.; Simor, R.; Blazek, J.; Brabec, P.; Vozenilek, R. Electronic encyclopaedia of construction engines and vehicles. In Proceedings of the 41st International Scientific Conference of Czech and Slovak University Departments and Institutions Dealing with the Research of Internal Combustion Engines, Liberec, Czech Republic, 6–7 September 2010; pp. 232–238, ISBN 978-80-7372-632-4. [Google Scholar]
  65. Technical Data Kia. Available online: https://www.cars-data.com/en/ (accessed on 6 September 2024).
  66. Technical Data VW. Available online: https://www.carfolio.com/search/results/?terms=volkswagen (accessed on 6 September 2024).
  67. User Manual for KPZ 52E-7/1. Available online: https://kpzwagi.pl/wagi-przemyslowe/panele-sterujace/panel-steruj-cy-kpz-52e-7-1/ (accessed on 4 May 2023).
  68. Frequently Asked Questions on Pallet Truck Scales. Available online: https://www.camaweigh.com/blog/post/faqs-on-pallet-truck-scales/, (accessed on 17 November 2023).
  69. Rievaj, V.; Vrábel, J.; Synák, F.; Bartuška, L. The effects of vehicle load on driving characteristics. Adv. Sci. Technol.-Res. J. 2018, 12, 142–149. [Google Scholar] [CrossRef] [PubMed]
  70. Kang, S.; Kim, Y.; Park, H.; Kim, Y.; Woo, S.; Uyeh, D.D.; Ha, Y. Rollover Safety and Workable Boundary Suggestion of an Agricultural Platform with Different Attachments. Agriculture 2022, 12, 1148. [Google Scholar] [CrossRef]
  71. Zhao, N.; Dong, Y.; Yan, D.; Feng, X.; Cui, L. Enhanced assessment framework of static stability of tracked vehicles in consideration of multi-directional loading. J. Terramechanics 2024, 115, 100984. [Google Scholar] [CrossRef]
  72. Filo, M.; Puskar, M.; Kelemenova, T.; Kelemen, M.; Kolarikova, I.; Kral, J. Calibration Tool for Tilt Sensors for Checking the Instability of Motor Vehicles. MM Sci. J. 2024, 7260–7264. [Google Scholar] [CrossRef]
  73. User Manual for LP7516. Available online: https://www.topmaq.co.nz/content/products/pallet-weigh-platform-with-digital-scales-2ton-mapa1900-mapa1900-man1.pdf?srsltid=AfmBOoqzr1TZLRe75V02O2HKzJKmtySLOMaOPKicvk5wKcWeuazu_3q2 (accessed on 6 September 2024).
  74. Kamain, Y.; Zhukov, M.; Panickhin, A.; Redelin, A. Modeling of load lifting process with unknown center of gravity position. IOP Conf. Ser.-Mater. Sci. Eng. 2018, 327, 022054. [Google Scholar] [CrossRef]
  75. Yang, Y.; Zhou, X.; Yang, C.; Mo, J. Dynamic distribution method of multi-axle vehicle’s driving axle load on test bench. Zhejiang DaxueXuebao/J. Zhejiang Univ. (Eng. Sci.) 2014, 48, 1080–1085. [Google Scholar] [CrossRef]
  76. Wang, C.; Li, W.; Zhao, W.; Duan, T. Torque Distribution of Electric Vehicle with Four In-Wheel Motors Based on Road Adhesion Margin; Transactions of Nanjing University of Aeronautics and Astronautics: Nanjing, China, 2019; Volume 36. [Google Scholar] [CrossRef]
  77. Hosseinian, A.; Melzi, S. Numerical analysis of the influence of an actively controlled spoiler on the handling of a sports car. J. Vib. Control. 2018, 24, 5437–5448. [Google Scholar] [CrossRef]
  78. Preda, I.; Ciolan, G.; Covaciu, D. Aspects Regarding the Stability Performances Calculation of the Wheeled Vehicles While Turning. In Proceedings of the 30th SIAR International Congress of Automotive and Transport Engineering, Craiova, Romania, 23 – 25 October 2020; pp. 614–623. [Google Scholar] [CrossRef]
  79. Arslan, T.A.; Çelik, I.; Aysal, F.E.; Bayrakçeken, H. Investigation of the Effects of Axle Load on Tire Behaviour in Vehicle. J. Polytech. 2024, 27, 603–614. [Google Scholar] [CrossRef]
  80. Jilek, P.; Nemec, J. System for changing the radial response on car wheels. Acta Univ. Agric. Silvic. 2020, 68, 39–47. [Google Scholar] [CrossRef]
  81. Sharaf, A.; Yacoub, M.; Elhefnawy, A. Improving the stability of a bullet proofed vehicle using modified suspension system. In Proceedings of the ASME International Design Engineering Technical Conferences/Computers and Information in Engineering Conference (IDETC-CIE), Anaheim, CA, USA, 17–19 August 2020. [Google Scholar] [CrossRef]
  82. Sabouri, M.; Hamidi, A. Introducing a revised model for determination of rollover threshold speed of buses. Int. J. Heavy Veh. Syst. 2020, 27, 723–742. [Google Scholar] [CrossRef]
  83. Bruni, S.; Meijaard, J.; Rill, G.; Schwab, A. State-of-the-art and challenges of railway and road vehicle dynamics with multi body dynamics approaches. Multi Body Syst. Dyn. 2020, 49, 1–32. [Google Scholar] [CrossRef]
  84. Skrucany, T.; Gnap, J. The Effect of the Crosswinds on the Stability of the Moving Vehicles. In Proceedings of the 6th International Scientific Conference on Dynamic of Civil Engineering and Transport Structures and Wind Engineering (DYN-WIND), Donovaly, Slovakia, 25–29 May 2014; Volume 617, pp. 296–301. [Google Scholar] [CrossRef]
  85. Jurco, A. Study of the influence of roof luggage box on a vehicle aerodynamics. Ingeniria Automob. 2021, 58, 15–18. [Google Scholar]
  86. LLatif, M.A.; Hashim, M.; Rashid, M.; Azhari, M.; Othman, M. Roof Box Shape Streamline Adaptation and the Impact towards Fuel Consumption. Eng. Technol. Int. Conf. (ETIC) 2017, 97, 6. [Google Scholar] [CrossRef]
  87. Makihara, T.; Kitamura, T.; Yamashita, T.; Maeda, K.; Kato, C.; Takayama, T.; Yamamoto, K.; Yamade, Y.; Suzuki, Y. Identification of Vortical Structure that Drastically Worsens Aerodynamic Drag on a 2-Box Vehicle using Large-scale Simulations. SAE Int. J. Passeng. Cars-Mech. Syst. 2016, 9, 592–602. [Google Scholar] [CrossRef]
  88. Mashadi, B.; Ebrahimi, N.; Marzbanrad, J. Effect of front-wheel drive or rear-wheel drive on the limit handling behaviour of passenger vehicles. Proc. Inst. Mech. Eng. Part D-J. Automob. Eng. 2007, 221, 393–403. [Google Scholar] [CrossRef]
  89. Wang, J.; Chen, X.; Shen, J.; Yan, J. Study on Improvement of Climbing Ability of Multi-Motor Driven Vehicle. IOP Conf. Ser. Earth Environ. Sci. 2019, 252, 032182. [Google Scholar] [CrossRef]
  90. Majdan, R.; Abraham, R.; Tkac, Z.; Tkáč, Z.; Drlička, R.; Matejková, E.; Kollárová, K.; Mareček, J. Static Lateral Stability of Tractor with Rear Wheel Ballast Weights: Comparison of ISO 16231-2 (2015) with Experimental Data Regarding Tire Deformation. Appl. Sci. 2021, 11, 381. [Google Scholar] [CrossRef]
  91. Wang, X.; Ayers, P.; Womac, A. Static Simulation and Analyses of Mower’s ROPS Behavior in a Finite Element Model. J. Agric. Saf. Health 2009, 15, 335–352. [Google Scholar] [CrossRef]
  92. Wiesalla, J.; Mao, Y.; Esser, F. Using Generic Tire Parameters for Low Friction Surfaces in Full Vehicle Simulations. SAE Int. J. Veh. Dyn. Stab. NVH 2017, 1, 190–197. [Google Scholar] [CrossRef]
  93. Beal, C.; Brennan, S. Modeling and friction estimation for automotive steering torque at very low speeds. Veh. Syst. Dyn. 2020, 59, 458–484. [Google Scholar] [CrossRef]
  94. Kondakov, S.; Pavlovskaya, O.; Aliukov, S.; Smirnov, V. Modeling of the Automatic Power Distribution System Among the Traction Motors of the Driving Wheels of a Multi-Axle Vehicle; SAE Technical Papers; SAE International: Warrendale, PA, USA, 2023. [Google Scholar] [CrossRef]
  95. Dubrovskiy, A.; Aliukov, S.; Keller, A.; Dubrovskiy, S.; Alyukov, A. Adaptive Suspension of Vehicles with Wide Range of Control; SAE Technical Papers; SAE International: Warrendale, PA, USA, 2016. [Google Scholar] [CrossRef]
  96. Dong, G.; Zhang, N.; Du, H. Investigation into untripped rollover of light vehicles in the modified fishhook and the sine manoeuvres, part II: Effects of vehicle inertia property, suspension and tire characteristics. Veh. Syst. Dyn. 2011, 49, 949–968. [Google Scholar] [CrossRef]
  97. Hejtmanek, P.; Blatak, O.; Vancura, J. New Approach to measure the Vehicle Center of Gravity Height. Perner’s Contacts 2015, 10, 18–27. [Google Scholar]
  98. Kim, Y.Y.; Noh, J.S.; Shin, S.Y.; Byoungln, K.; Hong, S.J. Improved Method for Determining the Height of Center of Gravity of Agricultural Tractors. J. Biosyst. Eng. 2016, 41, 170–176. [Google Scholar] [CrossRef]
  99. Load Expert Software, Axle Load Calculation Software. Available online: https://www.loadxpert.com/axle-load-calculation-software/ (accessed on 7 October 2024).
  100. NTEA Vehicle Center of Gravity Axle Weight Calculator. Available online: https://www.ntea.com/weightcalculator (accessed on 7 October 2024).
  101. Corner Balance Calculator. Available online: https://robrobinette.com/corner_weight_calc.htm#google_vignette (accessed on 7 October 2024).
  102. NZ Transport Agency, Axle Weights Calculator. Available online: https://www.nzta.govt.nz/vehicles/choosing-the-right-vehicle/choosing-and-operating-a-heavy-vehicle/axle-weights-calculator/ (accessed on 7 October 2024).
  103. Axle Load Calculator. Available online: https://donbur.co.uk/gb-en/calculator/trailer-axle-load/index.php (accessed on 7 October 2024).
  104. Truck Stow. Available online: https://truck-stow-tudent.software.informer.com/ (accessed on 7 October 2024).
  105. Trends in Vehicle Centre of Gravity Height and Static Stability Factor from 1971 to 2020 using the NHTSA LVIPD and NCAP Rollover Stability Measurements. Available online: https://kktse.github.io/jekyll/update/2022/07/28/trends-in-vehicle-cg-height-and-ssf.html (accessed on 6 September 2024).
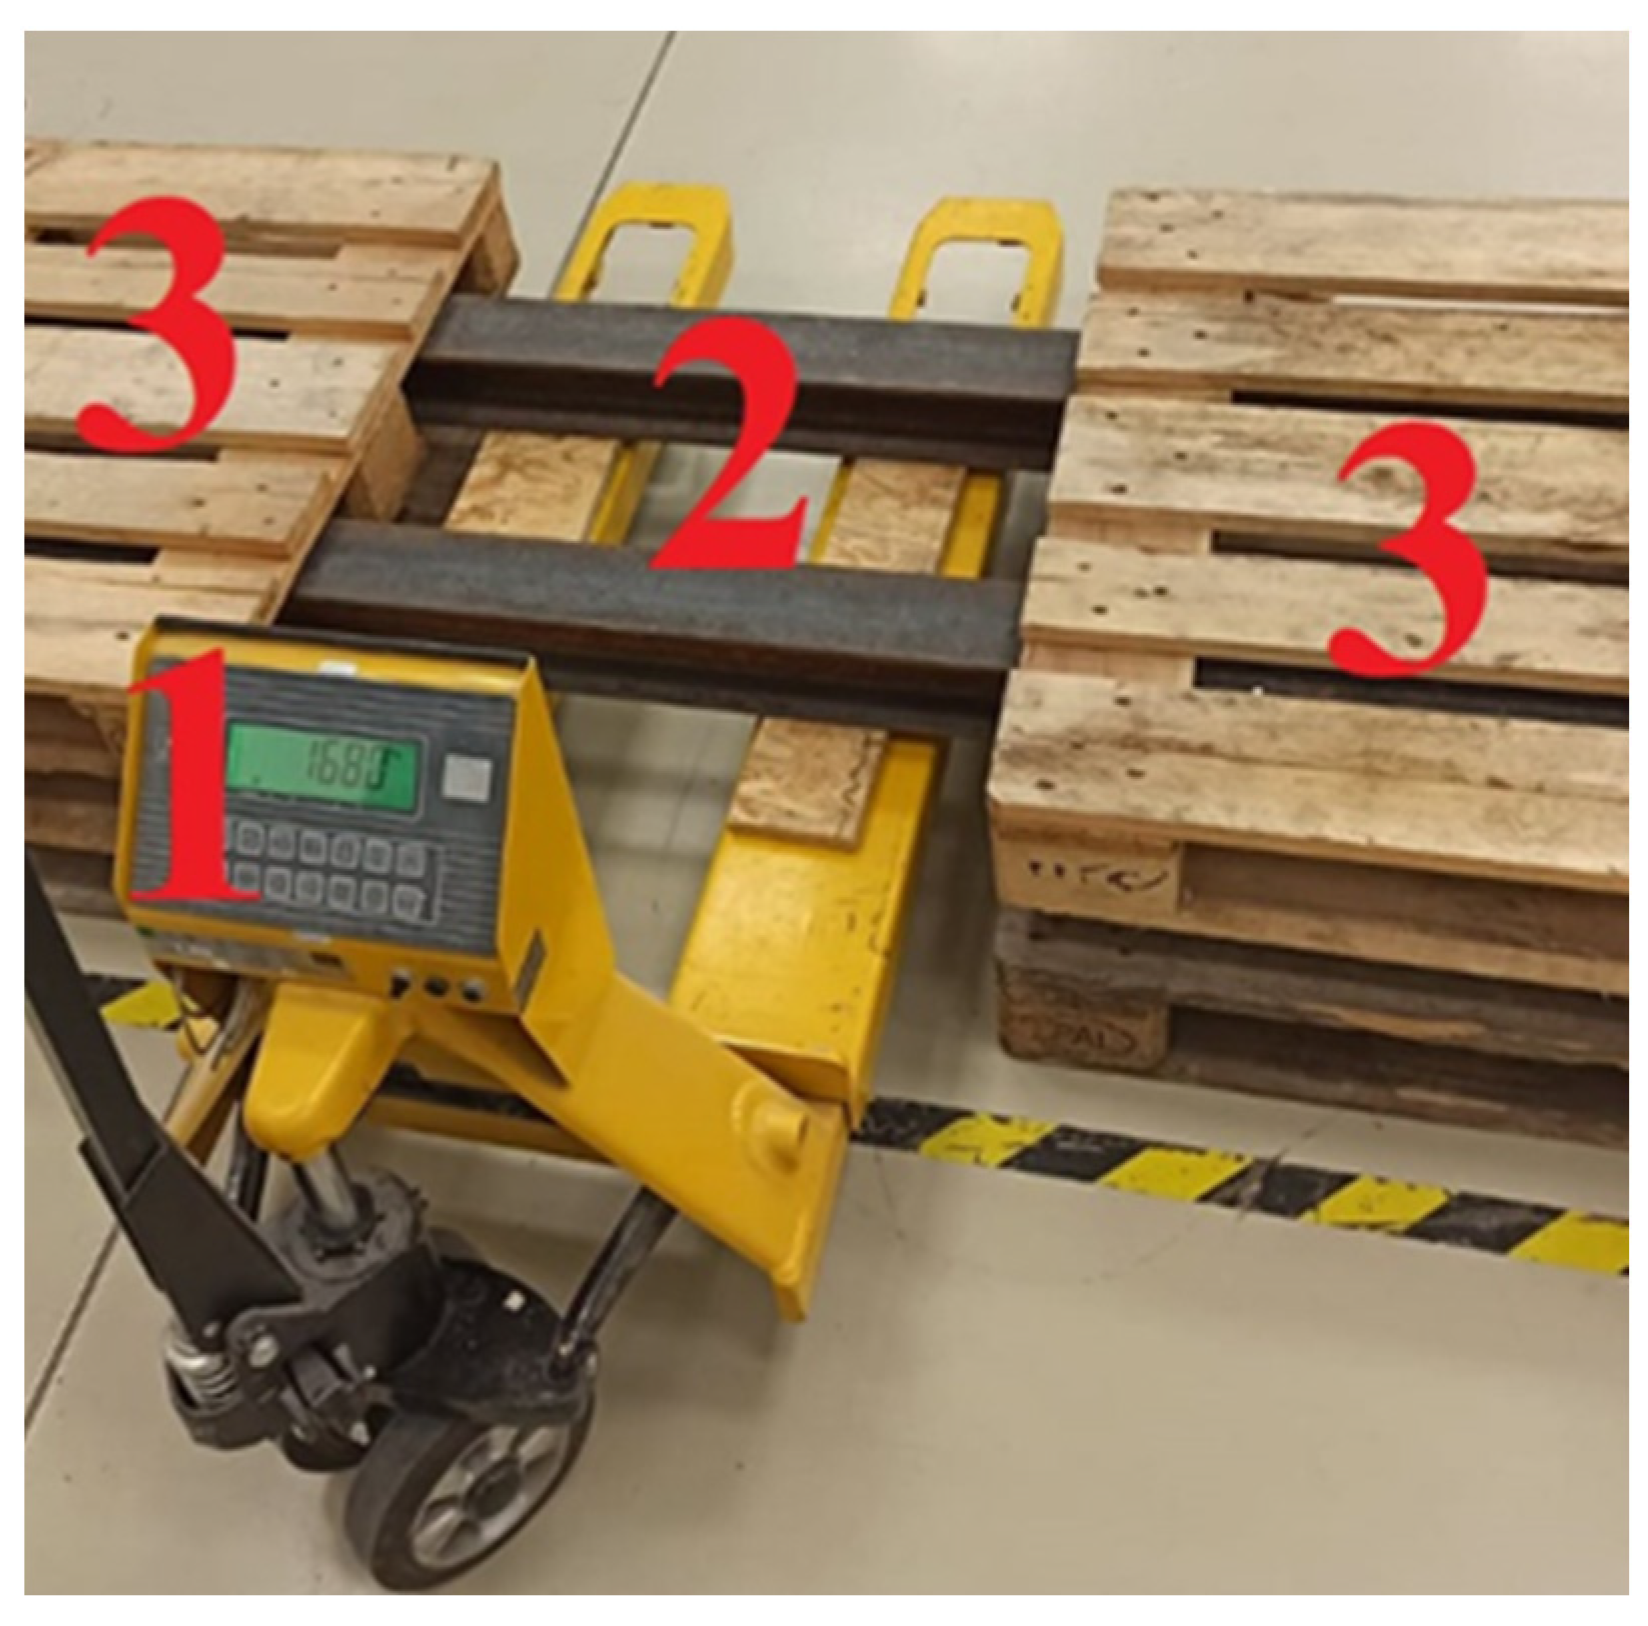
Figure 1. Pallet truck with pallets used for measuring the axle load.
Applsci 14 09328 g001
Figure 2. Principle of determining the axle load via the weight scale pallet truck in the horizontal direction.
Applsci 14 09328 g002
Figure 3. Principle of determining the axle load via the weight scale pallet truck in the vertical direction.
Applsci 14 09328 g003
Figure 4. SUV during measurements.
Applsci 14 09328 g004
Figure 5. Load of 400 kg placed in the luggage compartment and on the lowered rear seats of SUV.
Applsci 14 09328 g005
Figure 6. Electric during measurements.
Applsci 14 09328 g006
Figure 7. Position of the center of gravity of hatchback.
Applsci 14 09328 g007
Figure 8. Position of the center of gravity of SUV.
Applsci 14 09328 g008
Figure 9. Position of the center of gravity of electric, hybrid, and VAN.
Applsci 14 09328 g009
Figure 10. Center of gravity and model year.
Applsci 14 09328 g010
Figure 11. Center of gravity and vehicle mass.
Applsci 14 09328 g011
Figure 12. SSF and vehicle mass.
Applsci 14 09328 g012
Figure 13. SSF and height to track width.
Applsci 14 09328 g013
Table 1. Literature review.
Author and YearResearch Focus
Sar, H., Fundowics, P, 2018 [32],
Redl, J., Boyko, G., Kalantari, D, 2024 [61]
Use of the Monte Carlo method and using known vehicle parameters. Neglecting the impact of suspension, damping, and tire characteristics on the change in the center of gravity’s height.
Yue, H, Zhang, L., Shan, S., et al., 2015 [31]
Li, X., Zhang, M., Yan, X., et al., 2024 [62]
Estimation of the center of gravity’s height based on data obtained from displacement and velocity sensors. Such estimations have mean absolute errors of 14.2% and 5.0% of the state amplitude, respectively.
Xu, Q., Fu, R., Wu, F., et al., 2021, [34]Identification of a specific vehicle model by sensors and subsequent assignment of the center of gravity’s position from a database, regardless of the actual vehicle load.
Lee, H., Tahery, S. 2017, [41]
Doumiati, M., Victorino, A., Charara, A., et al., 2009, [43]
Estimation of the center of gravity’s position based on data obtained from specialized sensors in the tires, with errors exceeding 30%.
Kubica, P., 2023, [47]Experimental measurements based on the vehicle’s moments of inertia. The equipment is very money-demanding with deviations exceeding 20%.
Schiller, 2023 [48]
This publicationExperimental measurements using readily available tools and aids.
Table 2. Technical parameters of vehicles [65,66].
VehicleKia Ceed, 1.6 CVVT (Hatchback)Kia Sportage (SUV)BMW i3s
(Electric)
Kia Sportage Plug-in (Hybrid)Volkswagen Transporter (VAN)
Engine1.6 CVVT1.7 CRDI,Electric motor1.6 GDi1.9TDI
Engine power, engine type93 kW, spark-ignition85 kW, compression ignition75 kW
Synchronous
44 kW, ignition + electric62 kW, compression ignition
Outside size, body size (l/w/h) (mm)4235/1790/
1480
4440/1855/
1635
4011/1775/
1598
4515/1865/
1650
4890/1904/
1990
Wheelbase (mm)26502640257426853013
Total mass17101940173024152600
Kerb mass (kg)12631390136519221800
Wheelbase (kg)447550365493800
Roof load (kg)80100758080
Table 3. Measured values of hatchback.
VariantFront Axle (kg)Rear Axle (kg)Lifted front Axle (kg)
Empty vehicle789.0516.5768.5
Load in the luggage compartment776.5734.5745.5
Load on the rear seats827.5684.0804.0
Load in the luggage compartment and in the roof box806.0716.0773.5
Load in the roof box only815.0573.0785.5
Load on the rear seats and in the roof box841.0681.5807.0
Load on the rear seats, empty roof box831692800.5
Load in the luggage compartment, empty roof box778745748.5
Empty vehicle, empty roof box792.5524.5771.5
Table 4. Measured deviations of hatchback.
VariantMeasured Vehicle Mass (kg)Theoretical Vehicle Mass (kg)Deviation (%)
Load in the luggage compartment1511.01510.5+0.03
Load on the rear seats1511.51510.5+0.06
Load in the luggage compartment and in the roof box1522.01522.00.00
Load in the roof box only1388.01381.0+0.50
Load on the rear seats and in the roof box1522.51522.0+0.03
Load on the rear seats, empty roof box1523.01522.0+0.06
Load in the luggage compartment, empty roof box1523.01522.0+0.06
Empty vehicle, empty roof box1317.01317.00.00
Table 5. Division of vehicle mass into the front and rear axles of hatchback and the distance of the center of gravity from the axles.
VariantFront Axle Load (%)Rear Axle Load (%)Change (%)L1 (m)L2 (m)Change (m)
Empty vehicle60.4439.560.001.051.600.00
Load in the luggage
compartment
51.3948.619.051.291.360.24
Load on the rear seats54.7545.255.691.201.450.15
Load in the luggage
compartment and in the roof box
52.9647.047.481.251.400.20
Load in the roof box only58.7241.281.721.091.560.04
Load on the rear seats and in the roof box55.2444.765.201.191.460.14
Load on the rear seats, empty roof box54.5645.445.881.201.450.15
Load in the luggage compartment, empty roof box51.0848.929.361.301.350.25
Empty vehicle, empty roof box60.1739.830.271.061.590.01
Table 6. The height of the hatchback’s center of gravity and the theoretical speed of driving at the limit of overturning.
Varianthc (m)Change (%)/
(m)
Theoretical Speed Limit (km·h−1)Change (%)/
(km·h−1)
Theoretical Rollover Angle
(°)
Empty vehicle0.560 /087.650/050.71
Load in the luggage compartment0.6210.71/0.0683.20−5.07/−4.4551.70
Load on the rear seats0.6312.5/0.0782.53−5.84/−5.1251.25
Load in the luggage compartment and in the roof box0.6516.07/0.0981.23−7.33/−6.4250.37
Load in the roof box only0.6617.86/0.1080.60−8.04/−7.0549.94
Load on the rear seats and in the roof box0.6719.64/0.1179.99−8.74/−7.6649.51
Load on the rear seats, empty roof box0.6312.5/0.0782.53−5.84/−5.1251.25
Load in the luggage compartment, empty roof box0.6210.71/0.0683.20−5.08/−4.4551.70
Empty vehicle, empty roof box0.560/087.650.00/0.0050.71
Table 7. Measured values of SUV.
VariantFront Axle (kg)Rear Axle (kg)Lifted Front Axle (kg)
Empty vehicle911.0582.0873.5
Load in the roof box only, 72 kg927.0638.5682.5
Load in the luggage compartment, on the lowered rear seats, 400 kg, on the floor in front of the lowered rear seats, and on the floor in front of the front seat, 72.5 kg927.0638.5883.0
Load in the load compartment, on the lowered rear seats, 400 kg, and in the roof box, 72.5 kg942.01029.5882.0
Load on the floor, 72.5 kg943.0623.5905.0
Table 8. Measured deviations with SUV.
VariantMeasured Vehicle Mass (kg)Theoretical
Vehicle Mass (kg)
Deviation
(%)
Load in the roof box only, 72 kg1565.51565.50.00
Load in the luggage compartment, on the lowered rear seats, 400 kg, on the floor in front of the lowered rear seats, and on the floor in front of the front seat, 72.5 kg1969.01965.5+0.18
Load in the load compartment, on the lowered rear seats, 400 kg, and in the roof box, 72.5 kg1971.51965.5+0.31
Load on the floor, 72.5 kg1165.51565.50.00
Table 9. Division of vehicle mass into the front and rear axles of SUV and the distance of the center of gravity from the axles.
VariantFront Axle Load (%)Rear Axle Load (%)Change (%)L1 (m)L2 (m)Change (m)
Empty vehicle61.0238.980.001.031.610.00
Load in the roof box only, 72 kg59.2140.791.811.081.560.05
Load in the luggage compartment, on the lowered rear seats, 400 kg, on the floor in front of the lowered rear seats, and on the floor in front of the front seat, 72.5 kg48.6351.3712.391.361.280.33
Load in the load compartment, on the lowered rear seats, 400 kg, and in the roof box, 72.5 kg47.7852.2213.241.381.260.35
Load on the floor, 72.5 kg60.2039.800.821.051.590.02
Table 10. The height of the SUV’s center of gravity and the theoretical speed of driving at the limit of overturning and theoretical rollover angle.
Varianthc (m)Change (%)/
(m)
Theoretical Speed Limit (km·h−1)Change (%)/
(km·h−1)
Theoretical Rollover Angle
(°)
Empty vehicle0.670.00/0.0081.120.00/0.0050.23
Load in the roof box only, 72 kg0.715.97/0.0478.77−2.90/−2.3548.66
Load in the luggage compartment, on the lowered rear seats, 400 kg, on the floor in front of the lowered rear seats, and on the floor in front of the front seat, 72.5 kg0.692.99/0.0279.91−1.49/−1.2149.47
Load in the load compartment, on the lowered rear seats, 400 kg, and in the roof box, 72.5 kg0.7410.45/0.0777.14−4.91/−3.9849.47
Load on the floor, 72.5 kg0.66−1.49/−0.0181.74+0.76/+0.6250.73
Table 11. Measured values and deviations of electric, hybrid, and VAN.
VehicleFront Axle (kg)Rear Axle (kg)Measured/Theoretical Vehicle Mass (kg)Difference
(kg)/(%)
Electric646.5/672.5707.5/7321404.5/1404.50/0
Hybrid1106/1130789/815.51945.5/1945.50/0
VAN1101.5/1130696.5/718.51848.5/1848.50/0
Table 12. Division of vehicle mass into the front and rear axles of electric, hybrid, and VAN and the distance of the center of gravity from the axle.
VehicleFront Axle (%)Rear Axle (%)L1 (m)L2 (m)
Electric47.74/47.8852.26/52.121.34/1.341.23/1.23
Hybrid58.36/58.0841.64/41.921.12/1.121.56/1.56
VAN61.26/61.1338.74/38.871.17/1.171.84/1.84
Table 13. The height of the electric, hybrid, and VAN’s center of gravity and the theoretical speed of driving at the limit of overturning and theoretical rollover angle.
Vehiclehc (m)Theoretical Speed Limit (km·h−1)Theoretical Rollover Angle
(°)
Electric0.52/0.5389.55/88.6055.44/54.85
Hybrid0.52/0.5292.24/92.2457.10/57.10
VAN0.89/0.9169.78/68.9943.20/72.71
Disclaimer/Publisher’s Note: The statements, opinions and data contained in all publications are solely those of the individual author(s) and contributor(s) and not of MDPI and/or the editor(s). MDPI and/or the editor(s) disclaim responsibility for any injury to people or property resulting from any ideas, methods, instructions or products referred to in the content.