Article

Analysis, Generation, and Validation of New Boards for the Game Micro Robots

1
School of Videogames Development and Virtual Reality Engineering, Faculty of Engineering, Universidad de Talca, Talca 3460000, Chile
2
Department of Interactive Visualization and Virtual Reality, Faculty of Engineering, Universidad de Talca, Talca 3460000, Chile
*
Authors to whom correspondence should be addressed.
Appl. Sci. 2024, 14(20), 9416; https://doi.org/10.3390/app14209416
Submission received: 11 September 2024 / Revised: 7 October 2024 / Accepted: 12 October 2024 / Published: 15 October 2024

Abstract

:
This document presents a study of the board game Micro Robots and the development of a pipeline for the generation and validation of new boards of variable sizes. The implementation was carried out in the C# language, using graph theory and a depth-first search algorithm to explore various board configurations and their possible solutions. The main objective is the creation of boards that are different from the original ones, offering greater variety in the gaming experience. The impact of the modifications on the game’s dynamics and complexity was evaluated by comparing the generated boards with those from the commercial game. The results show that no major differences were found between the new boards’ structure and the original ones, maintaining an average complexity across all configurations. This work not only contributes to the study of board game design, but also opens new opportunities for innovation in this field.

1. Introduction

Board games or Eurogames [1] are a classic resource used in family or friend gatherings, and their market is constantly expanding. The news portal Deutsche Welle [2] reported that during the year 2020, the board game market registered a growth of 20%, mainly due to the COVID-19 pandemic. In this context, it is expected that this market will generate about USD 8.6 billion in 2024, with a compound annual growth rate of 3.52% from 2024 to 2028 [3]. The United States leads the market, with revenues of USD 2.74 billion, while countries like Germany stand out in the design of innovative and strategic games. The platform BoardGameGeek currently has more than 150,000 registered board games [4].
This growing popularity of board games over time has garnered some interest in the academic field. For example, various studies highlight the usefulness of this type of games as an educational tool in different contexts. Their effectiveness has been observed in the teaching of various subjects such as history [5], geography [6], mathematics [7], biology [8] and social sciences [9], while also fomenting skills such as teamwork, decision making, creativity, and imagination [10], thus promoting crucial aspects for academic development, positive behaviors, and emotions [11]. Similarly, direct interaction with small groups of students promotes discussion and co-learning, facilitating comprehensive education that covers conceptual, procedural, and attitudinal content [12].
There is a continuous search for new ways to develop board games’ pedagogical potential. This potential also suggests possible applications in various fields such as health, business, and technological development; so, exploring and advancing in this area of knowledge will allow for the discovery of a wide range of practical applications. Board games are divided into various categories, including abstract strategy games. This category is often characterized by the absence of a theme or narrative and is based on a simple and straightforward design and mechanics, presenting perfect information to the players [13]. Games in this category include Chess, Go, Mahjong, Ricochet Robots, and Micro Robots [14]. In Micro Robots, players compete simultaneously to find the shortest route to move a robot across a grid.
In this context, this paper proposes an analysis of the game Micro Robots, including the generation and validation of new boards, focusing on its rules, mechanics, and interactions, to evaluate the variation in the gaming experience by modifying the arrangement of its elements. The algorithms that generate and validate different board configurations of the original game size (6 × 6 squares) and reduced size (2 × 2 and 4 × 4 squares) are described.
Board generation consists of two methods: (1) randomly rearranging the squares; and (2) sequentially rearranging the squares while exploring all possible combinations. Board validation is carried out through their representation in graphs. These are explored using a depth-first search (DFS) algorithm, which evaluates the connectivity between the squares and finds all their solutions. Finally, a digital board game prototype is developed to test the newly generated boards.
This article is structured as follows: first, key concepts involved in the study are described, such as the board game itself, graph theory and its applications in other games, and search algorithms. Subsequently, the methodology used in designing and developing the program to generate new boards is defined. Then, the results obtained from the tool and the analyses carried out are described. Finally, the conclusions drawn from the data collection are presented.

2. Background

2.1. Procedural Content Generation

Procedural content generation (PCG) [15] is the creation of media using an algorithm. In the context of board games, this can range from aesthetic assets, such as pieces and board backgrounds, to game levels, mechanics, and rules. While PCG has seen extensive use for generating simple game content, like images, research into generating more complex content is just starting. Puzzle generation [16] in particular has been chiefly addressed for games that are strictly puzzle games. However, this research could address many game types simultaneously, as puzzles are often part of larger games. Particularly in video games, from first-person shooters that include physics puzzles (like Half-Life 2) or mini-games (like Bioshock), to actual puzzle games (like Portal, The Talos Principle, or The Witness).

2.2. Micro Robots

Micro Robots is a board game published in 2016 [14]. The game consists of the following components:
  • A transparent robot figure.
  • A colored six-sided die.
  • A numbered six-sided die.
  • Four pieces that make up the board (each piece has a black side and a copper side, and squares in different configurations).
  • One big token used on the exit square.
  • Twenty-five small tokens used to define each player’s score.
To play, both dice are rolled twice to determine the starting square and the final position. The game involves all players simultaneously thinking of moving the small robot to a target square. Only horizontal or vertical moves are allowed, and only between squares with the same number or color as the current square, regardless of their distance. The player who finds a solution in the shortest time and demonstrates it successfully earns a point. The game ends when a player reaches five points [17]. Figure 1 shows an example of the player’s movement restriction.

2.3. Graph Theory

Graph theory is a branch of mathematics that studies the properties and relationships between objects. A graph consists of a set of vertices or nodes, which are connected by edges [18]. This theory allows for the representation and analysis of a wide variety of situations and problems in different fields. Notable applications include the study of social networks and information management, route optimization, solving programming problems, bioinformatics, and computational biology, among others [19,20,21].
In the sphere of gaming, graph theory is used to model and solve games [22,23,24]. In maze or path puzzles, it is applied to find the shortest or optimal path. Other examples, such as chess, checkers, or strategy games in general, are modeled using graph theory to analyze optimal strategies and possible outcomes. Some examples are:
  • Thirty-one: In the game Thirty-one, the problem can be modeled with a directed graph where the vertices represent numbers from 1 to 31 and the edges are the allowed moves.This representation allows for strategically identifying positions that ensure an advantage over the opponent [25].
  • Nim: The game Nim can be represented with a directed graph, where the nodes correspond to the number of sticks per row, and the edges are the possible moves. This approach helps determine the moves that will provide the greatest chances of winning the game [25].
  • Dominoes: The game can be represented by a graph where each node corresponds to one end of a tile, and the edges are the connections between them. This approach allows for analyzing the feasibility of playing a perfect or near-perfect game with a given set of tiles [26,27].
  • Sudoku: This can be modeled with a graph, where the vertices are the squares and the edges represent the constraints between them. This approach makes it easier to determine if the board can be solved and allows for the application of graph theory concepts, such as colorability [28], and for analyzing the structure of the path between vertices [26,29].
  • Chess: In chess, graph theory is used to model the structures and relationships on the board [30]. This allows for analyzing how the pieces interact with each other and move throughout the game, facilitating the study of strategies and patterns [31].
In summary, graph theory is used in games to represent the relationships between the participating elements. In the case of the game Micro Robots, a graph is constructed to visualize the possible moves on the board. Another fundamental aspect related to this is search algorithms.

2.4. Search Algorithms

Search algorithms are crucial computational tools for exploring the structure of a graph. They operate systematically, following a set of predefined rules to analyze and extract information about the relationships and connections within it [32]. Some examples are:
  • Depth-first search (DFS): The depth-first search algorithm is used to traverse graphs. This algorithm explores in depth from an initial vertex, searching as far as possible along each path before backtracking and continuing with the next vertex [32,33]. One advantage of this algorithm is that nodes are visited only once. Additionally, it is easily modifiable and can be used to solve simple problems such as connectivity, cycle detection, and simple paths [34].
  • Breadth-first search (BFS): The breadth-first search algorithm is also used to explore graphs. It starts at an initial vertex and explores all adjacent nodes before proceeding to more distant vertices [32,33]. The main difference between BFS and DFS lies in their search strategy. BFS tends to be more effective for finding the shortest path between two nodes because it explores the nearest nodes first. Beyond that, it has the same characteristics as DFS [34].
  • Dijkstra: Dijkstra is a search algorithm for finding minimum-cost paths in directed and undirected graphs, as long as their weights are not negative. This algorithm finds the shortest path from a source node to all other reachable nodes in the graph [32]. It is widely used in graph representations to find solutions to maze problems [35].
  • A*: A* is a pathfinding algorithm that uses a heuristic function to find the shortest path between a start node and a target node in a graph. The heuristic guides the search towards the target vertex, prioritizing the exploration of nodes with the lowest estimated total cost [32,36,37]. This function allows A* to adapt efficiently to different problems [38].
This work uses DFS because we do not need to know the path length, only whether the graph is fully connected.

3. Methodology

The methodology used in this work involves modeling the board game Micro Robots using graphs based on the relationships between the numbers and colors of the board squares. The goal is to visualize the connections in the different boards that can be constructed. A DFS algorithm is implemented to traverse the graph due to its simplicity of implementation through recursion and its effectiveness in exploring the entire graph with the help of backtracking (following the game mechanics, i.e., the path from point A to point B, considering the game’s restrictions). With these concepts, the aim is to build a pipeline for generating and validating game boards to create valid boards that are different from those in the commercial game.

3.1. Board Complexities and Considerations

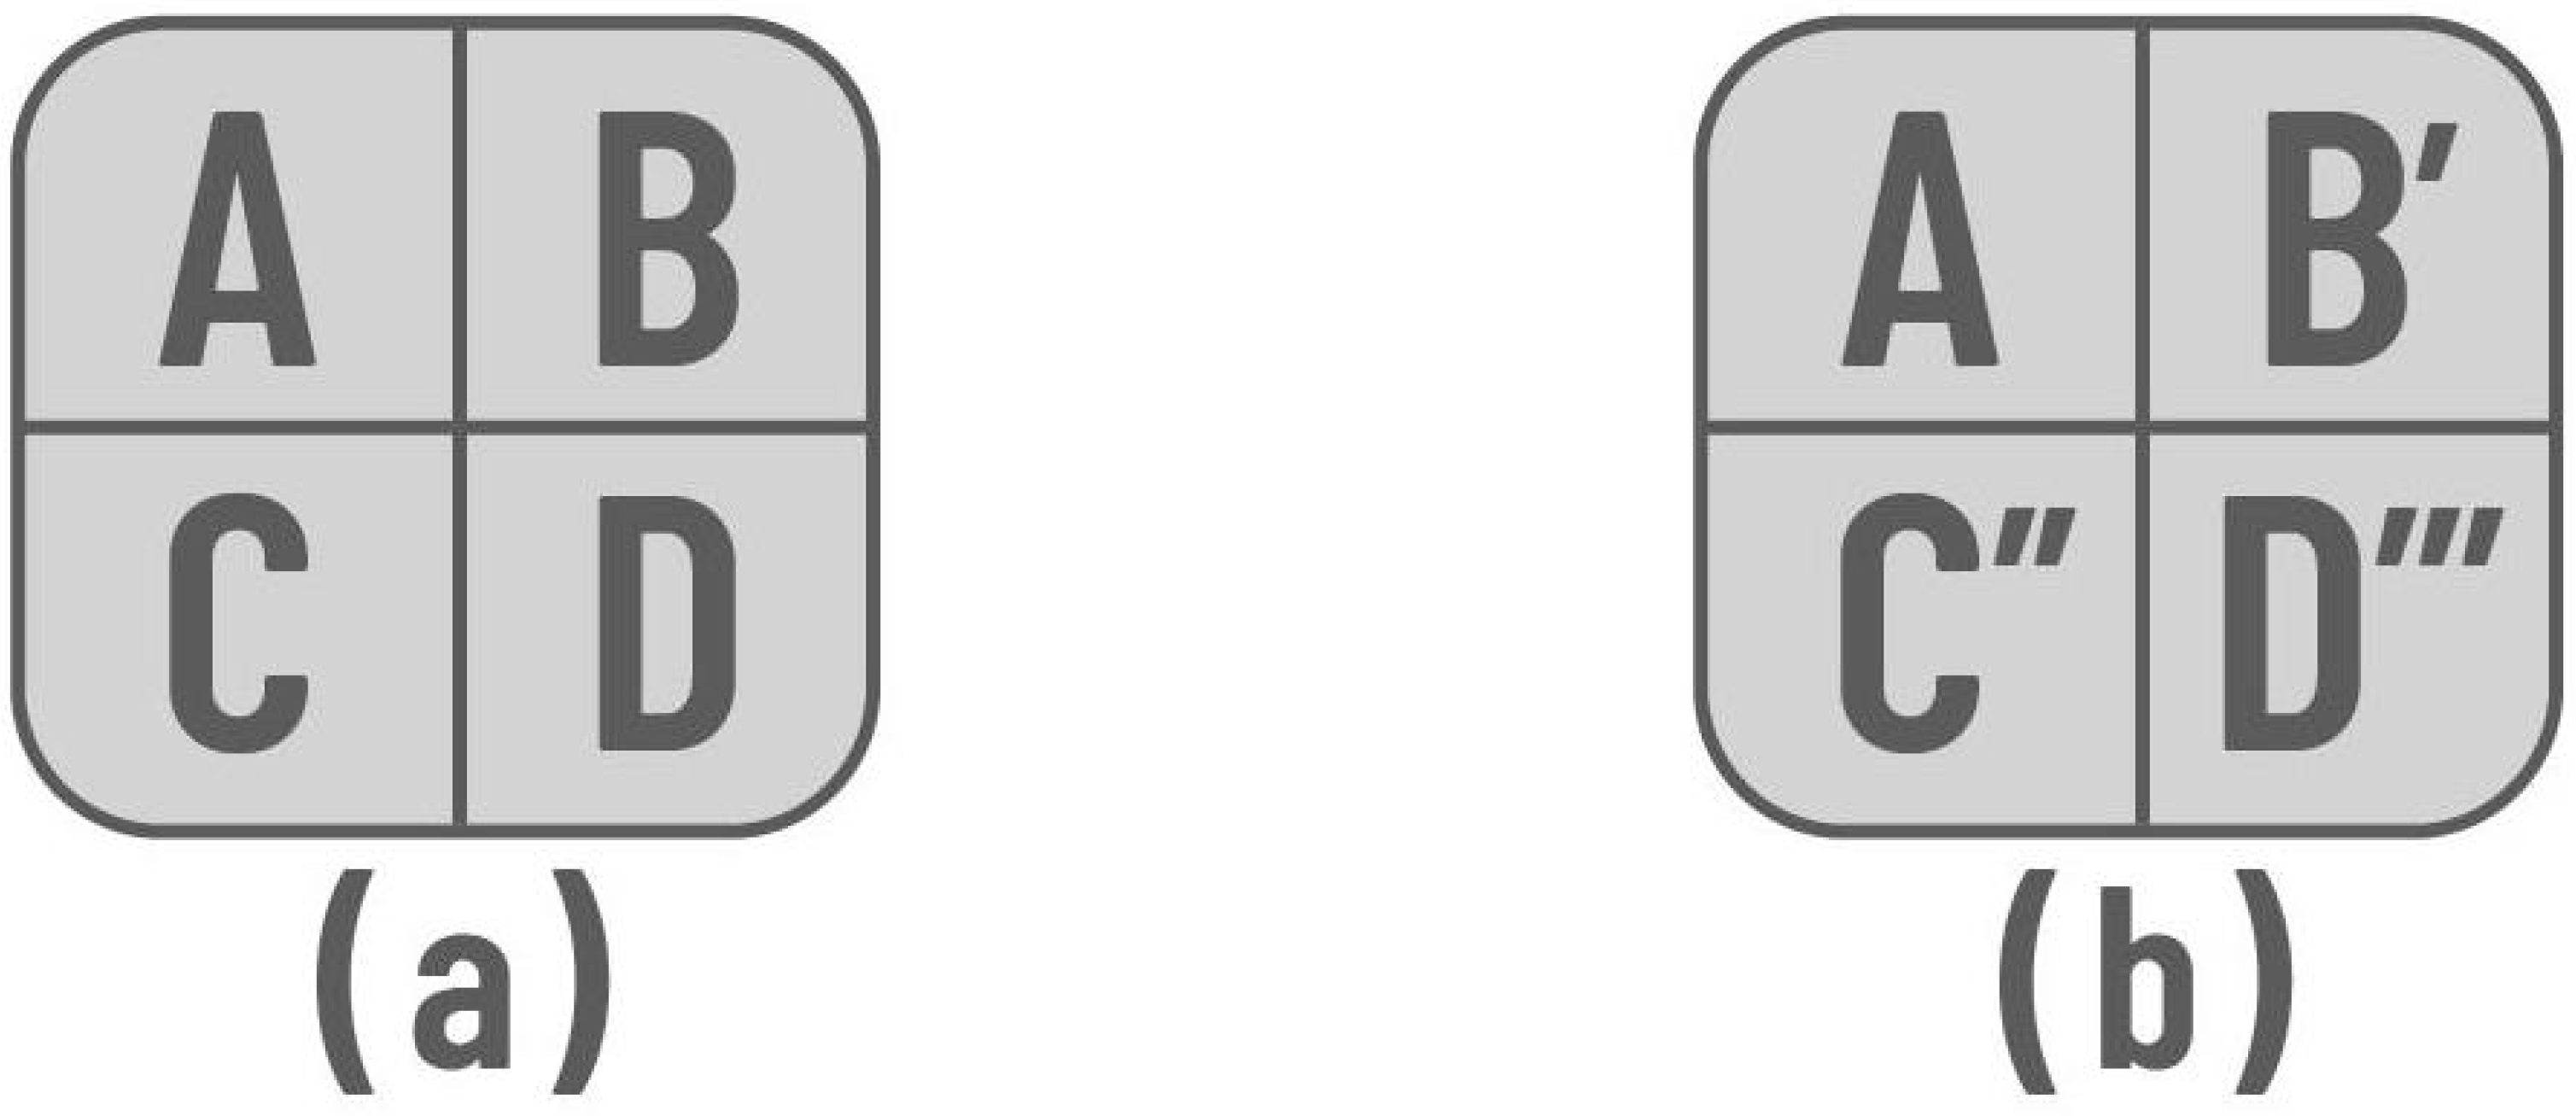
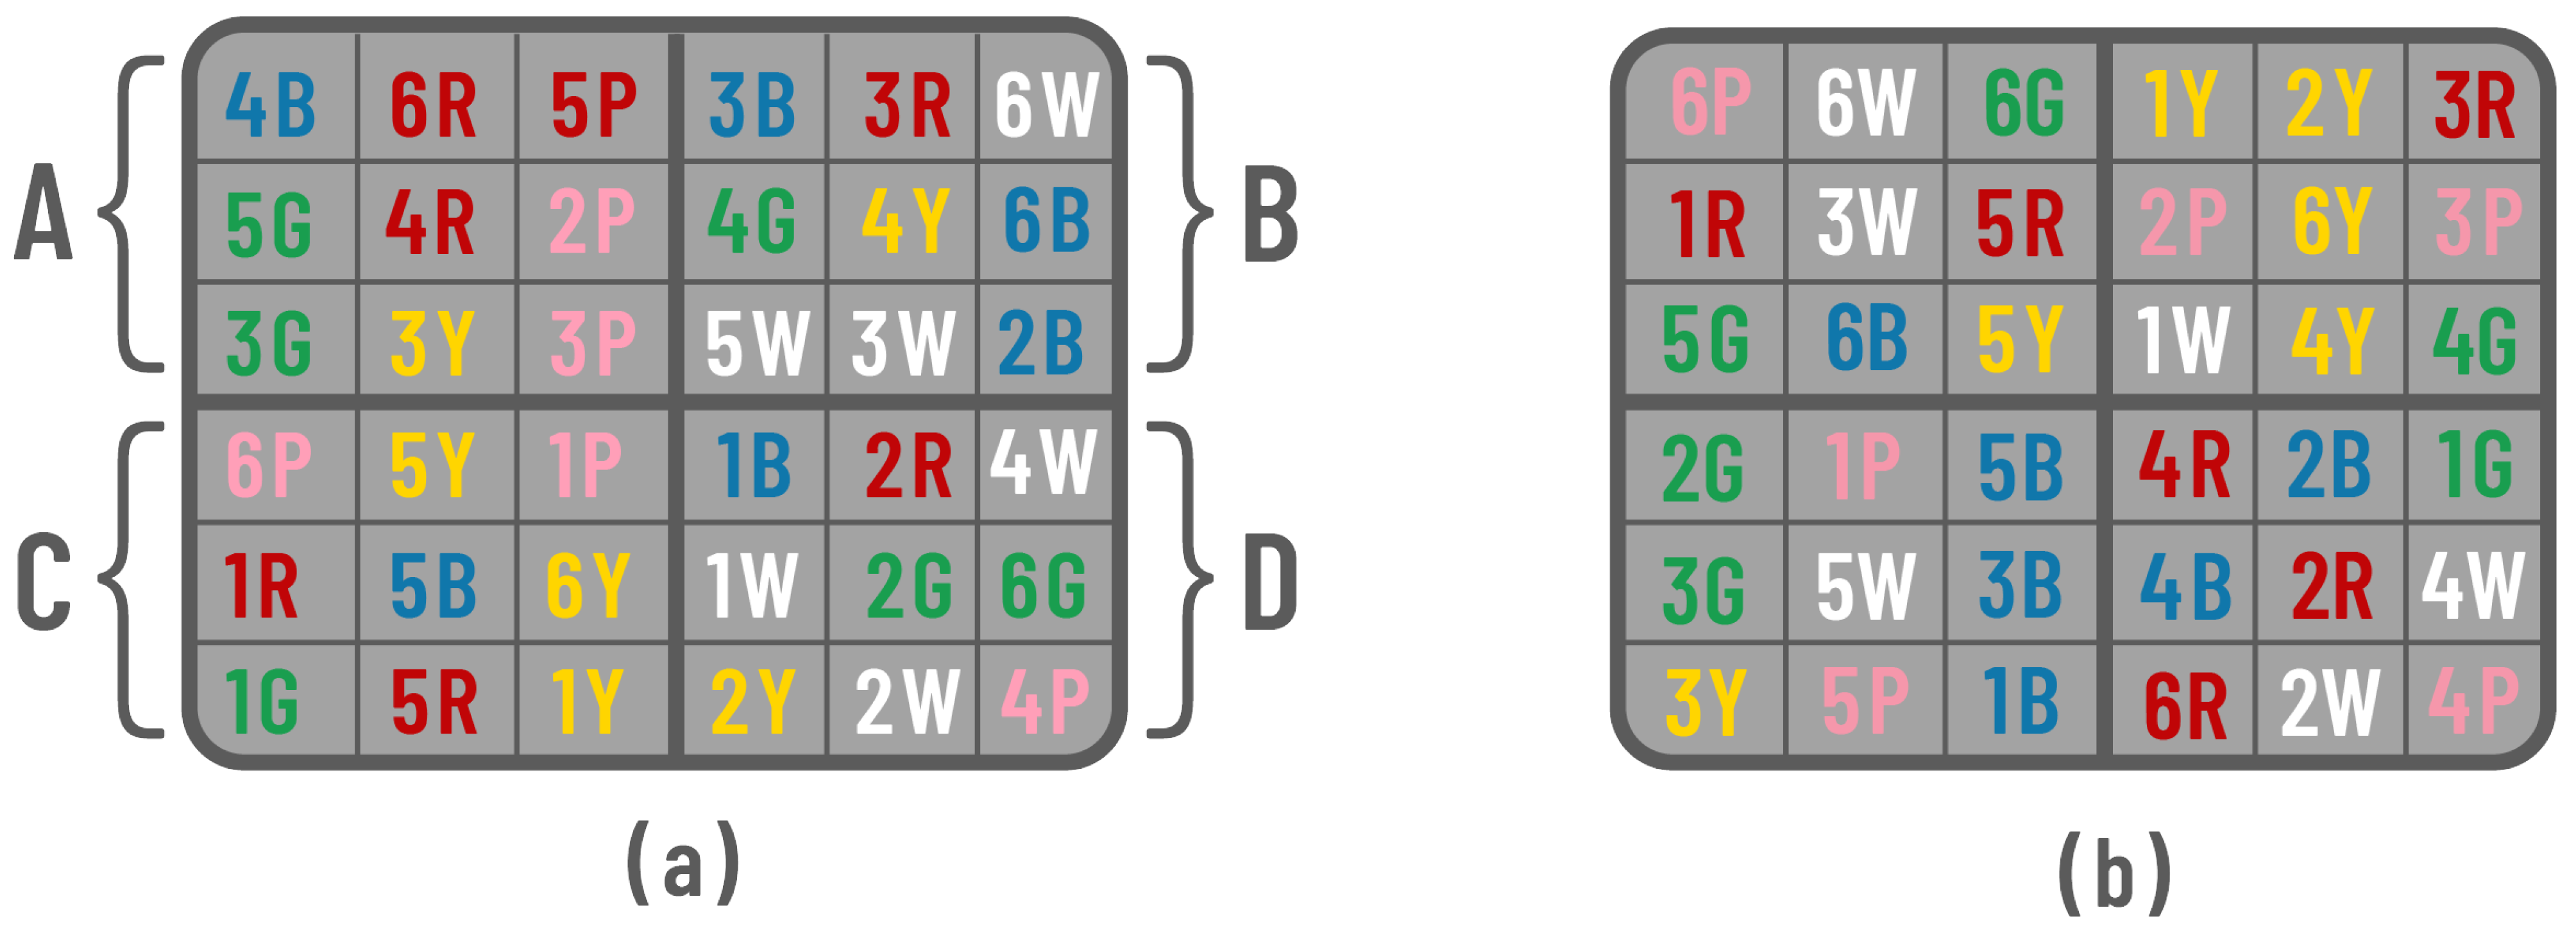
The Micro Robots board is modular, meaning different board configurations can be created using the available pieces. The board is divided into four quadrants that can be rotated and arranged in various ways, forming a board with six squares in height and six squares in width (6 × 6), and all possible states have a solution. Figure 2 shows a representation of a board of 6 × 6, with four quadrants noted as A, B, C and D. It is worth noting that by applying all the mentioned movements, 6.144 possible boards can be formed (256 boards by rotating quadrants, multiplied by 24 boards by rearranging quadrants).
Figure 3 presents four quadrants with their internal connections to allow for analyzing possible design patterns. As we can see, quadrant D has an internal node without connection (3 rose), but if we consider the board with the four quadrants (A, B, C, D) and their connections, all nodes are fully connected. You can arrange the quadrants in any order to generate the main board (6 × 6) for playing the game.
For a board to be considered valid, from any starting point, it must be possible to move to any other target square (in the commercial version of the board game, 12.288 different boards can be composed—6.144 for each side of the board—and all of them are valid). Since the initial and final positions are determined randomly, each square on the board must be connected to at least one other square, either horizontally or vertically. This means that the squares in each quadrant are arranged to maintain a direct or indirect relationship.
Figure 4 shows the Micro Robots game board modeling using graphs. The relationship between all squares based on their numbers and colors, as specified in the game’s instructions, can be observed. In this example, a board with an initial configuration is shown in Figure 4a, and a modification in the position of its quadrants is shown in Figure 4b.
Figure 4c shows both of the previous boards, but with one quadrant rotated.

3.2. Creation of New Boards

There is no obvious general rule or heuristic for constructing Micro Robots boards, so we have devised a simple procedure outlined in the following paragraphs. The challenge of creating new Micro Robots boards is divided into two important aspects.
  • All squares on the board must be connected to each other, as any disconnection could result in an unsolvable configuration.
  • The previous point must be applied to all possible board configurations. Each quadrant can be rotated four times until it returns to its initial position, resulting in a total of  4 4 = 256  board configurations. Similarly, the sections can be rearranged, yielding  4 ! = 4 × 3 × 2 × 1 = 24  additional configurations for each rotation performed on any of the pieces. By applying both movements together,  256 × 24 = 6.144  possible board configurations can be obtained, considering rotated and inverted constructions.
The original game board consists of 36 squares, with approximately  36 ! = 3.7199 × 10 41  possible square combinations. Meeting the aforementioned requirements involves finding a combination of squares whose distribution across the board is precise, which requires careful and detailed analysis of the placement of squares in each quadrant.
The result of this modeling is then used to generate a pipeline for board generation and validation.

4. Development

Exploring the set of possible square combinations manually is impractical due to its vast extent. However, a straightforward way to address the problem is to identify individual configurations that meet the established criteria using a board generation and validation pipeline designed to navigate this search space efficiently.
The developed pipeline consists of two systems: (1) board generation and (2) validation.
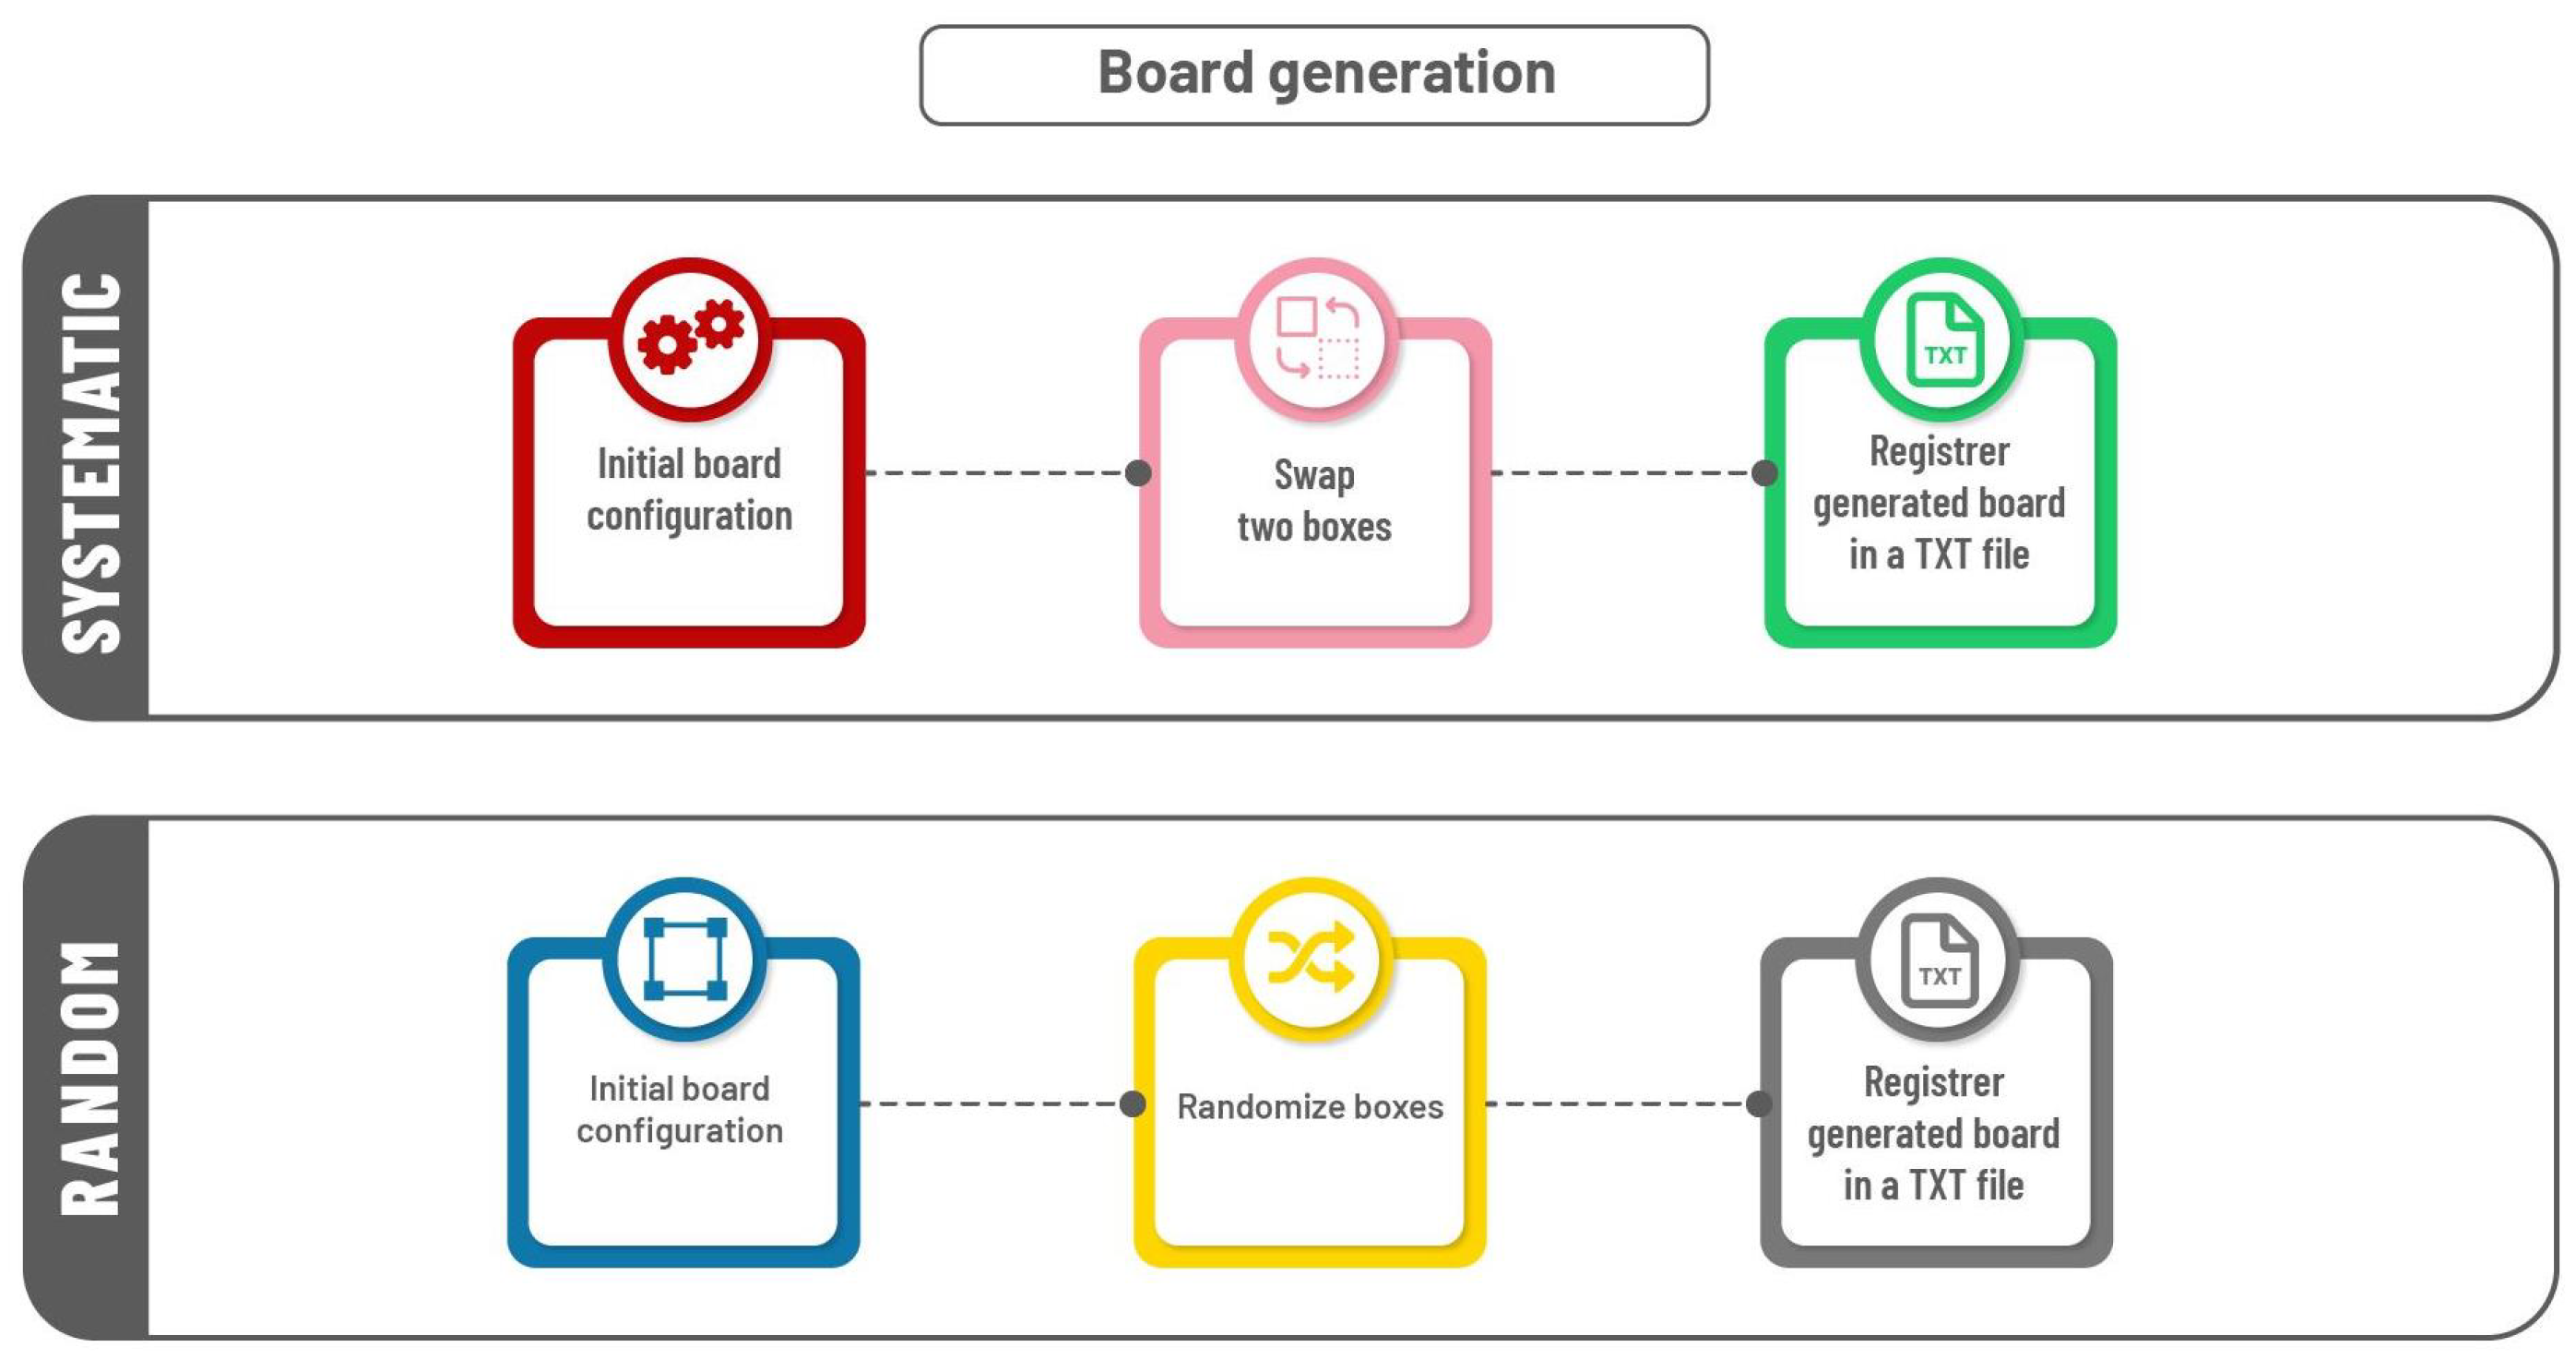
  • Creating new boards. Two approaches were implemented: randomly distributing the squares across the matrix that forms the board; and a systematic method, where squares are permuted sequentially starting from an initial board (see Figure 5). The generated boards are saved in a text file, then processed by a validator. These algorithms are parameterizable, allowing adjustment of the board size according to specified values, enabling the creation of boards of different dimensions.
  • Validating boards. For this, graphs and a DFS algorithm are used. First, the board is extracted from a plain text file and assumed to be valid. Next, the board is divided into four sections, independently rotated in 90-degree increments. For each rotation, the quadrants are rearranged, exploring all possible combinations. In each combination, a graph is constructed by assigning squares to vertices and assigning connections between squares and edges. The DFS algorithm checks the connectivity between all squares, thus ensuring a valid path that allows the robot to reach any target square from any initial position. This process is repeated until the entire set of 6.144 possible board configurations is evaluated. If an unsolvable configuration is detected during execution, the board is marked as “invalid”, and the validation process is interrupted to proceed with the next generated board.

4.1. Board Generator

The class RandomGenerator is responsible for the random generation of boards. This class contains three methods:
  • CreateSquare, which creates an initial set of squares.
  • RandomizeSquares, which randomly reorders the squares.
  • CreateDocument, which creates the file that includes the board.
This class operates independently of the board validator.
Systematic board generation occurs in the class named CombinationGenerator. It includes the CreateSquares and CreateDocument functions, which perform the same tasks as in the random generator. Additionally, it contains the Combinations and Permute functions, responsible for exploring various square combinations through permutation on the board.

4.2. Board Validator

The Validator class is responsible for the board validation system. This class consists of the following methods:
  • ReadBoard: Extracts the board data from the previously generated plain text document.
  • DefineQuadrants: Divides the board into four sections (upper left, upper right, lower left, and lower right).
  • RotateQuadrant: Rotates a specified quadrant 90 degrees to the right using an auxiliary matrix (see Algorithm 1).
  • RearrangeQuadrants: Reorders the quadrants following a list of possible combinations (see Algorithm 2).
  • CreateGraph: Traverses the board horizontally and vertically to establish nodes based on the squares and edges on the connections between them.
Algorithm 1 Method that rotates a specified quadrant 90 degrees to the right.
1:
if !valid then
2:
   return
3:
end if
4:
quadrantSize ← quadrant width
5:
auxiliaryMatrix ← new string[quadrantSize, quadrantSize]
6:
for i ← 0 to quadrantSize, k ← quadrantSize - 1 do
7:
   for j ← 0 to quadrantSize do
8:
     auxiliaryMatrix[j, k] ← quadrants[quadrantID, i, j]
9:
     k ← k - 1
10:
   end for
11:
end for
12:
for i ← 0 to quadrantSize do
13:
   for j ← 0 to quadrantSize do
14:
     quadrant[quadrantID, i, j] ← auxiliaryMatrix[i, j]
15:
   end for
16:
end for
17:
RearrangeQuadrants(quadrants, quadrantSize)
Algorithm 2 Method that rearranges the quadrants according to a list of possible combinations.
1:
for each item in quadrantsOrder do
2:
   ModifyBoard(quadrants, quadrantSize, item[0], item[1], item[2], item[3])
3:
   if boardIDs.Count() > 0 and boardIDs.Contains(GenerateID()) then
4:
     return
5:
   end if
6:
   InitializeGraph()
7:
   CreateGraph()
8:
   DFS(0)
9:
   if !valid then
10:
     return
11:
   end if
12:
end for
13:
RotateQuadrants(quadrants)
The DFS and TraverseGraph methods work together. The former sends a list of nodes to visit to the latter, which is responsible for exploring the graph. If all nodes are visited, an ID is created for the new board and added to a list of explored boards. If not all nodes are visited, the board is considered invalid.
With this pipeline, boards of different sizes—2 × 2, 4 × 4, and 6 × 6 squares—are generated. The random generator stops when it finds a valid board, while the systematic generator operates iteratively, generating boards and verifying their validity immediately. The goal of the systematic generator is to explore all possible combinations of squares to find the maximum number of valid boards allowed. The generated boards were subjected to a comparative analysis along with the original game boards.

5. Results

Two results of this work are presented below: (1) the generated boards, and (2) a mobile application that uses the new sets of boards to implement a “Find a Path” game.

5.1. Generated Boards

Since generation algorithms are parameterizable, smaller valid boards were generated to simplify the problem.
  • 2 × 2-square boards: These proved too small, and although they were adapted to maintain their validity, their manipulation was limited because each quadrant was a single square. It is worth mentioning that the total set of 2 × 2 boards is very small (4! = 24 boards), so it was easy to explore all possible combinations.
  • 4 × 4-square boards: The generation was successful, yielding valid configurations quickly. After one hour of running the generator, 968 boards with dimensions of 4 × 4 were obtained.
  • 6 × 6-square boards: Similar results were obtained in terms of connectivity and validity. However, after one hour of execution, only 99 boards with dimensions of 6 × 6 were generated.
As can be observed, the number of 6 × 6 boards generated is less than that for boards with dimensions of 4 × 4 within the same target time. For this reason, board generation continued until a quantity comparable to that obtained for the previous dimensions was reached. Table 1 summarizes the number of boards generated according to the time used. It is important to mention that since the generator is random, there is no guarantee that all boards are different.
The next step was to try to generate all or the maximum possible number of boards using the systematic board generator.
This strategy was applied to 4 × 4 boards because their set of possible configurations is considerably smaller than the original 6 × 6 dimensions. After 24 h of execution, approximately 68,000 different boards were identified (with the possibility that there are boards whose quadrants are the same but in a different order and rotation). Despite these results, the figure is far from the 16! =  2.092279 × 10 13  possible combinations, so we decided to stop the procedure. However, a short test was conducted with 6 × 6 boards, reaching 16,000 boards found in 1 h, which still does not compare to the total set of combinations for this dimensions  36 ! = 3.7199 × 10 41 . It is necessary to mention that due to the permutation of squares being carried out in an ordered manner, many of the boards found by this system share similarities in the distribution of their squares.

5.2. Mobile Application: Find a Path

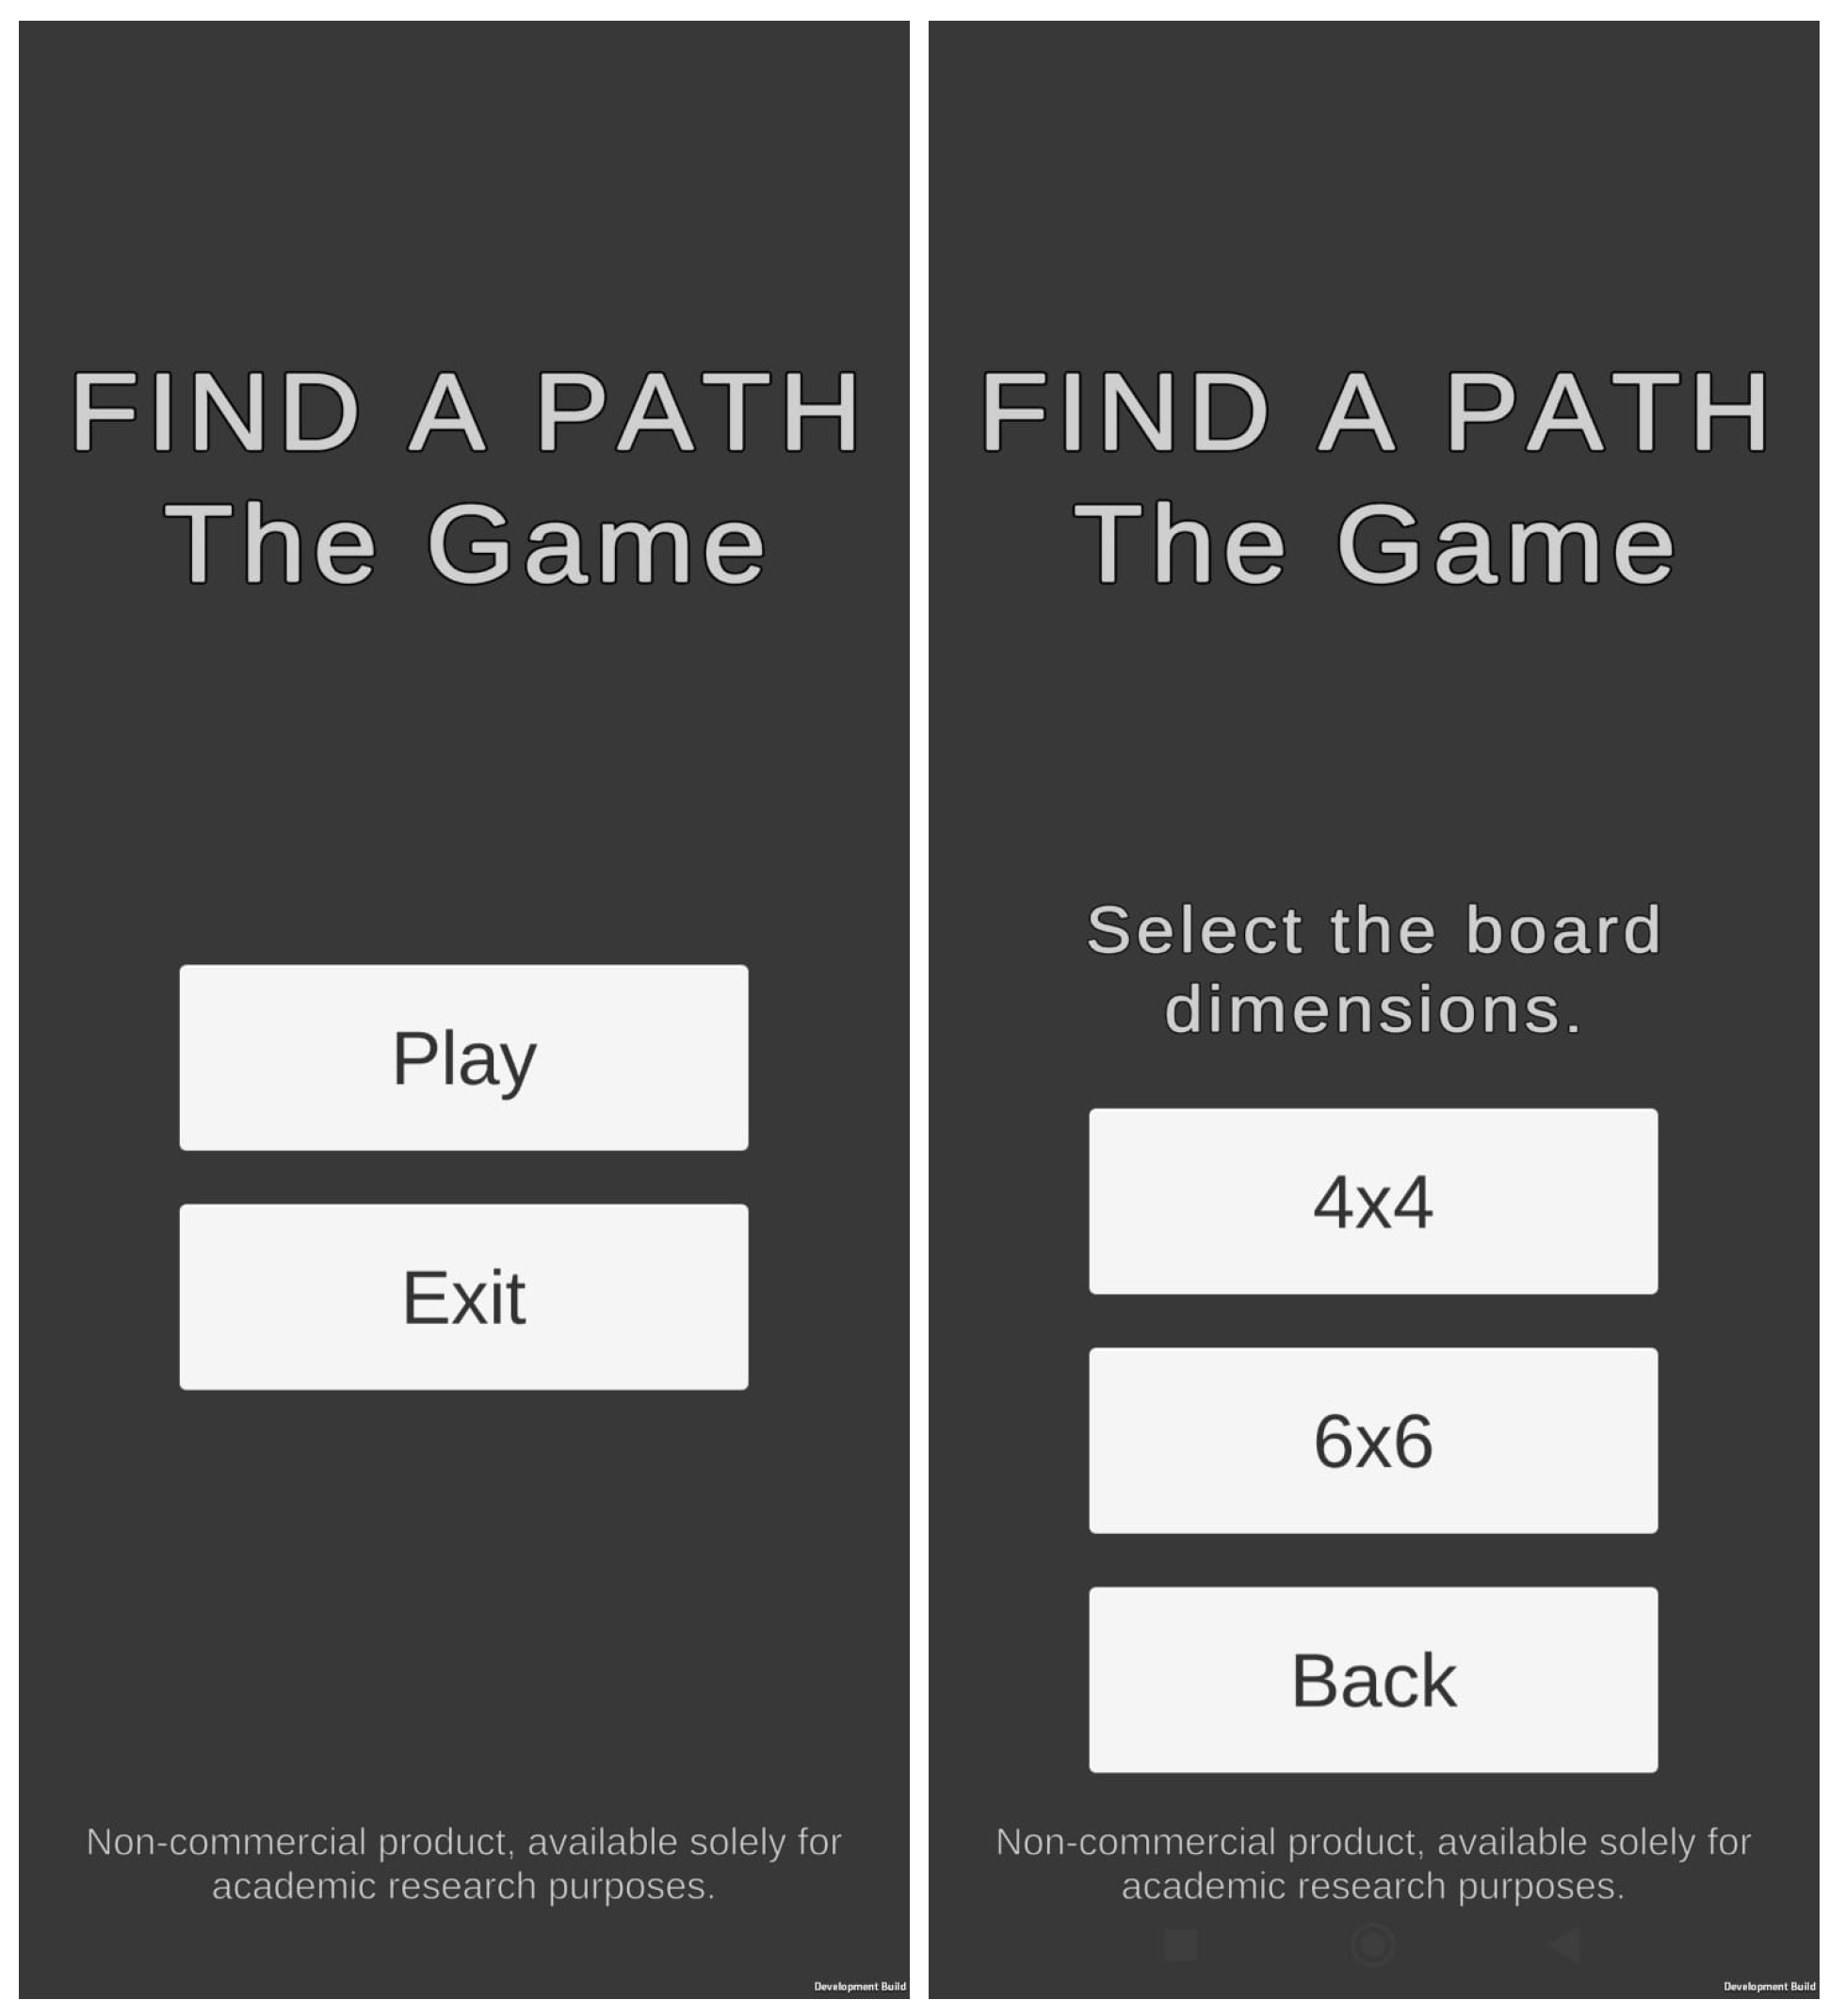
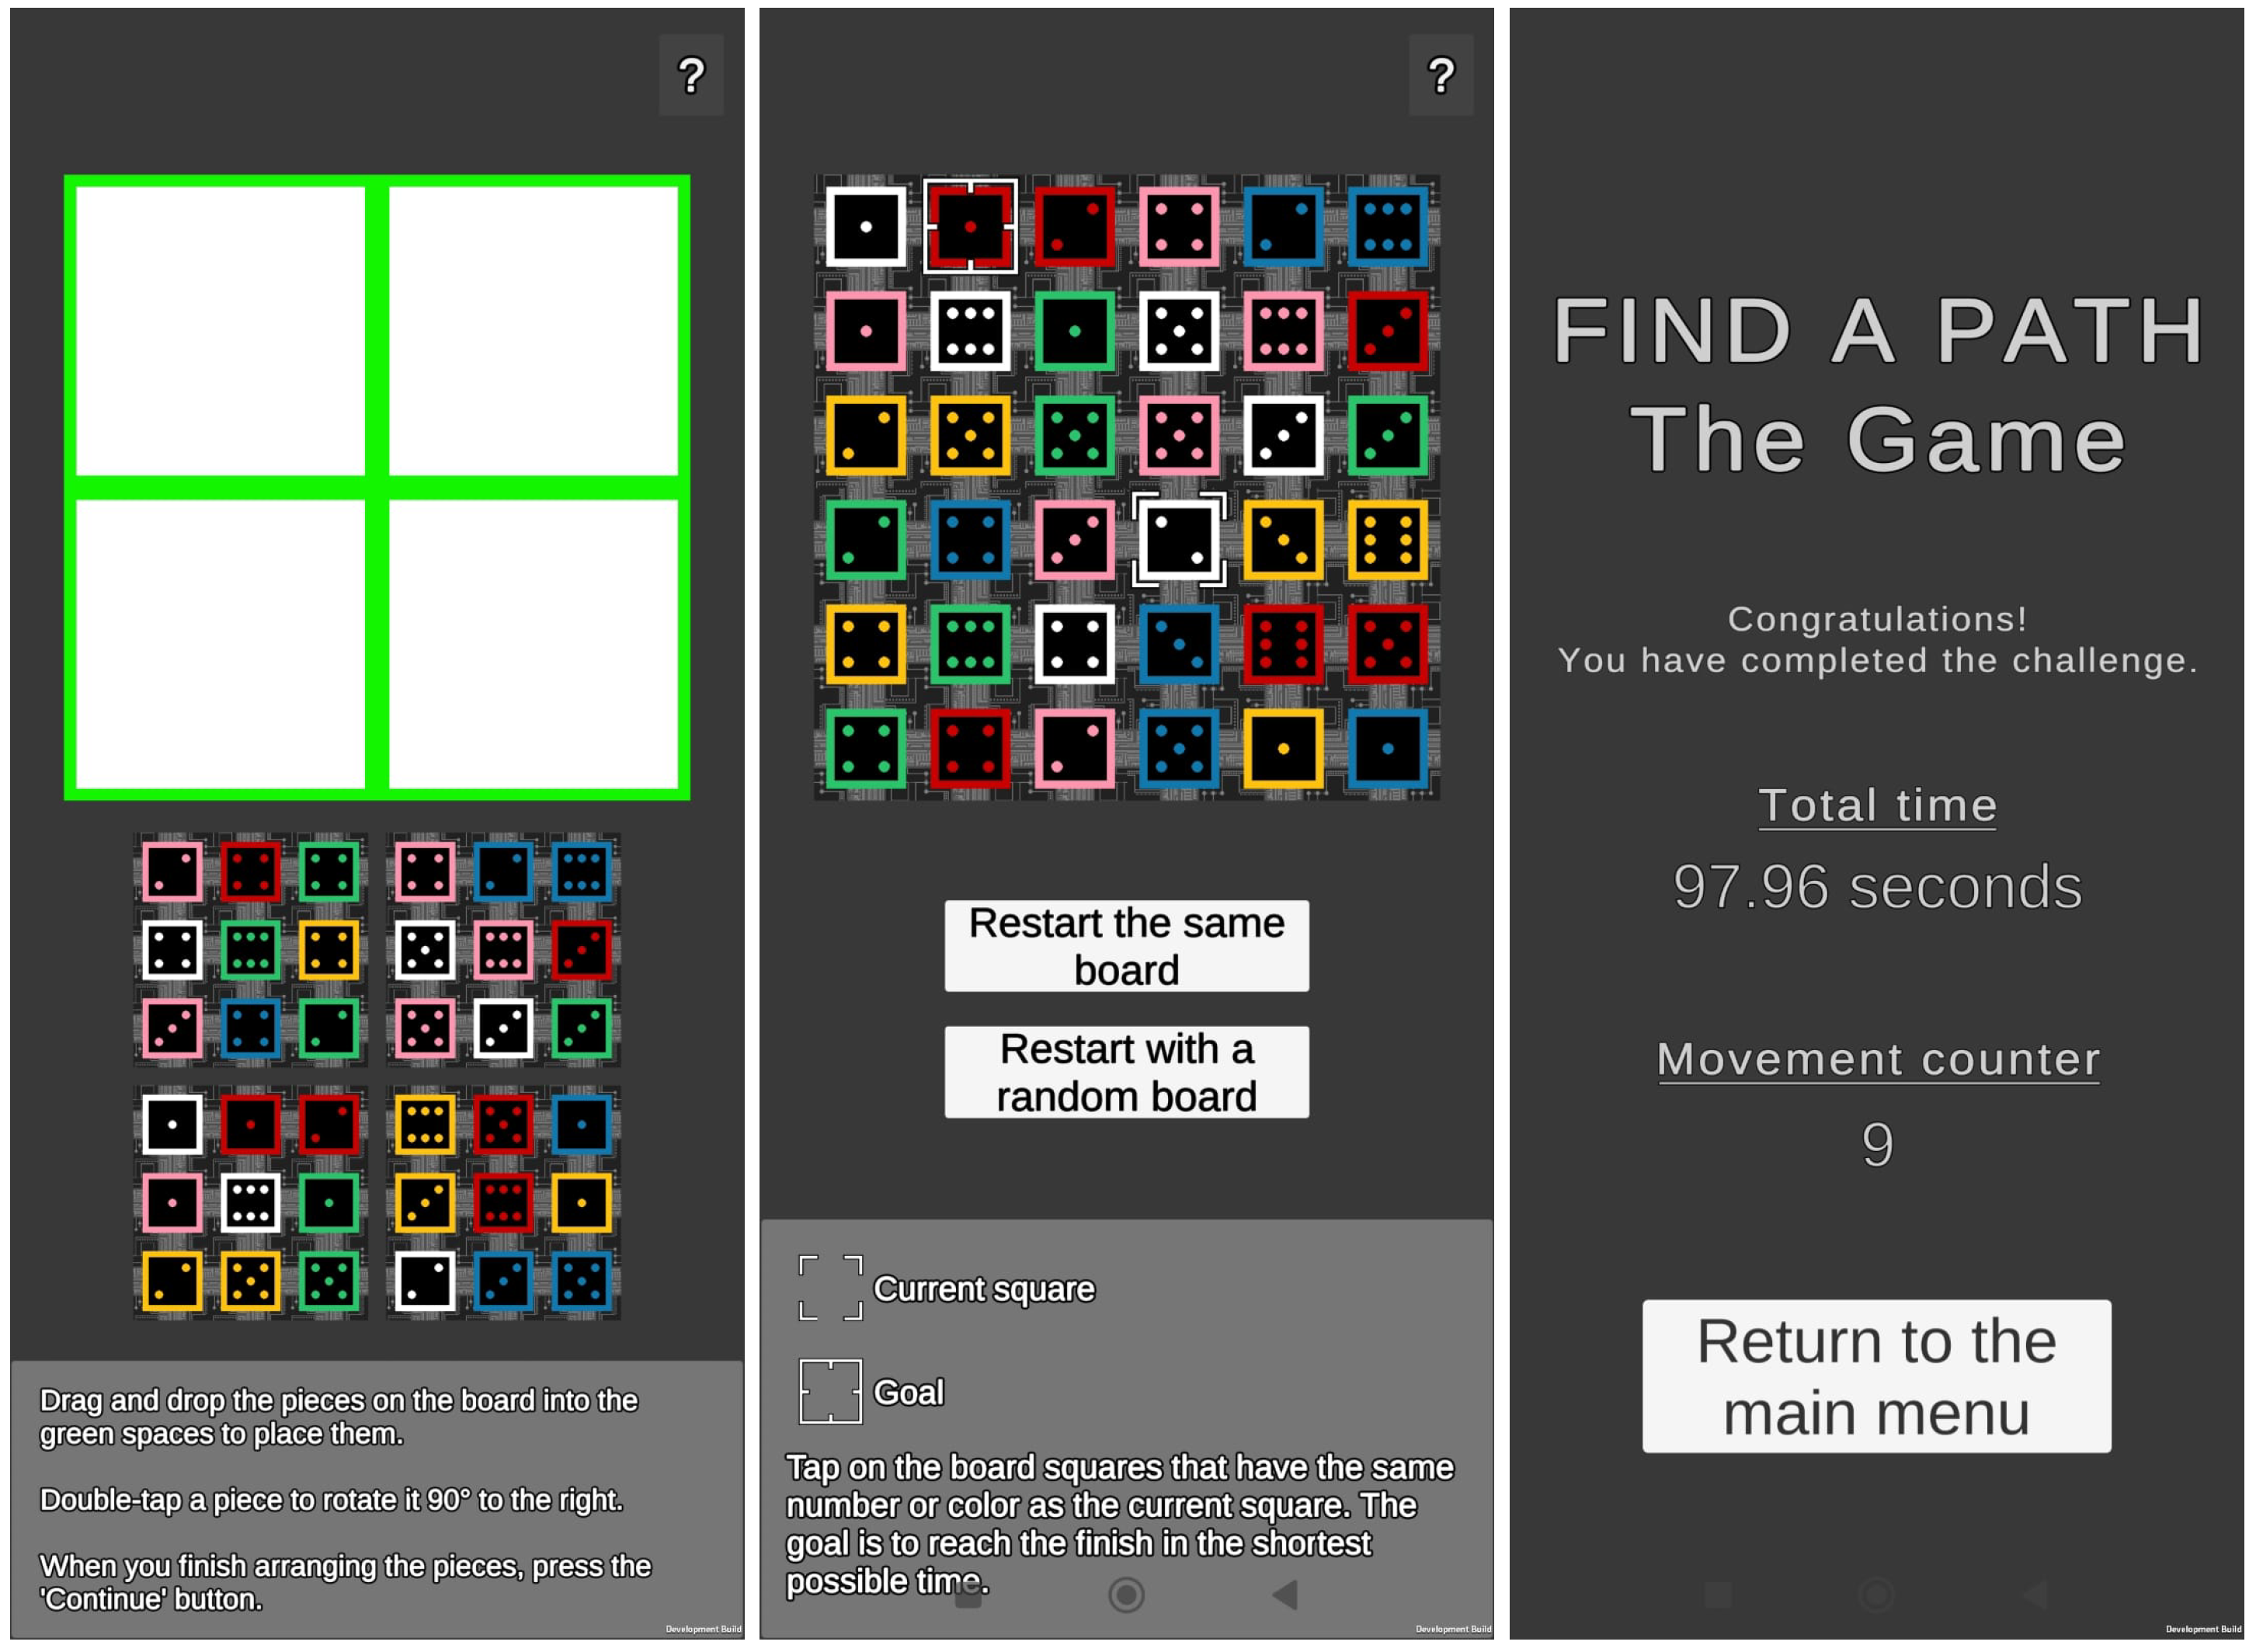
A mobile app was developed using the Unity Engine game engine [39], see Figure 6 and Figure 7. The graphic resources were created with the tool PyxelEdit [40], which is specialized for creating tilesets and pixel art.
The game’s rules follow the original format, allowing only moves to squares with the same number or color within the same row or column as the current position.
The final version of the digital game prototype was exported for Android devices.
The game includes a start menu that allows the player to choose between 4 × 4- or 6 × 6-square boards. However, the selected board is random (the 2 × 2 boards were not included because they were too easy to solve). After selecting the board type, the player must rearrange the quadrants in the desired order, with the option to rotate them. A button in the upper right corner displays a panel at the bottom of the screen with the game instructions. Once the board is constructed, the player can start playing. The game mechanics follow the rules of the commercial board game. The player has the option to reset the board or start a new game with a different board, which is randomly selected. Upon completing the challenge, a screen with game statistics is displayed along with a button to return to the main menu. The application is simple, and its primary purpose is to visualize and test the new boards generated by the pipeline. Therefore, it was considered appropriate to include at least 200 boards per dimension, which can be modified by rotating and rearranging pieces, allowing for 6.144 configurations per board.

6. Discussion

In this work, we have analyzed the board game Micro Robots and generated and validated new boards under the original game rules. In this context, we will discuss the differences between the generated boards and those from the original game using derived metrics.
For this analysis, one randomly generated board was selected and compared with one board from the commercial board game. This analysis focused on the number of multiple edges present in the graph associated with each board. Tests were conducted with 50 different configurations for each board, randomly selected, with the aim of determining whether the overall solution of the generated boards became easier or more complex compared to the commercial game boards.
The notation shown in Figure 2 is used to refer to the board configuration. An apostrophe (’) is used to represent quadrant rotation. Figure 8 presents the boards that were part of the analysis. Table 2 provides a summary of the data collected from 50 configurations of the boards mentioned above.
The analysis results revealed a trend toward a greater presence of triple links, with an average of 10.18 compared to 12.78 in the original boards, and quadruple links, with an average of 9.44 compared to 8.74. These were followed by double links (8.78 on average compared to 7.90) and quintuple links (3.74 on average compared to 2.68). Single links averaged 2.62 compared to 2.06. The number of sextuple and septuple links was minimal, with values of 1.14 versus 1.58, and 0.10 versus 0.24. The original board featured octuple links, with an average of 0.02. In total, all analyzed boards had exactly 36 links.
The links represent the number of connections between the squares on the board. A greater number of multiple links indicates more alternatives in finding a solution to the board. The difference in the average number of links per type of link between the generated and original boards is minimal, and the highest standard deviation observed in the generated board is 2.99, while in the original board it is 2.82. This shows that both boards are equally consistent in the variation of the number of links per type of link, and that the difference between the two boards is relatively small. Consequently, the generated board maintains similarity to the original board game, despite being generated by a computational algorithm.

7. Conclusions and Future Work

Although a variety of boards were generated using the random generator, there was a significant difference in the time taken to generate 4 × 4 boards compared to 6 × 6 boards, suggesting that the cost of producing 6 × 6 boards is higher. This is due to the larger set of square combinations to combine, the larger total set of square combinations, and the greater effort required to explore all configurations when rotating and rearranging quadrants. Regarding systematic generation, the applied methodology allowed for the generation of a large number of valid 4 × 4 boards, although this number was limited compared to the total set of possible theoretical combinations. However, this system proved to fulfill its purpose.
Regarding the analysis, it is concluded that the generated boards show some similarity to the original boards in terms of complexity, presenting small variations. This suggests that the shape and layout of the board are closely related to the design and functionality of the board game. This consistency is due to its layout directly responding to the needs imposed by the design of the game itself. Specific and well-defined design patterns are observed, ensuring a balanced gaming experience. Therefore, the difficulty of the game is not determined by the distribution of the squares but by the game mechanics and the starting and ending points.
Future work should focus on:
  • Finding a way to speed up the permutation of squares to explore the set of combinations faster.
  • Extending our analysis by incorporating additional measures such as the average degree of vertices, and the average shortest path length, among others, to obtain deeper insights of the generated boards.
  • Using heuristic algorithms to explore the search space more efficiently.
  • Generating all possible game boards.
  • Searching for new patterns and configurations of more complex boards.
Finally, this work represents a significant advance in the development of a comprehensive tool that allows for the expansion of content for this type of game in a precise, fast, and efficient manner.

Author Contributions

Conceptualization, F.B. and N.A.B.; methodology, F.B. and N.A.B.; software, K.S.; validation, F.B., K.S. and N.A.B.; formal analysis, F.B.; investigation, F.B., K.S. and N.A.B.; data curation, K.S.; writing—original draft preparation, K.S.; writing—review and editing, F.B. and N.A.B.; supervision, F.B.; funding acquisition, N.A.B. All authors have read and agreed to the published version of the manuscript.

Funding

This research was partially funded by the National Agency for Research and Development (Agencia Nacional de Investigación y Desarrollo, ANID Chile), FONDECYT Iniciación grant 11220438.

Data Availability Statement

The dataset is available from the authors upon request.

Conflicts of Interest

The authors declare no conflicts of interest.

Abbreviations

The following abbreviations are used in this manuscript:
PCGProcedural content generation
DFSDepth-first search
BFSBreadth-first search

References

  1. Woods, S. Eurogames: The Design, Culture and Play of Modern European Board Games; McFarland & Company, Inc.: Jefferson, NC, USA, 2012. [Google Scholar]
  2. Matalucci, S. Board Game Sales Growth Faces Pandemic Challenges. 2021. Available online: https://www.dw.com/en/coronavirus-rapid-growth-of-board-games-market-faces-pandemic-hurdles/a-56370700 (accessed on 7 October 2024).
  3. Department, S.S. Board Games—Worldwide. 2024. Available online: https://www.statista.com/outlook/cmo/toys-hobby/toys-games/board-games/worldwide (accessed on 7 October 2024).
  4. BoardGameGeek. All Boardgames—BoardGameGeek. 2024. Available online: https://boardgamegeek.com/browse/boardgame (accessed on 7 October 2024).
  5. Amorín, A.I. La aplicación de los juegos de mesa en la enseñanza de la Historia. Clío 2022, 48, 26–49. [Google Scholar] [CrossRef]
  6. Gaite, M.J.M. Los juegos de simulación como recurso didáctico para la enseñanza de la geografía. Didáctica Geográfica 1996, 1, 45–55. [Google Scholar]
  7. Álvarez Reyero, J. Sobre cómo un Inocente Juego de Mesa Despierta el Interés por las Matemáticas Entre el Alumnado. Master’s Thesis, Universidad de Oviedo, Oviedo, Spain, 2024. [Google Scholar]
  8. Teixeira, J.d.S.; Angeluci, A.C.B.; Prates Junior, P.; Prado Martin, J.G. ‘Let’s play?’A systematic review of board games in biology. J. Biol. Educ. 2024, 58, 251–270. [Google Scholar] [CrossRef]
  9. García, J.R.C.; Rivas, P.G.; Sesé, J.M.; Hourcade, J.J.G. Estudio de juegos de mesa como recurso didáctico para la enseñanza de las Ciencias Sociales y Humanidades. La Univ. Como Comunidad Innovación y Cambio 2015, 73. [Google Scholar]
  10. Rubio-Campillo, X. Identificación computacional de temáticas históricas en contextos de aprendizaje informal: El caso de los juegos de mesa. Clío 2022, 48, 1–25. [Google Scholar] [CrossRef]
  11. Sánchez, A.B.G.; Moya, E.C. Revisión sistemática: Beneficios de los juegos de mesa en el ámbito de la educación social con menores de entre 6 y 18 años. Educ. Knowl. Soc. (EKS) 2023, 24, e28528. [Google Scholar] [CrossRef]
  12. Iglesia, J.L.G.; Monterrubio, N.L.; Tena, J. Evaluando el uso de juegos de mesa no educativos en las aulas: Una propuesta de modelo. Communicatio 2018, 7, 37–48. [Google Scholar]
  13. BoardGameGeek. Abstract Strategy—BoardGameGeek. 2024. Available online: https://boardgamegeek.com/boardgamecategory/1009/abstract-strategy (accessed on 7 October 2024).
  14. BoardGameGeek. Micro Robots | Board Game—BoardGameGeek; 2016. Available online: https://boardgamegeek.com/boardgame/191543/micro-robots (accessed on 7 October 2024).
  15. Hendrikx, M.; Meijer, S.; Van Der Velden, J.; Iosup, A. Procedural content generation for games: A survey. ACM Trans. Multimed. Comput. Commun. Appl. (TOMM) 2013, 9, 1–22. [Google Scholar] [CrossRef]
  16. De Kegel, B.; Haahr, M. Procedural puzzle generation: A survey. IEEE Trans. Games 2019, 12, 21–40. [Google Scholar] [CrossRef]
  17. BoardGameGeek. Micro Robots: Rules English. 2019. Available online: https://boardgamegeek.com/filepage/128027/micro-robots-rules-english (accessed on 7 October 2024).
  18. McHugh, J.A. Algorithmic Graph Theory; Prentice Hall: Upper Saddle River, NJ, USA, 1990; Volume 68056. [Google Scholar]
  19. Allauca, J.E. Aplicación de la teoría de grafos en la optimización de redes de transporte. Cienc. Intel. 2023, 1, 1–14. [Google Scholar]
  20. Prathik, A.; Uma, K.; Anuradha, J. An Overview of application of Graph theory. Int. J. Chemtech Res. 2016, 9, 242–248. [Google Scholar]
  21. Ray, S.S. Graph Theory with Algorithms and Its Applications: In Applied Science and Technology; Springer: Berlin/Heidelberg, Germany, 2013. [Google Scholar]
  22. Hesterberg, A.; Kopinsky, J. The parameterized complexity of ricochet robots. J. Inf. Process. 2017, 25, 716–723. [Google Scholar] [CrossRef]
  23. Witter, R.T.; Lyford, A. Applications of graph theory and probability in the board game ticket to ride. In Proceedings of the 15th International Conference on the Foundations of Digital Games, Bugibba, Malta, 15–18 September 2020; pp. 1–4. [Google Scholar]
  24. Lluch, C.J.; Codesal, E.S. Piedra, Papel, Tijera y sus generalizaciones. Model. Sci. Educ. Learn. 2013, 6, 145–153. [Google Scholar] [CrossRef]
  25. Martín Novo, E.; Méndez Alonso, A. Aplicaciones de la teoría de grafos a algunos juegos de estrategia. Suma 2004, 46, 31–36. [Google Scholar]
  26. Martín Morales, J.; Muñoz Escolano, J.M.; Oller Marcén, A.M. Empleo didáctico de juegos que se matematizan mediante grafos: Una experiencia. Context. Educ. Rev. Educ. 2009, 12, 137–164. [Google Scholar]
  27. Neumann-Lara, V.; Rivera-Campo, E. Euler tours and a game with dominoes. Discret. Math. 1997, 167, 511–517. [Google Scholar] [CrossRef]
  28. Borges, S.; Lima, T.; Marques, V. Coloração de grafos aplicado na resolução do sudoku. In Proceedings of the Anais do II Encontro Potiguar de Jogos, Entretenimento e Educação, Natal, Brazil, 7–12 November 2016. [Google Scholar]
  29. Lala, C. Graph Theory of Sudoku. Master’s Thesis, Indian Institutes of Science Education and Research, Bhopal, India, 2013. [Google Scholar]
  30. Wagon, S. Graph theory problems from hexagonal and traditional chess. Coll. Math. J. 2014, 45, 278–287. [Google Scholar] [CrossRef]
  31. Farren, D.; Templeton, D.; Wang, M. Analysis of Networks in Chess; Technical report; Stanford University: Stanford, CA, USA, 2013. [Google Scholar]
  32. Meza, O.; Ortega, M. Grafos y Algoritmos. (Segunda ed.); Editorial Equinoccio: Sartenejas, Caracas Venezuela, 2006. [Google Scholar]
  33. Vidal, E. Algoritmos en Grafos; Facultad de Informática, Universidad Politécnica de Valencia: Valencia, Spain, 2000. [Google Scholar]
  34. Coto, E. Algoritmia Básica de Grados. Lecturas en Ciencias de la Computación, Publicaciones internas, Escuela de Computación; UCV: Caracas, Venezuela, 2003; ISSN 1316-6239. [Google Scholar]
  35. Mariano, V.T.T.; Camacho, J.H.; de Jesús Núñez Cárdenas, F. Propuesta para Encontrar una ruta más Corta en un Entorno de Búsqueda 2D. Cienc. Lat. Rev. Cient. Multidiscip. 2023, 7, 6798–6810. [Google Scholar]
  36. Mariano, V.T.T.; Cárdenas, F.d.J.N.; Hernández, E.A. Análisis de algoritmos de búsqueda en espacio de estados. Cienc. Huasteca Bol. Cient. Esc. Super. Huejutla 2015, 3. [Google Scholar]
  37. Qiu, Y. Aplicación de Algoritmos de Búsqueda en la Optimización de Caminos de Coste Mínimo en Grafos de Decisión. Master’s Thesis, Universidad Politécnica de Madrid, Madrid, Spain, 2017. [Google Scholar]
  38. Sanz Hinojosas, R. Aplicación de Algoritmos de Búsqueda en la Optimización de Caminos de Coste Mínimo en Grafos de Decisión. Master’s Thesis, Universidad Politécnica de Madrid, Madrid, Spain, 2016. [Google Scholar]
  39. Technologies, U. Motor de Unity. 2005. Available online: https://unity.com/es/products/unity-engine (accessed on 7 October 2024).
  40. Kvarfordt, D. Pyxel Edit. 2024. Available online: https://pyxeledit.com (accessed on 7 October 2024).
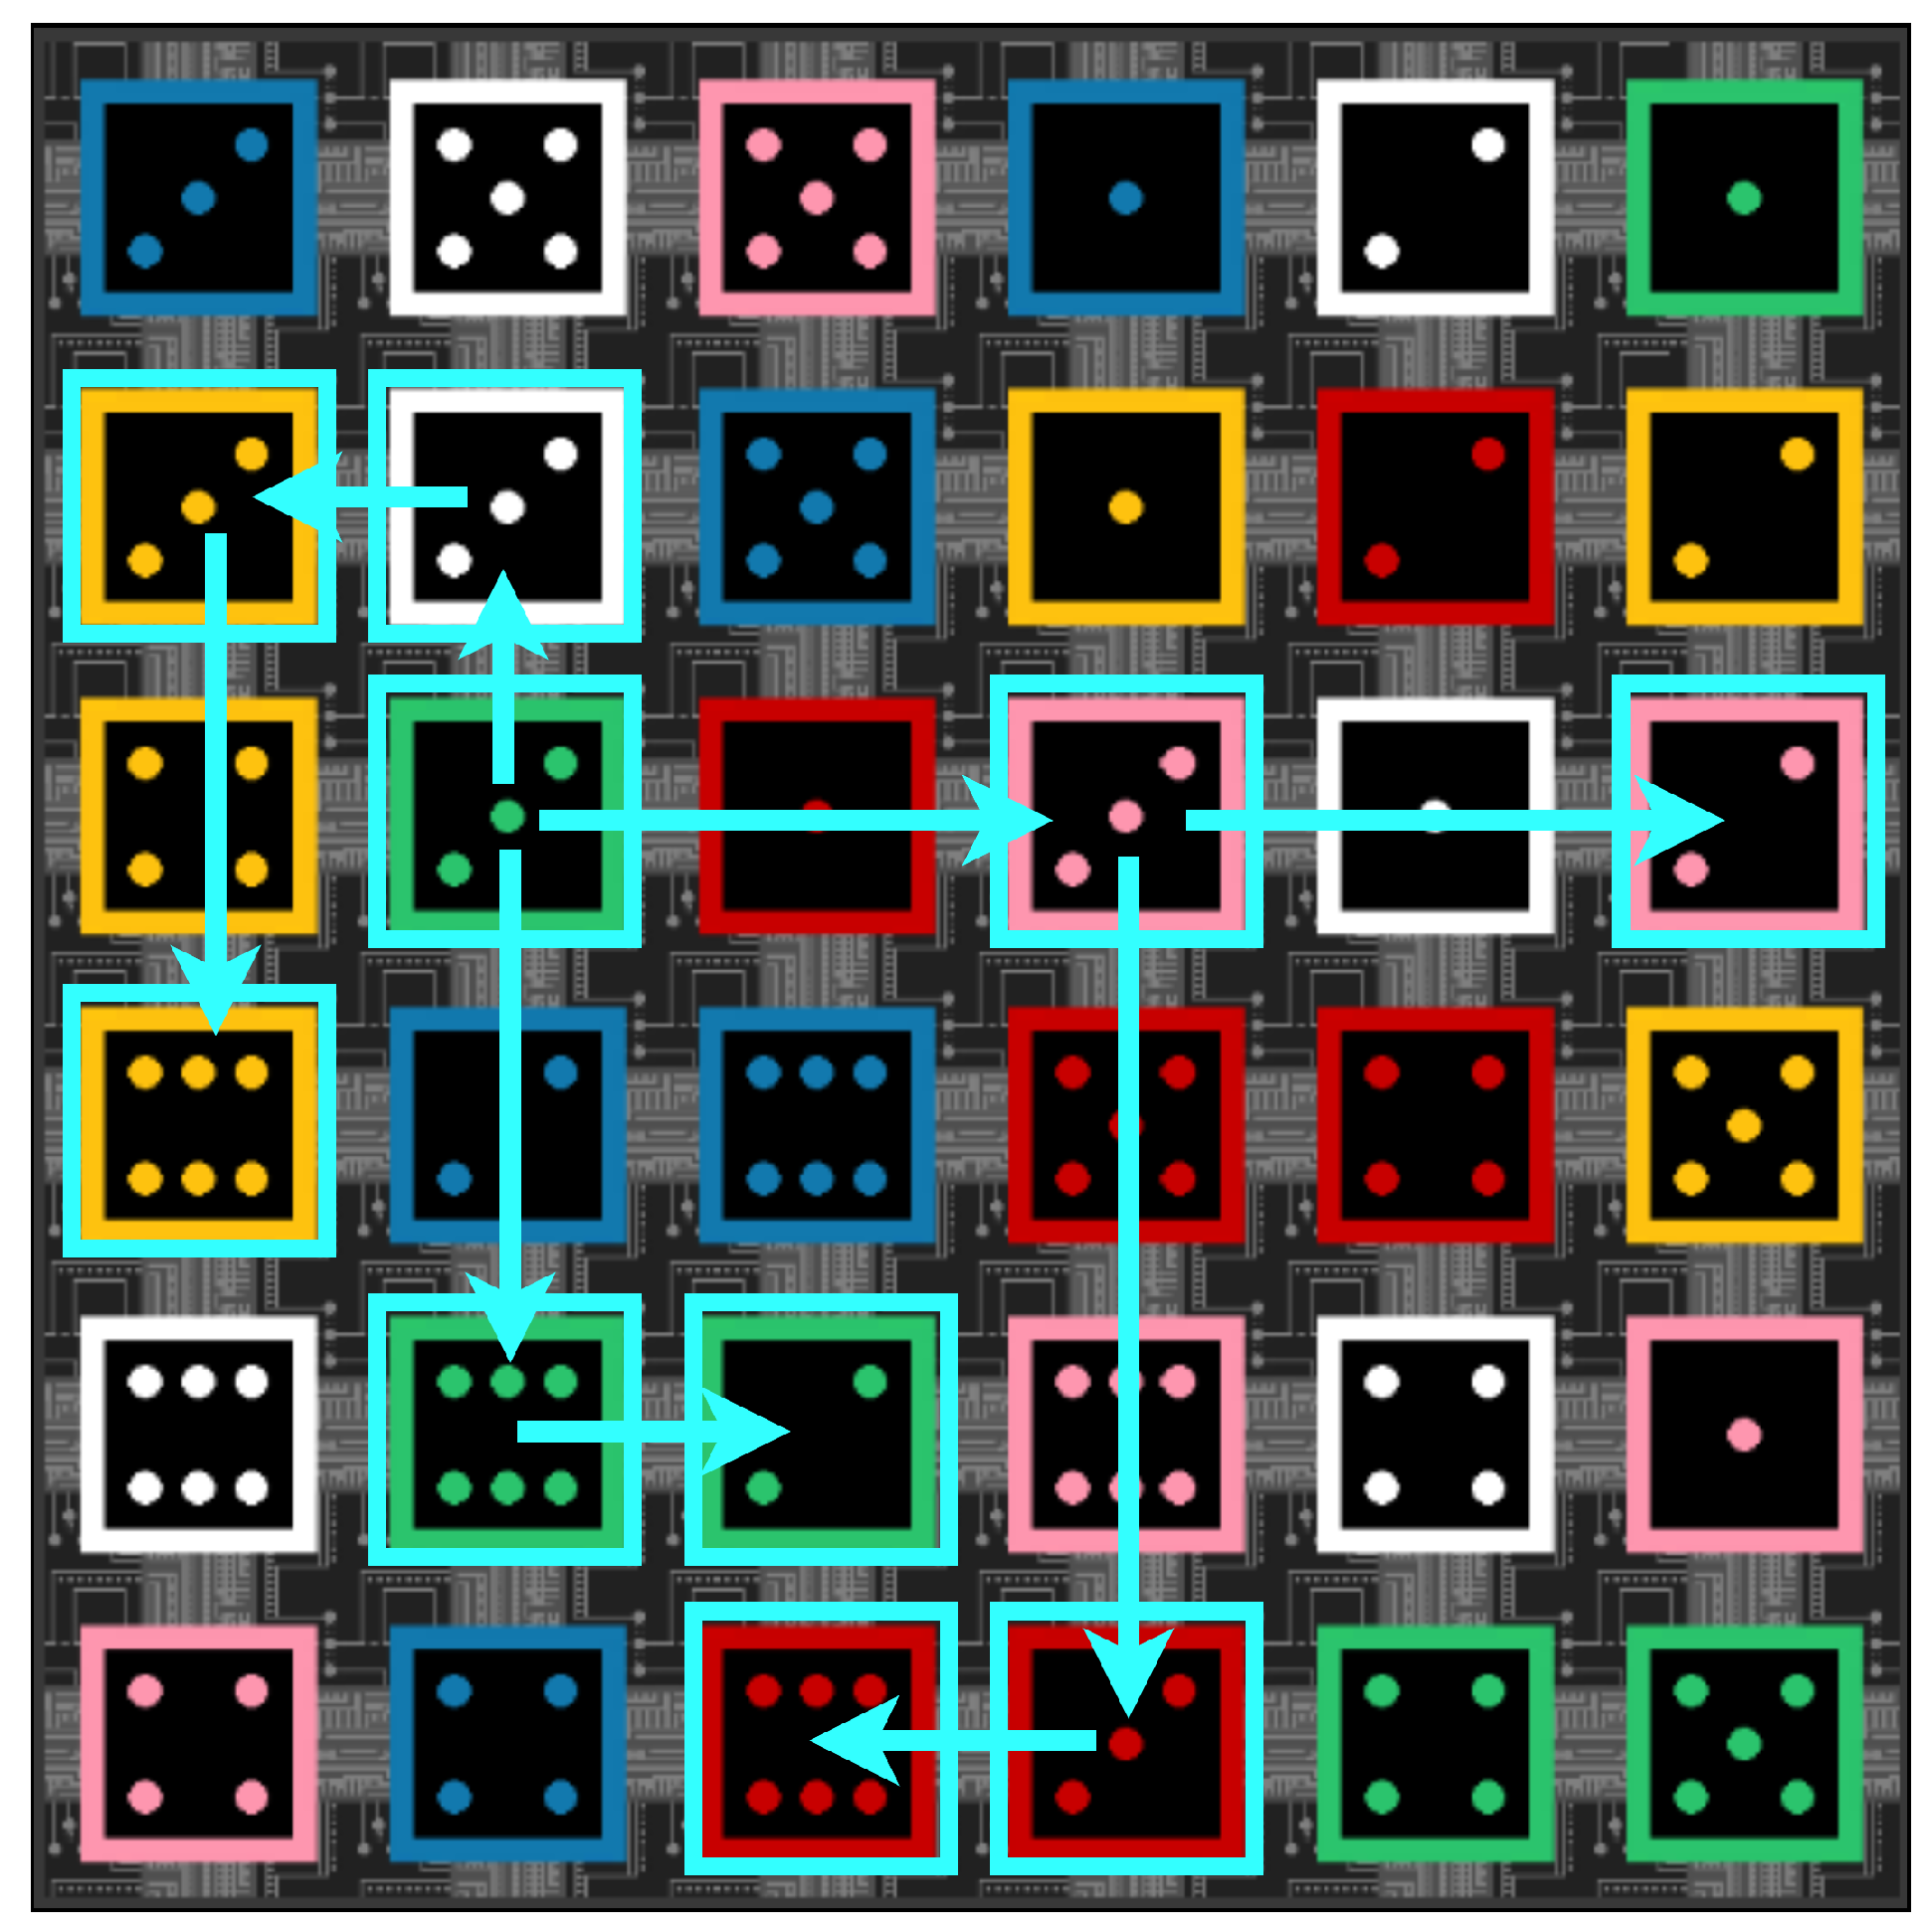
Figure 1. Demonstration of player movement mechanics. Only moves between squares on the same row or column that share the color or the number are allowed.
Applsci 14 09416 g001
Figure 2. (a) Schematic board configuration; each uppercase letter represents a quadrant. (b) Schematic board configuration with rotated quadrants. Each apostrophe (’) represents a quadrant rotation of 90° clockwise.
Applsci 14 09416 g002
Figure 3. Four quadrants of one of the two original boards of the Micro Robots game.
Applsci 14 09416 g003
Figure 4. (a) Example of a board in its initial configuration, after randomly rearranging its quadrants (A, B, C, D); (b) example of the resulting board after moving the quadrants (no rotation) (D, C, B, A); (c) example of the resulting board taking the board from (b) and rotating quadrant D three times (270°) (D′′′, C, B, A).
Applsci 14 09416 g004
Figure 5. Diagram of the board generation system.
Applsci 14 09416 g005
Figure 6. Start menu of the “Find A Path” prototype.
Applsci 14 09416 g006
Figure 7. Example of a game with a 6 × 6 board in “Find A Path”, and final menu of “Find A Path”.
Applsci 14 09416 g007
Figure 8. (a) Original board, composed of four subsets of 3 × 3; (b) generated board, composed of four subsets of 3 × 3. To see notation of subsets, see Figure 2.
Applsci 14 09416 g008
Table 1. Number of randomly generated boards of different dimensions based on the time used.
DimensionQuantityTime
4 × 4 boards9681 h
6 × 6 boards97310 h
Table 2. Comparison of links based on 50 board configurations: original board vs. generated board.
Original BoardGenerated Board
Type of LinkAverage of LinksStandard DeviationAverage of LinksStandard Deviation
Single link2.061.542.621.32
Double link7.902.828.782.99
Triple link12.782.5910.182.42
Quadruple link8.742.489.442.83
Quintuple link2.681.243.741.86
Sextuple link1.581.221.141.00
Septuple link0.240.470.100.30
Octuple link0.020.140.000.00
Total links36 36
Disclaimer/Publisher’s Note: The statements, opinions and data contained in all publications are solely those of the individual author(s) and contributor(s) and not of MDPI and/or the editor(s). MDPI and/or the editor(s) disclaim responsibility for any injury to people or property resulting from any ideas, methods, instructions or products referred to in the content.