Study Protocol

Research on Optimal Control of Treadmill Shock Absorption Based on Ground Reaction Force Constraint

1
Institute of Applied Technology, College of Science & Technology, Ningbo University, Ningbo 315000, China
2
Faculty of Mechanical Engineering and Mechanics, Ningbo University, Ningbo 315000, China
*
Author to whom correspondence should be addressed.
Appl. Sci. 2024, 14(20), 9509; https://doi.org/10.3390/app14209509
Submission received: 7 September 2024 / Revised: 15 October 2024 / Accepted: 16 October 2024 / Published: 18 October 2024

Abstract

:
Research shows that treadmill shock-absorbing devices can reduce the impact of ground reaction forces on the knee and ankle joints during running. Most existing treadmills use fixed or passive shock absorption, meaning their shock-absorbing systems do not actively adjust to changes in ground reaction forces (GRFs). Methods: This study establishes a mathematical model integrating human motion biomechanics and treadmill running surfaces, analyzing the relationships between various parameters affecting the system. Ultimately, an optimal shock-absorbing treadmill control system is designed, utilizing a microcontroller as the main control unit, airbags for shock absorption, and a widely used foot pressure testing system. Objective: The goal is to more effectively prevent running injuries caused by excessive foot pressure. Compared to conventional shock absorption systems, this design features an active multilevel adjustment function with higher precision in regulation. Results: The experimental results demonstrate that the ground reaction force (GRF) generated by the optimal shock-absorbing treadmill control system is reduced by up to 10% compared to that of a conventional shock-absorbing treadmill. Conclusions: This leads to a smaller impact force on the knees due to foot pressure, resulting in better injury prevention outcomes.

1. Introduction

Running is one of the best ways to reduce the various harms associated with prolonged sitting, eliminate negative physiological states, and alleviate psychological stress. It is the most popular form of physical exercise in China and has the highest participation rate. With the development of the times, more and more people are choosing to exercise indoors on treadmills. During running, the vertical ground reaction force can be 2 to 5 times the body weight [1]. Correspondingly, the increasing popularity of running has led to a higher incidence of running-related injuries. Epidemiological studies have found that the knee joint is the most vulnerable part of the body to injury during running [2,3]. During running, the large and repetitive ground reaction forces (GRFs) on the knee joint can increase the risk of overuse injuries [4]. Winter [5] pointed out that during the support phase of jogging, energy is primarily absorbed by the knee joint and generated at the ankle joint. Therefore, having a superior shock absorption system in treadmills is crucial to prevent injuries to the ankle and knee joints of runners.
Research indicates that treadmills have the highest shock absorption capability among all surfaces, such as artificial turf and athletic tracks. Treadmills with more shock-absorbing and compliant surfaces are expected to enhance energy return for athletes [6]. Shock-absorbing treadmills generally reduce foot pressure and stress during running, with the most significant reductions observed in the forefoot and midfoot areas. Impact forces typically increase with speed [7]. There are subtle differences in the electromyography (EMG) signals of leg muscles between running on the ground and running on a treadmill [8].
Rodden, P.T. set multiple springs between the two sides of the running belt plate and the bottom frame to realize the spring shock absorption of the treadmill [9]. Yuegang, M.A. set elastic pads between the treadmill frame and the body of the support wheel to realize shock absorption of the treadmill rubber pad [10]. Yuegang, M.A. installed two magnetically repelling magnets on the lower side of the support plate and the upper side of the frame of the treadmill base to achieve magnetic suspension shock absorption of the treadmill [11]. Moser, G. implemented shock absorption through multiple air suspension elements [12]. The shock absorption systems mentioned above are primarily passive, relying on nonadjustable methods or manual changes to rubber pads. Adjusting the hardness of the rubber or changing the number of springs is often aimed at simulating different running surfaces, such as grass or synthetic tracks. However, these systems cannot actively adjust treadmill shock absorption based on the magnitude of ground reaction forces (GRFs). This makes operation cumbersome and limits precise regulation, reducing their effectiveness in preventing exercise-related injuries.
The peak foot pressure is the most direct indicator of the magnitude of ground reaction force (GRF). GRF represents the reaction force exerted by the ground on the foot during running when it makes contact with the surface. In light of current research, this paper proposes a control system for treadmills that actively adjusts the shock absorption based on the magnitude of GRF. This paper establishes an active control system for treadmill shock absorption through system modeling and experimental setup. The designed treadmill is modified from a standard rubber-bottom treadmill. The hardware components include airbags, air tubes, a pump, solenoid valves, relays, a pressure sensor, a microcontroller, a safety valve, a host computer, and foot pressure sensors. This treadmill can actively adjust its shock absorption based on the specified dataset. The actively controlled shock absorption treadmill offers a multilevel adjustment feature compared to conventional shock-absorbing treadmills. It can more effectively and accurately reduce peak foot pressure during running, resulting in improved shock absorption. This, in turn, is beneficial for lowering the risk of injuries to the knee and ankle joints.

2. Establishment of the Mathematical Model

2.1. Biomechanical Motion Model

Currently, there is extensive experimental research and equivalent function modeling in human motion biomechanics. Scholars have explored various modeling techniques, such as the four-degree-of-freedom MSD model proposed by Liu and Nigg [12], known as the LN model. This model integrates the rigid and swinging mass of the upper and lower limbs for the first time. However, as a passive model, the LN model cannot account for changes in the stiffness and damping of soft tissues in the legs. Zadpoor and Nikooyan [13] proposed a new active model—the LNZN model, which is an improvement over the LN model. In this model, the stiffness and damping coefficients of the lower limb muscles are adjustable, and the parameters are described in detail. This paper presents a new model based on the improvement of the LNZN model, adding an additional layer to represent the subsystem of the treadmill platform, as shown in Figure 1a for human running on a treadmill. The modified model is shown in Figure 1b. The model has seven particles. m represents the mass of the system (units: kg); c denotes the damping coefficient of the damper (units: N*s/m); and k indicates the spring constant (units: N/m). The stiffness and mass of the upper and lower limbs are represented by m1 and m3, respectively. These are linked by a set of springs and dampers, denoted as k1 and c1. The mass of the lower limb soft tissues is represented by m2, which is connected to the stiffness mass m3 via a spring with a stiffness coefficient k3. It is also connected to the lower tissue stiffness mass through a variable stiffness spring–damper system k2 and c2. The upper limb stiffness m3 is directly connected to the lower limb stiffness mass via k1 and c1. The mass of the upper limb soft tissues is represented by m4, which is connected to the upper limb stiffness mass by k5, k4, and c4. In this model, the rigid body masses represent the skeletal mass of the human body, such as m1 and m3, while the swinging mass represents the soft tissue mass, including muscles and blood. m5 represents the stiffness mass of the treadmill platform; kt5 and ct5 denote the equivalent damping of the athletic shoes worn during the experiment. m6 and m7 are the equivalent masses of the shock-absorbing airbags; k6 and k7 are the equivalent spring stiffness of the treadmill platform; c6 and c7 are the equivalent damping of the airbags. kt6 and kt7 represent the equivalent damping spring stiffness of the treadmill support frame. Additionally, fg is the external force absorbed by the human body (units: N), while fg1 and fg2 are the external forces absorbed by the two shock-absorbing airbags (units: N).
According to the modified model, the equation of motion can be obtained as follows:
m 1 x 1 ¨ = m 1 g + k 1 x 3 x 1 + k 2 x 2 x 1 + c 1 x ˙ 3 x ˙ 1 + c 2 x ˙ 2 x ˙ 1 f g m 2 x 2 ¨ = m 2 g + k 2 x 2 x 1 + k 3 x 3 x 2 + c 2 x ˙ 2 x ˙ 1 m 3 x 3 ¨ = m 3 g + k 1 x 3 x 1 + k 3 x 3 x 2 + k 4 + k 5 x 4 x 3 + c 1 x ˙ 3 x ˙ 1 + c 4 x ˙ 4 x ˙ 3 m 4 x 4 ¨ = m 4 g + k 4 + k 5 x 4 x 3 + c 4 x ˙ 4 x ˙ 3 m 5 x 5 ¨ = m 5 g + k t 5 x 1 x 5 + k 6 x 5 x 6 + k 7 x 5 x 7 + c t 5 x 1 ˙ x 5 ˙ + c 6 x 5 ˙ x 6 ˙ + c 7 x 5 ˙ x 7 ˙ m 7 x 7 ¨ = m 7 g + f g 2 k t 7 x 7 f g 1 + f g 2 = f g
In the equations, the coefficients m, c, and k represent mass, damping, and stiffness, respectively, while g denotes gravitational acceleration. In Nikooyan and Zadpoor [13], the magnitude of the ground reaction force (GRF) is represented as Fg, which has been modified. According to the modified model, the vertical contact force Fg is expressed as follows:
F g = A c [ a ( x 1 x 5 ) b + c ( x 1 x 5 ) d ( x ˙ 1 x ˙ 5 ) e ]   x 1 > 0 0   x 1 0
Ac, a, b, c, d, and e are shoe-specific parameters that correspond to the values for soft and hard shoes. The parameters used in this experiment are consistent with those employed by Zadpoor and Nikooyan, as shown in Table 1. In reality, this represents a nonlinear elastic model, where parameters a, b, c, d, and e are unique to the shoes.

2.2. Airbag Model

The experiment uses two airbags, one on each side of the treadmill structure. Each airbag has a gas capacity of 2.5 L and a maximum pressure of 300 kPa. Made from rubber, they are suitable for most harsh environments. The state of the gas within the airbags can be described using the ideal gas law, which expresses the relationship between pressure, volume, and temperature as follows:
P V = n R T
where P is the gas pressure (Pa); V is the gas volume (m3); n is the amount of substance of the gas (mol); R is the gas constant (J/(mol·K)); and T is the absolute temperature of the gas (K). Assuming the gas inside the airbag behaves as an ideal gas and that the temperature remains constant, the ideal gas law can be simplified to
P = n R T V
Since the volume and temperature of the airbag remain constant, the pressure P of the airbag is directly proportional to the amount of substance n of the gas. Based on the provided parameters, the pressure model for the airbag can be expressed as
P = k m
where k is a constant representing the specific performance parameter of the airbag, and m is the load supported by the treadmill, which corresponds to the user’s weight. Given that the volume of the airbag is 2.5 L, it can be substituted into the equation to obtain
P × 2.5 = n R T
Since the amount of substance of the gas (n) and the temperature (T) remain constant, they can be combined into a constant k, resulting in
P × 2.5 = k
The constant k can be determined through experimental measurement or theoretical calculation. In this experiment, the value of k is obtained through experimental measurement. Under controlled conditions (such as maintaining a constant temperature), different loads (body weights) are applied to the airbag, and the corresponding pressure P and load m are recorded for each measurement. The value of k is derived using linear regression and simple calculations. Since the airbag pressure varies between 0 and 300 kPa, it can be substituted into the equation. Therefore, the relationship between the airbag volume V and the pressure P can be expressed simply as
V = k P

2.3. Foot Pressure Model

2.3.1. Air Pressure and Foot Pressure

It can be assumed that there exists some functional relationship between air pressure and foot pressure, denoted as P P a , where P represents foot pressure and P a represents air pressure. Since the data obtained in this experiment are discrete and it is not possible to directly find a function to describe this relationship, linear interpolation is used to approximate this function. It can be assumed that the relationship between foot pressure P and air pressure P a is
P P a = k · P a + b
where k is the slope of the linear relationship, and b is the intercept. Setting two data points ( P a 1 , P 1 ) and ( P a 2 , P 2 ), we have
P 1 = k · P a 1 + b
P 2 = k · P a 2 + b
To solve this equation, find the values of k and b:
k = P 2 P 1 P a 2 P a 1
b = P 1 k · P a 1

2.3.2. Speed and Foot Pressure

Due to the nonlinear relationship between speed and foot pressure, polynomial fitting can be attempted to establish a model. The least squares method can be used to fit the data, minimizing the error between the function and the actual data. It is assumed that the relationship between the ground reaction force and running speed can be described using a quadratic polynomial:
F v = a v 2 + b v + c
where F(v) is the ground reaction force, v is the running speed, and a, b, and c are the coefficients to be determined. By substituting the ground reaction force F(v) corresponding to each speed v into the quadratic polynomial equation, a set of equations is obtained. The coefficients of this set of equations can then be solved using the least squares method to minimize the sum of squared residuals:
i = 1 n ( F i ( a v i 2 + b v i + c ) ) 2
where n is the number of data points and F i is the speed corresponding to the i-th data point.

2.3.3. Model of Air Pressure, Foot Pressure, and Speed

The data obtained in this experiment can be used to fit and establish a mathematical relationship among the three variables. The following polynomial can be used:
P = a 0 + a 1 · v + a 2 · P a + a 3 · v 2 + a 4 · v · P a + a 5 · P a 2
where P is the reaction force, v is the speed, P a is the air pressure, and a 0 , a 1 , a 2 , a 3 , a 4 , a 5 are the coefficients to be determined. The data obtained in this experiment can be used to fit the polynomial and find suitable coefficients. In this experiment, the scientific computing library in Python 3.7 is used to fit the results.

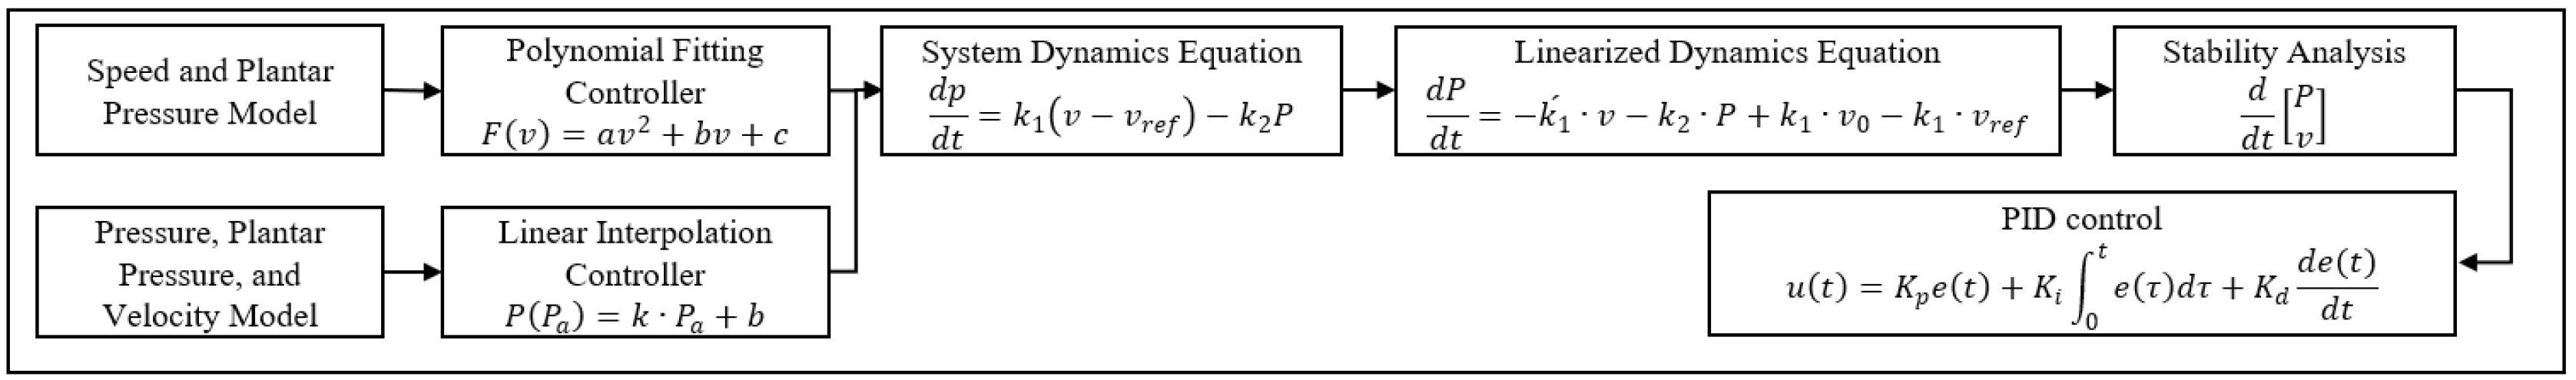
2.4. Establishing a System Stability Model

2.4.1. Establishing the System Dynamics Equation

This experiment involves a treadmill system, where the airbag pressure can be adjusted to influence the ground reaction force (GRF). The state variable of the system is the airbag pressure P, and the control variable is the speed V. The airbag pressure is influenced by two factors: first, the control exerted by the air pump, and second, the GRF generated during human movement. Considering that the inflation and deflation processes of the airbag are complex nonlinear processes, we can simplify the model by assuming that the inflation rate and deflation rate of the air pump are linearly related, and that the GRF is linearly related to the air pressure. Therefore, a simplified system dynamics equation can be established as follows:
d p d t = k 1 v v r e f k 2 P
where p is the airbag pressure; t is time; v is the current running speed; v r e f is the set target running speed; and k 1 and k 2 are system parameters representing the influence coefficient of running speed on air pressure and the rate of air pressure leakage.

2.4.2. Linearized System Dynamics Equations

To linearize the system dynamics equation, we first need to linearize the nonlinear parts, assuming the system operates near a specific operating point ( P 0 , v 0 ). Considering the k 1 ( v v r e f ) term in the system dynamics equation, we can use Taylor expansion to linearize this term. The first-order approximation of the Taylor expansion is
k 1 v v r e f k 1 v v r e f + k 1 ´ ( v v 0 )
where k 1 ´ is the first derivative of k 1 with respect to v evaluated at the operating point v 0 . Substituting this approximation into the dynamics Equation (17) yields
d P d t = k 1 v v r e f + k 1 ´ v v 0 k 2 P
Substituting v 0 into the position of v and considering that the first derivative of k 1 near the operating point can be treated as a constant, the linearized system dynamics equation becomes
d P d t = k 1 ´ · v k 2 · P + k 1 · v 0 k 1 · v r e f
This is the linearized dynamic equation of the system near ( P 0 , v 0 ).

2.4.3. Stability Analysis

To conduct a stability analysis, it is necessary to consider the linearized state of the system near the operating point and analyze the eigenvalues. The real part of the eigenvalues can indicate the stability of the system; a negative eigenvalue indicates that the system is stable near that operating point. The linearized dynamics Equation (20) can be written in matrix form as
d d t P v = k 2 k ´ 1 0 0 P v + k 1 · v 0 k 1 · v r e f 0
The system can be expressed as x ˙ = A x + B u , where x is the state variable vector, A is the state transition matrix, B is the input matrix, and u is the control variable vector. A is the coefficient matrix of the linearized dynamics equation. The eigenvalues λ are the roots that satisfy the equation d e t ( A λ I ) = 0 , where I is the identity matrix. According to the quadratic formula, λ can be solved as
λ = k 2 ± k 2 2 2

2.4.4. Stability Control Strategy

From Formula (22), we can find that λ 1 = 0 and λ 2 = k 2 . Since the system adjusts the foot pressure by controlling the airbag pressure, λ 1 = 0 indicates that the feedback mechanism of the control system is very effective, allowing the system to quickly return to the target state when subjected to disturbances. The sign of λ 2 depends on k 2 . To ensure that all the real parts of the eigenvalues are negative, this experiment uses a feedback controller, where the control input is a function of the system state. A feedback system is designed to adjust the inflation and deflation rates of the air pump to keep the system stable. A simple feedback system strategy is implemented using a PID controller, where the control objectives are the set airbag pressure (the target airbag pressure defined by the system) and the current airbag pressure (the real-time monitored airbag pressure value). The output of the PID controller can be expressed as
u t = K p e t + K i 0 t e τ d τ + K d d e ( t ) d t
where e t is the current pressure difference, expressed as
e t = P t a r g e t P a c t u a l
u t is the control output used to adjust the inflation and deflation amounts of the air pump. When u t > 0 , the air pump inflates, increasing the airbag pressure. When u t < 0 , the solenoid valve releases air, decreasing the airbag pressure. Appropriate values for K p , K i , and K d are set through experiments to ensure responsiveness and stability.

3. Overall Design of Active Control System for Treadmill Shock Absorption

A block diagram of the overall design of the system is shown in Figure 2. This system includes the foot pressure model, system dynamics model, system stability model, and stability control strategy. In this experiment, the ideal gas law is used to describe the state of the gas in the airbag, the relationship between air pressure and foot pressure is approximated using linear interpolation, and polynomial fitting is employed to describe the relationship between foot reaction force and running speed. Finally, by establishing the system dynamics equations and performing linearization, the stability of the system was analyzed, and a stable control strategy was designed. In the control system, PID control is used, and appropriate values for K p , K i , and K d are set through experiments to ensure responsiveness and stability.

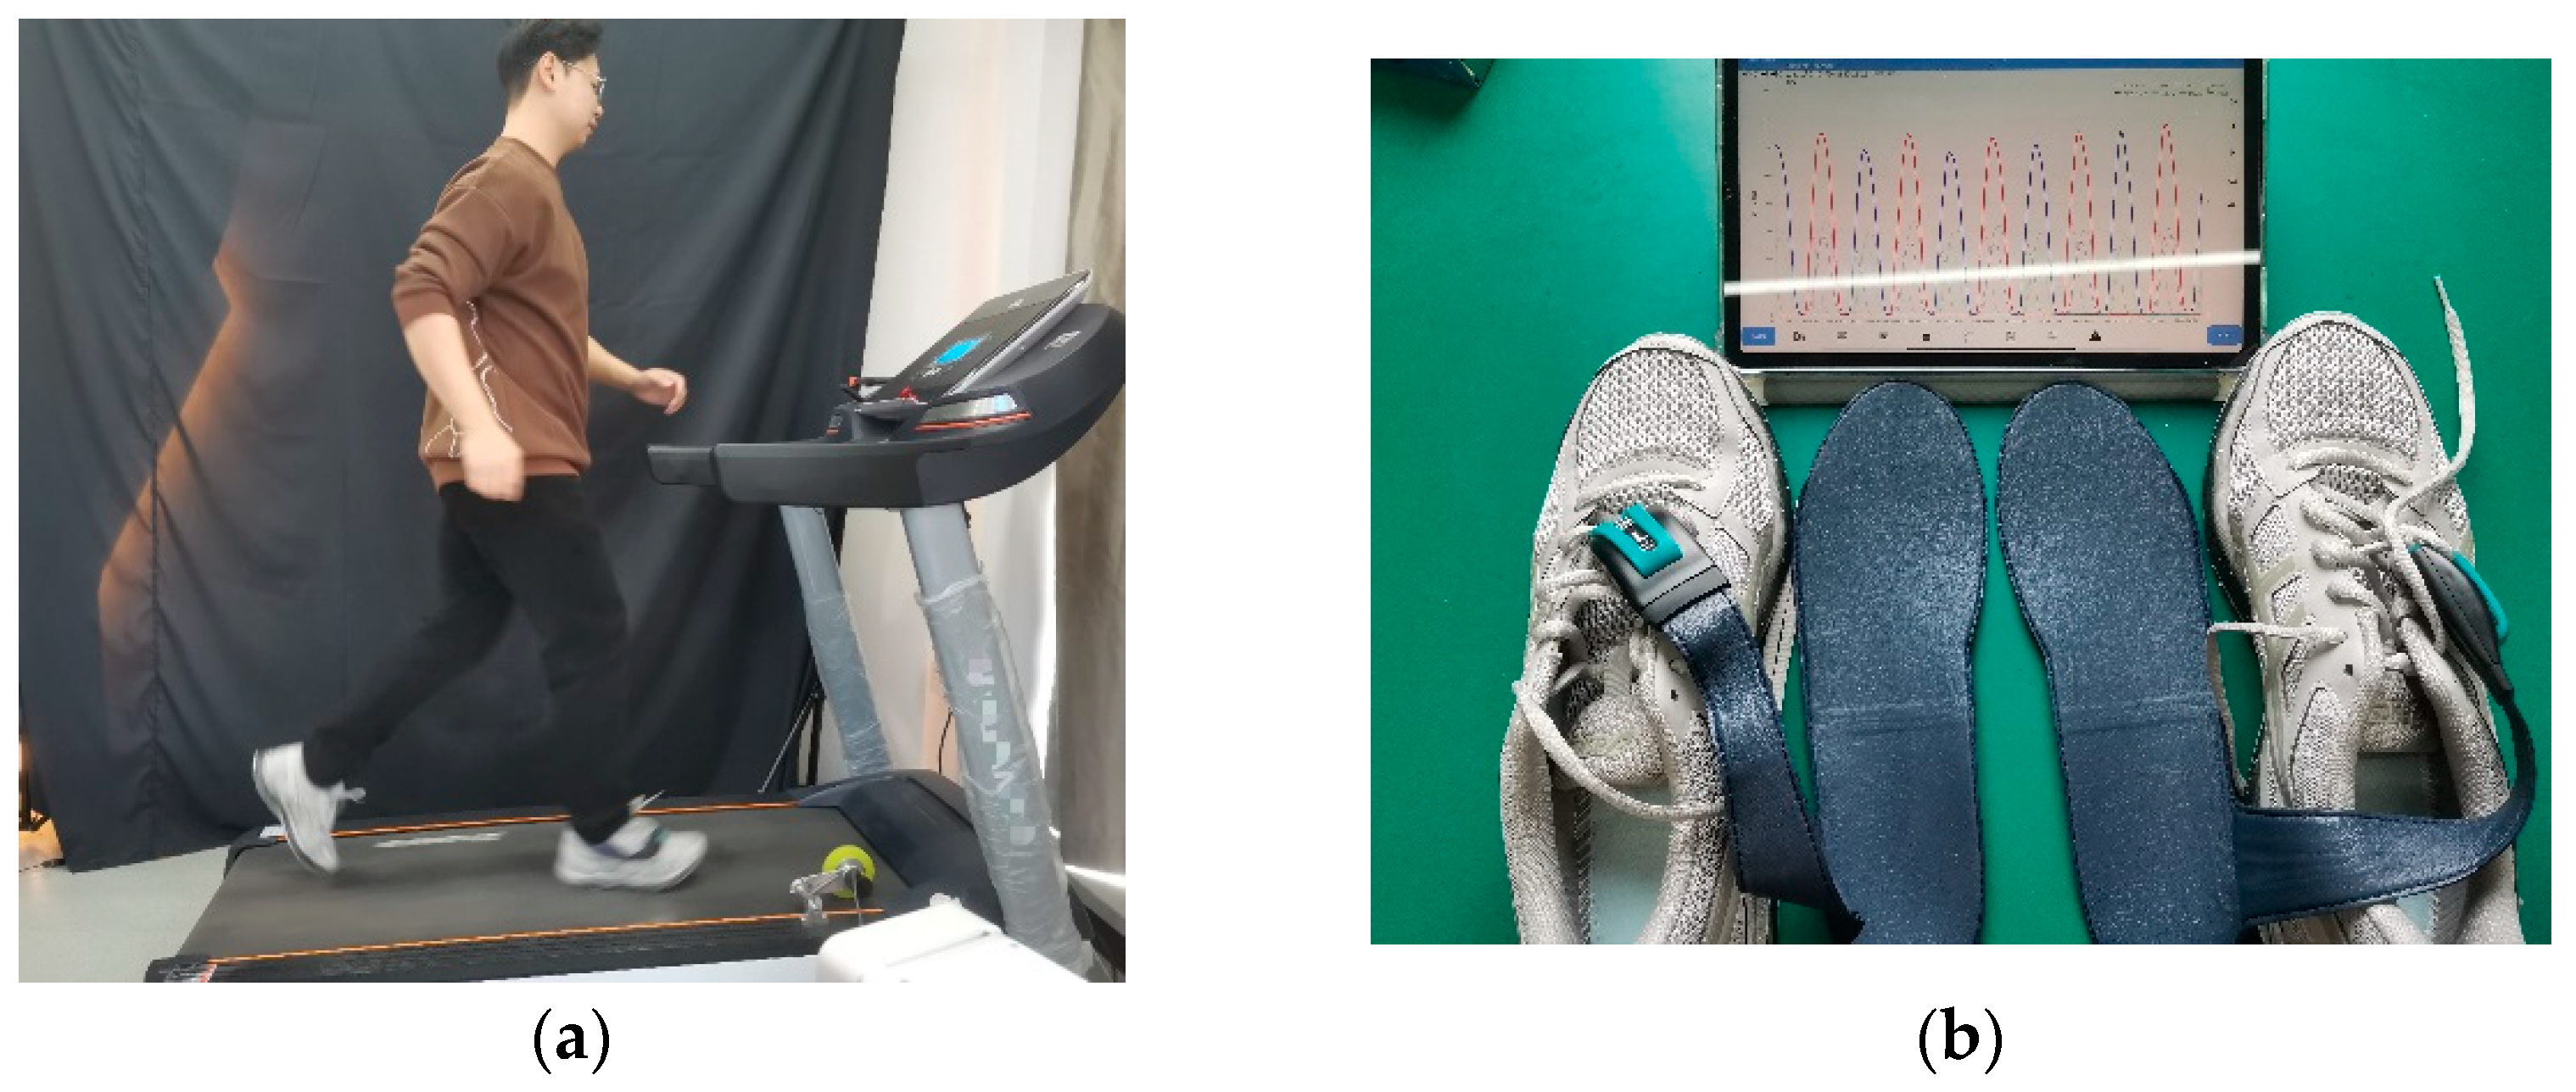
4. Experimental Data Collection

4.1. Foot Pressure Testing System

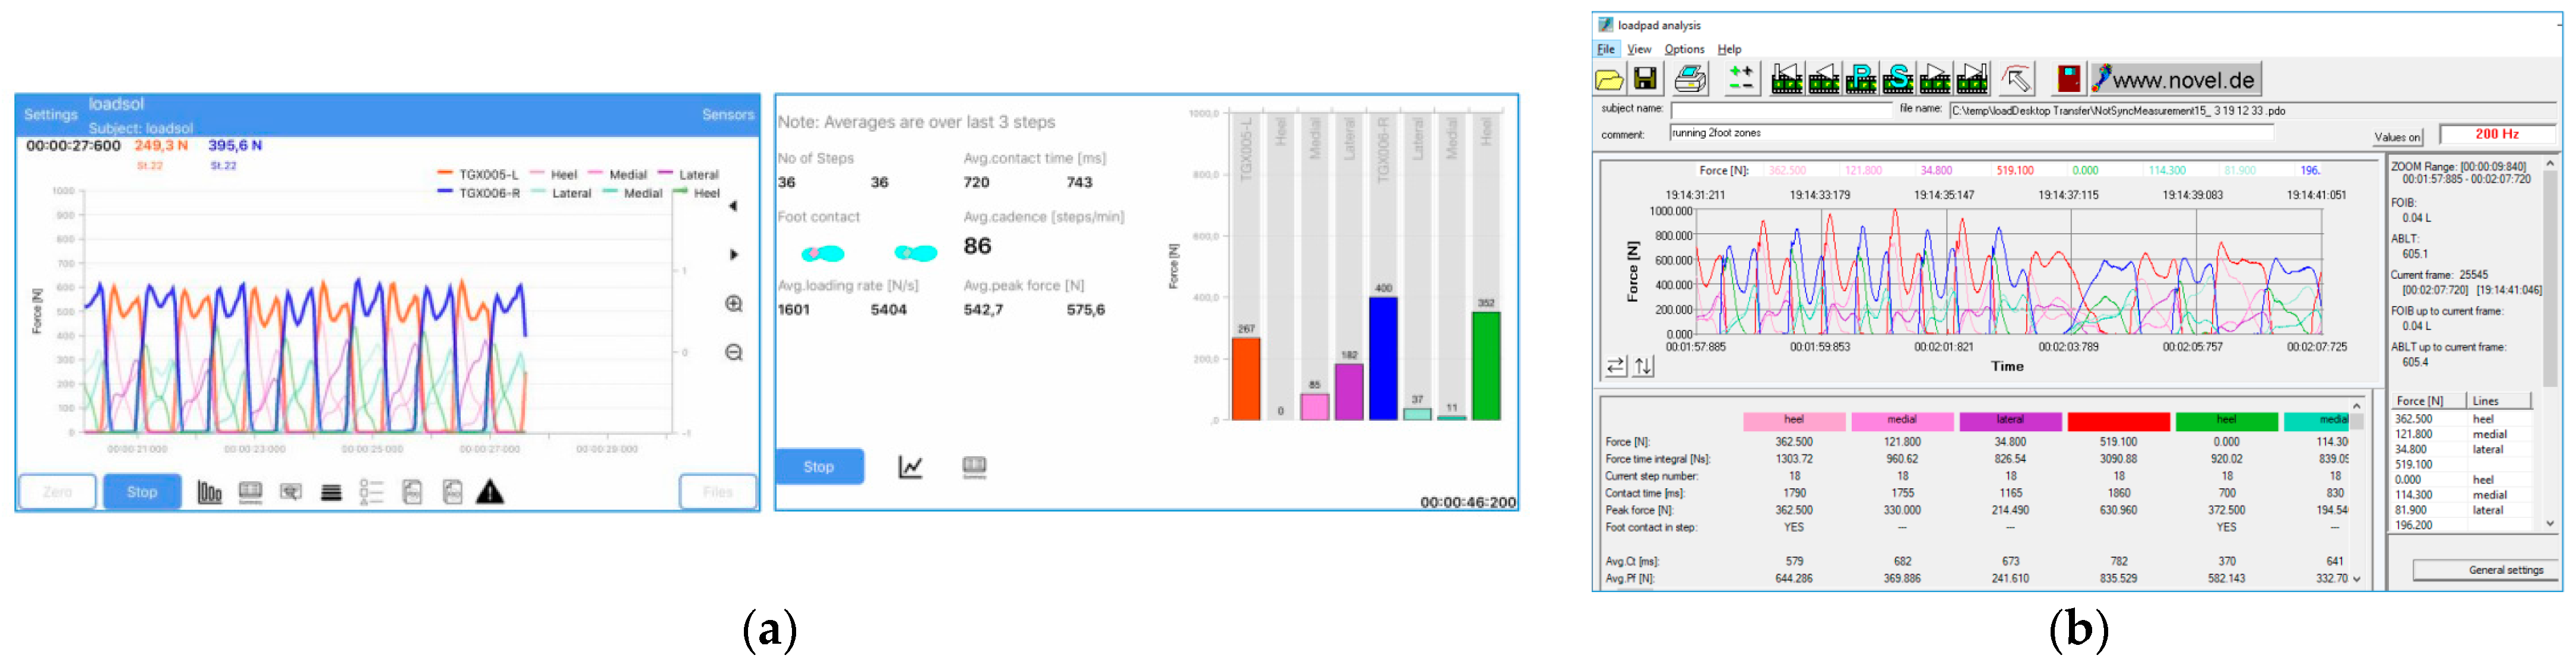
4.1.1. Dataset Creation

Participants: A total of 27 subjects of different genders, ages, and weights were selected for this experiment. This article focuses on a single male participant in the testing. The subject is 170 cm tall, weighs 71 kg, is in good health, has experience using a treadmill, possesses good athletic ability and running habits, does not have flat feet or high arches, and has had no history of lower limb injuries in the year prior to the experiment (Figure 3a).
Methods: The participant wore athletic clothing and running shoes equipped with foot pressure sensor insoles (Figure 3b) and performed an 8 min warm-up jog before running. Since the typical treadmill running speeds range from 4 km/h to 11 km/h, the testing speeds were set to 4 km/h, 5 km/h, 6 km/h, 7 km/h, 8 km/h, 9 km/h, 10 km/h, and 11 km/h (with 4 km/h corresponding to a brisk walk and the other speeds corresponding to running). The foot pressure sensor was zeroed before each test. After running for 1 min, the runner reached a stable state, and data collection began for 1 min. There was a 10 min rest period between each run to ensure the participant had time to recover. During each pace run, adjustments were continuously made to the air pressure in the airbags, allowing multiple sets of different pressure values to be tested at each speed to determine the optimal pressure value for different speeds. The peak foot pressure values collected within 1 min were averaged, and then the average foot pressure values at different air pressure settings in the airbags were compared at a fixed speed. The air pressure value corresponding to the minimum average foot pressure was identified as the optimal pressure value for that specific pace. This process was repeated to determine the optimal pressure values for different paces. Subsequently, the average peak foot pressure values were also collected for a standard rubber shock-absorbing treadmill at different paces.

4.1.2. Data Processing

The pedar-X in-shoe system is used to measure foot pressure, and it has been proven to be an effective, reliable, and accurate method for measuring plantar pressure [14,15]. The pedar-X insoles are thin and flexible, consisting of 99 capacitive sensors (Figure 4a,b), with an error typically ranging from ±5% to ±10%. The data measured by the pedar-X pressure sensors have undergone data filtering and normalization, enhancing the accuracy and reliability of the data. This ensures that the analysis reflects a more accurate plantar pressure distribution. Therefore, the GRF data obtained in this experiment come entirely from the output of the pedar-X sensors. Bus et al. [16] and Owings et al. [17] used the pedar-X pressure measurement system in cross-sectional studies to measure plantar pressure. When analyzing the peak plantar pressure data from the left and right feet, 40 consecutive stable peak values from each foot were averaged to obtain the data. The output from the STM32F103C8T6 chip’s serial module displayed the air pressure values detected by the pressure sensor for the airbags. The pressure sensor used in this experiment typically has an error ranging from ±0.5% to ±1%. Data analysis was performed using Excel 2016 and Origin 2021 to create graphs showing the relationship between plantar pressure and air pressure at different speeds, as well as speed vs. plantar pressure analysis.

5. Experimental Data

5.1. Establishment of the Dataset

The dataset is established by continuously changing the air pressure values of the airbags in the active damping control treadmill while measuring the ground reaction force (GRF) at a constant speed. The air pressure value corresponding to the minimum GRF at a specific speed is considered the optimal pressure for that speed. Following this pattern, the air pressure values corresponding to the minimum GRF at different speeds are measured to create the dataset. The dataset includes graphical representations of certain data (Figure 5a shows the air pressure value corresponding to the minimum GRF at a speed of 4 km/h, while Figure 5b shows the same for a speed of 10 km/h). From Figure 5a, it can be seen that at a speed of 4 km/h, the air pressure value of 140 kPa corresponds to the minimum foot pressure value (GRF). Similarly, from Figure 5b, at a speed of 10 km/h, the air pressure value of 80 kPa corresponds to the minimum foot pressure value (GRF).

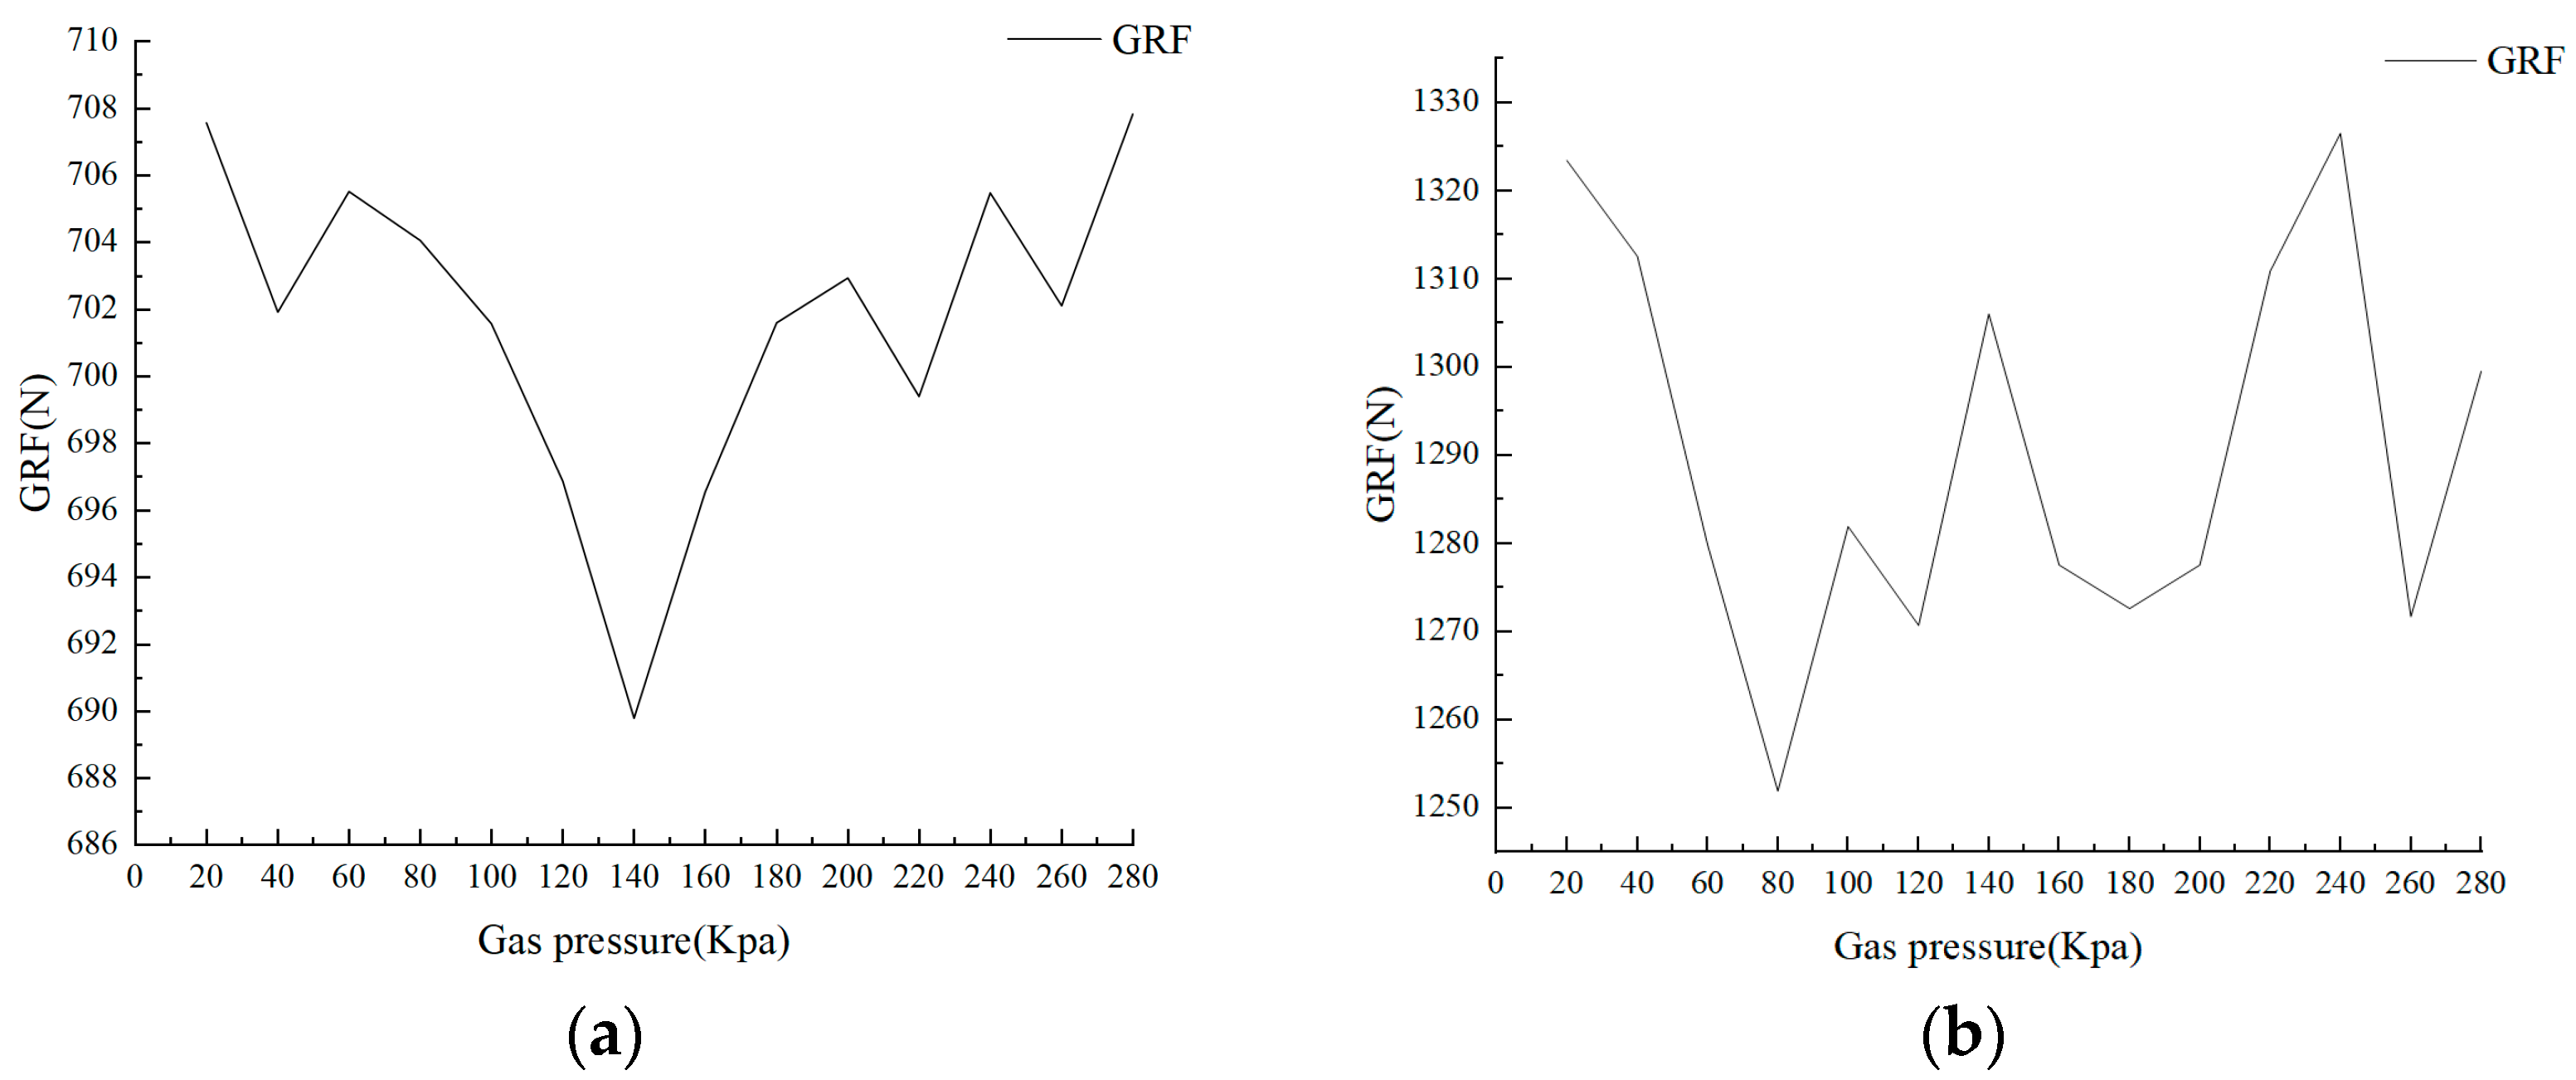
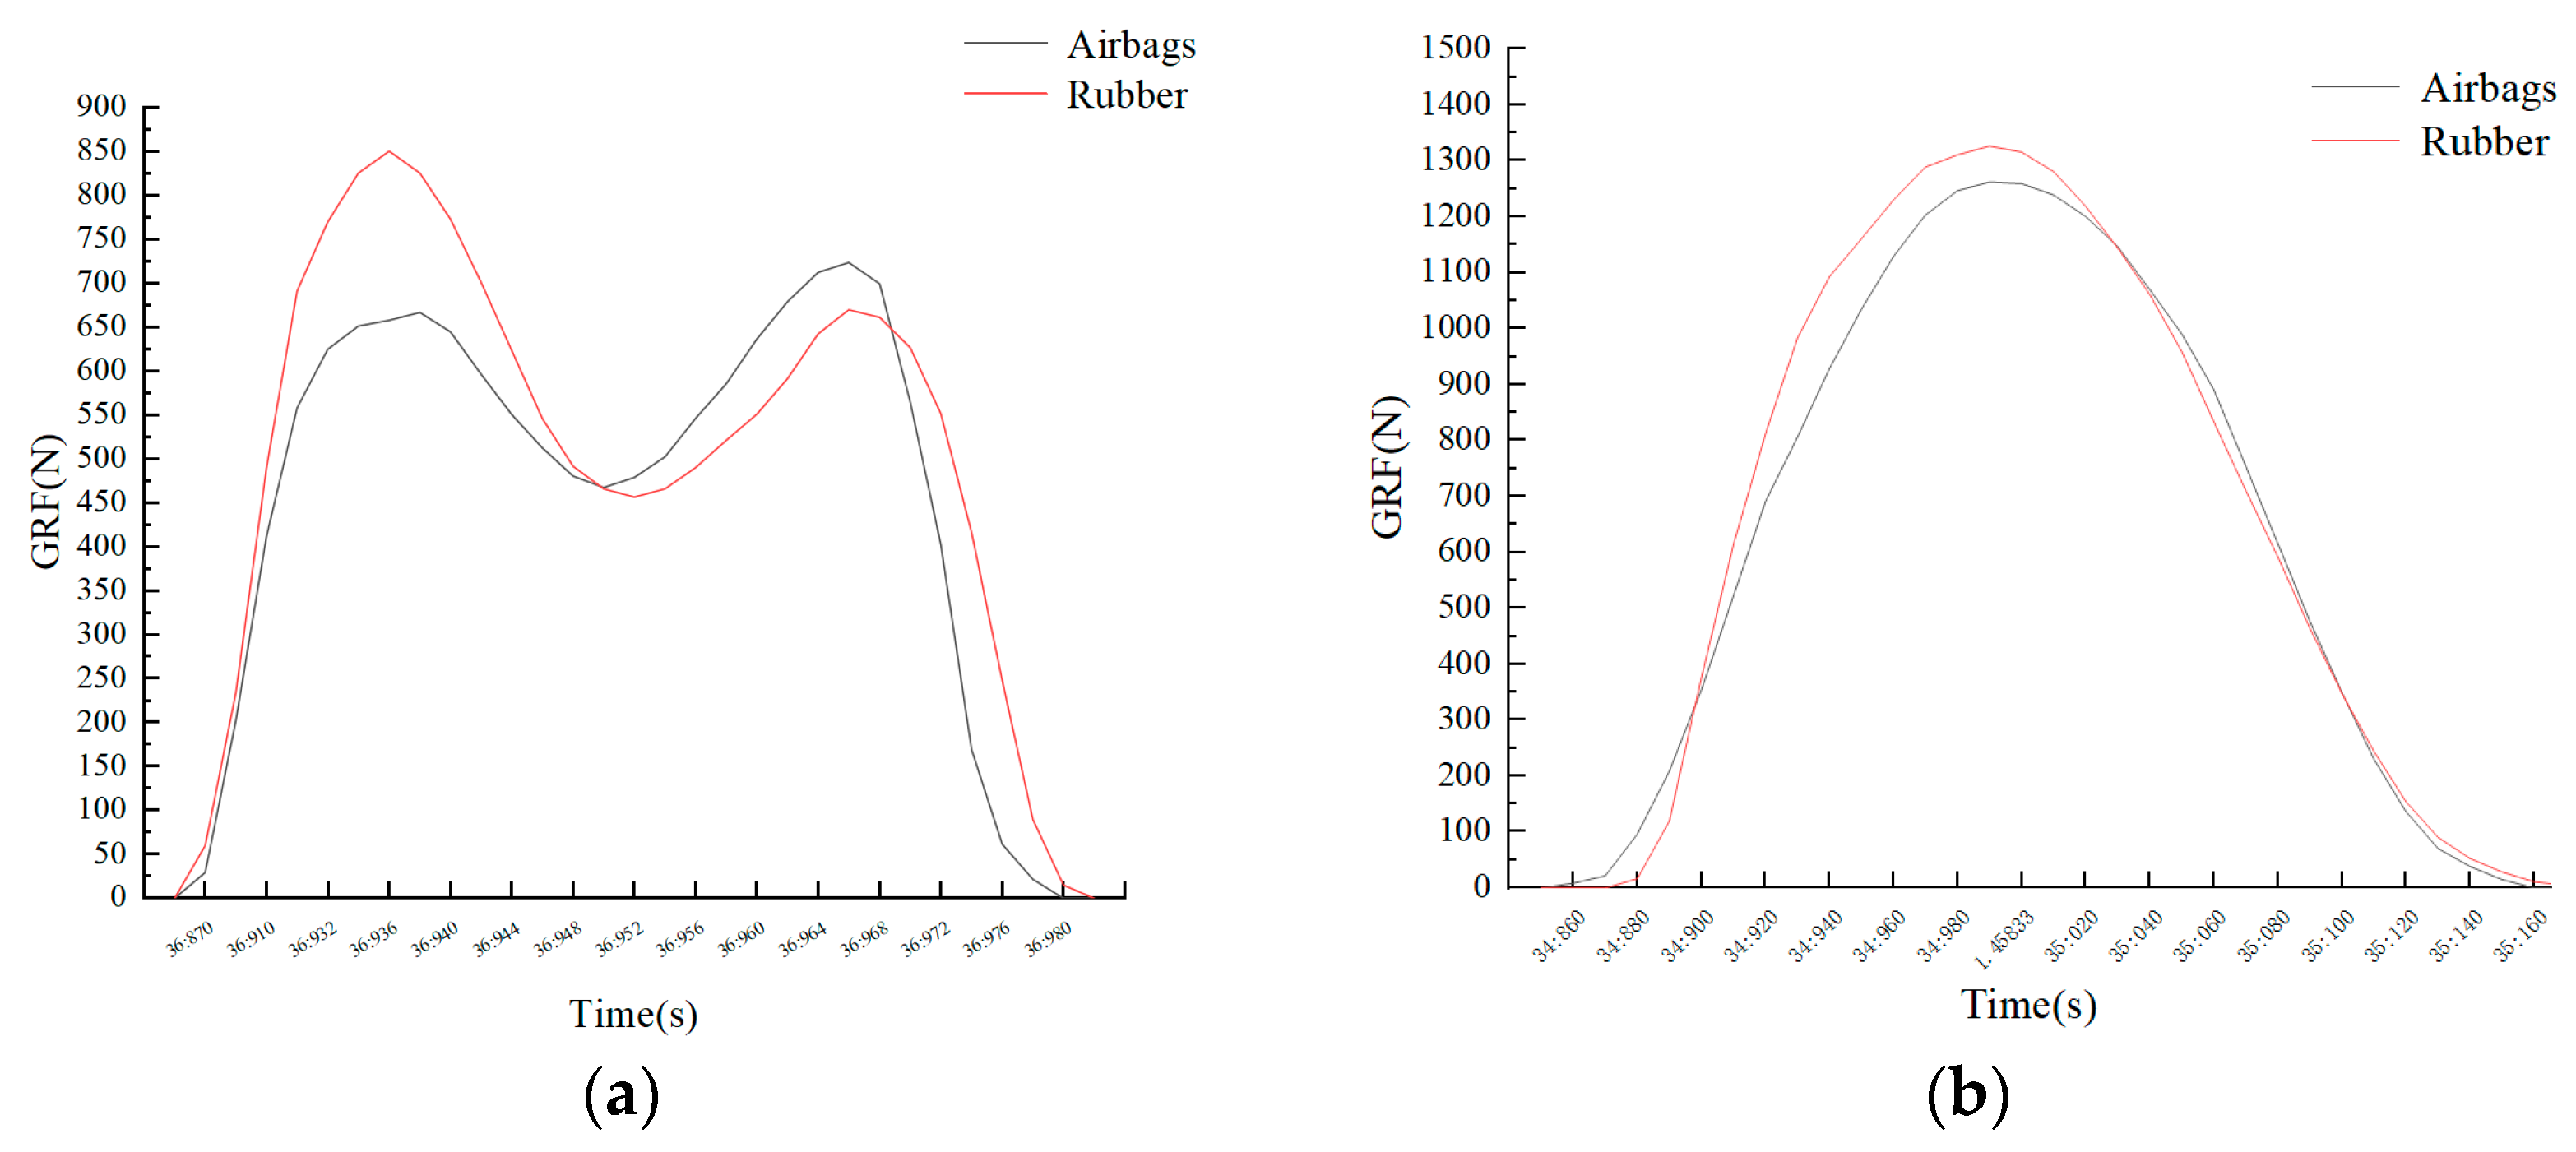
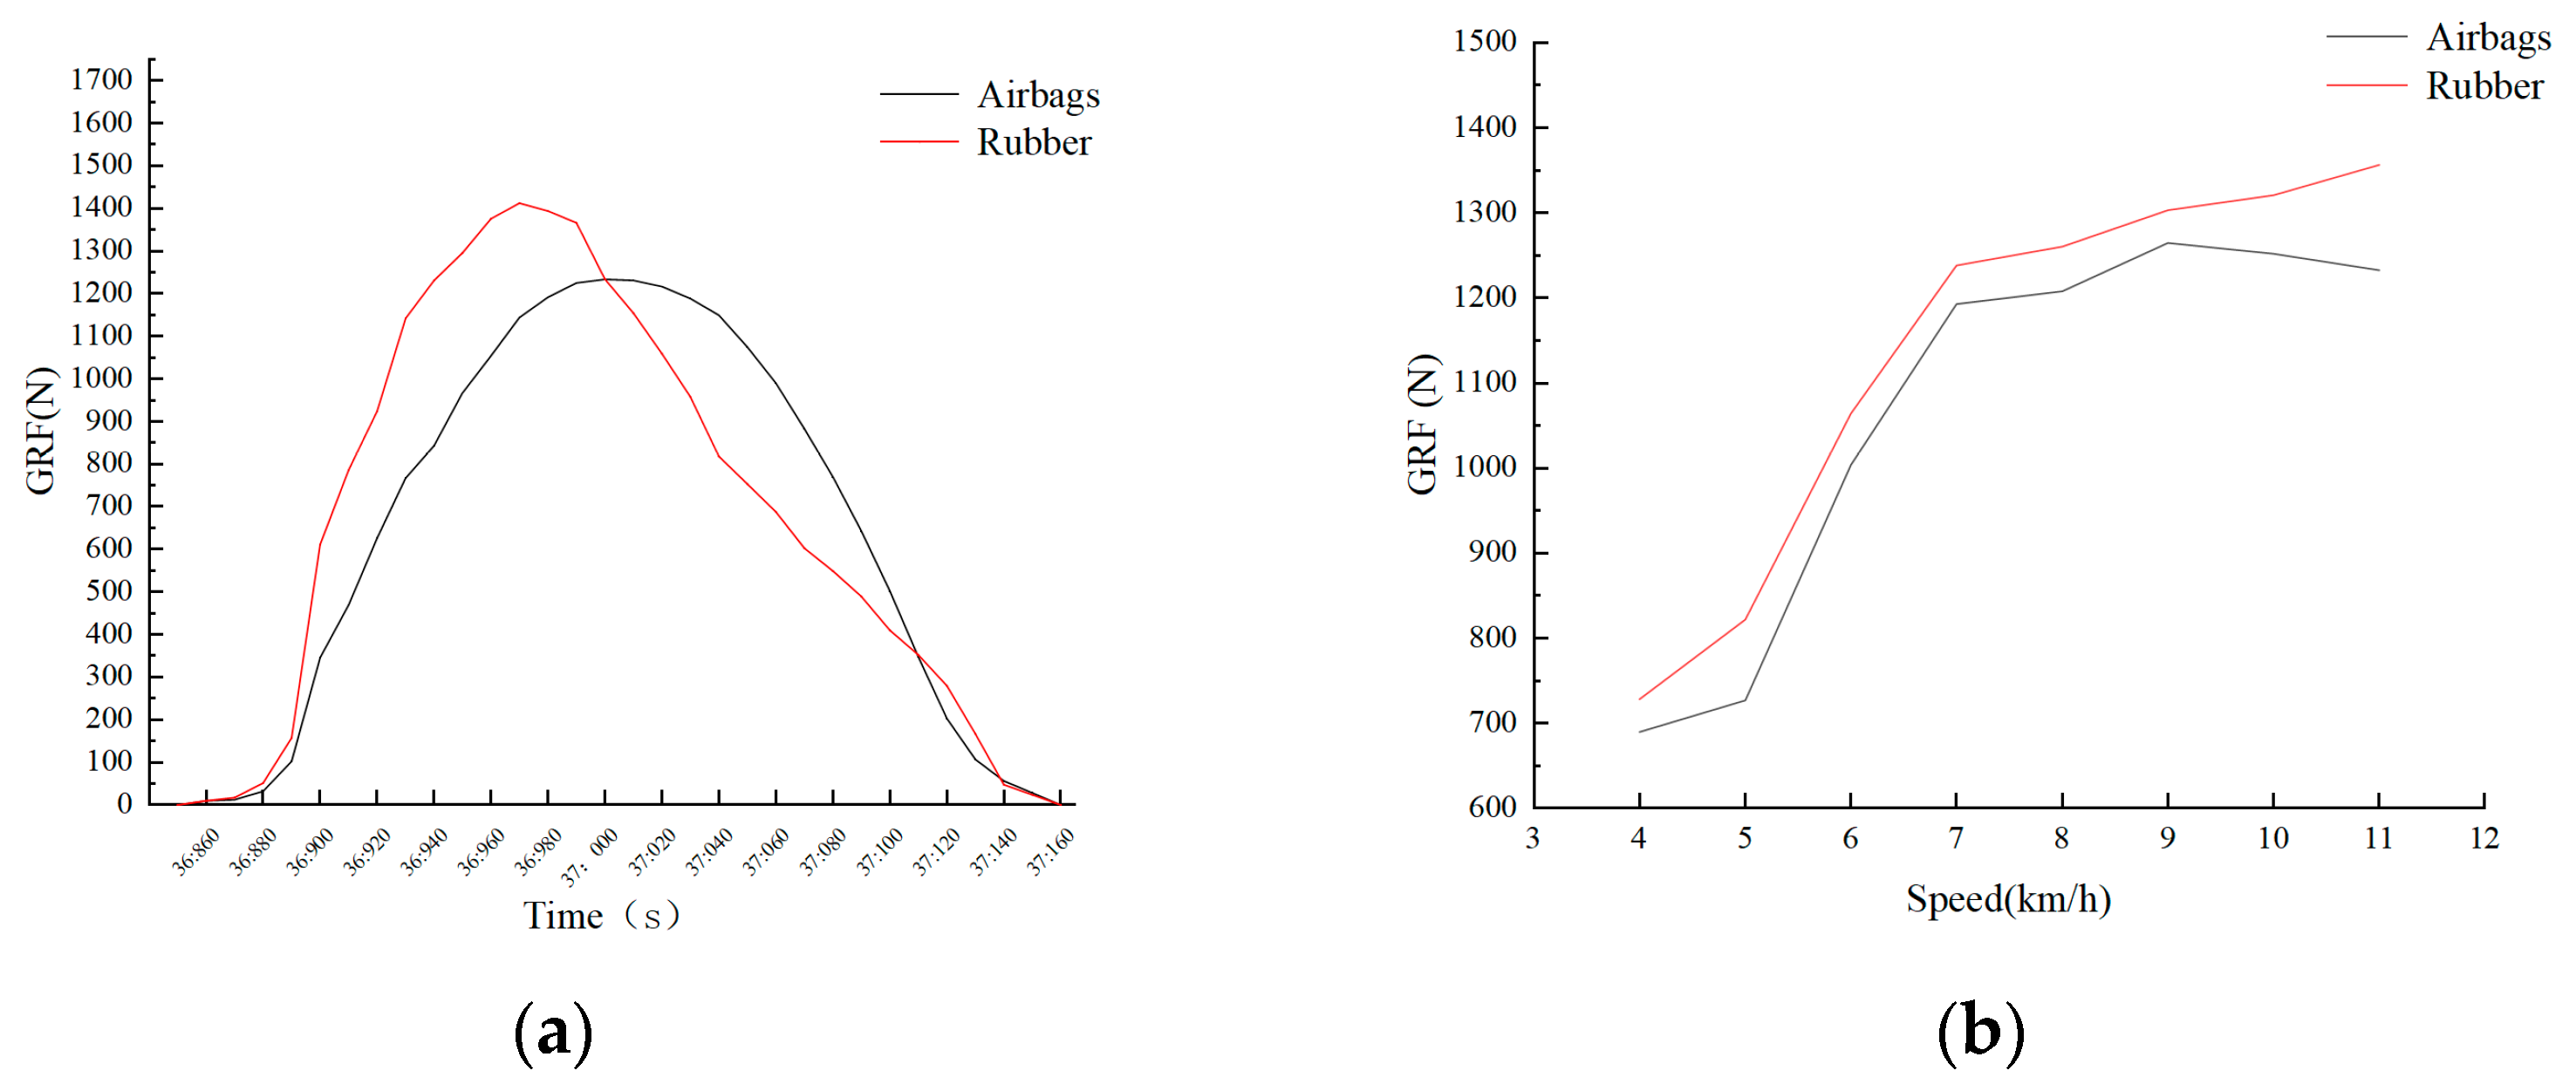
5.2. Comparison of GRF

Comparison of GRF between air-cushioned treadmills and rubber-cushioned treadmills at different speeds (Figure 6a shows the GRF data comparison for both treadmills at a speed of 5 km/h, Figure 6b at 9 km/h, and Figure 7a at 11 km/h).
Comparison of GRF data between air-cushioned treadmills and rubber-cushioned treadmills at speeds of 4 km/h to 11 km/h (Figure 7b, Table 2). Experimental data indicate that the air-cushioned treadmill with active shock absorption shows a significantly better damping effect compared to the standard rubber-cushioned treadmill, with GRF values reduced to varying degrees at all speeds, where the maximum difference in GRF is 123.8 N.

6. Conclusions

This article details the design of an active control system for treadmill shock absorption through a series of relevant mathematical models, providing an effective method to improve the shock absorption performance of standard treadmills. The treadmill designed in this study has two innovative features compared to conventional shock-absorbing treadmills: (1) The shock absorption system can be adjusted to multiple levels, allowing for more precise adjustments compared to fixed systems. (2) The reference parameter for adjustments is the ground reaction force (GRF), which helps to prevent sports injuries at the source. Additionally, the system is characterized by low cost, fast responses, good stability, and high measurement reliability. Experiments have shown that the ground reaction force (GRF) of the active shock-absorbing treadmill designed in this study is 10% lower compared to that of certain conventional shock-absorbing treadmills.
However, the actual system may exhibit nonlinear and time-varying characteristics. Future work can focus on improving the model to enhance accuracy, employing more advanced control strategies to optimize system performance, optimizing system parameters for better outcomes, using simulation tools to validate the optimized system model, considering multiple performance metrics for optimization, and enriching the dataset to cover a broader range of populations.

Author Contributions

Research on control systems, L.H.; Software, L.H.; Writing—original draft, L.H.; Writing—review & editing, X.W. (Xiancheng Wang), Z.W. and X.W. (Xueguang Wu); Supervision, X.W. (Xiancheng Wang); Project administration, X.W. (Xiancheng Wang). All authors have read and agreed to the published version of the manuscript.

Funding

This research received no external funding.

Institutional Review Board Statement

Not applicable.

Informed Consent Statement

Not applicable.

Data Availability Statement

Not applicable.

Conflicts of Interest

The authors declare no conflict of interest.

References

  1. Munro, C.F.; Miller, D.I.; Fuglevand, A.J. Ground reaction forces in running: A reexamination. J. Biomech. 1987, 20, 147–155. [Google Scholar] [CrossRef] [PubMed]
  2. Besier, T.; Lloyd, D.G.; Wilkie, J.C.; Ackland, T. External loading of the knee joint during running and cutting maneuvers. Med. Sci. Sports Exerc. 2001, 33, 1168–1175. [Google Scholar] [CrossRef] [PubMed]
  3. Fields, K.B.; Sykes, J.C.; Walker, K.M.; Jackson, J.C. Prevention of running injuries. Curr. Sports Med. Rep. 2010, 9, 176–182. [Google Scholar] [CrossRef] [PubMed]
  4. Hreljac, A. Impact and overuse injuries in runners. Med. Sci. Sports Exerc. 2004, 36, 845–849. [Google Scholar] [CrossRef] [PubMed]
  5. Winter, D. Moments of force and mechanical power in jogging. In Proceedings of the 1999 ICRA, Detroit, MI, USA, 10–15 May 1999; pp. 368–374. [Google Scholar]
  6. Colino, E.; Felipe, J.L.; Van Hooren, B.; Gallardo, L.; Meijer, K.; Lucia, A.; Lopez-Fernandez, J.; Garcia-Unanue, J. Mechanical properties of treadmill surfaces compared to other overground sport surfaces. Sensors 2020, 20, 3822. [Google Scholar] [CrossRef] [PubMed]
  7. Ricard, M.D.; Veatch, S. Effect of running speed and aerobic dance jump height on vertical ground reaction forces. J. Appl. Biomech. 1994, 10, 14–27. [Google Scholar] [CrossRef]
  8. Wank, V.; Frick, U.; Schmidtbleicher, D. Kinematics and electromyography of lower limb muscles in overground and treadmill running. Int. J. Sports Med. 1998, 19, 455–461. [Google Scholar] [CrossRef]
  9. Rodden, P.T. Treadmill with Elastomeric-Spring Mounted Deck. U.S. Patent 5,336,144, 9 August 1994. [Google Scholar]
  10. Yuegang, M.A. Shock Absorption Mechanism for Treadmill. U.S. Patent 16/360,998, 18 June 2020. [Google Scholar]
  11. Moser, G. Treadmill. U.S. Patent 15/798,373, 15 February 2018. [Google Scholar]
  12. Nigg, B.M.; Wakeling, J.M. Impact forces and muscle tuning: A new paradigm. Exerc. Sport Sci. Rev. 2001, 29, 37–41. [Google Scholar] [CrossRef]
  13. Nikooyan, A.A.; Zadpoor, A.A. An improved cost function for modeling of muscle activity during running. J. Biomech. 2011, 44, 984–987. [Google Scholar] [CrossRef]
  14. Putti, A.B.; Arnold, G.P.; Cochrane, L.; Abboud, R.J. The Pedar® in-shoe system: Repeatability and normal pressure values. Gait Posture 2007, 25, 401–405. [Google Scholar] [CrossRef]
  15. Boyd, L.; Bontrager, E.; Mulroy, S.; Perry, J. The reliability and validity of the novel Pedar system of in-shoe pressure measurement during free ambulation. Gait Posture 1997, 5, 165. [Google Scholar] [CrossRef]
  16. Bus, S.A.; Ulbrecht, J.S.; Cavanagh, P.R. Pressure relief and load redistribution by custom-made insoles in diabetic patients with neuropathy and foot deformity. Clin. Biomech. 2004, 19, 629–638. [Google Scholar] [CrossRef] [PubMed]
  17. Owings, T.M.; Apelqvist, J.; Stenström, A.; Becker, M.; Bus, S.A.; Kalpen, A.; Ulbrecht, J.S.; Cavanagh, P.R. Plantar pressures in diabetic patients with foot ulcers which have remained healed. Diabet. Med. 2009, 26, 1141–1146. [Google Scholar] [CrossRef] [PubMed]
Figure 1. (a) Human treadmill exercise. (b) Kinematic model of moving surface.
Applsci 14 09509 g001
Figure 2. Block diagram of the overall design.
Applsci 14 09509 g002
Figure 3. (a) Subject data acquisition. (b) Sole pressure test insoles and data acquisition software.
Applsci 14 09509 g003
Figure 4. (a) Plantar pressure acquisition system curve and bar display mode. (b) The PC side of the plantar pressure acquisition system displays the interface diagram.
Applsci 14 09509 g004
Figure 5. (a) Optimal pressure at 4 km/h. (b) Optimal pressure at 10 km/h.
Applsci 14 09509 g005
Figure 6. (a) GRF comparison at 5 km/h. (b) GRF comparison at a speed of 9 km/h.
Applsci 14 09509 g006
Figure 7. (a) GRF comparison at 11 km/h. (b) Two kinds of treadmill data pairs at 4 km/h–11 km/h.
Applsci 14 09509 g007
Table 1. Table of parameters for soft shoes and hard shoes.
Acabcde
Hard footwear2.0 6.0 × 10 5 1.38 2.0 × 10 4 0.751
Soft footwear2.0 6.0 × 10 5 1.38 2.0 × 10 4 0.751
Table 2. Comparisons between airbag shock absorption values and rubber shock absorption values.
Speed (km/h)4 km/h5 km/h6 km/h7 km/h8 km/h9 km/h10 km/h11 km/h
Airbag (N)689.7726.91003.71192.71207.91264.71251.91232.5
Rubber (N)728.4821.91064.11238.21260.21303.01320.51356.4
Difference (N)38.695.060.345.452.338.268.6123.8
Disclaimer/Publisher’s Note: The statements, opinions and data contained in all publications are solely those of the individual author(s) and contributor(s) and not of MDPI and/or the editor(s). MDPI and/or the editor(s) disclaim responsibility for any injury to people or property resulting from any ideas, methods, instructions or products referred to in the content.

