Featured Application
Use of ancient materials for new technologies.
Abstract
In recent decades, fabric-dyeing processes involved greener processes because, since ancient times, dyers used mordants based on metals to make the color better adhere to the textile fibers, but this is the reason for their increased pollution. To develop new strategies, attention was focused on finding the best condition for a dyeing method for natural fibers of vegetable and animal origin (cotton and wool) using an ancient natural dye known as folium. Folium was used mostly in miniature painting in an attempt to avoid the use of classical mordants and solvents. To this purpose, plasma treatment and chitosan coating were employed. Firstly, the textile fibers were analyzed through infrared spectroscopies to verify surface modifications; subsequently, the post-treatment morphological variations were observed via scanning electron microscopy. Both techniques highlighted a significant variation of the surface functional groups due to plasma treatments with He-O2 mixtures, which allowed a greater adhesion of chitosan on the fiber’s surface. Finally, the color strength of samples dyed with folium was tested through fiber optic reflectance spectroscopy, and the folium absorbance peaks were still detected after fabric washing. It is thus shown how an ancient, traditional raw matter has become relevant for developing new modern technologies.
1. Introduction
Textile industries and modern dyeing processes are highly water- and energy-consuming, and are responsible for the substantial production of polluted wastewater [1]. This is due to the use of mordants and synthetic dyes, which often contain heavy metals [2,3]. To overcome these issues, a comeback to natural dyes and dyeing methods is desirable. For these reasons, in recent years, “new” dyes of natural origin have been sought. Natural dyes have some limits in terms of availability, color palette, and stability over time [4]. Natural dyes have several advantages, as they are hypoallergenic, non-toxic, and do not depend on the petrochemical industry; furthermore, unlike dyes of synthetic origin, they produce less wastewater and are more easily disposed of [5,6]. With a view to sustainability and recycling, natural dyes can be recovered starting from waste by-products deriving from the food industry, from carpentry waste, floriculture waste, and minerals [3,4,7,8].
However, if compared to synthetic dyes, natural dyes present several problems in the dyeing stage, such as lower fiber-affinity of the dye, the need for pre-treatments of the textiles, lower color strength, and chromatic range [3,5,7].
To overcome these issues, plasma treatment and chitosan coating were chosen for this study. Plasma is ionized gas consisting of ions, electrons, photons, and other chemical species able to roughen the substrate surface without the need for any wetting process [9,10].
Furthermore, plasma modifies and functionalizes the fiber surface without altering the bulk properties; this seems to increase the dyeability and wettability of the textile, as well as color fastness [9,10,11].
Plasma based on He or a He and O2 mixture (He-O2) allows for the formation of binding sites for chitosan molecules. Chitosan is a polysaccharide which bears positive charges (e.g., NH3+) at low pH; because of this characteristic, it can be easily protonated in the presence of acids such as lactic acid, formic acid, acetic acid, malic acid, and citric acid [12,13].
Upon plasma-treatment, chitosan coatings can interact with its cationic components onto the fiber, thus increasing their affinity for anionic dyes. With the aim of finding a natural, more sustainable material, in this study, the dye known as folium was used; it is a purple dye extracted from the fruits of Chrozophora tinctoria (L.) A. Juss., a plant of the Euphorbiaceae family, common in geographic areas with mild and dry climates such as Southern Europe or Near- and Middle East Asia. The plant has been known since antiquity; Pliny the Elder, in his Naturalis historia [14], mentions it as Heliotropium tricoccum. The dye is extracted from the trilobate fruits of Chrozophora, more specifically from the external cuticles that envelope the seed [15,16], by means of simple extraction in water. The color of the external cuticle changes depending on the ripening stage; in fact, it gradually shifts from green to blue and finally to purple color. Therefore, different hues can be obtained from the fruits, even if the final stage of ripening, being the purple fruits, generate a stable color, while the other colors are not stable.
Folium was typically employed for medieval painting as a substitute for the more expensive Tyrian purple dye, and, in particular, for miniature painting; most of pen-writing artworks in 14th and 15th century manuscripts produced in Italy and France were prepared with folium-based inks. After the Renaissance, the dye lost its importance in painting art due to the availability of other more stable dyes such as the Mexican cochineal coming from the New World. Its use for dyeing textiles was not reported, however, perhaps due to its relatively low lightfastness. However, experiments of sorption on an anionic exchange phase evidenced that folium, whose structure is only partially elucidated, indeed behaves like an anion. Therefore, it could be fixed on a textile through its interaction with a chitosan coating, as cited before.
The main aim of this study was to develop a green dyeing method capable of affording high color strength values (K/S) involving an ancient material, the natural dye folium specifically, which was historically employed in different scenarios. The first step was to characterize all of the raw and treated materials using IR spectroscopy to verify the fiber’s surface functionalization produced using plasma treatment and the chitosan coating. More specifically, the surface modification involved amino groups, carboxylic groups, hydroxyl groups, and disulfide bridges, as well as the introduction of new functional groups upon chitosan coating. Subsequently, the differences were evaluated via scanning electron microscopy (SEM) and finally the best condition among those tested of the process parameters was evaluated by means of UV–visible diffuse reflectance spectrophotometry with optic fibers (FORS) in order to obtain the best result in terms of color fastness.
2. Materials and Methods
2.1. Materials
For the Egyptian raw cotton (0.150 g/cm2) and raw wool (0.275 g/cm2) samples, all of the samples were cut to obtain a 2 × 2 cm in size, supplied by Environment Park (Turin, Italy).
Chitosan (CAS 9012-76-4) and glacial acetic acid (99.7%) were purchased from Sigma-Aldrich (Milwaukee, WI, USA).
2.2. Natural Dye Extraction
Ripe Chrozophora tinctoria berries (27.022 g) were infused in Milli-Q (Merck Life Science, Milan, Italy) water (500 mL) for 4 h at room temperature, with constant magnetic stirring. The solution was filtered, and the solvent was evaporated to afford the dye. The deep purple product is quite viscous, probably because of its content of glycosides.
2.3. Plasma Treatments
Two different plasma treatment were used on the fibers: the first treatment was carried out using cold plasma at atmospheric pressure based on 100% helium, and the second in the same pressure condition using a mixture of He-O2 with a ratio of 10:2 (20%)
In both cases, the nominal power was 1650 W, which decreased to an effective power of 1000 W and with exposure times that was changed in 1, 2, and 5 min, in order to evaluate the more efficient condition.
2.4. Chitosan Coatings
The plasma-treated samples were immediately immersed in three different chitosan mixtures. The first mixture of 3.75 g/L (w/v) of chitosan in distilled water was prepared using 2% (v/v) glacial acetic acid to help the dissolution. The mixture was stirred overnight at room temperature. The second mixture consisted of 5.0 g/L (w/v) chitosan, while the third mixture contained 10.0 g/L (w/v).
2.5. Dyeing Method and Washings
After the characterization of the fibers and the extracted dyes, the dyeing methods adopted for each sample were similar. The dyeing solutions were prepared by mixing the dye with Milli-Q water, while the textile samples were cut into 2 × 2 cm squares. All of the samples were immersed in 1:10 (textile weight:solution weight) dye bath; for all of the samples, 100% by weight of the dye was used in order to operate under optimal conditions.
The best condition of the dyeing process, among those tested, is reported in Table 1.

Table 1.
Experimental parameters.
Each dyed sample was washed to check the color fastness and stability. Each sample was first washed with Milli-Q water to remove any excess dye. The materials were then immersed in a soapy solution consisting of Marseille soap (2.0 g/L) and Na2CO3 (2.5 g) with a ratio of 1:100 g/g of sample with respect to the solution weight, the temperature was maintained at 40 °C and the procedure time was fixed to one hour; after that, the samples were rinsed with Milli-Q water.
2.6. Analytical Techniques
2.6.1. Scanning Electron Microscopy (SEM)
SEM images at different magnifications were recorded using a Quanta 200 Philips Scanning Electron Microscope (FEI company, Hillsboro, OR, USA) equipped with an EDAX energy dispersive spectroscopy (EDS, EDAX, Mahwah, NJ, USA) attachment. The electron source was a tungsten filament operating at 25 keV. The analyses were performed in a low-vacuum condition (90 Pa) to obtain an electrical conduction on the surface and prevent sample charging.
2.6.2. Micro-IR Spectroscopy (Micro-IR)
Micro-IR characterizations were carried out by means of a Thermo Fisher Scientific (Waltham, MA, USA) Nicolet iN10 spectroscope, considering the spectral range 4000–950 cm−1, with 128 scans and a spectral resolution of 8 cm−1, a collecting square spot of 100 × 100 μm, working in reflectance mode; Norton–Beer function was the applied apodization function.
2.6.3. UV–Visible Diffuse Reflectance Spectrophotometry with Optic Fibers (FORS)
The FORS technique was employed to quantitatively evaluate the color fastness onto the textiles; the analysis was performed with an Avantes (Apeldoorn, The Netherlands) AvaSpec-ULS2048XLUSB2 model spectrophotometer and an AvaLightHAL-S-IND tungsten halogen light source; the detector and light source were connected with fiber optic cables to a 1.5 mm diameter FCR-7UV200-2-1,5 × 100 probe. Incident and detecting angles were 45° from the surface normal, to exclude specular reflectance. The spectral range of the detector was 350–1100 nm. The best spectra resolution of the system, calculated as FWHM, was 2.4 nm. Diffuse reflectance spectra of the samples were referenced against the WS-2 reference tile, guaranteed to be reflective at 98% or more in the spectral range investigated. The investigated area on the sample was 1 mm in diameter. In all the measurements, the distance between probe and sample was 1 mm. To visualize the investigated area on the sample, the probe contained a USB endoscope. The instrumental parameters were set as follows, 10 ms integration time, 100 scans, for a total acquisition time of 1 s for each spectrum. The system was managed by means of AvaSoftTM 8 software running on Windows 7TM. Three replicated FORS spectra were taken for each point of measurement; the spectra shown are the average of the three replicates. The precision was >5% on the reflectance % values. The uncertainty on the spectral features was ±3 nm.
3. Results
The textile samples of raw cotton (RC), cotton (C), raw wool (RW), and wool (W), dyeing process time (infusion time), temperature, and their respective plasma treatment and chitosan concentration are summed up in Table 2. They were dyed using folium. The materials were characterized before and after the dyeing process.
Table 2.
Dyed conditions (infusion time and temperature) for raw cotton (RC), cotton (C), raw wool (RW), and wool (W) samples treated with He or He+O2 plasma and chitosan concentration (g/L).
3.1. SEM Analysis
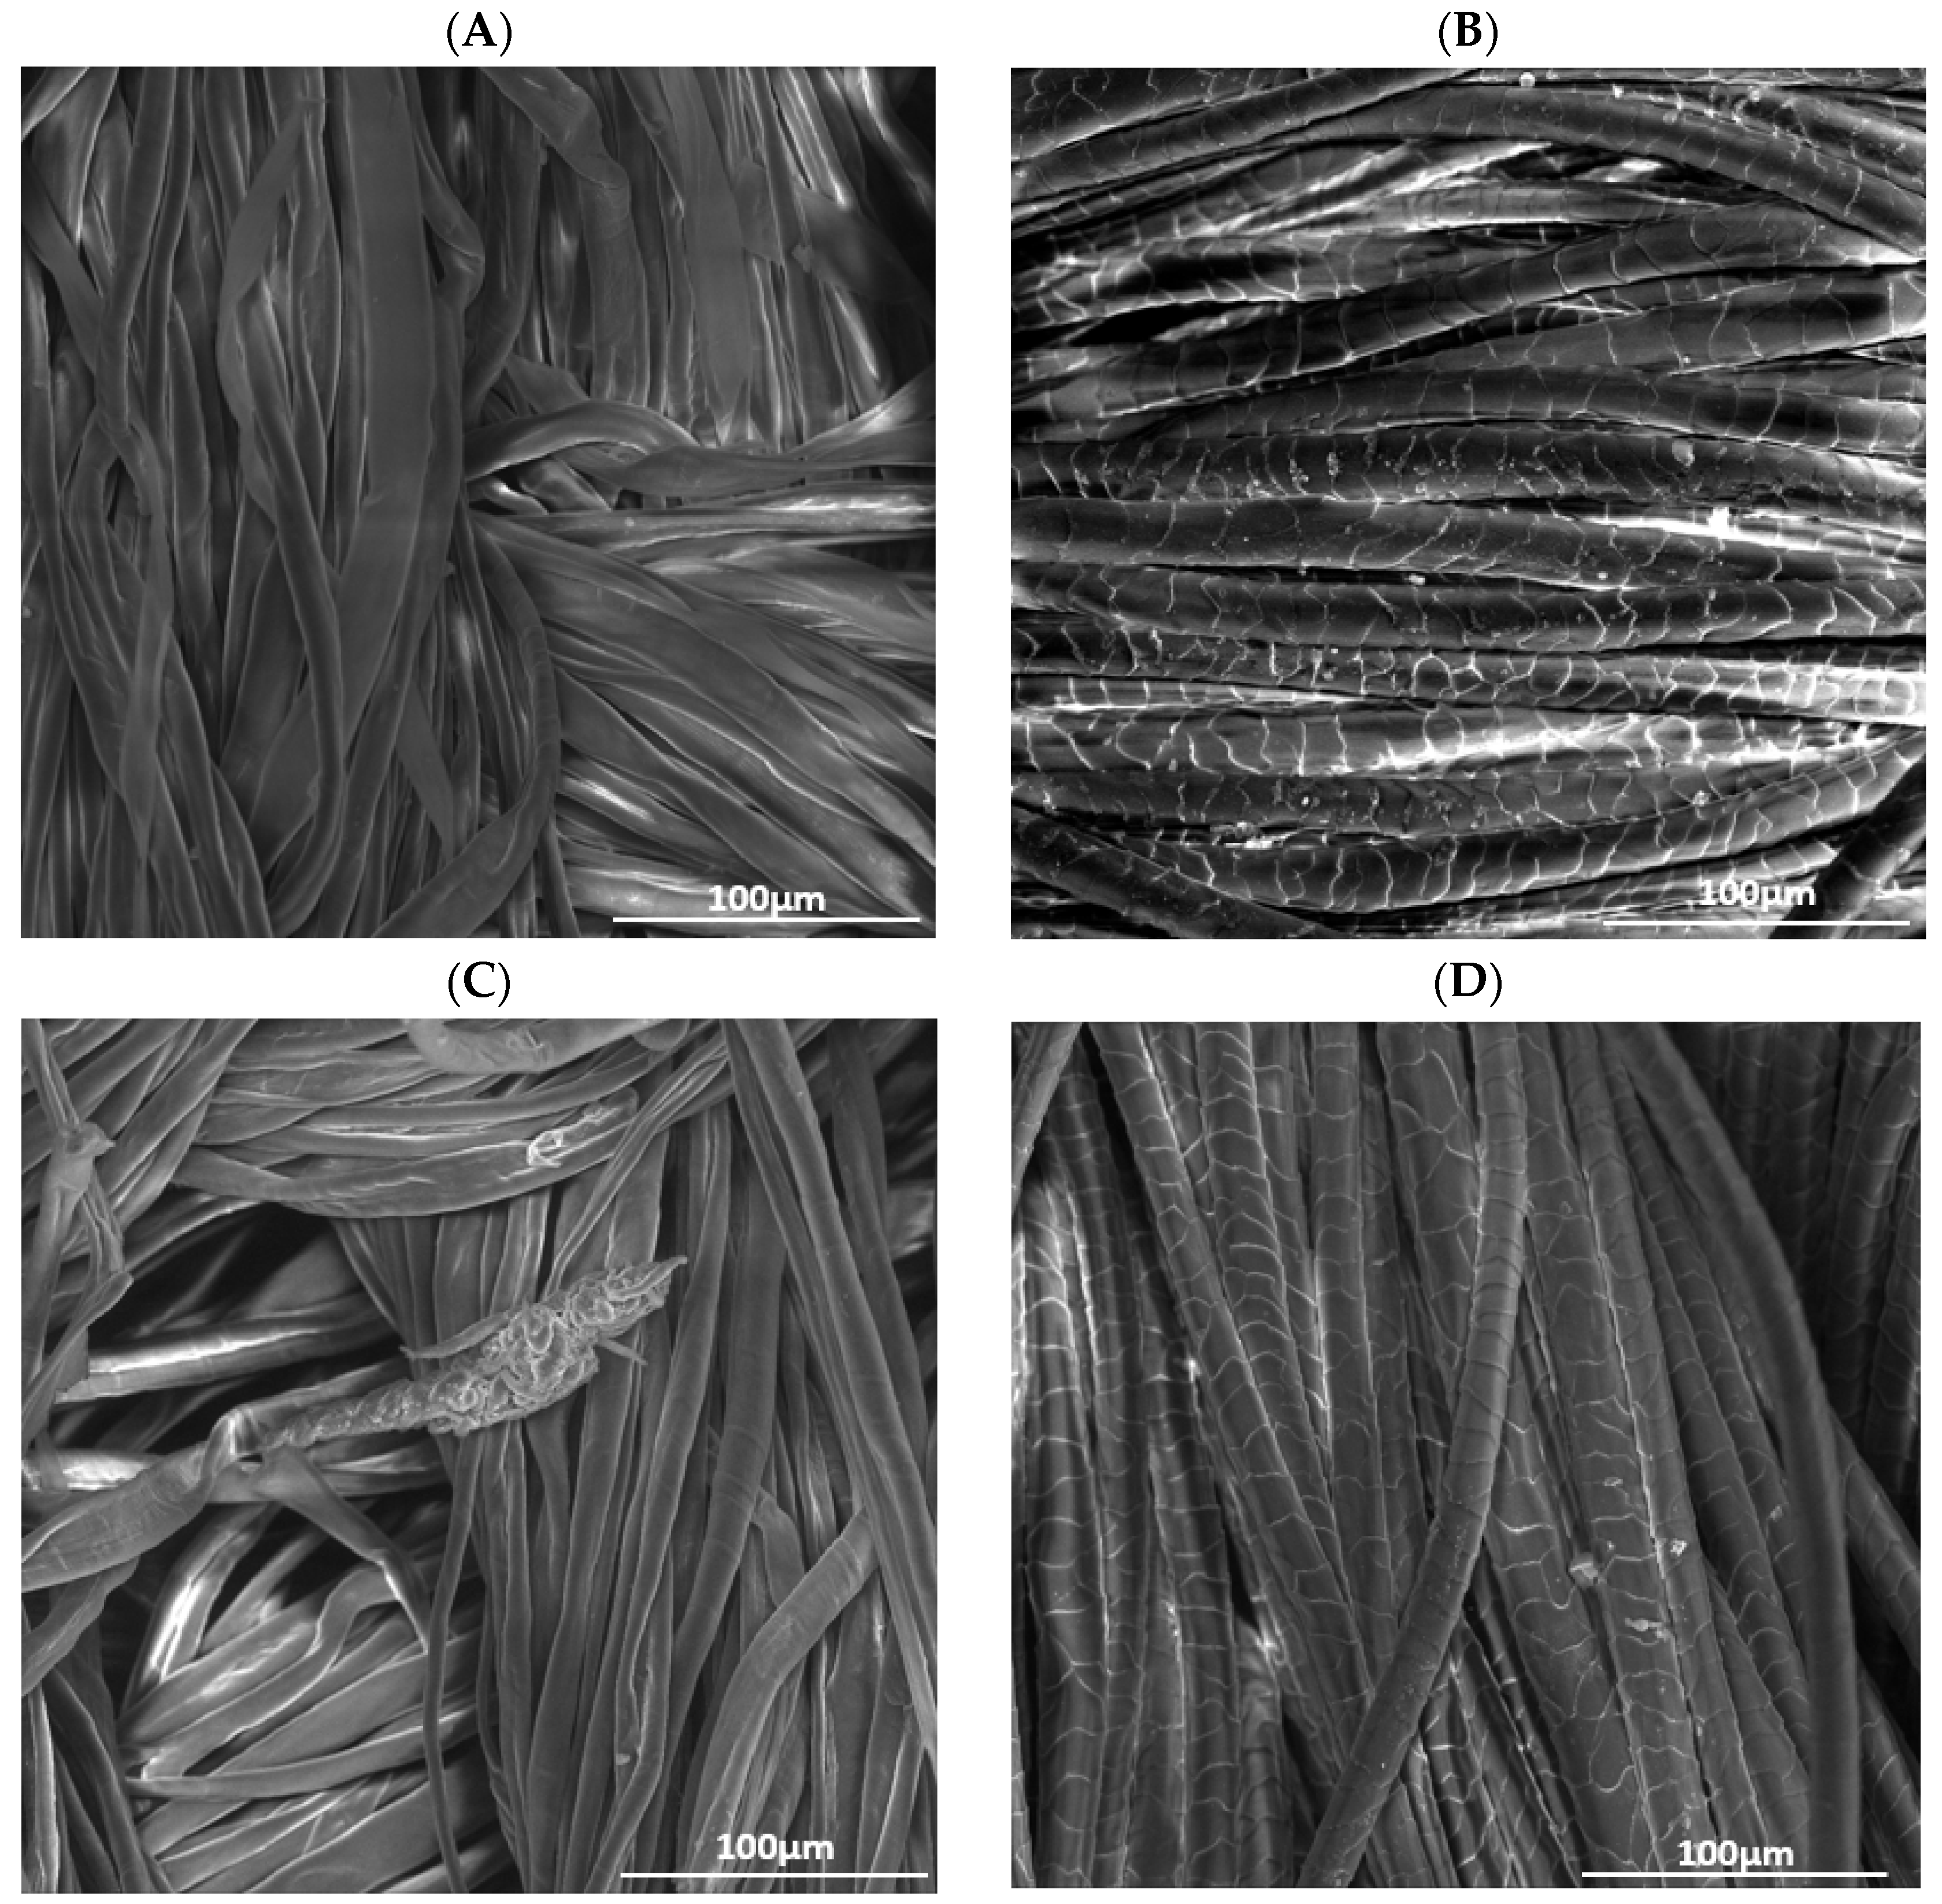
Figure 1 displays the surface topography of raw cotton and raw wool, compared to the samples that were treated with plasma and chitosan under optimal experimental conditions.

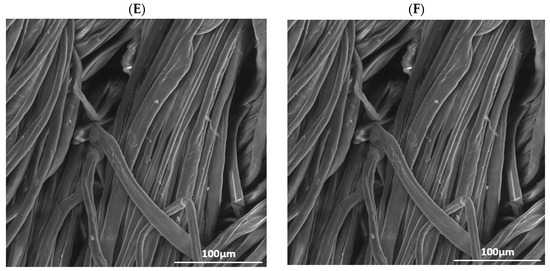
Figure 1.
SEM images of (A) raw cotton, (B) raw wool, (C) cotton treated with He plasma and chitosan 10 g/L, (D) wool treated with He plasma and chitosan 10 g/L, (E) cotton treated with He-O2 plasma and chitosan 10 g/L, (F) wool treated with He-O2 plasma and chitosan 10 g/L.
Raw cotton presents a smoother and more even surface, where the single fibers are very visible, compared to He-O2 treated cotton, whose fibers seem rougher and looser. The change in texture is caused by the bombardment of the material with high-energy particles. Together with other factors, a rougher surface facilitates the binding of dye molecules [17,18].
Figure 1B,D,F demonstrates that the scales on the wool fibers are flat and distinct; therefore, the apparent roughness of the surface is due to the overlapping of these scales. The position and motion of these scales during washing is responsible for the shrinking and felting of textile fibers. Figure 1B shows the chitosan deposit, as well as the petal-like opening of the fibers, which implies higher roughness, especially after He-plasma treatment.
3.2. Infrared Spectroscopic Analyses
The use of FTIR spectroscopy was used in this work to understand the surface modification after He and He-O2 plasma treatments. Surface modification can cause a different capacity of interaction between the tissue surface and chitosan molecules.
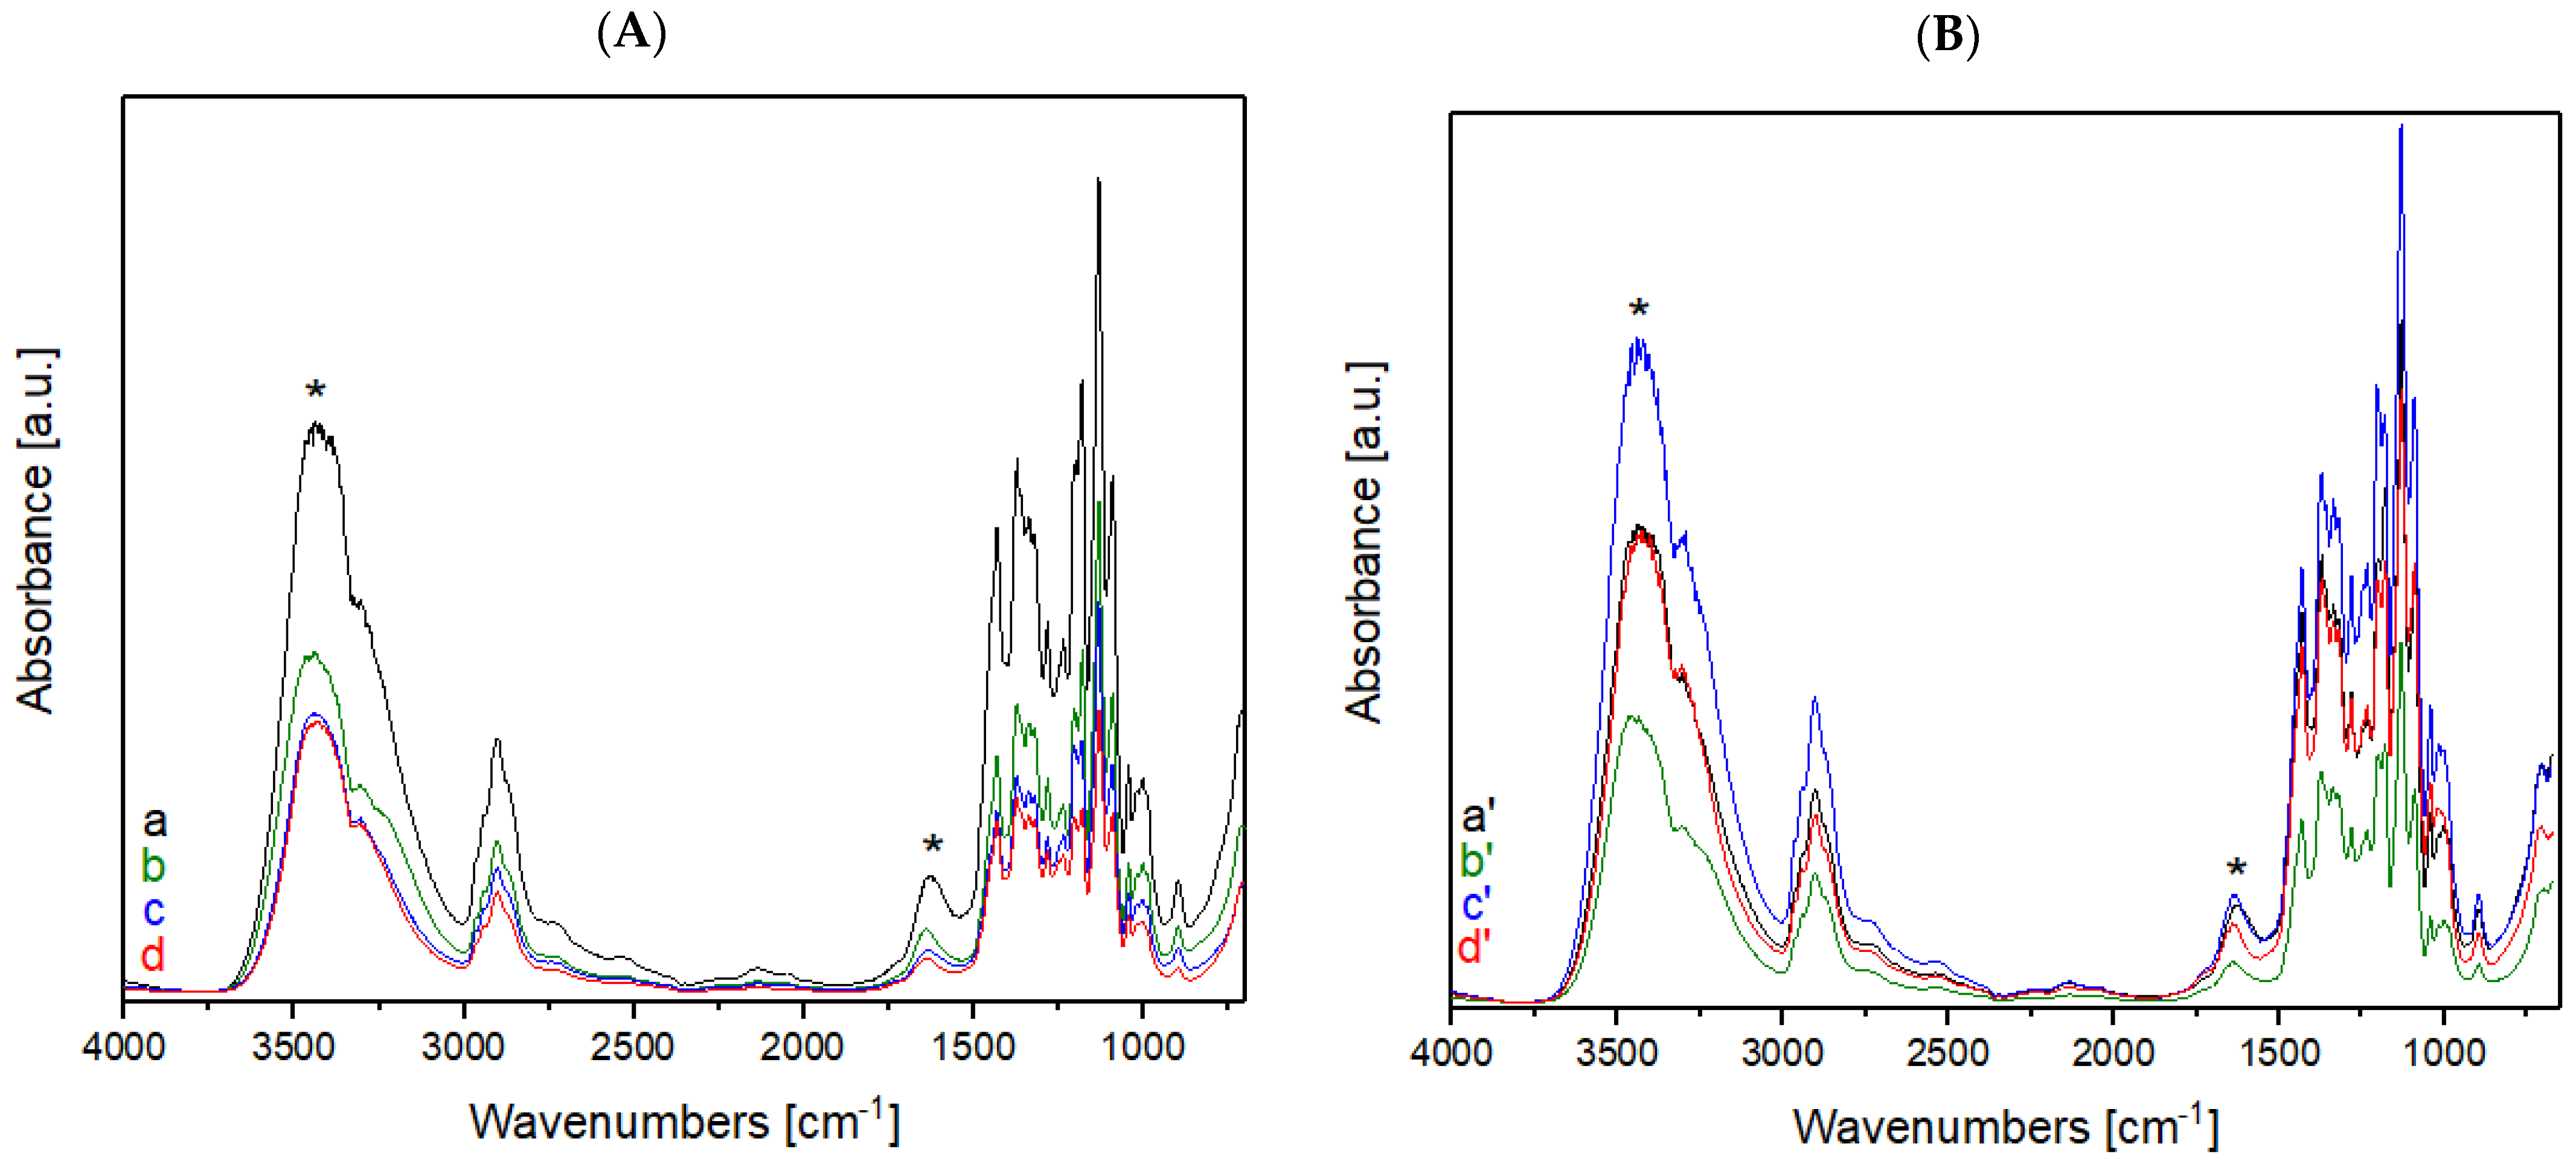
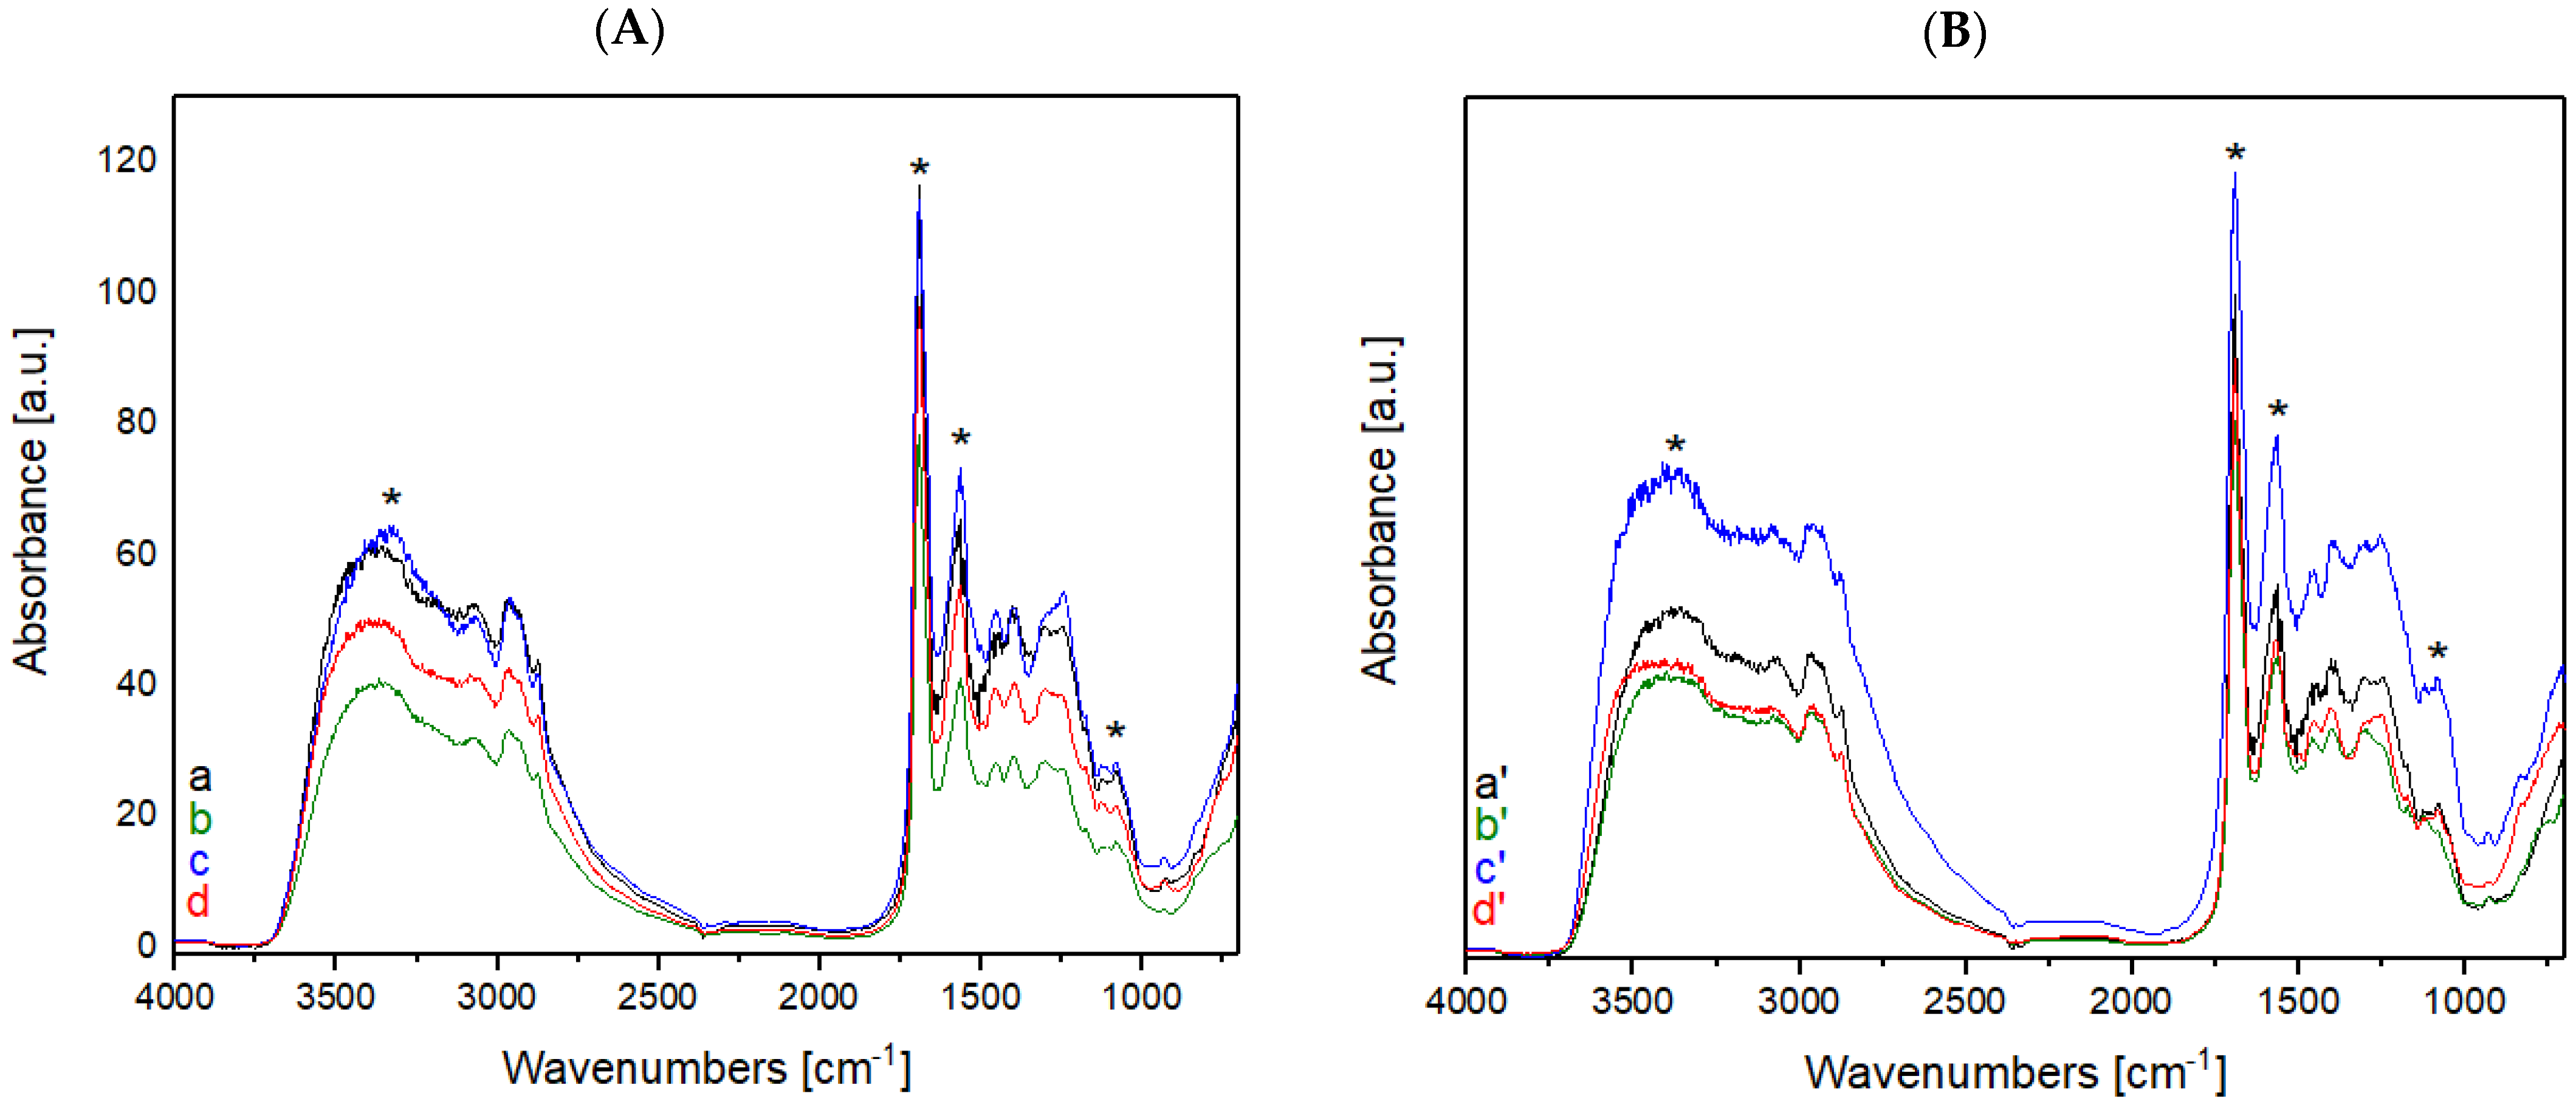
The IR spectra for raw cotton and cotton treated with He-plasma are shown in Figure 2A; while the spectra for the materials treated with, He-O2 plasma are reported in Figure 2B. Both figures also display the data recorded for plasma treatments lasting 1, 2, and 5 min. The length of plasma treatments was increased to study how the materials’ surfaces were affected by increasingly longer exposure times.
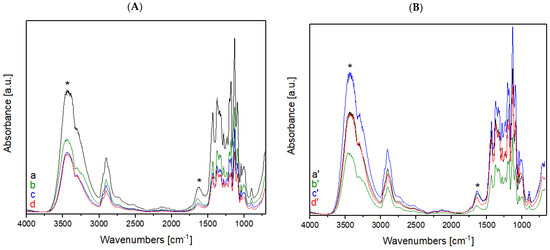
Figure 2.
(A) FT-IR spectra of raw cotton treated with He plasma at different times: (a) untreated, (b) treated for 1 min, (c) 2 min, and (d) 5 min; (B) FT-IR spectra of raw cotton treated with a mixture of He-O2 plasma at different times: (a′) untreated, (b′) treated for 1 min, (c′) 2 min, and (d′) 5 min. Asterisks mark the bands of cotton that are subjected to changes after plasma treatment.
The assignment of the peaks present in the FT-IR spectra of raw cotton and raw wool are noted in the literature and were used for evaluating the structure of the textile fibers used [12,13,17,19,20,21].
As it can be evinced from the spectra, the changes in absorbance intensity occur on the bands corresponding to O2-containing functional groups, such as hydroxyl and carboxylic groups, for either plasma treatment type.
Both plasma treatments cause the pyran rings to break and form radicals, which in turn convert to aldehyde, carboxylic, and ester groups, together with the functional groups that are already present.
The starting hypothesis is that the percentage of O2 increases after the He-O2 plasma treatment; therefore, the intensity of the -OH and -C=O bands should also increase.
This phenomenon can be observed in the spectral range around 1700 cm−1, the frequency corresponding to -C=O absorption, and it is even more evident for the sample that was treated for 2 min.
On the other hand, the peak intensities for the samples that were treated for 5 min are not altered. The intensity of this peak increases equally for the samples treated with He only, for 2 and 5 min.
The intensity of the peak lying between 3300 and 3400 cm−1 (corresponding to the -OH groups) is also found to increase more significantly for the 2 min sample, compared to the 5 min one. This demonstrates that the optimal plasma treatment time is 2 min; a longer time does not produce the desired outcome, that is, an increase in the amount of surface bonds of -OH. This observation is valid for both types of plasma treatments.
A similar behavior was observed for the asymmetrical stretching of -CH bonds at 2922 cm−1.
The increase in the number of hydrophilic groups containing oxygen bonds to the surface of the textile, due to plasma treatment, results in more hydrophilic cotton samples which therefore display better wettability.
The same analyses were performed for raw wool and wool samples treated with He (Figure 3A) and He-O2 plasma (Figure 3B).
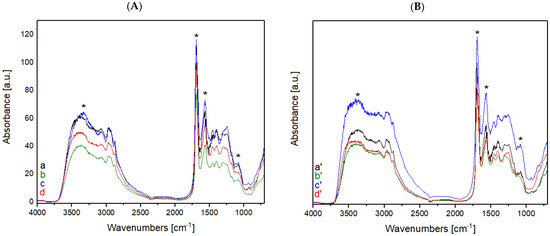
Figure 3.
(A) FT-IR spectra of raw wool treated with He plasma at different times: (a) untreated, (b) treated for 1 min, (c) 2 min, and (d) 5 min; (B) FT-IR spectra of raw wool treated with a mixture of He-O2 plasma at different times: (a′) untreated, (b′) treated for 1 min, (c′) 2 min, and (d′) 5 min. Asterisks mark the bands of wool that are subjected to changes after plasma treatment.
Comparing the FT-IR spectra of the raw wool samples before and after He plasma treatment (Figure 3A), the treatment did not lead to an increase in hydrophilic groups on the surface of the samples; on the contrary, the intensity of the peaks present in the rage of high frequency (between 4000 and 2750 cm−1) show a decrease in signal intensity. In opposition to the He plasma treatment, He-O2 plasma treatment cause a variation in the intensity of peaks present in the high frequency region (between 4000 and 2750 cm−1); these data confirm an increase in hydrophilic groups (e.g., hydroxyl groups, amide groups, and carboxyl groups) on the sample’s surface. The treatment of wool with He-O2 plasma causes the disulphide bridges to break and oxidize, with the subsequent formation of sulfur groups containing oxygen, which are responsible for the absorbance band between 1040 and 1060 cm−1 [13]. The presence of these new functional groups can provide a binding site for dye molecules; their presence also makes the fiber less soft.
3.3. Evaluation of Color Fastness Through Fiber Optics Reflectance Spectroscopy (FORS)
One of the best ways to evaluate color strength on the fibers is using fiber optic reflectance spectroscopy (FORS) and, in particular, the K/S ratio. An increase in K/S leads to an increase in absorption of the dye [22,23,24,25].
The color fastness could also be evaluated in samples treated with chitosan by comparing the spectrum of dyed fibers with that of pure folium.
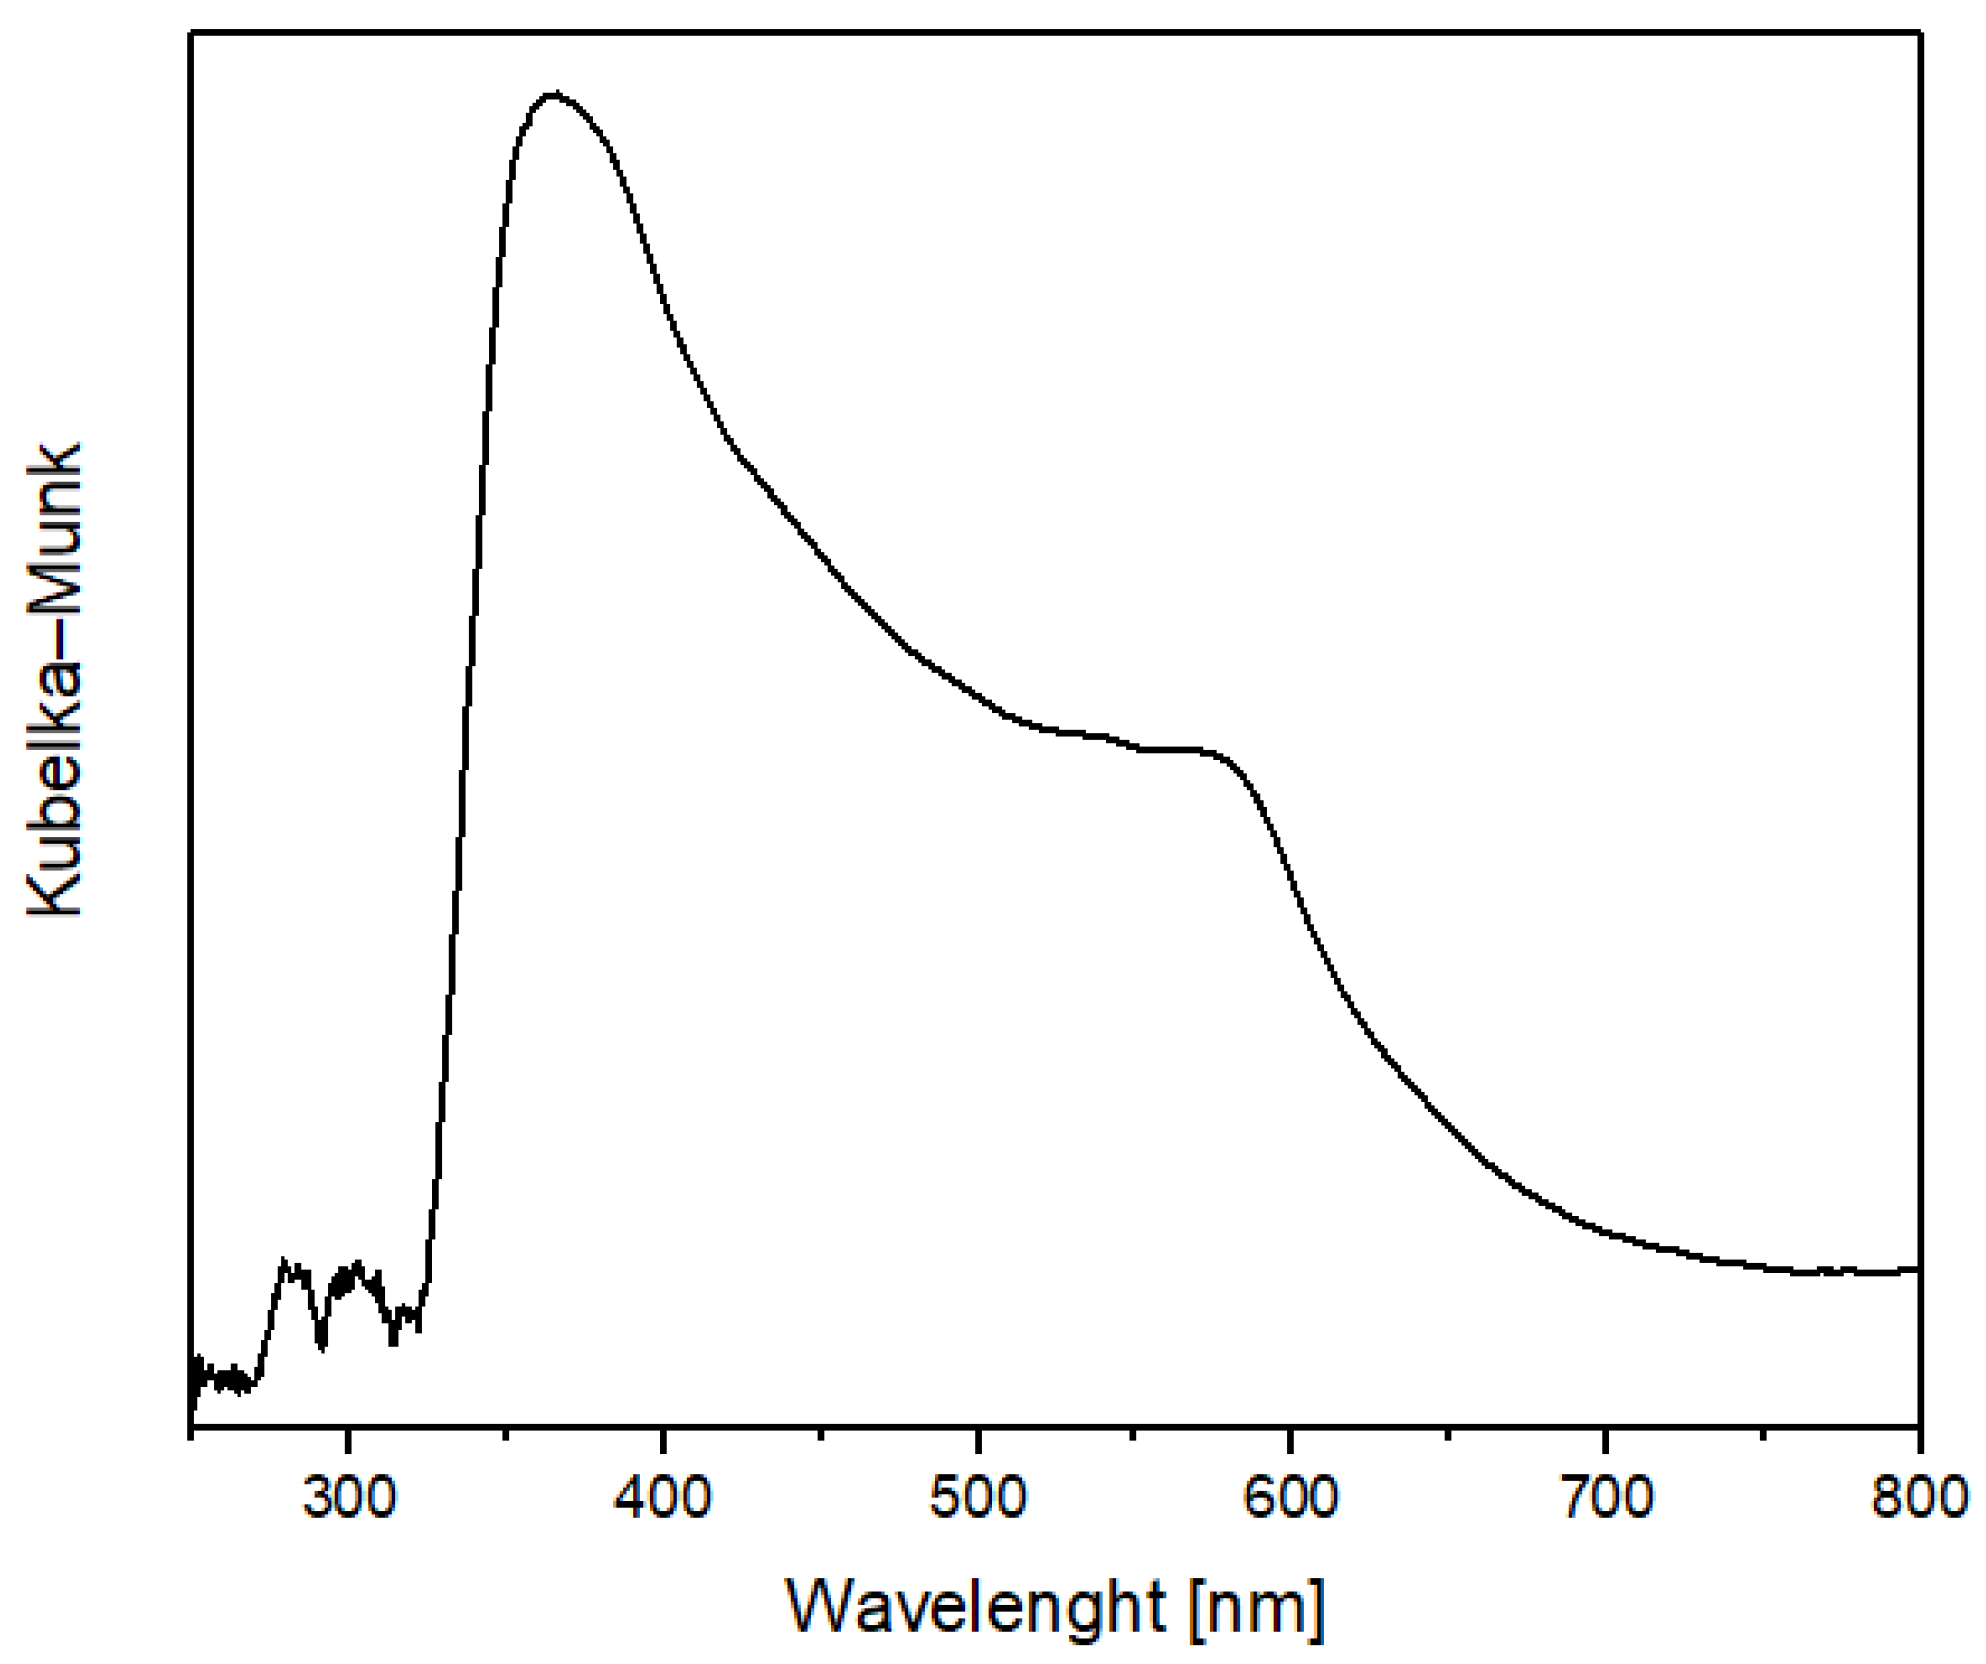
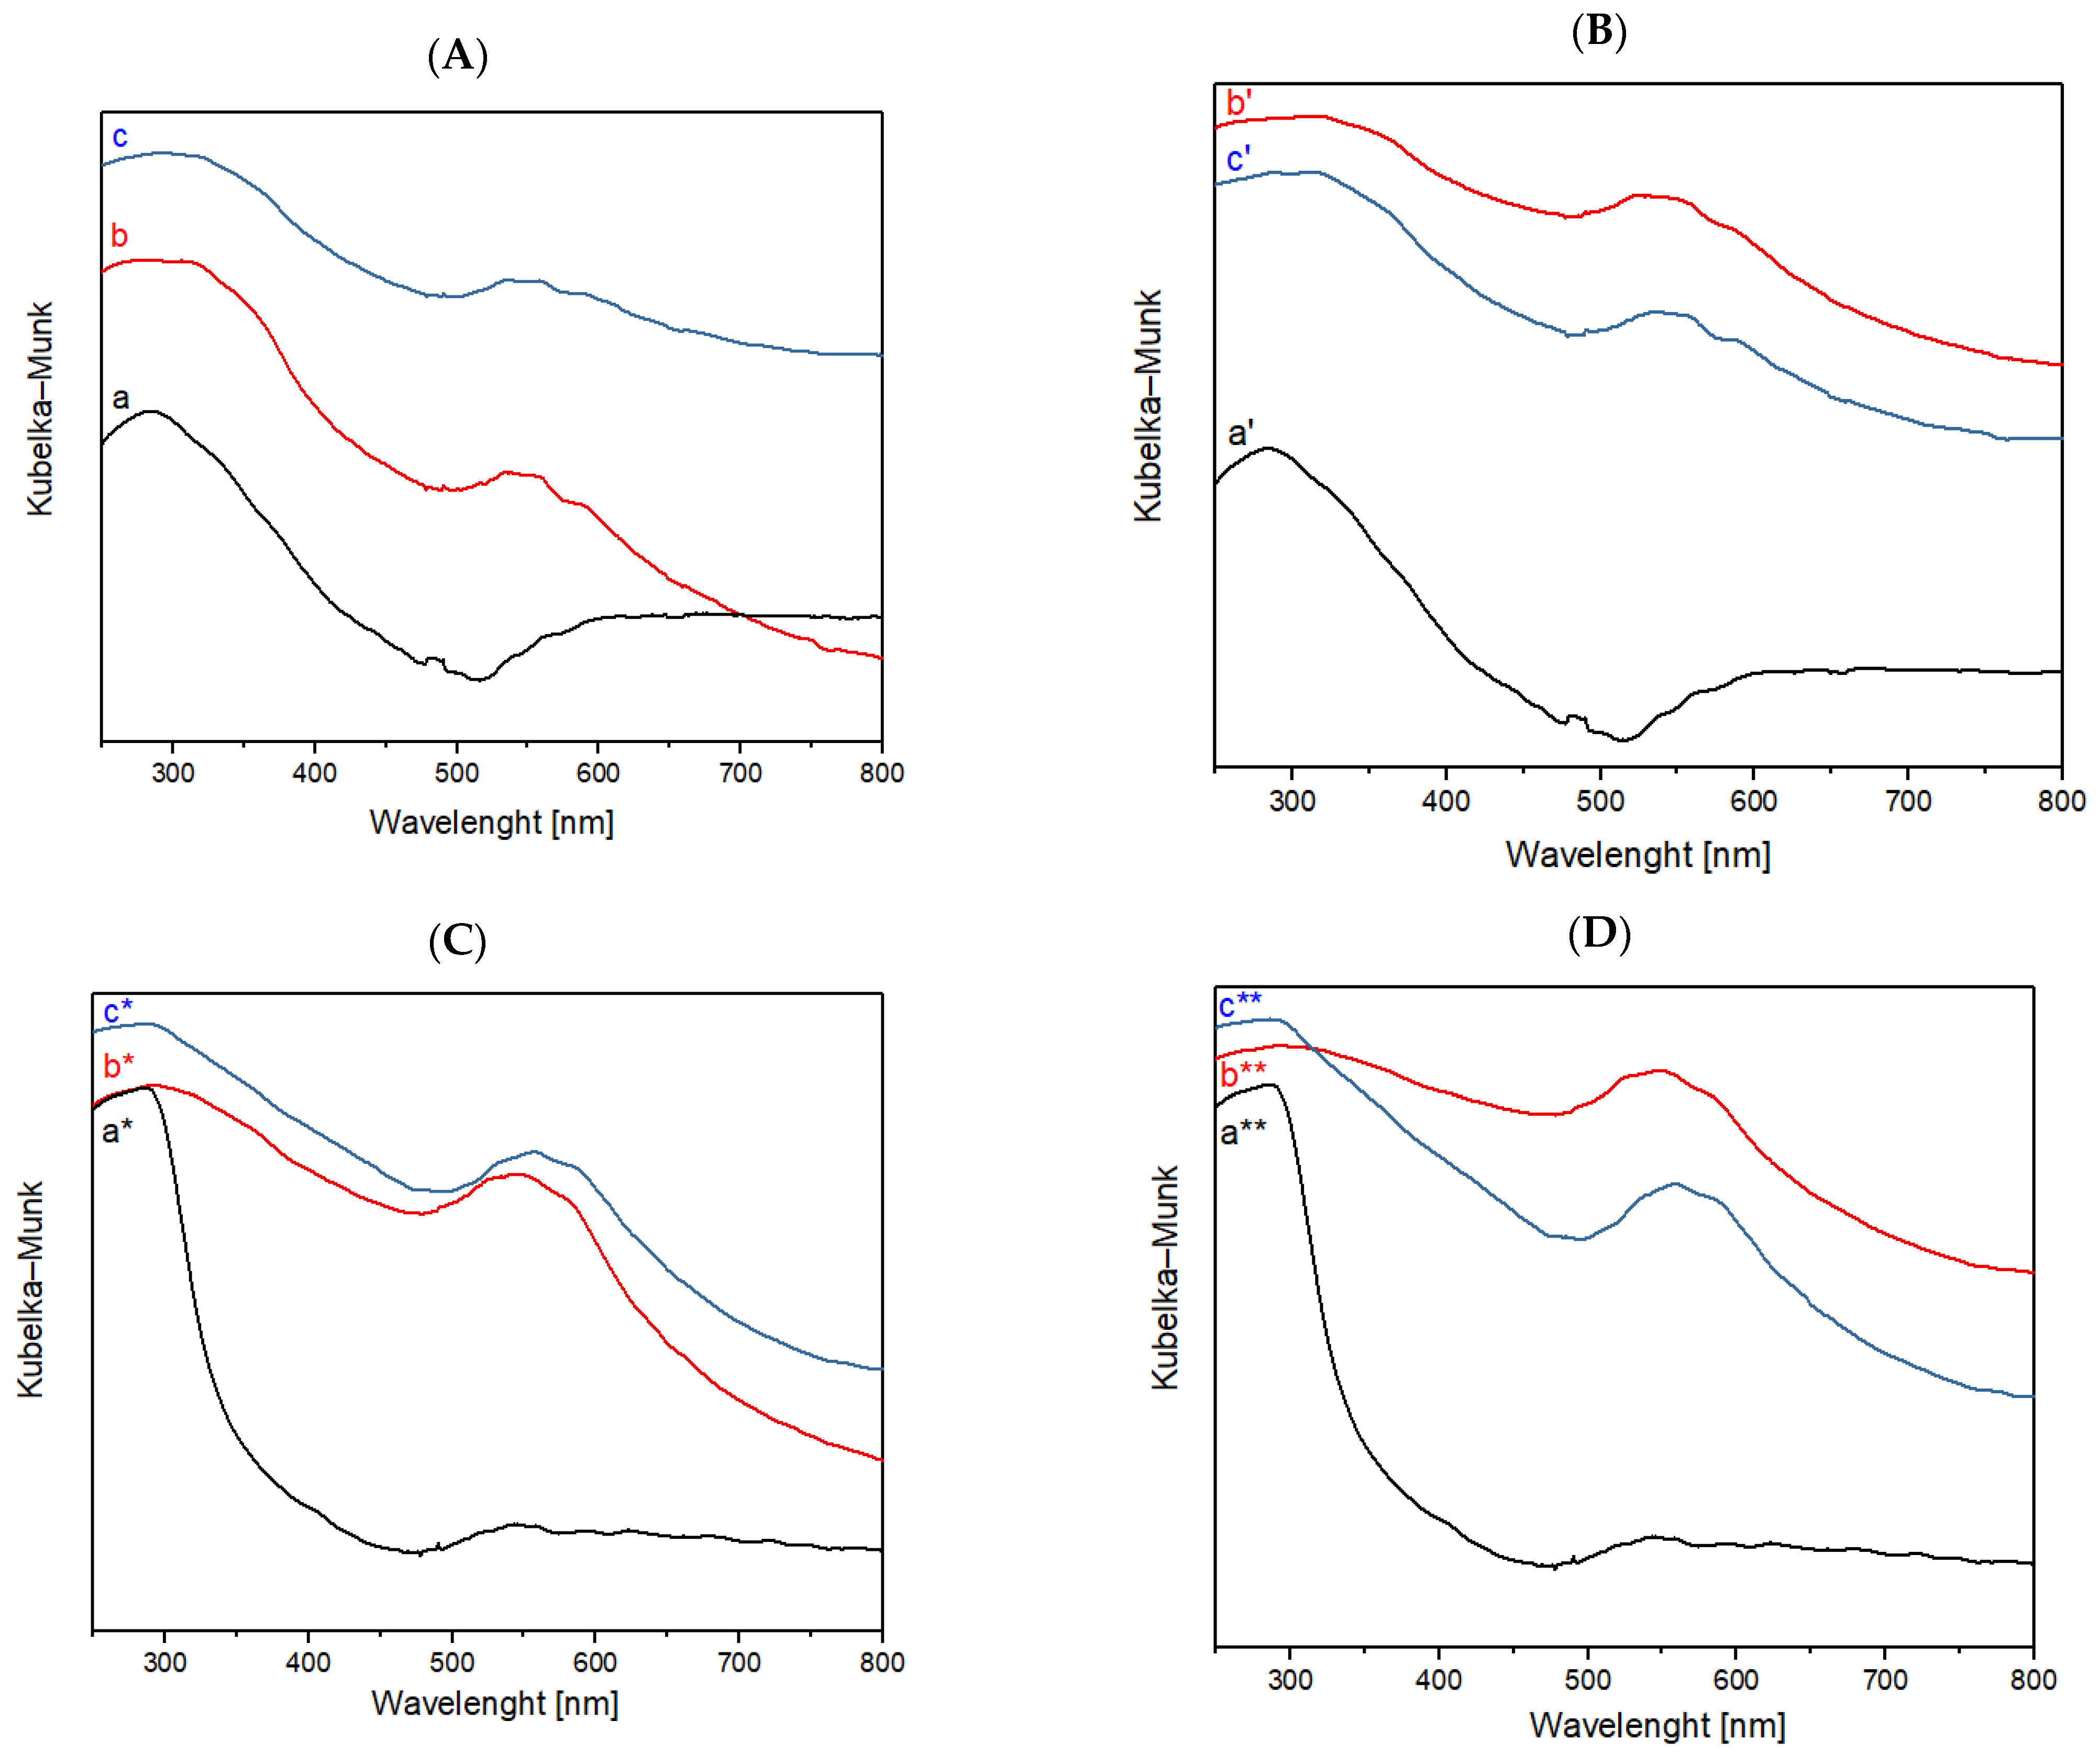
The spectrum reported in Figure 4 shows the two characteristic peaks of folium that could be observed also in the spectra of wool and cotton treated with plasma and chitosan after the dyeing process, reported in Figure 5. The presence of chitosan on the fibers guarantees the adhesion of the dye after washing step. The presence of the folium dye after the washing process is confirmed by the presence of the two characteristic bands of folium at 545 e 575 nm in each of the samples analyzed.
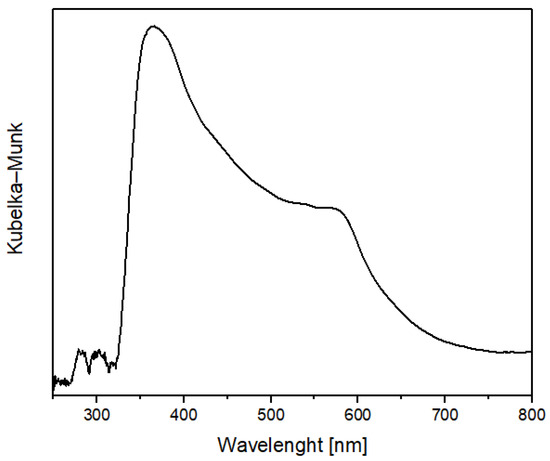
Figure 4.
FORS spectrum of folium in Kubelka-Munk coordinates.
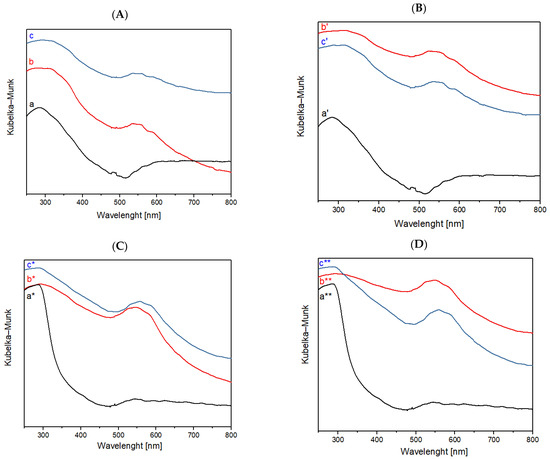
Figure 5.
(A) FORS spectra of raw cotton (a) after plasma treatment with He, (b) dyed with folium, (c) washed; (B) FORS spectra of raw cotton (a′) after plasma treatment with He-O2, (b′) dyed with folium, (c′) washed; (C) FORS spectra of raw wool (a*) after plasma treatment with He, (b*) dyed with folium, (c*) washed; (D) FORS spectra of raw wool (a**) after plasma treatment with He-O2, (b**) dyed with folium, (c**) washed.
The two characteristic peaks of folium are present in the samples of cotton and wool after the dyeing and wash phases. Samples were treated with He or He-O2 plasma.
According to the FORS spectra reported in Figure 5, it is possible to notice how, for the samples of wool treated with plasma, the peaks of dye folium (at 545 and 575 nm) are more evident than those present in the samples of cotton treated with plasma. These data indicate a greater adhesion of the dye on the wool fiber treated with plasma and coated with chitosan compared to the cotton fiber under the same conditions.
4. Discussion
The purpose of this work is to find the best conditions for a dyeing method for plant and animal fibers (i.e., cotton and wool) using an ancient dye called folium without the use of solvents and mordants and via eco-friendly processes.
The employed textile fibers were first treated with He-plasma, as well as a He-plasma enriched with 20% O2, to functionalize the surface by increasing its roughness, thus strengthening the binding of dye molecules.
Infrared characterizations showed that the He-O2 plasma treatment works best for cotton, whereas pure He-plasma treatment is preferable for wool; in both cases, a 2 min-treatment for both fiber types is best. The processes mentioned above resulted in better wettability of textiles, as well as better absorption of the dye. It is possible to observe, from the FTIR spectra, the increase in the oxygen species (in cotton tissues treated wit He-O2 plasma) and sulfur–oxygen species (in wool tissues treated with He plasma) that increase the compatibility between the fiber’s surface and chitosan molecules.
Dye tests proved that the method used for samples of raw cotton dyed for 24 h and cotton treated with He-O2 plasma and dyed for 4 h was not enough to allow the dye to stick to the material after washing. Therefore, the dyeing step for the latter samples was carried out at increasingly high temperatures to favor all of the binding steps of the dye onto the textile fibers.
Samples of cotton (treated with He-O2 plasma and dyed for 4 and 1.5 h) and wool (treated with He and He-O2 plasma and dyed for 1.5 h) were previously treated with chitosan, with concentrations of 3.5, 5, and 10 g/L, to verify which concentration could maximize the color fastness. The best results were obtained using a 10 g/L concentration.
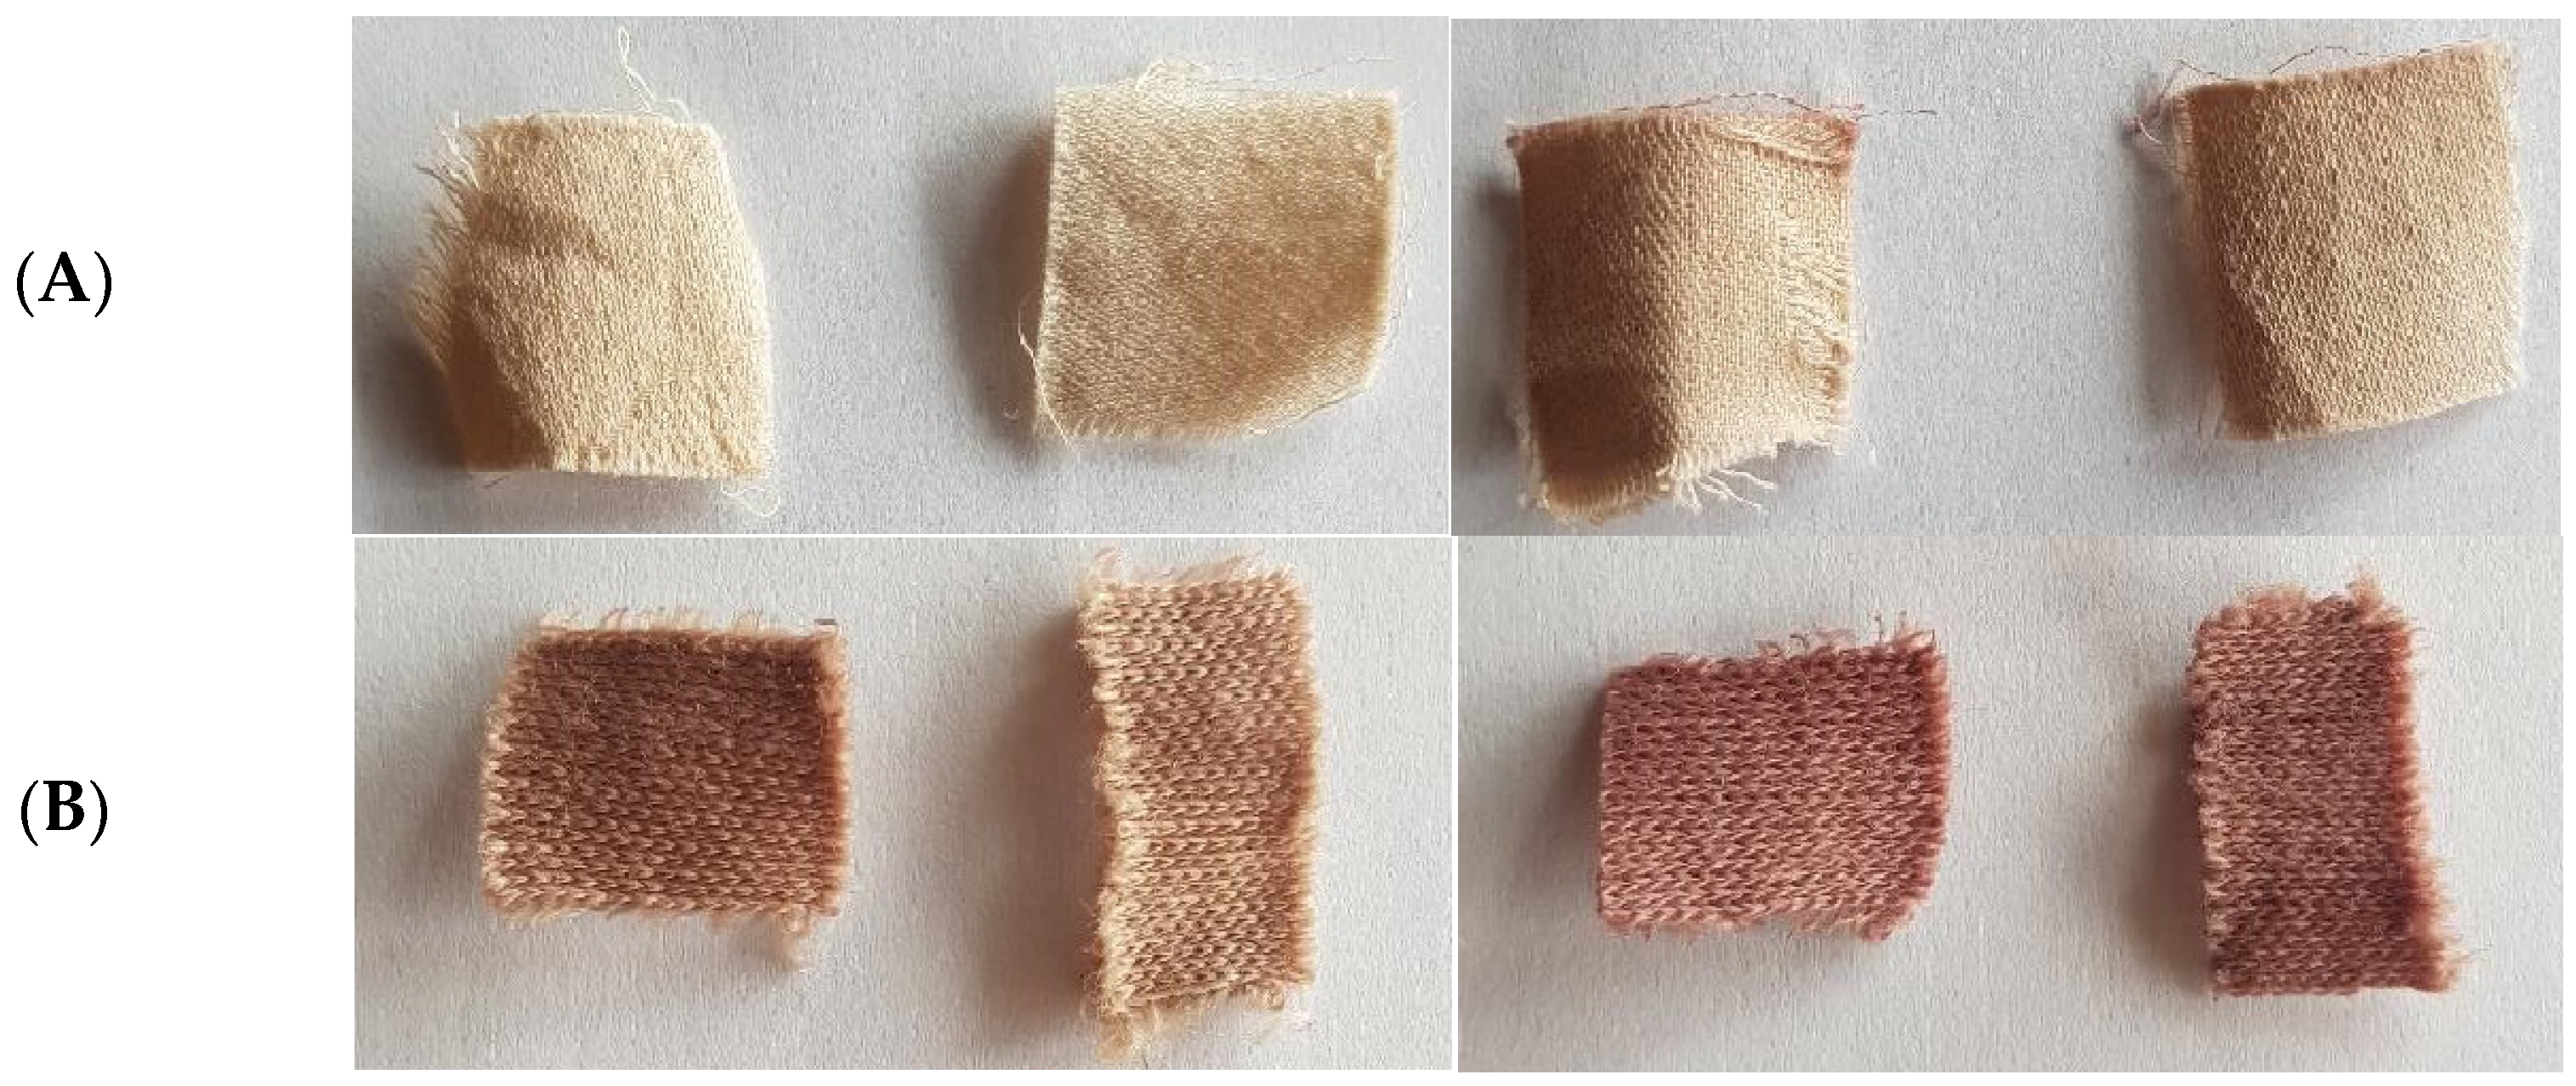
The temperature was kept below 50 °C, as natural substances can be subject to thermal degradation. Finally, the temperature of the dye bath was increased to 100 °C for cotton and 80 °C for wool, for samples of cotton and wool treated with He and He-O2 plasma and coated with a solution of chitosan 10 g/L and dyed for 1.5 h. These samples showed the best dye absorption and color fastness after the washing procedure (Figure 6).
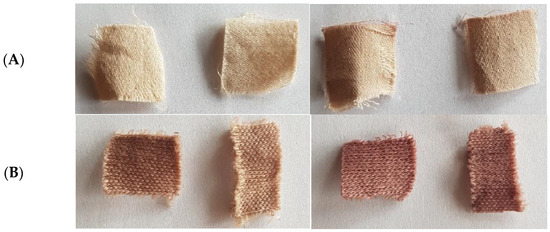
Figure 6.
(A) left pane, plasma- (left) and chitosan-treated (right) cotton; right pane, cotton dyed with folium (left) and subsequently washed (right), samples CHe1.5-10 and CHeO1.5-10. (B) let pane, plasma- (left) and chitosan-treated (right) wool; right pane, wool dyed with folium (left) and subsequently washed (right), samples WHe1.5-10 and WHeO1.5-10.
The results obtained from the dyeing and washing steps were confirmed by means of fiber optic reflectance spectroscopy (FORS), which displays folium-related peaks in the range of 500–600 nm, specifically with two peaks at 545 nm and 575 nm, also in the spectra acquired for the washed samples.
Furthermore, a larger amount of dye was observed on the wool samples, compared to the cotton ones; a possible reason behind this is that pigments with a structure like that of folium bind more strongly onto animal fibers rather than onto plant fibers.
As a matter of fact, animal fibers mainly consist of proteins containing amino- and carboxyl groups, which form ionic bonds with protonated anthocyanins. On the contrary, cellulose does not contain such functional groups; therefore, only weak van der Waals interactions and hydrogen bonds can be formed between the OH- groups of anthocyanins and cellulose.
This work demonstrates that it is possible to design eco-friendly dyeing methods which do not employ any solvents or mordants, and thus require less water and energy consumption, as well as avoiding the production of potentially hazardous waste.
5. Conclusions
Within this work, an ancient dye such as folium was used to dye cotton and wool fibers. To increase the interactions between folium dye molecules and the fibers studied (cotton and wool fibers), the surfaces of the fibers were medicated with plasma treatment, carried out in the presence of He plasma or He-O2 mixture plasma, and subsequently coated with chitosan.
After plasma treatments, SEM images show the presence of chitosan particles of the analyzed fibers, more evident in wool fibers than cotton. The FT-IR spectra conduced on the cotton and wool fibers, before and after plasma and coating treatments, show that there is a significant variation in the surface functional groups, most presents for the samples of tissues treated with plasma deriving from He-O2 mixtures, also allowing for a greater adhesion of chitosan on the surface of the fibers. He-O2 plasma treatments cause an increase in hydroxyl and carboxyl groups able to increase the adhesion of chitosan molecules on the tissue.
This is, of course, an initial study. As a future perspective, the natural aging of the fabric obtained with plasma treatment over the time will be inspected by studying the stability of the dye over a long period.
This study suggests how ancient materials can be useful for developing modern, more sustainable technologies that are useful for everyday life.
Author Contributions
Conceptualization, D.D; methodology, G.G.; software, E.C.; validation, E.C.; formal analysis, A.M. and F.R.; investigation, A.M. and F.R.; resources, D.D. and G.G.; data curation, A.C.; writing—original draft preparation, F.R.; writing—review and editing, M.A.; visualization, A.M.; supervision, G.G.; project administration, A.C.; funding acquisition, G.G. All authors have read and agreed to the published version of the manuscript.
Funding
This research received no external funding.
Institutional Review Board Statement
Not applicable.
Informed Consent Statement
Not applicable.
Data Availability Statement
The data presented in this study are available on request from the corresponding author. The data are not publicly available due to privacy.
Acknowledgments
Authors would like to thank Tessitura Pertile SRL (Chieri, Italy) for providing the textile materials used in this work.
Conflicts of Interest
The authors declare no conflicts of interest.
References
- Anwer, H.; Mahmood, A.; Lee, J.; Kim, K.-H.; Park, J.-W.; Yip, A.C.K. Photocatalysts for Degradation of Dyes in Industrial Effluents: Opportunities and Challenges. Nano Res. 2019, 12, 955–972. [Google Scholar] [CrossRef]
- Velusamy, S.; Roy, A.; Sundaram, S.; Kumar Mallick, T. A Review on Heavy Metal Ions and Containing Dyes Removal Through Graphene Oxide-Based Adsorption Strategies for Textile Wastewater Treatment. Chem. Rec. 2021, 21, 1570–1610. [Google Scholar] [CrossRef] [PubMed]
- Jiang, H.; Guo, R.; Mia, R.; Zhang, H.; Lü, S.; Yang, F.; Mahmud, S.; Liu, H. Eco-Friendly Dyeing and Finishing of Organic Cotton Fabric Using Natural Dye (Gardenia Yellow) Reduced-Stabilized Nanosilver: Full Factorial Design. Cellulose 2022, 29, 2663–2679. [Google Scholar] [CrossRef]
- Li, N.; Wang, Q.; Zhou, J.; Li, S.; Liu, J.; Chen, H. Insight into the Progress on Natural Dyes: Sources, Structural Features, Health Effects, Challenges, and Potential. Molecules 2022, 27, 3291. [Google Scholar] [CrossRef] [PubMed]
- Samanta, A.K.; Agarwal, P. Application of Natural Dyes on Textiles. Indian J. Fibre Text. Res. 2009, 34, 384–399. [Google Scholar]
- Singh, R.; Srivastava, S. A Critical Review on Extraction of Natural Dyes from Leaves. Int. J. Home Sci. 2017, 3, 100–103. [Google Scholar]
- Ebrahim, S.; Mosaad, M.; Othman, H.; Hassabo, A. A Valuable Observation of Eco-Friendly Natural Dyes for Valuable Utilisation in the Textile Industry. J. Text. Color. Polym. Sci. 2021, 19, 25–37. [Google Scholar] [CrossRef]
- Fang, J.; Meng, C.; Zhang, G. Agricultural Waste of Ipomoea Batatas Leaves as a Source of Natural Dye for Green Coloration and Bio-Functional Finishing for Textile Fabrics. Ind. Crops Prod. 2022, 177, 114440. [Google Scholar] [CrossRef]
- Berhanu, B.Y.; Luebben, J.F.; Nalankilli, G. Cold Plasma Treatment in Wet Chemical Textile Processing. Fibres Text. East. Eur. 2020, 28, 118–126. [Google Scholar] [CrossRef]
- Haji, A. Dyeing of Cotton Fabric with Natural Dyes Improved by Mordants and Plasma Treatment. Rev. Prog. Color. Relat. Top. 2019, 12, 191–201. [Google Scholar]
- Höcker, H. Plasma Treatment of Textile Fibers. Pure Appl. Chem. 2002, 74, 423–427. [Google Scholar] [CrossRef]
- Dave, H.; Ledwani, L.; Chandwani, N.; Chauhan, N.; Nema, S.K. The Removal of Impurities from Gray Cotton Fabric by Atmospheric Pressure Plasma Treatment and Its Characterization Using ATR-FTIR Spectroscopy. J. Text. Inst. 2014, 105, 586–596. [Google Scholar] [CrossRef]
- Barani, H.; Haji, A. Analysis of Structural Transformation in Wool Fiber Resulting from Oxygen Plasma Treatment Using Vibrational Spectroscopy. J. Mol. Struct. 2015, 1079, 35–40. [Google Scholar] [CrossRef]
- Eichholz, D.E. Pliny’s Natural History—Pliny: Natural History, Vol. IX: Books XXXIII–XXXV. With an English Translation by H. Rackham. (Loeb Classical Library.) Pp. Ix+421. London: Heinemann, 1952. Cloth, 15s. Net. Classical Rev. 1954, 4, 136–138. [Google Scholar] [CrossRef]
- Aceto, M.; Calà, E.; Agostino, A.; Fenoglio, G.; Idone, A.; Porter, C.; Gulmini, M. On the Identification of Folium and Orchil on Illuminated Manuscripts. Spectrochim. Acta—Part A Mol. Biomol. Spectrosc. 2017, 171, 461–469. [Google Scholar] [CrossRef]
- Aceto, M.; Calà, E.; Arrais, A.; Clericuzio, M.; Marsano, F.; Idone, A.; Davit, P.; Menghini, L.; Gulmini, M. On the Identification of Folium by SERS: From Crude Extracts to Illuminated Codices. J. Raman Spectrosc. 2017, 48, 530–537. [Google Scholar] [CrossRef]
- Kolářová, K.; Vosmanská, V.; Rimpelová, S.; Švorčík, V. Effect of Plasma Treatment on Cellulose Fiber. Cellulose 2013, 20, 953–961. [Google Scholar] [CrossRef]
- Samanta, K.K.; Gayatri, T.N.; Saxena, S.; Basak, S.; Chattopadhyay, S.K.; Arputharaj, A. Effect of Plasma Treatment on Physico-Chemical Properties of Cotton. Int. J. Eng. Res. Technol. 2014, 3, 32467–32477. [Google Scholar]
- Abidi, N.; Cabrales, L.; Haigler, C.H. Changes in the Cell Wall and Cellulose Content of Developing Cotton Fibers Investigated by FTIR Spectroscopy. Carbohydr. Polym. 2014, 100, 9–16. [Google Scholar] [CrossRef]
- Liu, Y. Recent Progress in Fourier Transform Infrared (FTIR) Spectroscopy Study of Compositional, Structural and Physical Attributes of Developmental Cotton Fibers. Materials 2013, 6, 299–313. [Google Scholar] [CrossRef]
- Hosseinnezhad, M.; Gharanjig, K.; Razani, N.; Imani, H. Green Dyeing of Wool Fibers with Madder: Study of Combination of Two Biomordant on K/S and Fastness. Fibers Polym. 2020, 21, 2036–2041. [Google Scholar] [CrossRef]
- Jabar, J.M.; Ogunmokun, A.I.; Taleat, T.A.A. Color and Fastness Properties of Mordanted Bridelia Ferruginea B Dyed Cellulosic Fabric. Fash. Text. 2020, 7, 1. [Google Scholar] [CrossRef]
- Hosseinnezhad, M.; Gharanjig, K.; Razani, N.; Jafari, R.; Saeb, M.R. Green Miles in Dyeing Technology: Metal-Rich Pumpkin Extracts in Aid of Natural Dyes. Environ. Sci. Pollut. Res. 2022, 29, 50608–50616. [Google Scholar] [CrossRef] [PubMed]
- Veysian, M.; Shams-Nateri, A. The Effect of Metal Mordant and Biomordant on Color Strength of Dyed Woolen Yarn with Natural Dyes. Fibers Polym. 2023, 24, 4337–4355. [Google Scholar] [CrossRef]
- Hosseinnezhad, M.; Gharanjig, K.; Rouhani, S.; Razani, N.; Imani, H. Environmentally Friendly Dyeing of Wool Yarns Using of Combination of Bio-mordants and Natural Dyes. Environ. Prog. Sustain. Energy 2022, 41, e13868. [Google Scholar] [CrossRef]

Disclaimer/Publisher’s Note: The statements, opinions and data contained in all publications are solely those of the individual author(s) and contributor(s) and not of MDPI and/or the editor(s). MDPI and/or the editor(s) disclaim responsibility for any injury to people or property resulting from any ideas, methods, instructions or products referred to in the content. |
© 2024 by the authors. Licensee MDPI, Basel, Switzerland. This article is an open access article distributed under the terms and conditions of the Creative Commons Attribution (CC BY) license (https://creativecommons.org/licenses/by/4.0/).