
Urban Color Perception and Sentiment Analysis Based on Deep Learning and Street View Big Data


Abstract
:1. Introduction
2. Data and Methods
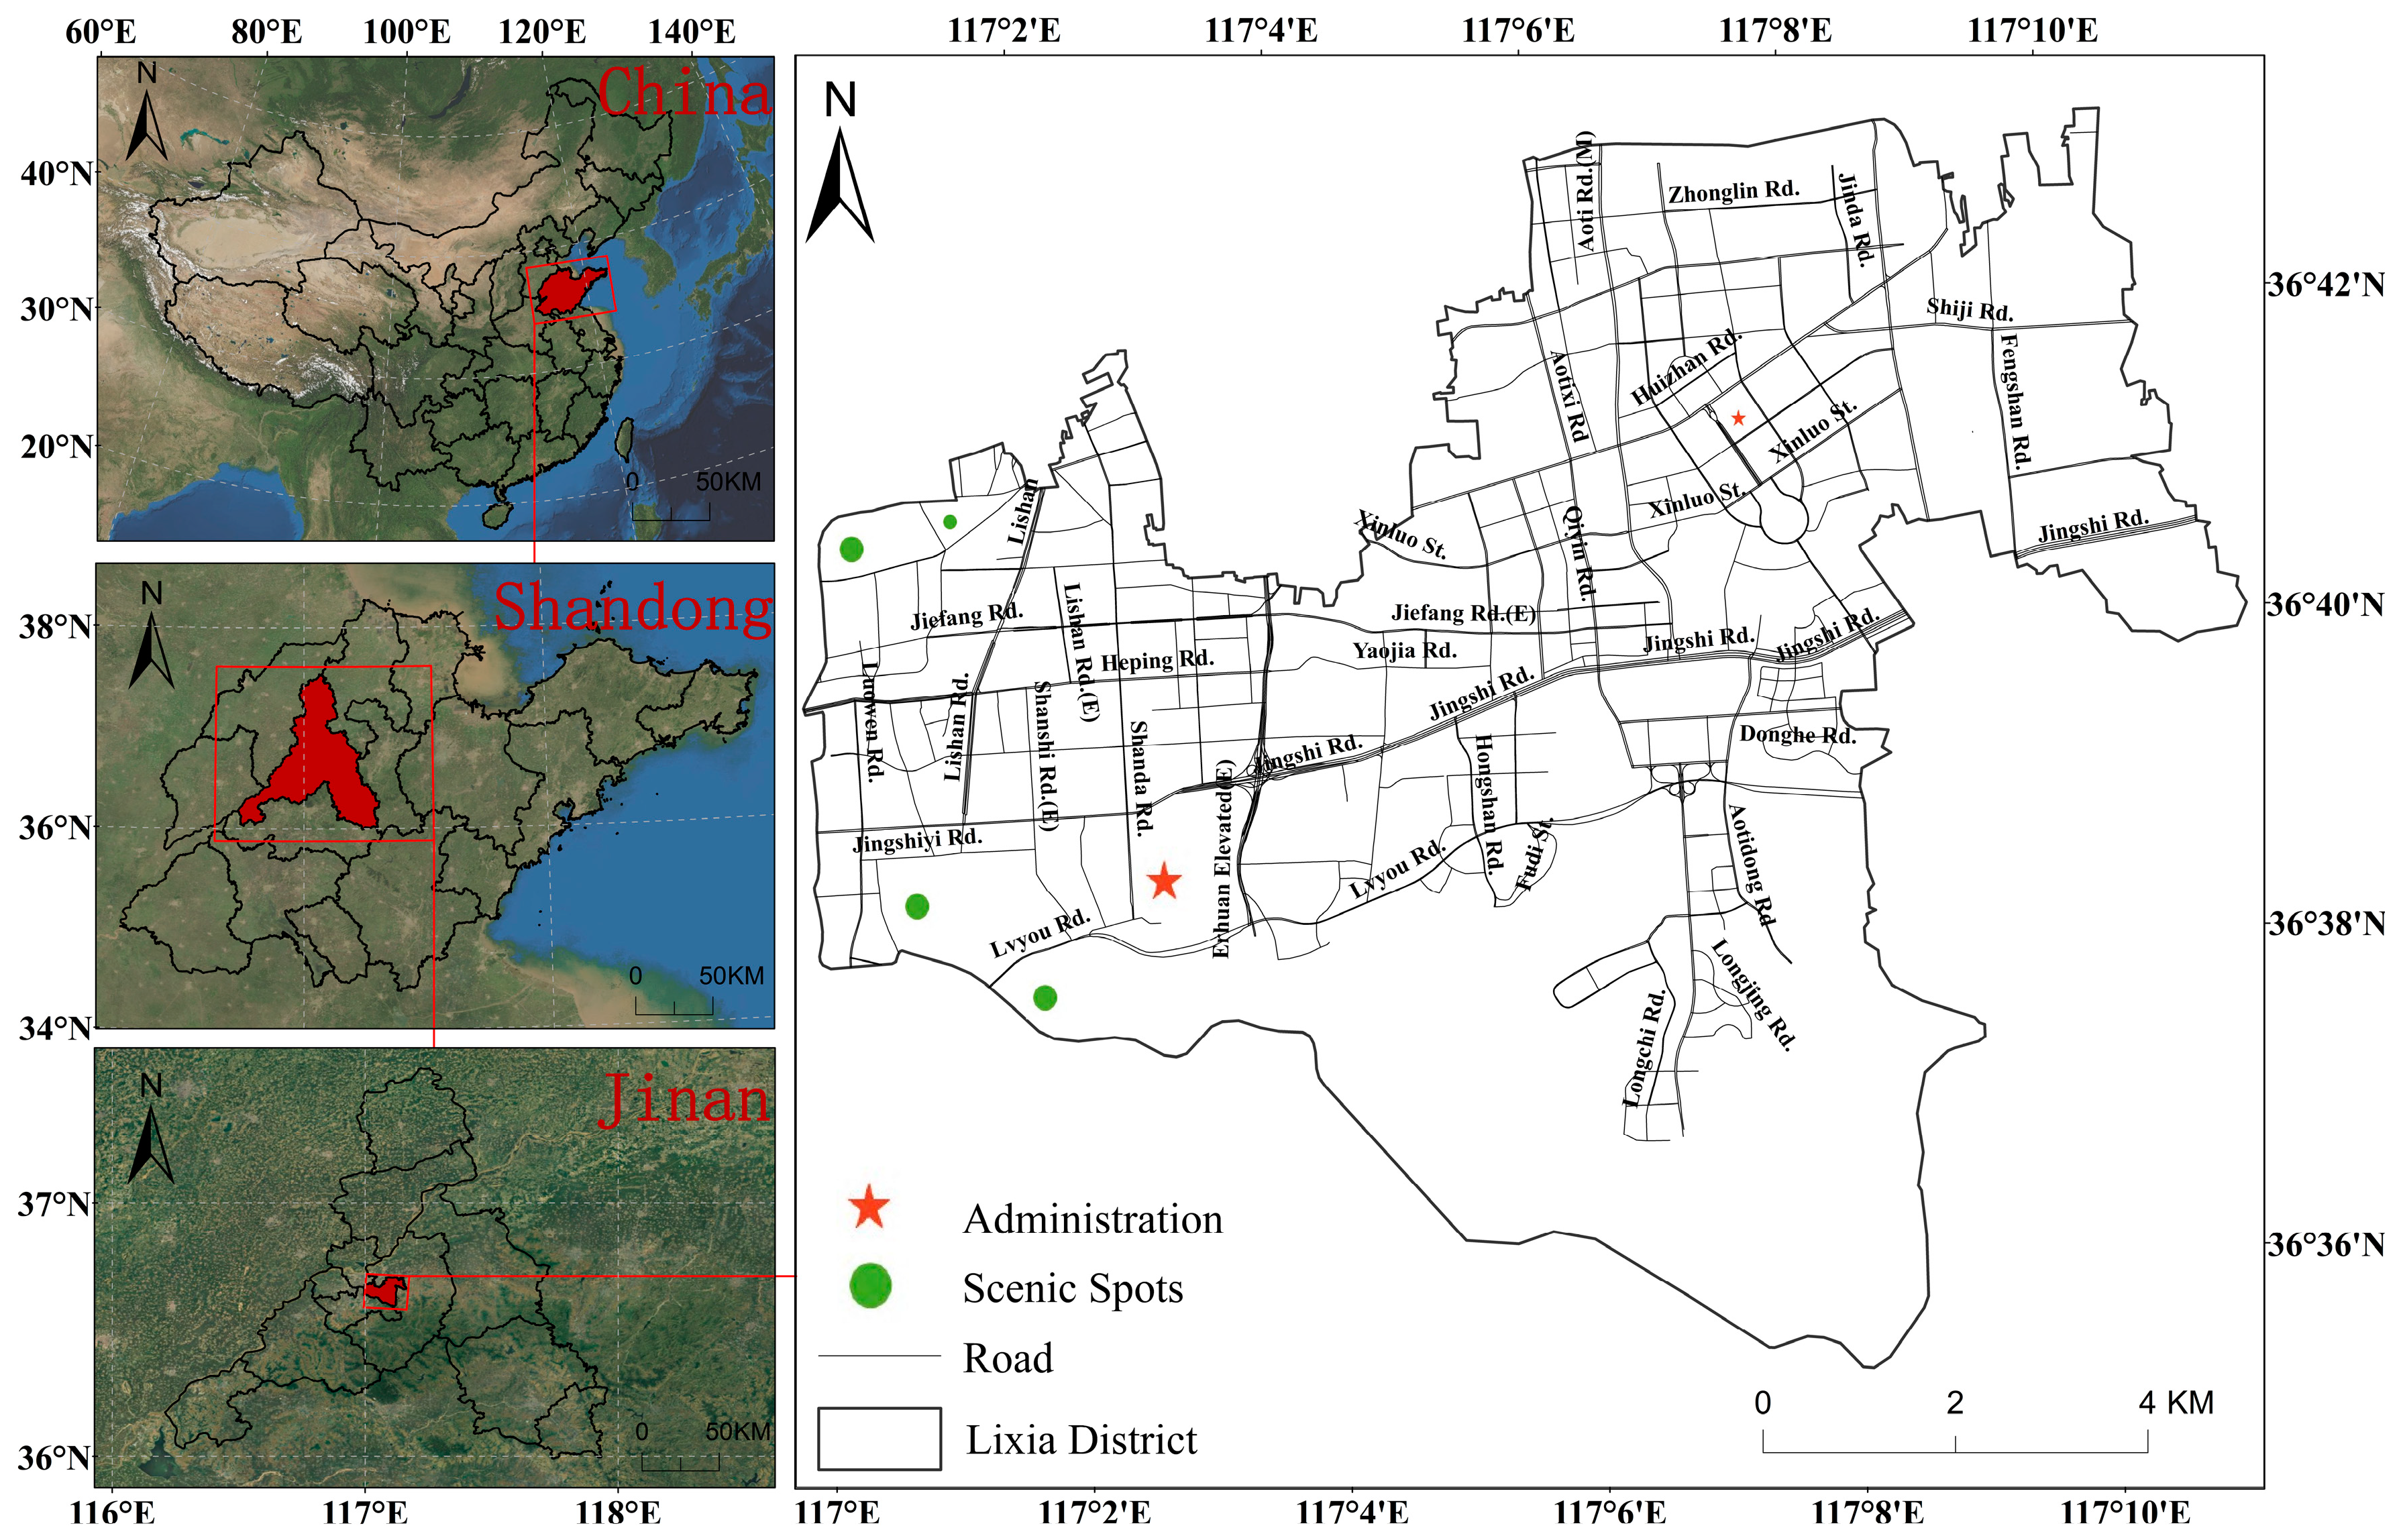
2.1. Overview of the Study Area
2.2. Data Sources
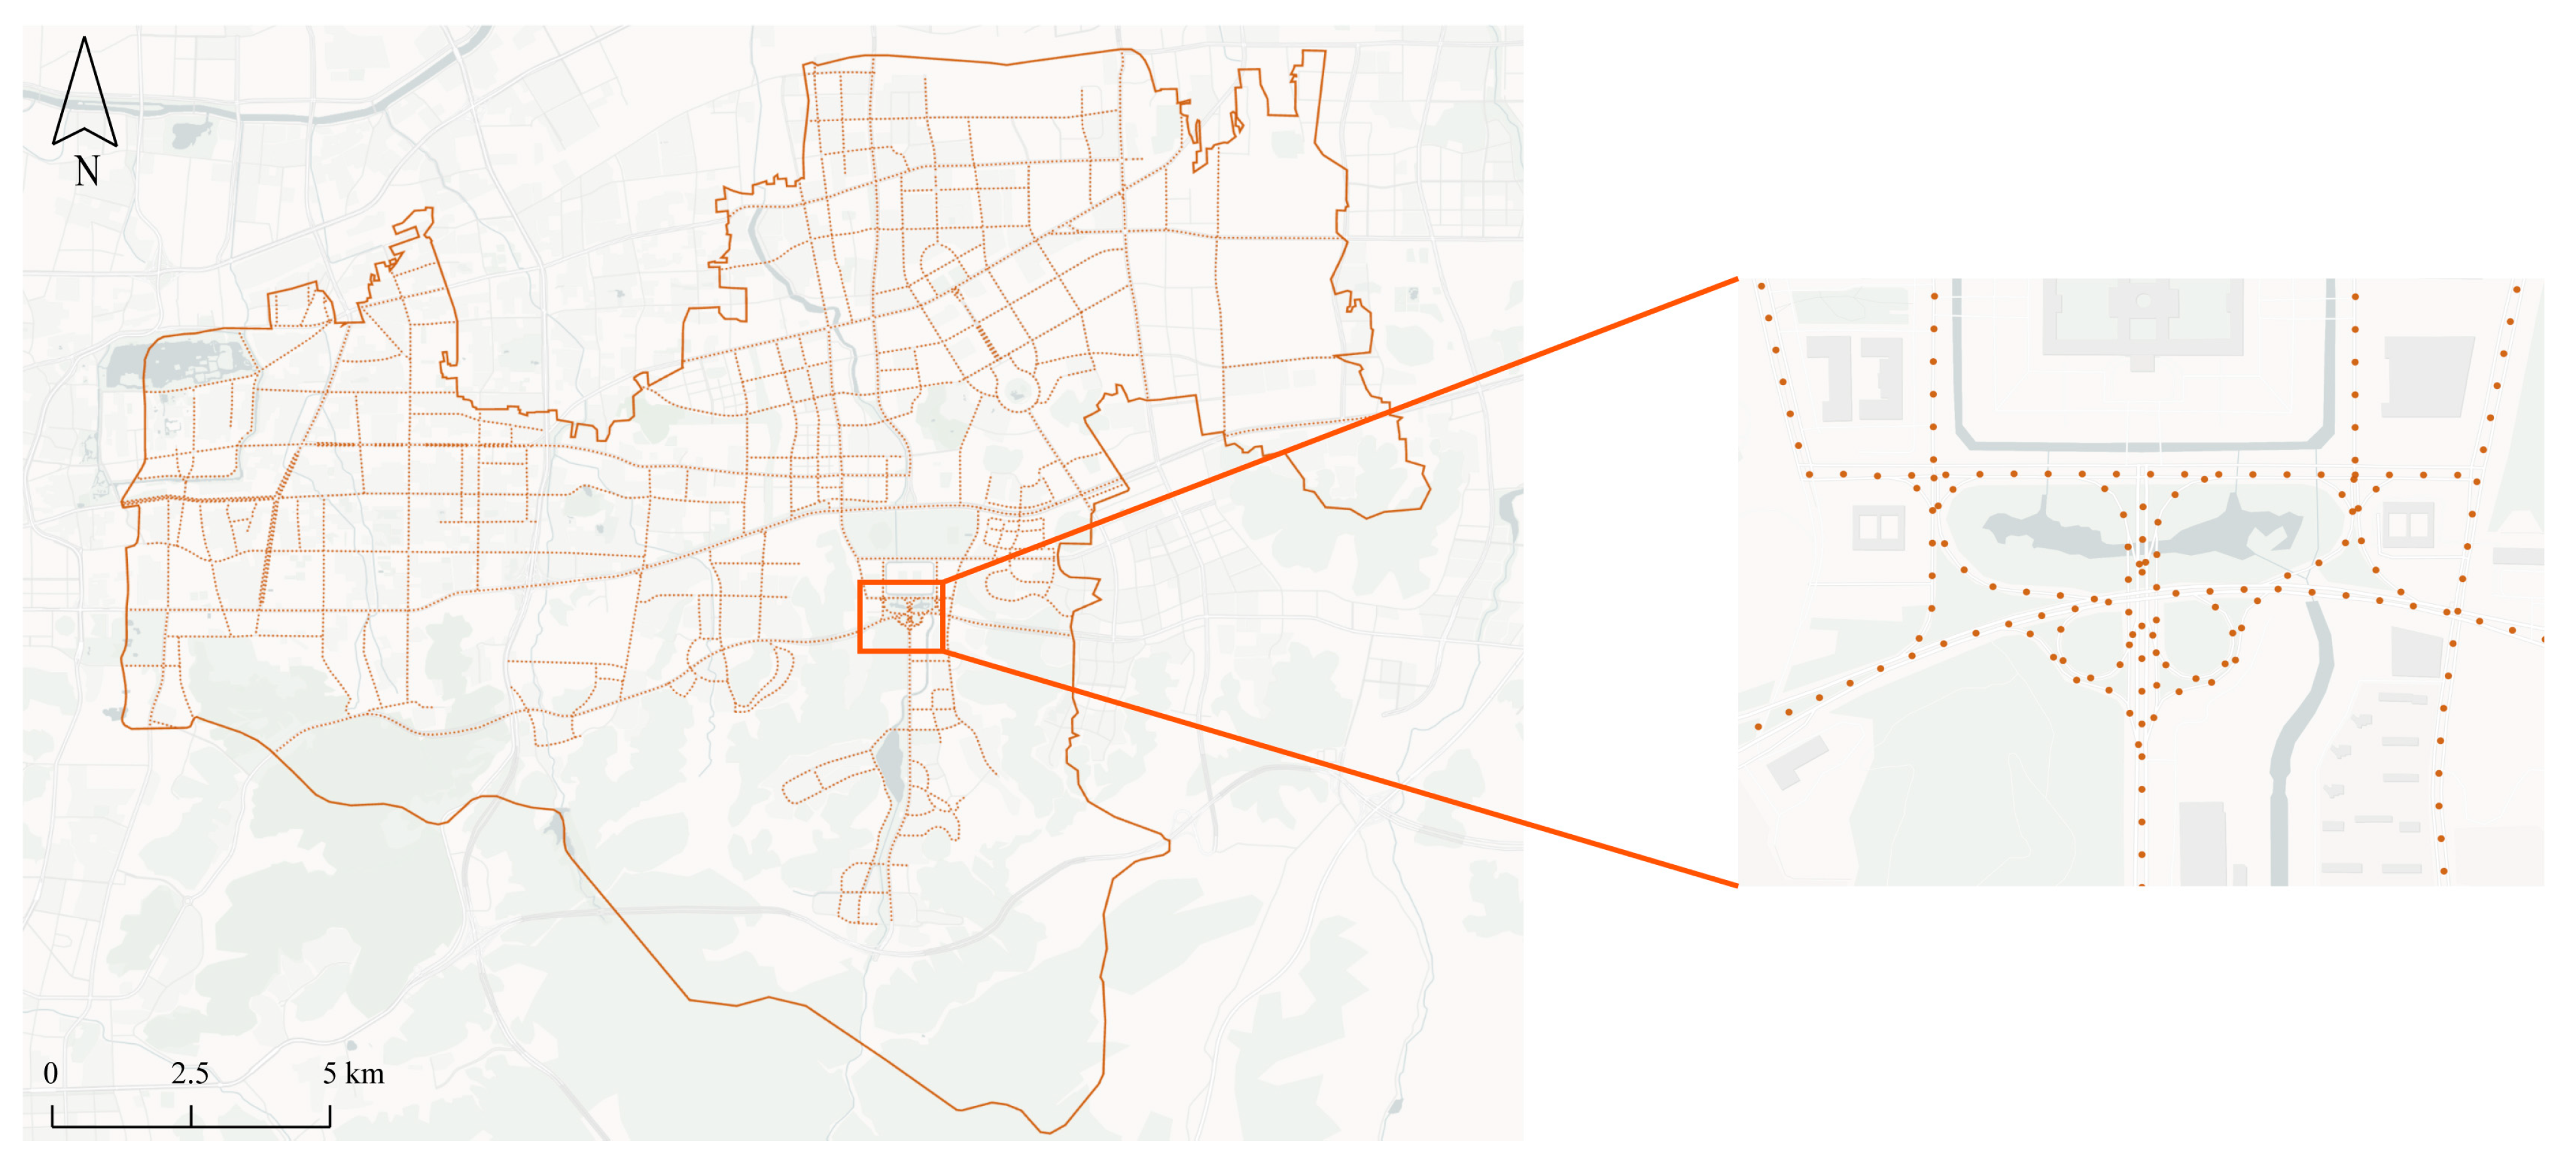
2.2.1. Road Network Collection and Processing
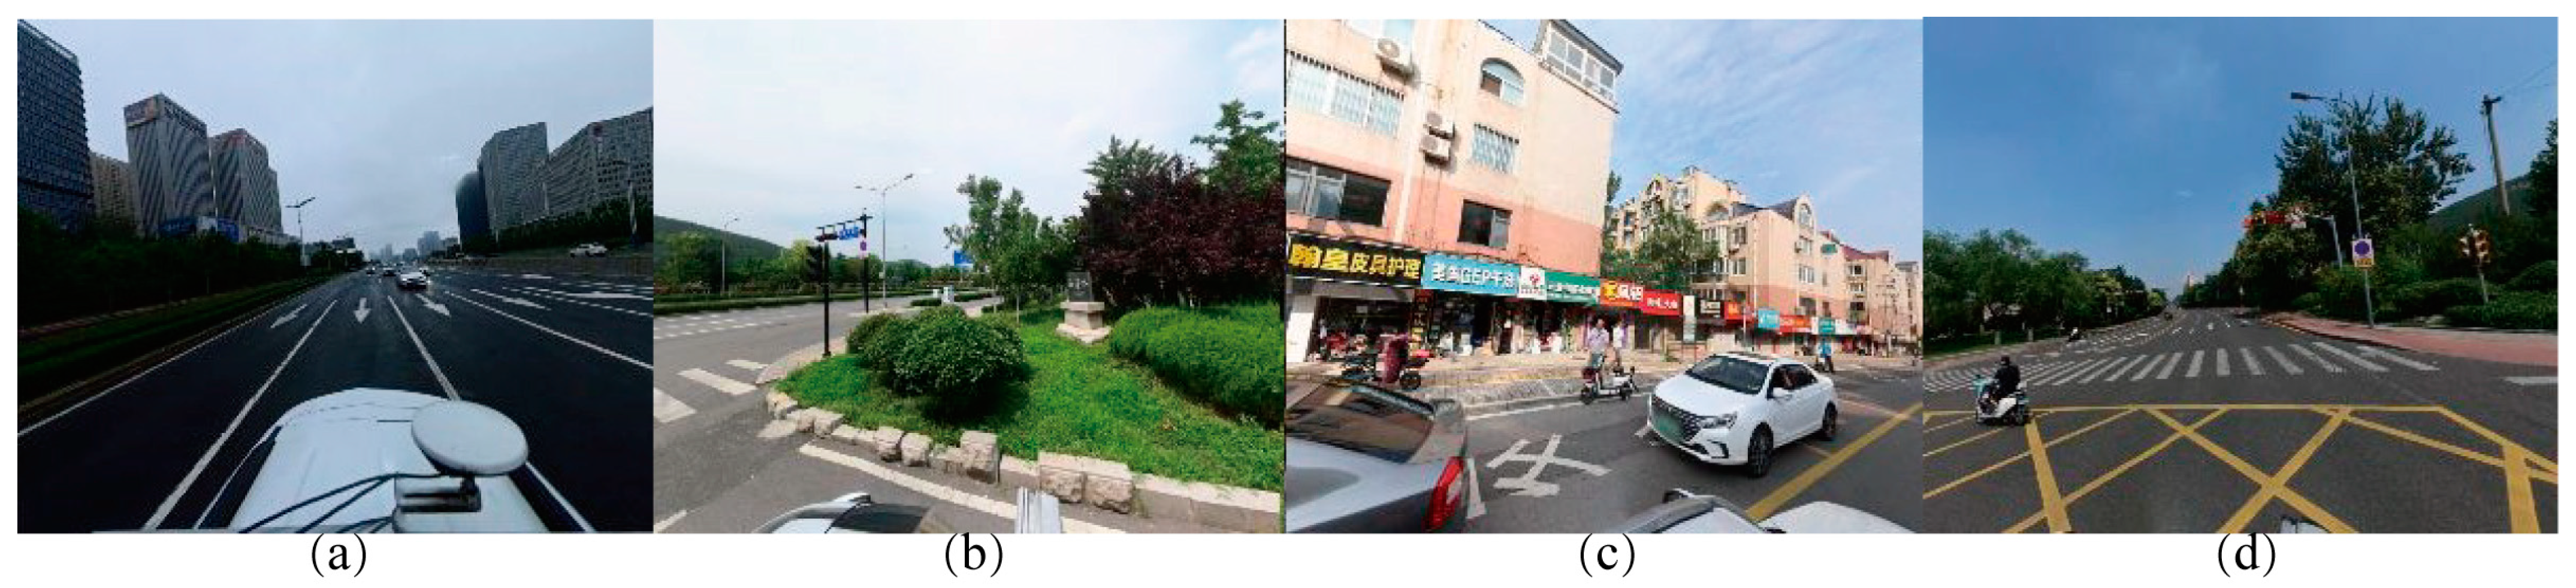
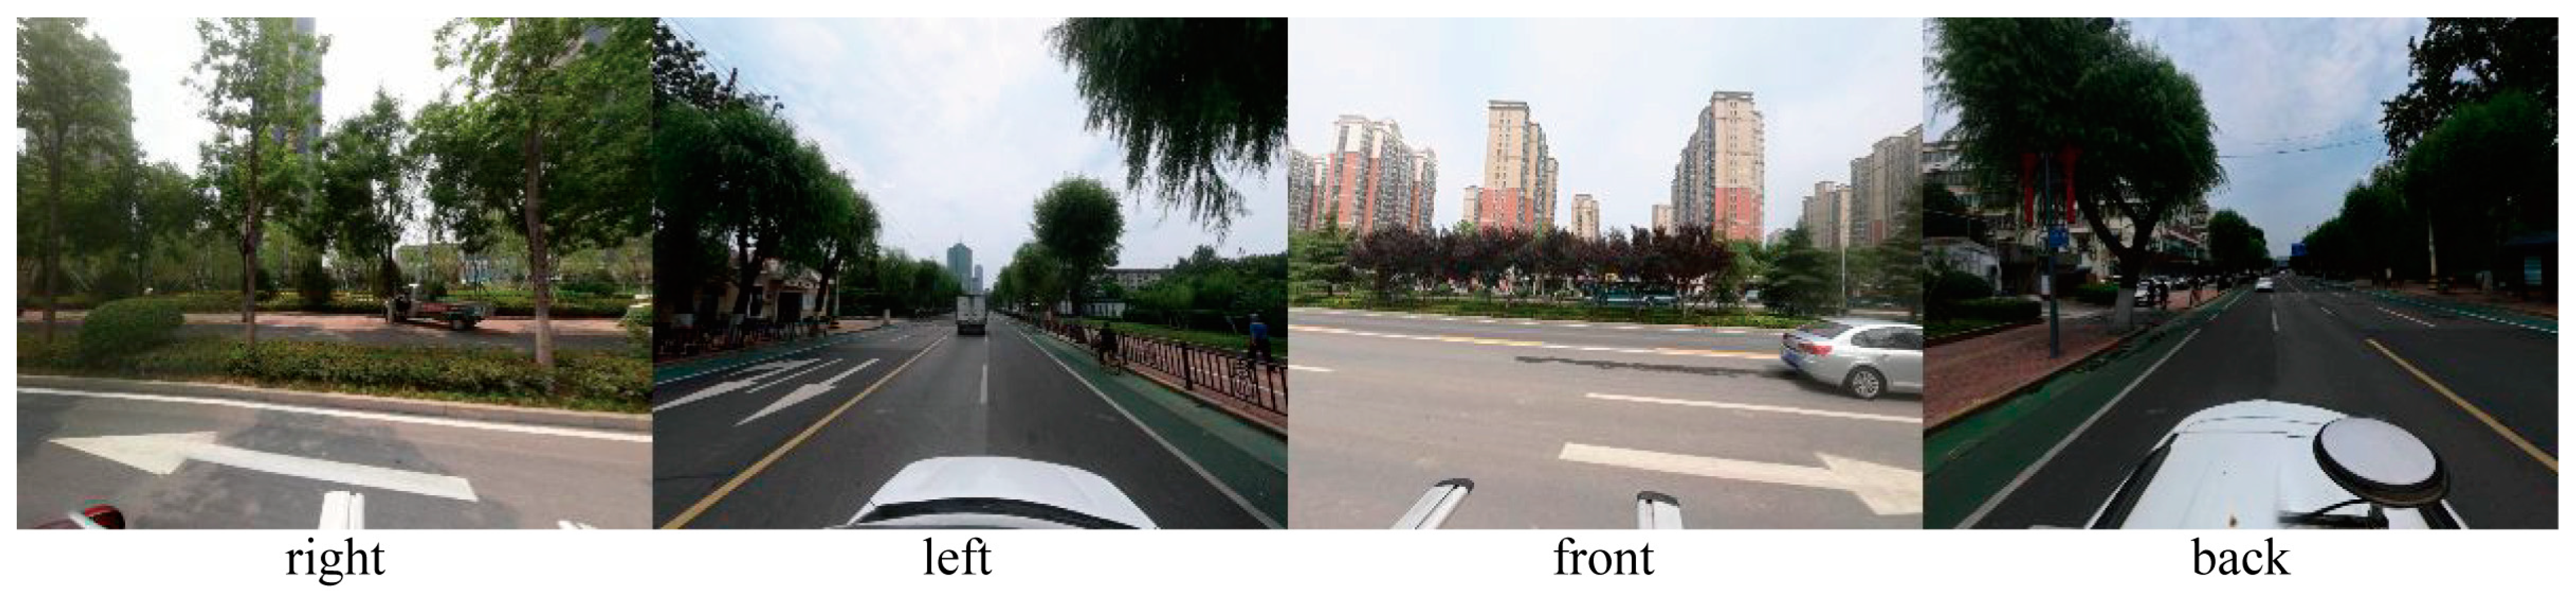
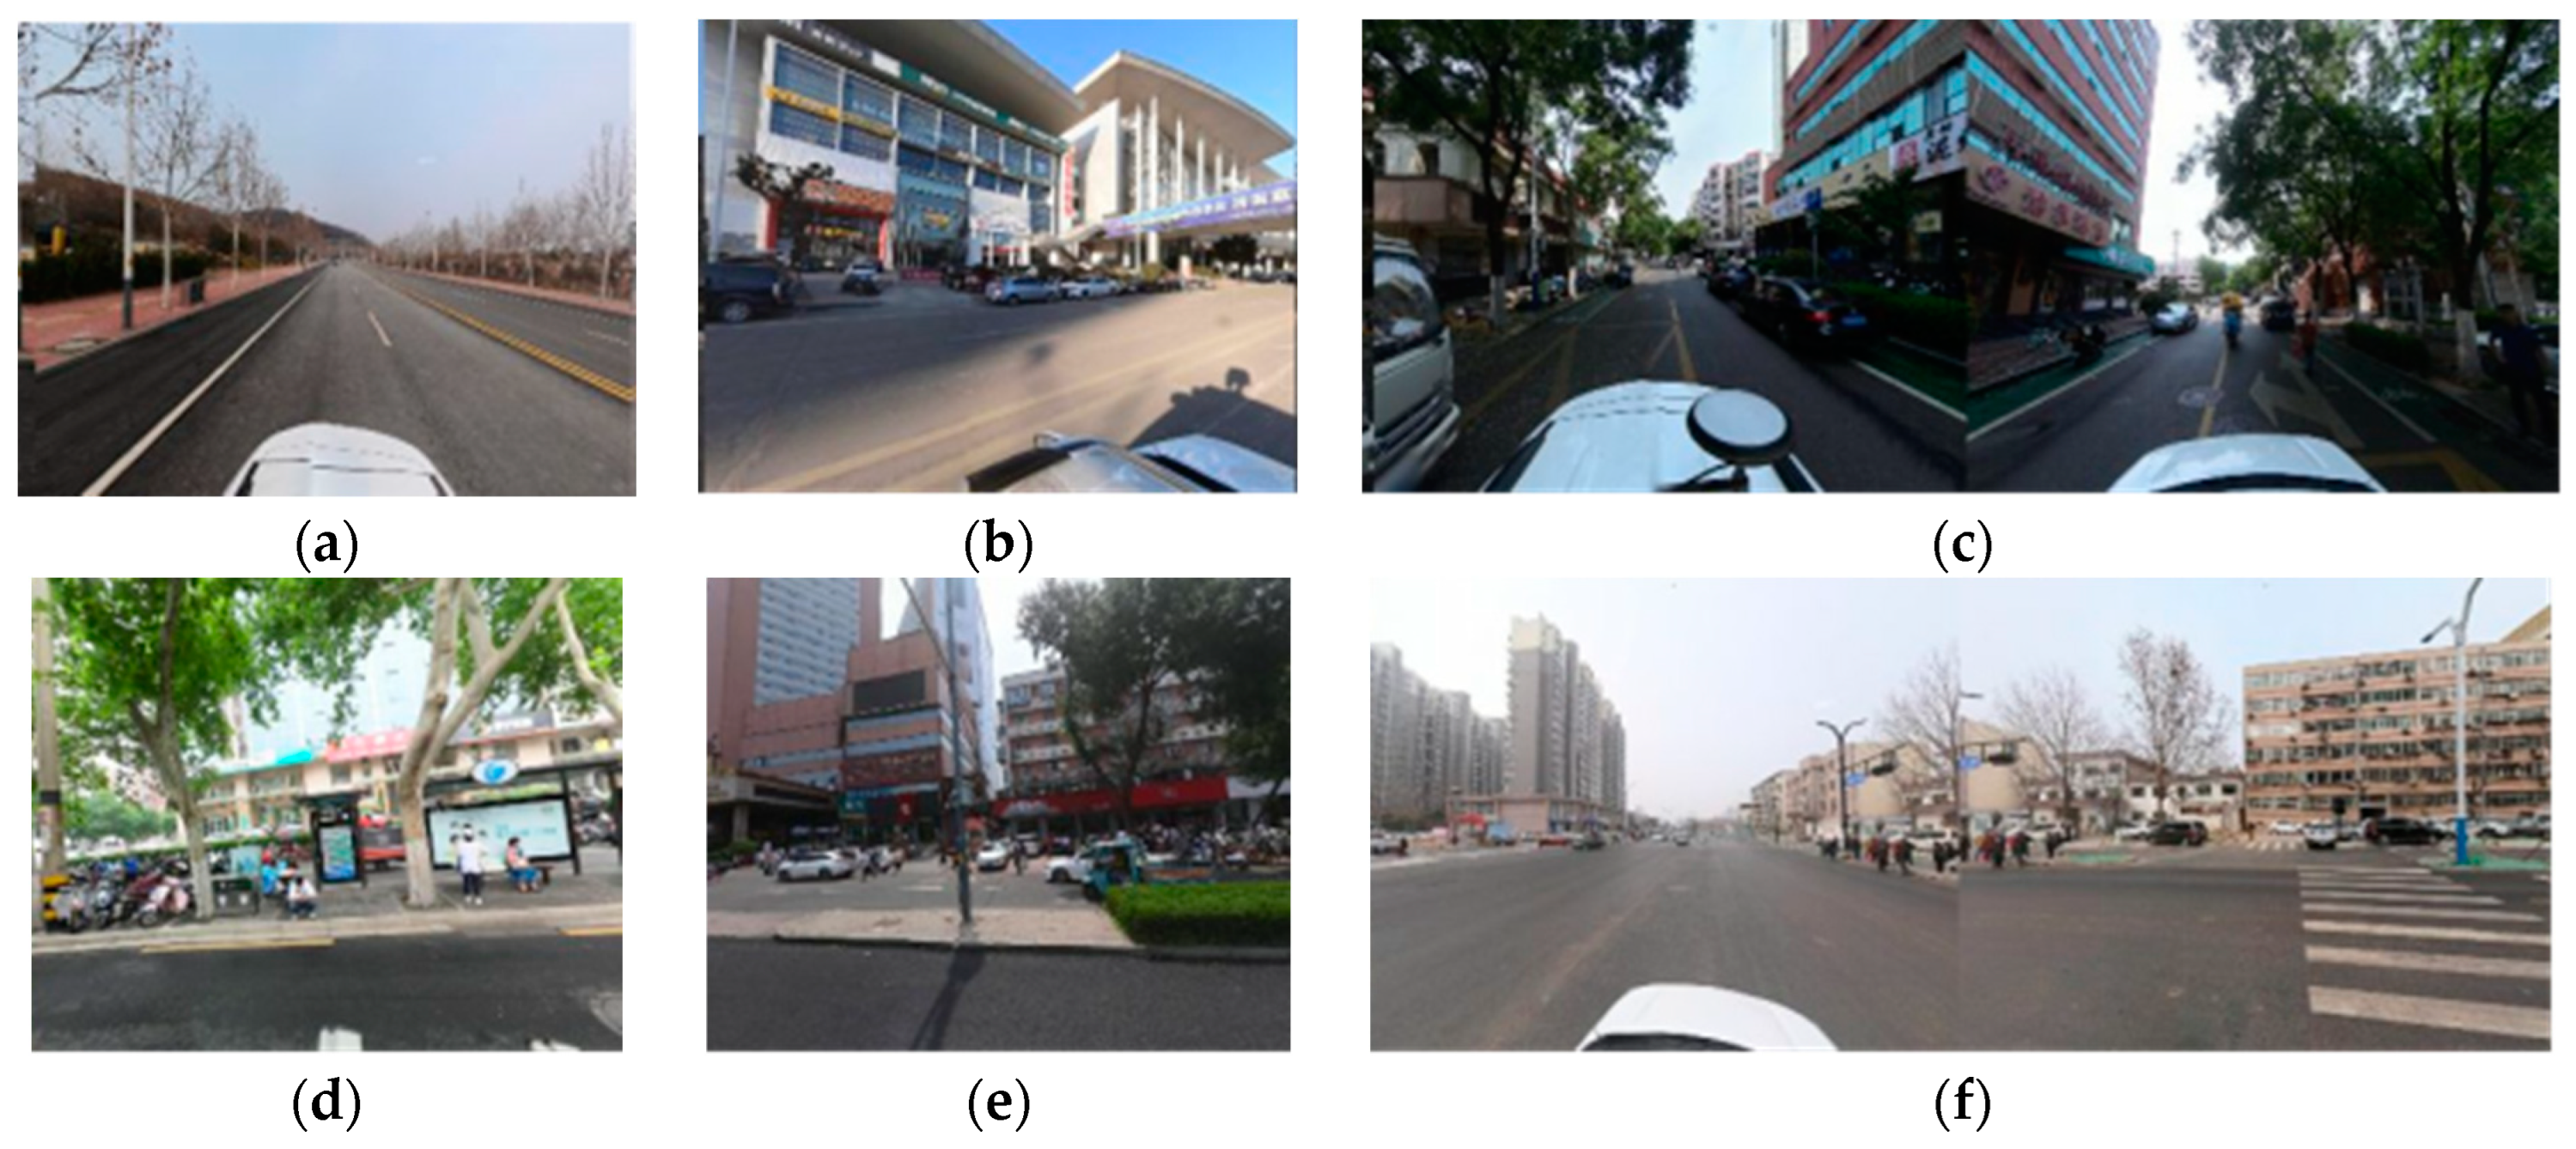
2.2.2. Collection of Street View Image Data
2.2.3. MIT Places Pulse Dataset
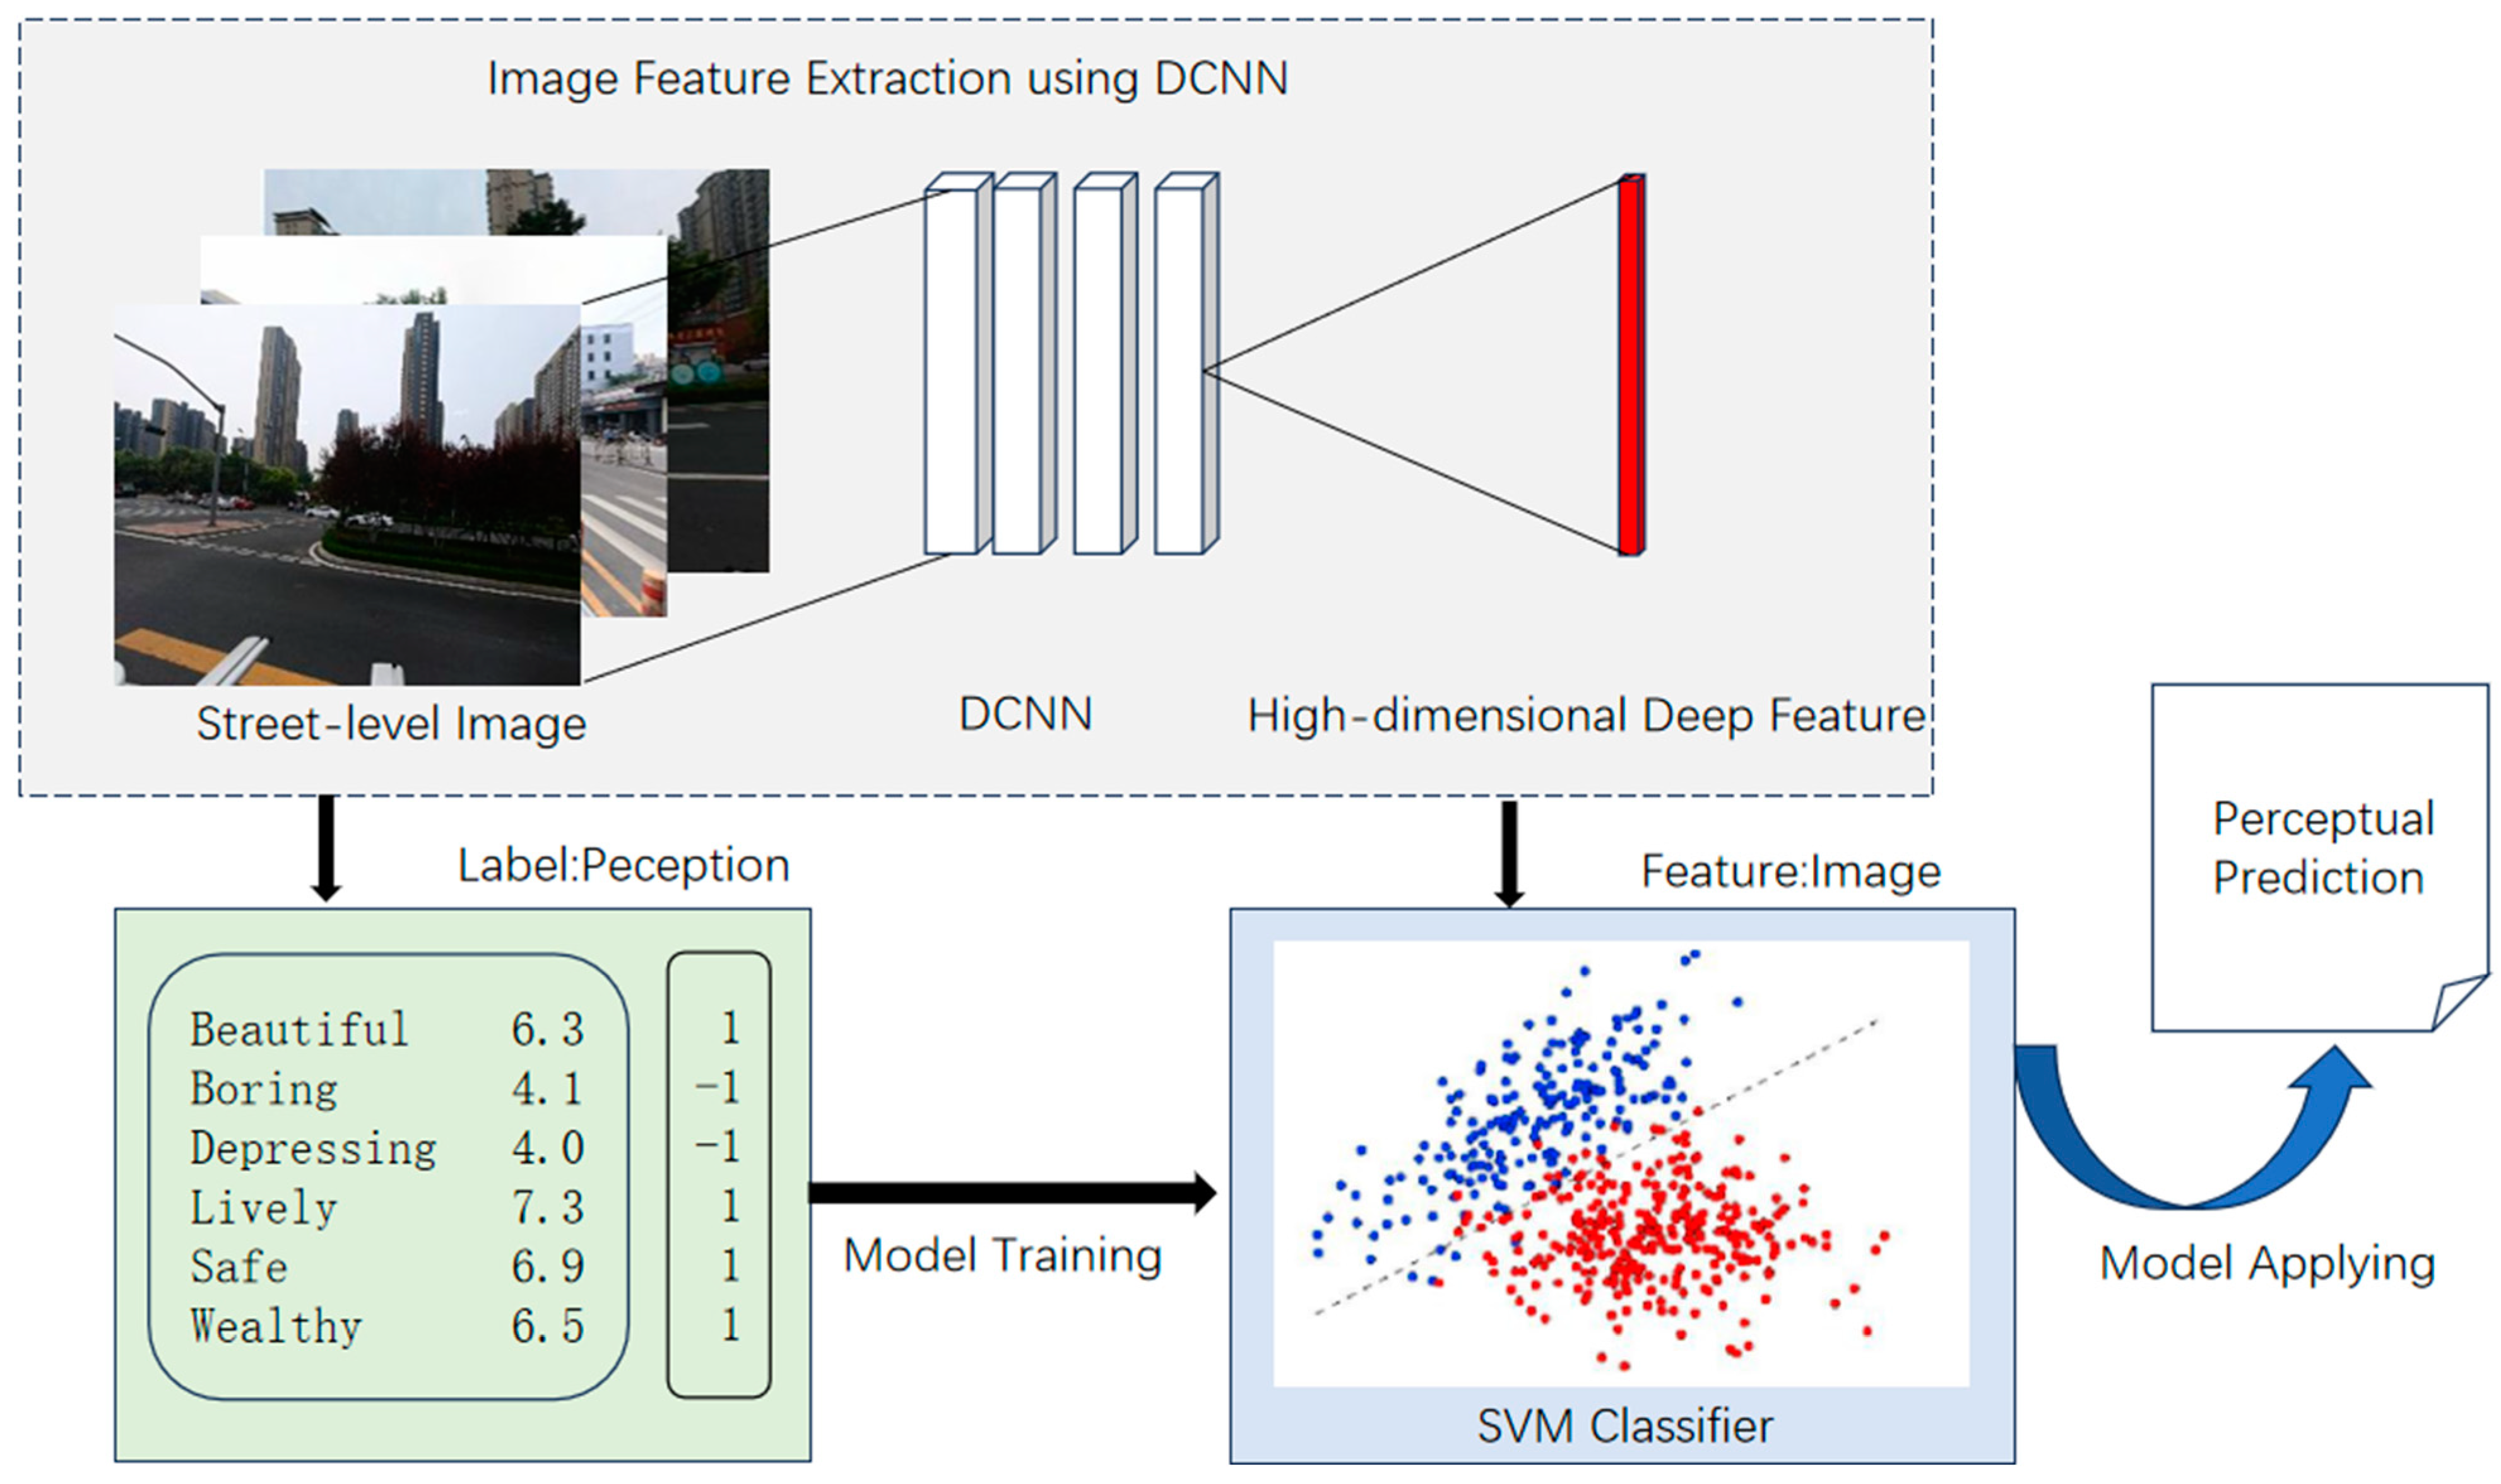
2.3. Image-Aware Score Calculation and Classification
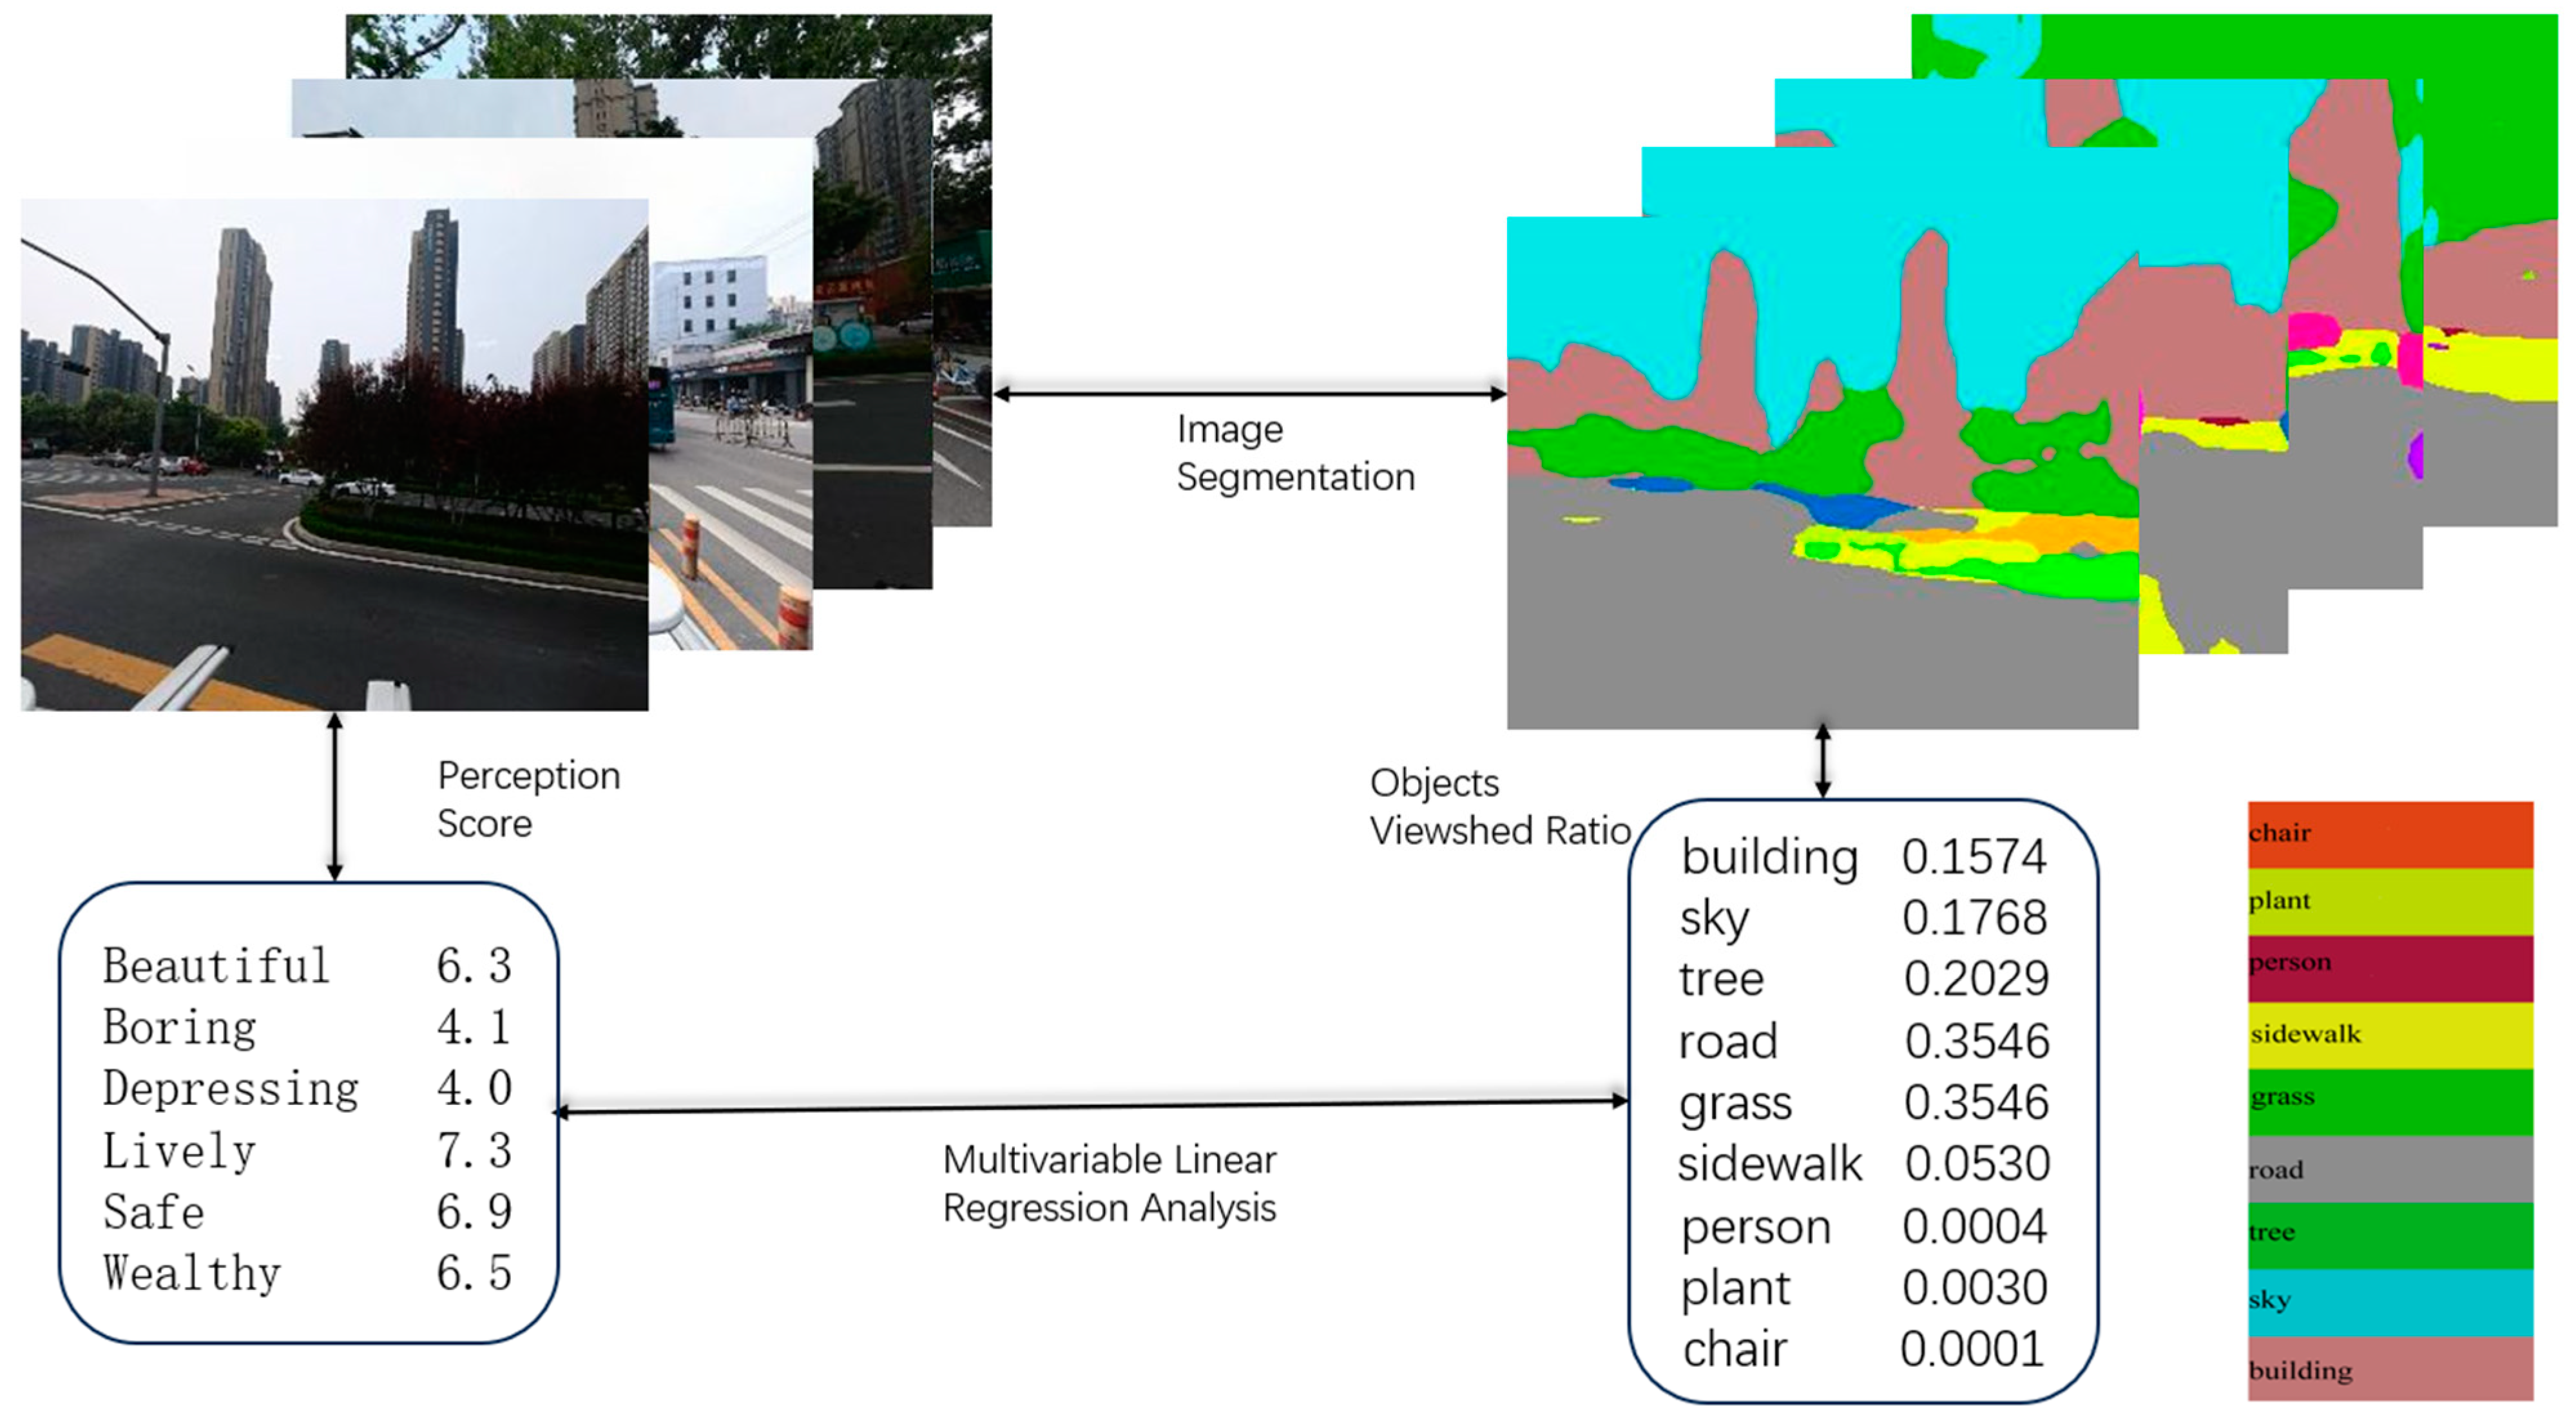
2.4. PSPNet
2.5. Modeling the Effects of Street Environments on Emotional States in Metropolitan Areas
2.6. Assessment of the Impact of Streetscape Elements on Emotional States
2.7. Urban Color Spatial Transformation and Visualization Technology
2.8. Color Metrics Calculation
2.8.1. Color Complexity Metrics
2.8.2. Color Coordination Indicators
2.9. Spatial Analysis Methods
2.9.1. Spatial Autocorrelation Analysis
2.9.2. Least Squares and Geographically Weighted Regression Models
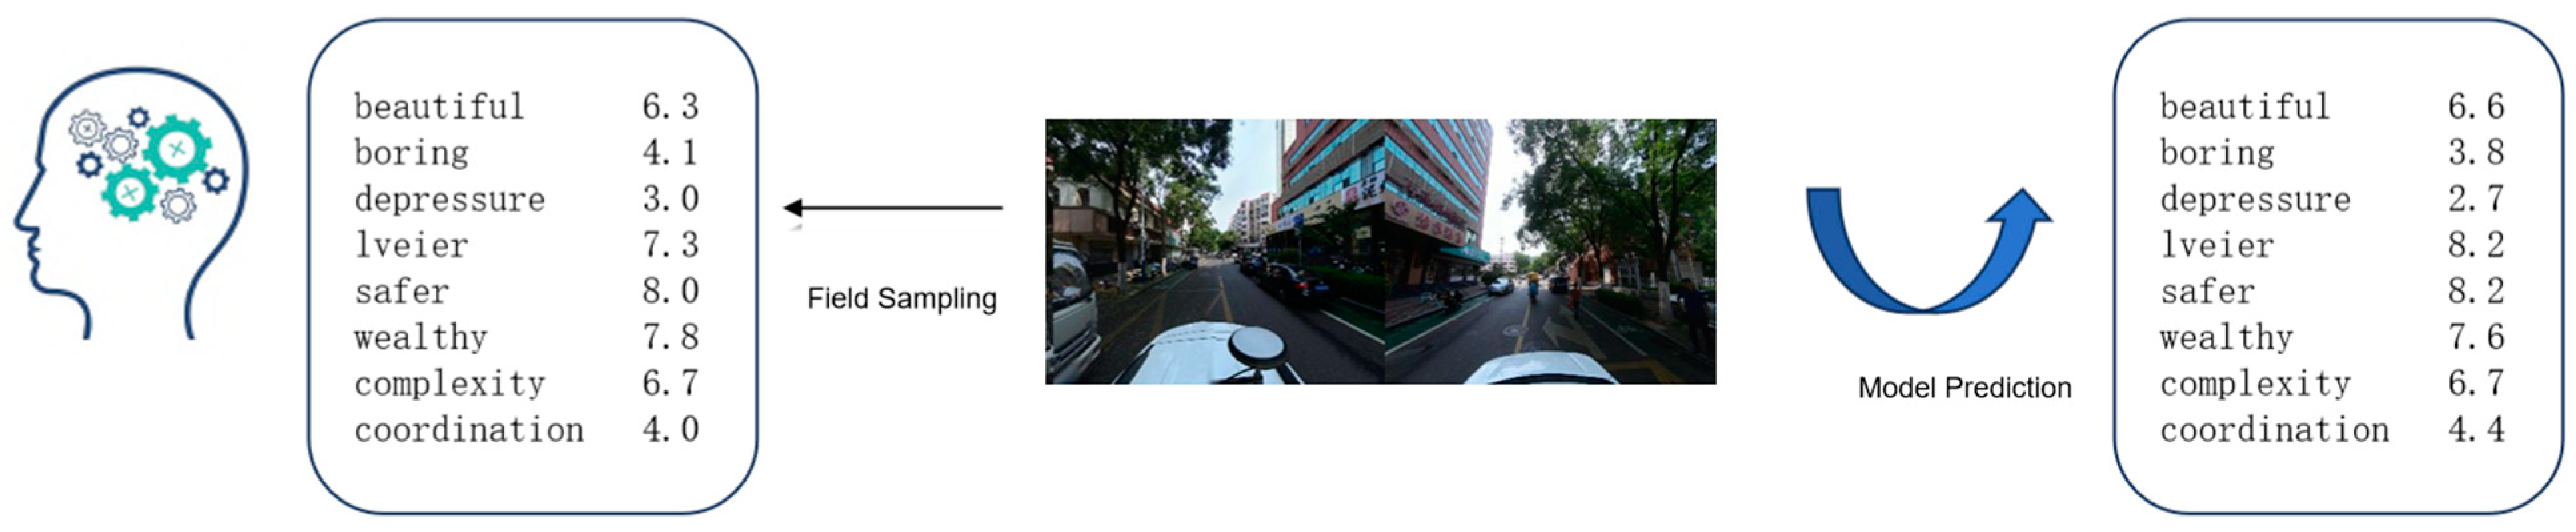
2.10. Model Validation and Evaluation
3. Experiments and Results
3.1. City Color Analysis
3.2. Emotional Perception Analysis
3.2.1. Emotional Relevance Analysis
3.2.2. Spatial Autocorrelation Analysis of Emotions
3.2.3. High/Low Cluster Analysis
3.2.4. Hot Spot Analysis
3.3. Analysis of Color Indicators and Emotional Perception
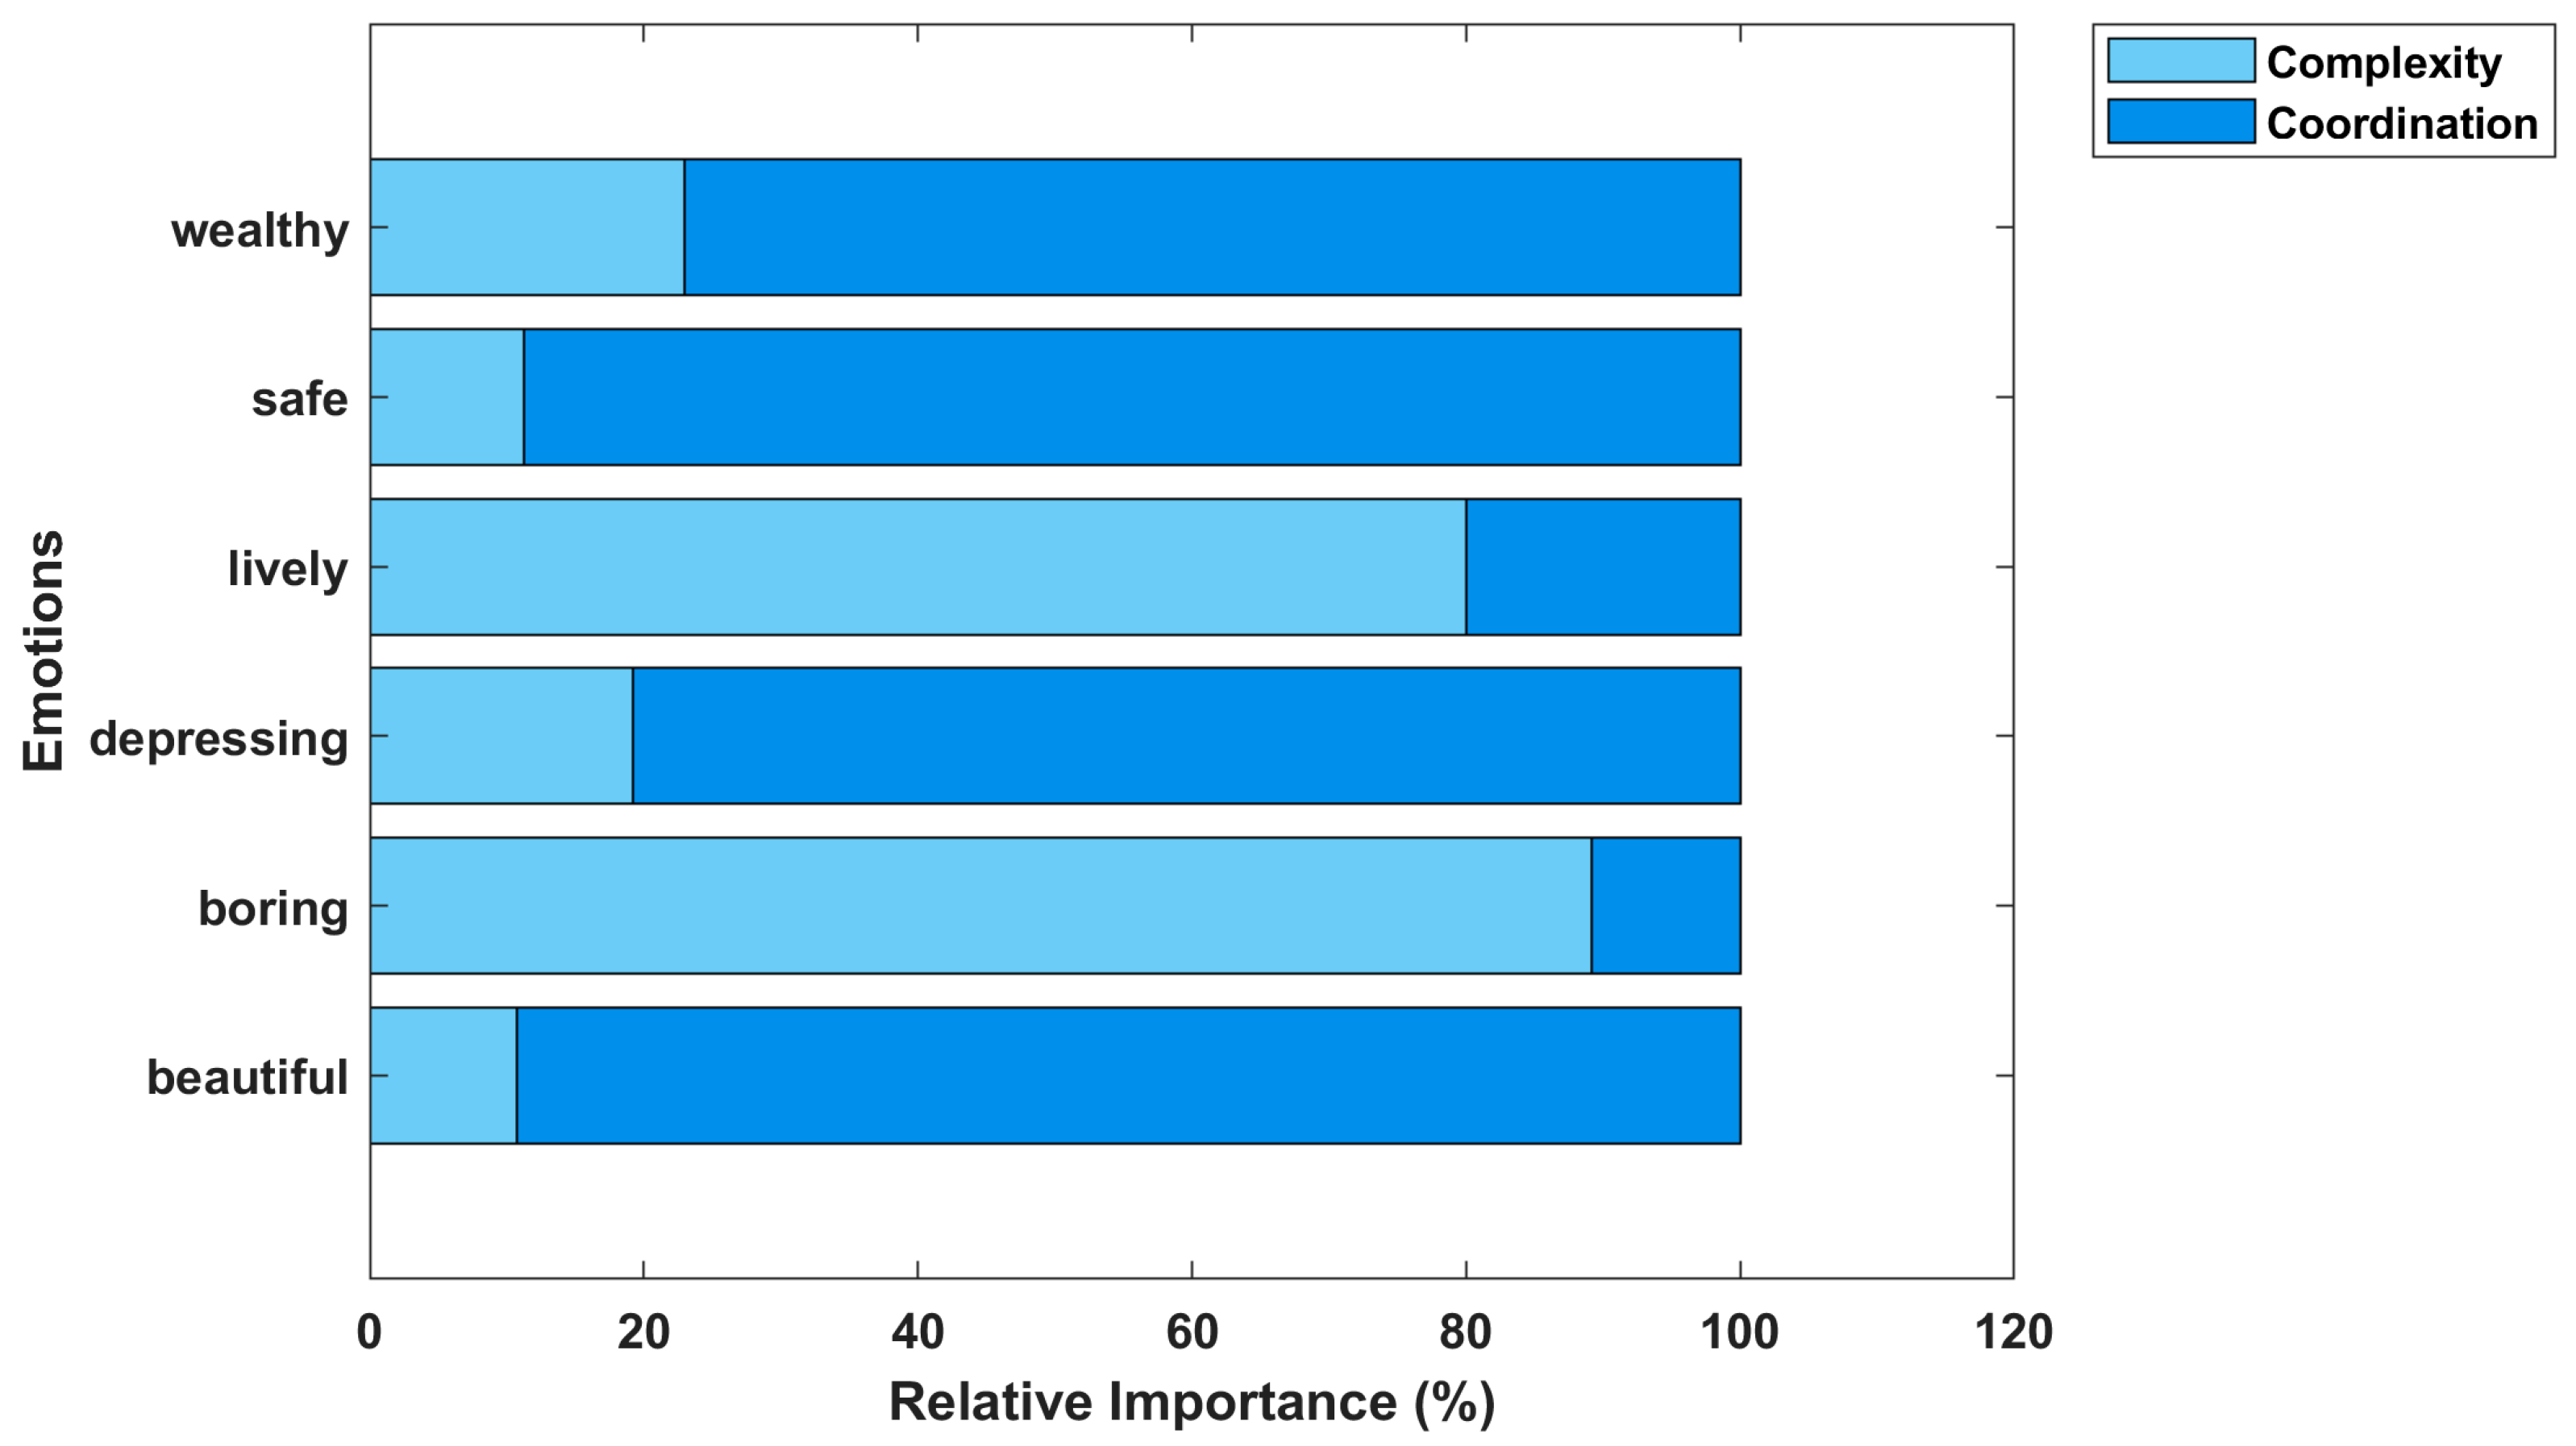
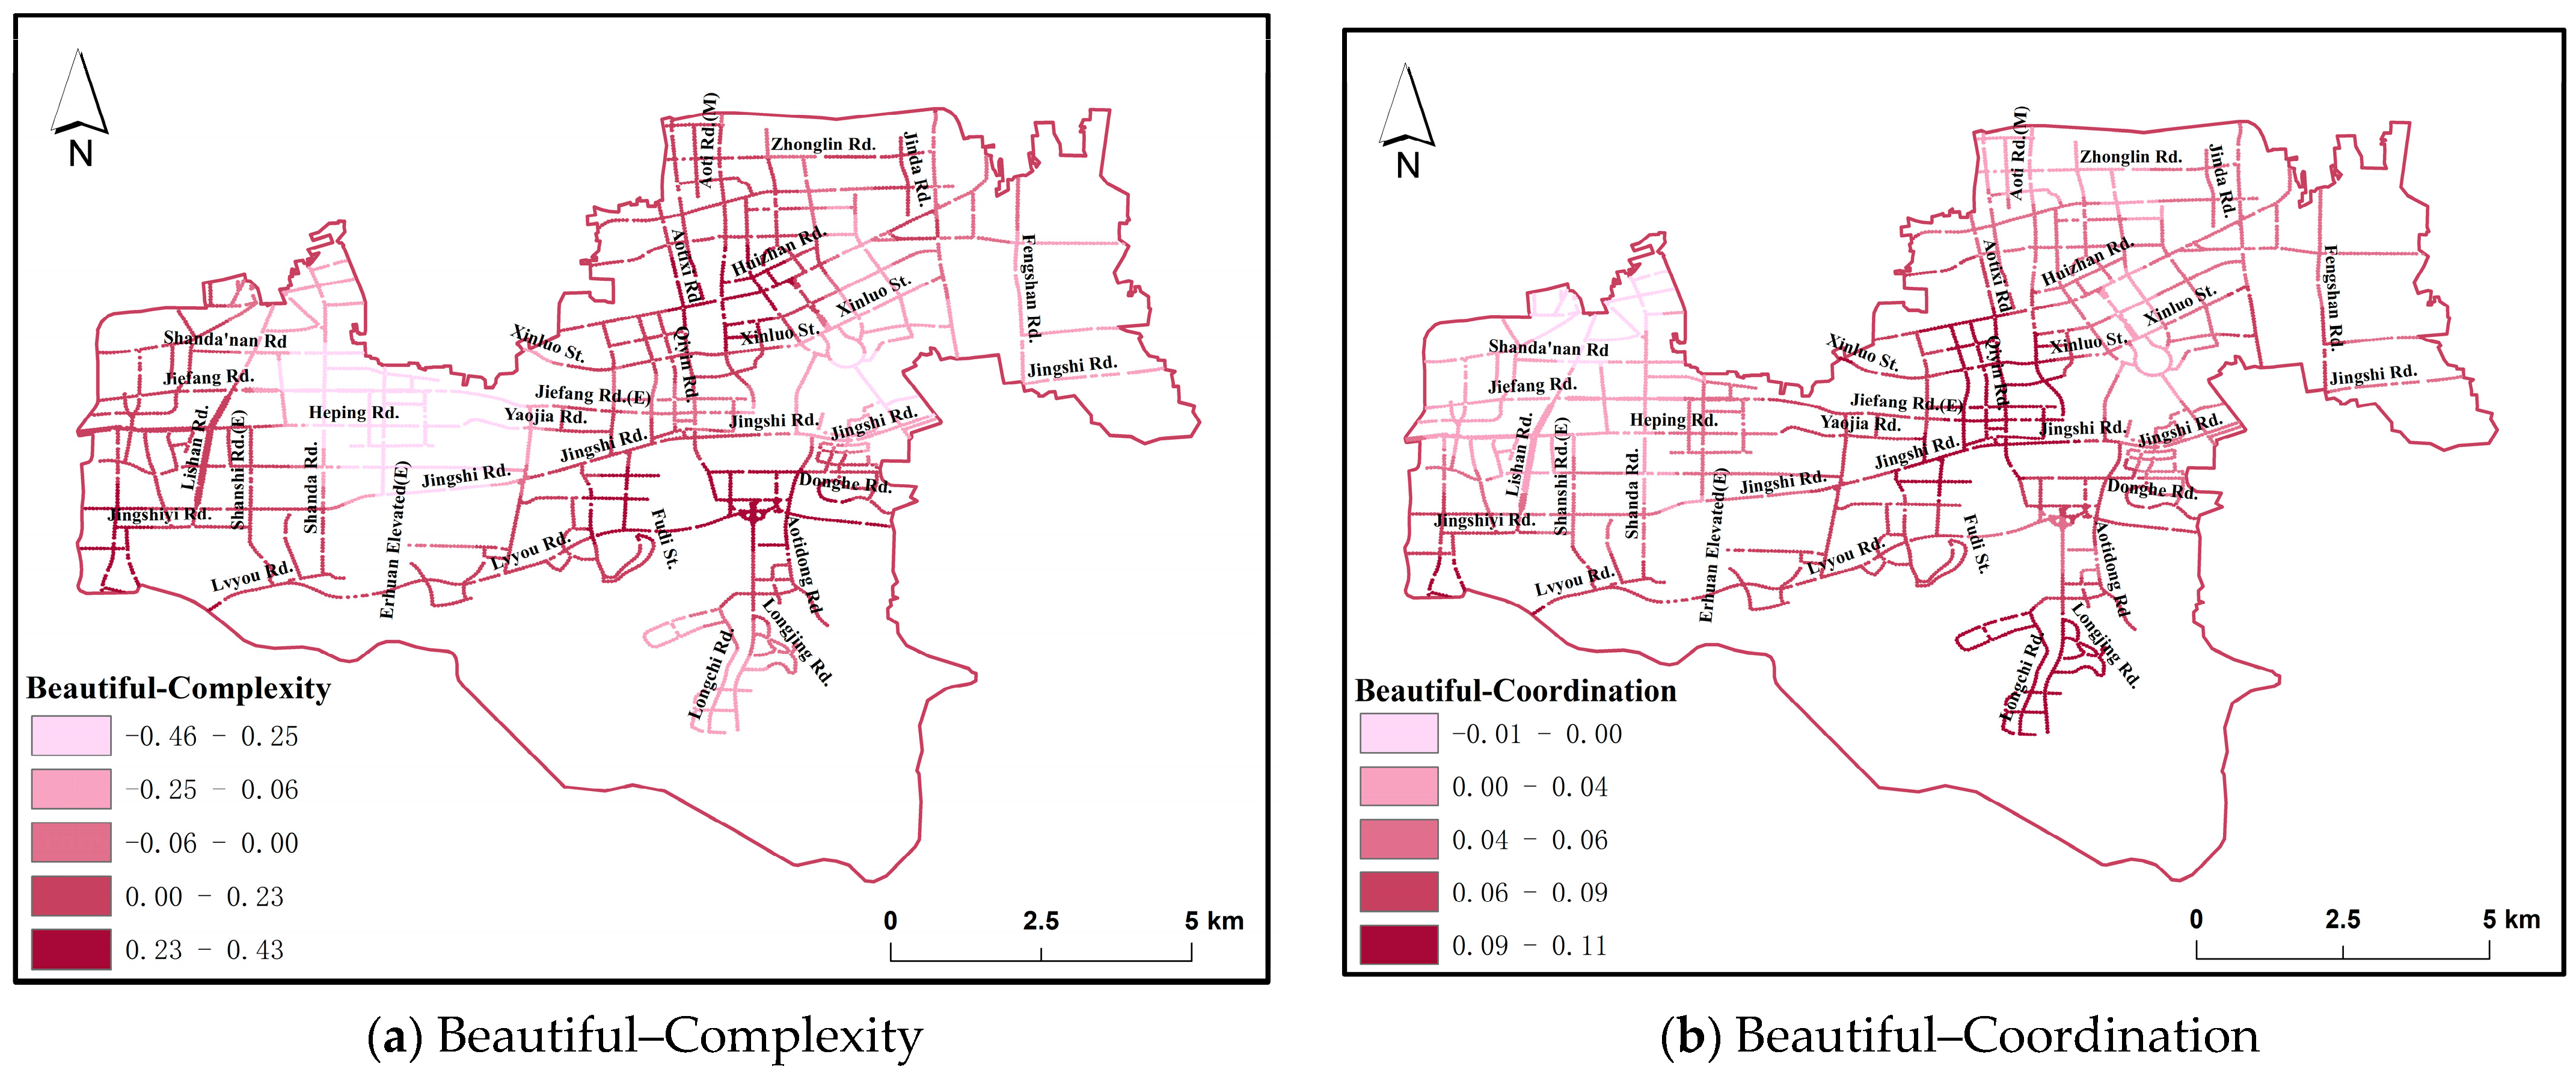
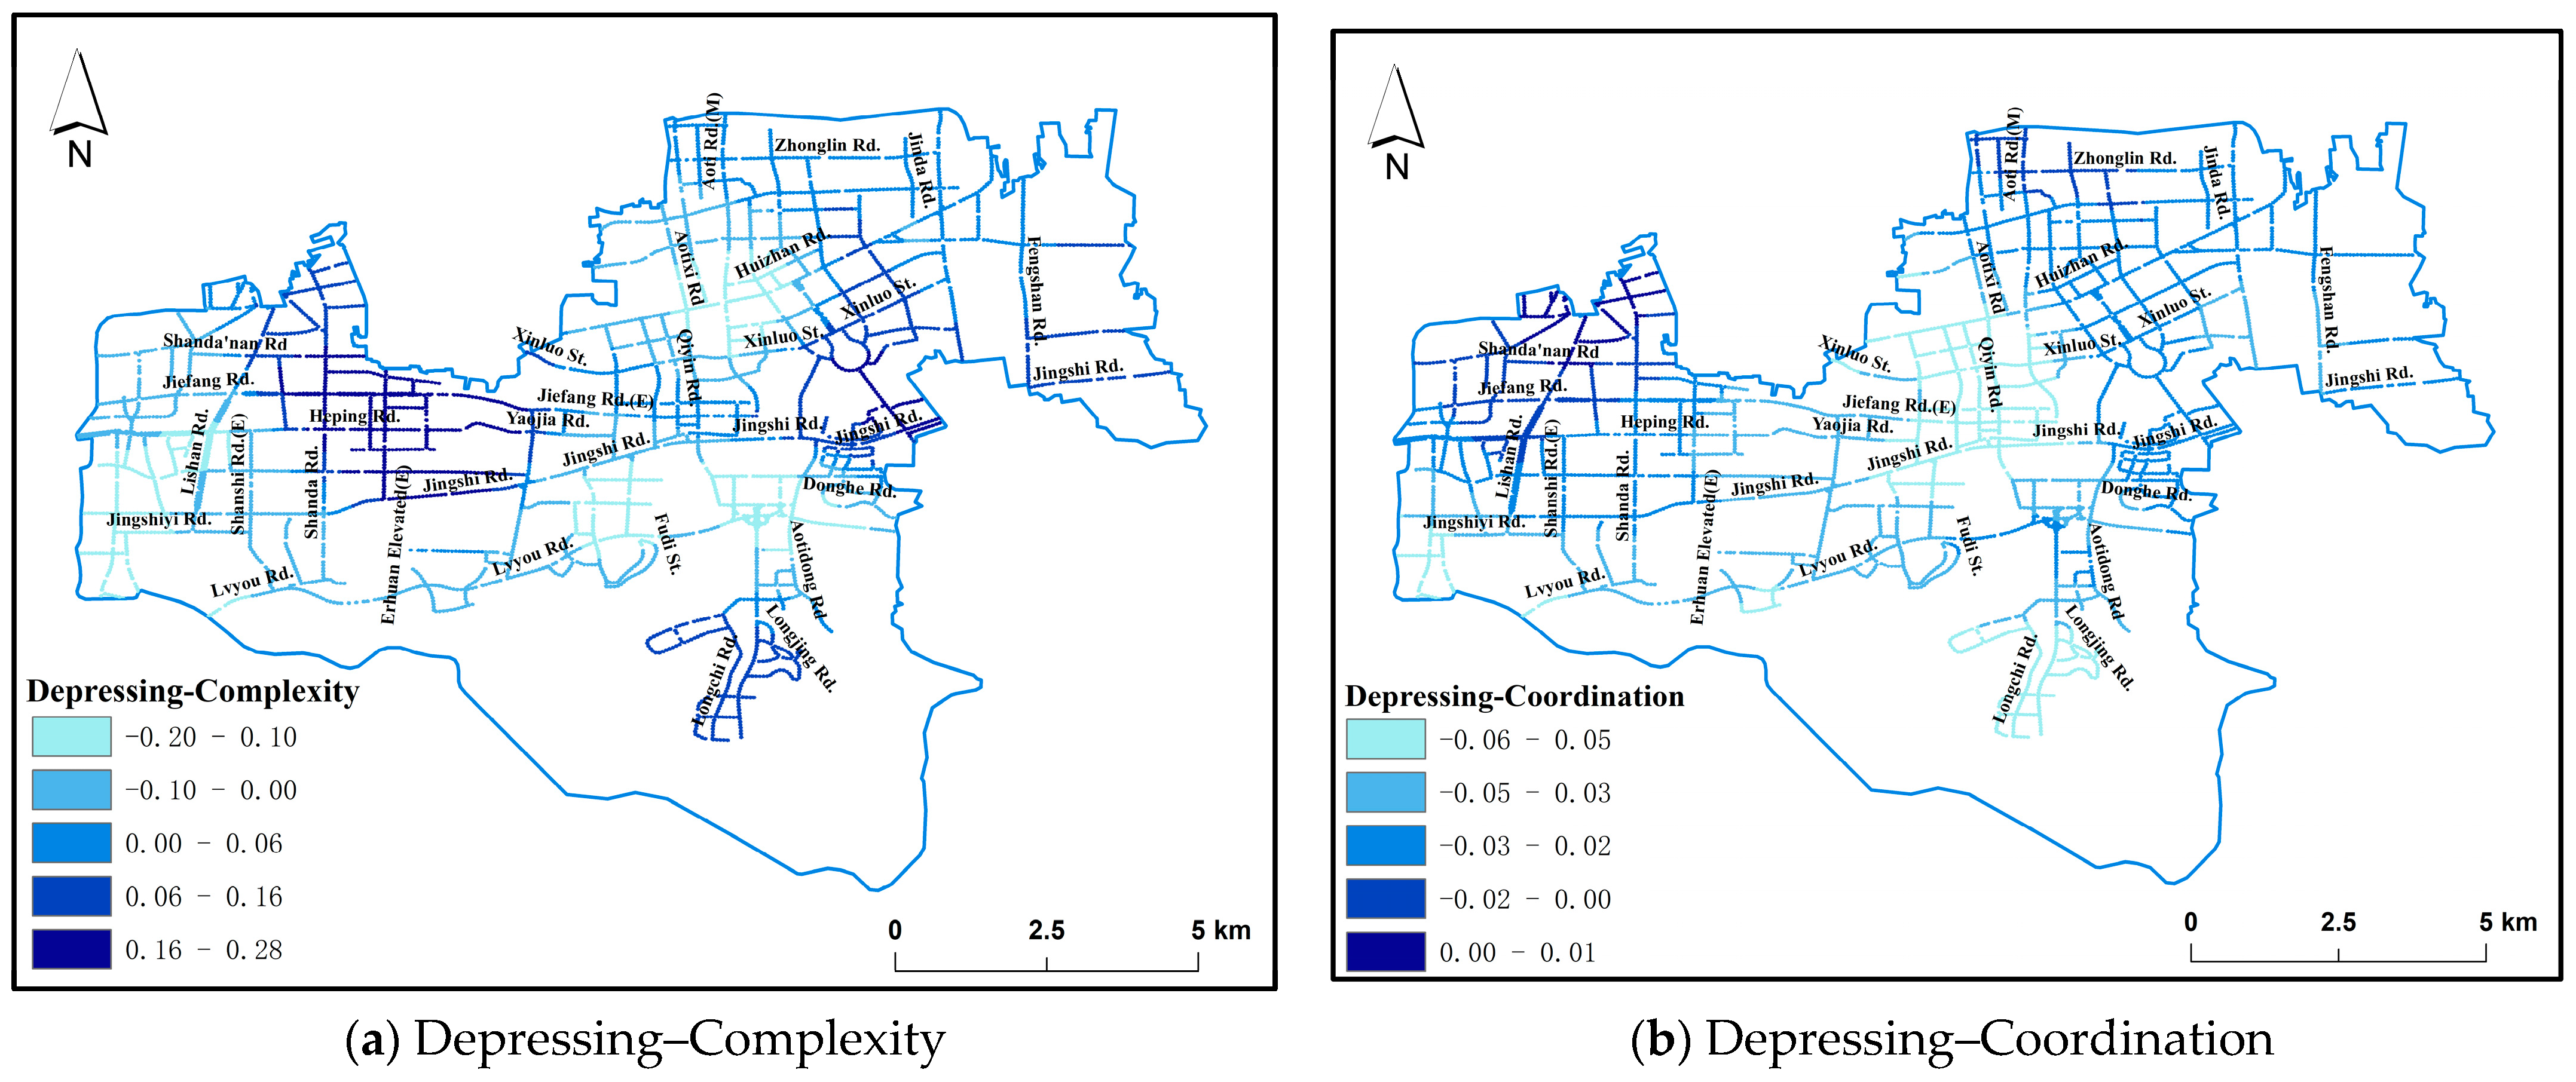
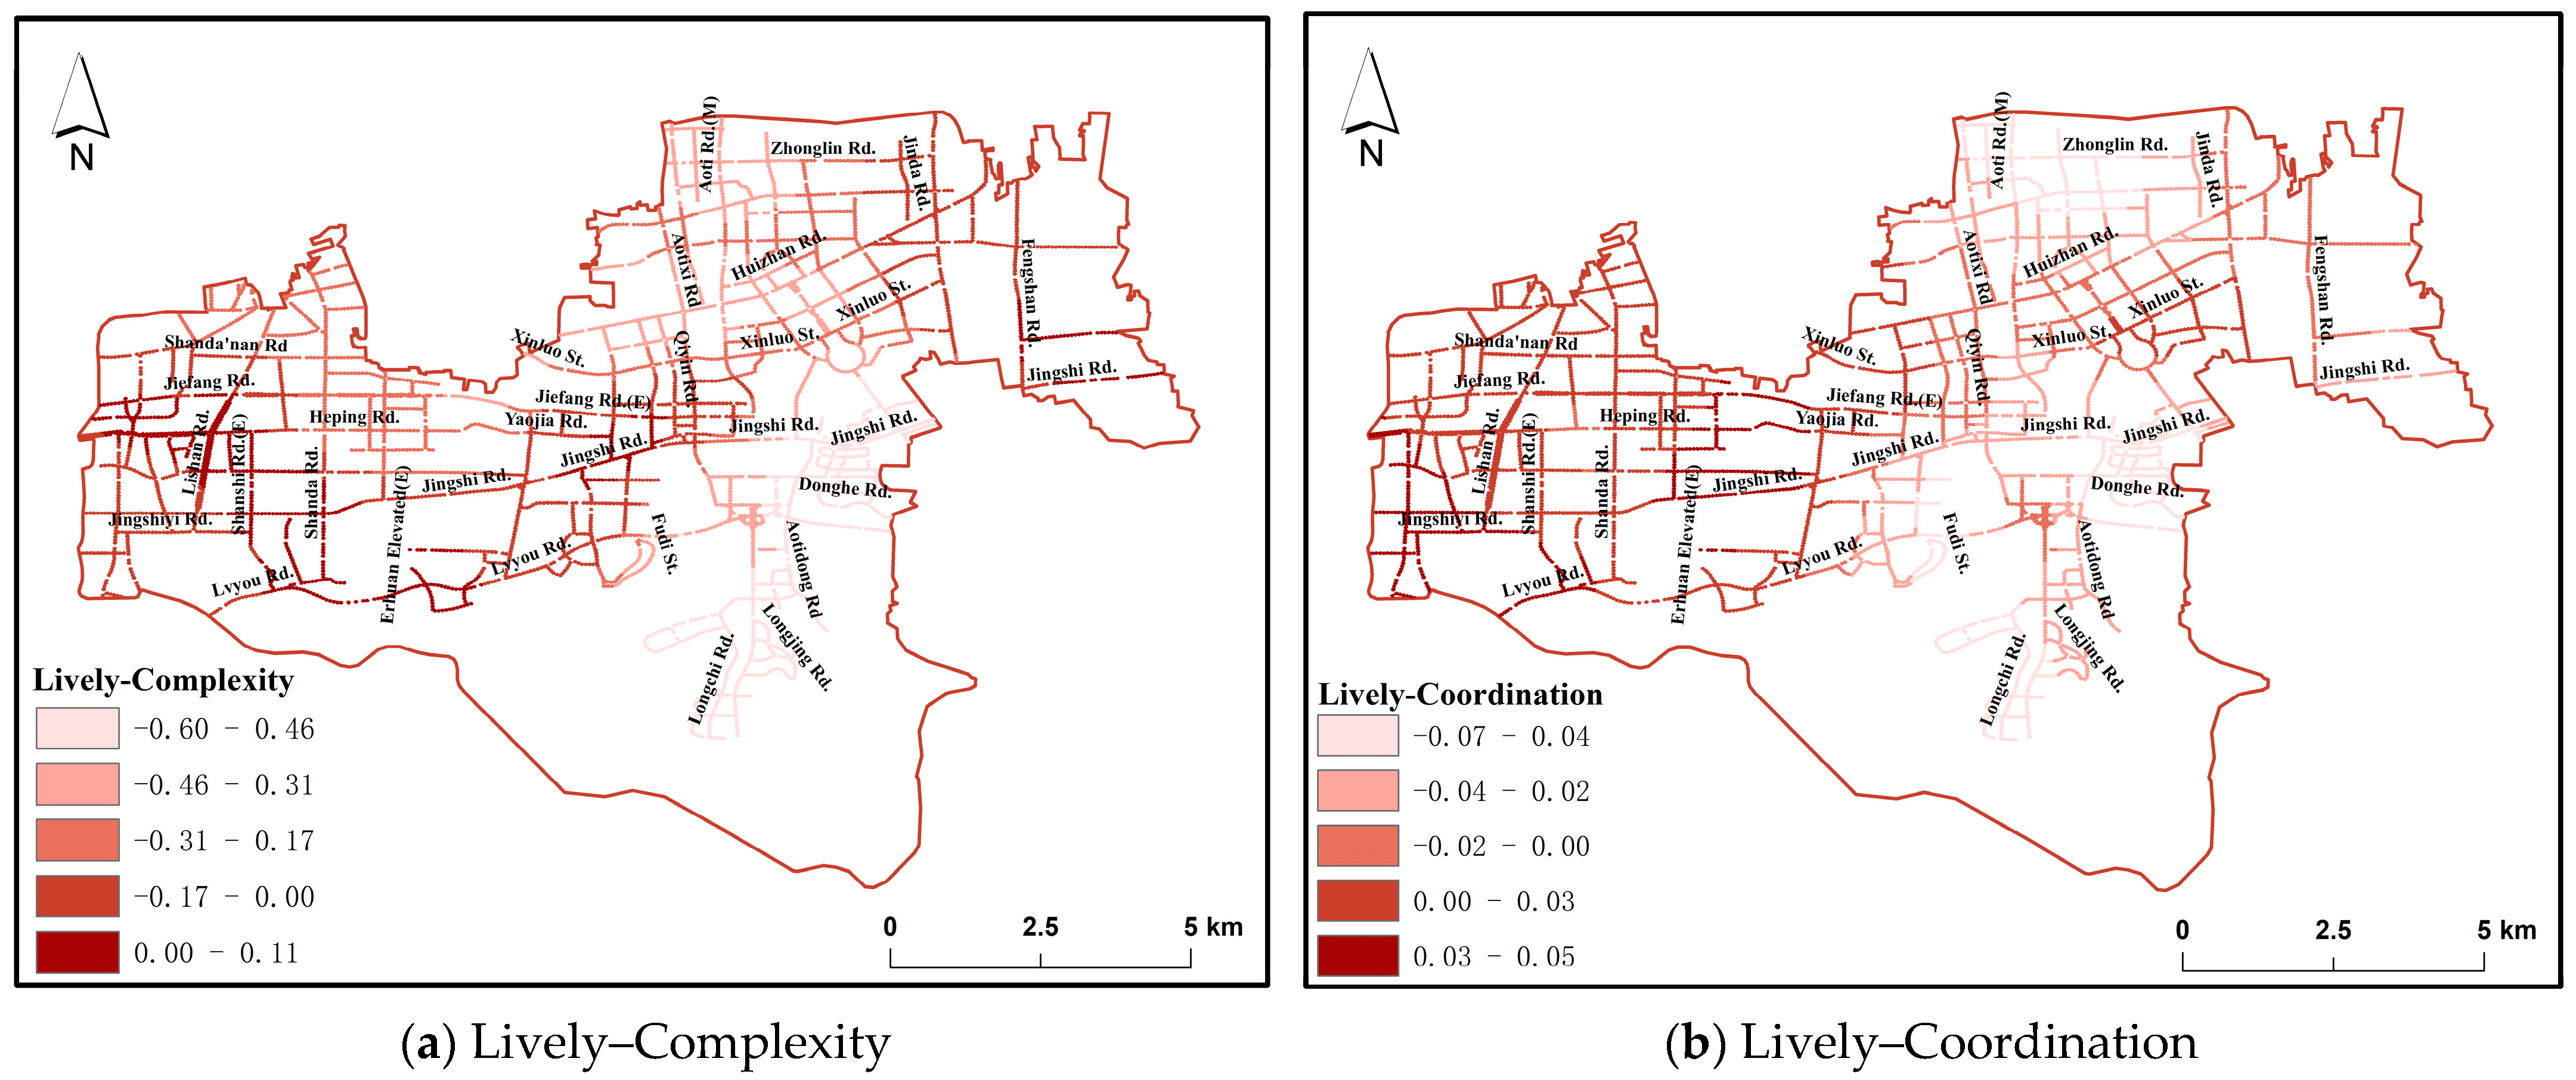
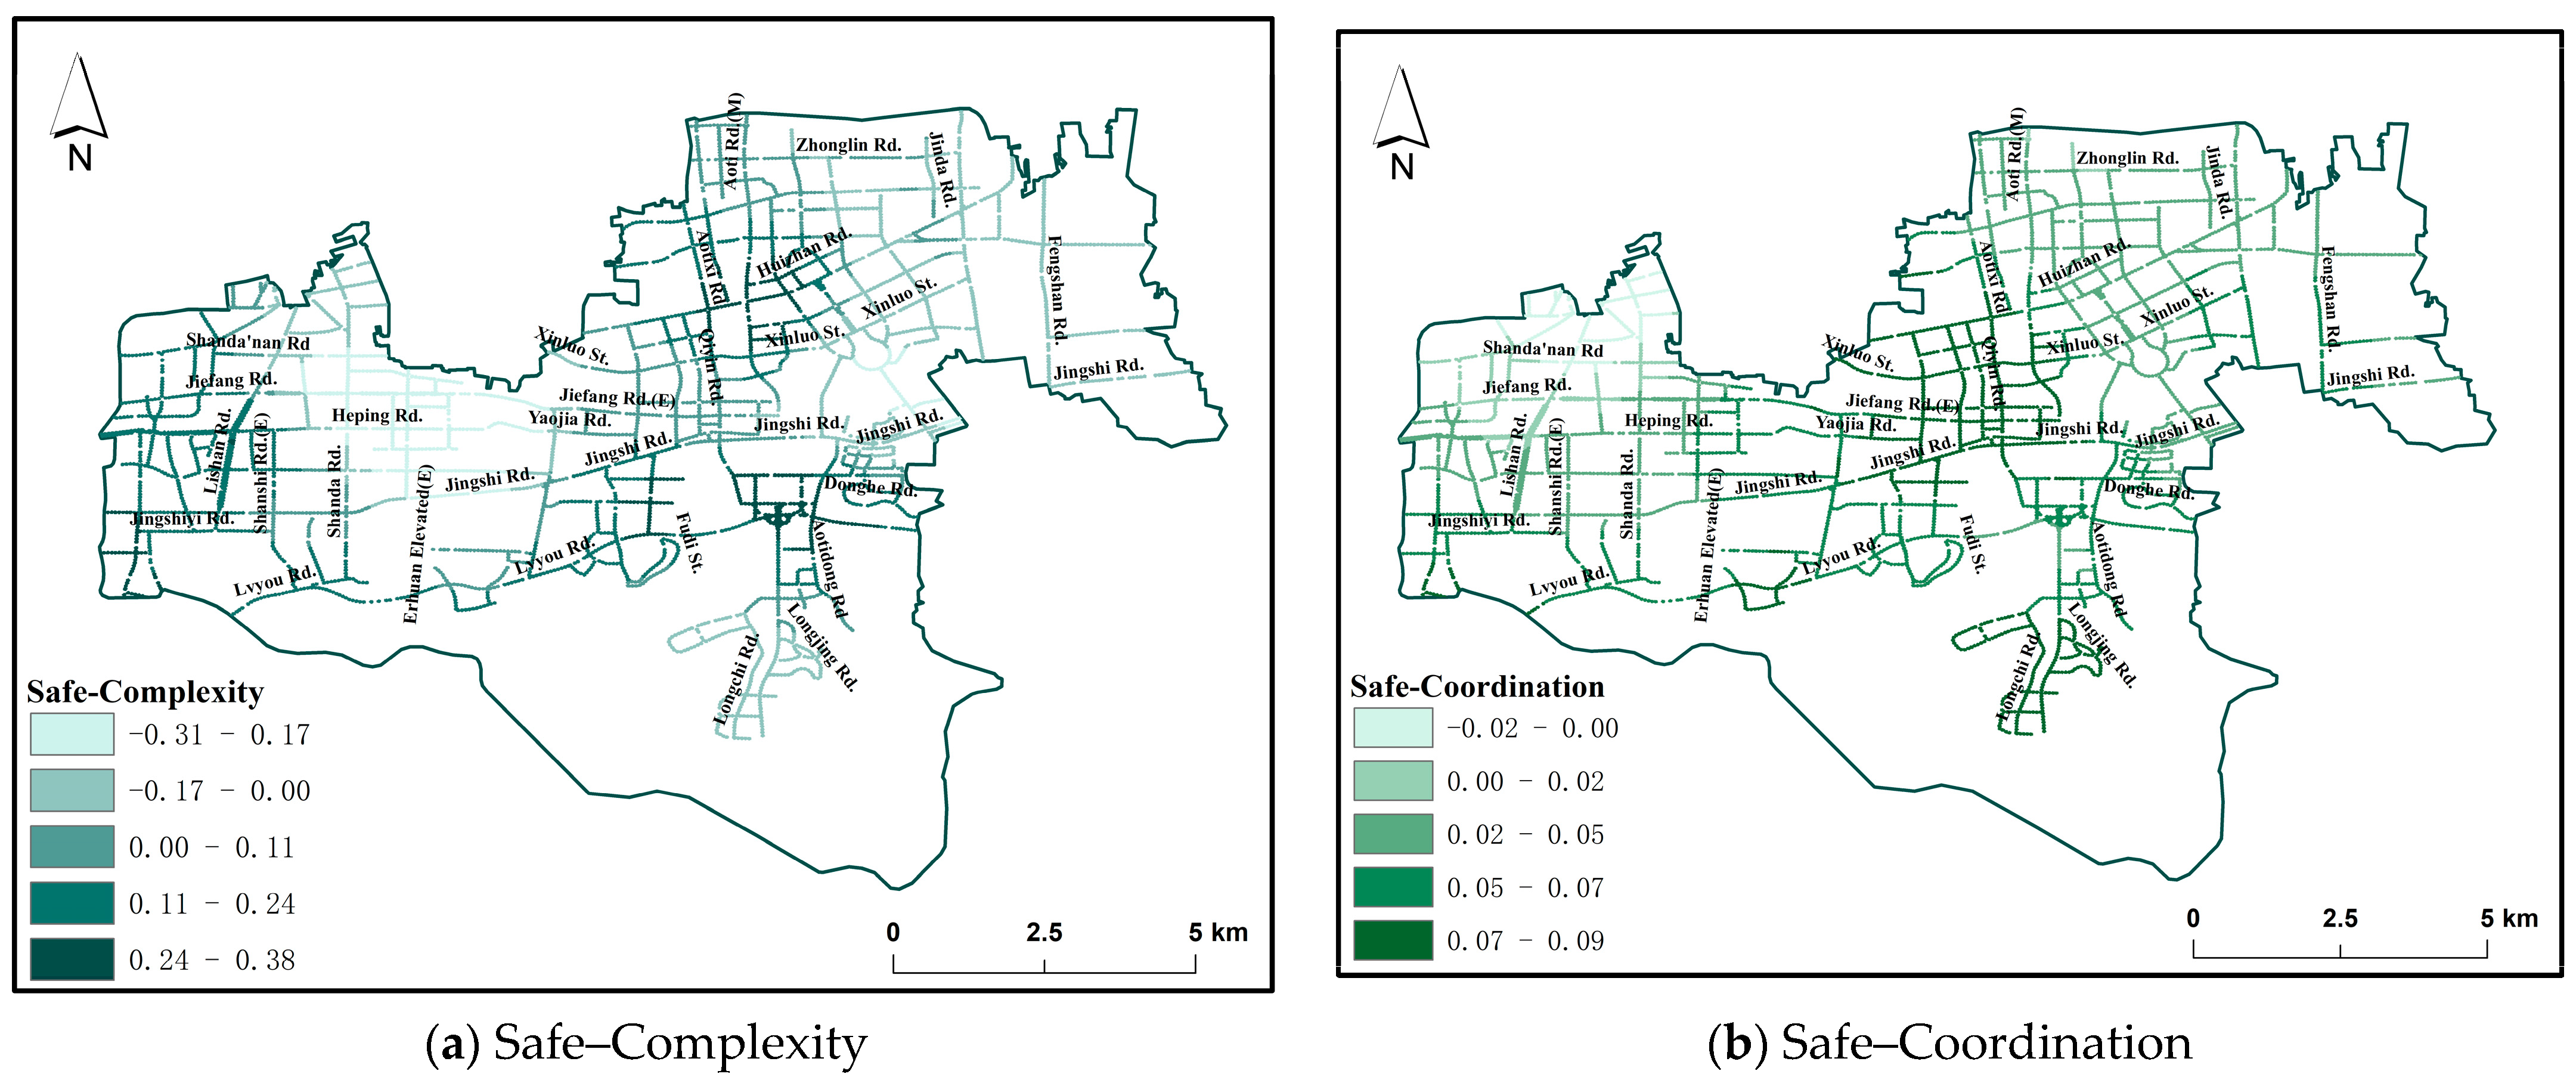
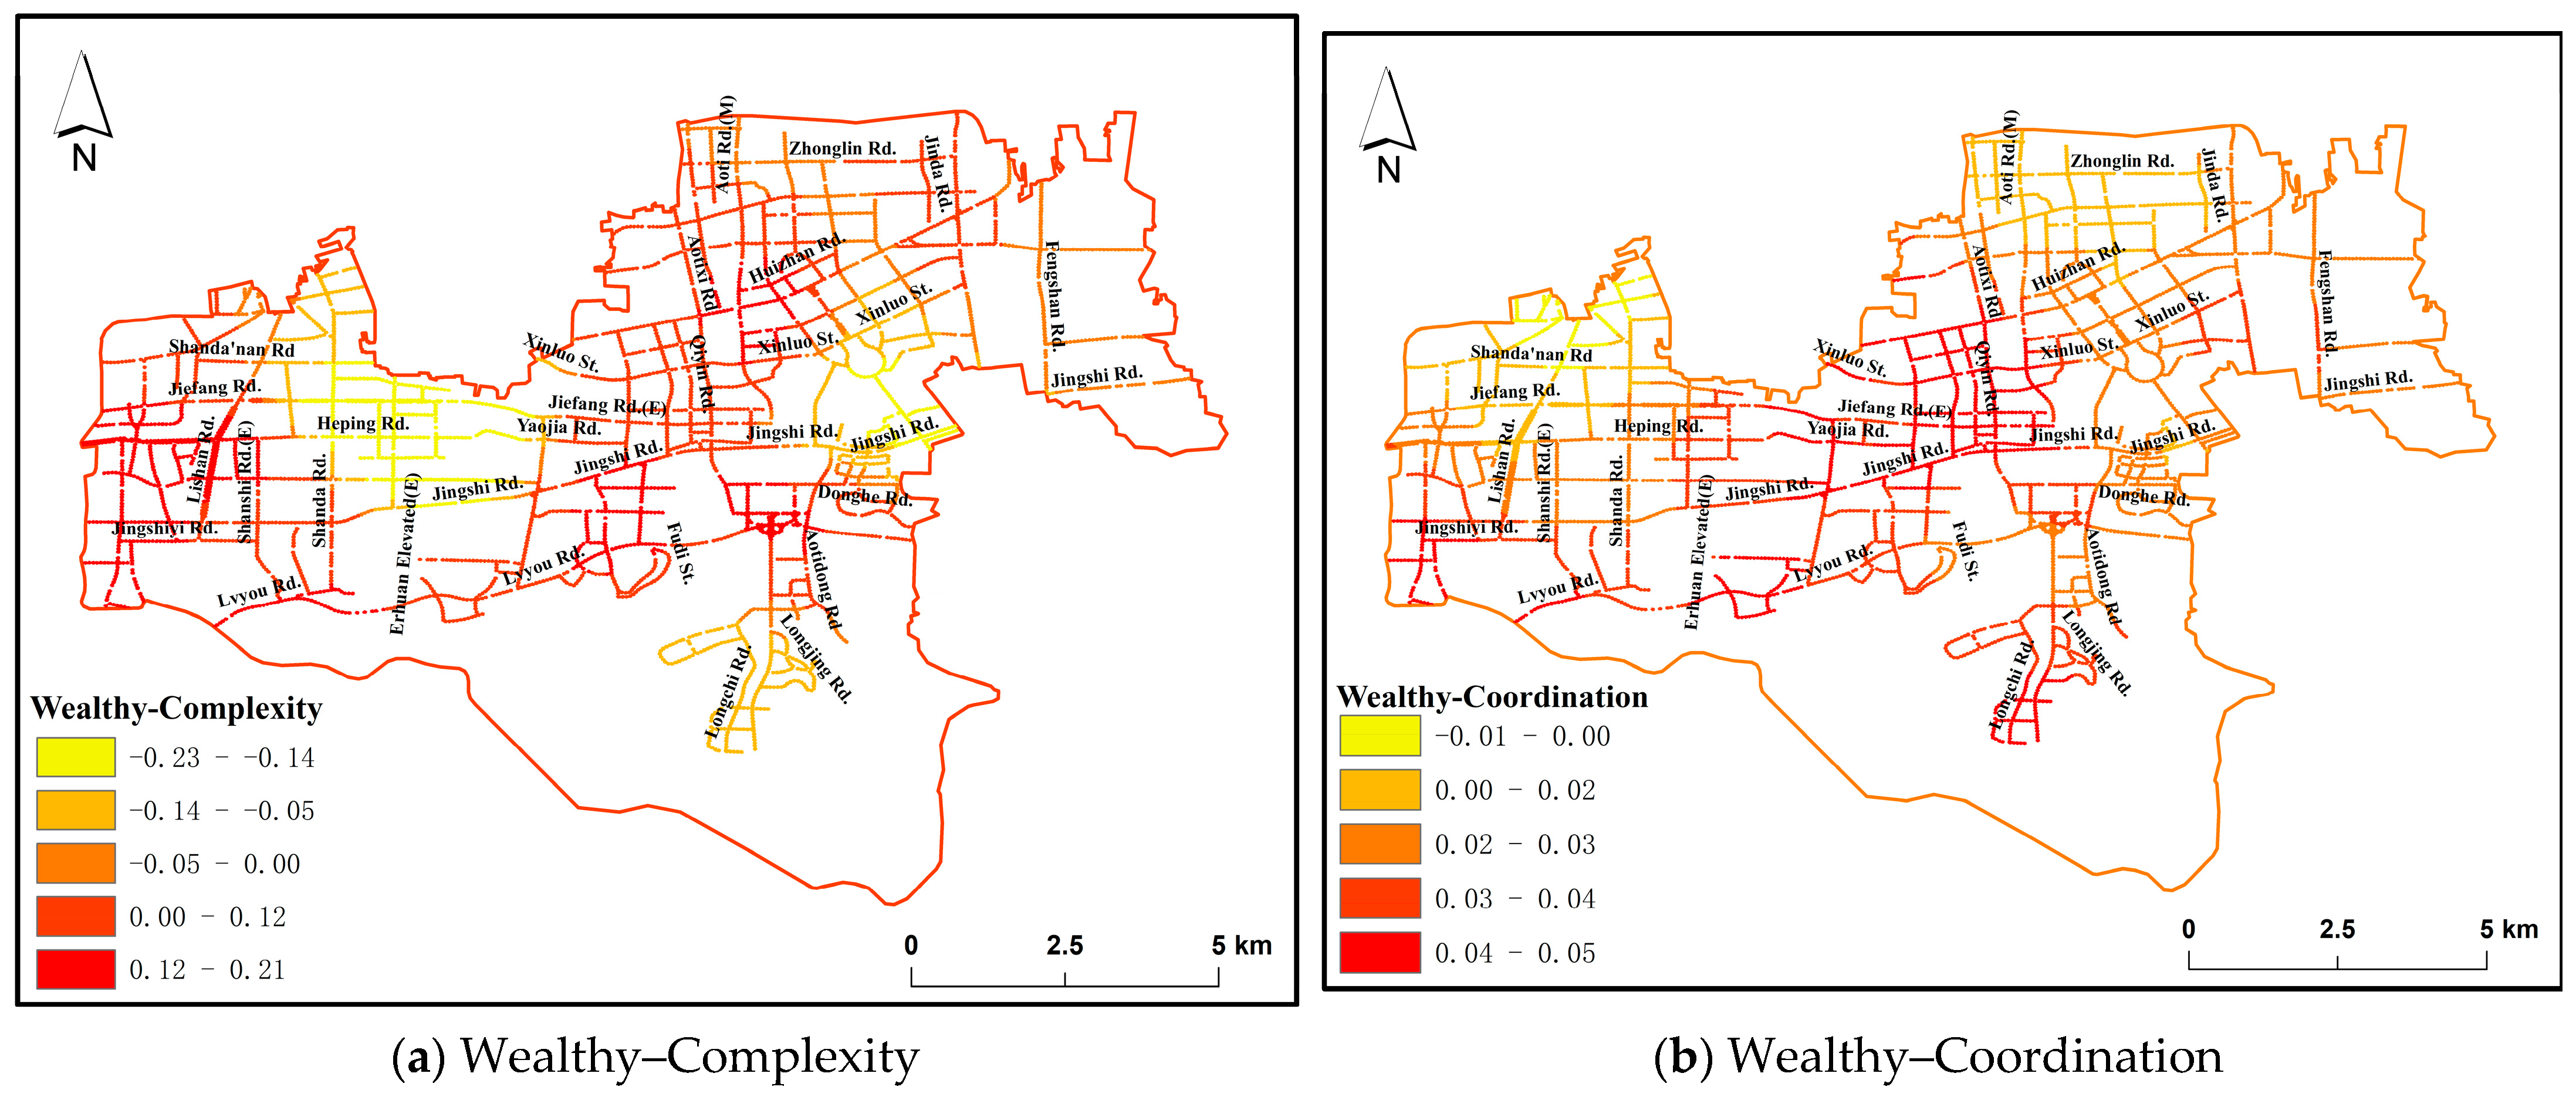
3.3.1. Effect of Color Complexity–Coordination on Emotion Perception
3.3.2. OLS Regression Analysis Versus Geographically Weighted Regression Analysis
4. Discussion and Conclusions
- (1)
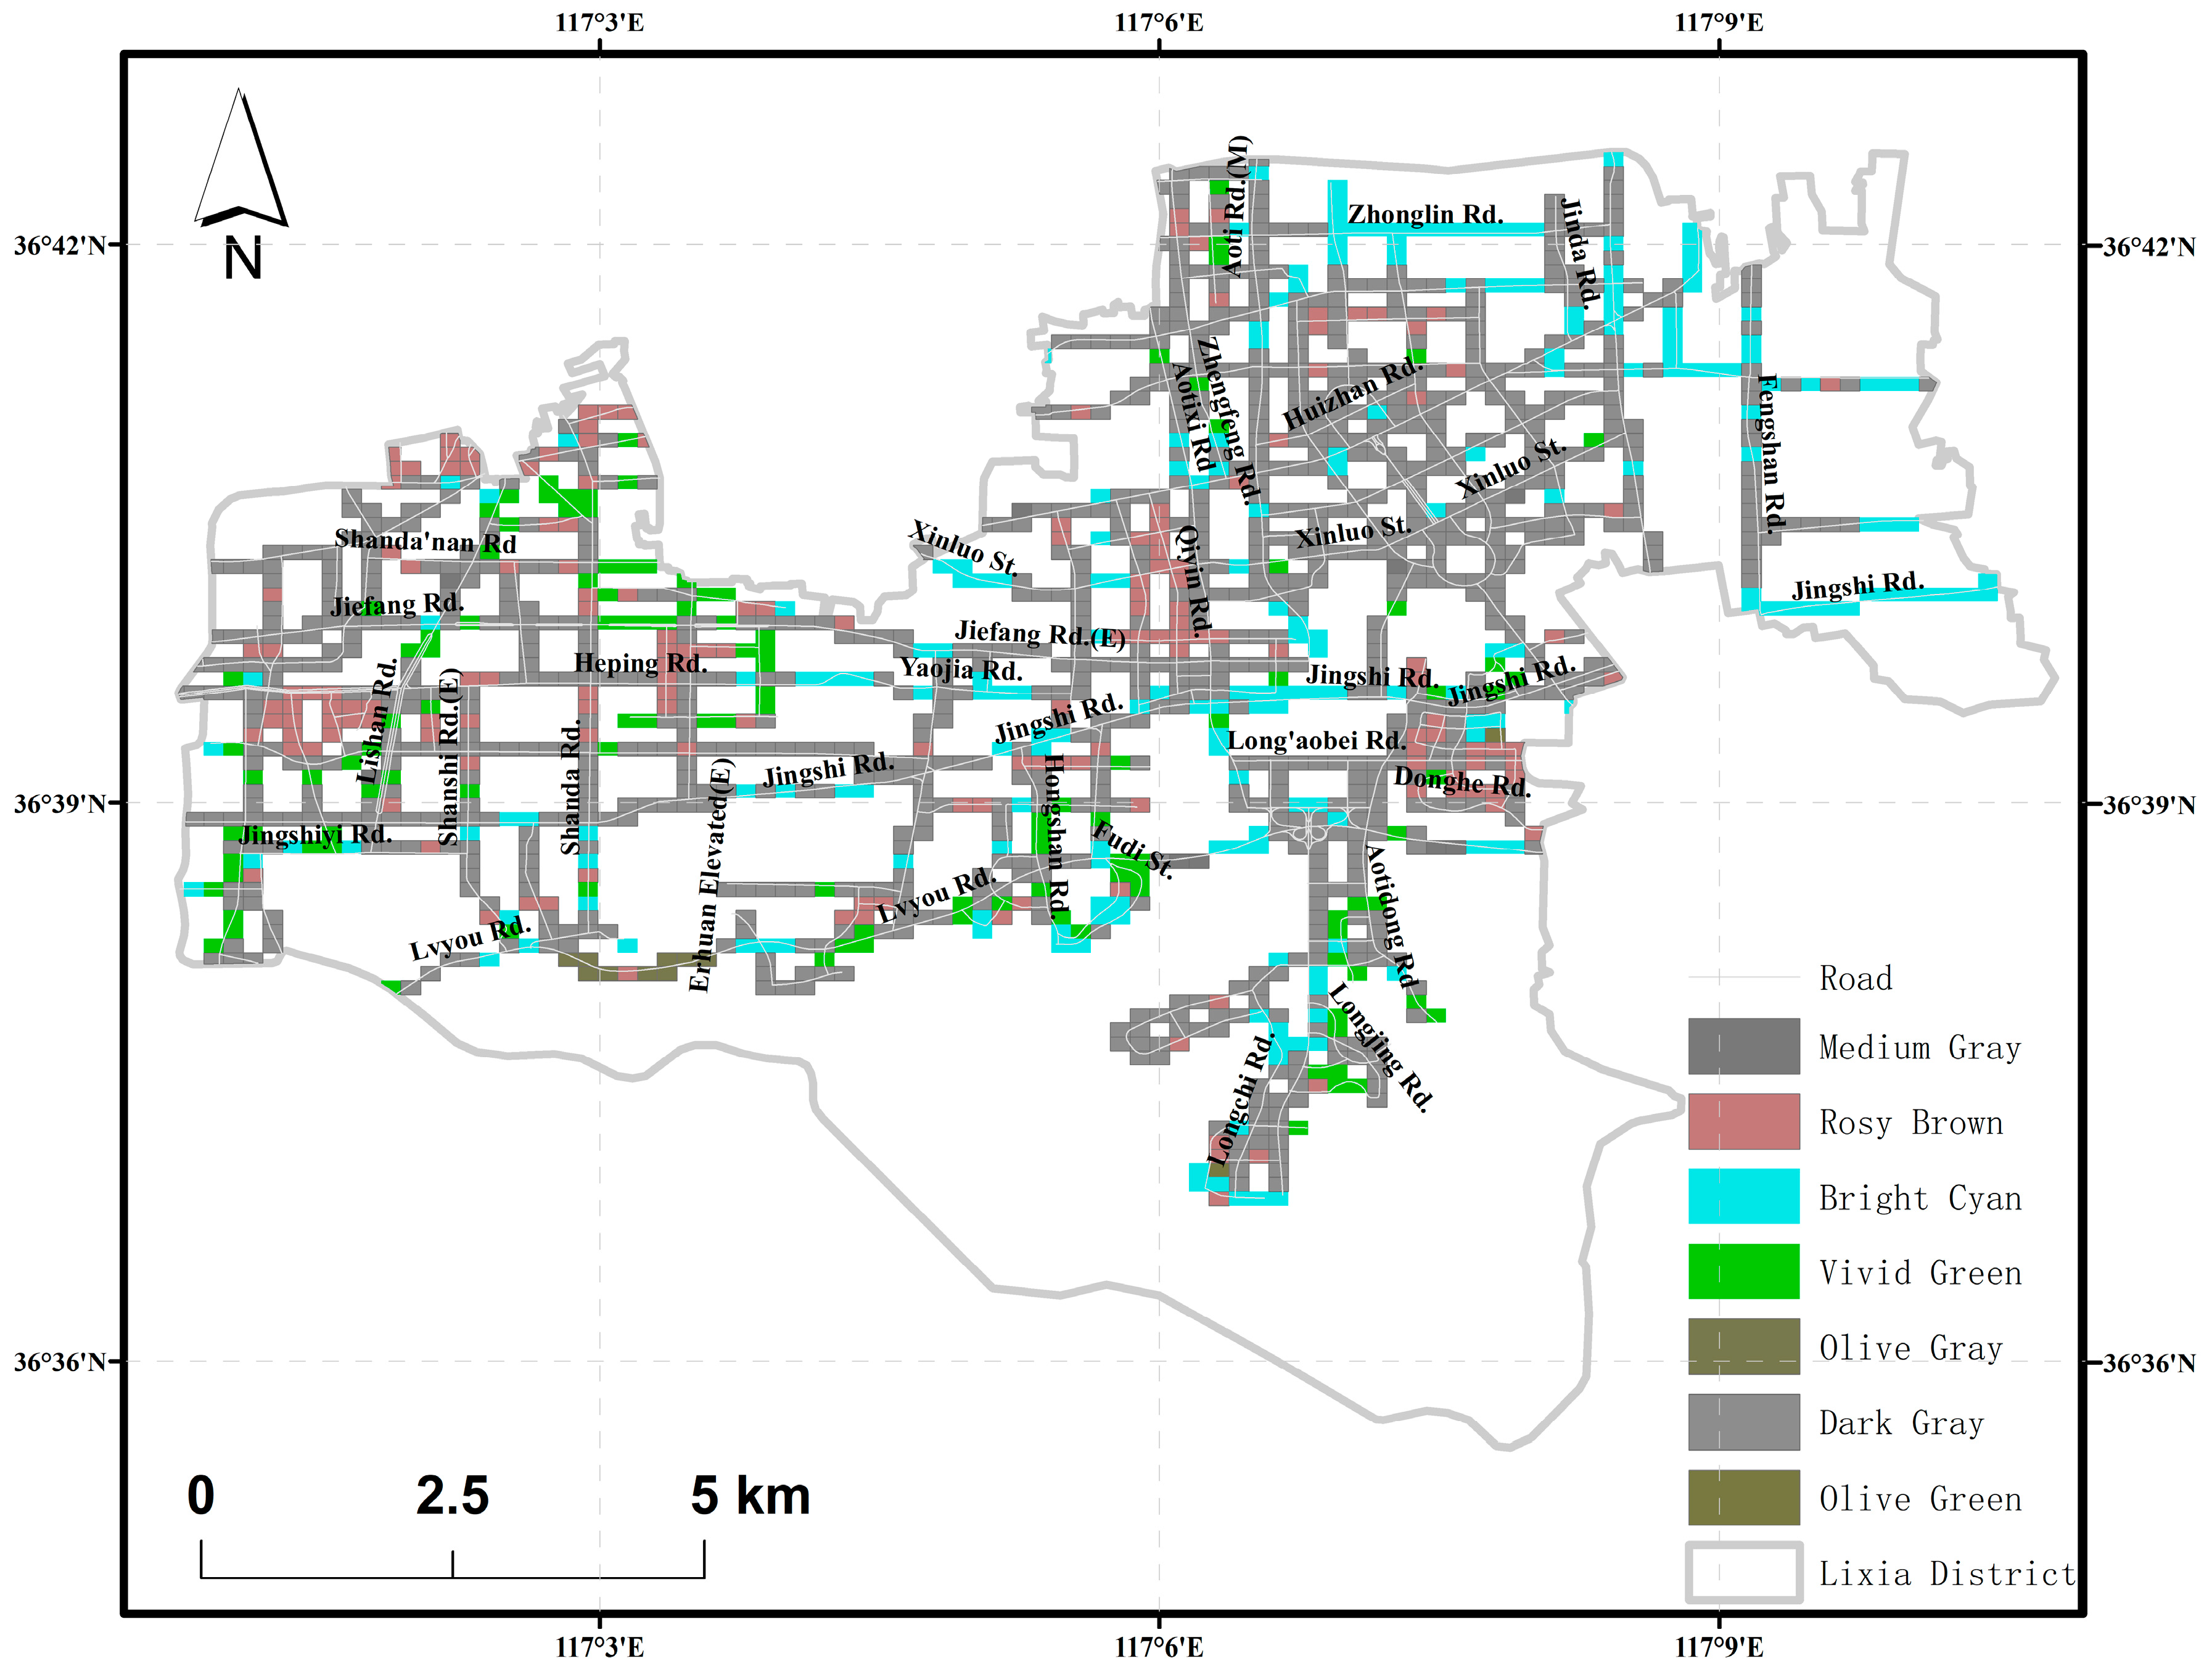
- The predominant color types in Lixia District of Jinan City are gray and blue-green. Gray is distributed in a more concentrated manner, while blue-green is distributed in a more scattered manner. Additionally, the majority of areas in Lixia District exhibit a high color complexity and low color coordination.
- (2)
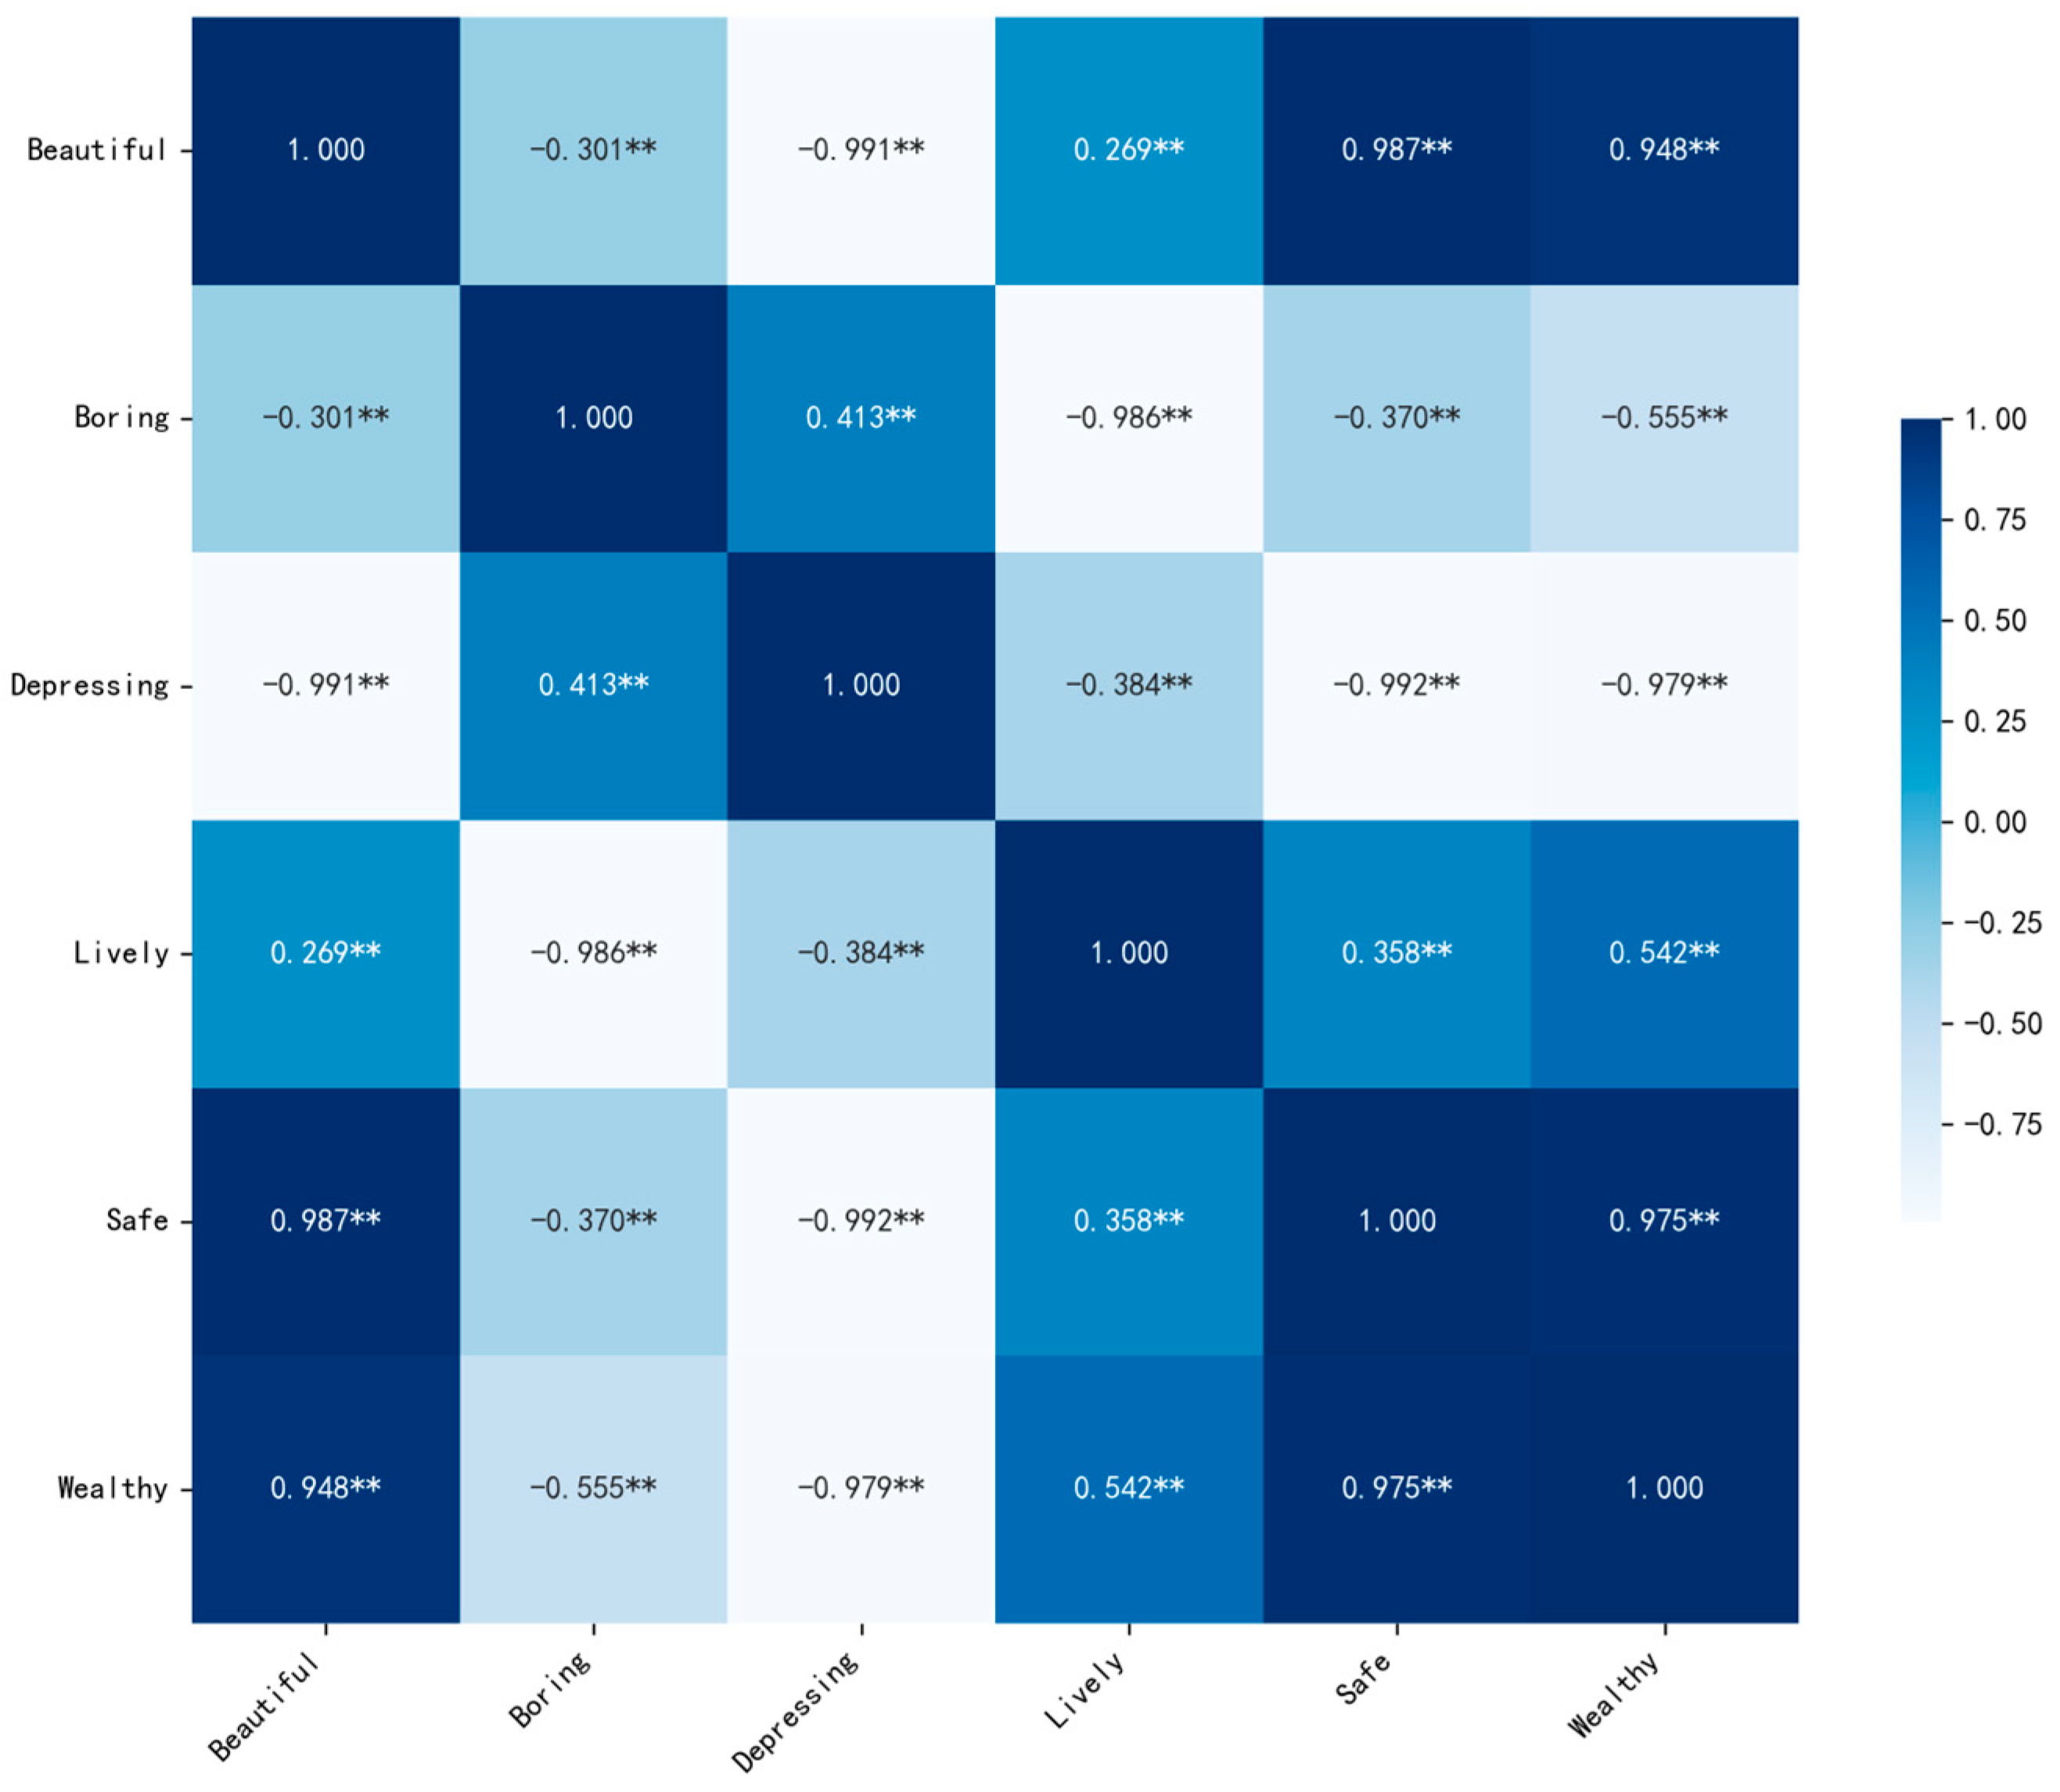
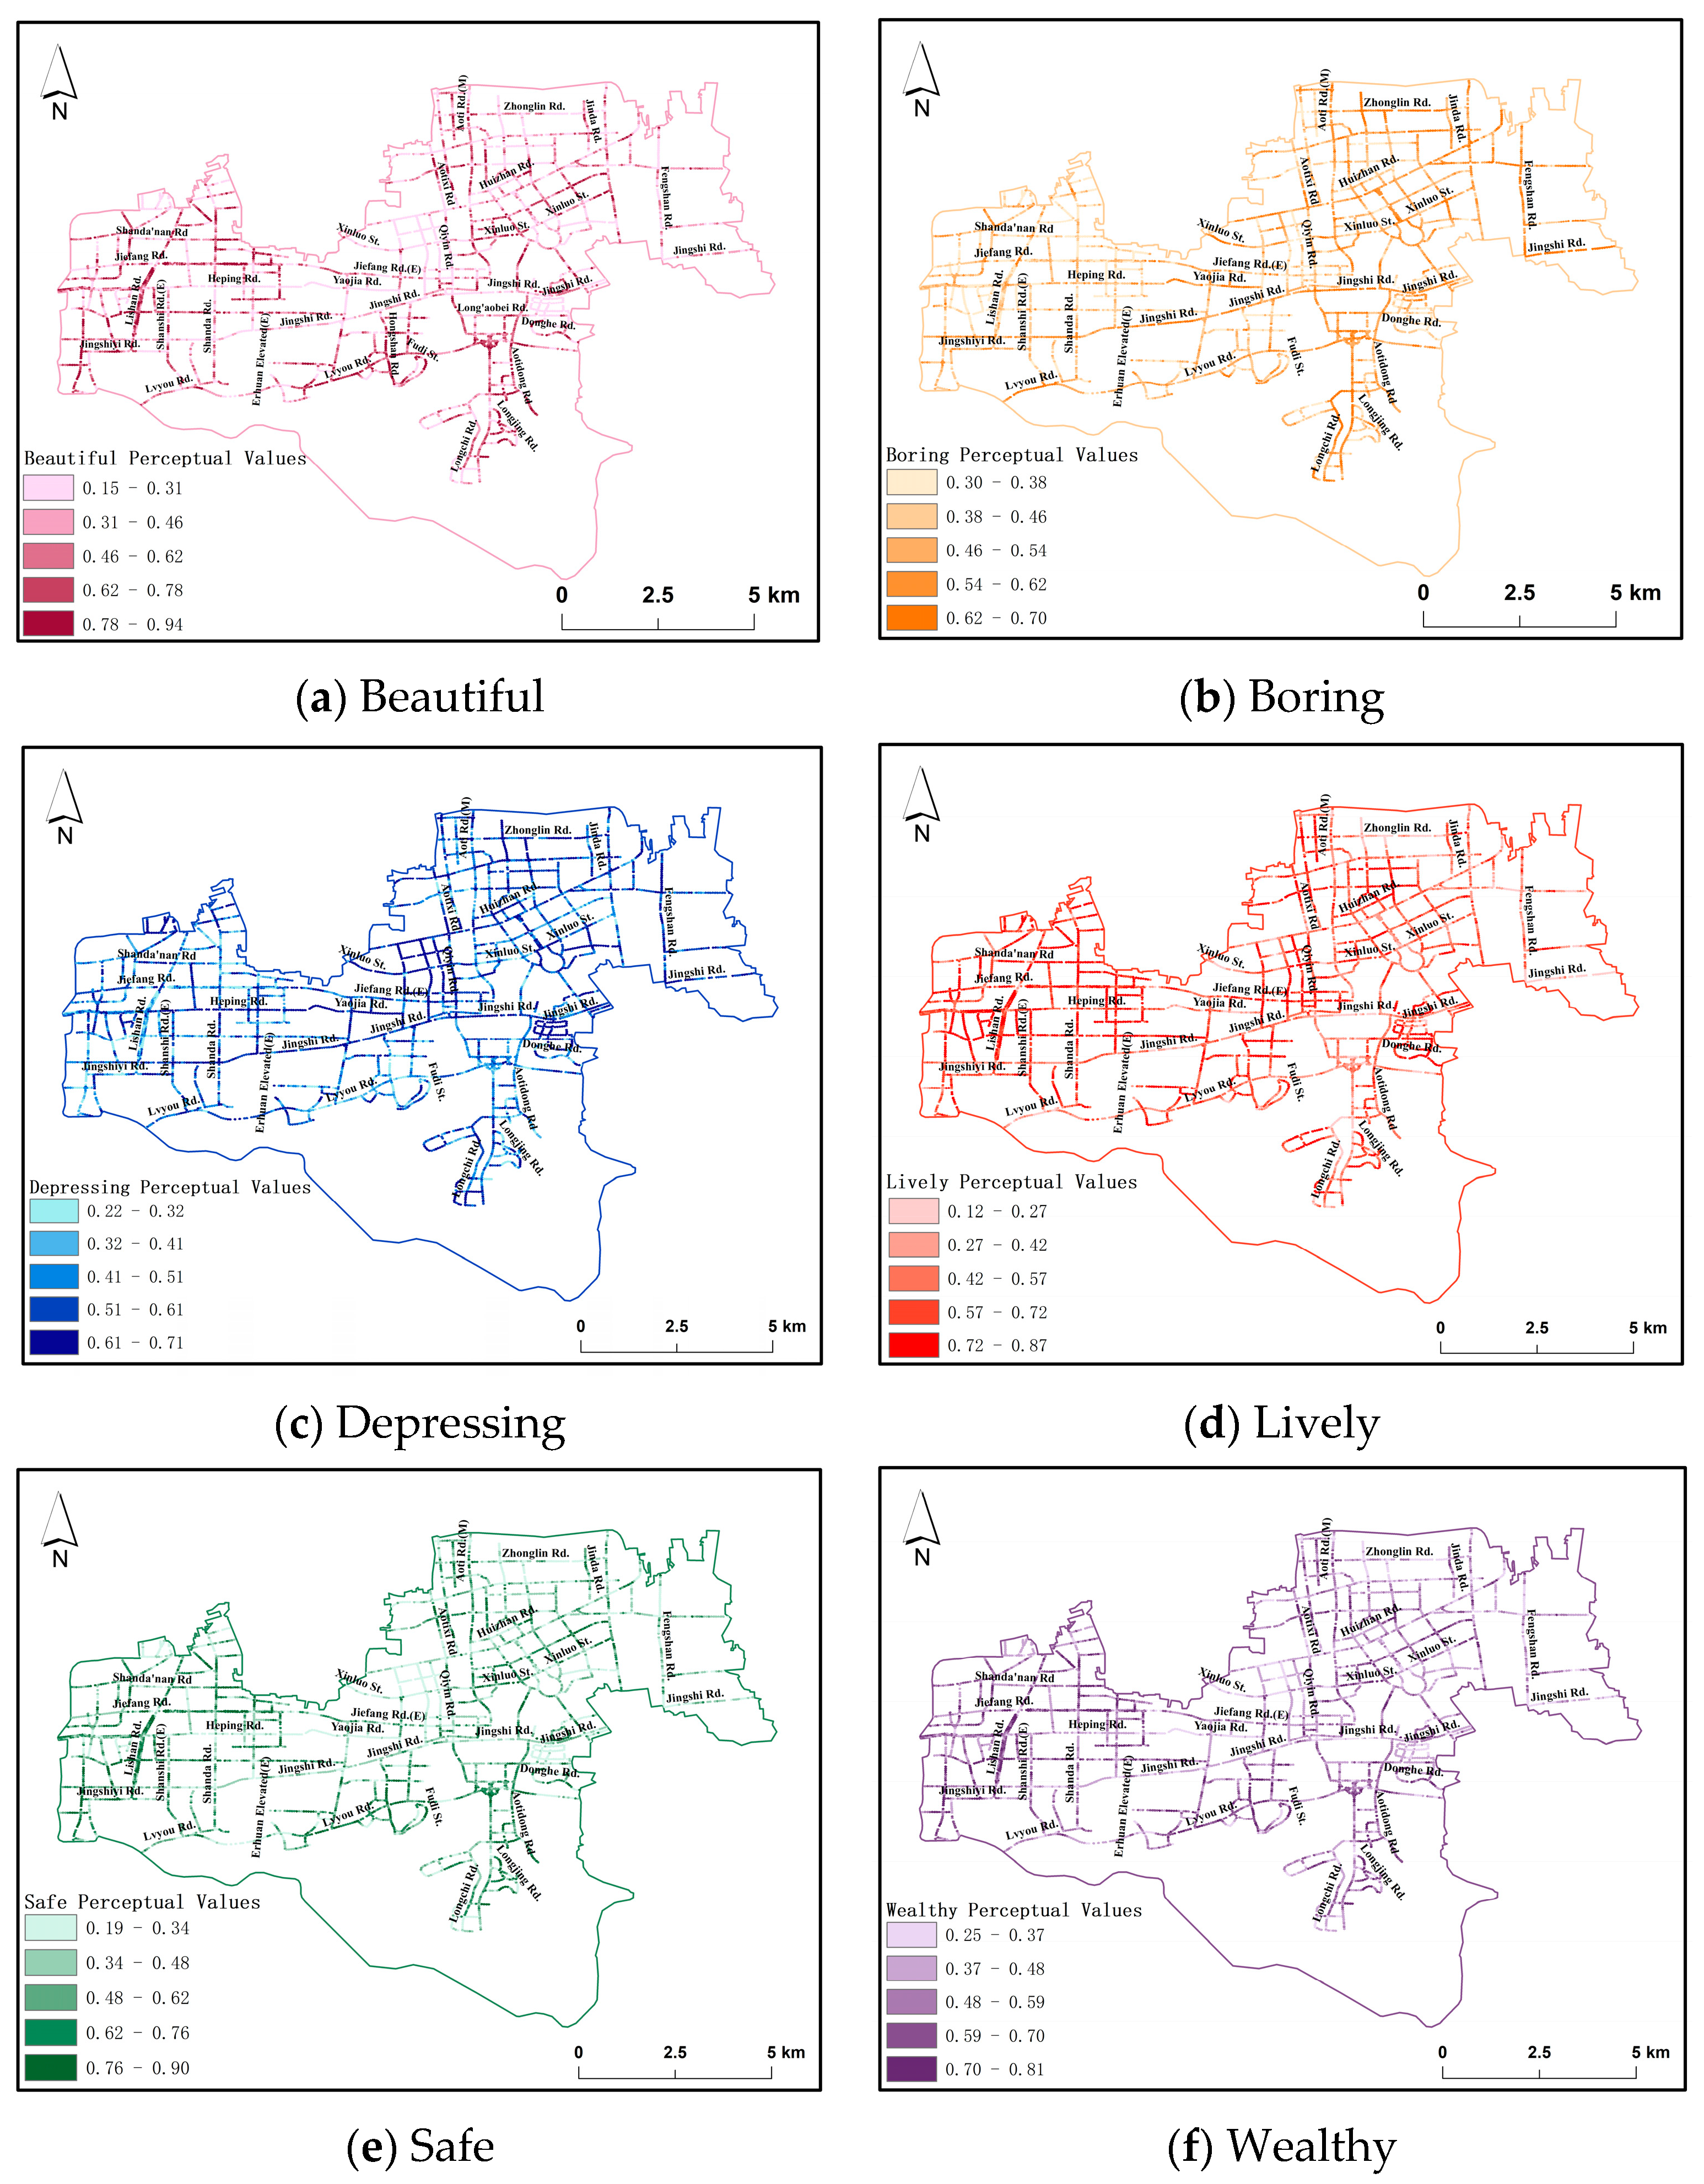
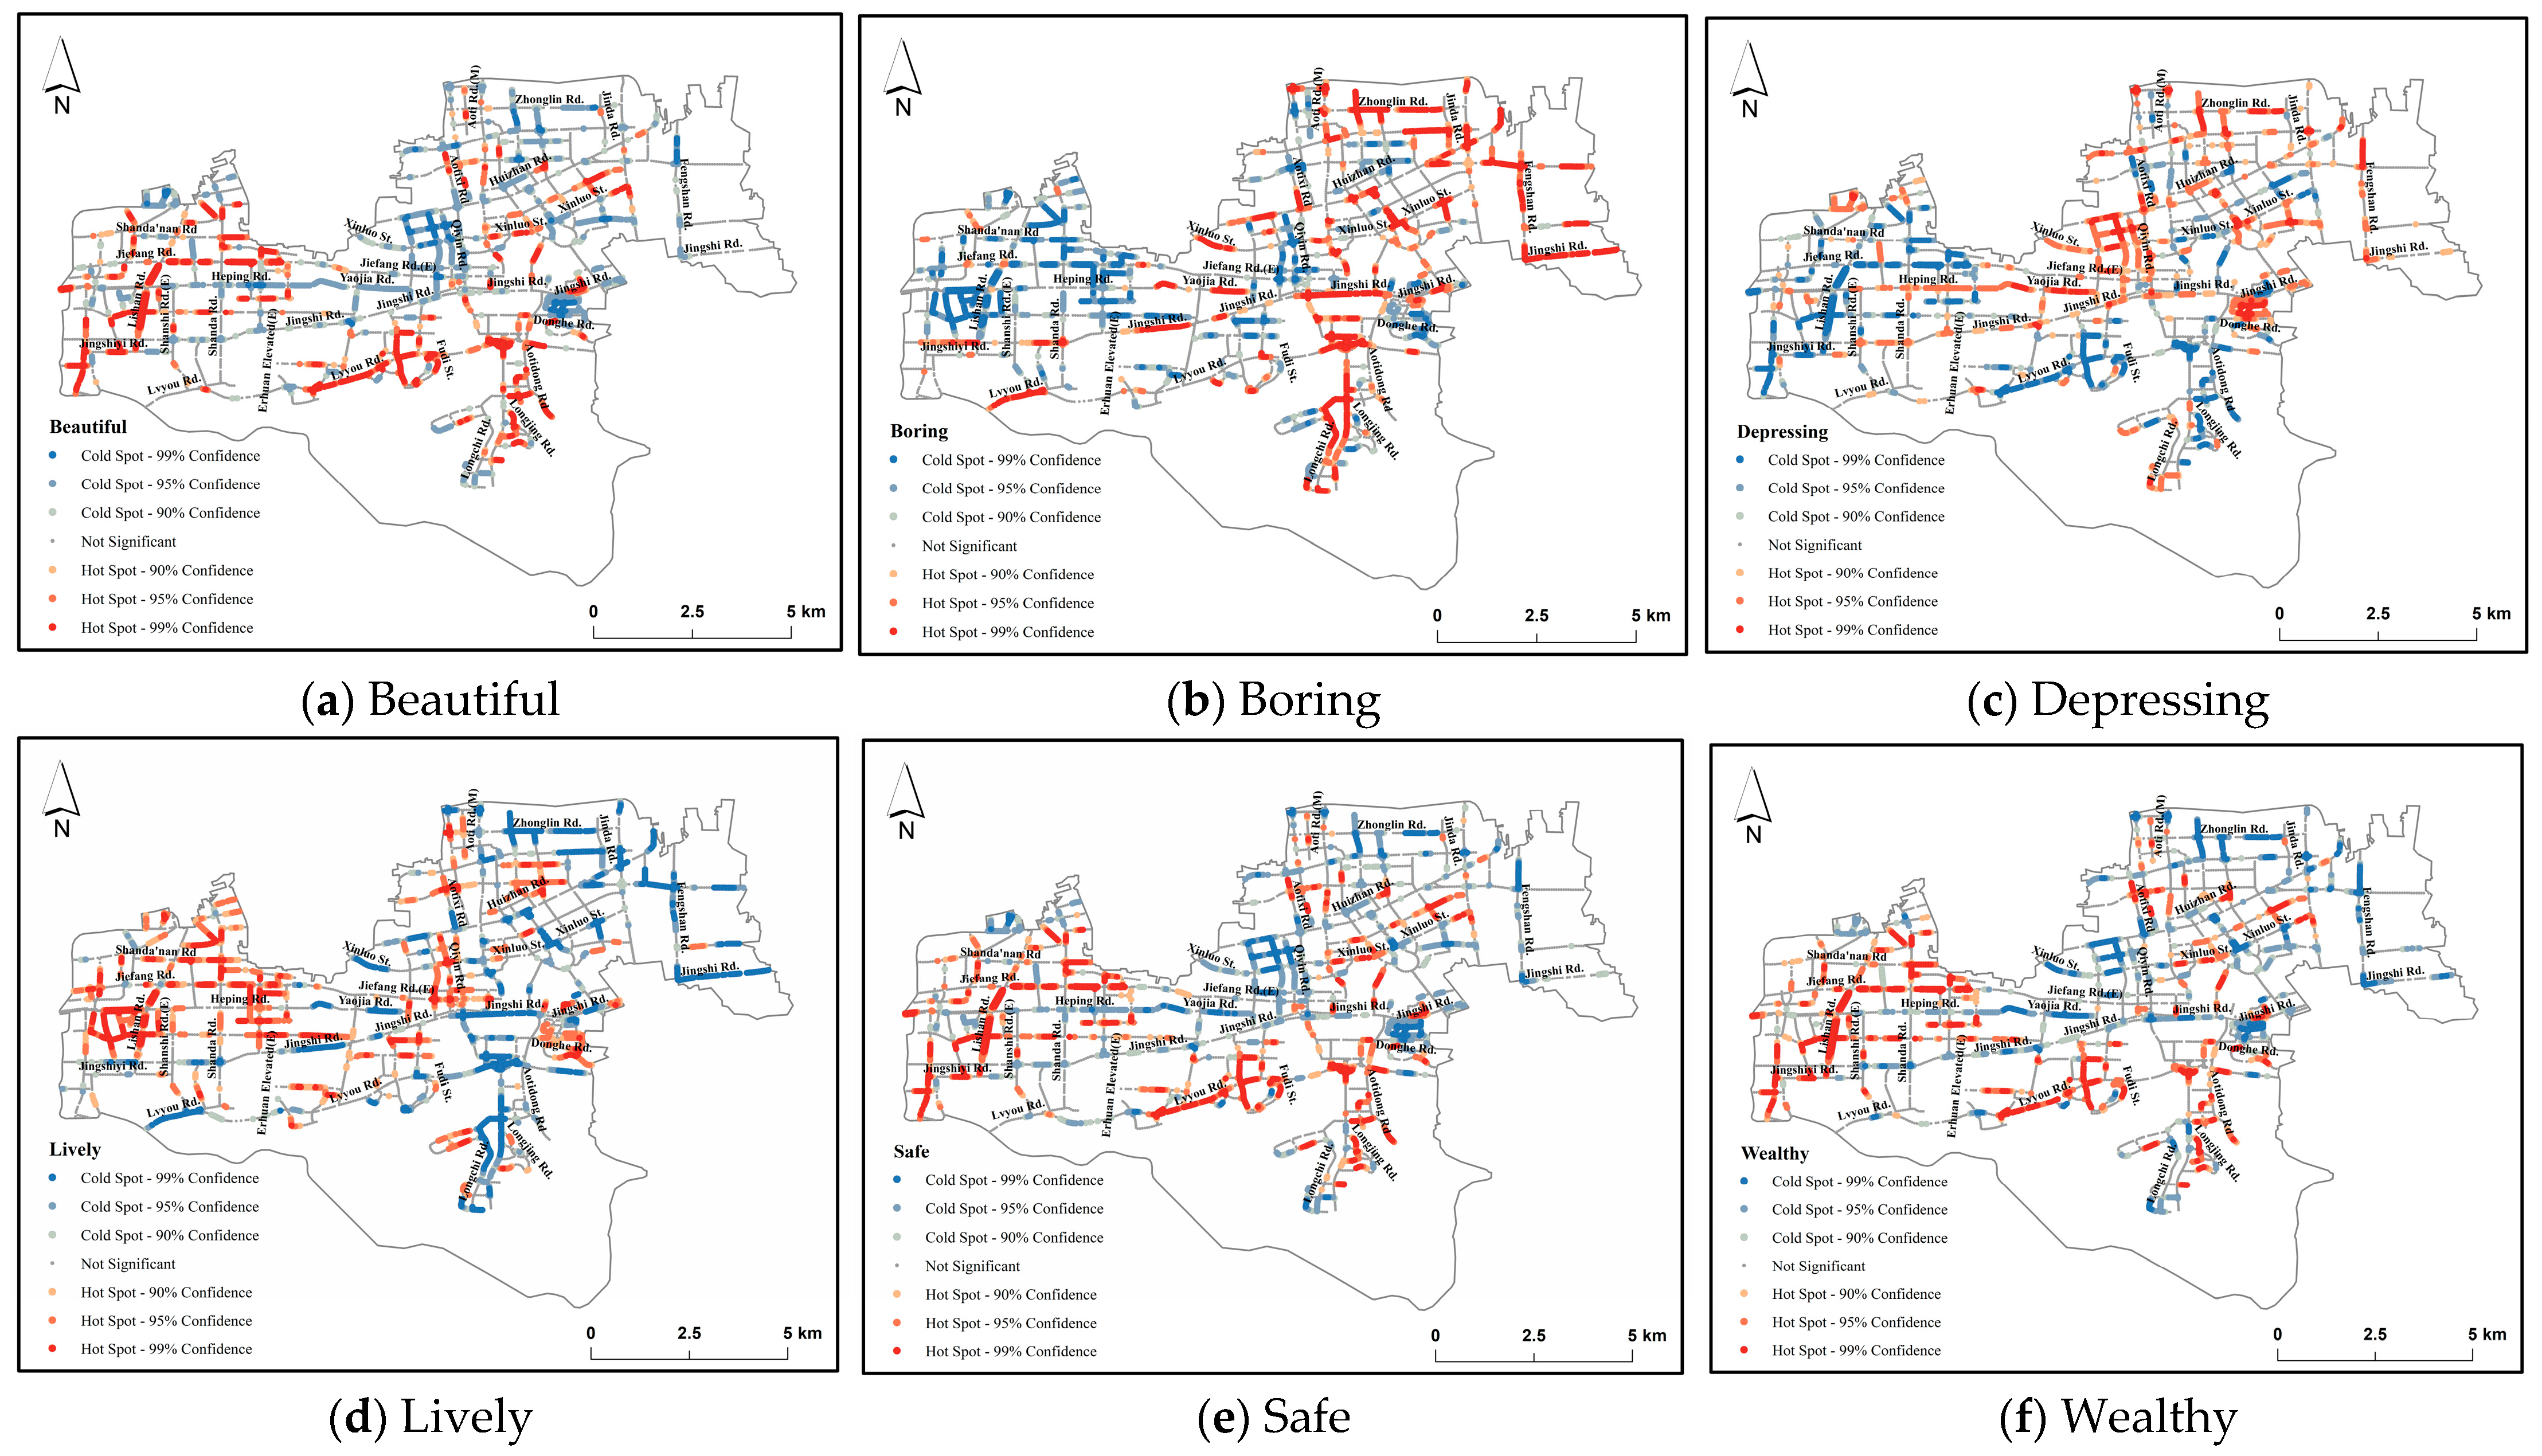
- There is a high degree of correlation between emotional perceptions, with a high positive correlation between beauty, security, and richness and a moderate positive correlation between boredom and depression. The prevalence of depression and liveliness is higher in the central area, while the perception of safety and richness is lower in this region. As distance from the center increases, residents’ depression levels decline, liveliness levels rise, and emotional distributions exhibit a regular aggregation phenomenon. Positive emotions are consistent in areas of a high spatial value, while negative emotions display the opposite spatial distribution characteristics.
- (3)
- The complexity and coordination of colors are pivotal elements influencing the emotional perceptions of residents. A greater degree of color complexity tends to provide a more diverse visual stimulus, which, in turn, attracts the attention of residents, particularly in commercial areas and entertainment venues. However, an excess of complexity may result in visual fatigue, which may, in turn, elicit feelings of depression and unease. In contrast, a moderate color complexity has been found to stimulate vitality and pleasure, thereby inducing feelings of relaxation and ease. Meanwhile, color coordination has been demonstrated to have a more pronounced positive effect on residents’ emotional experience. Highly coordinated color combinations have been shown to contribute to a more harmonious and aesthetically pleasing streetscape, and may enhance residents’ sense of security and happiness. In contrast, poorly coordinated colors have been found to increase visual confusion and lead to emotional discomfort and tension.
Author Contributions
Funding
Institutional Review Board Statement
Informed Consent Statement
Data Availability Statement
Acknowledgments
Conflicts of Interest
References
- Chen, C.; Li, H.; Luo, W.; Xie, J.; Yao, J.; Wu, L.; Xia, Y. Predicting the effect of street environment on residents’ mood states in large urban areas using machine learning and street view images. Sci. Total Environ. 2022, 816, 151605. [Google Scholar] [CrossRef] [PubMed]
- Beenackers, M.A.; Kruize, H.; Barsties, L.; Acda, A.; Bakker, I.; Droomers, M.; Kamphuis, C.B.M.; Koomen, E.; Nijkamp, J.E.; Vaandrager, L.; et al. Urban densification in the Netherlands and its impact on mental health: An expert-based causal loop diagram. Health Place 2024, 87, 103218. [Google Scholar] [CrossRef] [PubMed]
- Ma, X.; Ma, C.; Wu, C.; Xi, Y.; Yang, R.; Peng, N.; Zhang, C.; Ren, F. Measuring human perceptions of streetscapes to better inform urban renewal: A perspective of scene semantic parsing. Cities 2021, 110, 103086. [Google Scholar] [CrossRef]
- Zhang, S.; Liu, Y.; Nie, H. Geographical Feature based Research on Urban Color Environment—Taking Wuhan as an Example. IERI Procedia 2014, 9, 190–195. [Google Scholar] [CrossRef]
- Meichen, D. Quantitative contrast of urban agglomeration colors based on image clustering algorithm:Case study of the Xia-Zhang-Quan metropolitan area. Front. Archit. Res. 2021, 010, 692–700. [Google Scholar]
- Rui, Q.; Cheng, H. Quantifying the spatial quality of urban streets with open street view images: A case study of the main urban area of Fuzhou. Ecol. Indic. 2023, 156, 111204. [Google Scholar] [CrossRef]
- Rang, W.; Liang, H.; Wang, Y.; Zhou, X.; Cheng, D. A unified hybrid memory system for scalable deep learning and big data applications. J. Parallel Distrib. Comput. 2024, 186, 104820. [Google Scholar] [CrossRef]
- Fu, L.; Li, J.; Chen, Y. An innovative decision making method for air quality monitoring based on big data-assisted artificial intelligence technique. J. Innov. Knowl. 2023, 8, 100294. [Google Scholar] [CrossRef]
- Lindal, P.J.; Hartig, T. Architectural variation, building height, and the restorative quality of urban residential streetscapes. J. Environ. Psychol. 2013, 33, 26–36. [Google Scholar] [CrossRef]
- Subiza-Pérez, M.; Vozmediano, L.; Juan, C.S. Green and blue settings as providers of mental health ecosystem services: Comparing urban beaches and parks and building a predictive model of psychological restoration—ScienceDirect. Landsc. Urban Plan. 2020, 204, 103926. [Google Scholar] [CrossRef]
- Nisaito, Y. Deep Learning for Beginners; People’s Posts and Telecommunications Publishing House: Beijing, China, 2018. [Google Scholar]
- Shao, Y.; Ye, D.; Ye, Y. A Study on Large-Scale Measurement of Street Interface Penetration Rate Based on Street View Data and Deep Learning—A Case Study of Shanghai. Urban Plan. Int. 2023, 38, 39–47. [Google Scholar]
- He, K.; Gkioxari, G.; Dollár, P.; Girshick, R. Mask R-CNN. IEEE Trans. Pattern Anal. Mach. Intell. 2017, 42, 386–397. [Google Scholar] [CrossRef] [PubMed]
- Zhao, H.; Shi, J.; Qi, X.; Wang, X.; Jia, J. Pyramid Scene Parsing Network. In Proceedings of the 2017 IEEE Conference on Computer Vision and Pattern Recognition (CVPR), Honolulu, HI, USA, 21–26 July 2017; pp. 6230–6239. [Google Scholar] [CrossRef]
- Tang, J.; Long, Y. Measuring visual quality of street space and its temporal variation: Methodology and its application in the Hutong area in Beijing. Landsc. Urban Plan. 2019, 191, 103436. [Google Scholar] [CrossRef]
- Verma, D.; Jana, A.; Ramamritham, K. Predicting human perception of the urban environment in a spatiotemporal urban setting using locally acquired street view images and audio clips. Build. Environ. 2020, 186, 107340. [Google Scholar] [CrossRef]
- Fan, Z.; Bolei, Z.; Liu, L.; Yu, L.; Fung, H.H.; Hui, L.; Carlo, R. Measuring human perceptions of a large-scale urban region using machine learning. Landsc. Urban Plan. 2018, 180, 148–160. [Google Scholar]
- Yang, R.; Deng, X.; Shi, H.; Wang, Z.; He, H.; Xu, J.; Xiao, Y. A novel approach for assessing color harmony of historical buildings via street view image. Front. Archit. Res. 2024, 13, 764–775. [Google Scholar] [CrossRef]
- Chen, H. Deep Learning-Based Extraction of Quantity and Spatial Relationships of Streetscape Features. Master’s Thesis, Hebei University of Engineering, Handan, China, 2022. [Google Scholar]
- Gong, F.Y.; Zeng, Z.C.; Zhang, F.; Li, X.; Ng, E.; Norford, L.K. Mapping sky, tree, and building view factors of street canyons in a high-density urban environment. Build. Environ. 2018, 134, 155–167. [Google Scholar] [CrossRef]
- Ning, Z.; Yun, C.; Yuebin, W.; Bo, H.; Takis, M.P. Land-Use Mapping for High-Spatial Resolution Remote Sensing Image Via Deep Learning: A Review. IEEE J. Sel. Top. Appl. Earth Obs. Remote Sens. 2021, 14, 372–391. [Google Scholar]
- Liang, Q. Research on Semantic Segmentation Algorithm for Urban Street View Images Based on Convolutional Neural Networks. Master’s Thesis, Changchun University of Technology, Changchun, China, 2024. [Google Scholar]
- Zhao, Y. Research on the Semantic Segmentation Method of Urban Street Scene Based on DeepLabv3+. Master’s Thesis, Nanjing University of Posts and Telecommunications, Nanjing, China, 2023. [Google Scholar]
- Yang, H. Research on automatic classification method of building style based on real image. Master’s Thesis, Beijing University of Civil Engineering and Architecture, Beijing, China, 2024. [Google Scholar]
- Gu, H.; Jiang, H. Quantitative Control Method of Urban Colour Primary Tone with Digital Technology Support--Taking Ankang Urban Colour Planning and Design as an Example. Planners 2013, 29, 42–46. [Google Scholar]
- Ziyin, Q.I.; Junyi, L.I.; Zhe, H.E.; Xiping, Y. The Influence of Urban Streetscape Color on Tourists’ Emotional Perception Based on Streetscape Images. J. Geo-Inf. Sci. 2024, 26, 514–529. [Google Scholar]
- Liu, C.; Li, J.; Li, X. An example of the research design of the image region of interest extraction method based on HSV colour space. Softw. Eng. 2024, 27, 1–5. [Google Scholar]
- Liu, J.; Li, D. Adaptive K_means image segmentation method based on Lab colour space. Mach. Des. Manuf. Eng. 2018, 47, 23–27. [Google Scholar]
- Jinan Municipal People’s Government. Available online: http://www.jinan.gov.cn/col/col129/index.html (accessed on 18 April 2024).
- Jinan Municipal Bureau of Statistics. Available online: http://jntj.jinan.gov.cn/art/2024/3/28/art_18254_4750937.html (accessed on 28 March 2024).
- Ye, Y.; Zhang, L.; Yan, W.; Zeng, W. A Framework for Measuring the Quality of Street Greening from a Humanistic Perspective—A Large-Scale Analysis Based on Baidu Street View Data and Machine Learning. Landsc. Archit. 2018, 25, 24–29. [Google Scholar]
- He, K.; Zhang, X.; Ren, S.; Sun, J. Deep residual learning for image recognition. In Proceedings of the 2016 IEEE Conference on Computer Vision and Pattern Recognition (CVPR), Las Vegas, NV, USA, 27–30 June 2016; pp. 770–778. [Google Scholar]
- Dubey, A.; Naik, N.; Parikh, D.; Raskar, R.; Hidalgo, C.A. Deep Learning the City: Quantifying Urban Perception at a Global Scale. In Computer Vision—ECCV 2016; Springer: Cham, Switzerland, 2016; pp. 196–212. [Google Scholar]
- Salesses, P.; Schechtner, K.; Hidalgo, C.A. The Collaborative Image of The City: Mapping the Inequality of Urban Perception. PLoS ONE 2013, 8, e68400. [Google Scholar] [CrossRef] [PubMed]
- Garcia-Garcia, A.; Orts-Escolano, S.; Oprea, S.; Villena-Martinez, V.; Garcia-Rodriguez, J. A Review on Deep Learning Techniques Applied to Semantic Segmentation. arXiv 2017. [Google Scholar] [CrossRef]
- Wang, X.; Guo, Y.; Wang, S.; Cheng, G.; Wang, X.; He, L. Rapid detection of incomplete coal and gangue based on improved PSPNet. Measurement 2022, 201, 111646. [Google Scholar] [CrossRef]
- Liu, H.; Li, Y.; Li, Y.; Liu, X. Research on building change detection method based on improved PSPNet model for high resolution remote sensing images. Surv. World 2024, 2, 1–4. [Google Scholar]
- Pan, Y.; Qiu, L.; Wang, Z.; Zhu, J.; Cheng, M. Unravelling the association between polycentric urban development and landscape sustainability in urbanizing island cities. Ecol. Indic. 2022, 143, 109348. [Google Scholar] [CrossRef]
- Zhao, Z.; Luo, H. GIS-based Spatial Evaluation Research on Cultural Facilities--Taking Zhifu District of Yantai City as an Example. Urban. Archit. 2023, 20, 79–83. [Google Scholar]
- Li, M.; Zhong, F.; Peng, Z. Research on Rural Residential Base Remediation Strategies in Karst Areas Based on Cluster Analysis--Taking Xifeng County of Guiyang City, Guizhou Province as an Example. In Spatial Governance for High-Quality Development—Proceedings of the Annual Conference on Urban Planning in China 2021; China Architecture Industry Press: Beijing, China, 2021; pp. 779–791. [Google Scholar]
- Wang, Z.; Wang, X.; Xie, X.; Xiao, M.; Wu, Y.; Li, X. Influencing factors of green space landscape pattern evolution and its spatial differences in Fujian Province based on the GWR model. J. Northwest For. Univ. 2022, 005, 242–250. [Google Scholar]


| Emotional Perception | Spatial Autocorrelation Statemen | High/Low Clustering Analysis Statement | ||||
|---|---|---|---|---|---|---|
| Moran’s I | Z | P | General G | Z | P | |
| Beautiful | 0.549 | 49.162 | 0.000 | 0.000022 | 19.866 | 0.000 |
| Boring | 0.667 | 59.697 | 0.000 | 0.000019 | 8.569 | 0.000 |
| Depressing | 0.556 | 49.845 | 0.000 | 0.000018 | 0.650 | 0.516 |
| Lively | 0.662 | 59.327 | 0.000 | 0.000019 | 9.550 | 0.000 |
| Safe | 0.545 | 48.816 | 0.000 | 0.000020 | 16.990 | 0.000 |
| Wealthy | 0.552 | 49.507 | 0.000 | 0.000019 | 12.804 | 0.000 |
| Beautiful | Boring | Depressing | Lively | Safe | Wealthy | |
|---|---|---|---|---|---|---|
| Color Complexity | −0.016 | 0.231 ** | 0.041 ** | −0.186 ** | −0.006 | −0.029 * |
| Color Coordination | 0.188 ** | 0.003 | −0.178 ** | −0.017 | 0.180 ** | 0.156 ** |
| OLS | GRW | |||||||||
|---|---|---|---|---|---|---|---|---|---|---|
| Ratio | P | Robust_pr | Koenker (BP) | Adj R2 | AICc | Jarque–Bera | Adj R2 | AICc | ||
| Beautiful | Complexity | −0.000481 | 0.988 | 0.988 | 0.024 * | 0.03 | −920.36 | 0.000 * | 0.15 | −1518.78 |
| Coordination | 0.066143 | 0.000 * | 0.000 * | |||||||
| Boring | Complexity | 0.230475 | 0.000 * | 0.000 * | 0.582 | 0.05 | −9025.48 | 0.000 * | 0.24 | −10,058.43 |
| Coordination | 0.00341 | 0.113 | 0.117 | |||||||
| Depressing | Complexity | 0.034976 | 0.063 | 0.063 | 0.017* | 0.03 | −6152.9 | 0.000 * | 0.15 | −6769.57 |
| Coordination | −0.035787 | 0.000 * | 0.000 * | |||||||
| Lively | Complexity | −0.362119 | 0.000 * | 0.000 * | 0.316 | 0.04 | −2569.97 | 0.000 * | 0.23 | −3600.65 |
| Coordination | −0.009735 | 0.021 * | 0.023 * | |||||||
| Safe | Complexity | 0.017164 | 0.534 | 0.533 | 0.078 | 0.03 | −2492.61 | 0.000 * | 0.15 | −3071.09 |
| Coordination | 0.053784 | 0.000 * | 0.000 * | |||||||
| Wealthy | Complexity | −0.021679 | 0.259 | 0.257 | 0.028* | 0.02 | −5961.1 | 0.000 * | 0.15 | −6578.42 |
| Coordination | 0.031954 | 0.000 * | 0.000 * | |||||||
| Emotional Perception | Color Complexity | Color Coordination | ||
|---|---|---|---|---|
| Average Value | Standard Deviation | Average Value | Standard Deviation | |
| Beautiful | 0.024 | 0.192 | 0.058 | 0.025 |
| Boring | 0.155 | 0.098 | 0.004 | 0.015 |
| Depressing | 0.008 | 0.109 | −0.031 | 0.014 |
| Lively | −0.215 | 0.190 | −0.009 | 0.028 |
| Safe | 0.049 | 0.154 | 0.047 | 0.022 |
| Wealthy | 0.022 | 0.108 | 0.028 | 0.013 |
Disclaimer/Publisher’s Note: The statements, opinions and data contained in all publications are solely those of the individual author(s) and contributor(s) and not of MDPI and/or the editor(s). MDPI and/or the editor(s) disclaim responsibility for any injury to people or property resulting from any ideas, methods, instructions or products referred to in the content. |
© 2024 by the authors. Licensee MDPI, Basel, Switzerland. This article is an open access article distributed under the terms and conditions of the Creative Commons Attribution (CC BY) license (https://creativecommons.org/licenses/by/4.0/).
Share and Cite
Yu, M.; Zheng, X.; Qin, P.; Cui, W.; Ji, Q. Urban Color Perception and Sentiment Analysis Based on Deep Learning and Street View Big Data. Appl. Sci. 2024, 14, 9521. https://doi.org/10.3390/app14209521
Yu M, Zheng X, Qin P, Cui W, Ji Q. Urban Color Perception and Sentiment Analysis Based on Deep Learning and Street View Big Data. Applied Sciences. 2024; 14(20):9521. https://doi.org/10.3390/app14209521
Chicago/Turabian StyleYu, Mingyang, Xiangyu Zheng, Pinrui Qin, Weikang Cui, and Qingrui Ji. 2024. "Urban Color Perception and Sentiment Analysis Based on Deep Learning and Street View Big Data" Applied Sciences 14, no. 20: 9521. https://doi.org/10.3390/app14209521
APA StyleYu, M., Zheng, X., Qin, P., Cui, W., & Ji, Q. (2024). Urban Color Perception and Sentiment Analysis Based on Deep Learning and Street View Big Data. Applied Sciences, 14(20), 9521. https://doi.org/10.3390/app14209521