Article

Investigating the Effects of the Height-to-Diameter Ratio and Loading Rate on the Mechanical Properties and Crack Extension Mechanism of Sandstone-Like Materials

1
School of Mines, China University of Mining & Technology, Xuzhou 221116, China
2
College of Mining Engineering and Geology, Xinjiang Institute of Engineering, Urumqi 830023, China
*
Authors to whom correspondence should be addressed.
Appl. Sci. 2024, 14(21), 10049; https://doi.org/10.3390/app142110049
Submission received: 24 September 2024 / Revised: 15 October 2024 / Accepted: 19 October 2024 / Published: 4 November 2024

Abstract

:
The causes of the size effect (SE) and loading rate effect (LR) for rocks remain unclear. Based on this, a gypsum-mixed material was used to simulate sandstone, where the dosing ratio was 7.5% river sand, 17.5% quartz, 58.3% α -high-strength gypsum, and 16.7% water. The specimens were designed to have a height-to-diameter ratio (HDR) of 0.6~2, and three strain rates (SRs)—static, quasi-dynamic, and dynamic—were used to perform single-factor rotational uniaxial compression experiments. PFC2D was used to numerically simulate the damage pattern of a sandstone-like specimen. The results showed that the physical parameters did not change monotonically, as was previously found. The main reason for this is that the end-face friction effect (EFE) is generated when the dynamic SR or the HDR is 0.6~1, with a damage pattern of “X”. Under mechanical analysis, the power consumed by the EFE was inversely proportional to the HDR and directly proportional to the LR, and it can reduce the actual amount of energy transferred inside the specimen. This paper may provide a foundation for the study of non-linear hazards in coal and rock.

1. Introduction

Rock is a heterogeneous material featuring a non-linear, non-uniform, and complex geometric structure. Due to weathering, there are many defects such as cracks, joints, and weak structural planes in rocks, which directly affect the mechanical properties of the rock. As the size of a rock increases, the random defects contained within it also increase. Different sizes of rock often show discrepancies in their mechanical properties, which is called the size effect (SE). The SE in rock engineering has attracted special attention and research over the past five decades. The SE is not limited to rocks. Almost all quasi-brittle and brittle materials exhibit some form of the SE [1]. Now, the SE is still one of the hot research directions in rock mechanics [2].
By studying the mechanical properties and crack propagation laws of sandstone under different HDRs and LRs, a deeper understanding of the constitutive relationship of rock—that is, the intrinsic connection between stress and strain—can be achieved, thus enriching and perfecting the theory of rock mechanics. For example, changes in the HDR may lead to changes in the stress distribution and deformation mode of sandstone, and different LRs will cause obvious differences in the mechanical properties, such as the strength and toughness of sandstone. The study of these phenomena is helpful for establishing more accurate theoretical models. At the same time, the HDR and the LR will affect the generation location and propagation direction and speed of internal cracks in sandstone. Understanding these influence mechanisms can reveal the failure mechanism of rock and provide important theoretical support for basic research in rock mechanics. For example, under a high LR, sandstone may be more prone to brittle failure, and changes in the HDR may change the crack propagation path and failure mode. Through the study of these changes, the constitutive model of rock can be improved to make the theoretical model closer to the actual mechanical behavior of rock. This also helps with studying the propagation law of microcracks inside rock and deepening the understanding of the rock failure mechanism, providing a basis for the development of theories such as rock damage mechanics. Engineers can select appropriate HDRs and loading methods when designing rock structures based on research results to improve the stability and bearing capacity of a structure. For completed rock structure projects, engineers can evaluate the safety and durability of a structure according to the research results of the effects of HDRs and LRs. Through regular detection and evaluation, problems existing in a structure can be found in time, and corresponding maintenance and repair measures can be taken to extend the service life of a project.
Contemporary research on the SE began with the strength theory of rock materials based on statistical theory, proposed by Weibull [3,4]. According to this theory, the ultimate strength of rock materials is determined by the integral of the statistical distribution function related to the volume and material. Based on the classical method of equivalent elastic fracture mechanics, Bazant presented the famous size effect law [5]. Liu et al. proposed an empirical formula for the SE of the UCS, which was well verified in seven types of rocks [6]. He held that as the size of a rock increases, the UCS displays downward trend which is sharp at first and then slow. Hoek and Brown established the relationship of specimens’ strength between different size diameters and a 50 mm diameter and accordingly proposed the empirical size effect mode [7]. The research conducted by Brace also applied to many rock mechanical problems regarding the SE [8]. Carpinteri et al. proposed the multifractal scaling law size effect model [9]. Based on Bazant’s study, Masoumi et al. proposed the unified size effect law (USEL) for Gosford sandstone for uniaxial compression and point loading experiments [1]. Zhang et al. established statistical models and general expressions for the failure probability, and on this basis, they determined the SE of quasi-brittle materials through the Weibull and Poisson distribution models, revealing that the defect probability and rock strength increase monotonously with the volume [10]. Liang et al. proposed a numerical simulation method for studying the SE of a macroscopic cross-dimension rock mass [11].
In addition, under different loading conditions, the mechanical properties of rock vary greatly. In a laboratory, different values for the LR can be used to simulate the loading conditions of specimens subjected to different stress environments. The LR is likewise one of the factors affecting rock’s mechanical parameters. By conducting experiments on marble with different LRs, Su et al. found that with an increase in the LR, the rock damage morphology experienced changed the localized shear to complete shear-tension damage and to conical damage [12]. By analyzing the energy evolution mechanism of marble at nine LRs, Huang et al. proposed that the degree of fracturing is positively correlated with the LR [13]. Zhang et al. studied the mechanical properties of deep sandstone under different loading rates and revealed the damage mechanism of deep sandstone under different strain rates [14]. They analyzed the relationship between the SE of rock and the different confining stress conditions through numerical simulations, and the strength of the rock increased significantly with increasing confining pressure [15,16,17,18].
Through statistical analysis of previous research results and experimental verification, Darlington et al. concluded that the SE for a rock’s strength depends on the type and structure of the rock [19]. Most rock formations in coal mines are sedimentary rock. There are still differences of opinion about the SE and LR of sedimentary rocks. Hawkins proposed that sandstone specimens reach their peak strength in the range of 40~60 mm in height, and the strength will decrease when the height is beyond this range [20]. Wang et al. proposed that the long-term strength values of rock will gradually decrease and plateau as the specimen size increased [15]. Chen et al. used RFPA2D to study the mechanical behavior of carbonaceous mudstone specimen with a HDR of 2:1, and founded that φ150 mm × 300 mm was the boundary size of rock strength [21]. Meng et al. conducted mechanical testing experiments on red sandstone and found that the peak strength of the specimen is negatively correlated with the HDR and positively correlated with the LR [22]. Aurelien et al. experimentally challenged the assumption underlying the Weibull method that the critical crack size increased with specimen size [23]. Arcady proposed a brittle dynamic failure model and predicted that the observed dynamic compressive strength would be enhanced with the increase in the LR and specimen size [24].
The surrounding rocks of deep coal mines have undergone extensive geological structural deposition, resulting in a highly complex stress environment. Additionally, the coal and rock mass are relatively incomplete, which complicates the successful drilling of rock and coal specimens with a HDR of 2:1 on site [16,25,26,27,28]. Furthermore, the mechanical properties of rock and coal specimens drilled from different locations exhibit significant discrepancies. Consequently, recent experimental studies have increasingly focused on the development of rock-like materials in the laboratory to investigate the associated mechanical properties of rock. Haeri et al. combined experiments and numerical simulations to investigate the mechanism of micro-crack propagation and coalescence in brittle rock-like materials. They discovered that crack propagation in rock-like materials may resemble that of natural micro-cracks [29]. This was achieved through orthogonal experiments, Song et al. developed a rock-like material with cement, silica fume and quartz as the main components which better simulated the similar deformation and brittleness characteristics of sandstone [30]. Zhang et al. studied the influence of multiple intersecting fissures on the mechanical properties of rock-like, materials and found that as the length of a single fissure increased, the UCS and residual strength of the specimens gradually decreased, while the macro-failure mode transitioned from shear to tension [31]. Huang et al. researched the influence of the SE and confining pressure on the UCS and Em of rock-like gypsum–cement mix materials, revealing that as the specimen size increased, strength initially rose before declining, ultimately increasing with the rise in circumferential pressure [32]. Yin and Yang analyzed the differences in failure characteristics, UCS and acoustic emission parameters of two types of transversely isotropic rock-like materials through various experiments [33].
This study aims to investigate the influences and causes of the SE and LR on the mechanical properties of materials. Initially, a sandstone-like material was developed to exhibit mechanical properties that adhere to a specific ratio relationship with targeted sandstone. The effects of different LRs and HDRs on the mechanical properties of the sandstone-like rock bodies were also investigated by uniaxial compression experiments and PFC2D numerical simulations. Consequently, the underlying causes of the SE and LR production in sandstone-like specimens are revealed. This paper could lay the research foundation for preventing non-linear damage in underground spaces such as rock and mining engineering. It also offers valuable guidance for the selection and proportioning of similar materials and is of great significance for predicting and controlling rock fracture behavior in engineering applications.

2. Sandstone-Like Material

2.1. Preparation and Testing of Sandstone Specimens

The sandstone specimens were selected as the research object, and were collected from the transportation roadway of a coal mine at a buried depth of 730~800 m in Shanxi Province, China (as shown in Figure 1). The joints and cracks in the surrounding rock are only slightly developed. Six specimens (φ50 × 100 mm) were drilled and polished from a large rock sample in the laboratory with the ISRM’s suggested method [34].The detrital components are primarily quartz, and the cementing material components are mainly carbonates. It belongs to relatively young sandstone after the Mesozoic era. This sandstone is a medium-strength rock. Furthermore, to minimize the influence of different LRs on the experimental results, a control experiment was conducted to test the mechanical properties of sandstone specimens at a loading rate of 0.5 MPa·s−1 using the MTS815 electro-hydraulic servo-controlled rock mechanics testing system at the China University of Mining and Technology. The average value of UCS measured was 69.2 MPa.

2.2. Raw Materials

In current research on rock-like materials, gypsum-mixed materials are the most widely used that their mechanical properties which closely resemble those of natural rock. In addition, these materials are also featured with relatively larger adjustment range of mechanical parameters, abundant sources, low price, and ease of production [35,36,37]. Based on these advantages, gypsum-mixed materials have been selected as the simulation material for sandstone in this paper.
The main components of the gypsum-mixed simulation materials include river sand, quartz sand, α -high-strength gypsum and water. The best ratio was found through multiple proportioning tests and reference studies [38,39,40]. To be specific, river sand and quartz sand were used as aggregates; α -high-strength gypsum was the binder; and water was used as the blending agent. The specific composition ratio is detailed in Table 1.

2.2.1. River Sand

The river sand used was of high quality, without impurities such as clay. The sand was screened in the laboratory using mesh sieves to separate it into three particle sizes: 9, 16, and 32 mesh. These three grain sizes of river sand were mixed together in a certain ratio (as shown in Table 1), which was to prevent the effect of inhomogeneous grain sizes on mechanical parameters such as the strength of rock-like specimens.

2.2.2. Quartz Sand

The quartz sand used was high purity quartz sand, presented in a white powder form, characterized by its high hardness, high specific gravity, uniform grain size and natural color. Two types of quartz sand, 200 and 600 mesh, were used for this simulated material and mixed in a designated ratio (as shown in Table 1).

2.2.3. α-High-Strength Gypsum

The α -high-strength gypsum was available in the form of white powder, produced through decomposition under higher pressure. The grains of high-strength gypsum were coarse, with relatively small surface area. The plasticized water requirement for blending into the gypsum slurry was approximately 35–45%, thus the porosity was small after hardening. Accordingly, it featured high-strength (up to 40 MPa at 7 days) and compactness. The dosing and particle size specifications are shown in Table 1.

2.2.4. Water

Water served as the blending agent in this study. Tap water, sourced from the laboratory at room temperature, was utilized due to its purity and freedom from impurities, as well as its easy accessibility from various sources.

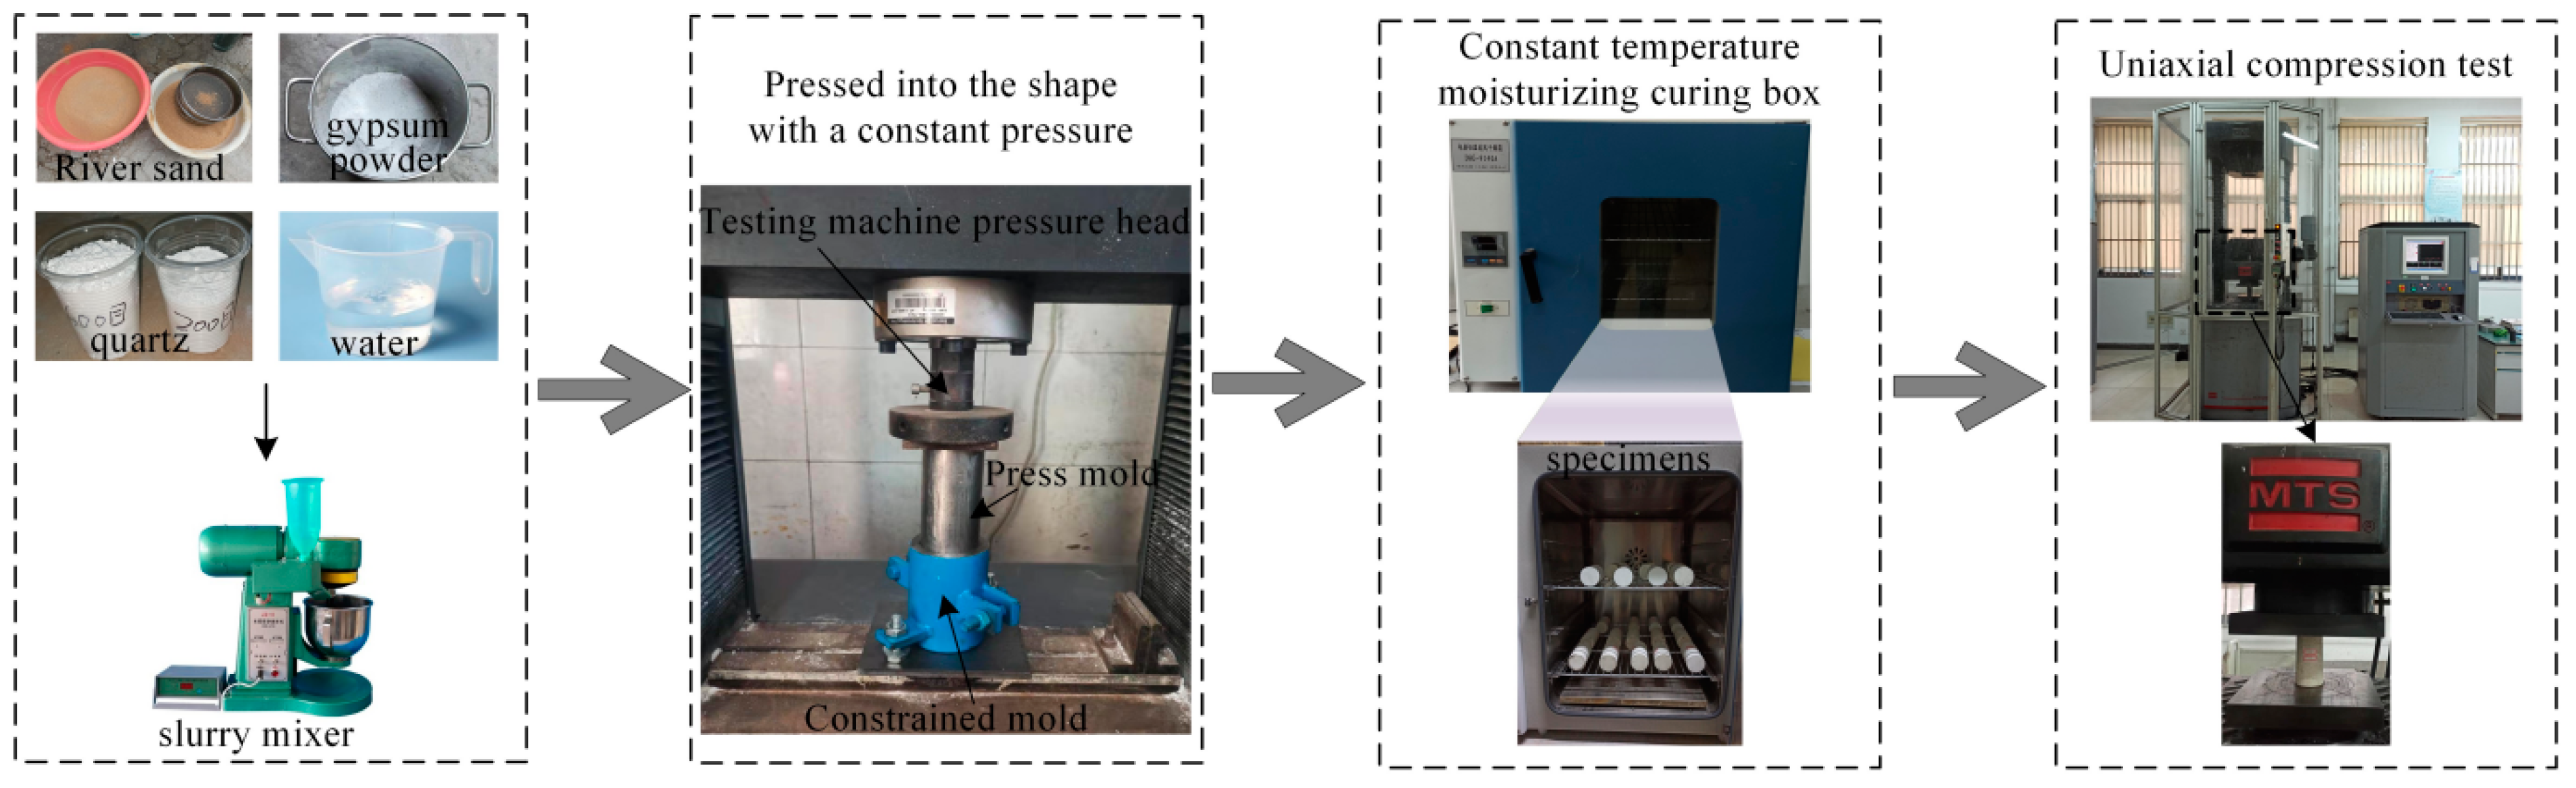
2.3. Preparation of Gypsum-Mixed Sandstone-Like Specimens

In order to simulate the structural characteristics of sandstone under geological deposition, this study used a WDW-50 electro-hydraulic servo testing machine to exert a constant load on the upper surface of the specimen after initial setting and press it into the shape in a constrained mold as illustrated in Figure 2. The specific production steps are outlined as follows:
(1)
First, combine the river sand and quartz sand, then shake the mixture on a vibrating table for 2 min to make it homogeneous.
(2)
Mix the gypsum powder evenly in the prepared water.
(3)
Gradually add the gypsum solution slowly to the aggregates and mix continuously at 30 r·min−1 until there are no flocculants or air bubbles in the slurry.
(4)
Apply petroleum jelly evenly to the inner wall of the mold to facilitate the release of the specimen.
(5)
Allow the slurry to mix thoroughly for 1 to 3 min and then pour into the mold.
(6)
In order to simulate the stress state and structural formation characteristics of sandstone in a large burial depth roadway, place the specimen after reaching initial solidification in the prepared closed cylindrical mold and press it into the corresponding size and shape with a constant pressure of 3~5 KN by using the WDW-50 electro-hydraulic servo tester (the pressure needs to be adjusted according to the actual burial depth of the roadway).
F Y = γ H π r 2 C σ
where F Y denotes the constant load applied by the press; γ is the average rock capacity; H refers to actual burial depth of the rock formation; π is the circumference of the circle; r denotes the radius of the specimen cross-section; C σ is the stress similarity ratio between sandstone and similar materials.
(7)
Remove the mold after the initial setting of the specimens, and put the specimens in a constant-temperature moisturizing curing box for 28 days.
(8)
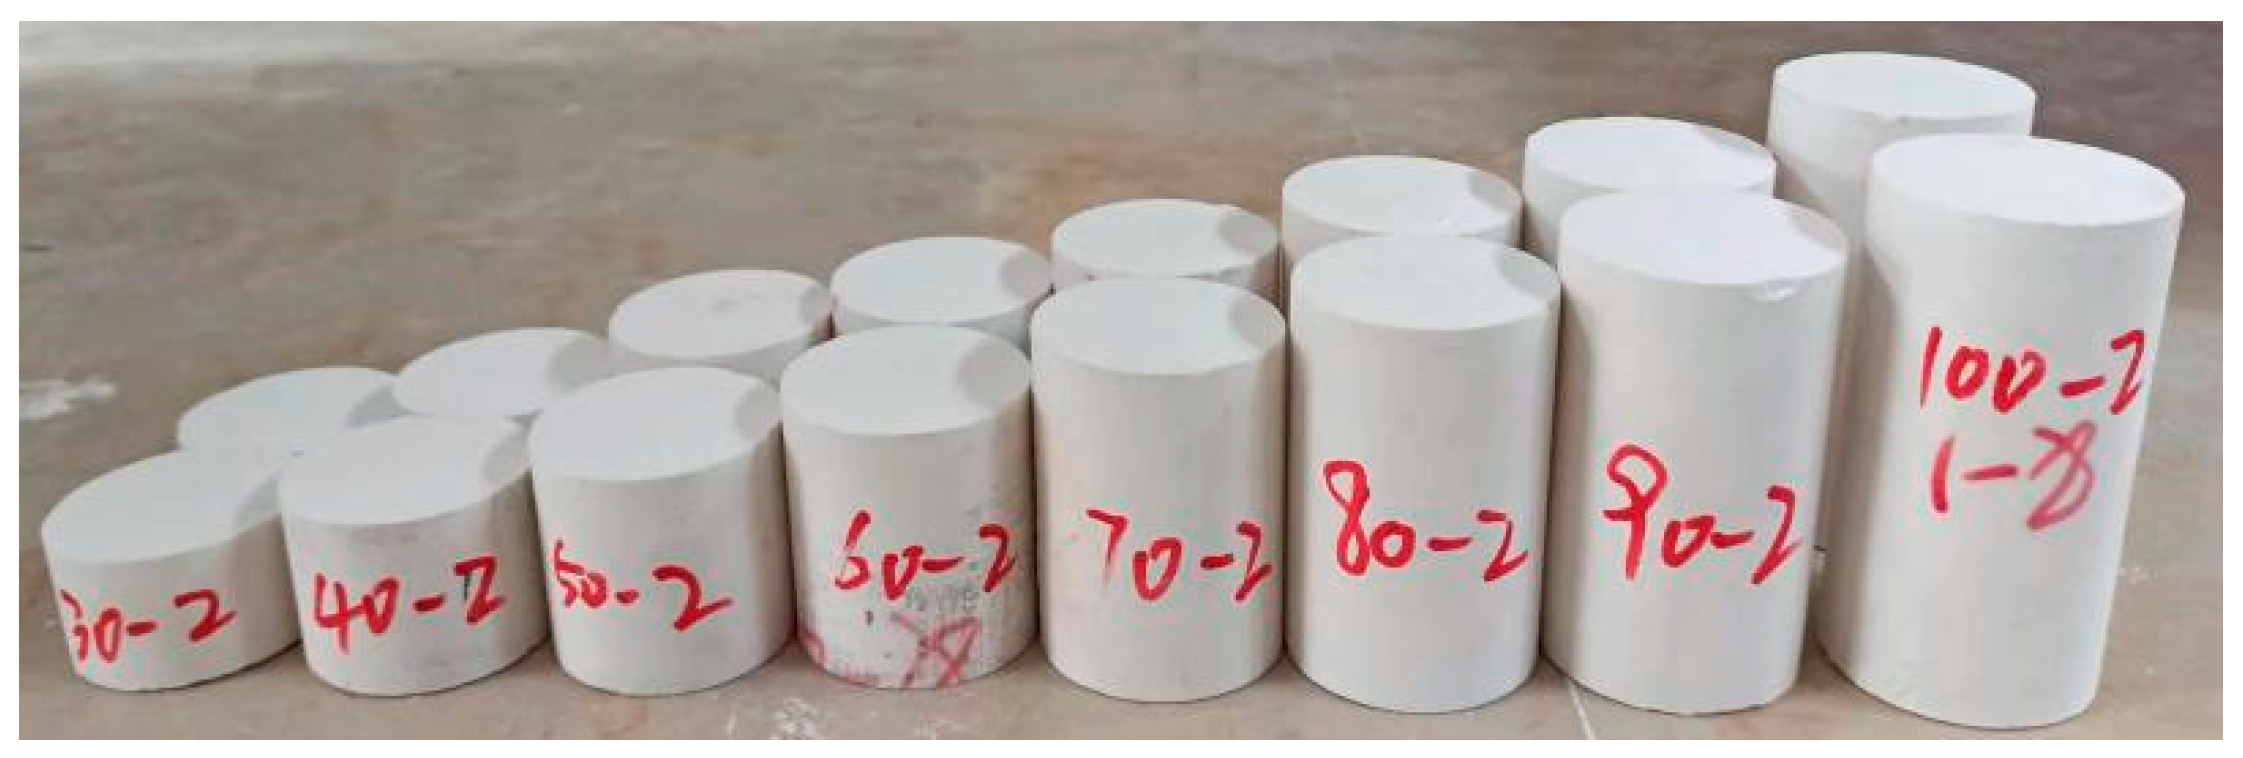
Cut and polish the prepared specimens into eight groups of cylindrical specimens with a diameter of 50 mm and a height of 30 mm, 40 mm, 50 mm, 60 mm, 70 mm, 80 mm, 90 mm, and 100 mm in different HDRs, as shown in Figure 3; in total, 80 rock-like specimens were produced.
(9)
The allowable deviation of the height and diameter of the same group of specimens is 0.3 mm; that of the unevenness of the two ends’ surfaces is 0.05 mm; and the ends’ surfaces should be perpendicular to the axis of the specimen to allow a deviation of 0.25°.

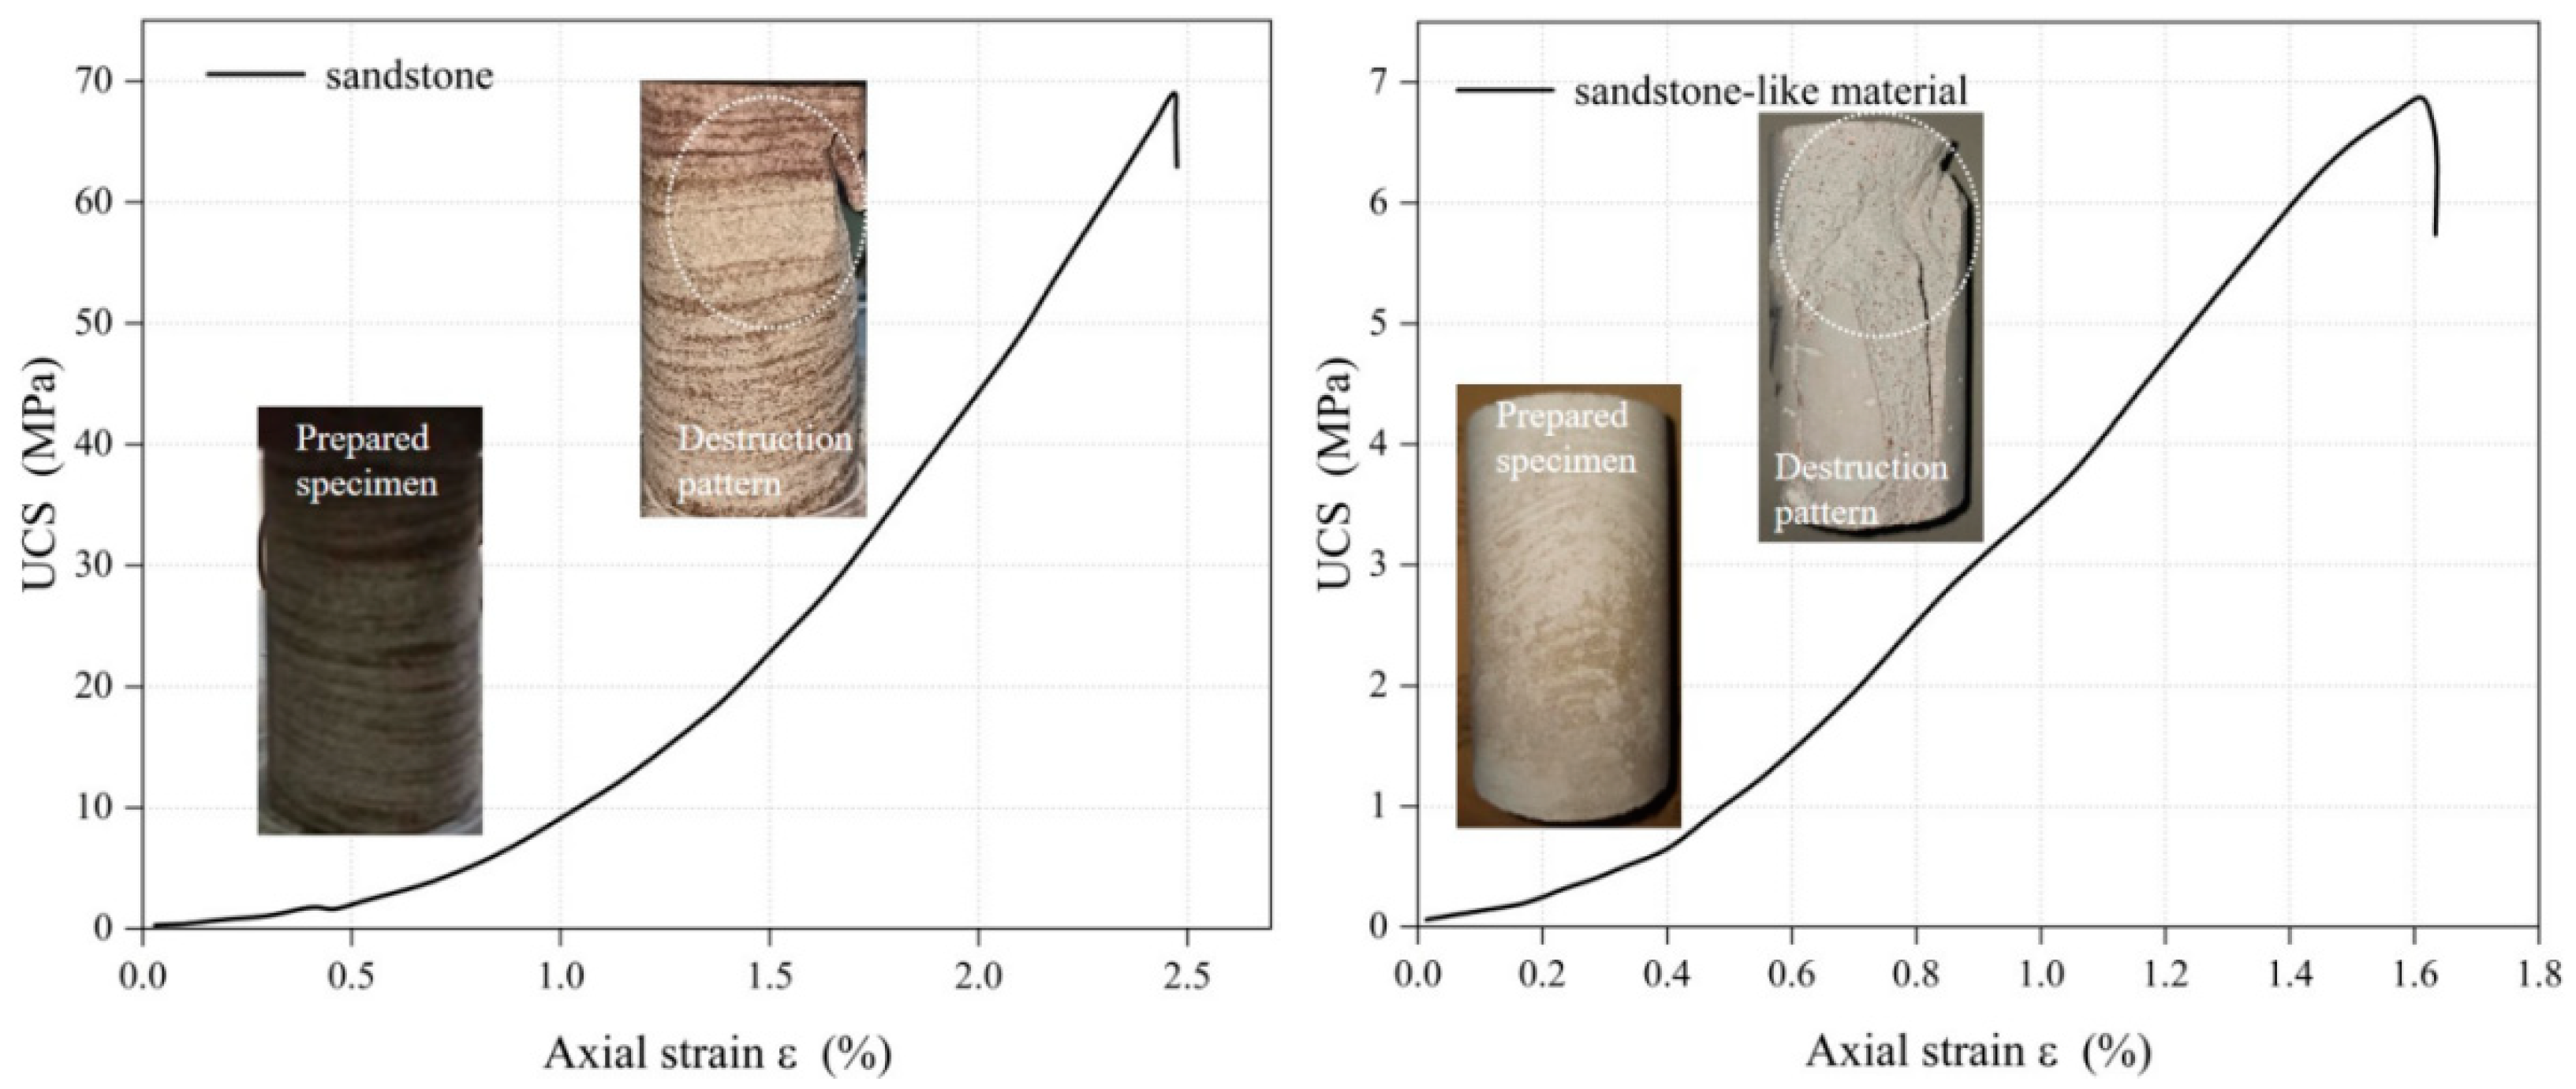
2.4. Performance Comparison

The sandstone-like specimens were polished to a size of φ50 × 100 mm, after which a uniaxial compression experiment was also performed at a LR of 0.5 MPa·s−1. The results showed that the average of UCS was 6.96 MPa. In contrast, the UCS of sandstone is 69.2 MPa, revealing a difference between the two is approximately ten times. The difference in density between the two is approximately two times. As is shown by the stress–strain curves Figure 4, the stress–strain curves were fitted, and the slope of the fitted straight line was taken as an approximate value for the elastic modulus. The slopes of the two fitted straight lines are similar and the goodness of fit approaches 1, suggesting that the elastic moduli of both materials are comparable. The failure characteristics and mechanical properties between sandstone and sandstone-like specimens are very similar, with a similar proportional relationship. The mechanical properties are shown in Table 2. This proves that it is feasible to use this kind of sandstone-like material to simulate sandstone [41].

3. Mechanical Experiment

3.1. Experimental Design and Method

The experimental design employed a single-factor rotation method in order to verify the law of the SE and LR on the mechanical parameters of gypsum-mixed sandstone-like specimens. The aim of the single-factor rotating experiment method was to reduce the number of experiments and save manpower while obtaining the best experimental results with fewer factors and more influence levels [42,43].
The SR is the LR per unit height of the specimen [44,45,46,47], as shown in Formula (2). Coal mine load states can be classified based on the SR, as shown in Table 3. Additionally, the deep roadway in aimed coal mine was used to subject to a stress environment similar to quasi-dynamic loading conditions.
ε ˙ = U ˙ r H × 60
where U ˙ r denotes the displacement LR, mm·min−1; ε ˙ is the SR, s−1; and H is the height of the specimen, mm.
A different SR loading uniaxial compression experiment was designed according to Table 3. There were three loading conditions, namely, static, quasi-dynamic and dynamic. Firstly, uniaxial compression experiments were carried out on the 50 mm-diameter specimens whose height ranged from 30 mm to 100 mm at a certain LR of 0.8 mm·min−1 (quasi-dynamic). The experimental LRs selected included 0.1 mm·min−1, 0.2 mm·min−1, 0.5 mm·min−1, 1 mm·min−1, 2 mm·min−1, 5 mm·min−1, 10 mm·min−1, 20 mm·min−1 and 50 mm·min−1. Subsequently, uniaxial compression experiments on sandstone-like specimens with a diameter of 50 mm and a height of 100 mm were performed at different LRs. Before the test, a small amount of butter was applied on the upper pressure contact sheets to avoid causing the friction between the end face of the specimens and the testing machine. The uniaxial load and displacement values were measured in real time by an automated data acquisition system. In order to reduce the test errors, every test was repeated three times, and the average value was taken as the final result [48].

3.2. Analysis of the Experimental Results

Based on previous research [19,29], segmented fitted curves were found to be the most effective means of reflecting the SE pattern. The HDR of the sandstone-like specimens was divided into 0.6~2 (diameter of 50 mm and height ranging from 30 mm to 100 mm). And the changing trend of stress–strain curve was also divided in accordance with the three loading conditions: static, quasi-dynamic, and dynamic under the different LRs. The experimental results are shown in Table 4.

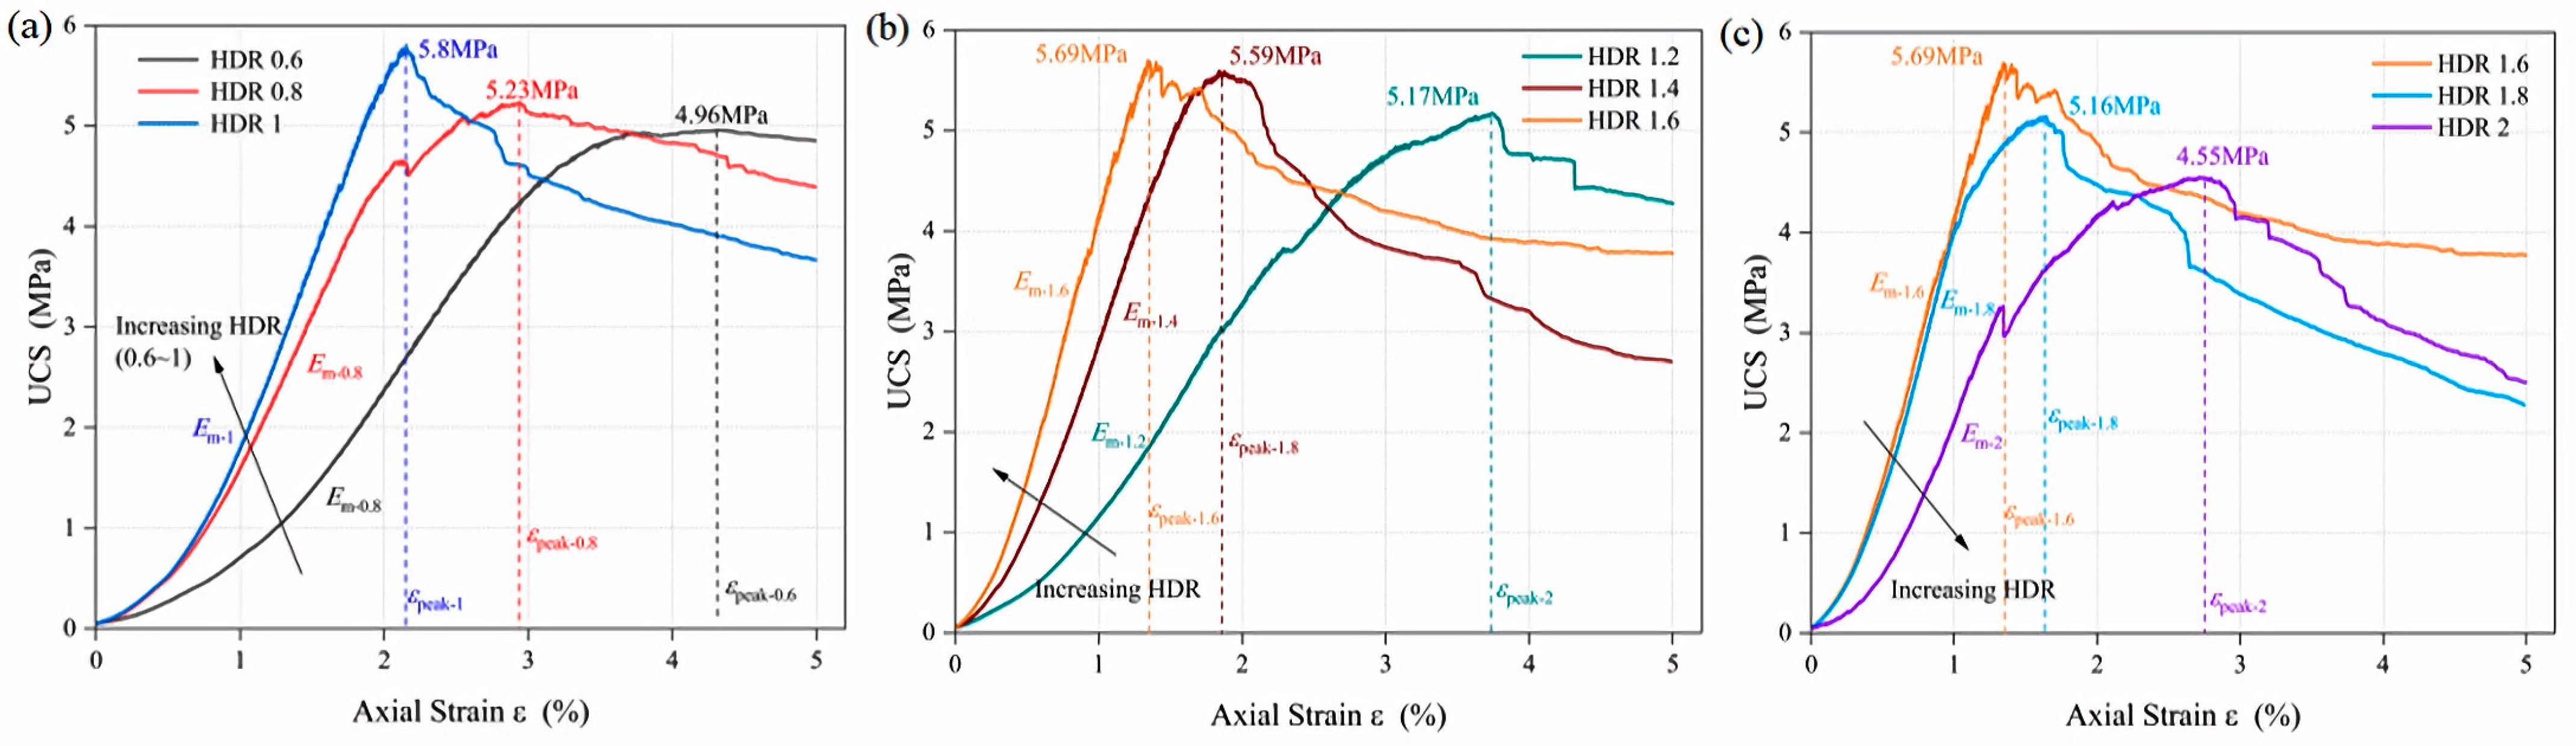
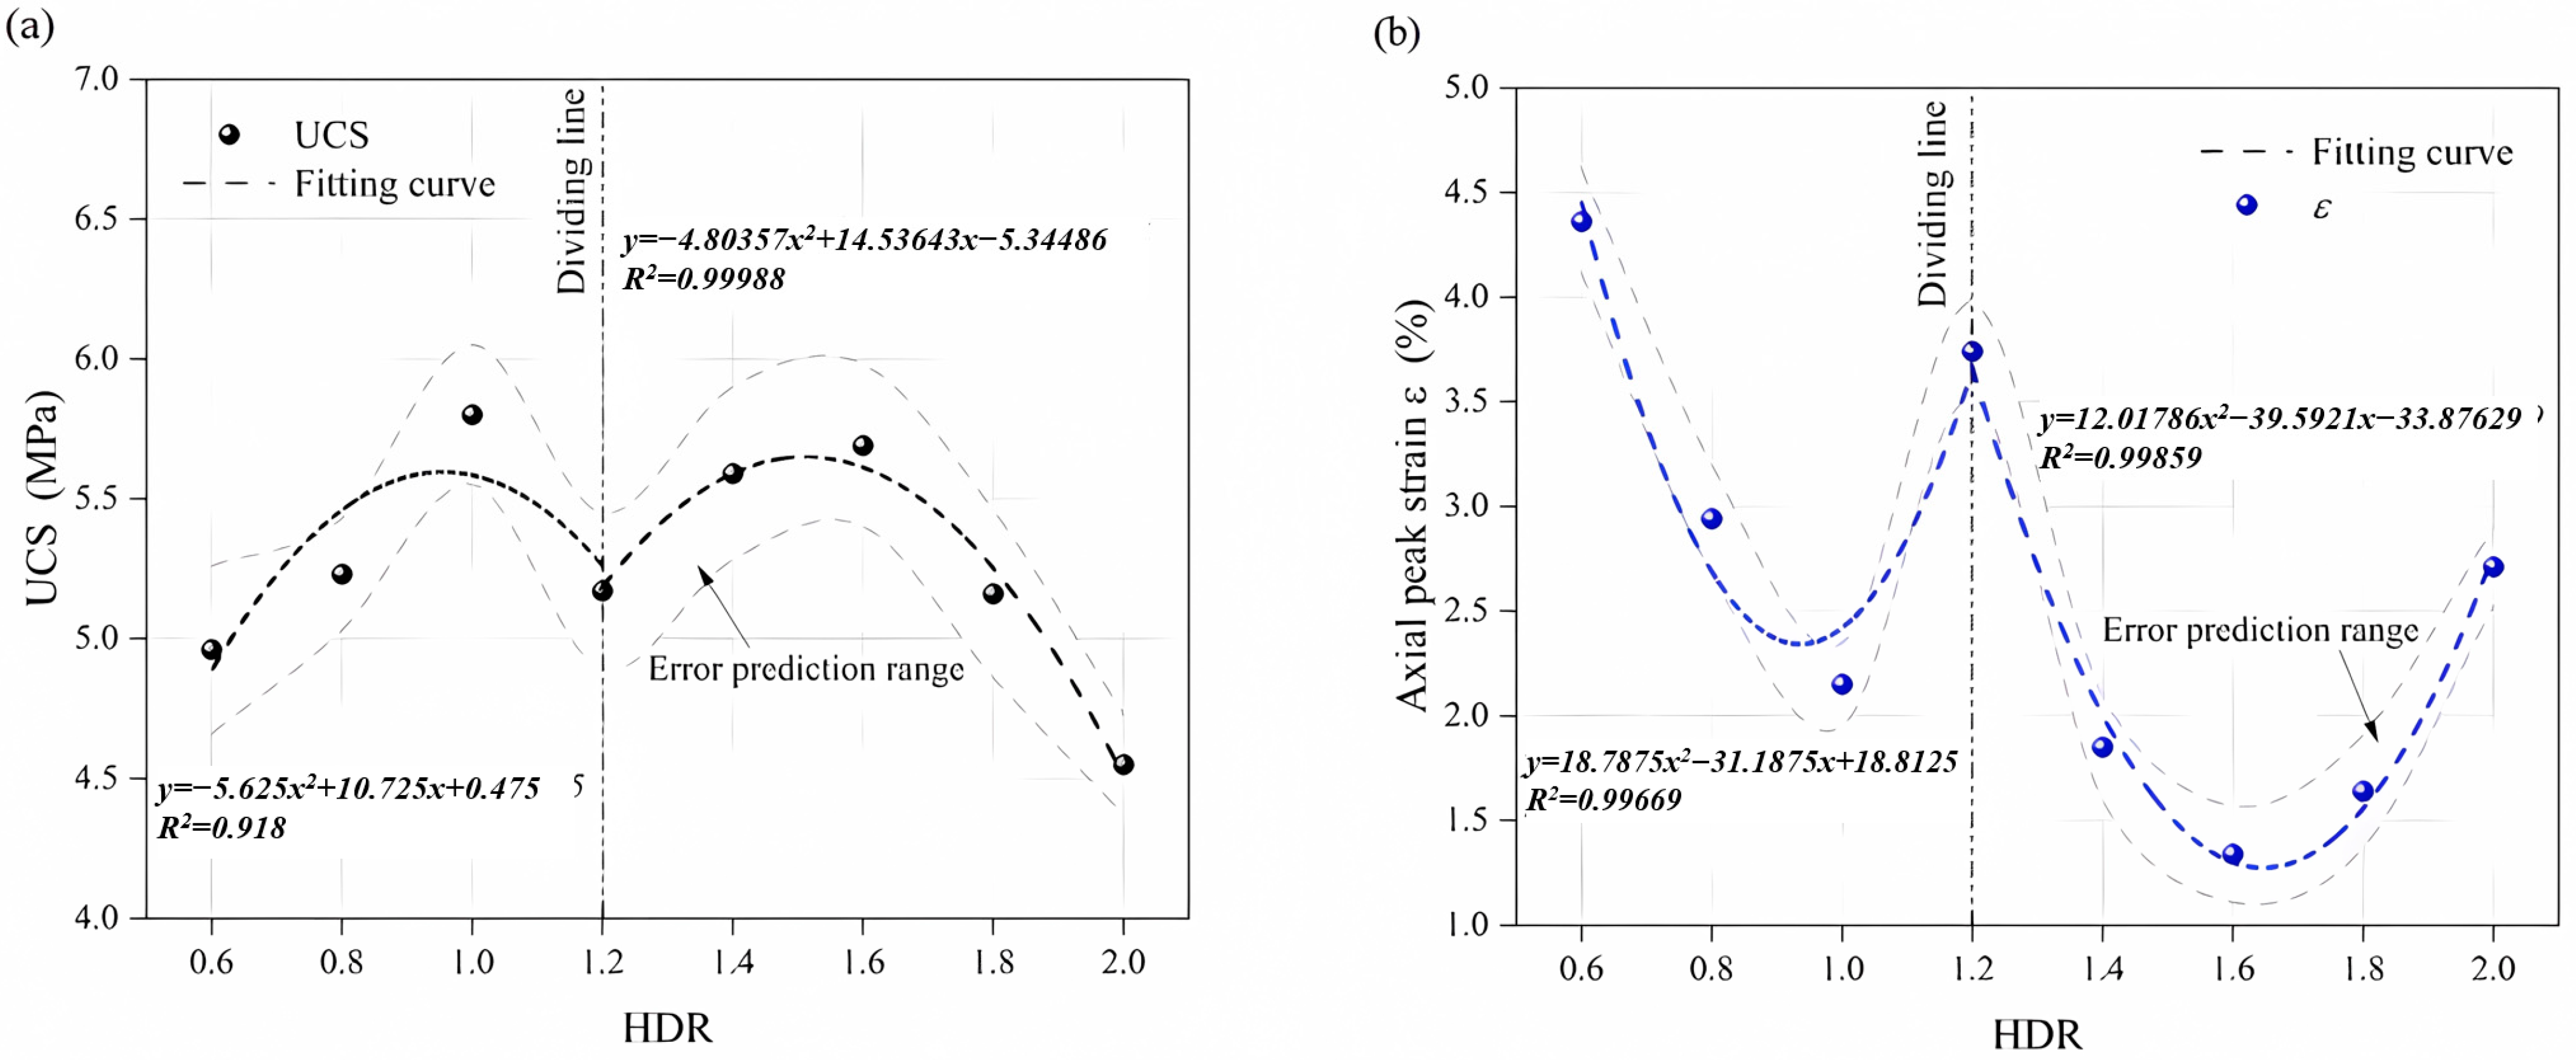
3.2.1. Different HDRs

In order to observe more clearly the trends in mechanical parameters such as UCS with the HDR, the stress–strain curves are plotted in Figure 5. It can be seen that specimens with different HDRs display different trends. They did not increase or decrease monotonically. At a HDR range of 0.6~1, the UCS increases with an increasing HDR and the peak strain decreases accordingly, and from the degree of inclination of the elastic phase of the curve, it can be seen that the elastic model also increases. The same pattern is satisfied at a HDR of 1.2~1.6. However, at HDRs of 1.6~2, the mechanical parameters change in the opposite trend. The details are analyzed below. Those with HDRs less than 1 are affected by end effects and show X-shaped failure. Those with HDRs greater than or equal to 1.2 have obvious unilateral development of cracks. In order to obtain these results, a total of 45 samples, 5 for each of the nine specimens with HDRs ranging from 0.6 to 2, were tested. Taking 1.2 as the turning point, this is also reflected in the subsequent numerical simulation.

UCS

Figure 6a illustrates that as the HDR increases, the UCS value displays a changing trend that is M shaped. The curve is fitted by two parts with a HDR of 0.6~1.2 and 1.2~2, and the fitting parameter is good, R2 is 0.918 and 0.99988, respectively in order to obtain the fitted Formula (3) for the UCS at each stage. When the HDR ranges from 0.6 to 1.2, the UCS roughly tends to first increase fast and then decrease slowly. The maximum UCS, 5.8 MPa, during this stage is obtained when the HDR is 1. After passing the dividing line of a HDR of 1.2, the UCS curve shows a trend of first fast growth then reducing significantly. And the maximum value of the UCS, 5.69 MPa, in this interval is obtained at a HDR of 1.6. Additionally the UCS has a small error prediction range, indicating it is low dispersion. Therefore, within the HDR range of 0.6~2, UCS presents different change trends, and the maximum value is obtained at a HDR of 1. However, the UCS does not completely decrease with the increase in size; when the HDR ranges from 0.6 to 1, the UCS follows an increasing trend. This is not consistent with previous conclusions that as the size increases, UCS gradually decreases to stabilize [4,6,7,10,31]. However, this result seems to coincide with the conclusions of Hawkins and Masoumi [1,20] that the UCS increases within a certain HDR range and gradually decreases when exceeding this range.
y 1 = 5.625 x 2 + 10.725 x + 0.475 y 2 = 4.80357 x 2 + 14.53643 x 5.34486 E 1 = 18.7875 x 2 31.1875 x + 18.8125 E 2 = 12.01786 x 2 39.59215 x + 33.87629
where y 1 is the UCS value when the HDR is 0.6~1.2, MPa; y 2 is the UCS value when the HDR is 1.2~2, MPa; E 1 is the peak axial strain when the HDR is 0.6~1.2, %; E 2 is the peak axial strain when the HDR is 1.2~2, %; x is the HDR.

Axial Peak Strain ε

The peak strain is inversely proportional to the UCS, mainly due to the gap in the elastic modulus. Under the same compressive strength, as the elastic modulus increases, the peak strain decreases. As can be seen from Figure 5, when the HDR ranges from 0.6 to 1, the curve slope increases, the elastic modulus of the specimen gradually increases, and the peak strain gradually decreases. When the HDR ranges from 1 to 1.6, the curve slope increases to the maximum value, at which point the elastic modulus of the specimen reaches the maximum value, and the peak strain reaches the minimum value. When the HDR ranges from 1.6 to 2, the curve slope decreases, the elastic modulus of the specimen gradually decreases, and the peak strain gradually increases.
As illustrated in Figure 6b, as the HDR increases, ε shows a “W-shaped” segmental changing trend, which is roughly opposite to that of UCS. It is also fitted by dividing the curve into two parts with the HDR of 1.2 as the dividing line. The fitting results demonstrate a high degree of accuracy, with R² values of 0.99669 and 0.99859, respectively. When the HDR is within the range of 0.6~1.2, the ε fast reduce then sharply increase; and the minimum value appears when the HDR is 1. Conversely, when the HDR is between 1.2 and 2, the ε significantly decrease followed by a rapid increase. And the minimum value appears when the HDR is 1.6. However, when the HDR is 1.2, another peak value of ε appears, which is not a coincidence in that the trends in UCS also reflect this behavior. In other words, the HDR corresponding to the peak point in the UCS is exactly the opposite in the axial peak strain, e.g., HDRs of 1, 1.2 and 1.6. The discretization is also low. Comparison of the variation curves of UCS and ε indicates that the degree of brittleness of such gypsum-mixed sandstone-like materials becomes more pronounced at higher strengths. In particular, ε is significantly lower for HDRs greater than 1.2, with values falling below 3%.

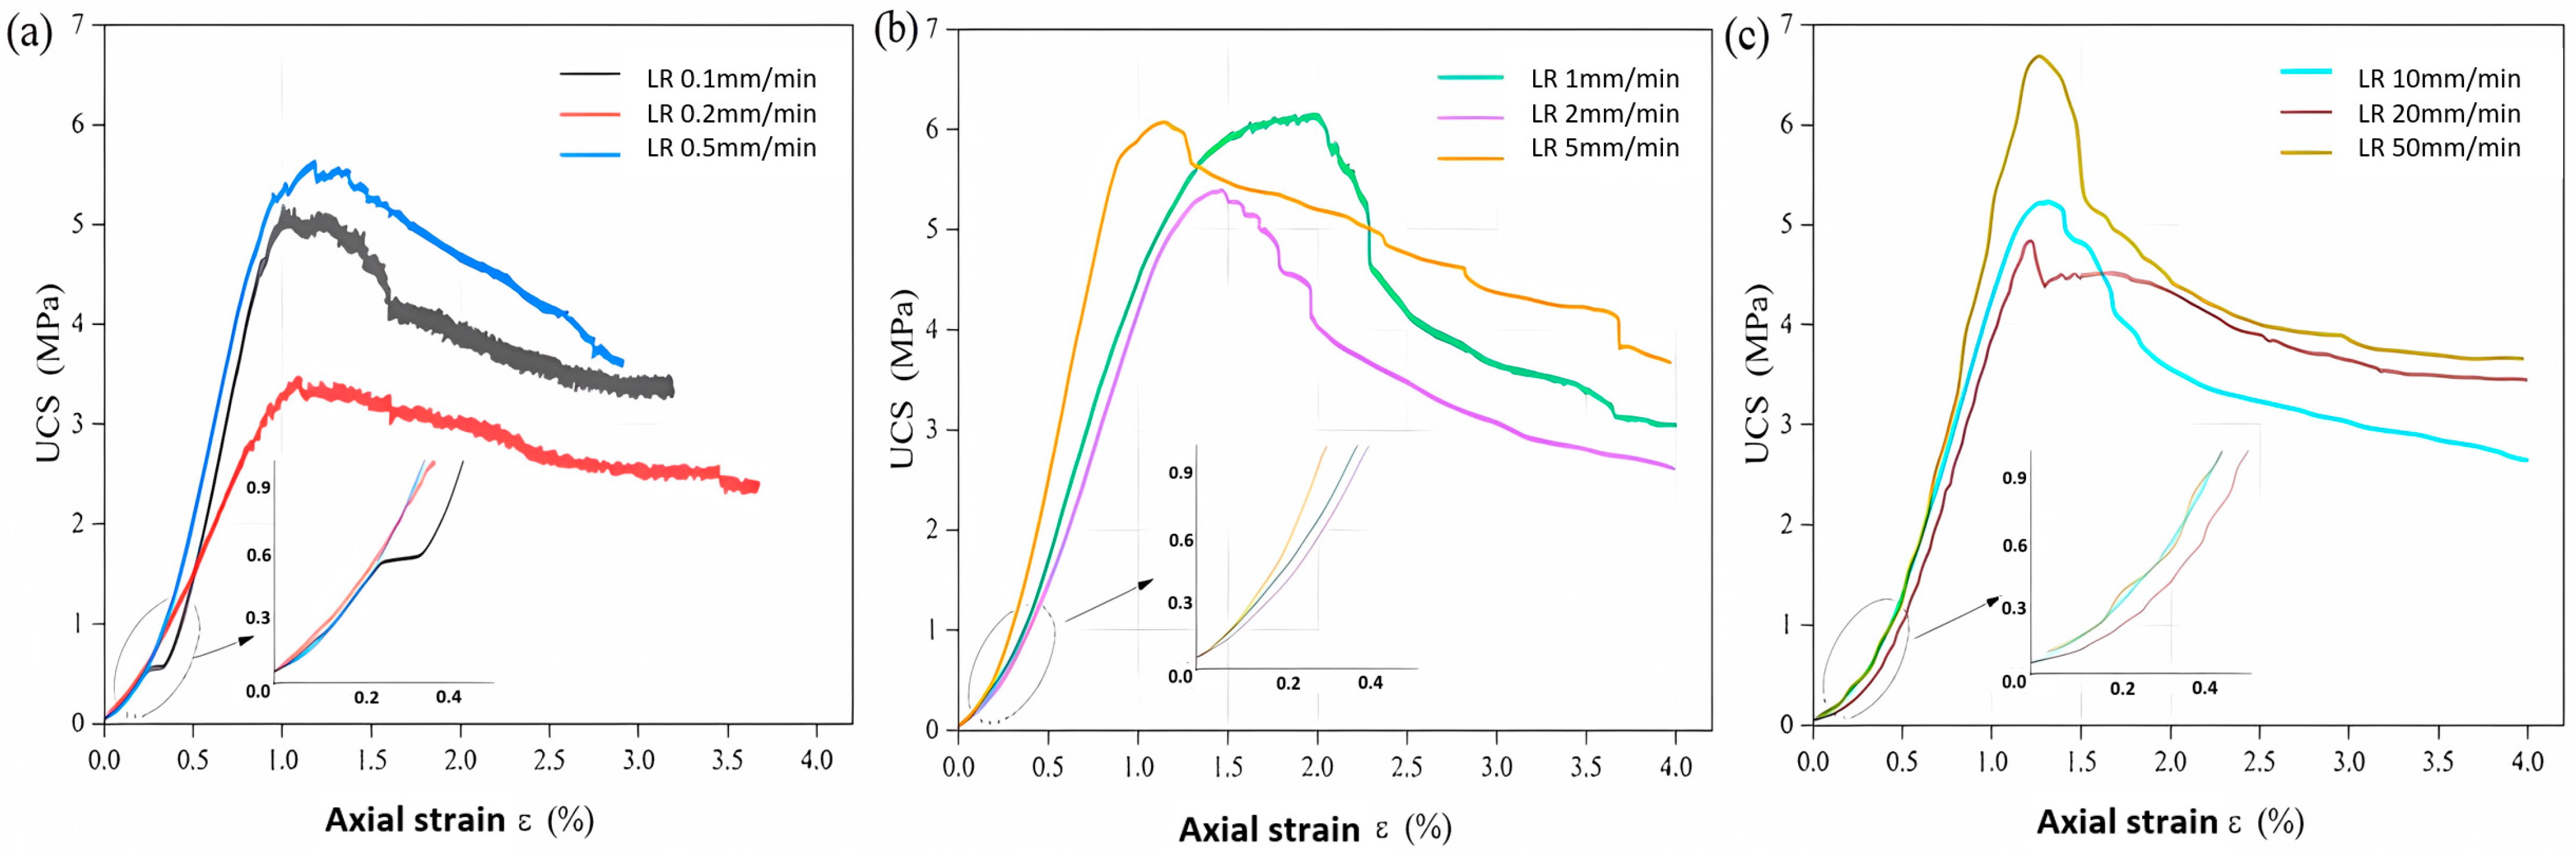
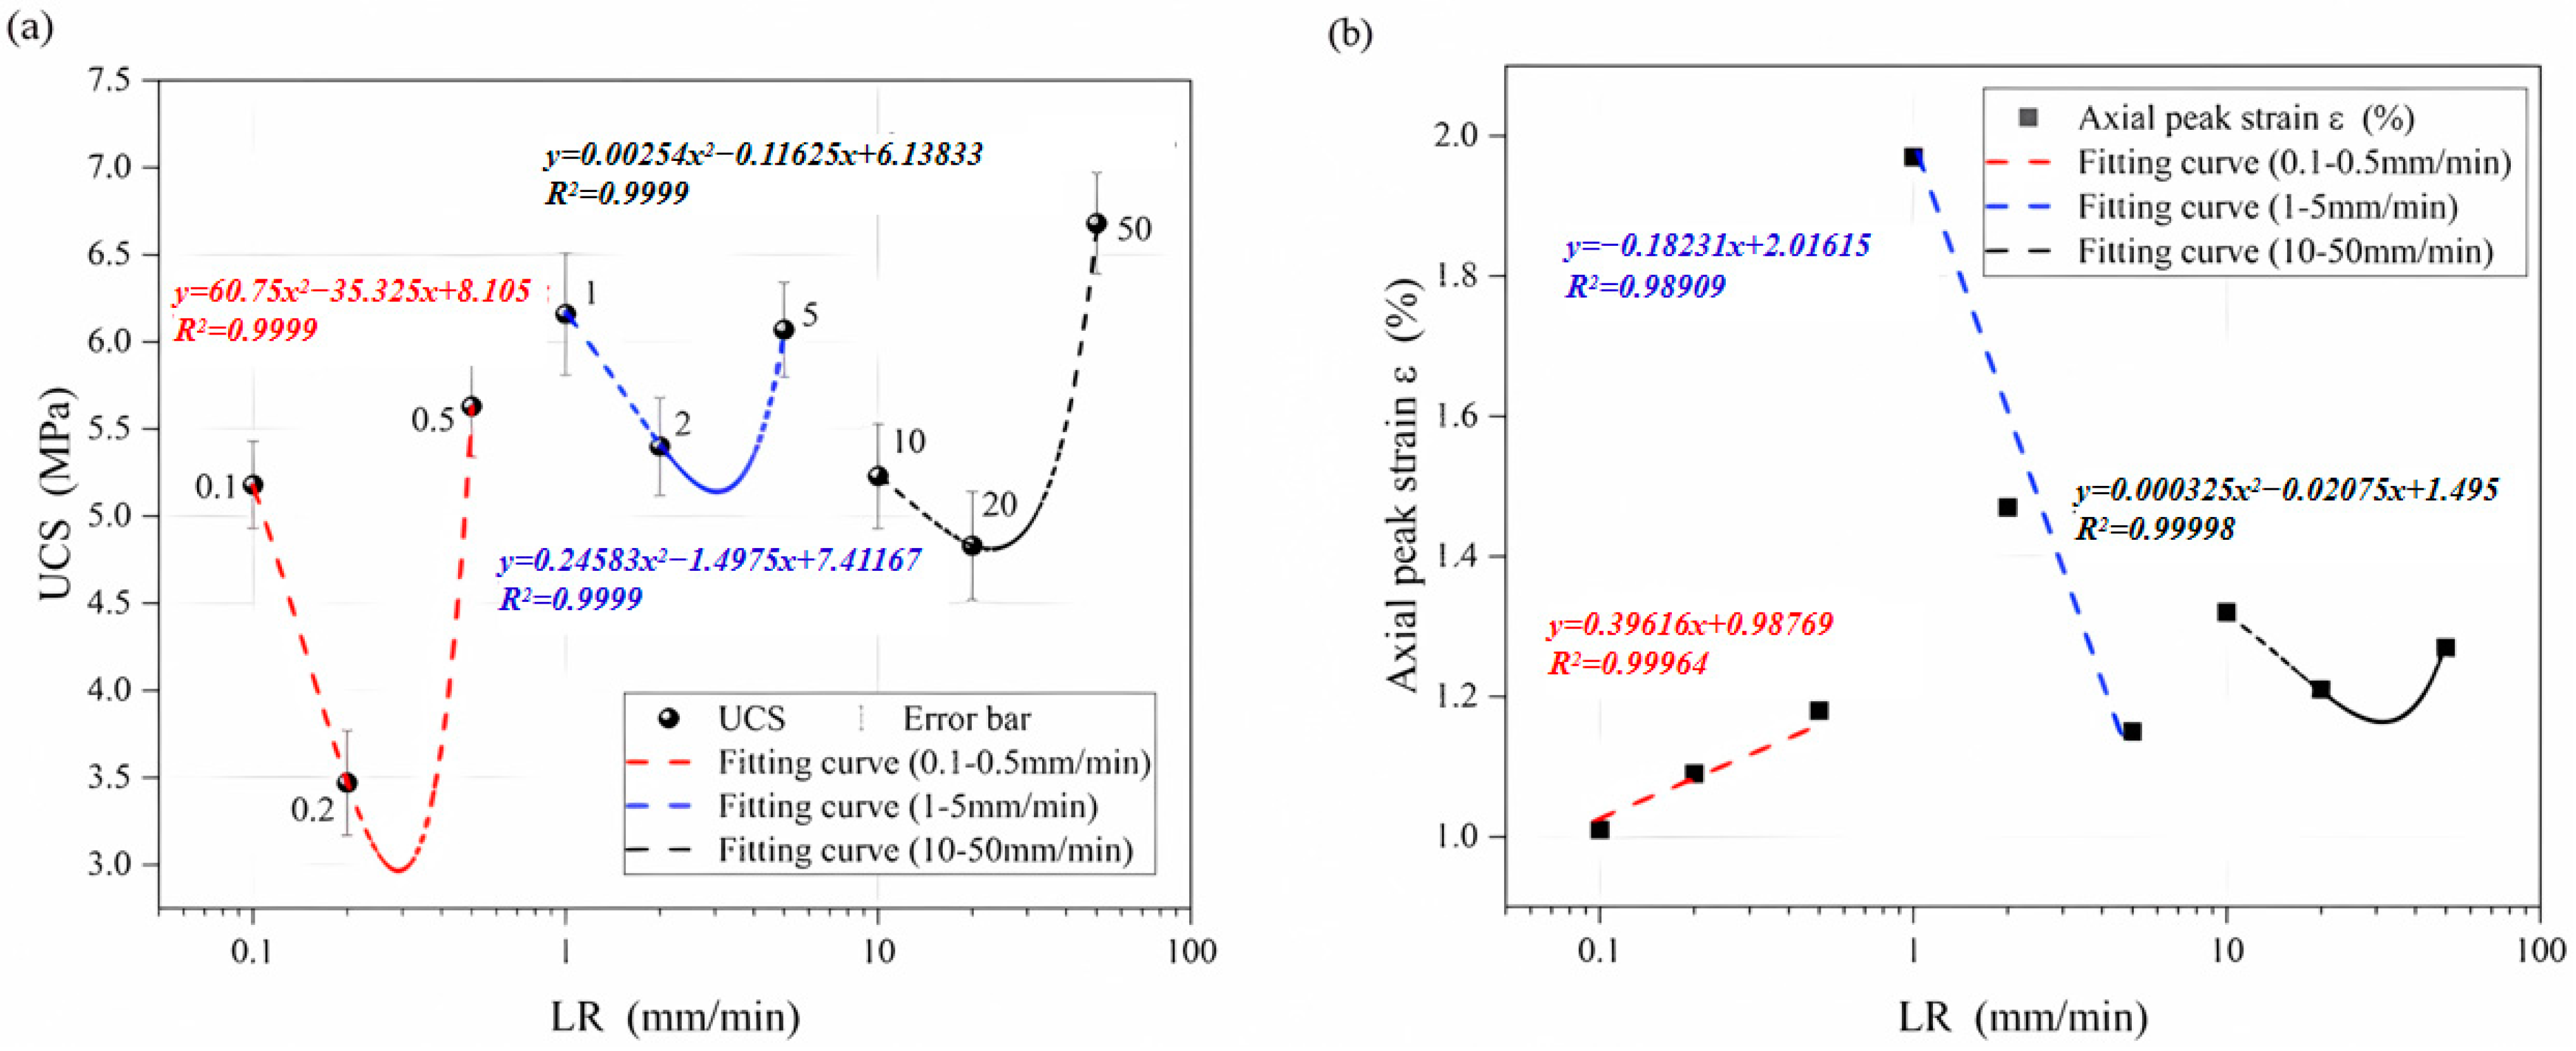
3.2.2. Different LRs

There are three SR loading conditions based on the LR, namely, static (0.1~0.5 mm·min−1), quasi-dynamic (1~5 mm·min−1), and dynamic (10~50 mm·min−1). The fitted Formula (4) and R2 values for the UCS and axial peak strain under these three states are also obtained, respectively. From Figure 7, it can be seen that the stress–strain curves of the specimens in the three SR loading states have different trends. However, during the original fracture compaction stage, the strain of the specimen was higher under static loading conditions, especially at 0.1 mm·min−1, indicating that the loading rate is low enough to allow a more fully integrated expansion of the internal cracks.
U 1 = 60.75 x 2 33.325 x + 8.105 U 2 = 0.24583 x 2 1.4975 x + 7.41167 U 3 = 0.00254 x 2 0.11625 x + 6.13833 A 1 = 0.39616 x + 0.98769 A 2 = 0.18231 x + 2.01615 A 3 = 0.000325 x 2 0.02075 x + 1.495
where U 1 and A 1 are the UCS value and peak axial strain when the SR in the static phase (0.1~0.5 mm·min−1), respectively; U 2 and A 2 are the UCS value and peak axial strain when the SR in the quasi-dynamic phase (1~5 mm·min−1), respectively; U 3 and A 3 are the UCS value and peak axial strain when the SR in the dynamic phase (10~50 mm·min−1), respectively; x is the LR.

UCS

From Figure 8a, it can be seen that the UCS of sandstone-like specimens with the same HDR does not increase or decrease monotonically under different LRs. The fitting was carried out according to each of the three loading states, which fitted well with a R2 of 0.9999, 0.9999 and 0.9999, respectively. The trend for each SR phase is approximately the same: first decrease and then increase. During the static phase, the lowest value of UCS, 3.47 MPa, is obtained at 0.2 mm·min−1. In the quasi-dynamic stage, a similar pattern of variation is observed, with the lowest value of UCS occurring at 2 mm·min−1 with 5.4 MPa. However, the UCS of the specimens in the quasi-dynamic phase are generally greater than those in the static phase. In the dynamic loading phase, the UCS values of the specimens with LRs between 10 and 20 mm·min−1 are smaller, and the lowest value appear at 20 mm·min−1. However, at a LR of 50 mm·min−1, the value of UCS is 6.68 MPa, which is the maximum across all phases. Additionally, all error bars are small, indicating a low discretization.
Axial Peak Strain ε he trend in ε varies at different phases of SRs (Figure 8b). The fitting parameter R2 are 0.99964, 0.98909 and 0.99998, respectively. During the static loading phase, as the LR increases, the ε rises slowly with a slope rate of 0.39616. There is a sharply rise trend during the transition from the static phase to the quasi-dynamic loading phase. The ε tends to decrease rapidly during the quasi-dynamic loading process. However, the values are greater than those observed during the static loading phase. In the dynamic loading phase, the curve of ε first slowly decrease and then quickly increase as the LR increases. These changing characteristics are not consistent with UCS, indicating that different LRs have some effect on the elastic modulus of the specimens. The elastic modulus reflects a rock’s ability to resist deformation and also represents the strength of the bonds between microscopic particles within the rock. This shows that different LR environments have a pronounced effect on the internal structure of the same specimen as well as on the bonding ability between microscopic particles.

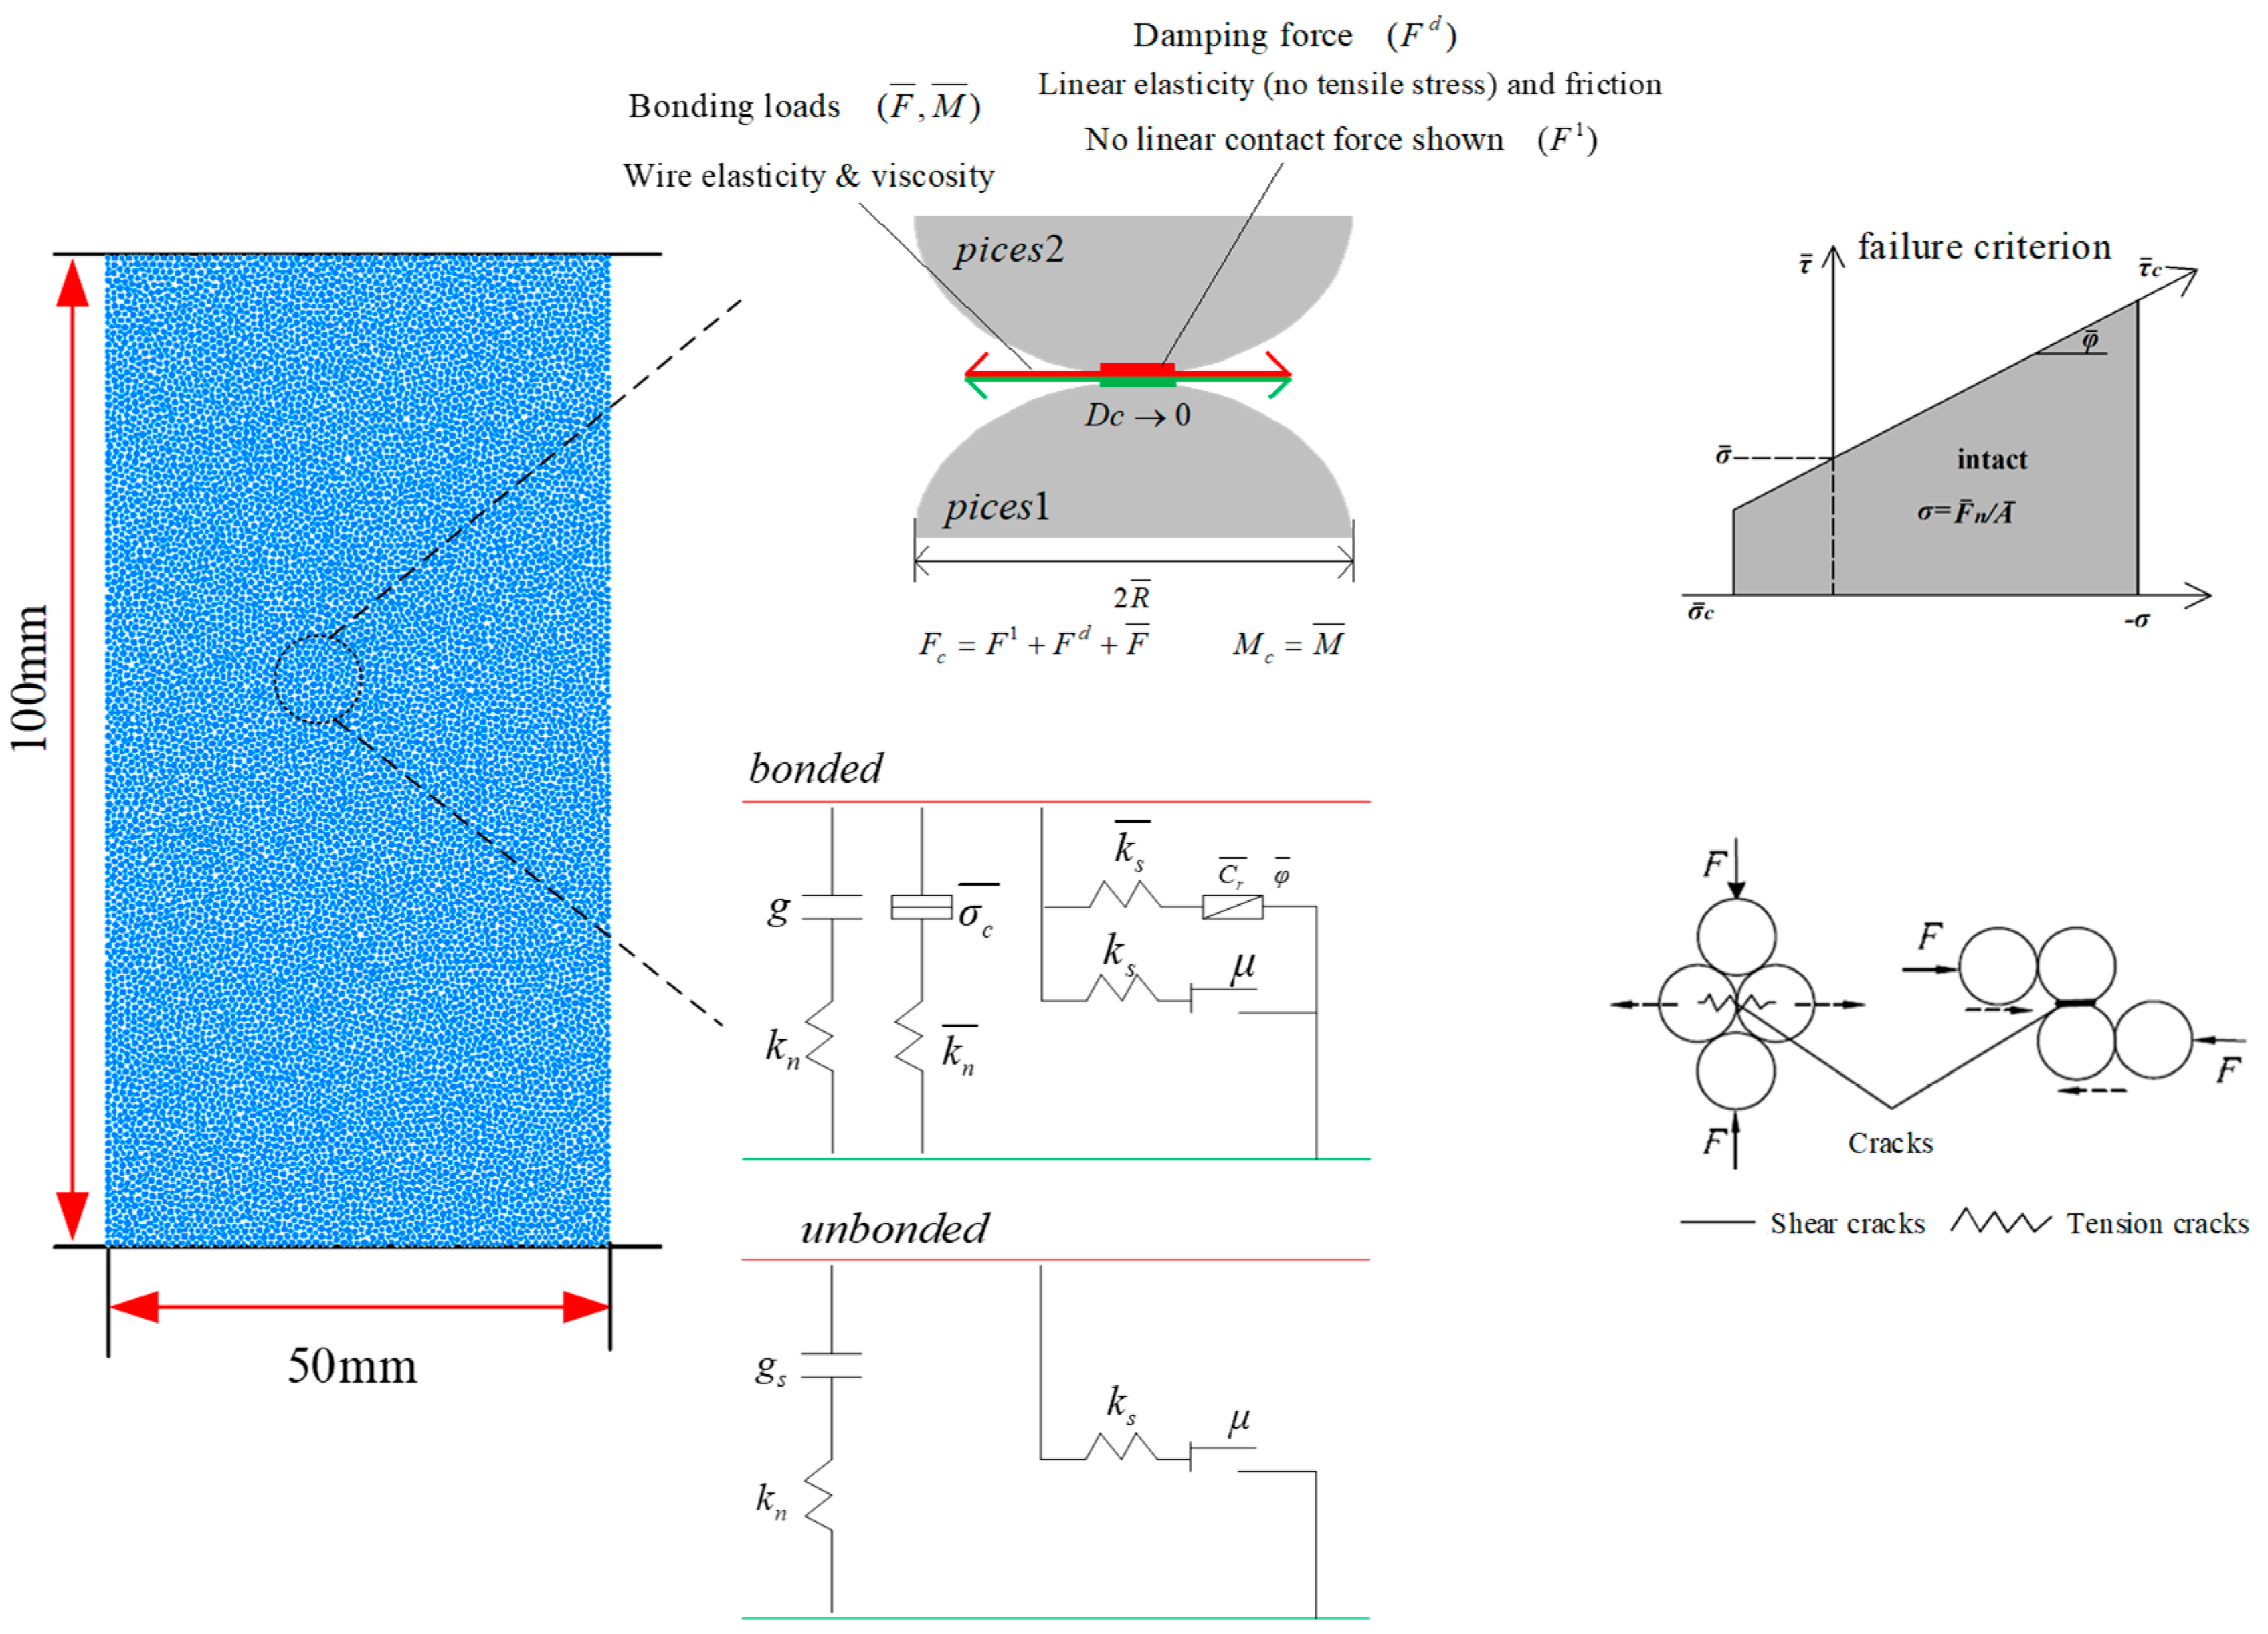
4. Numerical Simulation

The formation and development of cracks are fundamental causes of damage to the specimen. However, the development and expansion of the specimen internal crack cannot be observed during the loading process. Numerical simulation is a better method for observing the development and number of cracks within the specimen.

4.1. Model Configuration

A numerical model was developed to simulate uniaxial compression on sandstone-like specimens with different LRs and HDRs. The purpose is to observe crack distribution and changes in the damage process of the specimen, and then reveal the cause and mechanism of the SE and LR effect. The Particle Flow Code (PFC) is based on a discrete cell approach, which treats rock-like materials as an aggregate of rigid particles. This model overcomes the limitations of traditional continuous media analysis methods in the study of rock-like inhomogeneous materials and allows for the spatial and temporal evolution of crack incubation, extension and penetration to be accurately reproduced from a fine-scale perspective [49,50,51].
Rocks are composed of a collection of mineral particles, and the parallel bonding model (PBM) is mostly used in numerical simulations of rock materials. The PBM is capable of transferring both forces and moments, which is more realistic. PBM can be seen as consisting of linear spring set and a parallel bonded spring set, as shown in Figure 9. And in the model, a rock can be interpreted as a combination of discs of finite thickness, which are interconnected by bonding bonds that possess finite stiffness at both the contact points between the discs and in the bonded area. When the applied local stress (i.e., tension, shear or rotational moment) exceeds the specified bond strength, these bonds break to form a microcrack, and the code of destruction is subject to the Mohr–Coulomb theory.
The PFC2D 6.0 software is based on Newton’s second law and the law of forces and displacements, which relate the forces and displacements of two microelements in contact with each other [52]. The PFC2D software makes the following basic assumptions in its calculations: (1) the particles are rigid; (2) contact occurs over a small area, i.e., point contact; (3) the contact is flexible and a certain amount of “overlap” is allowed at the contact; (4) the amount of “overlap “ is related to the contact force; (5) the contact has a special joint strength; (6) the particle units are represented as discs.
The PFC2D software explains the damage fracture mechanism of materials from a fine-grained mechanical point of view by recording the cracks that develop during the fracture damage of bonding bonds through the embedded fish language. This paper adopts the recommendation of POTYONDY et al. [53,54] for the calibration of the fine view parameters, assuming that the particles and the adhesive bonds have common deformation properties as Formula (5), with the maximum to minimum particle size ratio maintained at a constant value of 1.66. To mitigate the influence of end-face friction on the experimental results, we set the contact surface between the loading plate and the specimen as frictionless prior to the numerical simulation experiment.
E c = E c ¯ k n / k s = k n ¯ / k s ¯

4.2. Numerical Results

4.2.1. Different HDRs

The numerical simulation aligns closely with the experimental results to a high degree as shown in Figure 10. Figure 11 shows the damage morphology and fracture development of the PFC2D simulated specimens across different HDRs at the same LR of 0.8 mm·min−1. The damage mode and internal crack development morphology varies somewhat among the specimens with different HDRs. Notably, the number of primitive cracks within the specimen gradually reduces as the HDR decreases. However, for the HDR from 0.6 to 1, the number of cracks formed inside the specimens at the moment of damage is 698, 789 and 696, respectively. This is significantly higher than those for a HDR of 1.2 and 1.4—502 and 530, respectively (as shown in Figure 12a). Meanwhile, it can be seen that internal cracks running along the diagonal direction occur in the direction of shear damage when the HDR is between 1.6 and 2; the internal crack expansion direction becomes smaller when the HDR is between 1.2 and 1.4; however, with the HDR between 0.6 and 1, the specimen shows an end damage mode internally, with cracks on the upper and lower end faces coming together in a triangular shape towards the center, and the specimen shows the “X-conjugate” damage pattern.

4.2.2. Different LRs

Figure 12b illustrates the number of cracks within the specimen under different LRs. To be specific, the development and number of internal cracks vary during uniaxial compression damage of the specimens with the same HDR at different LRs. As the LR increases, the number of cracks formed gradually rises, especially in the dynamic loading phase, where the number of cracks formed by specimen damage is significantly higher than that observed in static and quasi-dynamic loading phrases. Especially at a LR of 50 mm·min−1, the number of damaged fissures increases dramatically to 5931.
As stated by WASANTHA, at high strain rates, plastic strains may not develop sufficiently before the next level of stress increases, leading to hardening of the rock material and thus higher strength [55]. As can be seen from Figure 13, under static loading conditions (0.1~0.5 mm·min−1), due to the slow LR, the original cracks within the specimen to continue converging under the axial load and develop into multiple large cracks. In the quasi-dynamic loading phase (1~5 mm·min−1), the LR is larger than that of the static loading phase, and the specimen has been compressed and damaged before the internal fissures come to be “aware”, so that the primary cracks inside the specimen do not fully integrate. At this point, tensile cracks occur mainly between the spheres and the specimen and form a shear damage pattern along the diagonal direction. This is the same as the numerical simulation results for different HDRs. In the dynamic loading phase, cracking is in the form of a “large X” type of damage development. Especially at the LR of 50 mm·min−1, the number of cracks within the specimen increases significantly, resulting in the formation of multiple X-damage patterns.

5. Analysis for SE and LR Causes

5.1. The Mechanical Model

The EFE can increase the shear stress ( τ ) at the end face of the specimen, limiting the lateral deformation, resulting in the specimen showing tapered damage. The mode can be simplified as the specimen is broken into 4 parts, where there is friction between the blocks (as shown in Figure 14). According to the Mohr–Coulomb theory, we can obtain the following Formula (6).
σ 1 = σ 2 f cos θ τ = c + σ 1 tan φ
where σ is the stress applied by the press; σ 1 denotes the actual axial stress; τ is shear stress at the end face of the specimen; f is friction generated between the blocks; θ is the angle between conical block and vertical direction; c is the cohesion at the end face of the specimen; φ is the internal friction angle at the end face of the specimen.
Song et al. [56] assumed that the power consumed by end-face friction satisfied the Weibull distribution, which is given by:
W τ = 2 τ Δ v d s Δ v = v x 2 + v y 2 = μ v 0 h x 2 + y 2 r 2 = x 2 + y 2
where W τ is the power consumed by end-face friction; Δ v is the difference in speed between the test head and the surface of the specimen; v 0 is the loading speed of the test head; μ is Poisson’s ratio of the specimen; S is the cross-sectional area of the specimen; h is the height of the specimen; r is the radius of the specimen.
By combining Formulas (6) and (7), the coupling relationship can be expressed as (8).
W τ = 2 μ π r 3 c + σ 2 f cos θ tan φ v 0 h
In turn, the relationship between W τ with the HDR and the LR is obtained as Formula (9).
W τ = μ S v 0 c + σ tan φ 2 f cos θ tan φ d h
Δ 1 = W τ θ 1 W τ θ 2 < 0
It can be seen from Formula (9) that W τ is proportional to the LR and inversely proportional to the HDR. As the LR increases or the HDR decreases, the W τ increases accordingly. Meanwhile, when the height of the specimen is between 30 and 50 mm, the angle θ between the conical block produced by the damage and the vertical direction increases significantly ( θ 2 > θ 1 ). Also, θ ( 0 , π / 4 ) , cos θ could decrease as θ increases. Therefore, W τ will increase, i.e., Δ 1 < 0 (as Formula (10)).
The excessive W τ can reduce the actual amount of energy transferred inside the specimen (as Formulas (11)~(14)). In other words, under the same value of work done by the testing machine, the greater the W τ , the less real energy is actually transferred to the specimen, as illustrated in Figure 15. Therefore, a specimen that produces the EFE with the same W m (work done by the testing machine) has a passive enhancement of its ability to resist external loads. At the same time, the EFE will limit the specimen to undergo lateral deformation, which is equivalent to applying confining pressure to the specimen, thus increasing the load carrying capacity of the specimen. However, the EFE also resulted in more cracks in the specimen. This can be confirmed in experimental results and numerical simulations. The EFE discussed in this article are generated when the LR is too large (the dynamic loading phase) or when the HDR is too small (06~1). Therefore, the EFE is very harmful to engineering stability and safety, some measures should be taken to effectively avoid the generation of the EFE.
W m = W τ + W a
W a 1 = W m W τ θ 1
W a 2 = W m W τ θ 2
Δ 2 = W a 2 W a 1 < 0
where W m is the total output power of the test machine; W a is the actual input power inside the specimen.

5.2. Discussions

The number of primary fractures within the sandstone-like specimens of the same HDR is approximately the same. Based on Wasantha’s research [54], as can be seen from the aggregate grain size in sandstone-like specimens, when the specimens are damaged, not only is the bonding structure between the grain destroyed, but the internal part of the grain also experiences different degrees of damage through the transfer of forces. This is also confirmed in numerical simulations. At slower loading rates, the cracks in the specimens develop gradually, facilitating more extensive crack penetration and expansion. These cracks lead to lower strength by concentrating stress at the intersections and tips of the cracks, which in turn spreads out the applied stress [54]. This is similar to the findings of our mechanical modeling analysis and shows the reliability of the mechanical analysis. However, cracks within the grain are usually weak and do not lead to stress redistribution at a high SR. As the loading speed in the quasi-dynamic phase is too fast, the cracks within the specimen do not penetrate and converge in time, reducing the degree of destruction of the specimen, thus increasing the ability of the specimen to resist external loading, which results in a larger UCS in the quasi-dynamic phase compared to the static phase. However, the physical parameters change considerably during the dynamic loading phase because of the EFE in the loading process. For 50 mm·min−1, the very fast rate results in multiple new cracks due to the EFE, but it does not allow for complete fusion with the primary cracks before damage occurs and a large frictional effect is still formed between the broken specimens. At the same time, the lateral deformation at the end of the specimen is limited under the action of the EFE. The power consumed W τ through the EFE is significantly increase in 50 mm·min−1. Accordingly, its UCS value increases significantly. Based on the microstructural characteristics of rocks and the forming process of crack initiation and propagation at the macroscopic level, macroscopic viscosity during crack kinematic processes is considered as a critical factor contributing to the dynamic size effect [57]. As the strain rate increases, the variation trends with the size of the compressive strength, elastic modulus, and failure degree are distinctly intensified [58].
The results obtained in the SE also differ from previous studies where there is a monotonical decrease in specimen strength as the HDR increases. However, the UCS of the specimen with HDRs of 0.6~1 reached a maximum value. As the HDR is smaller (among 0.6~1), the height of the specimen is significantly smaller than the cross-sectional diameter, forming a greater end-face friction that prevents the lateral deformation and creates a constraining effect within the specimen, thus increasing the strength of the specimen. However, under the action of the EFE, the number of cracks inside the specimen was significantly increased. Although the larger HDR of the specimens may contain more internal random cracks, under quasi-dynamic loading conditions, the primary cracks in specimens not do not penetrate timely. According to St. Venant’s principle, the EFE should gradually weaken significantly with the increase in the HDR. However, at a HDR of 1.6, the UCS is relatively high, and based on Masoumi’s study [1], this may be due to the effect produced by defects on the surface of the specimen.
Before the experiment, the tester loading plates were uniformly greased with butter in order to reduce the friction between them and the specimens. However, during uniaxial loading, the EFE was still produced, which was related to the LR and the HDR of the specimen. In other words, the EFE is created during the loading process when it is influenced by the LR and SE, which occurs during the dynamic loading phase and the at a HDR of 0.6~1. Therefore, in order to accurately obtain the physical parameters of the real coal and rock and effectively avoid engineering disasters, the influence of the EFE on the experimental results should be mitigated as far as possible. Meanwhile, the EFE arising from different SEs and LRs could also provide a theoretical basis for the study of non-linear catastrophic changes in the surrounding rock under different stress environments. For example, the EFE studied in this paper may be used to provide a reference for the speed of roadway excavation and the size of coal pillars retained [59,60].

6. Conclusions

(1)
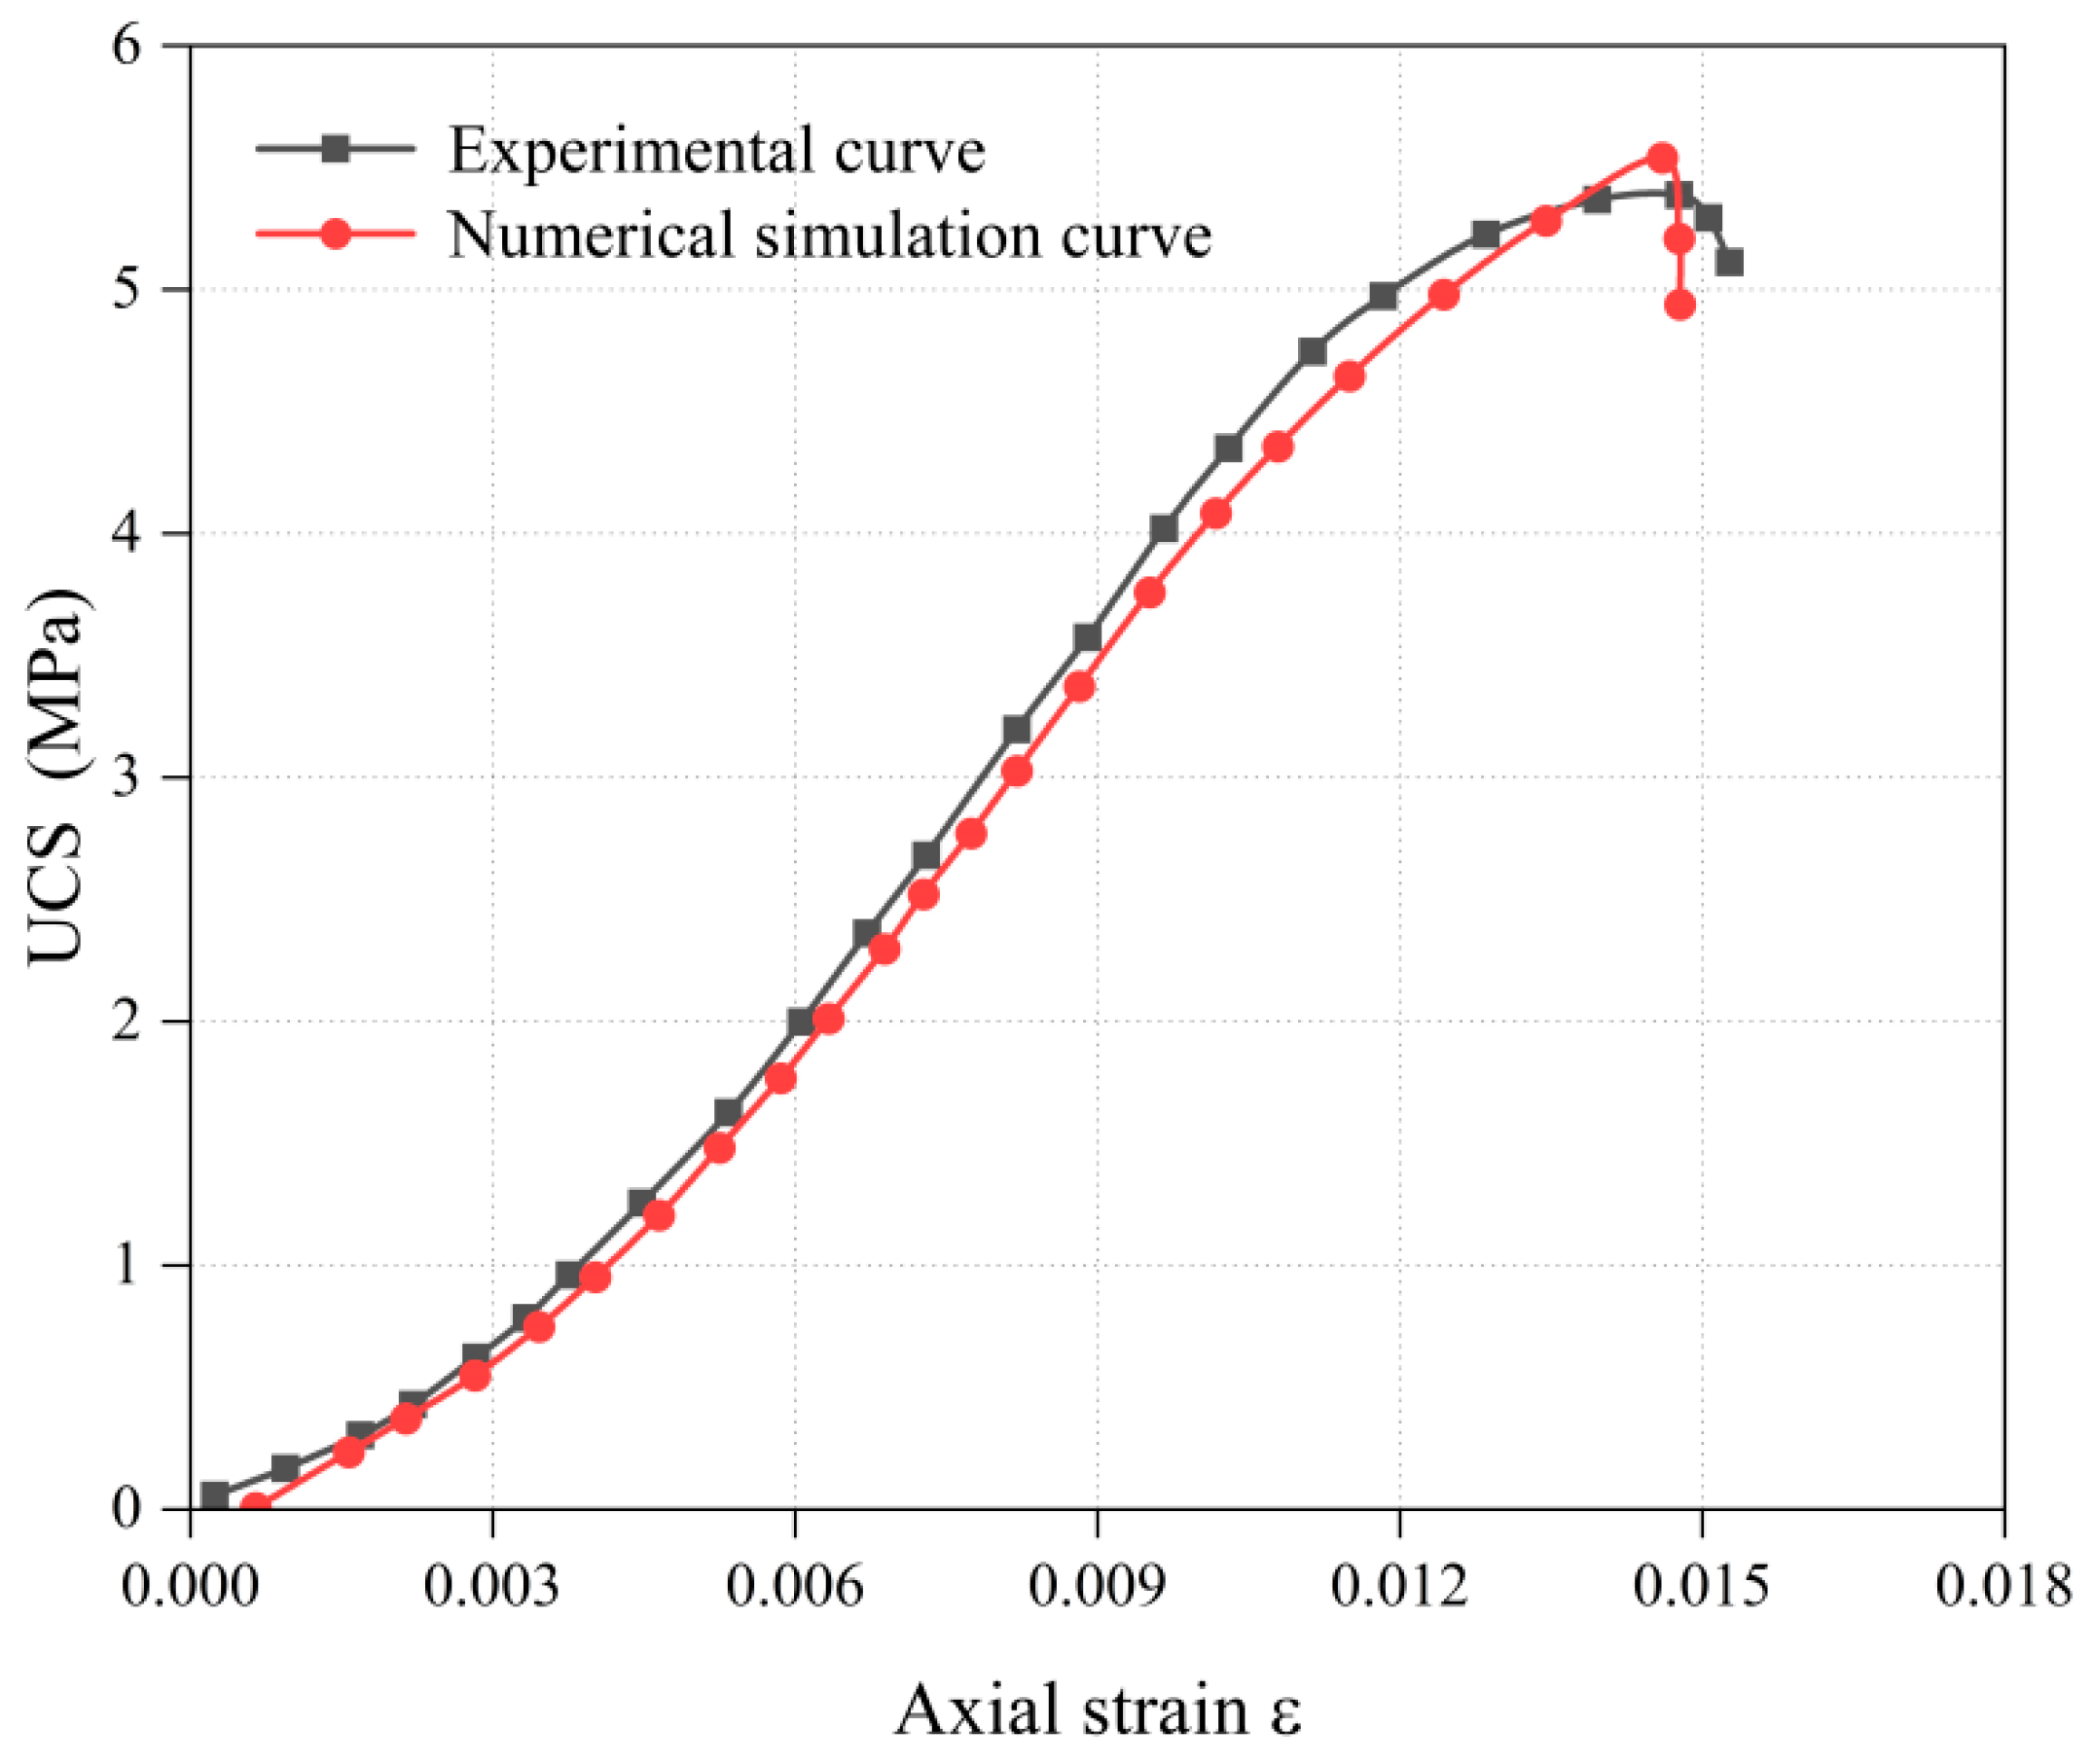
The optimal ratio of the gypsum-mixed sandstone-like material is 7.5% river sand, 17.5% quartz sand, 58.3% α -high-strength gypsum powder, and 16.7% water, respectively. Performance testing experiment have verified that the physical parameters of sandstone in a certain proportion can be simulated well, and the damage pattern is basically the same.
(2)
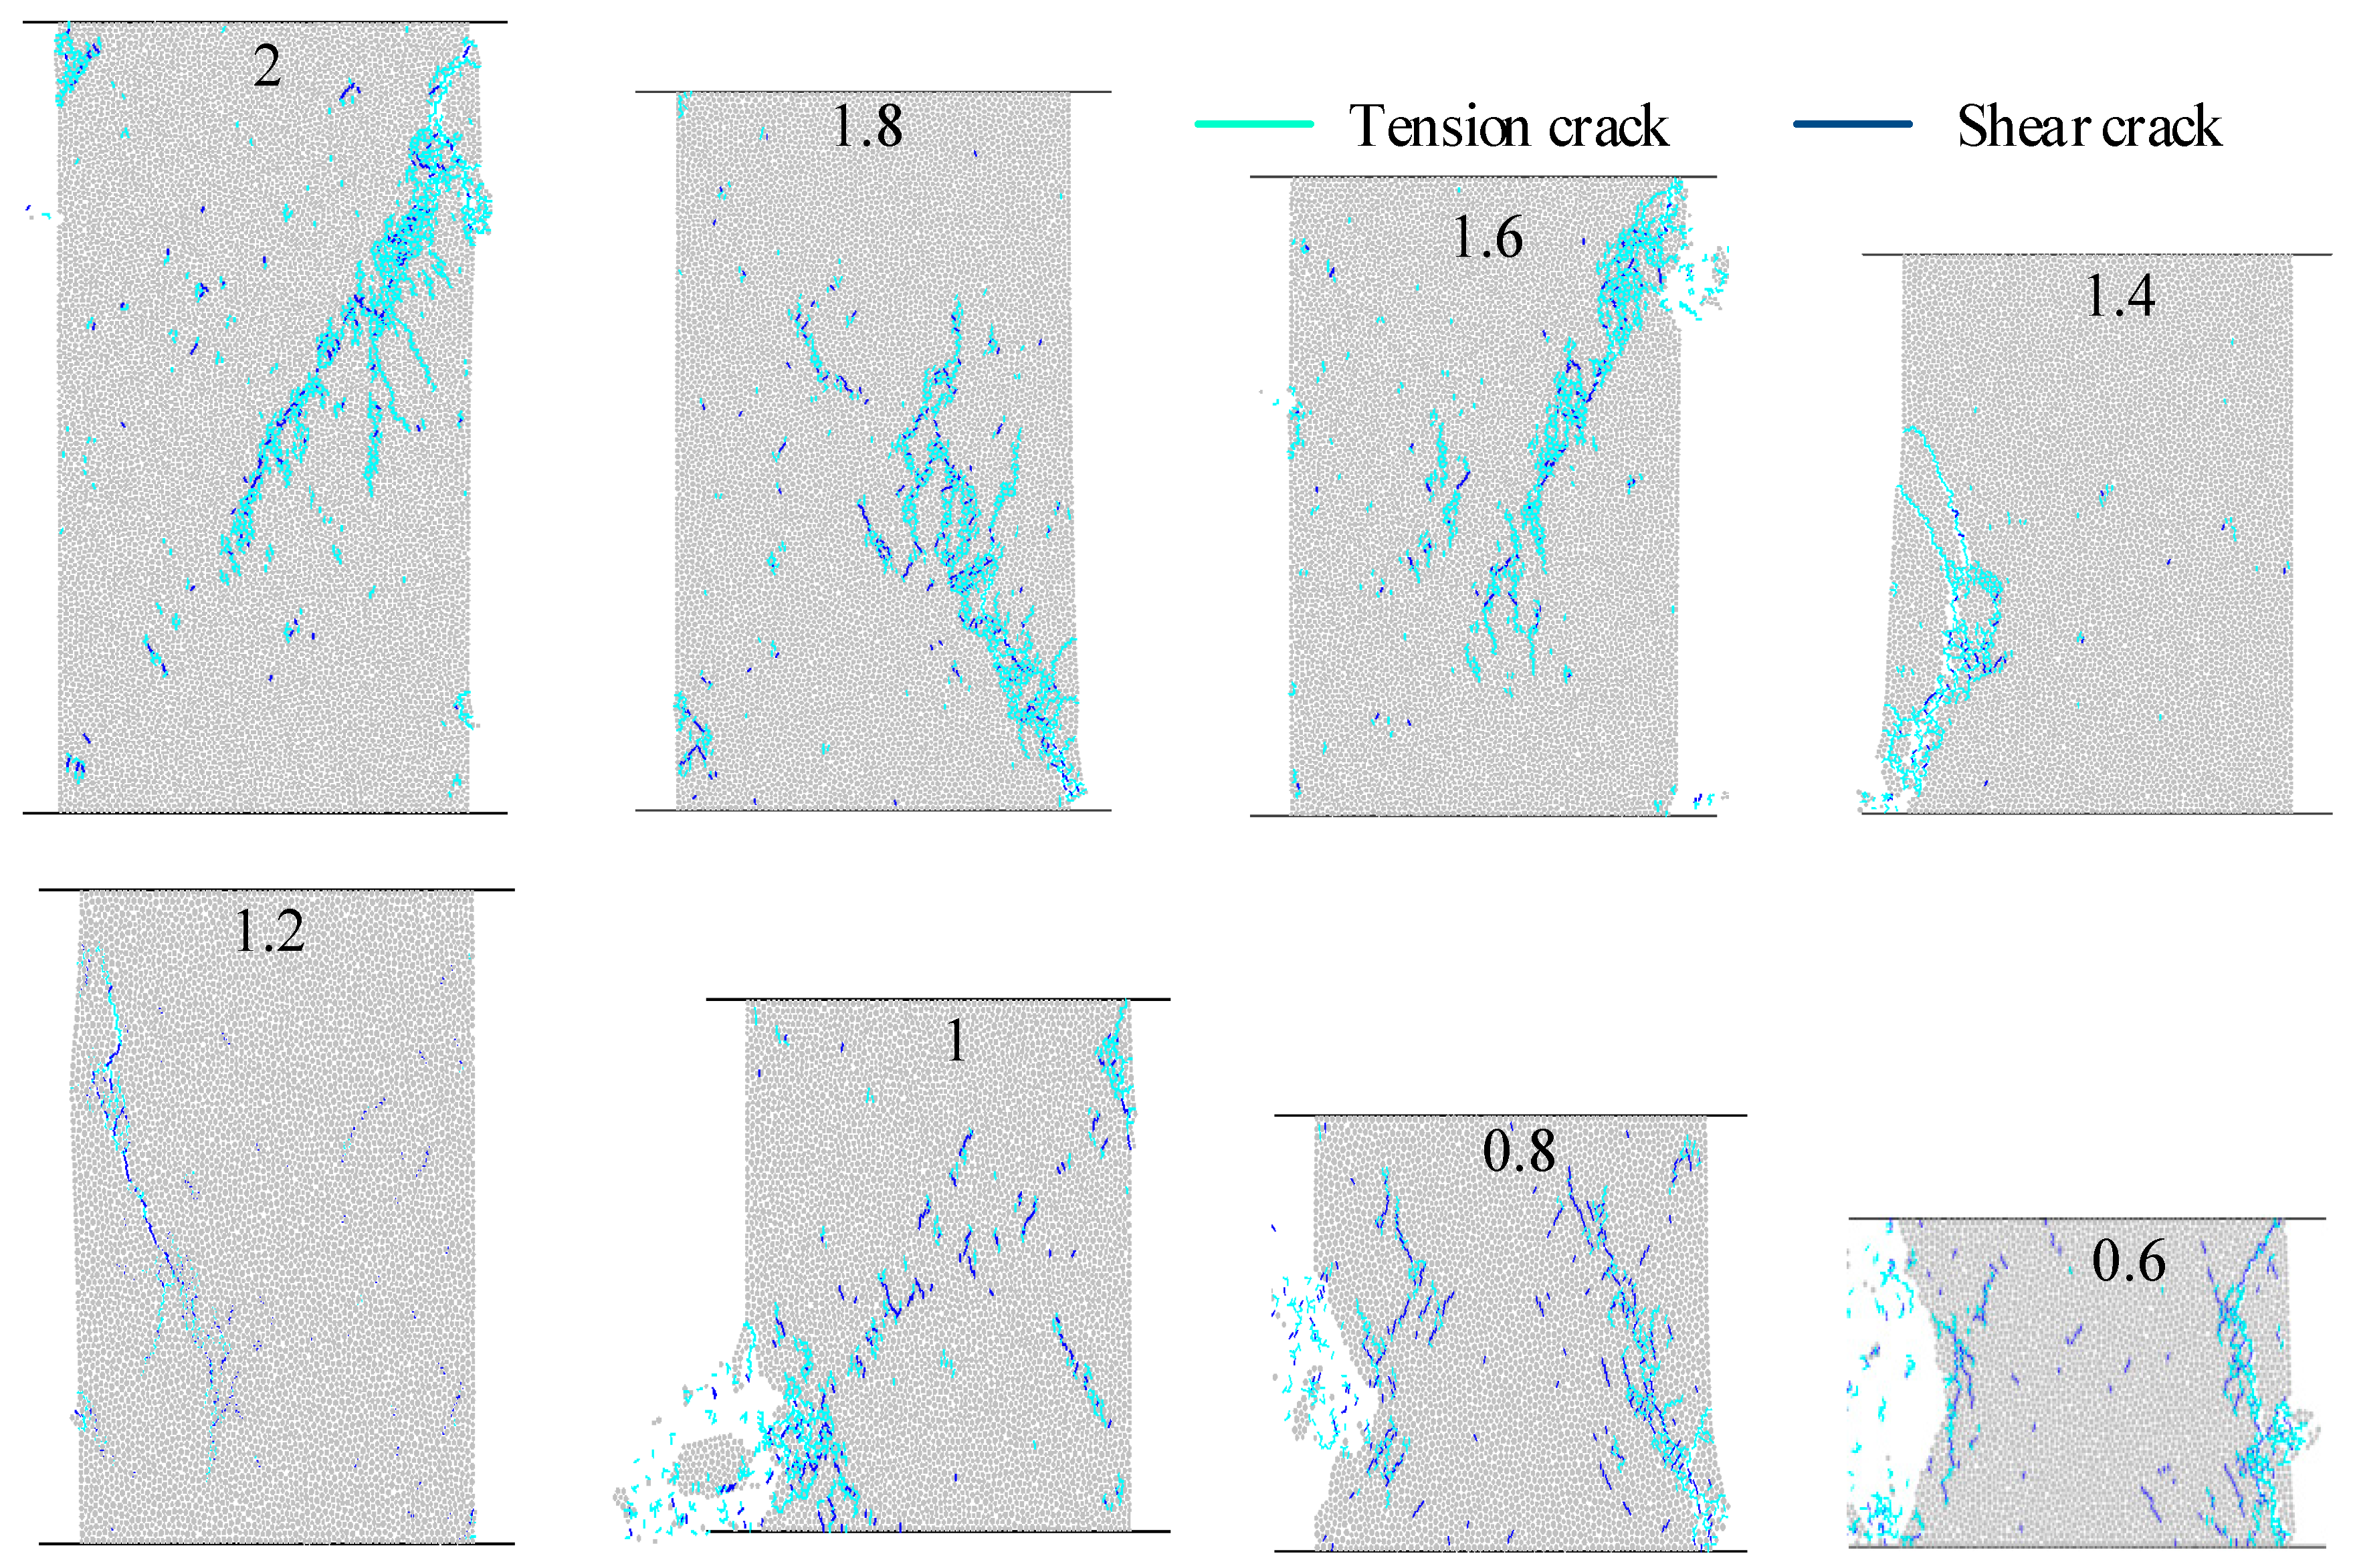
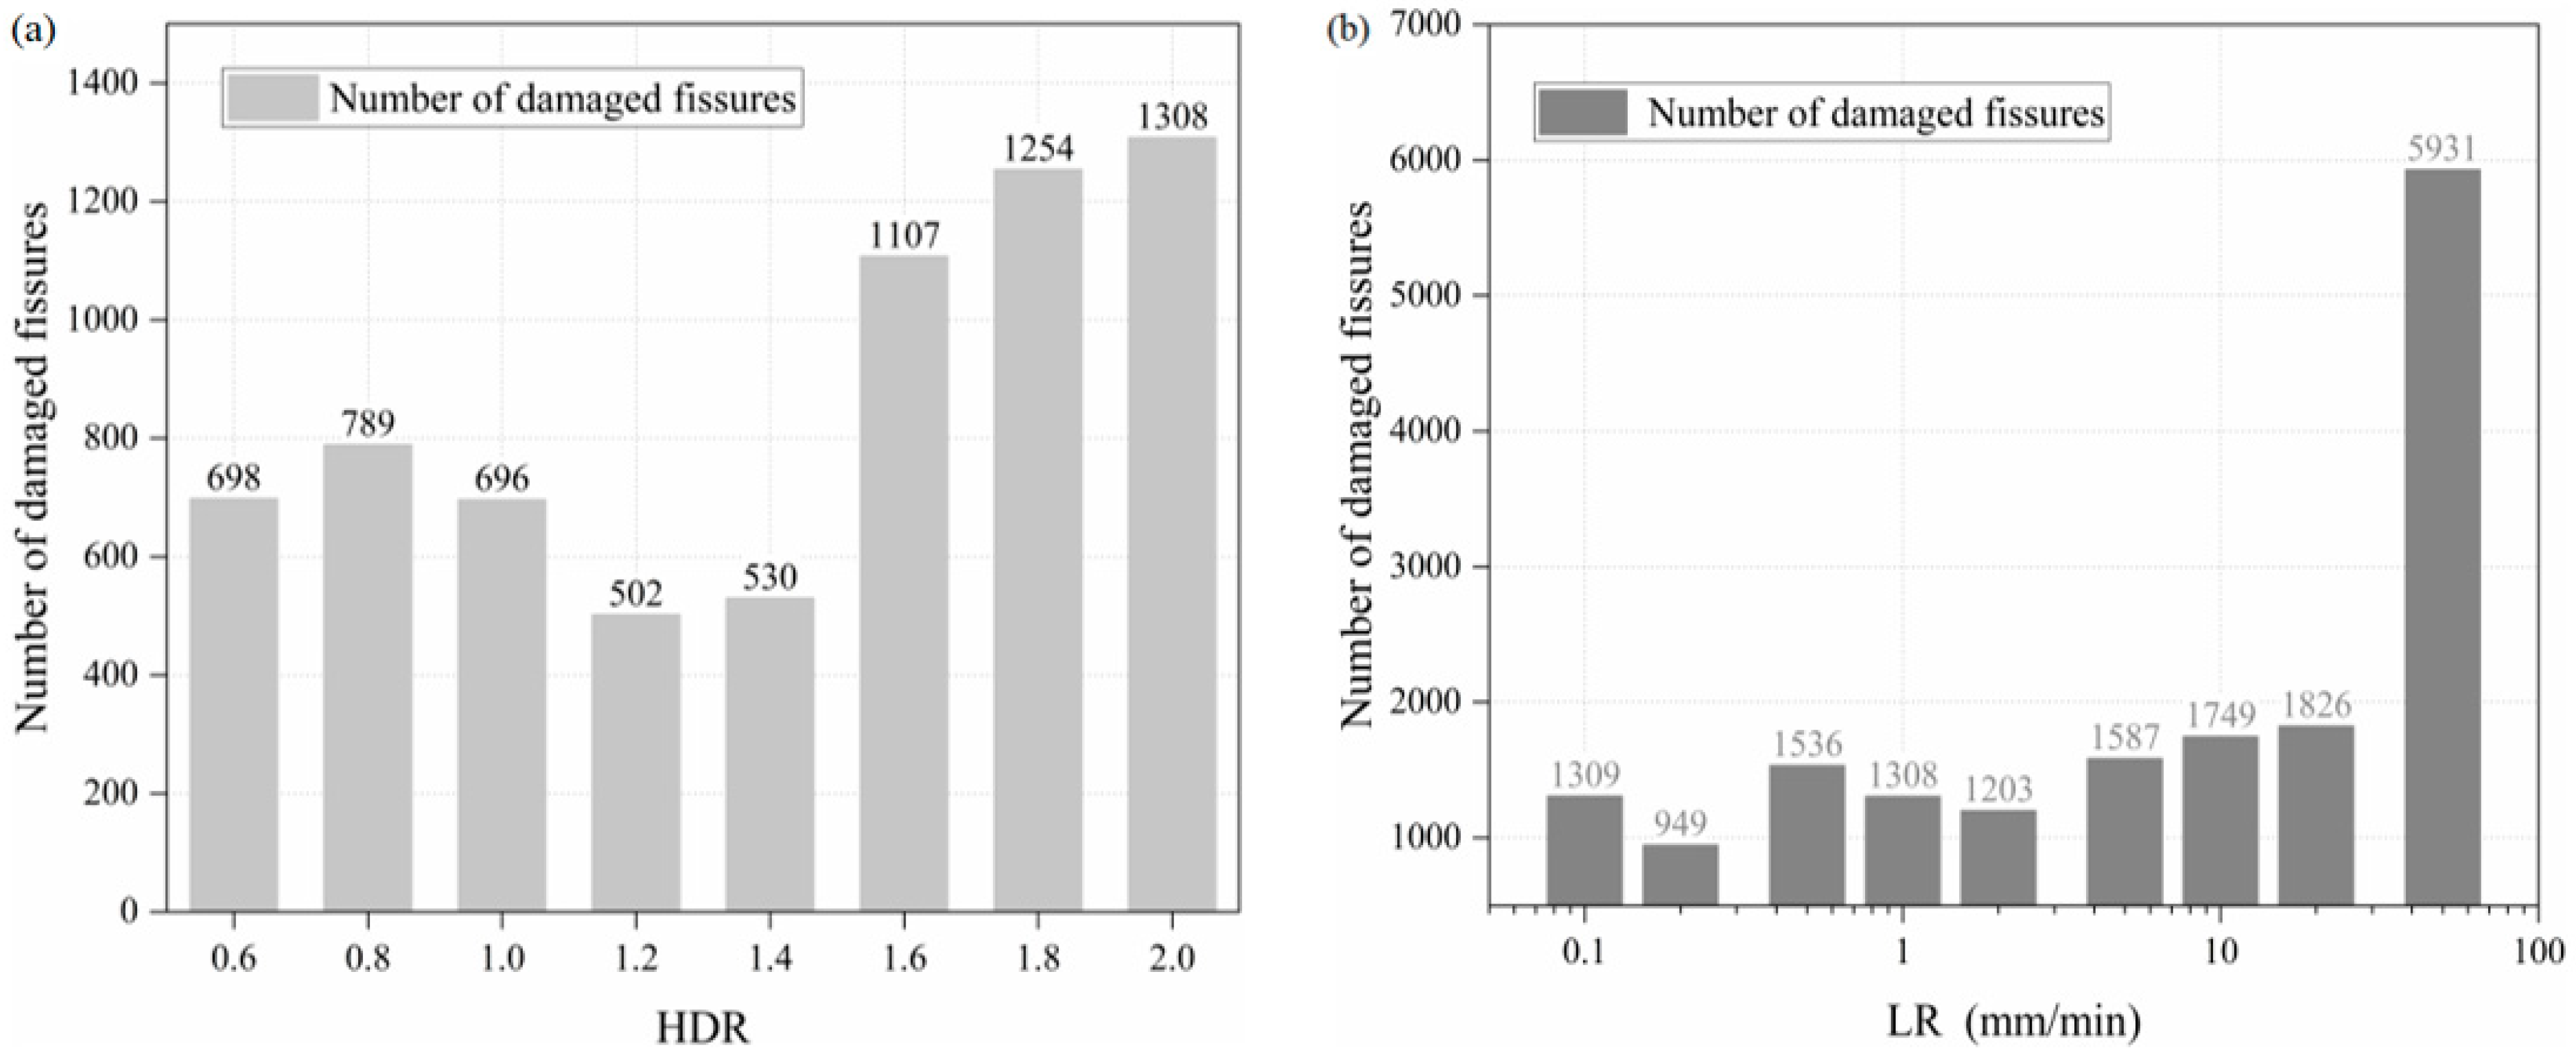
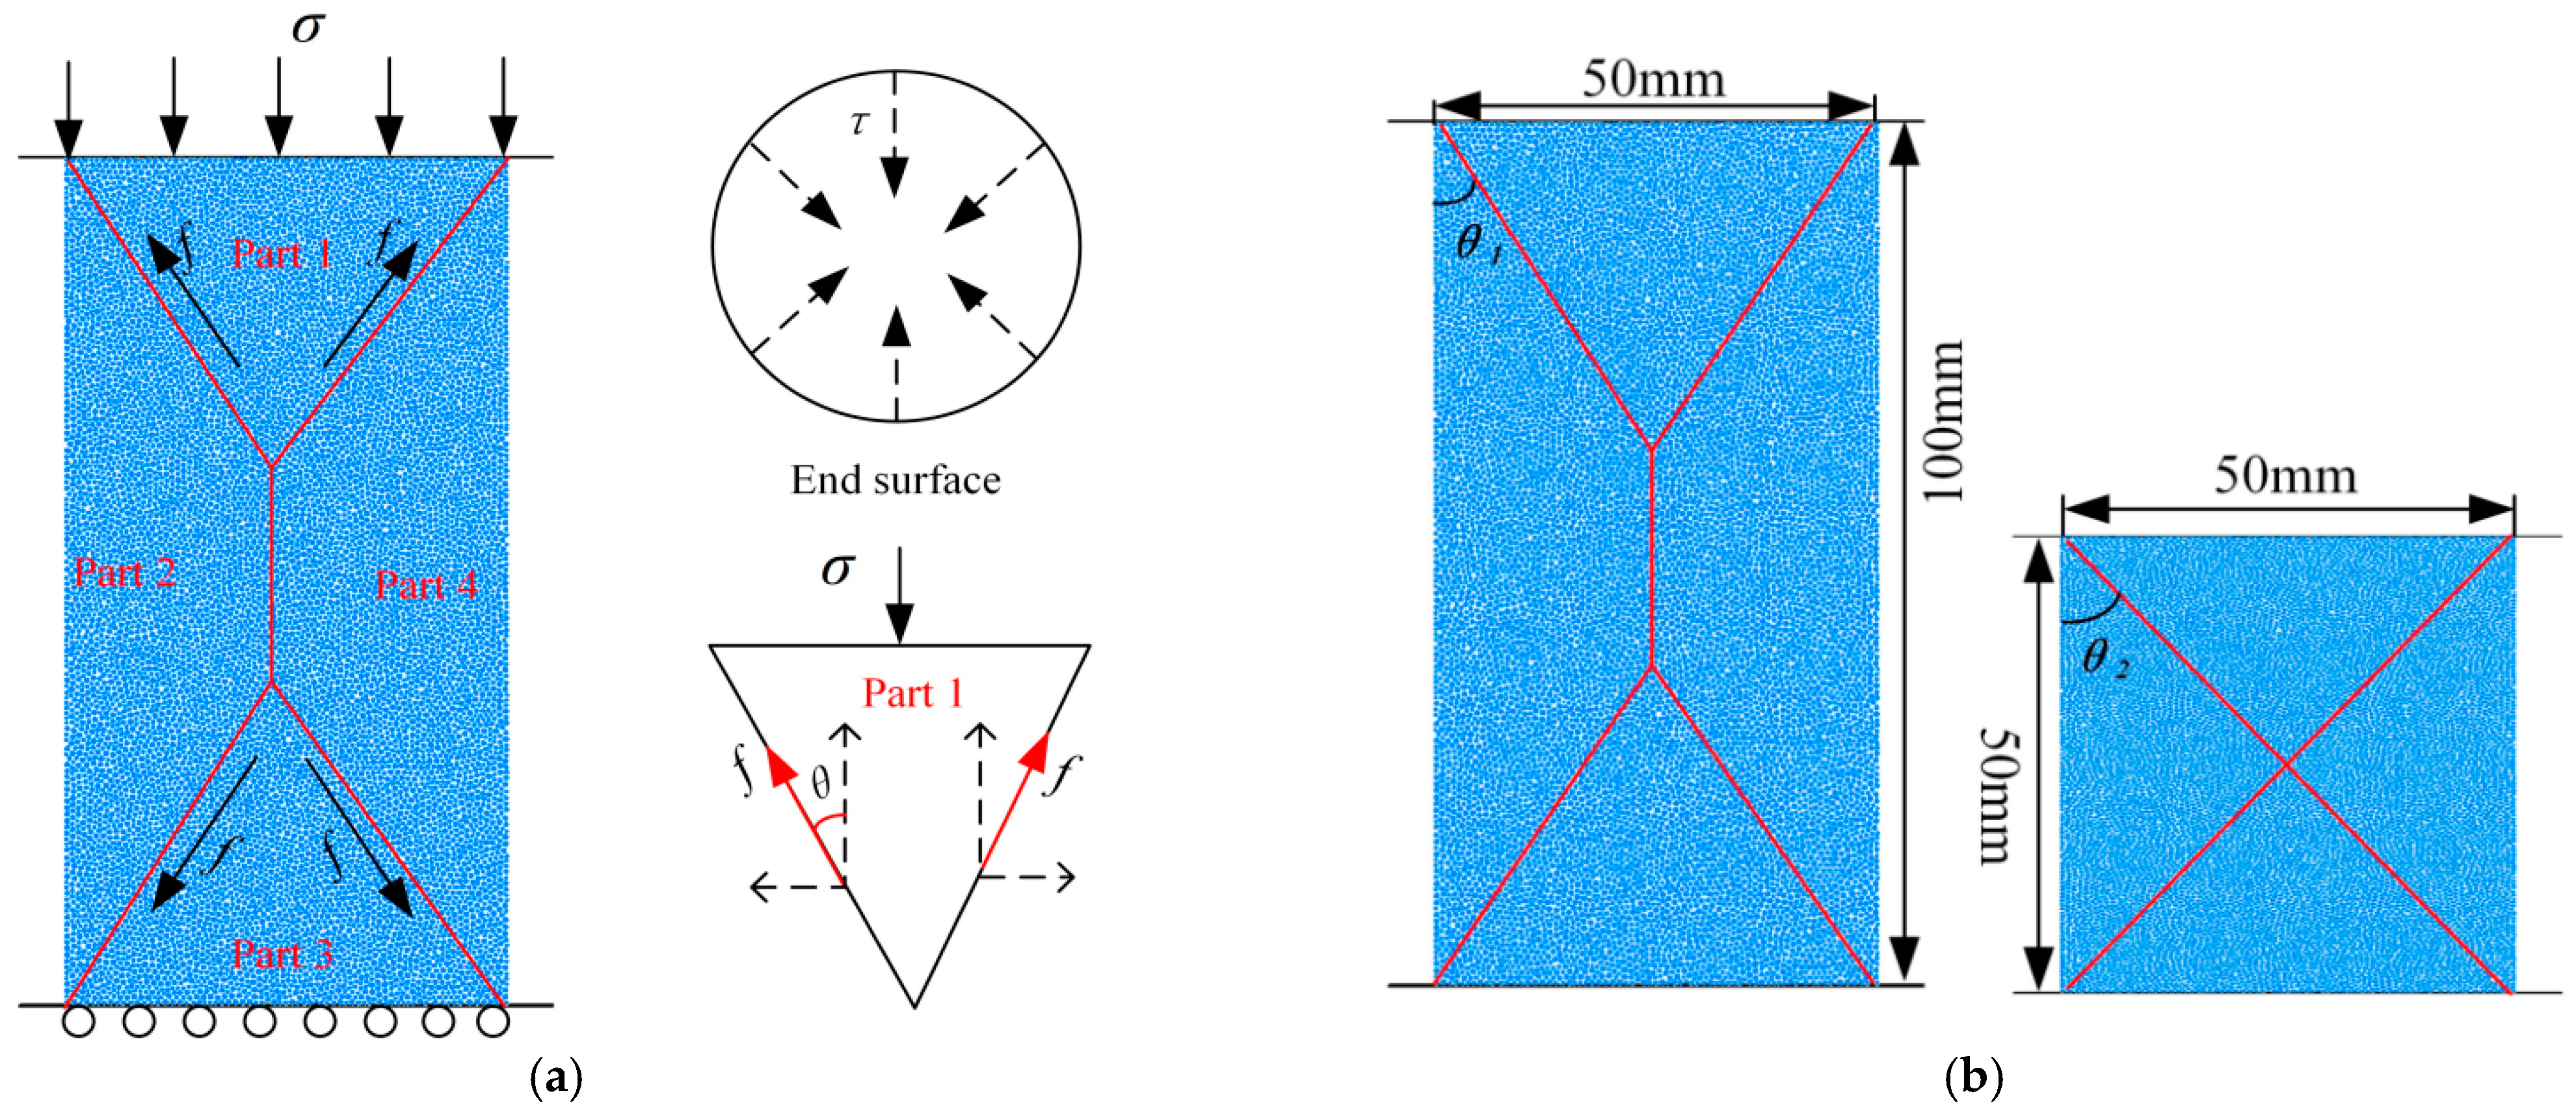
The curves were cut into two parts by a HDR of 1.2, and the R2 of the fitting parameters is greater than 0.9. The UCS displayed a changing trend that is M shaped, and the maximum value is obtained at a HDR of 0.6~1, although it does not monotonically decrease as the HDR increases. The peak strains show a W-shaped pattern in contrast to the UCS, which indicates that the stronger the gypsum-like material, the lower the peak strain. And when the HDR is less than 1, specimen damage shows X cross cracks and an increasing number of cracks. Mechanical analysis and numerical simulation results show that the main reason for the difference between UCS and previous studies is the generation of the EFE at a HDR of 0.6~1, which restricts the lateral deformation of the specimen and shows an effect of circumferential pressure, therefore increasing the ability of the specimen to resist deformation.
(3)
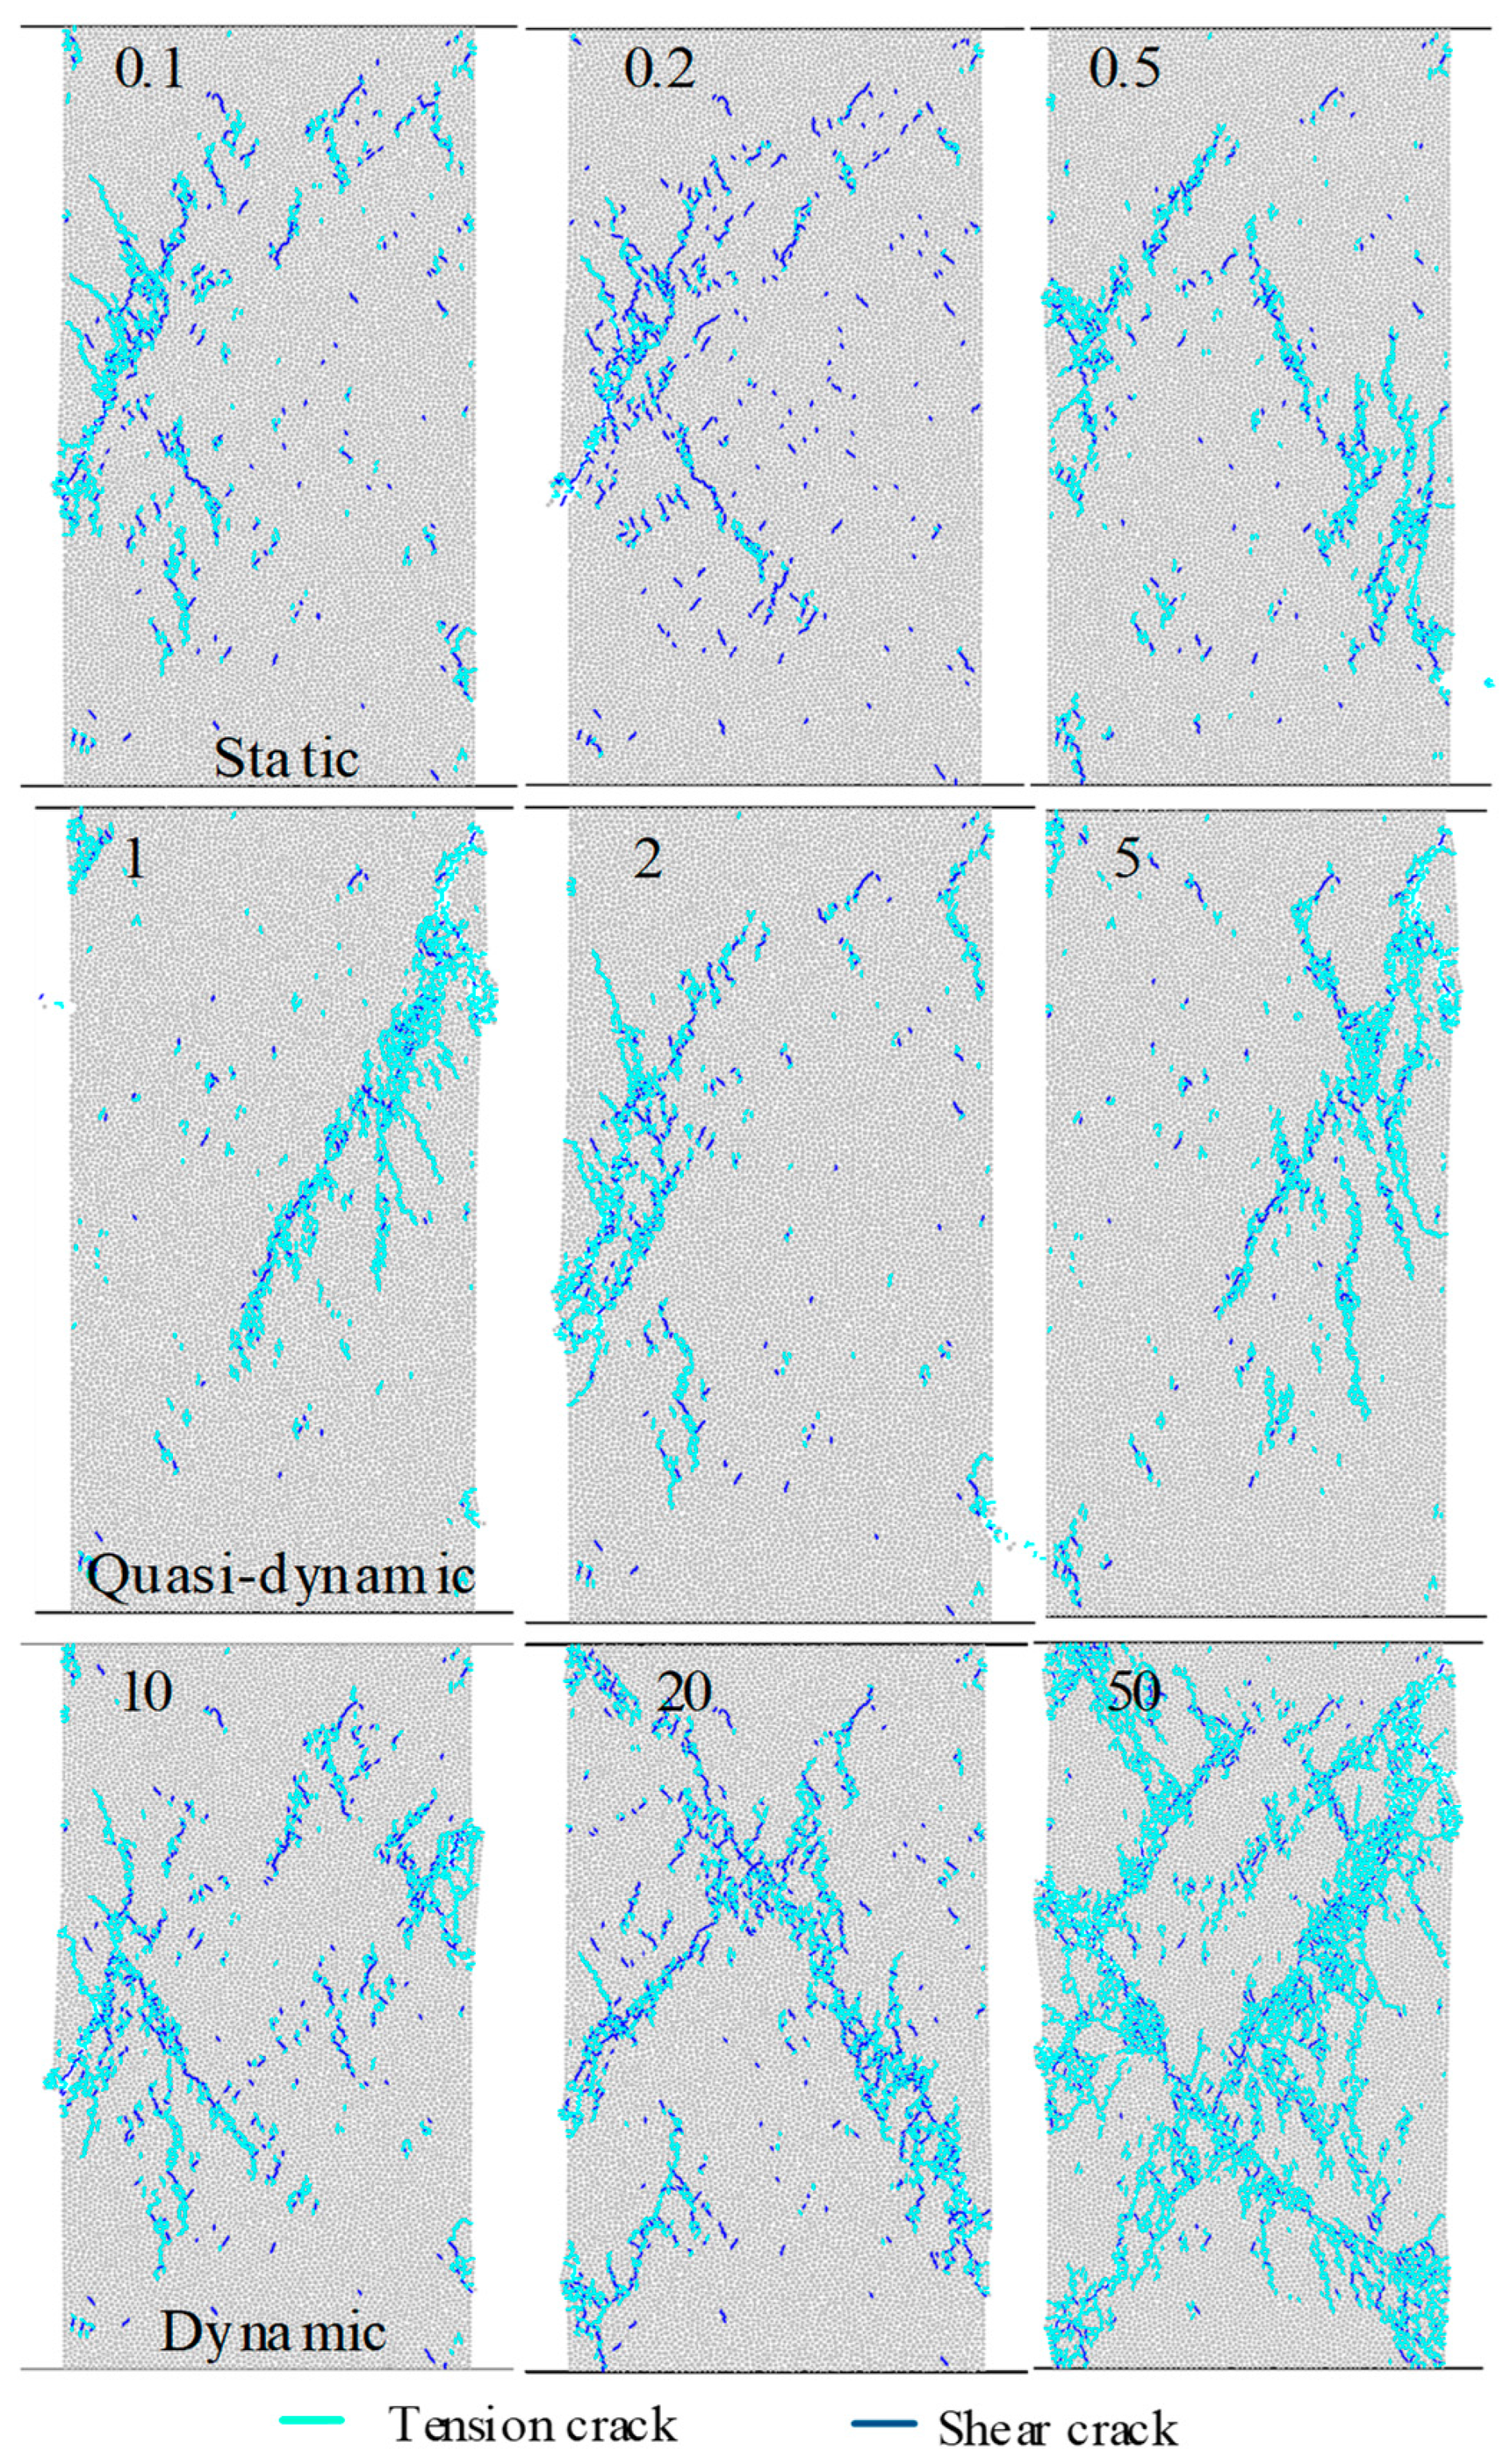
The UCS of the specimens at each SR stage shows roughly the same phased pattern of variation: first a decrease and then an increase. The rapid loading speed prevents cracks within the specimen so that they do not penetrate and converge in time, reducing the degree of destruction of the specimen, and thus increasing the ability of the specimen to resist external loading. For 50 mm·min−1, under the action of the EFE, the very fast rate results in multiple X-damage new cracks, but not complete fusion with the primary cracks, and the lateral deformation at the end of the specimen is also limited. The power consumed W τ through the EFE significantly increases in 50 mm·min−1. Accordingly, its UCS value increases significantly.
(4)
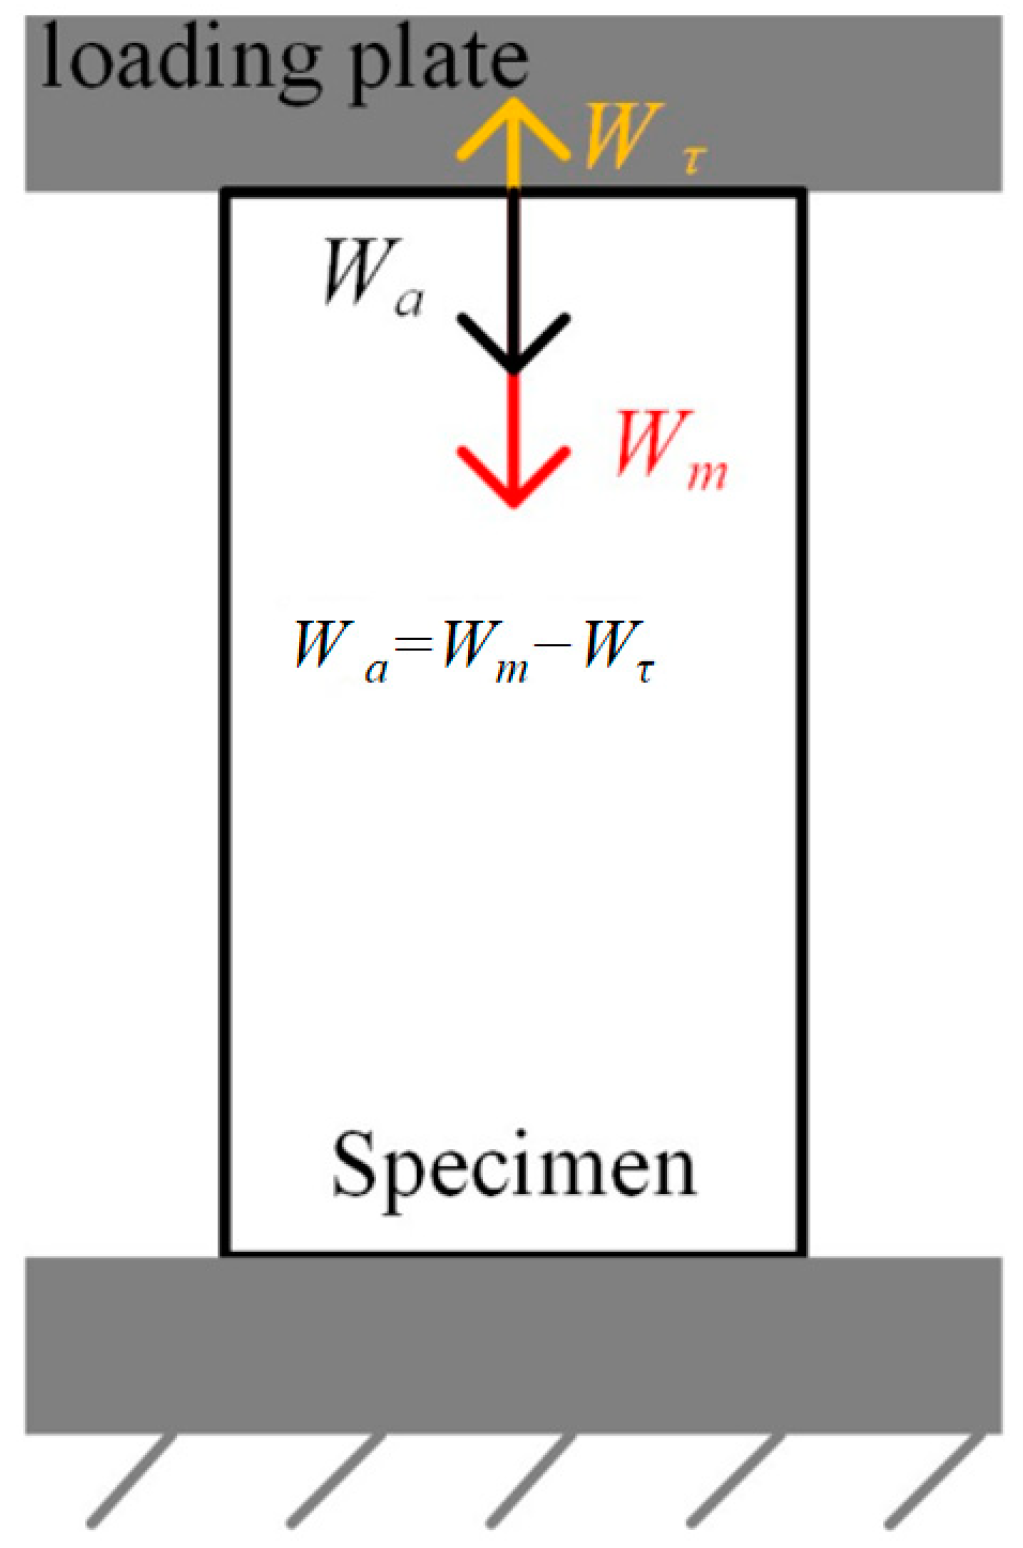
Both experiments and numerical simulations have confirmed that the SE and LR did have an influence on the physical parameters of the sandstone-like specimens. By mechanical analysis, the EFE was generated during the loading process with a HDR of 0.6~1 and during dynamic loading phases, which was the root cause of the SE and the LR. Meanwhile, the results also showed that the power consumed as a result of the EFE increased as the HDR of the specimen decreased and the LR increased, which reduced the actual amount of energy transferred inside the specimen. In order to accurately obtain the physical parameters of real coal and rock and effectively avoid engineering disasters, the influence of the EFE should be mitigated as far as possible.

Author Contributions

Y.G., formal analysis, methodology, and writing—original draft; J.B., conceptualization, writing—review and editing, supervision, and funding acquisition; Y.L., visualization and writing—review and editing; X.Z., conceptualization; L.T., conceptualization; Z.F., investigation and methodology. All authors have read and agreed to the published version of this manuscript.

Funding

The research described in this paper was financially supported by the National Natural Science Foundation of China (No. 52074239); the National Natural Science Foundation of China (No. 51927807); the Graduate Innovation Program of China University of Mining and Technology (2024WLJCRCZL027); and the Postgraduate Research & Practice Innovation Program of Jiangsu Province (SJCX24_1412).

Institutional Review Board Statement

Not applicable.

Informed Consent Statement

Informed consent was obtained from all subjects involved in the study.

Data Availability Statement

The data that support the findings of this study are available on request from the corresponding author. The data are not publicly available due to privacy or ethical restrictions.

Acknowledgments

The authors would like to thank the editor and reviewers for their constructive suggestions.

Conflicts of Interest

The authors declare that they have no conflicts of interest regarding the publication of this paper.

References

  1. Masoumi, H.; Saydam, S.; Hagan, P.C. Unified size-effect law for intact rock. Int. J. Geomech. 2016, 16, 04015059. [Google Scholar] [CrossRef]
  2. Zhao, Y.-S. Retrospection on the development of rock mass mechanics and the summary of some unsolved centennial problems. Chin. J. Rock Mech. Eng. 2021, 40, 1297–1336. [Google Scholar] [CrossRef]
  3. Weibull, W. A statistical function of wide applicability. J. Appl. Mech. 1951, 18, 293–297. [Google Scholar] [CrossRef]
  4. Weibull, W. A statistical theory of strength of materials. In IVB-Handl.; Generalstabens Litografiska Anstalts Förlag: Stockholm, Sweden, 1939; pp. 1–45. [Google Scholar]
  5. Bazant, Z.P. Size effect in blunt fracture: Concrete, rock, metal. J. Eng. Mech. 1984, 110, 518–535. [Google Scholar] [CrossRef]
  6. Liu, B.; Zhang, J.; Du, Q.; Tu, J. A study of size effect for compression strength of rock. Chin. J. Rock Mech. Eng. 1998, 17, 611–614. (In Chinese) [Google Scholar]
  7. Hoek, E.; Brown, E.T. Underground Excavations in Rock; Institute of Mining and Metallurgy: London, UK, 1980. [Google Scholar]
  8. Brace, W.F. The effect of size on mechanical properties of rock. Geophys. Res. Lett. 1981, 8, 651–652. [Google Scholar] [CrossRef]
  9. Carpinteri, A.; Chiaia, B.; Ferro, G. Size effects on nominal tensile strength of concrete structures: Multifractality of material ligaments and dimensional transition from order to disorder. Mater. Struct. 1995, 28, 311–317. [Google Scholar] [CrossRef]
  10. Zhang, M.; Lu, Y.; Yang, Q. Failure probability and strength size effect of quasi-brittle materials. Chin. J. Rock Mech. Eng. 2010, 29, 1782–1789. (In Chinese) [Google Scholar]
  11. Liang, Z.; Zhang, Y.; Tang, S.; Li, L.; Tang, C. Size effect of rock messes and associated representative element properties. Chin. J. Rock Mech. Eng. 2013, 32, 1157–1166. (In Chinese) [Google Scholar]
  12. Su, C.D.; Li, H.Z.; Zhang, S.; Gou, P. Experimental investigation on effect of strain rate on mechanical characteristics of marble. Chin. J. Rock Mech. Eng. 2013, 32, 943–950. (In Chinese) [Google Scholar] [CrossRef]
  13. Huang, D.; Huang, R.; Zhang, Y. Experimental investigations on static loading rate effects on mechanical properties and energy mechanism of coarse crystal grain marble under uniaxial compression. Chin. J. Rock Mech. Eng. 2012, 31, 245–255. (In Chinese) [Google Scholar]
  14. Zhang, J.; Ding, L.; Song, Z.; Fan, W.; Wang, S. Mechanical properties of deep sandstones under loading rate effect. J. Cent. South Univ. 2022, 29, 1933–1944. [Google Scholar] [CrossRef]
  15. Wang, Q.; Zhu, W.; Liu, H.; Niu Li, R. Size effect of long-term strength of sandstone under uniaxial compression. Rock Soil Mech. 2016, 37, 981–990. (In Chinese) [Google Scholar] [CrossRef]
  16. Zhang, B.; Li, S.; Yang, X.; Xia, K.; Liu, J.; Guo, S.; Wang, S. The coalescence and strength of rock-like materials containing two aligned X-type flaws under uniaxial compression. Geomech. Eng. 2019, 17, 47–56. [Google Scholar] [CrossRef]
  17. Yang, S.-Q.; Yin, P.-F.; Huang, Y.-H.; Cheng, J.-L. Strength, deformability and X-ray micro-CT observations of transversely isotropic composite rock under different confifining pressures. Eng. Fract. Mech. 2019, 214, 1–20. [Google Scholar] [CrossRef]
  18. Zhang, J.; Yang, Y. Rock size effect and acoustic emission characteristics under the influence of loading rate. China Min. Mag. 2021, 30, 205–210. [Google Scholar] [CrossRef]
  19. Darlington, W.J.; Ranjith, P.G.; Choi, S.K. The effect of specimen size on strength and other properties in laboratory testing of rock and rock-like cementitious brittle materials. Rock Mech. Rock Eng. 2011, 44, 513–529. [Google Scholar] [CrossRef]
  20. Hawkins, A.B. Aspects of rock strength. Bull. Eng. Geol. Environ. 1998, 57, 17–30. [Google Scholar] [CrossRef]
  21. Chen, P.; Zhou, Z. Size effect experiment of rock material with RFPA2D. J. Liaoning Tech. Univ. (Nat. Sci.) 2012, 31, 842–845. (In Chinese) [Google Scholar]
  22. Meng, Q.; Han, L.; Pu, H.; Li, H.; Wen, S.; Li, H. Effect of the size and strain rate on the mechanical behavior of rock specimens. J. China Univ. Min. Technol. 2016, 45, 233–243. (In Chinese) [Google Scholar]
  23. Aurelien, D.; Ronan, H.; Tanja, L.; Sylvain, M. Size effect assessment by Weibull’s approach and the coupled Criterion. Eng. Fract. Mech. 2021, 256, 107979. [Google Scholar] [CrossRef]
  24. Arcady, V.D.; Elena, P.; Qi, C.; Xia, C.; Qu, X. A possible mechanism of failure in dynamic uniaxial compression and the size effect. Eng. Fract. Mech. 2021, 257, 108005. [Google Scholar] [CrossRef]
  25. Cheng, H.; Zhou, X.; Zhu, J.; Qian, Q. The effects of crack openings on crack initiation, propagation and coalescence behavior in rock-like materials under uniaxial compression. Rock Mech. Rock Eng. 2016, 49, 3481–3494. [Google Scholar] [CrossRef]
  26. Luo, P.P.; Wang, S.R.; Hagan, P.; Huang, Q.X.; Cao, C.; Gamage, K. Mechanical performances of cement-gypsum composite material containing a weak interlayer with different angles. DYNA 2019, 94, 447–454. [Google Scholar] [CrossRef]
  27. Kou, M.; Liu, X.; Wang, Z.; Mohsen, N. Mechanical properties, failure behaviors and permeability evolutions of fissured rock-like materials under coupled hydro-mechanical unloading. Eng. Fract. Mech. 2021, 254, 107929. [Google Scholar] [CrossRef]
  28. Zhou, X.; Liang, F.; Hao, C.; Filippo, B. Cracking behaviours of rock-like materials containing three preexisting flaws after high-TEMPERATURE treatments. Fatigue Fract. Eng. Mater. Struct. 2021, 44, 622–635. [Google Scholar] [CrossRef]
  29. Haeri, H.; Khaloo, A.; Marji, M.F. Experimental and numerical simulation of the microcrack coalescence mechanism in rock-Like materials. Strength Mater. 2015, 47, 740–754. [Google Scholar] [CrossRef]
  30. Song, Y.; Liu, B.; Liu, H.; Sun, J.; Yu, M.; Ren, D. Orthogonal test method for determination of the proportion of rock-like material based on properties of deformation and brittleness. Rock Soil Mech. 2020, 41, 2675–2684. (In Chinese) [Google Scholar] [CrossRef]
  31. Zhang, Y.; Deng, H.; Deng, J.; Liu, C.; Yu, S. Peridynamic simulation of crack propagation of non-homogeneous brittle rock-like materials. Theor. Appl. Fract. Mech. 2020, 106, 102438. [Google Scholar] [CrossRef]
  32. Huang, Y.; Yang, S.; Liu, X. Experimental and numerical study on the mechanical characteristics of rock-like material. J. Exp. Mech. 2014, 29, 239–249. (In Chinese) [Google Scholar]
  33. Yin, P.; Yang, S. Experimental study on strength and failure behavior of transversely isotropic rock-like material under uniaxial compression. Geomech. Geophys. Geo-Energy Geo-Resour. 2020, 6, 44. [Google Scholar] [CrossRef]
  34. ISRM. The complete ISRM suggested methods for rock characterization, testing and monitoring. In Prepared by the Commission on Testing Methods; Ulusay, R., Hudson, J.A., Eds.; ISRM: Ankara, Turkey, 2007; pp. 1974–2006. [Google Scholar]
  35. Chang, Y.; Huang, P.; Wu, B.; Chang, S. A study on the color change benefits of sustainable green building materials. Constr. Build. Mater. 2015, 83, 1–6. [Google Scholar] [CrossRef]
  36. Zhou, Y.; Zhao, C.; Zhao, C.; Ma, C.; Xie, J. Experimental study on the fracturing behaviors and mechanical properties of cracks under coupled hydro-mechanical effects in rock-like specimens. Water 2018, 10, 1355. [Google Scholar] [CrossRef]
  37. Maqsood, Z.; Koseki, J.; Ahsan, M.K.; Shaikh, M.; Kyokawa, H. Experimental study on hardening characteristics and loading rate dependent mechanical behaviour of gypsum mixed sand. Constr. Build. Mater. 2020, 262, 119992. [Google Scholar] [CrossRef]
  38. Wang, P.; Jiang, L.; Li, X.; Qin, G.; Wang, E. Physical simulation of mining effect caused by a fault tectonic. Arab. J. Geosci. 2018, 11, 741. [Google Scholar] [CrossRef]
  39. Zhao, Y.; Cheng, Z.; Gao, Y.; Wu, S.; Chen, C. Review of geomechanical similar-material test systems. Arab. J. Geosci. 2020, 13, 906. [Google Scholar] [CrossRef]
  40. Wang, G.-F.; Li, G.; Dou, L.-M.; Mu, Z.-L.; Gong, S.-Y.; Cai, W. Applicability of energy-absorbing support system for rockburst prevention in underground roadways. Int. J. Rock Mech. Min. Sci. 2020, 132, 104396. [Google Scholar] [CrossRef]
  41. Zhuang, T.; Peng, R.; Zhao, Q.; Jiang, S.; Yang, X.; Shen, C.; Liu, J. Acoustic emission characteristic of sandstone and sandstone like material under multi-path loading. PLoS ONE 2024, 19, e0297087. [Google Scholar] [CrossRef]
  42. Diao, H.; Li, L.M.; Liang, J.; Ding, X. Screening of high-performance flocculant-producing bacteria and optimization of the conditions for flocculation of wheat distillery wastewater. Bioresources 2018, 13, 7738–7757. [Google Scholar] [CrossRef]
  43. Yan, H.; Wu, Y.; Li, S.; Zhang, L.; Zhang, K. The effect of factors on the radiation noise of high-speed full ceramic angular contact ball bearings. Shock. Vib. 2018, 2018, 1645878. [Google Scholar] [CrossRef]
  44. Mondal, D.; Jha, N.; Badkul, A.; Das, S.; Khedle, R. High temperature compressive deformation behaviour of aluminum syntactic foam. Mater. Sci. Eng. A-Struct. Mater. Prop. Microstruct. Process. 2012, 534, 521–529. [Google Scholar] [CrossRef]
  45. Liu, X.-H.; Huang, H.-Y.; Xie, J.-X. Effect of strain rate on the compressive deformation behaviors of lotus-type porous copper. Int. J. Miner. Metall. Mater. 2014, 21, 687–695. [Google Scholar] [CrossRef]
  46. Jordaan, M.S.; Kok, S. Material model calibration for superplastic forming. Inverse Probl. Sci. Eng. 2019, 27, 589–607. [Google Scholar] [CrossRef]
  47. Huang, R.; Li, S.; Meng, L.; Jiang, D.; Li, P. Coupled effect of temperature and strain rate on mechanical properties of steel fiber-reinforced concrete. Int. J. Concr. Struct. Mater. 2020, 14, 48. [Google Scholar] [CrossRef]
  48. Li, Y.; Bai, J.; Liu, L.; Wang, X.; Yu, Y.; Li, T. Micro and macro experimental study of using the new cement-based self-stress grouting material to solve shrinkage problem. J. Mater. Res. Technol. 2022, 17, 3118–3137. [Google Scholar] [CrossRef]
  49. Wu, T.; Gao, Y.; Zhou, Y.; Li, J. Experimental and numerical study on the interaction between holes and fissures in rock-like materials under uniaxial compression. Theor. Appl. Fract. Mech. 2020, 106, 102488. [Google Scholar] [CrossRef]
  50. Chen, S.; Xia, Z.; Feng, F.; Yin, D. Numerical study on strength and failure characteristics of rock samples with different hole defects. Bull. Eng. Geol. Environ. 2020, 80, 1523–1540. [Google Scholar] [CrossRef]
  51. Ma, Z.; Cheng, S.; Gong, P.; Hu, J.; Chen, Y. Particle flow code simulation of the characteristics of crack evolution in rock-Like materials with bent cracks. Geofluids 2021, 2021, 8889025. [Google Scholar] [CrossRef]
  52. Itasca Consulting Group Inc. PFC2D Theory and Background; Itasca Consulting Group Inc.: Minneapolis, MN, USA, 2008; pp. 20–80. [Google Scholar]
  53. Potyondy, D.O.; Cundall, P.A. A bonded-particle model for rock. Int. J. Rock Mech. Min. Sci. 2004, 41, 1329–1364. [Google Scholar] [CrossRef]
  54. Potyondy, D.O.; Cundall, P.A.; Lee, C.A. Modelling rock usingbonded assemblies of circular particles. In Proceedings of the 2nd North American Rock Mechanics Symposium, Montreal, QC, Canada, 19–21 June 1996; Auberrtin, M., Hassani, F., Mitri, H., Eds.; Balkema Press: Rotterdam, The Netherlands, 1996; pp. 1927–1944. [Google Scholar]
  55. Wasantha, P.L.P.; Ranjith, P.G.; Zhao, J.; Shao, S.S.; Permata, G. Strain rate effect on the mechanical behaviour of sandstones with different grain sizes. Rock Mech. Rock Eng. 2014, 48, 1883–1895. [Google Scholar] [CrossRef]
  56. Song, L.; Liu, W.; Jin, C. Scale constitutive model of statistical damage for coal samples with effect of interfacial friction. Eng. Mech. 2012, 29, 344–349. (In Chinese) [Google Scholar]
  57. Meng, X.; Liu, Y.; Ning, Z.; Dong, J.; Liang, G. Experimental Investigation of the Size Effect on Roller-Compacted Hydraulic Asphalt Concrete under Different Strain Rates of Loading. Materials 2024, 17, 353. [Google Scholar] [CrossRef] [PubMed]
  58. Xuan, X.; Lv, N.; Wang, H.; Wang, J.; Zong, Q.; Zhang, D. Coupling effect of specimen size and stress rate on the splitting failure of limestone: Tensile strength, crack extension, and fragment size. Constr. Build. Mater. 2024, 414, 134995. [Google Scholar]
  59. Wu, W.; Wang, T.; Bai, J.; Liu, J.; Wang, X.; Xu, H.; Feng, G. Failure Characteristics and Cooperative Control Strategies for Gob-Side Entry Driving near an Advancing Working Face: A Case Study. Processes 2024, 12, 1398. [Google Scholar] [CrossRef]
  60. Tai, L.; Li, C.; Hu, Y.; Yu, X.; Xu, Z.; Zhang, X.; Chai, S.; Zhang, P.; Lu, S. Experimental study on the significance of pressure relief effect and crack extension law under. Sci. Rep. 2024, 14, 1104. [Google Scholar] [CrossRef]
Figure 1. Location of the target coal mine.
Applsci 14 10049 g001
Figure 2. Flow chart of specimen preparation and testing.
Applsci 14 10049 g002
Figure 3. Part of the specimens with different HDRs.
Applsci 14 10049 g003
Figure 4. Stress–strain curves of sandstone and sandstone-like materials.
Applsci 14 10049 g004
Figure 5. Stress–strain curves of specimens with different HDR. (a) HDRs of 0.6–1; (b) HDRs of 1.2–1.6; (c) HDRs of 1.6–2.
Applsci 14 10049 g005
Figure 6. The changing trend of mechanical parameters with different HDRs at a LR of 0.8 mm·min−1: (a) UCS; (b) axial peak strain.
Applsci 14 10049 g006
Figure 7. Stress–strain curves of the specimens under different LRs: (a) static (0.1~0.5 mm·min−1); (b) quasi-dynamic (1~5 mm·min−1); (c) dynamic (10~50 mm·min−1).
Applsci 14 10049 g007
Figure 8. Mechanical parameter trends with same HDR at different LRs: (a) UCS; (b) axial peak strain.
Applsci 14 10049 g008
Figure 9. Parallel bonding model (PBM) and failure criterion.
Applsci 14 10049 g009
Figure 10. Comparison of experimental and numerical simulations of stress–strain curves.
Applsci 14 10049 g010
Figure 11. Crack extension in uniaxial compression of the specimens with different HDRs.
Applsci 14 10049 g011
Figure 12. The pattern of variation in the number of internal cracks formed when specimens are damaged: (a) different HDRs; (b) different LRs.
Applsci 14 10049 g012
Figure 13. Crack extension in uniaxial compression of the specimens with different LRs.
Applsci 14 10049 g013
Figure 14. Schematic diagram of the EFE. (a) Mechanical structural modeling of the end face; (b) conical damage angle for specimens of different heights.
Applsci 14 10049 g014
Figure 15. Diagram of the actual input power inside the specimen.
Applsci 14 10049 g015
Table 1. The composition ratio of sandstone-like material.
IngredientsSize (Mesh)RatioDosage (%)
River sand9, 16 and 321/3 of each particle size7.5
Quartz sand200 and 6001/2 of each particle size17.5
α -high-strength gypsum powder180/58.3
Water//16.7
Table 2. Comparison of mechanical parameters of sandstone and sandstone-like materials.
Typeρ (g·cm−3)UCS (MPa)Em (GPa)Axial Peak Strain ε (%)v
Sandstone2.6469.23.682.30.21
Sandstone-like material1.336.960.531.60.23
Table 3. The relationship between the load state and the SR in coal mines.
SR (s−1)Load Condition
<10−5Static
10−5~10−3Quasi-dynamic
>10−3Dynamic
Table 4. Experimental results on specimens with different HDRs and different LRs.
LR (mm·min−1)HDRSR (s−1)Load ConditionUCS (MPa)Axial Peak Strain ε (%)
0.80.64.44 × 10−4Quasi-dynamic4.964.36
0.83.33 × 10−4Quasi-dynamic5.232.94
12.67 × 10⁻⁴Quasi-dynamic5.82.15
1.22.22 × 10−4Quasi-dynamic5.173.74
1.41.90 × 10−4Quasi-dynamic5.591.85
1.61.67 × 10−4Quasi-dynamic5.691.34
1.81.48 × 10−4Quasi-dynamic5.161.64
21.33 × 10⁻⁴Quasi-dynamic4.552.71
0.121.67 × 10−5Static5.181.01
0.23.32 × 10−5Static3.471.09
0.58.32 × 10−5Static5.631.18
11.67 × 10⁻⁴Quasi-dynamic6.161.97
23.39 × 10⁻⁴Quasi-dynamic5.401.47
58.30 × 10⁻⁴Quasi-dynamic6.071.15
101.66 × 10⁻³Dynamic5.231.32
203.32 × 10⁻³Dynamic4.831.21
508.32 × 10⁻³Dynamic6.681.27
Disclaimer/Publisher’s Note: The statements, opinions and data contained in all publications are solely those of the individual author(s) and contributor(s) and not of MDPI and/or the editor(s). MDPI and/or the editor(s) disclaim responsibility for any injury to people or property resulting from any ideas, methods, instructions or products referred to in the content.

