Article

Optimization and Experimental Verification of Lower Articulation for Low-Floor Tram Using Meta-Model

1
Railway Components Evaluation Center, Korea Testing Laboratory, Seoul 08389, Republic of Korea
2
Department of Rolling Stock System, Seoul National University of Science & Technology, Seoul 08389, Republic of Korea
3
RND Department, THEJST, Uiwang-si 16105, Republic of Korea
*
Author to whom correspondence should be addressed.
Appl. Sci. 2024, 14(21), 9618; https://doi.org/10.3390/app14219618
Submission received: 2 September 2024 / Revised: 30 September 2024 / Accepted: 10 October 2024 / Published: 22 October 2024

Abstract

:
This study aimed to optimize the lower articulation of low-floor trams using a meta-model technique, followed by an experimental validation. The design variables were identified through structural analyses, and the optimization reduced the weight of the lower articulation by 20% while maintaining load-bearing performance. Strain gauges were attached to failure-prone areas for structural and fatigue testing. The results of the optimized design were compared with experimental data, confirming its validity. This method effectively reduces the cost and improves the performance of tram articulation devices. This study presents an effective approach for cost reduction and performance improvement in the lower articulation of low-floor trams.

1. Introduction

Globally, the expansion of sustainable and eco-friendly urban public transportation is being pursued, with trams increasingly being adopted as a solution [1,2,3]. The introduction of tram vehicles is on the rise, as trams operate on electric power, which does not contribute to air pollution, making them a highly regarded environmentally friendly transportation option [4,5,6]. Low-floor trams, which consider passenger convenience during boarding and alighting, are predominantly being introduced [7,8,9]. In the Republic of Korea, recent decisions have confirmed the introduction of trams, and domestic rail vehicle manufacturers are designing and producing low-floor trams. However, one of the major systems in low-floor trams, the gangway system, remains reliant on foreign products [10]. The low-floor tram gangway system consists of upper and lower articulation, bellows, and turntables. Among these, the lower articulation is classified as a key component of the gangway system [11]. It not only supports the vehicle and passenger loads, but also needs to accommodate loads in the fore–aft and vertical directions while providing flexible lateral rotation during operation. Therefore, a lower articulation is crucial for the gangway system. Optimization of design and manufacturing research are broadly being conducted to address the structural strength, durability, and weight reduction of trams [12,13,14].
Techniques commonly applied in optimization design include topology optimization, experimental design methods, and meta-models. These techniques generally aim to reduce the structural volume and thickness while maintaining the required strength level through shape modifications [15,16,17,18]. We eviewed studies that have applied these methods: Viqaruddin [15] performed topology optimization to enhance the stiffness of a control arm by changing its geometric dimensions and structural properties, resulting in a 30% reduction in component weight. Li [16] applied topology optimization to the front upright structure for weight reduction in formula car suspensions, achieving a mass reduction of over 60% and confirming performance through simulations and validations. Song [17] optimized an upper control arm using response surface modeling (RSM) and Kriging models based on FEM analysis, resulting in a weight reduction of 4.13% and 5.22%, respectively. Penadés-Plá [18] compared heuristic optimization and meta-models for concrete bridge design, reducing computational costs according to optimization techniques. Despite these various optimization design studies, there is a lack of experimental validation through the structural testing of products produced via optimization design.
This paper aims to address this gap by focusing on the lower articulation applied to low-floor trams. Using meta-model techniques, we will derive structural analyses and optimization design parameters, produce three optimized models of the lower articulation, and validate the feasibility of the optimization design through structural and fatigue testing.

2. Optimization Model for Lower Articulation

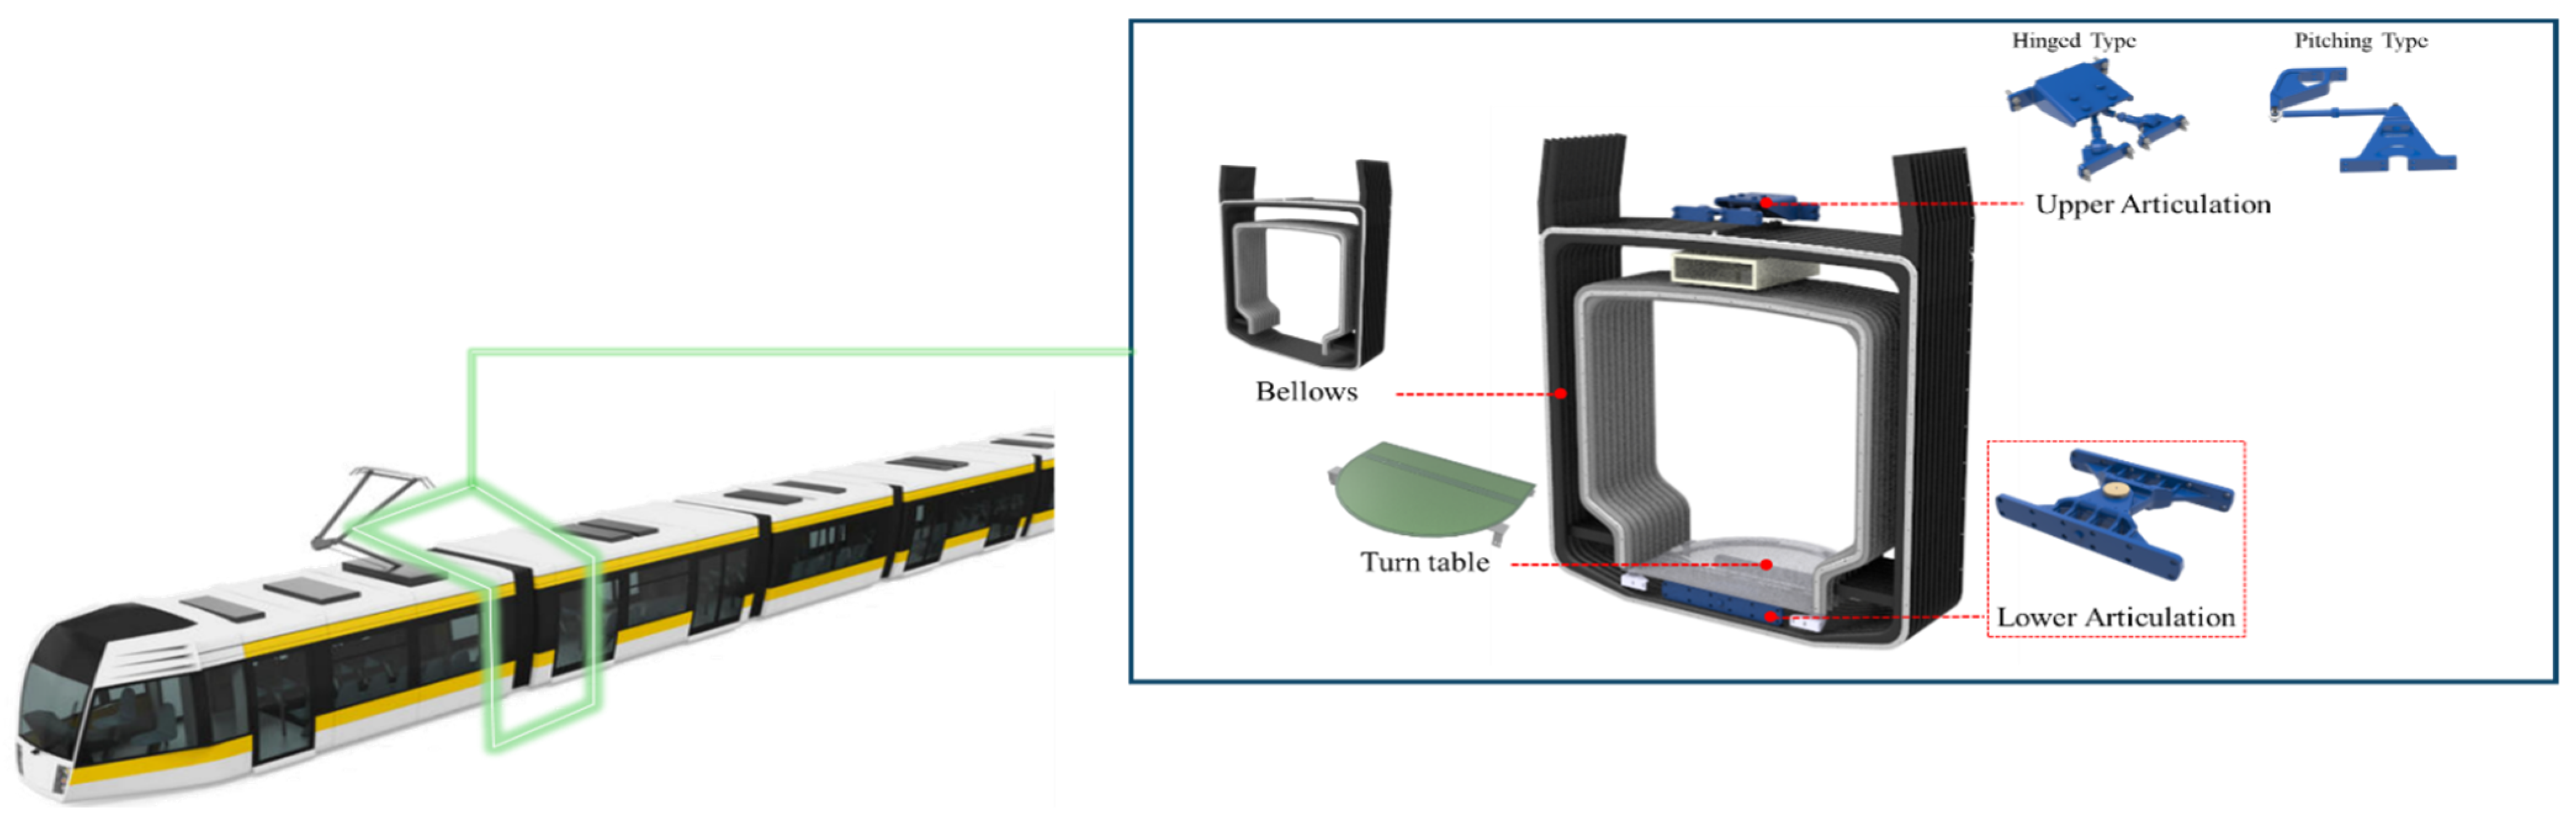
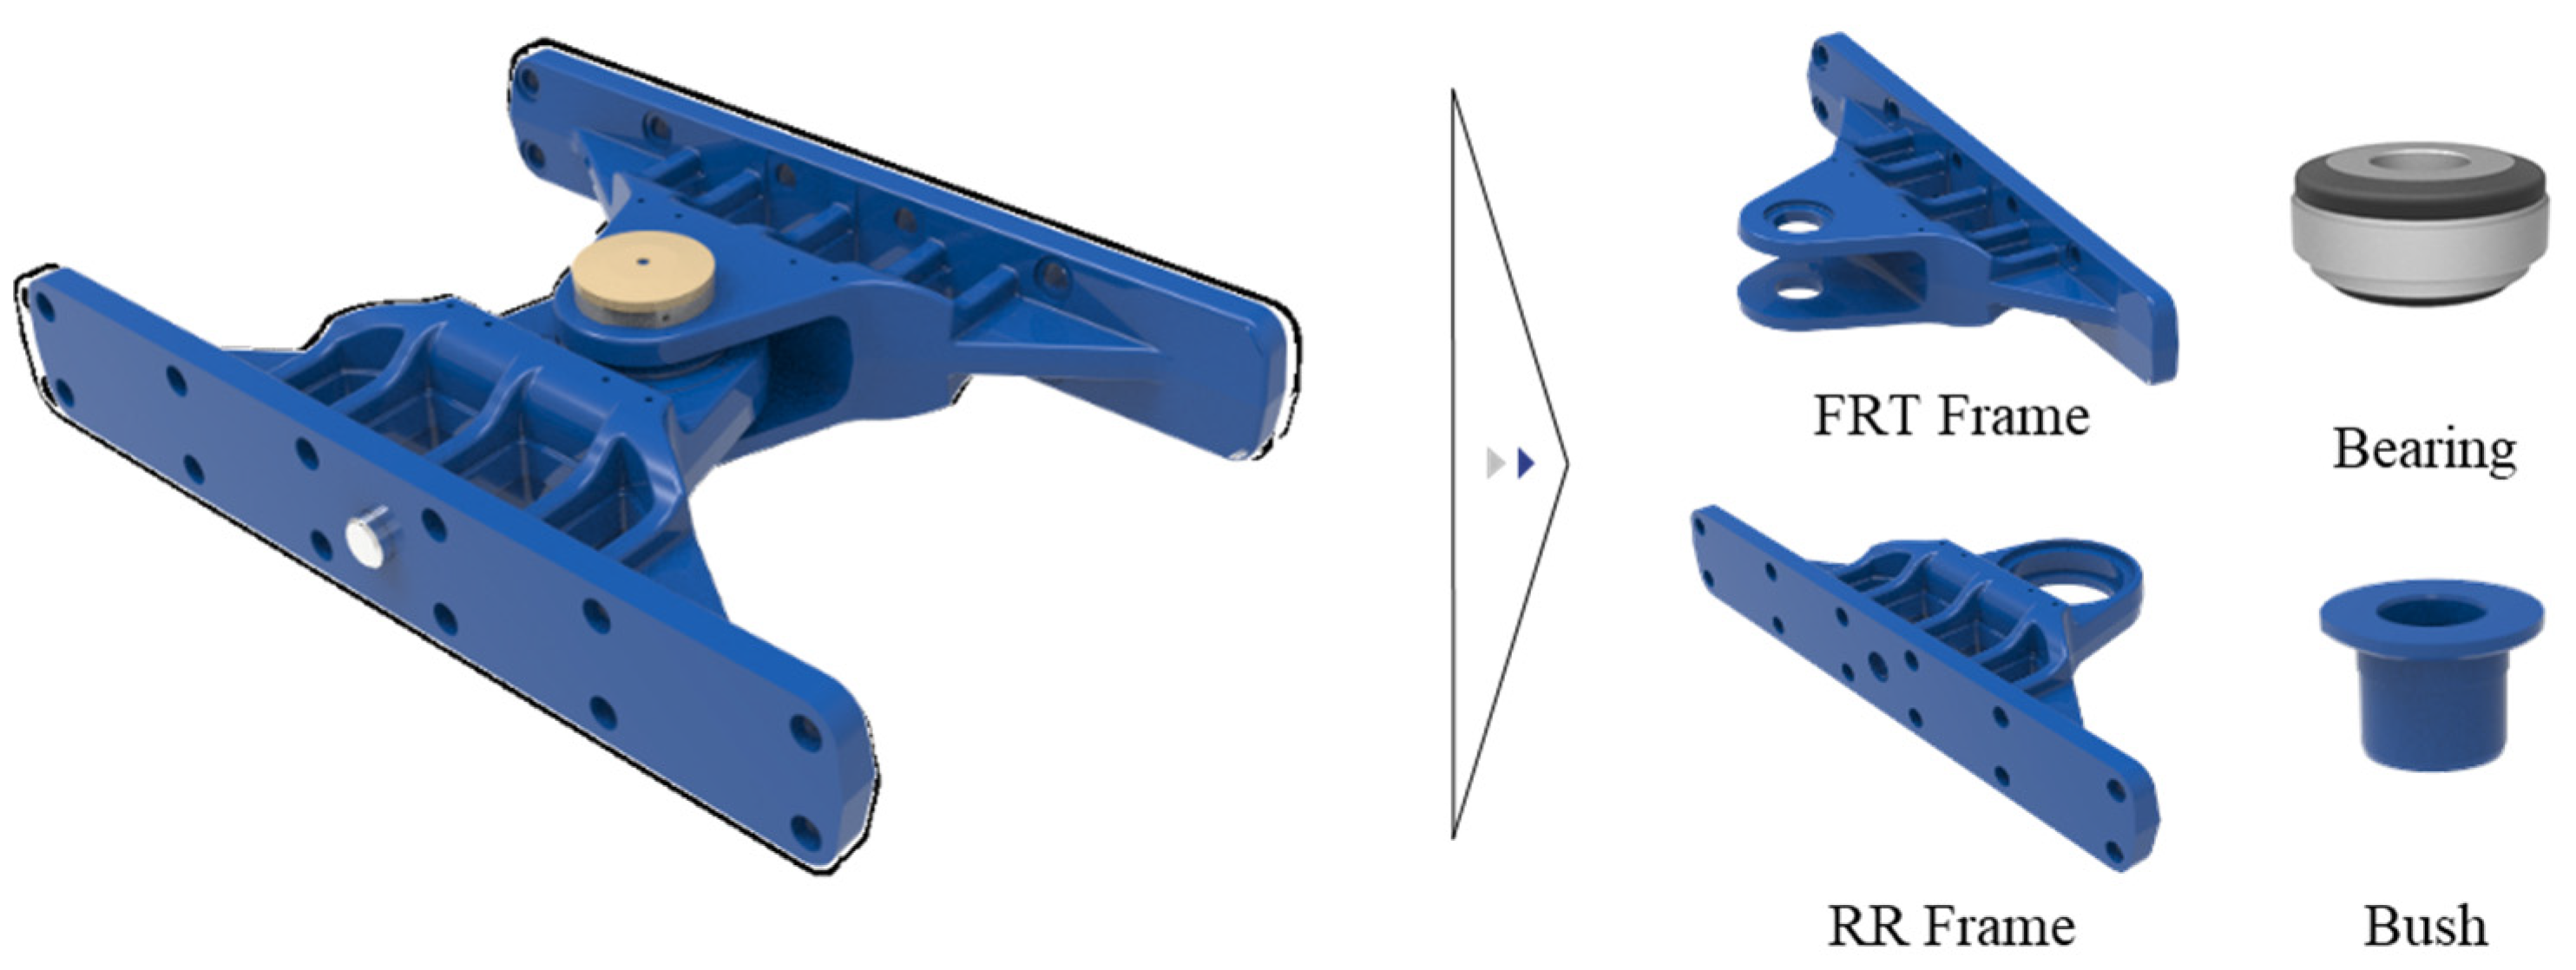
2.1. Lower Articulation

The gangway system, which connects the low-floor tram modules, is illustrated in Figure 1. This system is installed on the upper and lower parts of the tram modules and functions to connect each module, ensuring smooth operation. Among these components, the lower articulation is a key part that not only connects the modules of the low-floor tram but also supports the load while enabling movement through sharp curves and inclines. As shown in Figure 2, the lower articulation, a critical component of the low-floor tram, is composed of several detailed parts, including the FRT Frame, RR Frame, Bearing, and Bush.

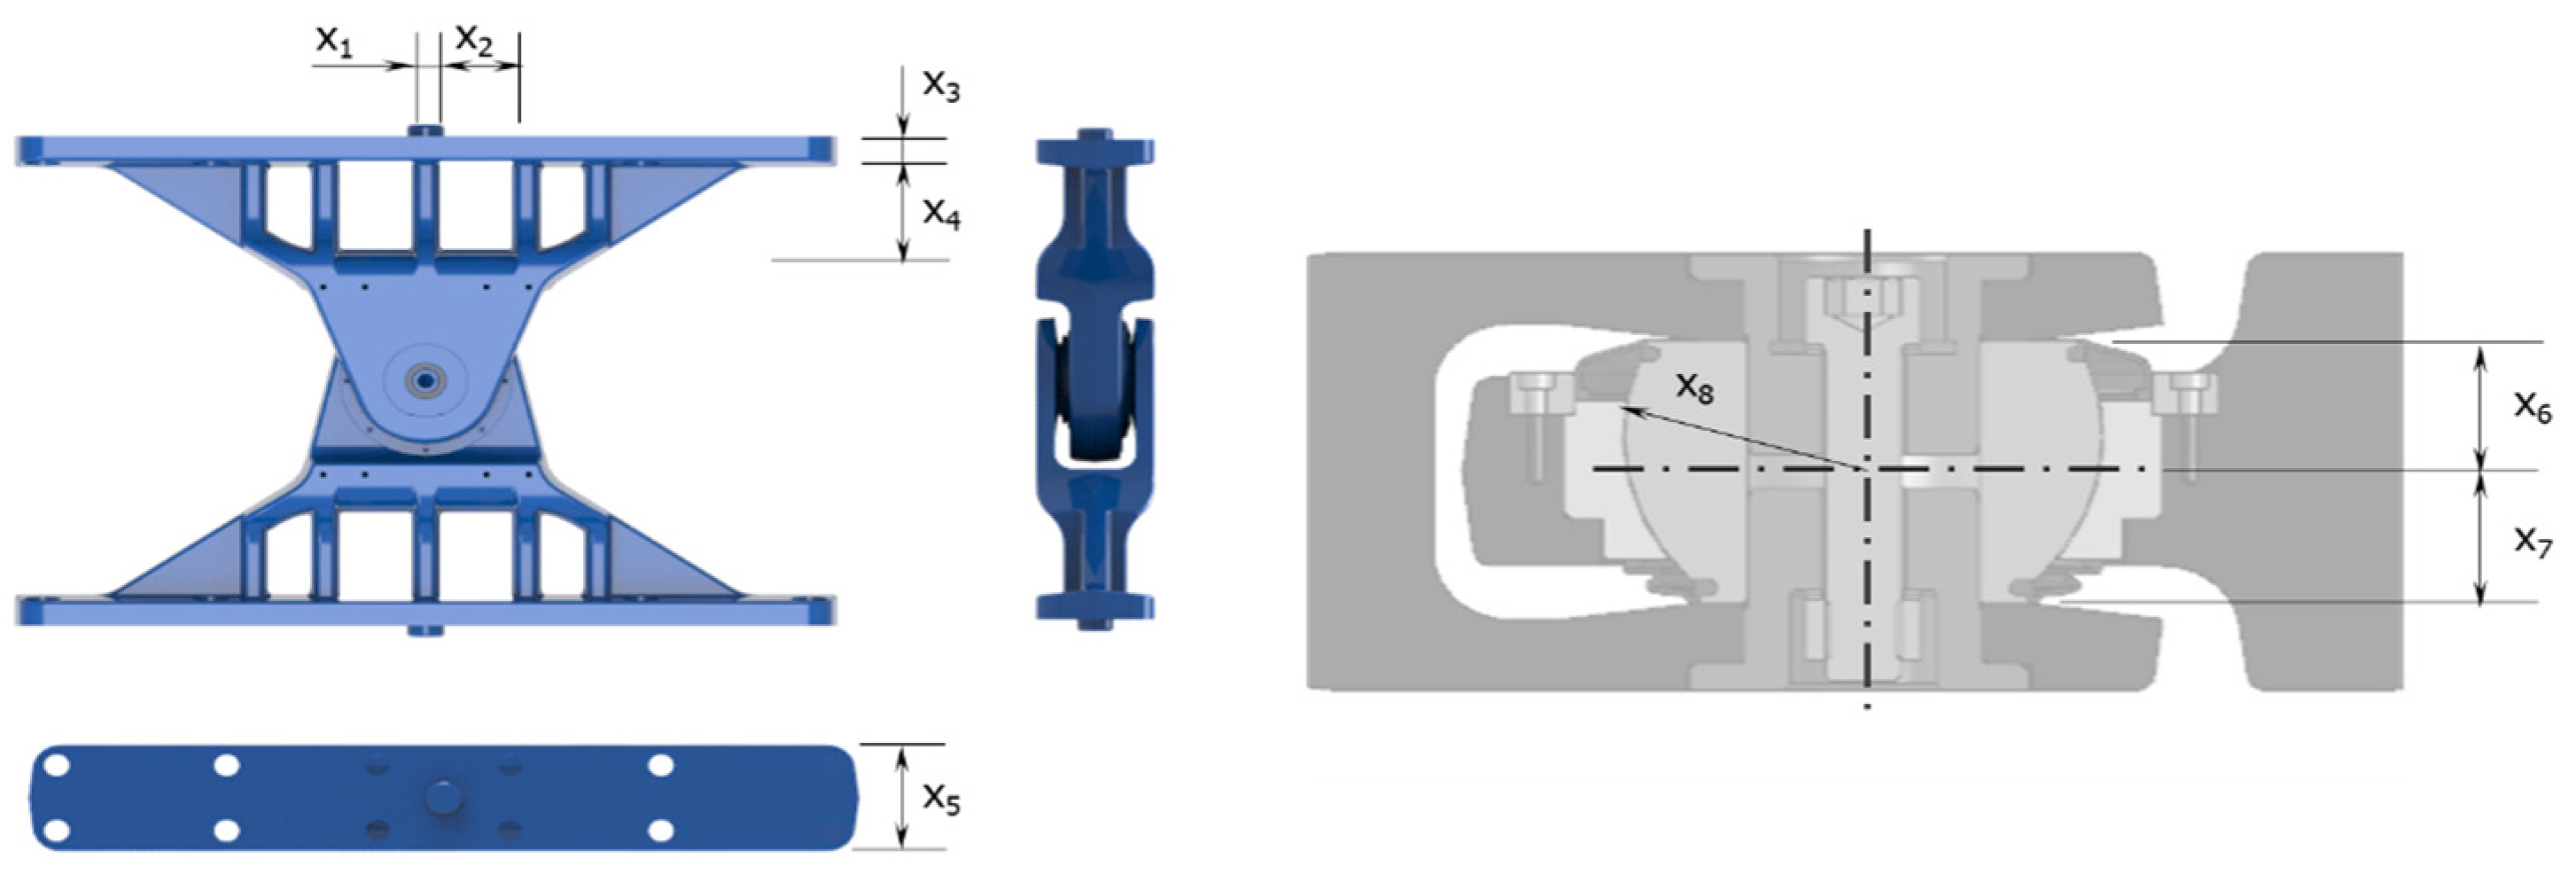
2.2. Design Variable of Lower Articulation

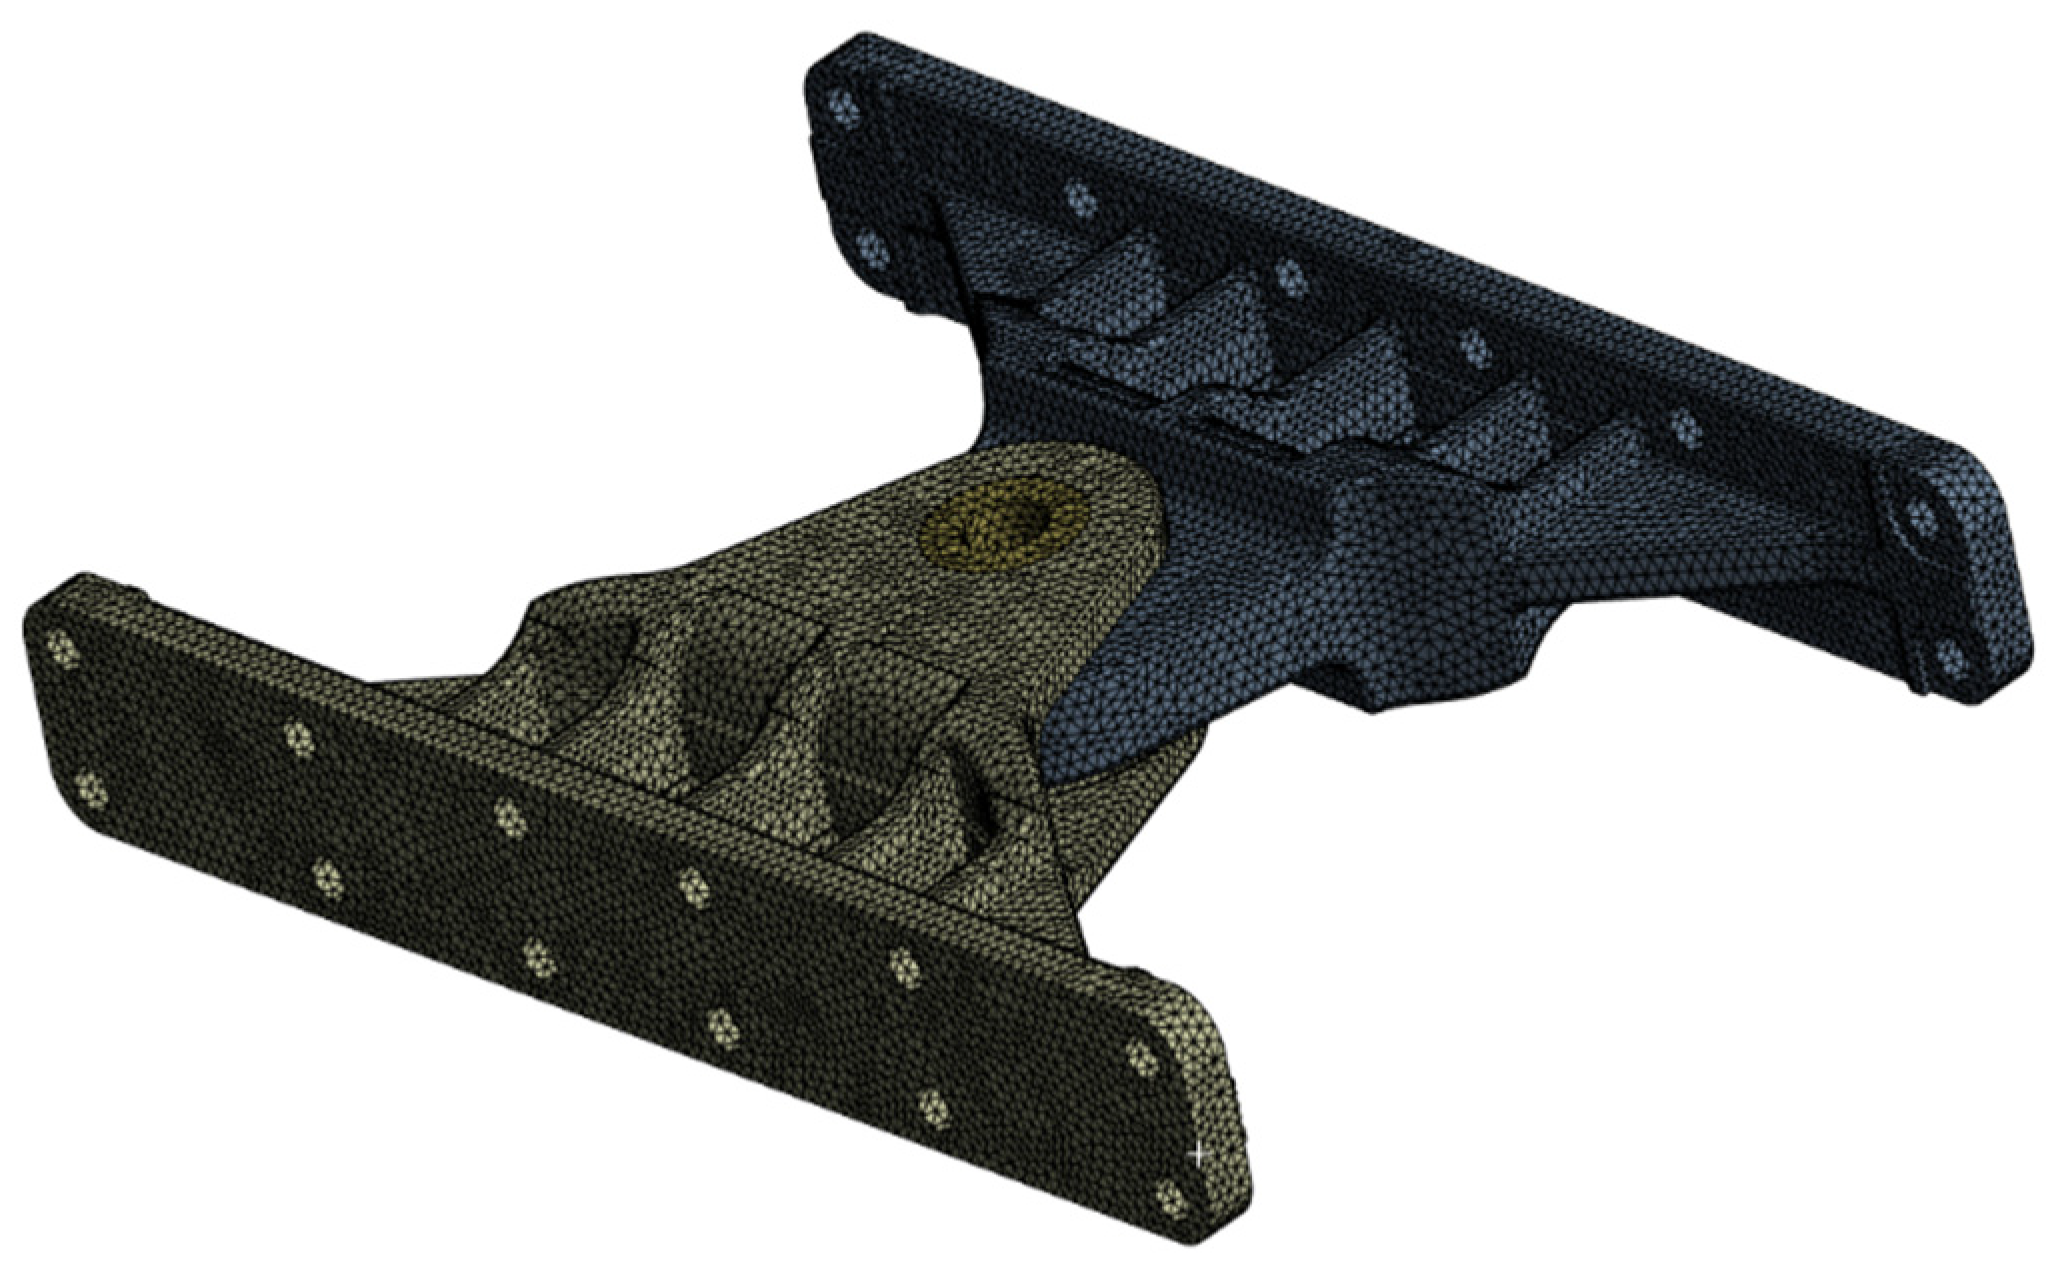
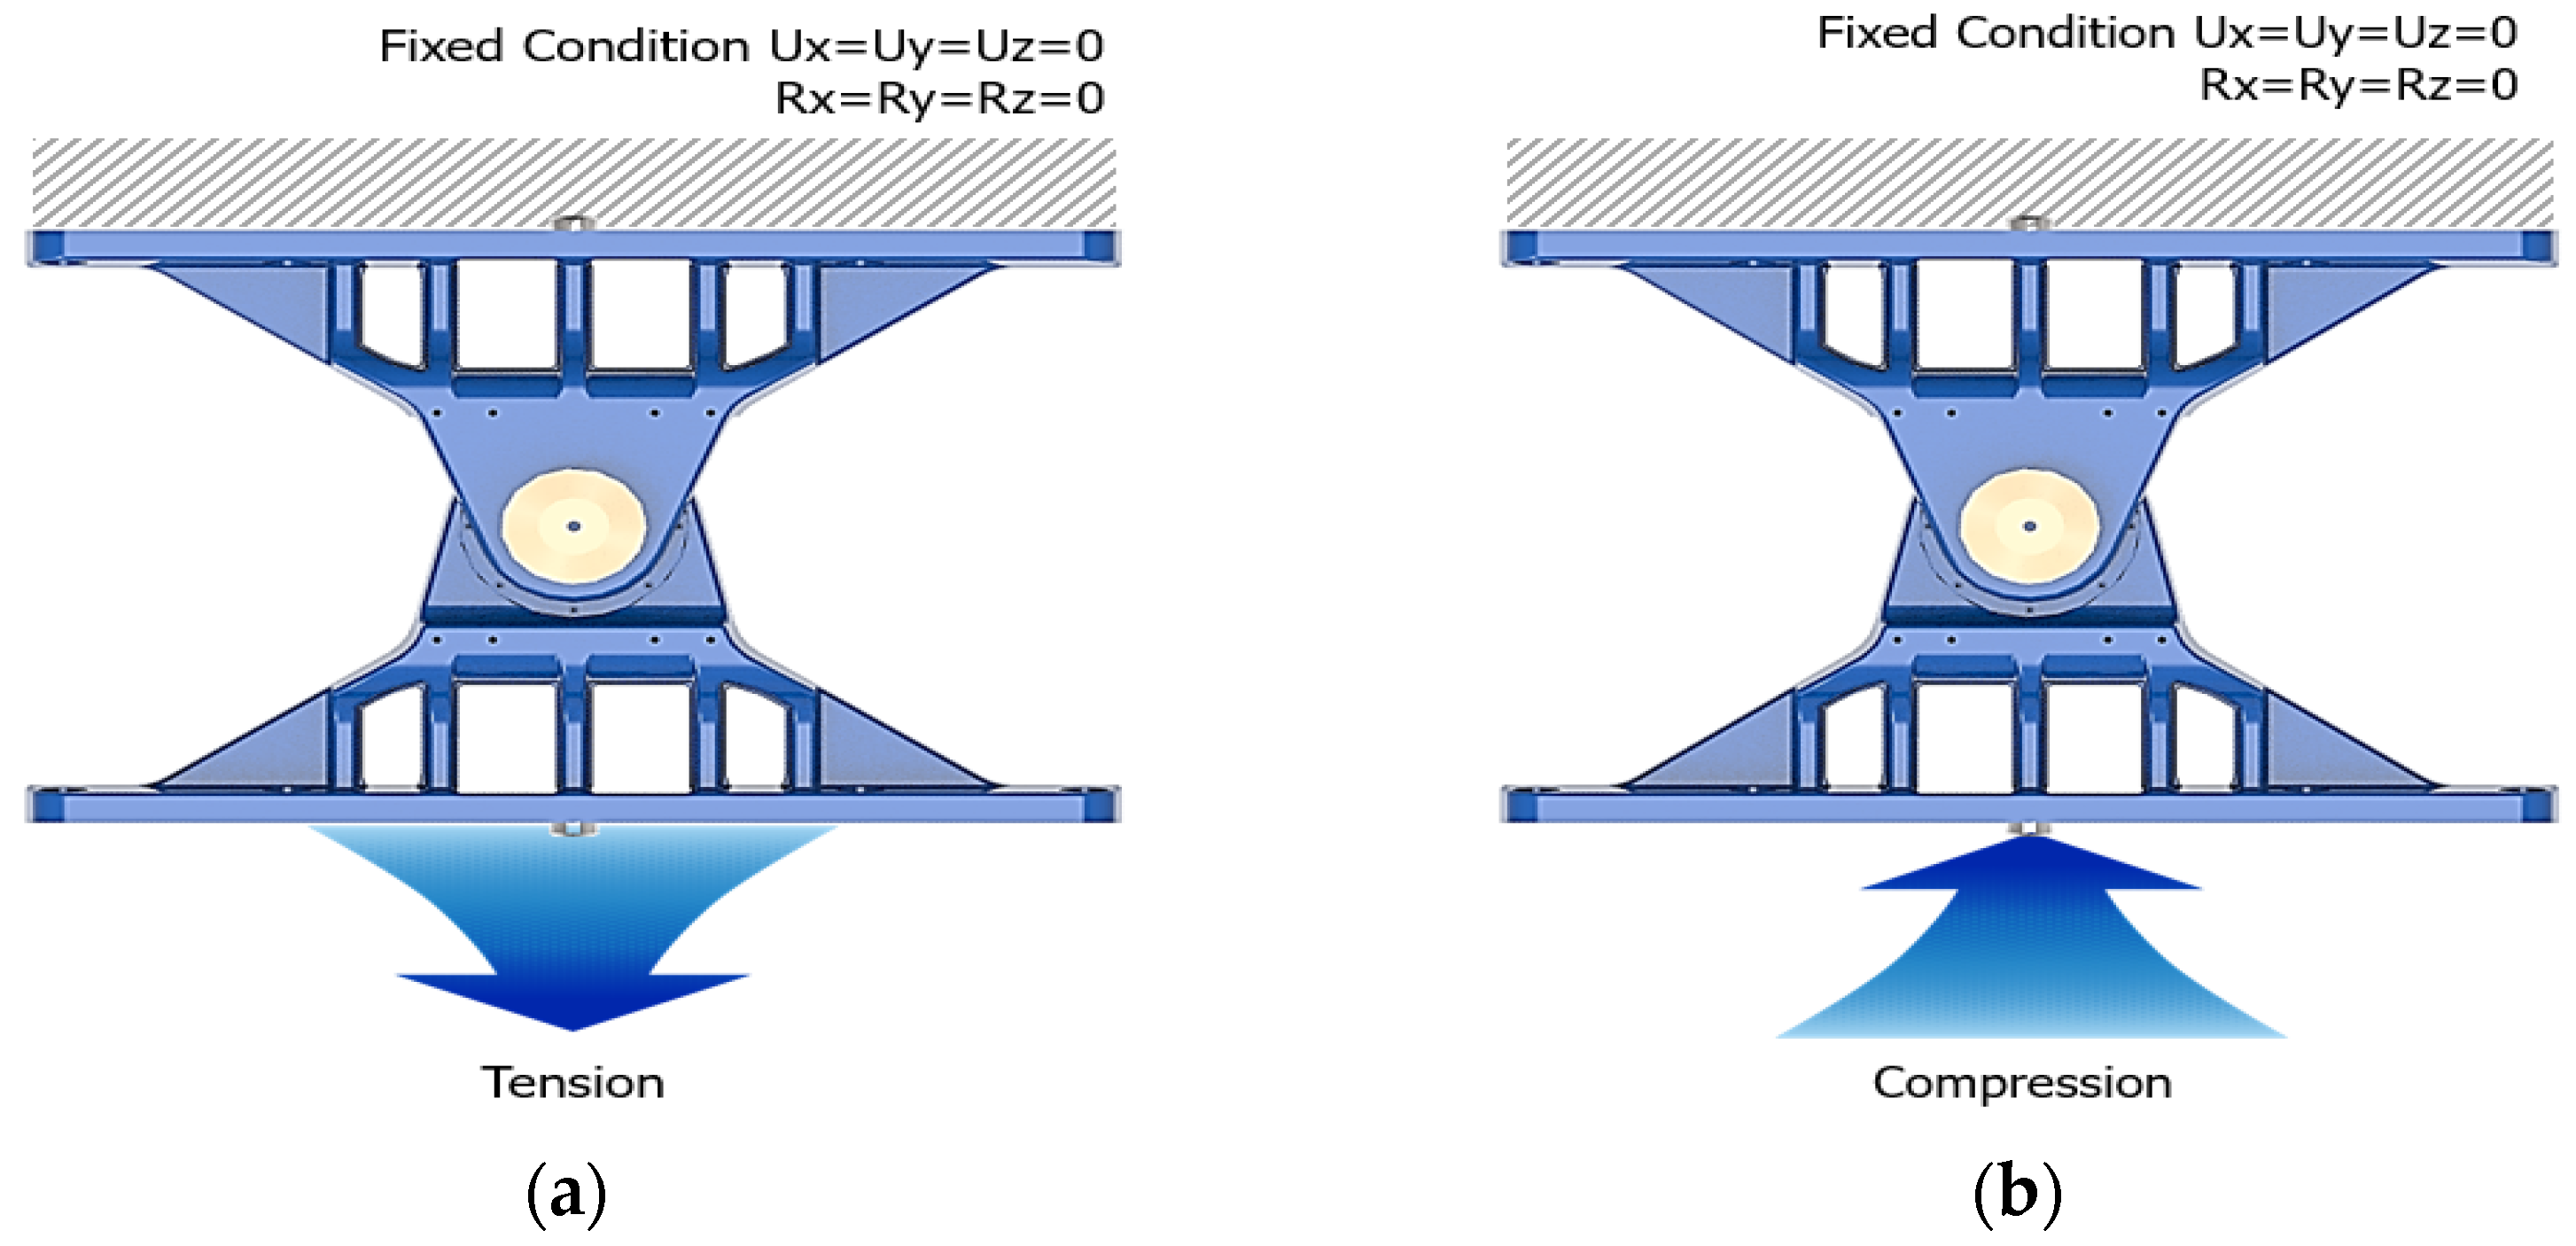
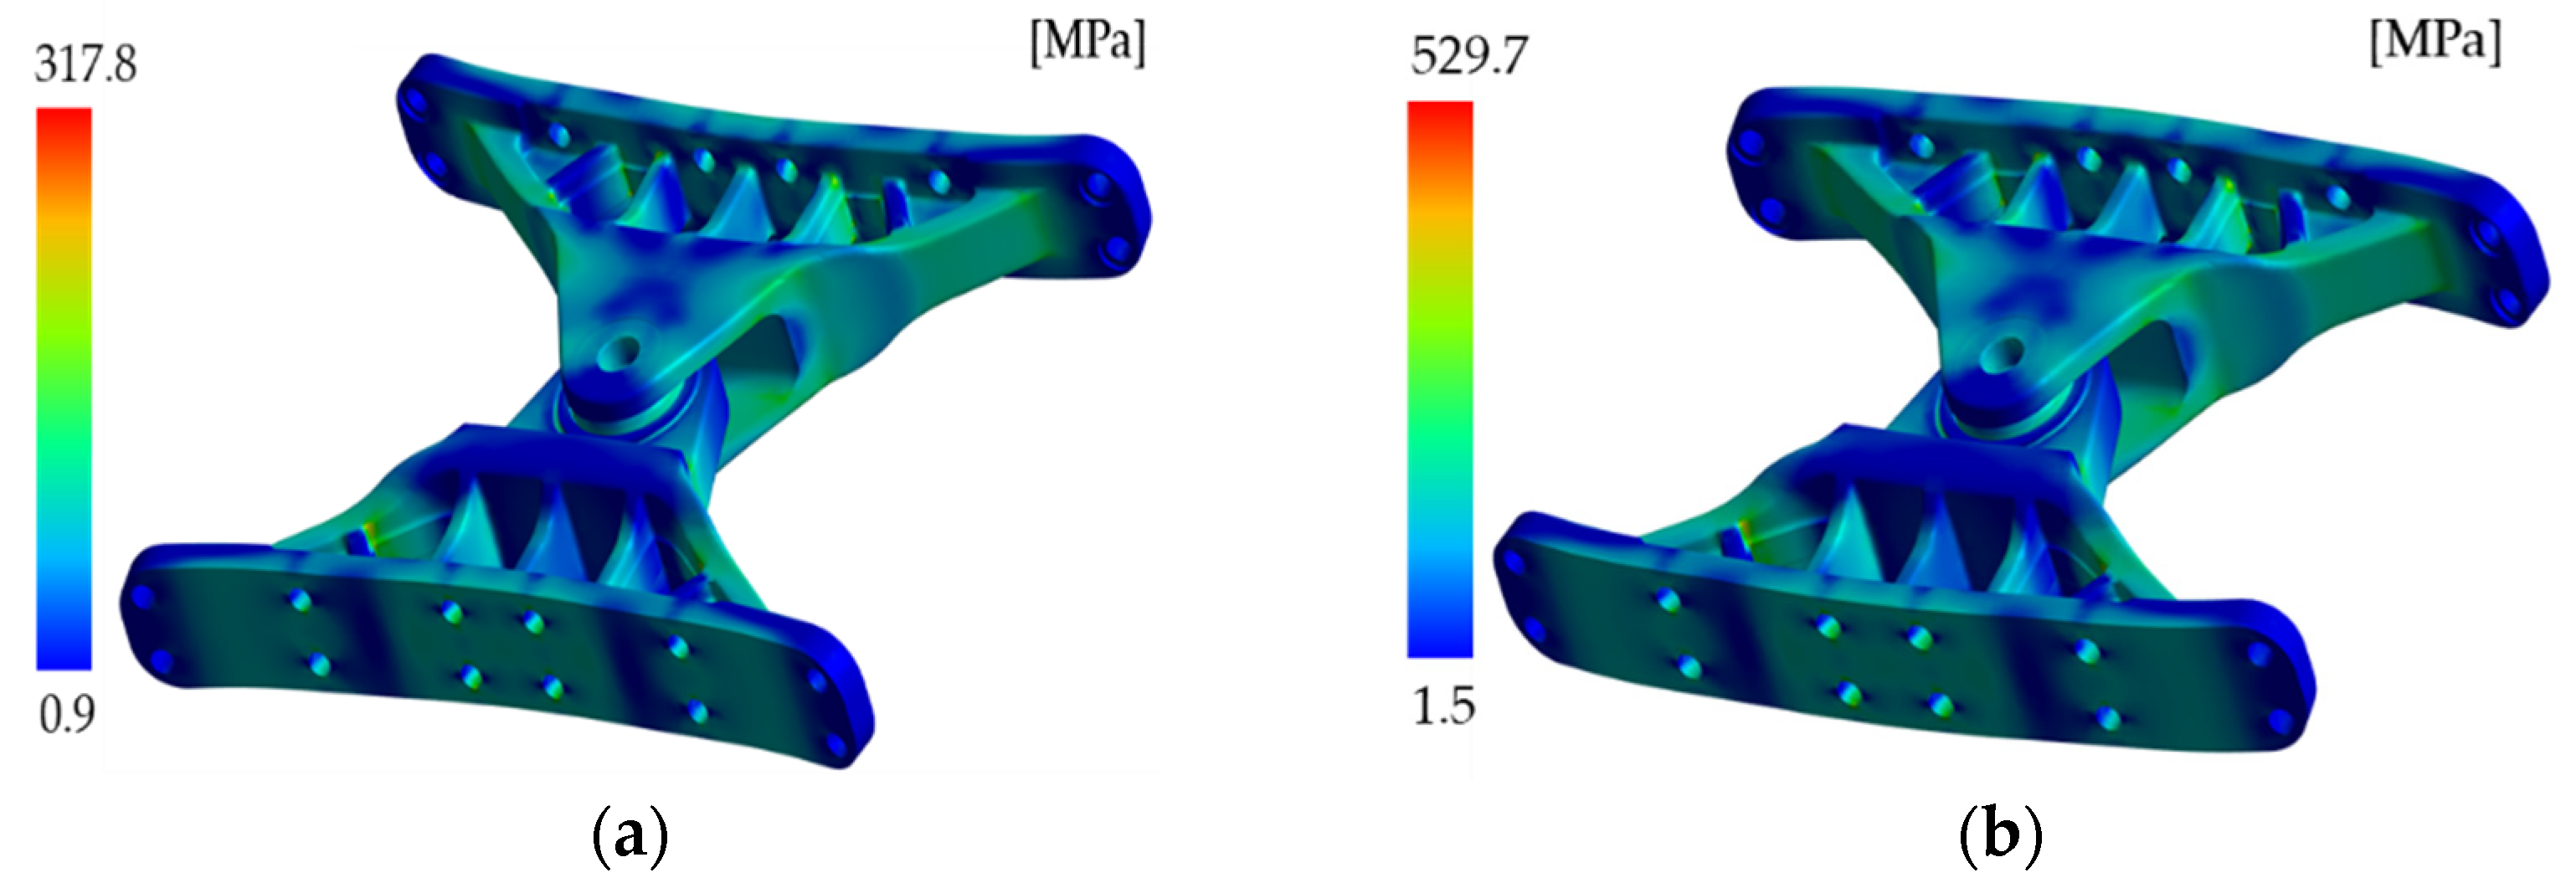
2.2.1. Structural Analysis

The lower articulation must ensure structural stability, as it plays a crucial role in enabling the safe operation of the low-floor tram by withstanding forces from three axes in the vertical, longitudinal, and lateral directions. In this study, ANSYS Workbench Release 18.1 [19] was used as the commercial software. The finite element analysis (FEA) was performed by modeling the lower articulation, as shown in Figure 3. The entire finite element model employed SOLID45, with the number of elements totaling 237,422 and the number of nodes totaling 414,593. The bolted connections between individual components were modeled using tie elements, while the areas expected to experience contact were modeled using surface contact elements. The material of the FRT Frame and RR Frame is SCM440, while the Bearing and Bush are made of STB2 and SM45C, respectively. The mechanical properties of these materials are listed in Table 1. For the boundary conditions, all directions on the end surface of the FRT Frame were constrained. The loading conditions were determined based on an analysis by the vehicle manufacturer, as well as relevant standards and specifications. A tensile load case of 600 kN and a compressive load case of 1000 kN were applied to the RR Frame. Figure 4 illustrates the loading and boundary conditions for the lower articulation.
The finite element analysis (FEA) was performed using tensile and compressive loads applied to the lower articulation. Figure 5 shows the stress distribution obtained from the structural analysis. As indicated in the figure, the maximum stress was calculated to be 317 MPa under tensile load case and 529 MPa under the compressive load case, both of which are below the allowable stress limit of 980 MPa. Therefore, it can be concluded that the lower articulation is structurally safe. Furthermore, design variables were selected based on the results of the structural analysis.

2.2.2. Design Variable

Based on the basic design of the lower articulation, the design factors were derived from the results of the structural analysis. These factors, which can influence both the strength and weight of the articulation, were determined by ensuring that there is no interference between the components. The design variable parameters were calculated based on the structural analysis. These parameters include x1 (Middle Frame), x2 (Frame Hold Width), x3 (Frame Edge Width), x4 (Frame Neck Length), x5 (Frame Width), x6 (Core Upper Length), x7 (Core Lower Length), and x8 (Core Radius). The design variables are illustrated in Figure 6. A total of eight variables affecting the characteristics of the lower articulation were selected. A range of conditions were established for each derived design factor, with the criteria based on considerations such as shape interference, as shown in Table 2.

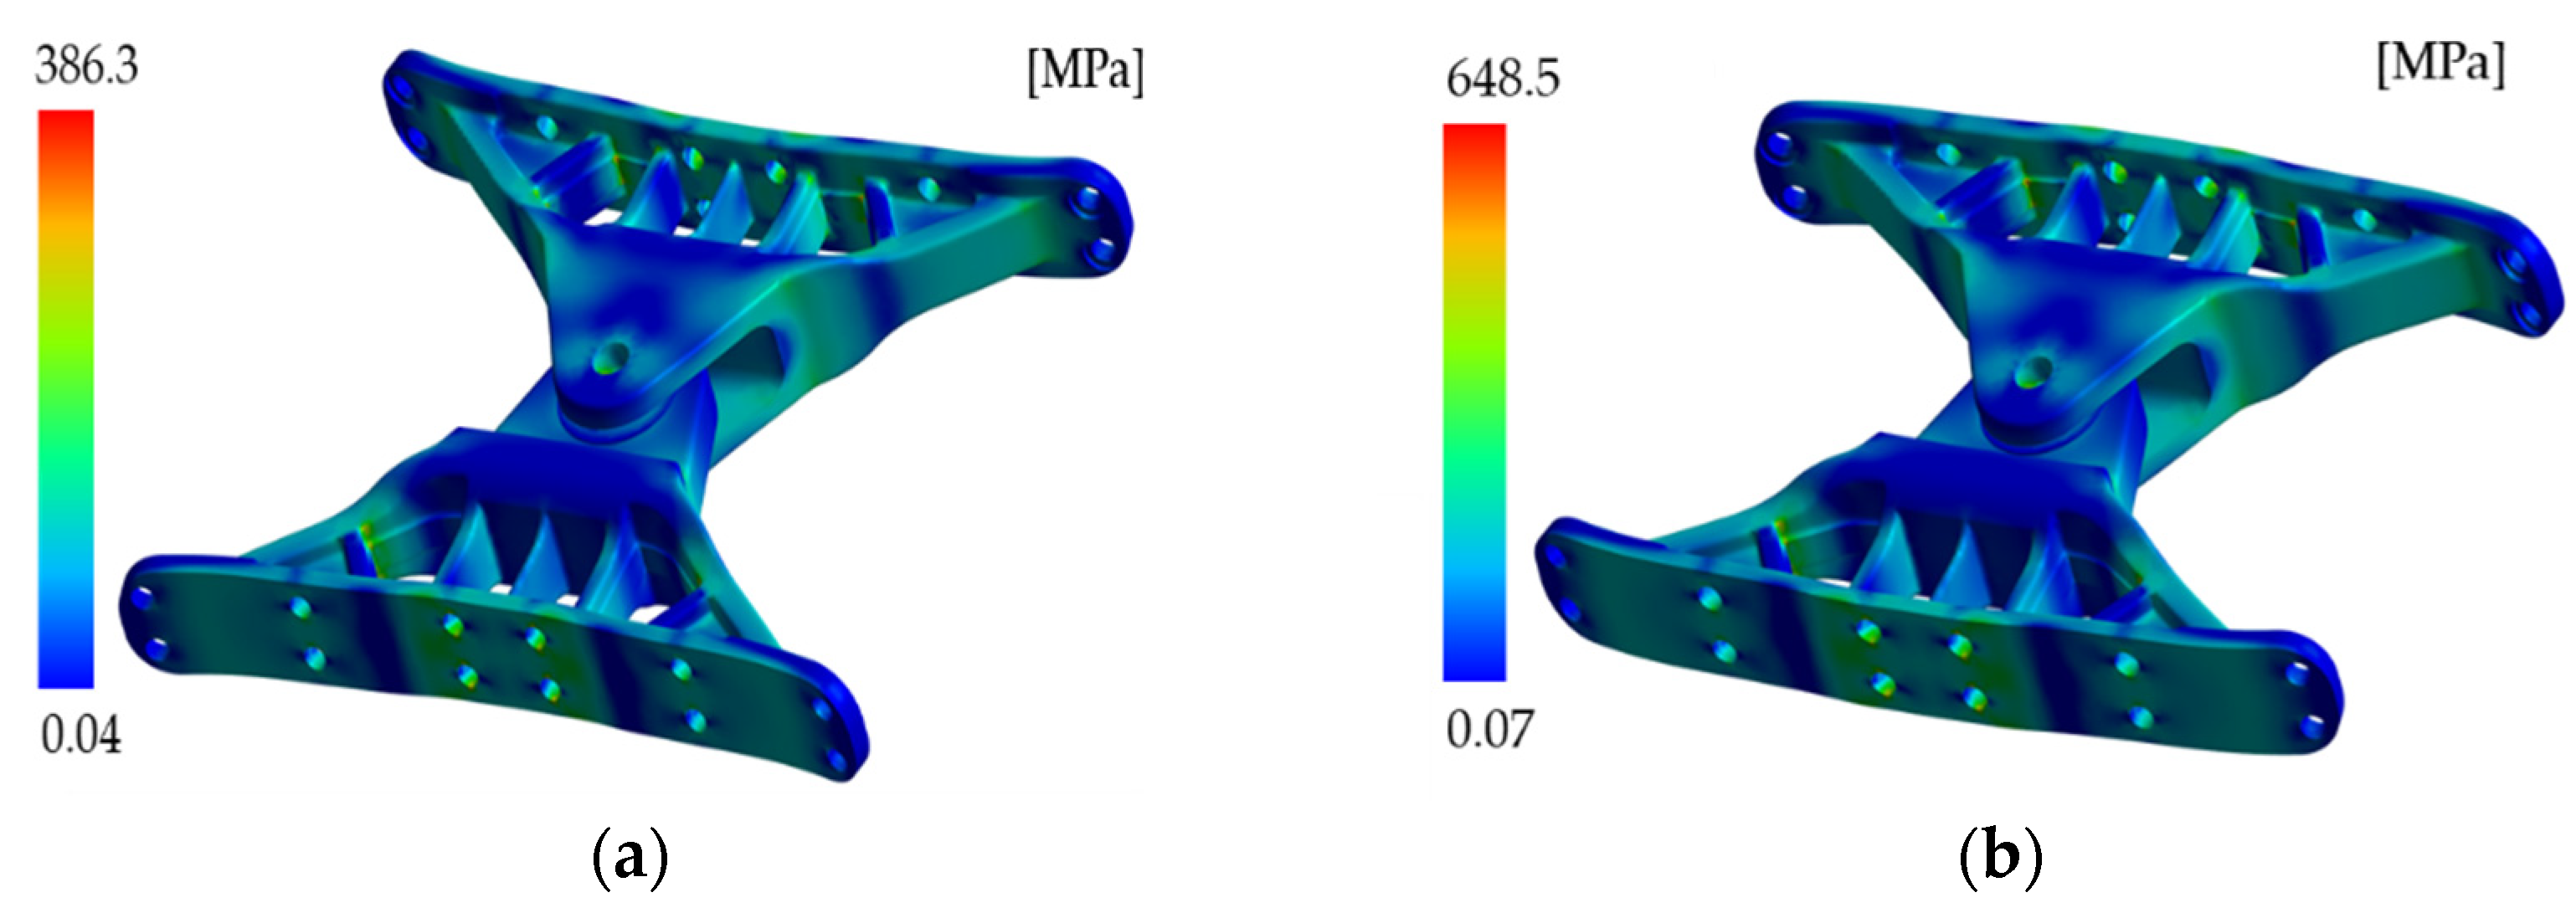
2.3. Structure and Fatigue Life Evaluation of Optimized Lower Articulation

2.3.1. Structural Design Using Meta-Model

The objective function of the optimal design of the lower articulation of the low-floor tram is to minimize the weight while ensuring that the stress remains within the allowable stress range. The constraints are defined based on the stresses derived from the tensile and compressive load conditions as follows:
Minimize W = W (x1, x2, x3, x4, x5, x6, x7, x8) Subject to
g = Allowable stress ≦ 650 MPa
Design variables
Lower ≦ x1, x2, x3, x4, x5, x6, x7, x8 ≦ Upper
Here, g represents the stress for each design variable, and W denotes the weight of the articulation. The initial analysis results indicated that the stress of the lower articulation did not exceed the allowable stress limit of 650 MPa. Consequently, the Incomplete Small Composite Design-II (ISCD-II) method was employed to ensure that the stress remained below the allowable limit while minimizing the weight. The commercial software Easy Design [20] was used to create the analysis conditions. Table 3 presents the experimental design matrix and analysis results for the eight factors using the ISCD-II technique. A total of 16 analyses were conducted to account for the variations in stress and weight due to changes in the eight factors. Table 3 also includes the maximum stress and weight values. The Kriging model was utilized in conjunction with the optimization algorithm to add experimental points and determine the optimal values. The optimization results, achieved by adding three experimental points, were identified as SAO #1–3. For example, Figure 7 shows the stress distribution results for SAO #3. The trend in the results is consistent with the initial model analysis. The model that meets the allowable stress of the design and minimizes the weight is identified as SAO #3. This model achieved a 10% reduction in weight from 143.7 kg in the initial model to 128.7 kg, fulfilling the goal of lightweight optimization. Additionally, the optimized lower articulation demonstrated appropriate stress levels within the allowable stress range, thereby achieving the optimization objectives.

2.3.2. Sensitivity Analysis

To examine the impact of the eight design factors on the objective functions of stress and weight for the lower articulation of the low-floor tram, sensitivity analyses were performed. Figure 8 shows the results of the sensitivity analyses for stress and weight. Figure 8a presents the sensitivity analysis results for stress. It was observed that factors x1 and x5 had little effect on the stress. Additionally, it was confirmed that changes in thickness for the remaining variables resulted in increased stress. Figure 8b shows the sensitivity analysis results for weight. As seen in the figure, factors x3, x5, and x6 significantly affected the weight due to changes in thickness. Conversely, the impact of the changes in thickness on weight for the other variables was minimal. The sensitivity analyses identified the factors that influence stress and weight.

3. Experimental Verification of Lower Articulation

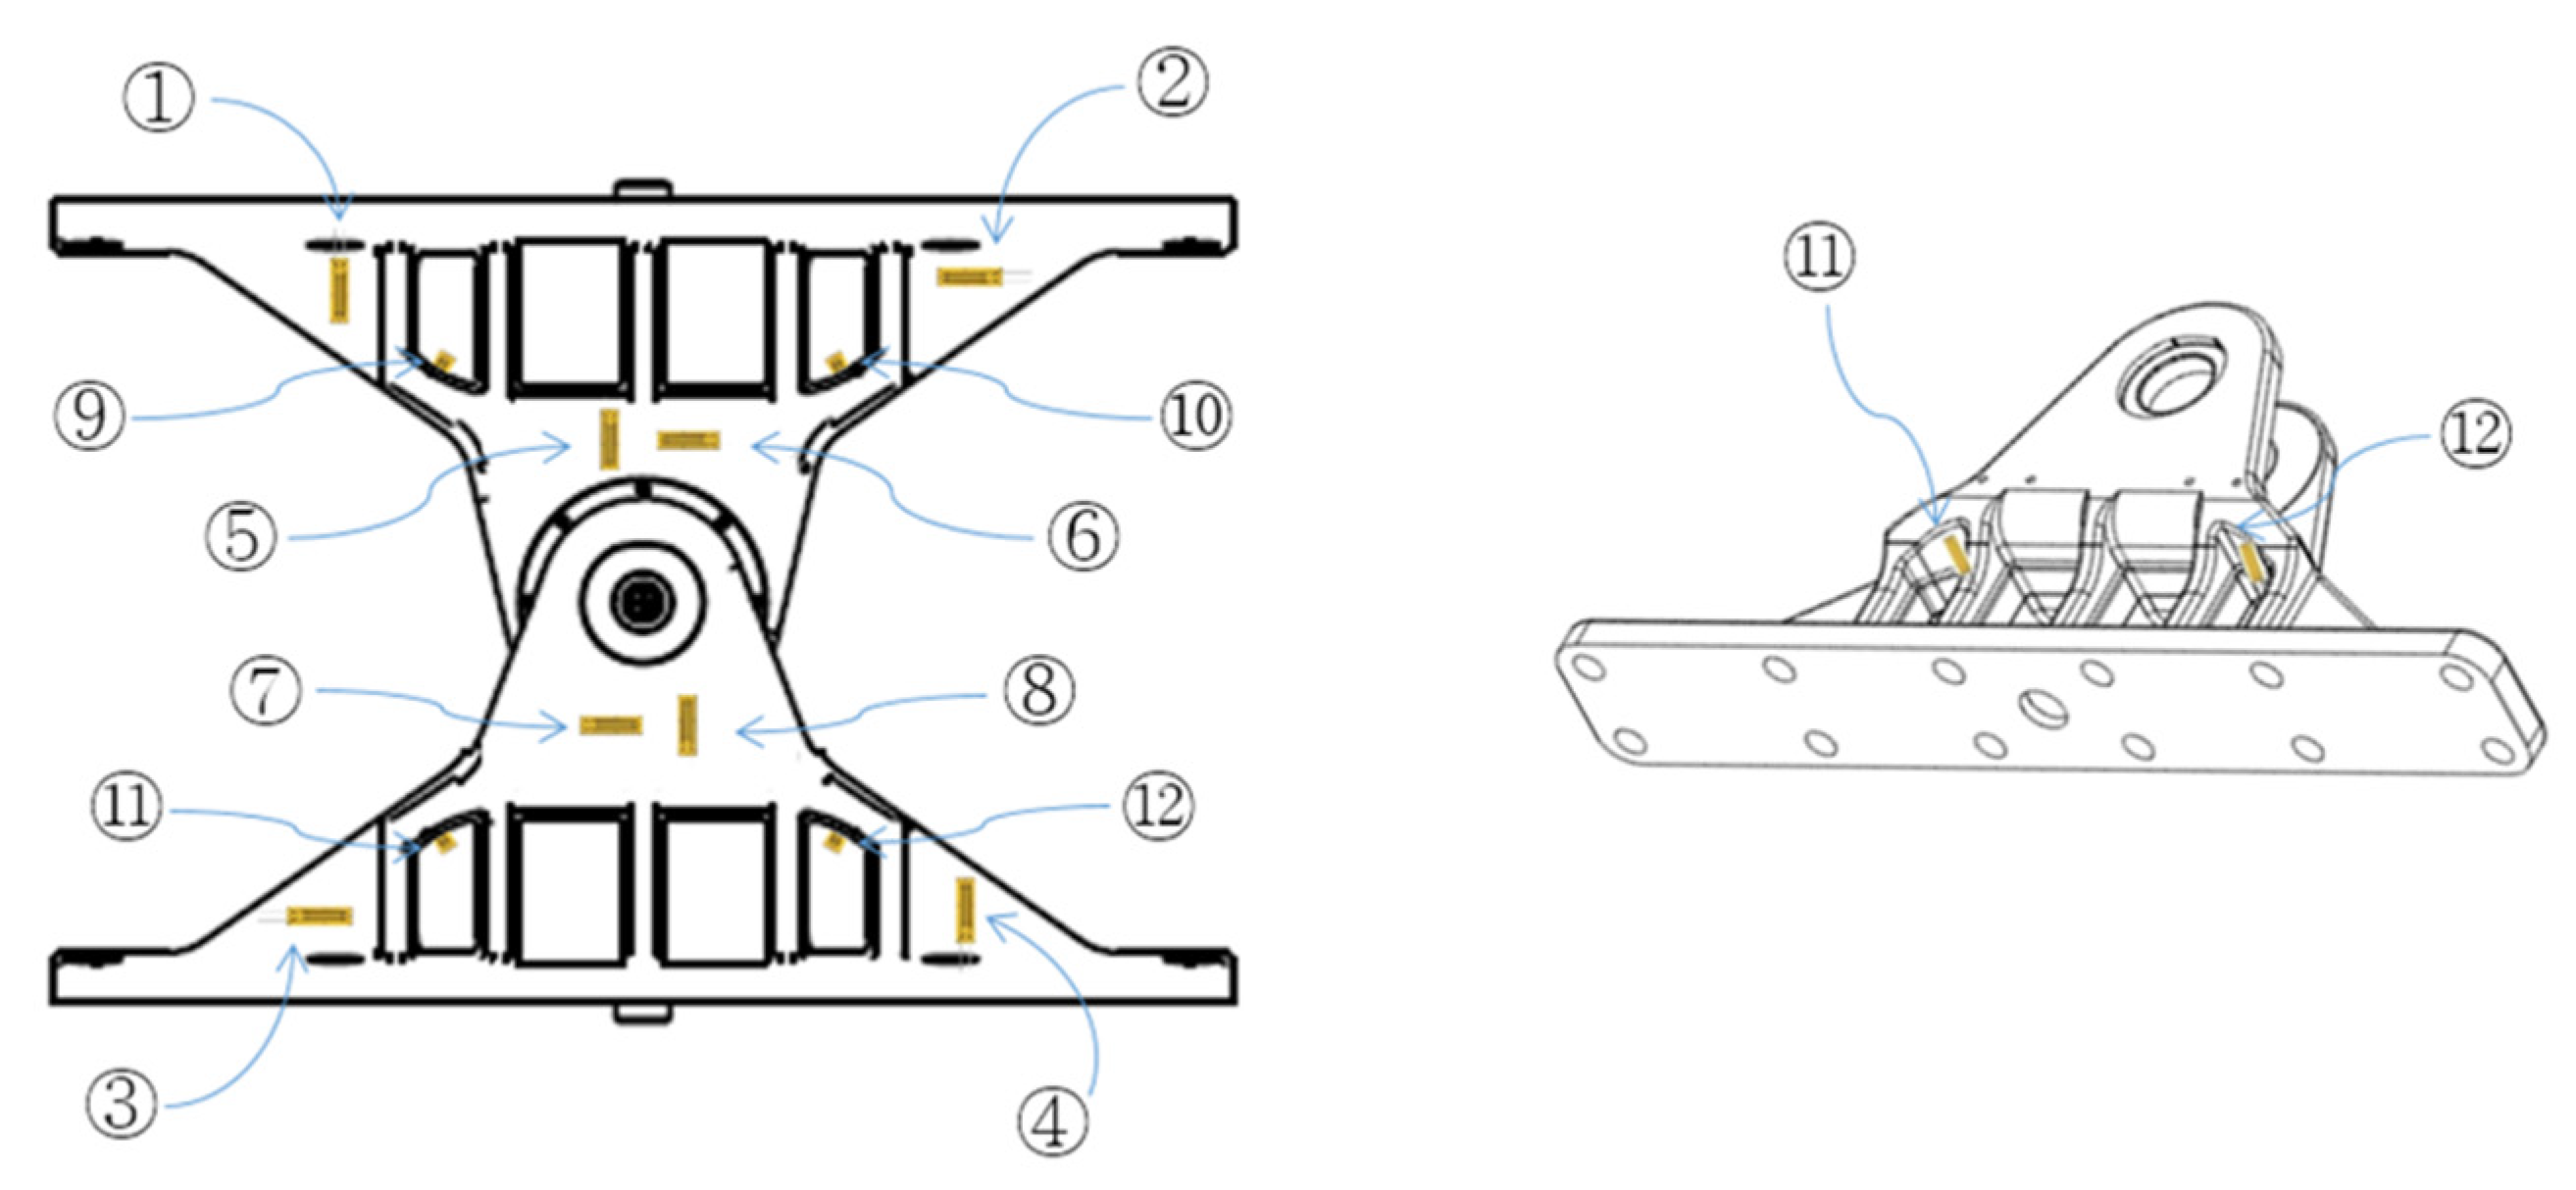
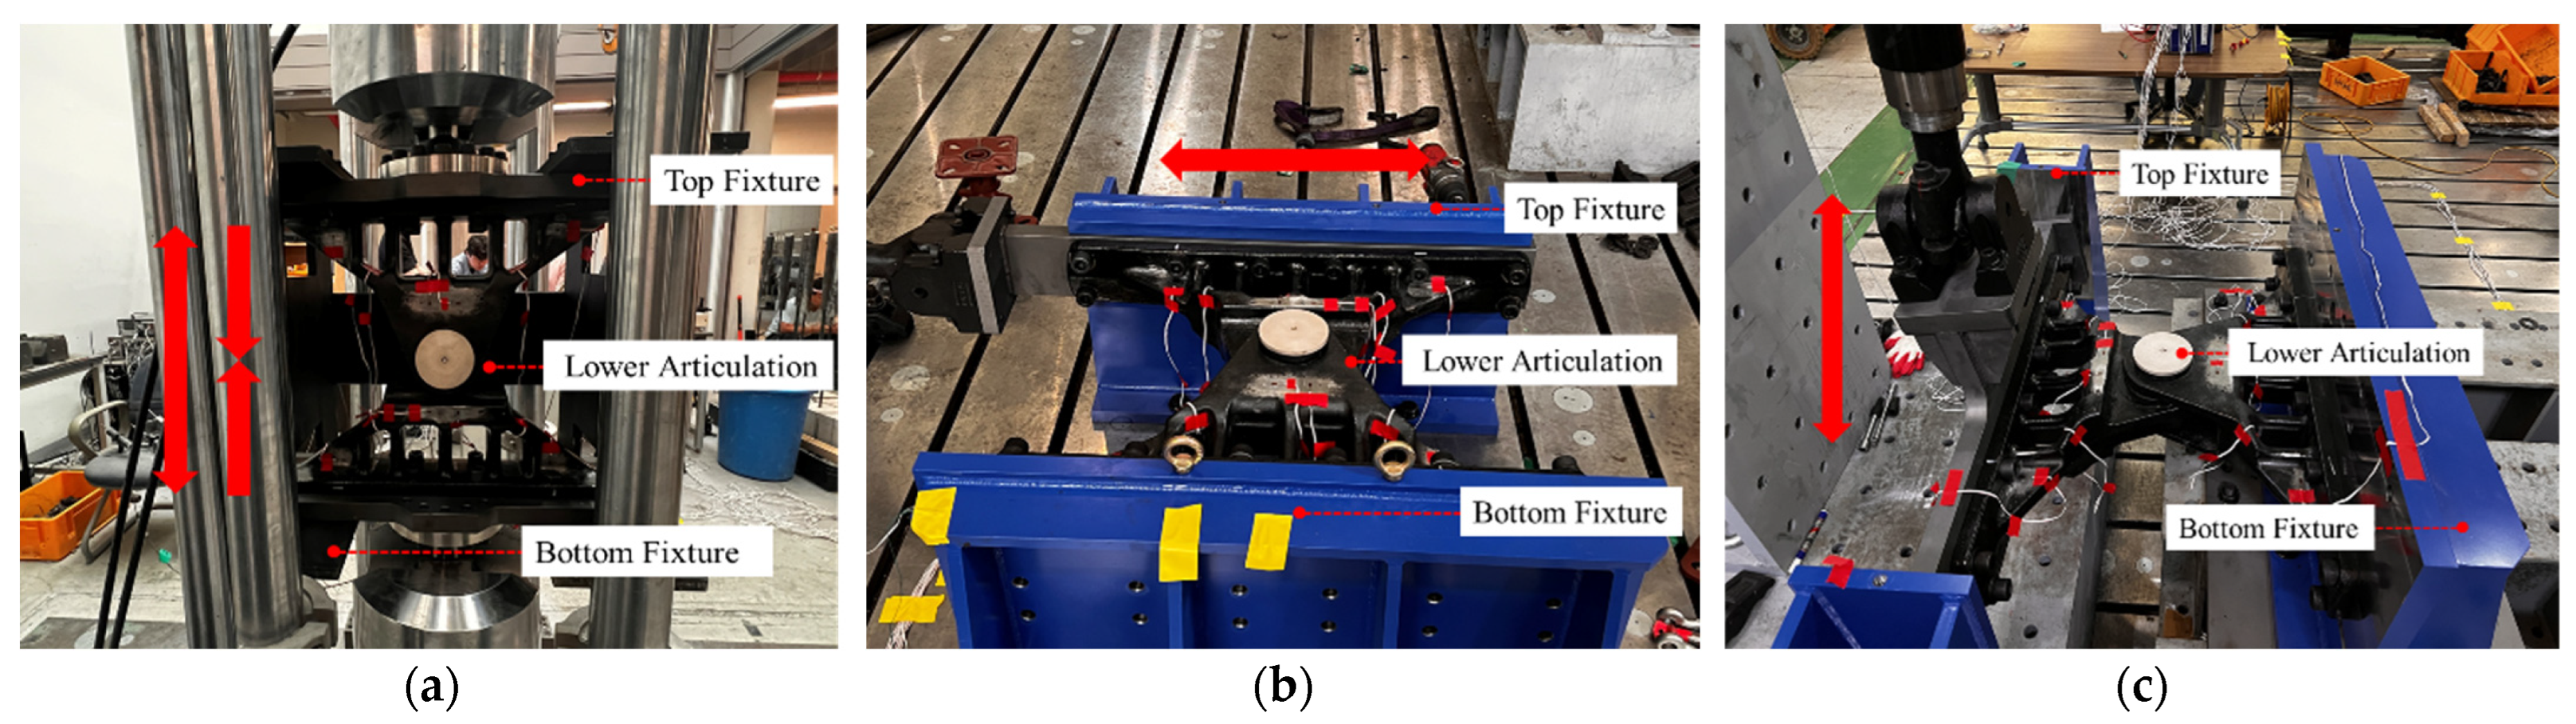
3.1. Structural Test

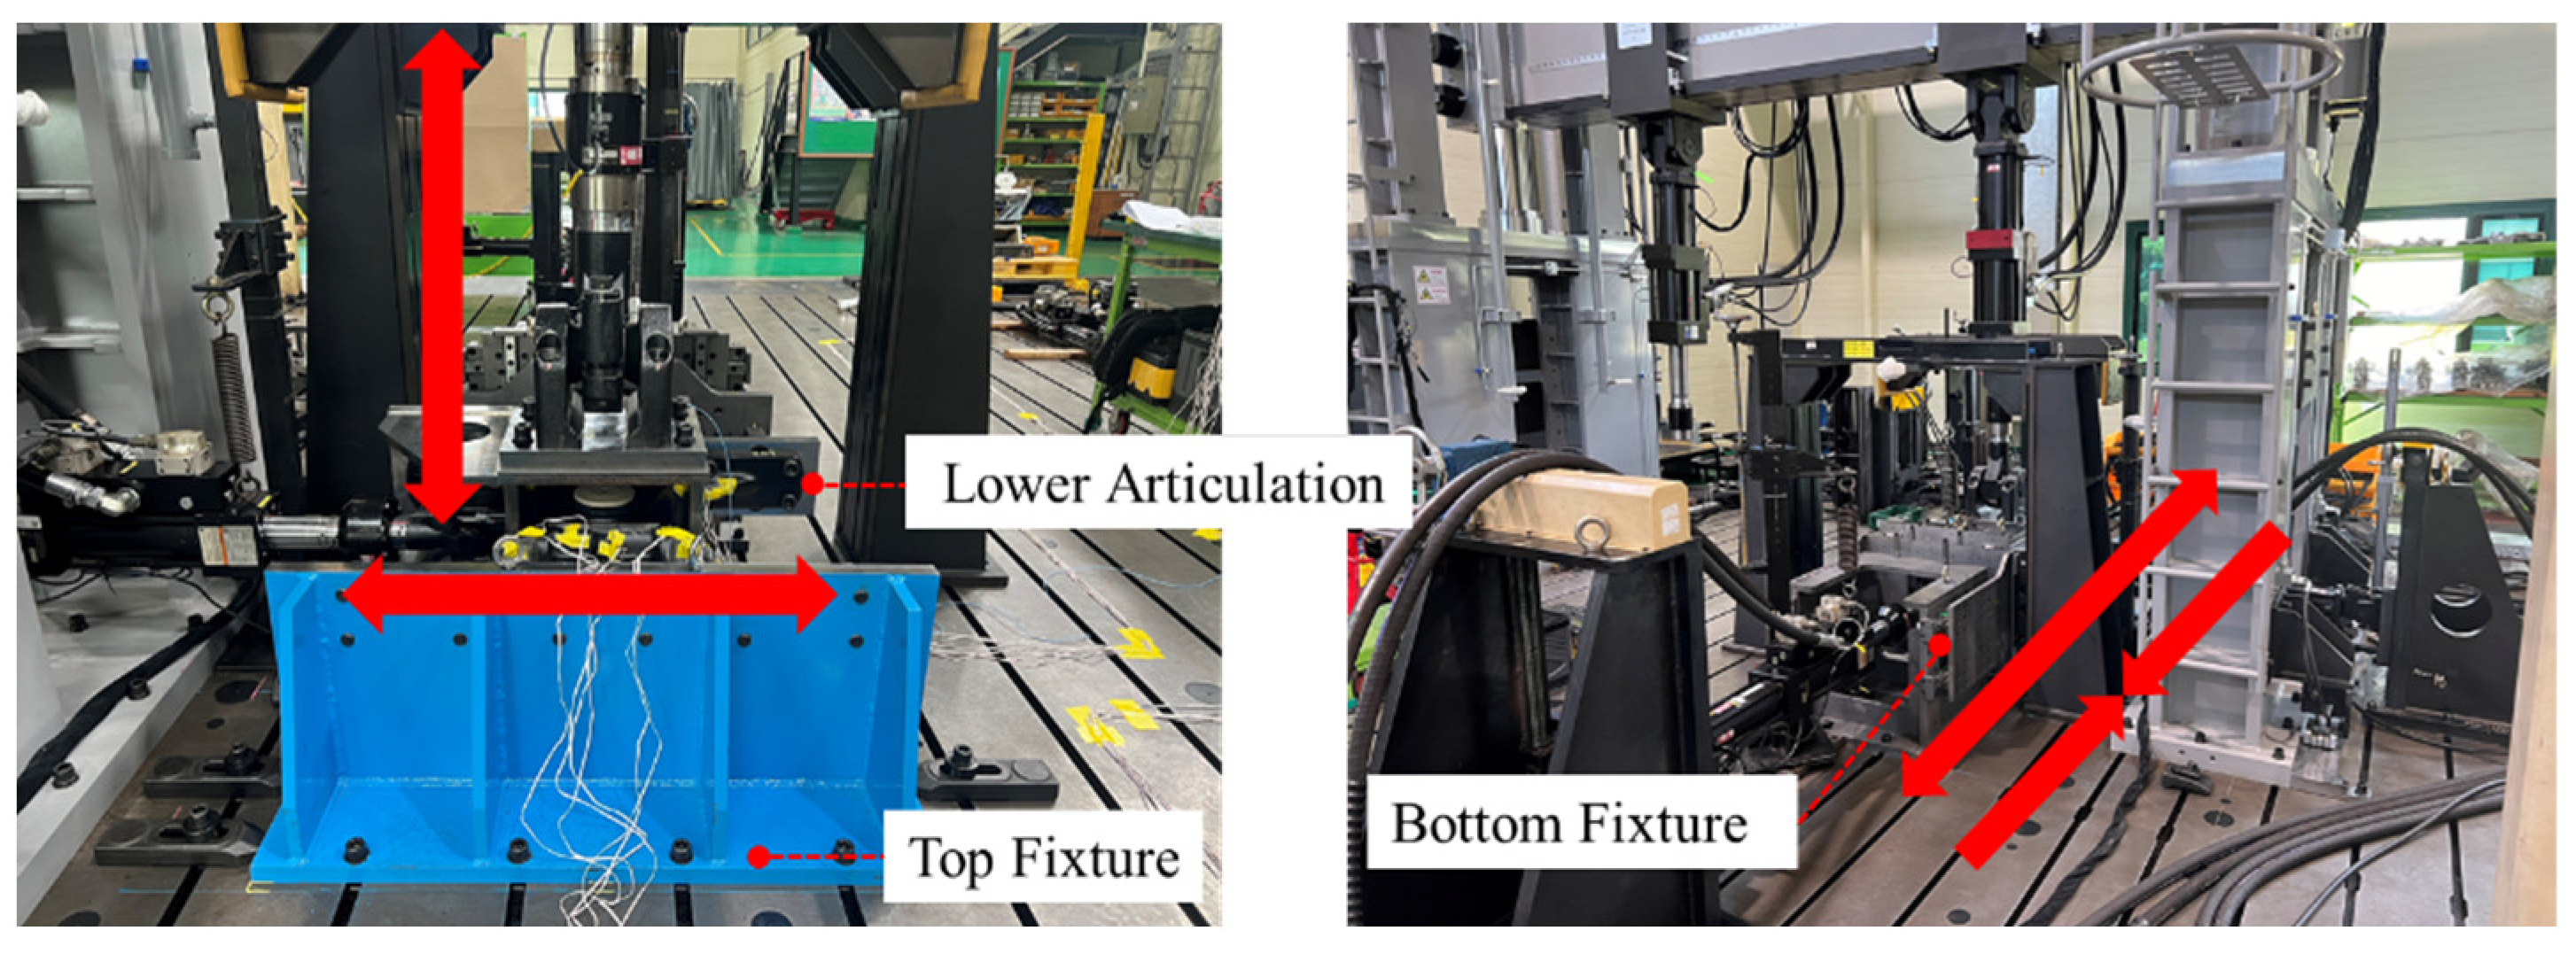
3.1.1. Structural Test Method

In order to verify the experimental validation of the optimized lower articulation, we produced one unit and conducted a structural test to measure the strain. The test conditions were established based on the vehicle manufacturer specifications, advanced standards, and regulations EN 12663-1 and EN 13749 [21,22]. The structural tests were performed under ambient conditions at room temperature, using displacement control. The details of the test loads, speeds, and equipment used for each direction are provided in Table 4. Figure 9 illustrates the strain gauges attached around the stress-prone areas identified through the structural analysis. To facilitate the application of the loads in the test directions, a separate fixing device was fabricated and installed on the lower articulation. The structural tests were then conducted three times in each direction using this fixing device, as shown in Figure 10.

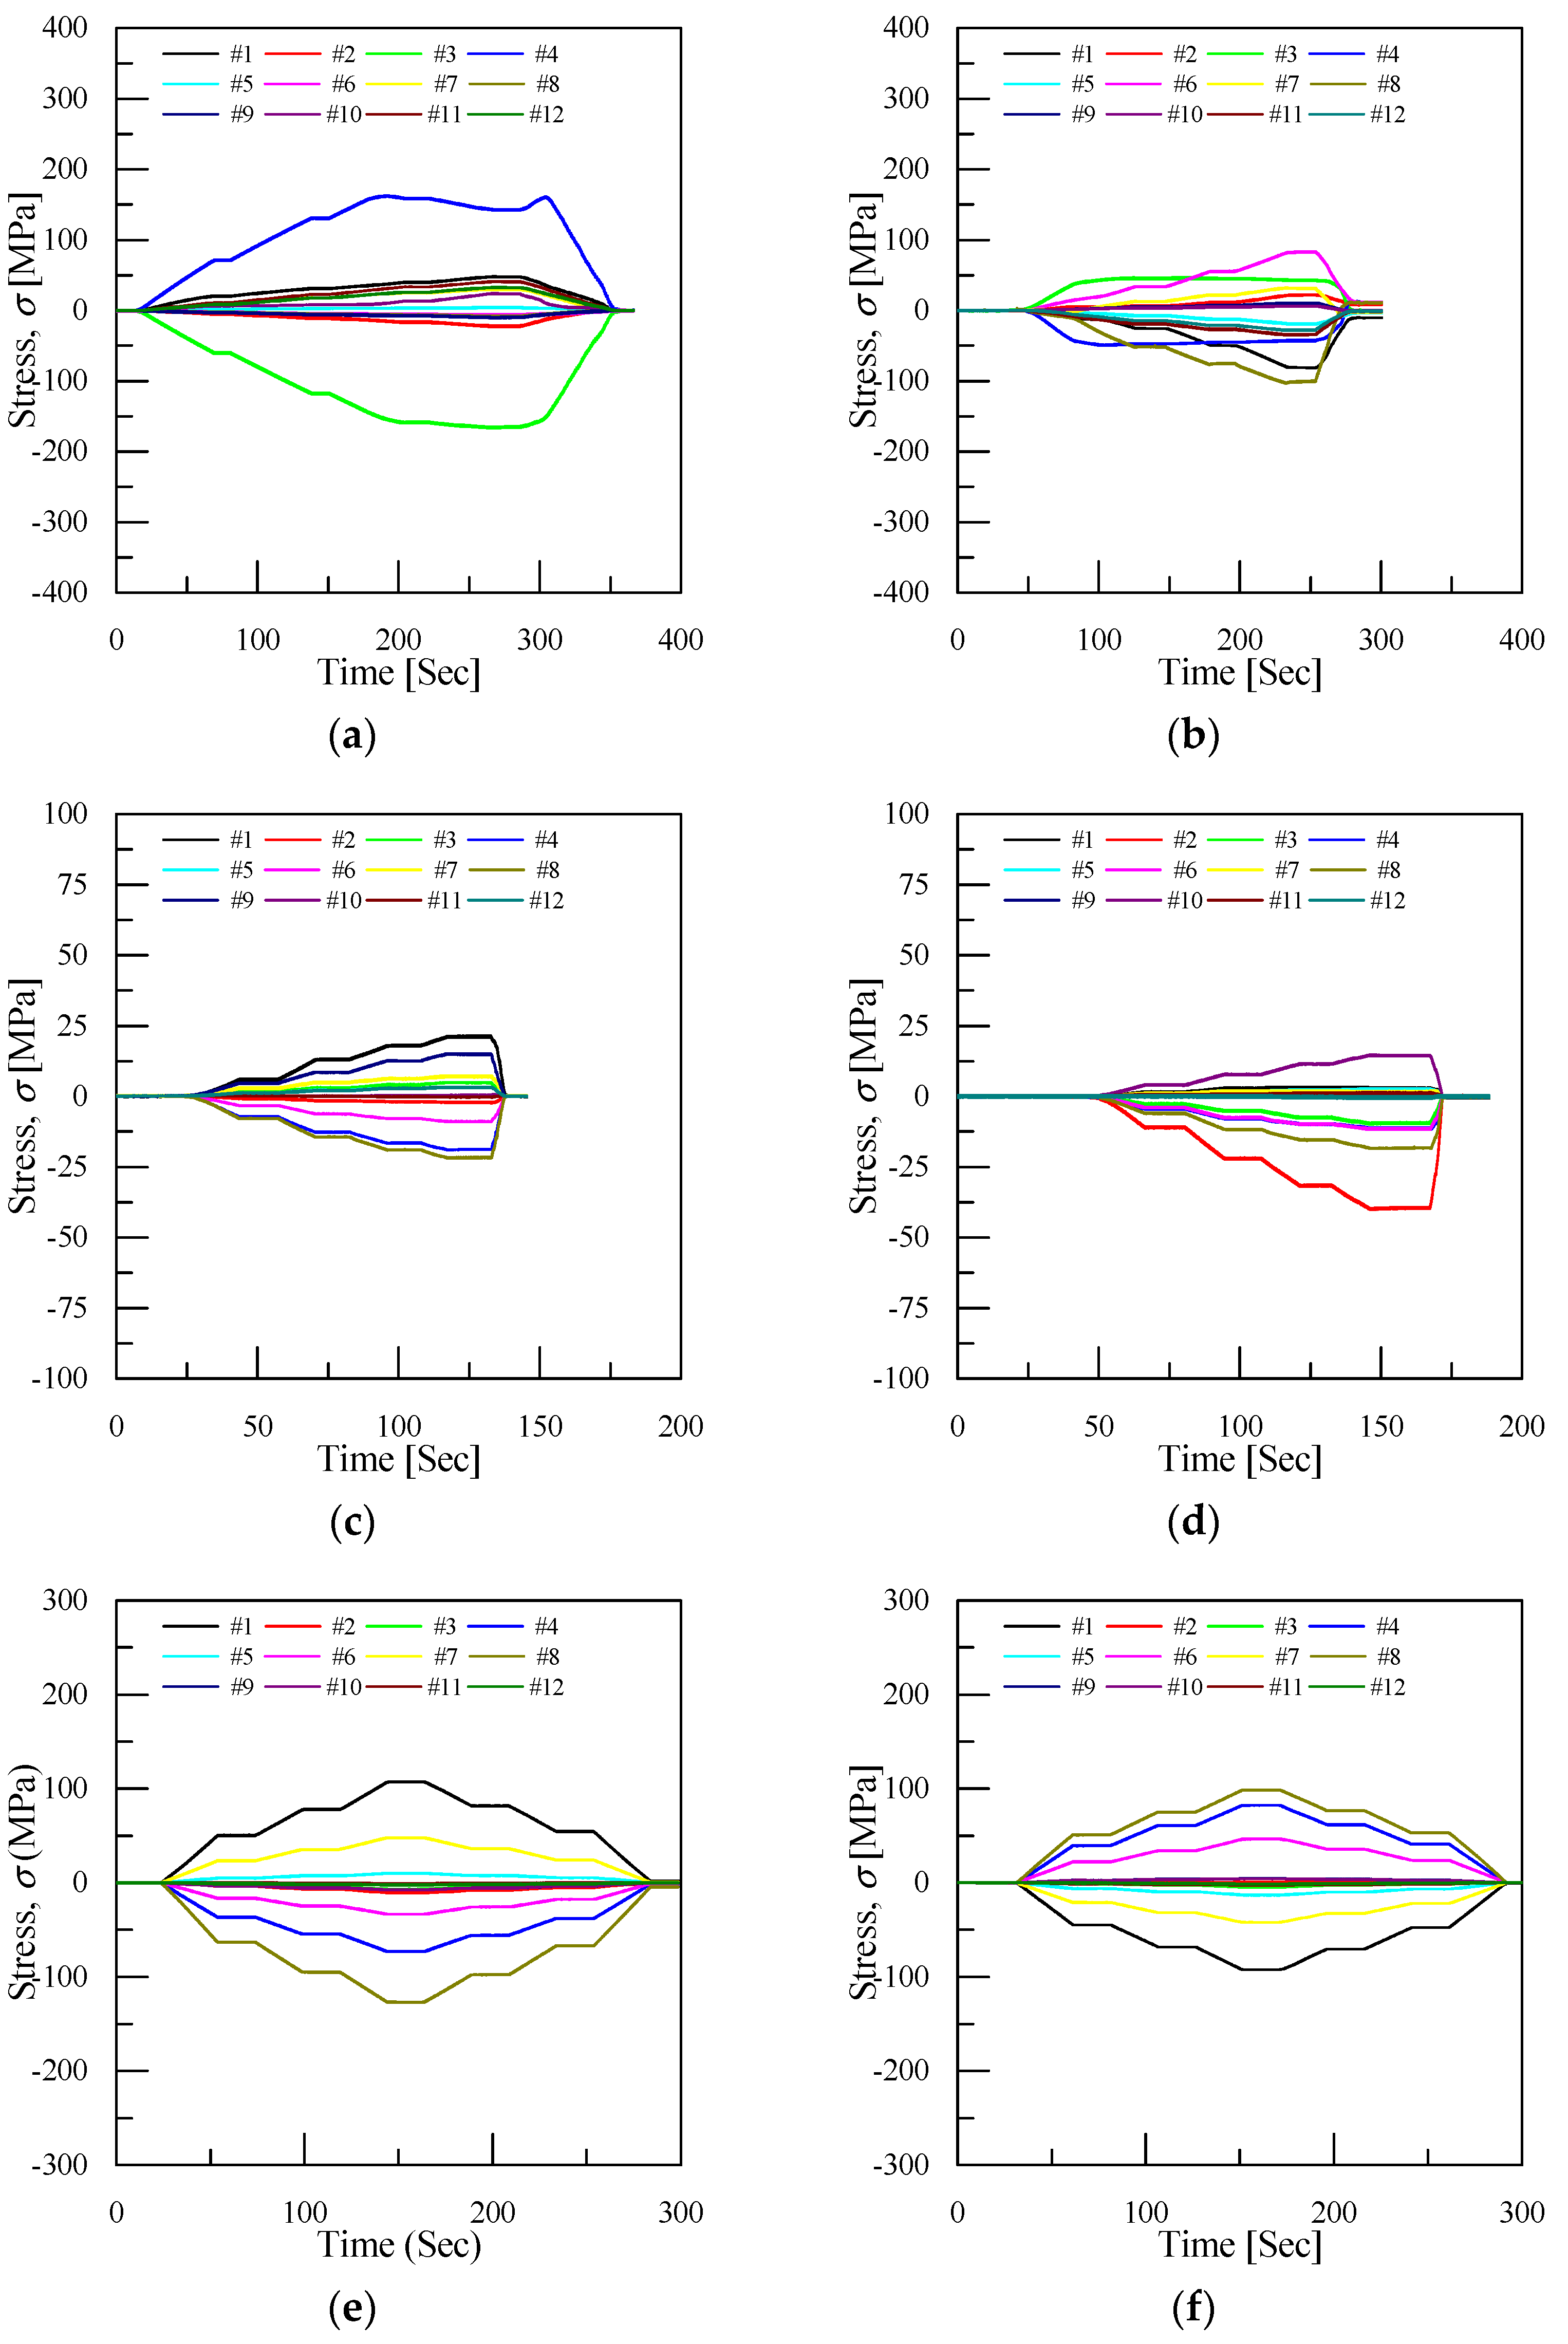
3.1.2. Structural Test Results

To validate the structural analysis, load resistance, and local strain of the lower articulation, structural tests were conducted. The tests were performed using a displacement control in each direction to obtain the strain measurements, which were then used to assess the structural safety of the lower articulation. Figure 11 illustrates the load-time behavior during the structural tests for each direction. As shown, the tests were conducted three times at 50%, 75%, and 100% of the load, with each load maintained for 10 s. The required loads in each direction were achieved, confirming the safety of the lower articulation. To evaluate the validity of the optimization analysis, the measured strains were converted into stress. Figure 12 presents the stress contours for different attachment locations. The stress results indicated varying locations of maximum stress for each direction. For a thorough evaluation of the optimization analysis, structural analysis results were compared with the experimental results, as shown in Table 5. The comparison demonstrates a significant similarity, with an average error within 10%. This indicates that the optimization analysis conducted in this study is valid. Furthermore, the results confirm the structural safety of the lower articulation.

3.2. Fatigue Test

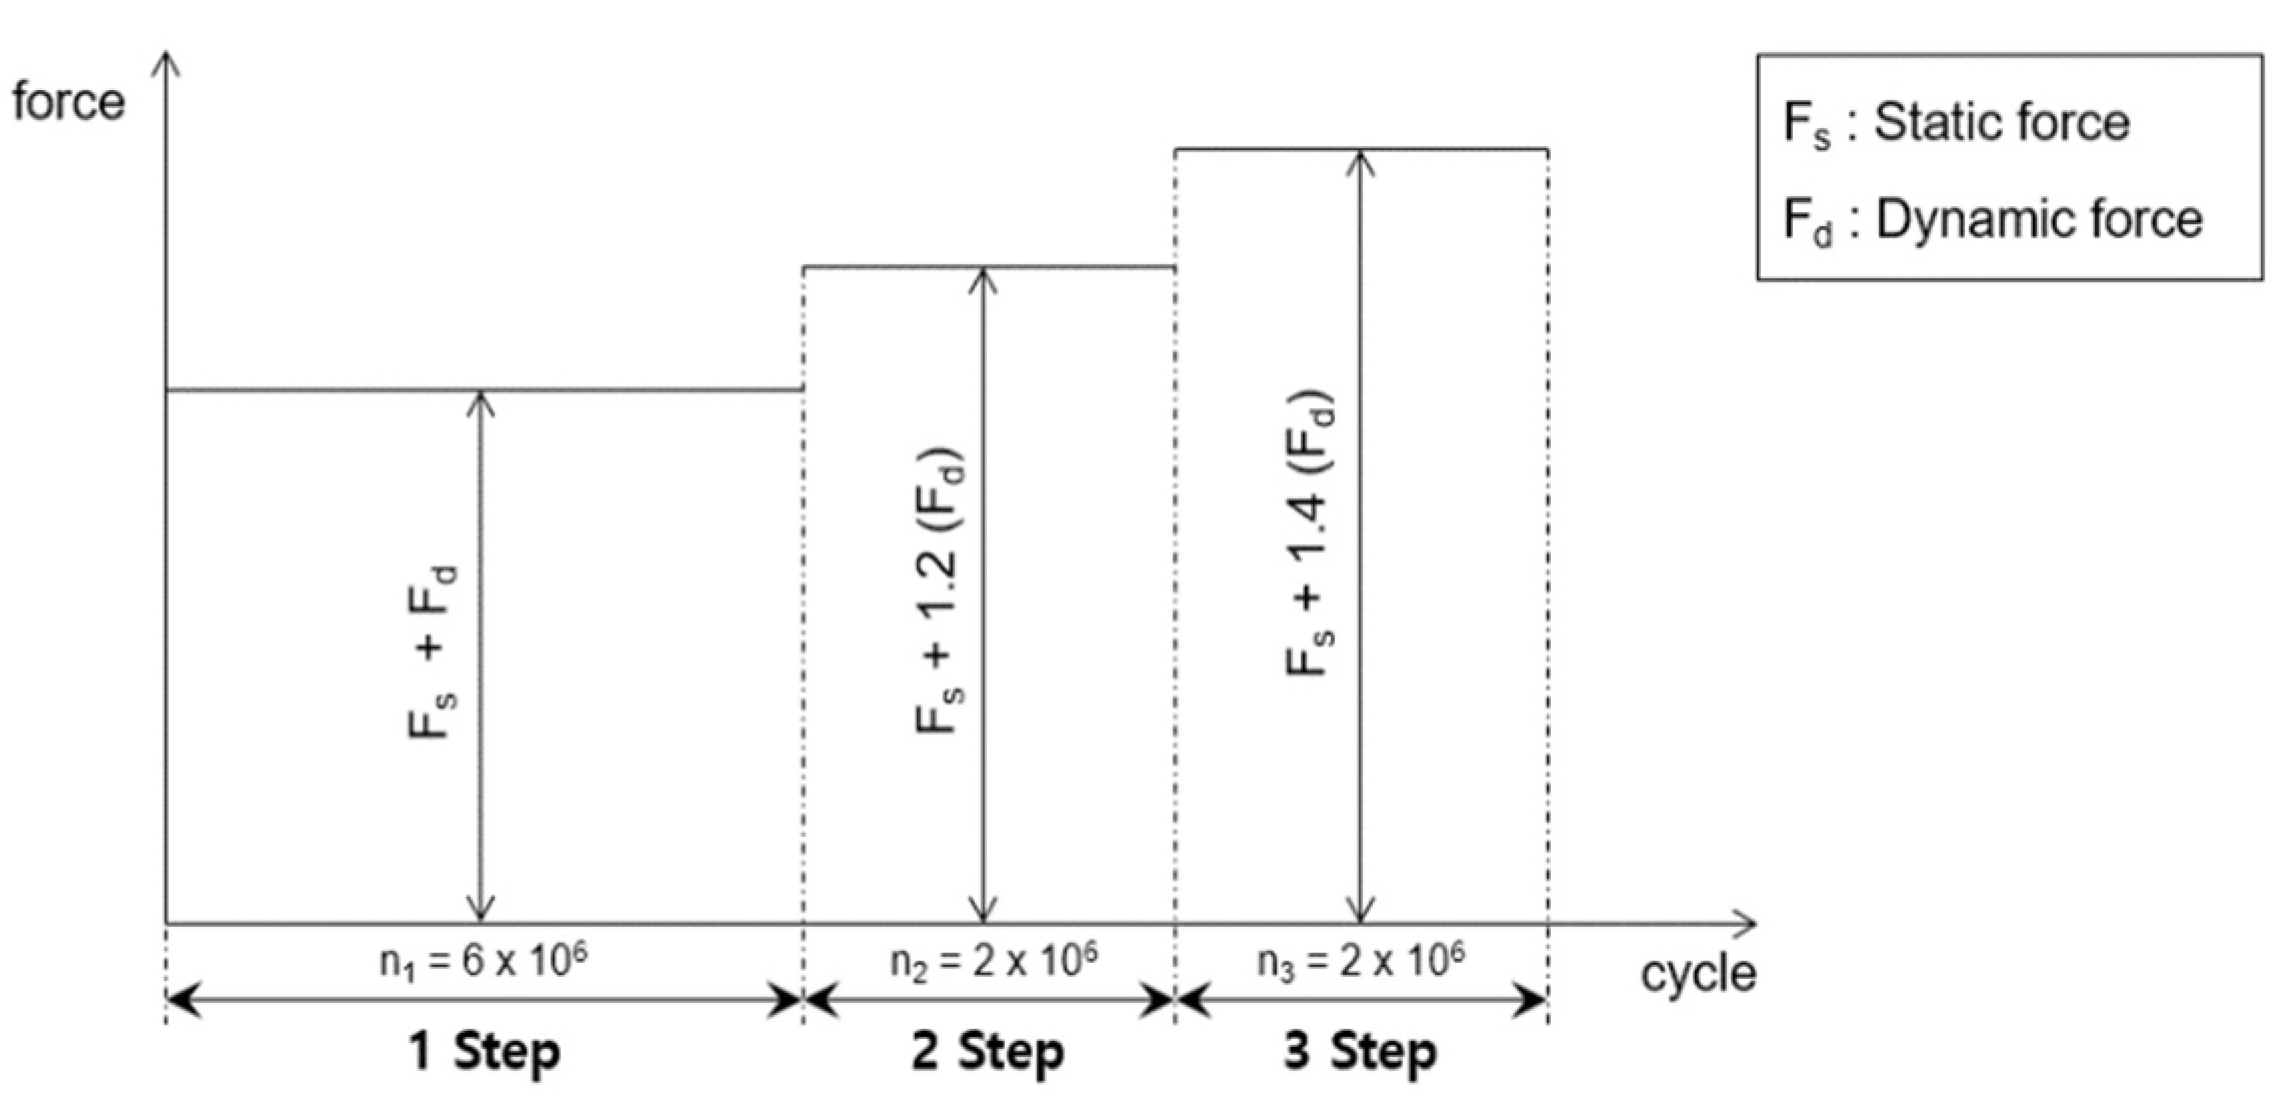
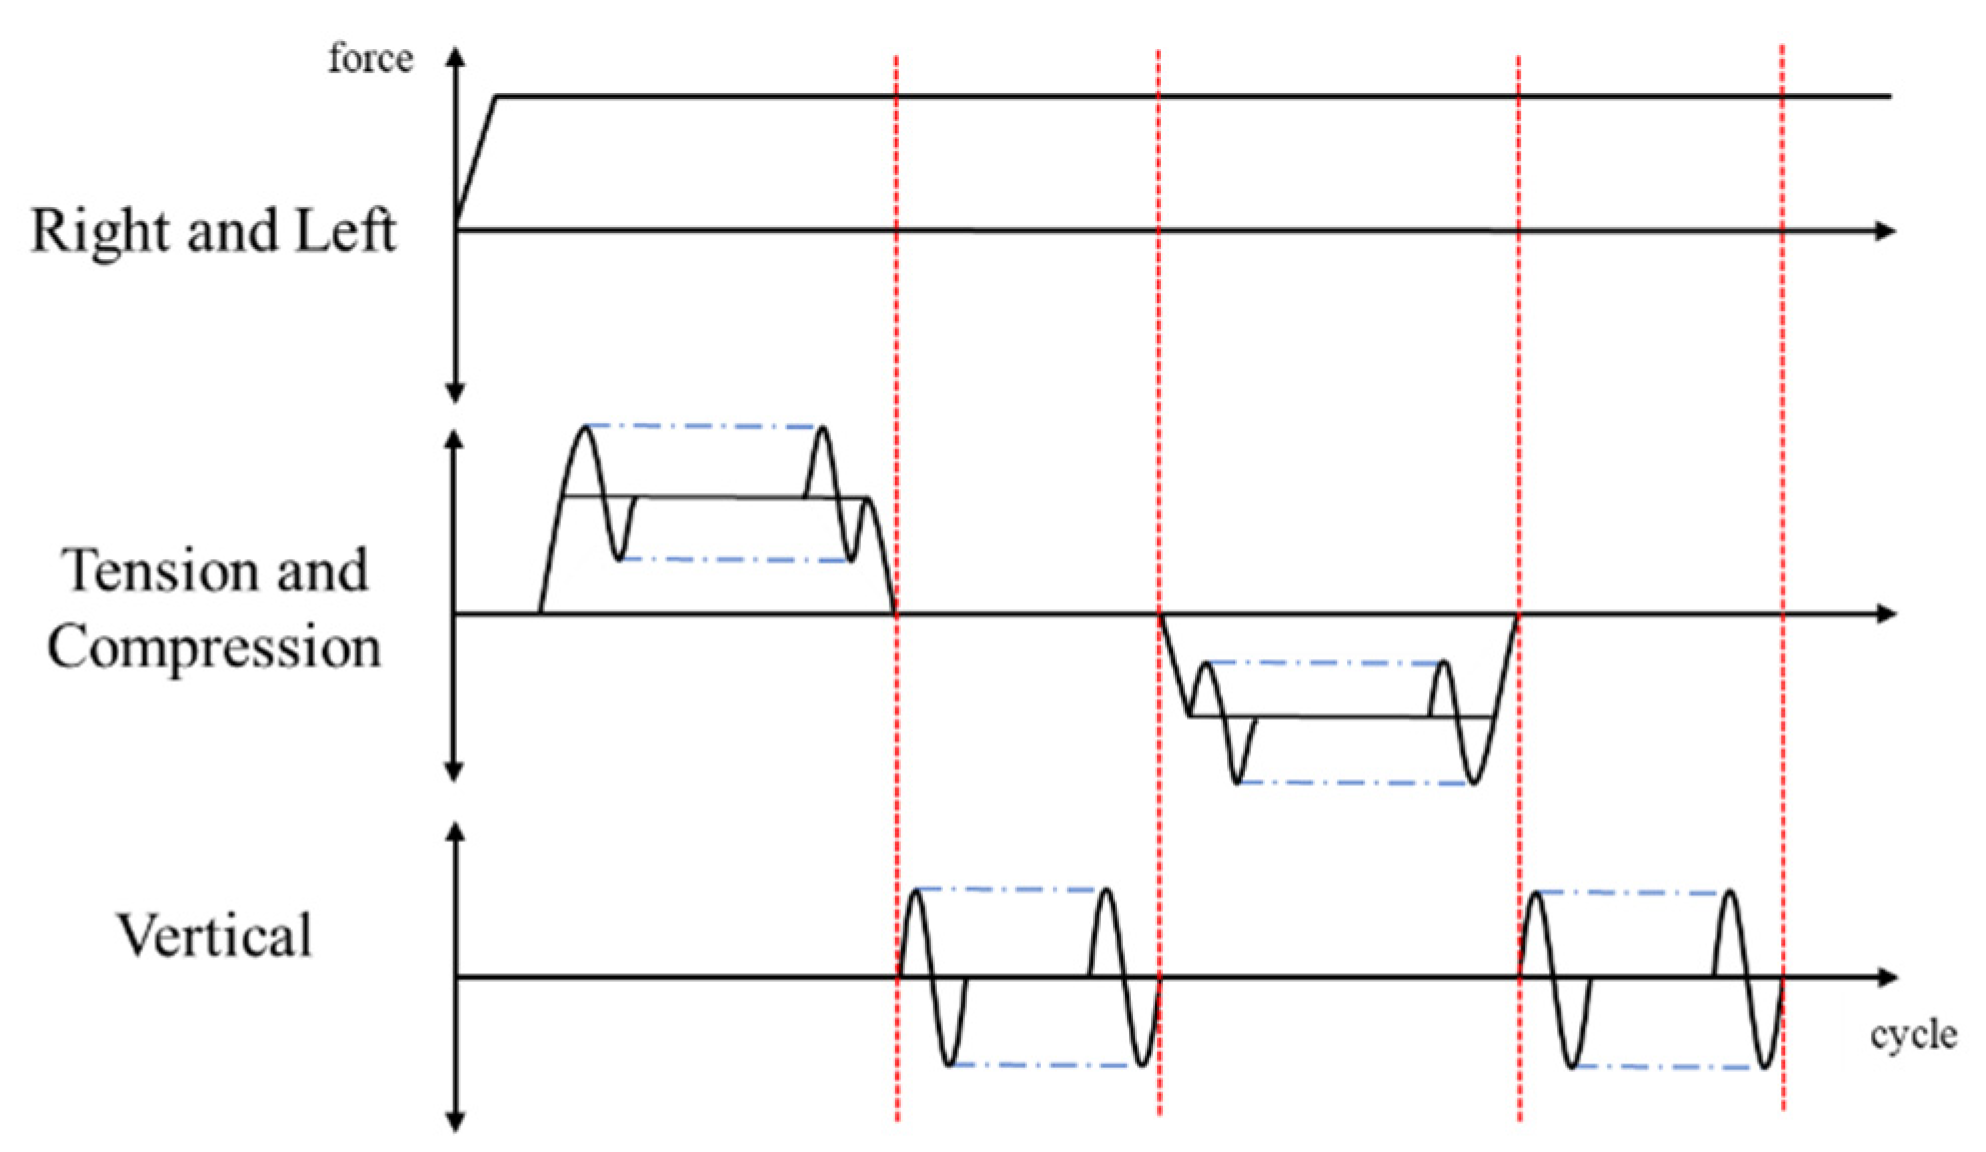
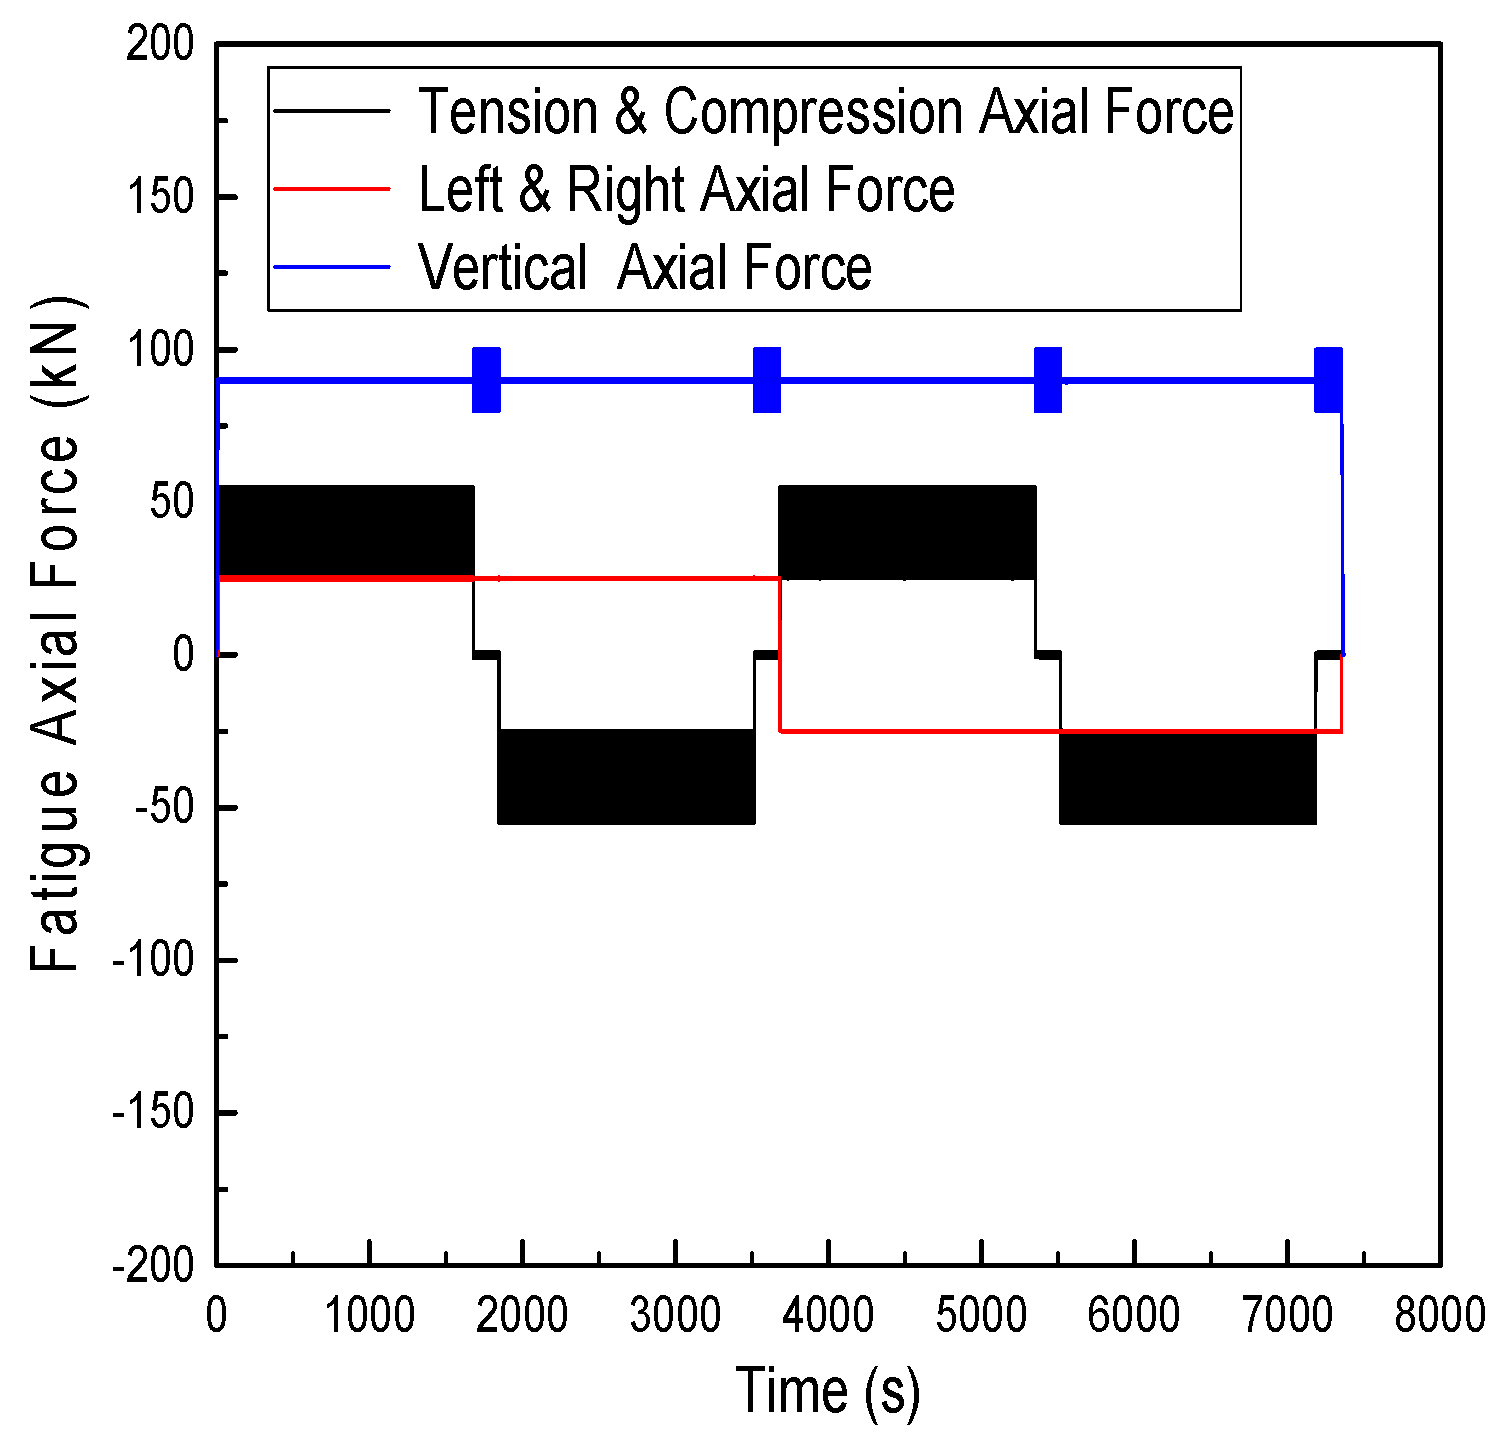
3.2.1. Fatigue Test Method

To evaluate the fatigue performance of the lower articulation, fatigue test conditions were established based on the vehicle manufacturer specifications, advanced cases, and standards EN 12663-1 and EN 13749 [21,22]. In addition, one unit of the lower articulation was produced and a fatigue test was conducted to verify its experimental validation. The fatigue testing procedure for the lower articulation was carried out according to the steps presented in Figure 13. The total number of fatigue test cycles was set to 1.0 × 10⁷, and the test was conducted in three steps. In Step 1, a total of 6.0 × 10⁶ cycles of repetitive loading were applied, followed by a liquid penetrant inspection to check for crack formation. If no cracks were detected in Step 1, the test continued with the same static load while increasing the dynamic load to 120% for Step 2, which was performed for 2.0 × 10⁶ cycles. After completing Step 2, the dynamic load was increased to 140% for Stage 3, which was conducted for 2.0 × 10⁶ cycles. After the tests, a final visual inspection was performed to check for crack formation.
The method for applying fatigue loads in each direction on the lower articulation is shown in Figure 14. As illustrated, initially, a static tensile load was applied continuously in the left direction, followed by 5000 cycles of repetitive loading under this static load. Next, after releasing the static tensile load, a dynamic vertical load was applied for 500 cycles. Once the dynamic vertical load application was completed, a static compressive load was applied, and 5000 cycles of dynamic compressive loading were performed. Finally, the static compressive load was released, and the vertical dynamic load was reapplied for 500 cycles.
Table 6 lists the equipment, standard loads, and speed conditions used for the fatigue testing of the lower articulation in each direction. The testing equipment for the lower articulation fatigue tests includes actuators for applying loads, load cells for measuring loads, strain gauges for measuring stress, and data acquisition systems (DAQs) for data collection and analyses. Figure 15 shows the fatigue testing setup for the lower articulation. Through these fatigue tests, the fatigue performance of the lower articulation was evaluated, and the safety was verified by checking for crack formation in each test step.

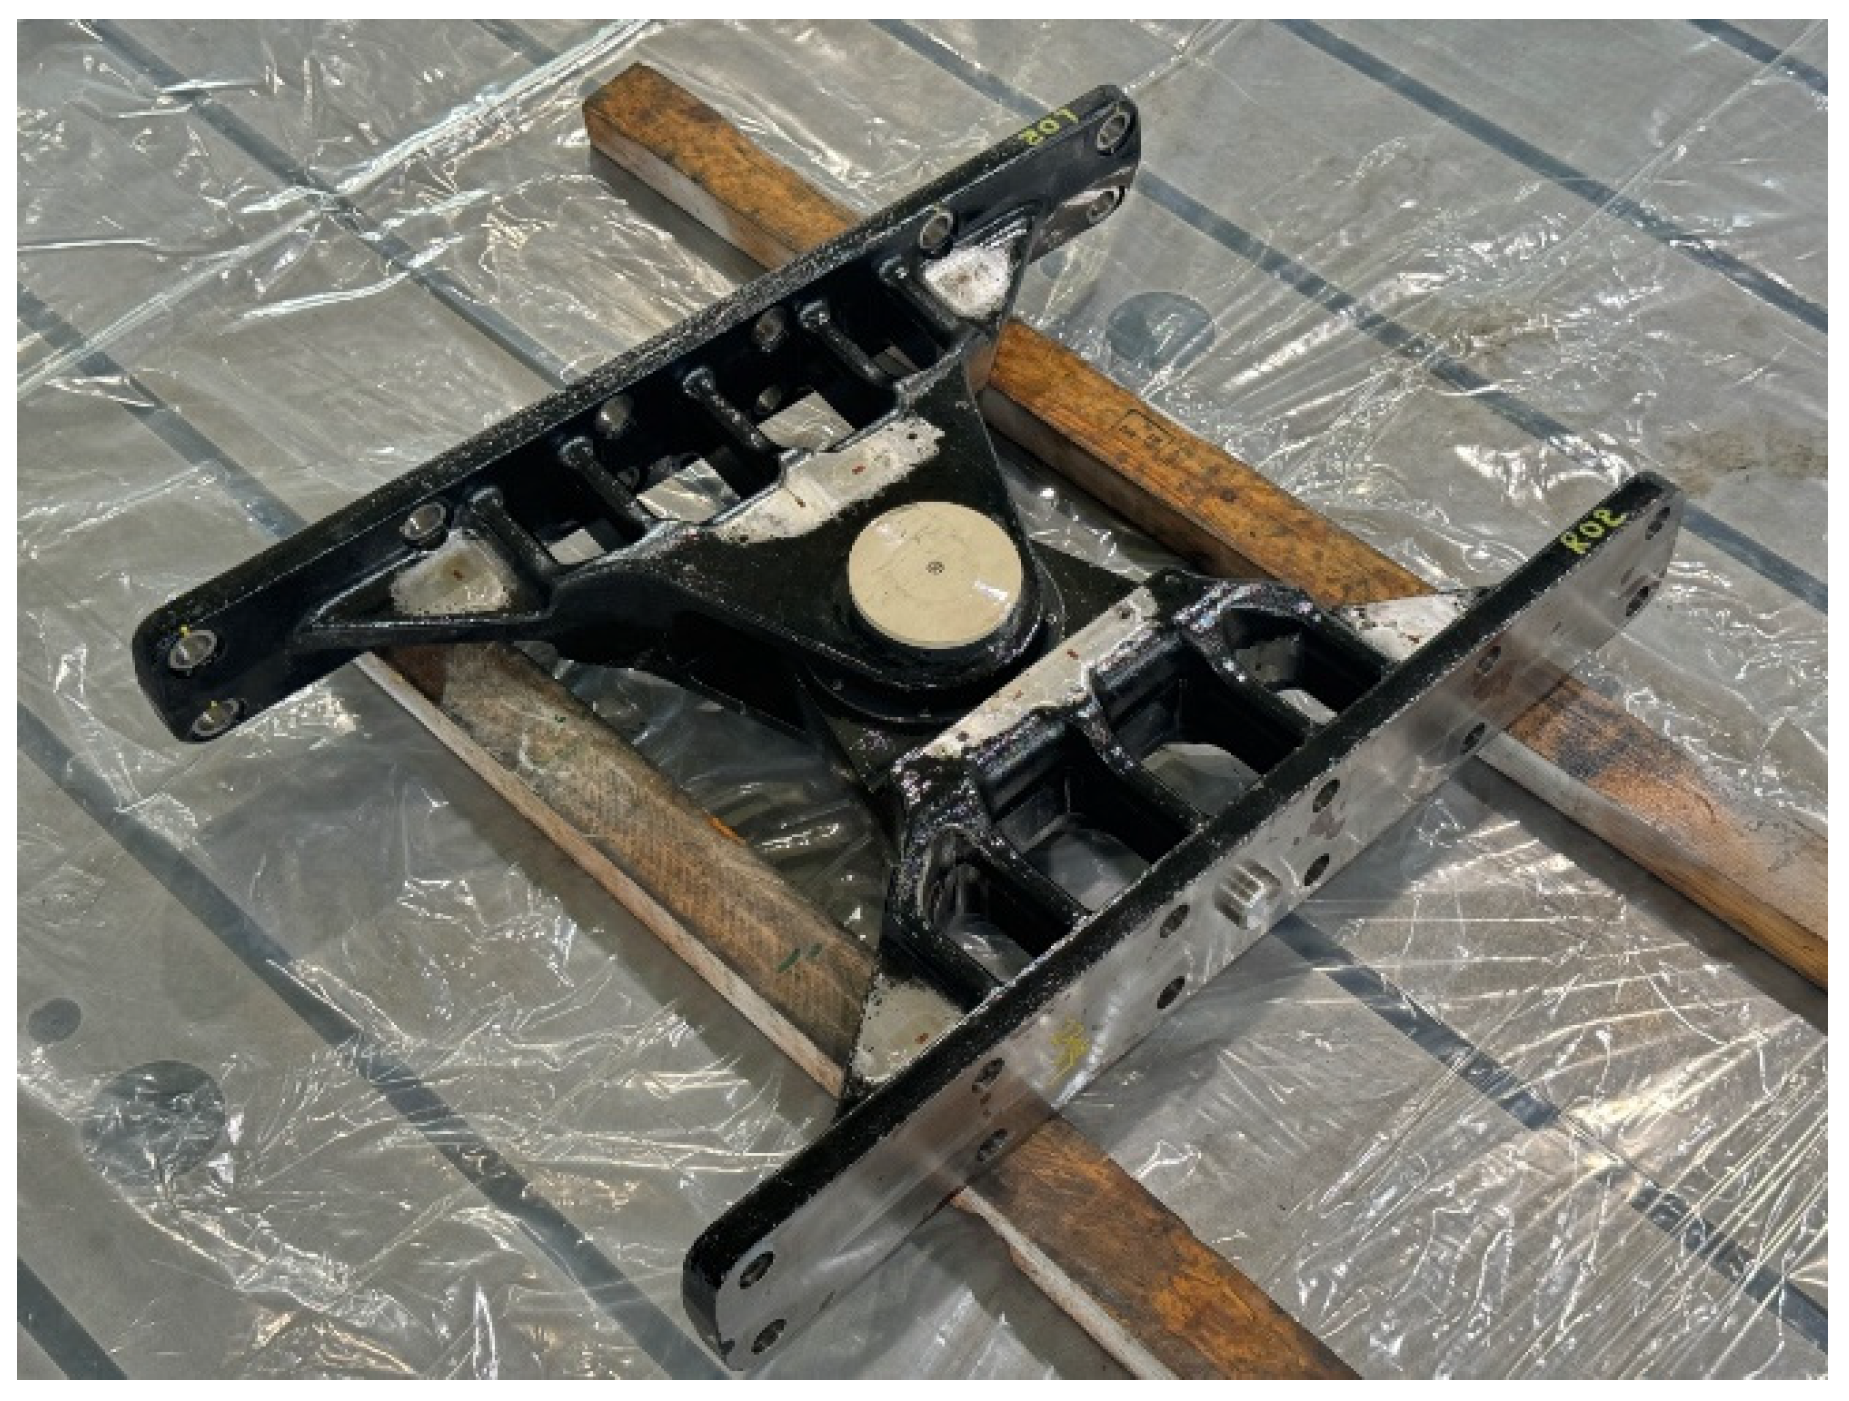
3.2.2. Fatigue Test Results

Fatigue tests for the lower articulation of the low-floor tram were conducted in accordance with the established fatigue testing procedures. Before initiating the fatigue tests, a visual inspection confirmed that there were no cracks in the initial state of the low articulation. The fatigue testing then proceeded as planned. Figure 16 shows the final fatigue load history, which was determined by combining the static and dynamic loads as outlined in Figure 13 and Figure 14. This combined load was applied during the fatigue testing.
After completing the first stage of fatigue testing (6 × 10⁶ cycles) with the applied loads, a liquid penetrant inspection was conducted to check for crack formation. Following the completion of the total fatigue test of 10 × 106 cycles, another liquid penetrant inspection was performed. Figure 17 depicts the lower articulation after the 10 × 106 cycle liquid penetrant inspection, showing no cracks, consistent with the initial findings.
The fatigue tests confirmed that the lower articulation under development exhibits adequate structural safety. These results suggest that further research and a validation of various tram components could enhance both the technical completeness and economic efficiency of low-floor trams. Additionally, these findings may positively influence the establishment of a domestic independent production of lower articulation.

4. Conclusions

In this study, an optimization was conducted on the lower articulation, a critical component of the low-floor tram, and experimentally validated through structural testing. The key findings from this research are as follows:
  • Eight factors affecting the structural safety of the lower articulation were identified, and their correlations with stress and weight were established.
  • The ISCD-II technique was employed to minimize the number of analyses to 16. Sensitivity analyses were used to identify the primary design factors significantly influencing stress and weight.
  • The structural safety of the optimized lower articulation was evaluated through both a structural analysis and experimental validation.
  • A comparison between the structural analysis and test results revealed an average error within 10% for each load direction, thereby validating the accuracy of the analysis.
  • Non-destructive testing conducted after completing the fatigue tests confirmed the absence of fatigue cracks, indicating that adequate durability was achieved.
  • The performance and durability of the lower articulation can be tested and verified through real vehicle tests by installing it on a low-floor tram.

Author Contributions

Data curation, J.L., J.-W.J. and J.C.; software, W.-J.H.; writing—review and editing, J.-W.J. and H.J. All authors have read and agreed to the published version of the manuscript.

Funding

This R&D is supported by the Korea Agency for Infrastructure Technology Advancement (KAIA) grant funded by the Ministry of Land, Infrastructure and Transport (Grant RS-2021-KA163484).

Institutional Review Board Statement

Not applicable.

Informed Consent Statement

Not applicable.

Data Availability Statement

The data presented in this study are available on request from the corresponding author. The data are not publicly available due to privacy of this research.

Conflicts of Interest

Author Won-Ju Hwang was employed by the company RND Department, THEJST. The remaining authors declare that the research was conducted in the absence of any commercial or financial relationships that could be construed as a potential conflict of interest.

References

  1. Uhl, T.; Chudzikiewicz, A. Analytical and experimental investigation of low floor tram dynamics. Veh. Syst. Dyn. 2002, 37, 702–713. [Google Scholar] [CrossRef]
  2. Lee, S.B.; Ahn, S.; Lee, J.H.; Jang, I.G. Optimization of the wireless power transfer system in an electric railway. In Proceedings of the 2014 IEEE Wireless Power Transfer Conference, Jeju Island, Republic of Korea, 8–9 May 2014; pp. 158–161. [Google Scholar]
  3. Shimauchi, T. Luxembourg tram system Catenary-free hybrid technology to reduce visual damage to the historical cityscape. Stud. Sci. Technol. 2020, 9, 141–148. [Google Scholar]
  4. Chudzikiewicz, A.; Korzeb, J. Simulation study of wheels wear in low-floor tram with independently rotating wheels. Arch. Appl. Mech. 2018, 88, 175–192. [Google Scholar] [CrossRef]
  5. Wang, L.; Zhao, Q.; Duan, H.; Liu, C. Energy Storage System Design for Catenary Free Modern Trams. In Proceedings of the 4th International Conference on Electrical and Information Technologies for Rail Transportation (EITRT) 2019: Novel Traction Drive Technologies of Rail Transportation, Qingdao, China, 25–27 October 2019; Springer: Singapore, 2020; pp. 613–621. [Google Scholar]
  6. Li, J.; Zhu, X.; Robineau, C. Non-linear stiffness analyzing of a hydraulic assisted turning system in low-floor trams. In Proceedings of the 2015 International Conference on Fluid Power and Mechatronics (FPM), Harbin, China, 5–7 August 2015; IEEE: New York, NY, USA, 2015; pp. 529–535. [Google Scholar]
  7. Jeong, N.T.; Choi, S.U.; Lee, H.Y.; Baek, K.H.; Han, S.Y.; Kim, W.K.; Suh, M.W. A study on the optimum design of high-speed low-floor bogie with independently rotating wheels. J. Mech. Sci. Technol. 2017, 31, 2105–2115. [Google Scholar] [CrossRef]
  8. Chudzikiewicz, A.; Maciejewski, I.; Krzyżyński, T.; Krzyszkowski, A.; Stelmach, A. Electric Drive Solution for Low-Floor City Transport Trams. Energies 2022, 15, 4640. [Google Scholar] [CrossRef]
  9. Kalina, T.; Heller, P.; Chval, Z.; Sedláček, F.; Křížek, M.; Bartoň, L. Numerical simulation and experimental testing of two-axle chassis of low-floor trams. Manuf. Technol. 2018, 18, 248–254. [Google Scholar] [CrossRef]
  10. Lee, J.I.; Jang, S.C.; Eom, K.; Lee, J.Y.; Kim, K.J. The Application of Articulation Systems based on the Number of Carbody Modules of the Low-Floor Tram. In Proceedings of the KSR Conference; The Korean Society for Railway: Busan, Republic of Korea, 2011; pp. 842–848. [Google Scholar]
  11. Megna, G.; Bracciali, A. Technical comparison of commercially available trams and review of standardization frame and design principles. Urban Rail Transit 2022, 8, 16–31. [Google Scholar] [CrossRef]
  12. Ding, W.S.; Song, X.L. Analysis of the anti-kink hydraulic system and running mode of low-floor trams. J. Eng. 2020, 14, 966–969. [Google Scholar] [CrossRef]
  13. Konowrocki, R.; Kalinowski, D.; Szolc, T.; Marczewski, A. Identification of safety hazards and operating conditions of the low-floor tram with independently rotating wheels with various drive control algorithms. Eksploat. Niezawodn. 2021, 23, 21–33. [Google Scholar] [CrossRef]
  14. Zhang, Y.; Yang, X.; Xiang, K.; Zuo, A. Mechanism and performance of a passive auxiliary steering device for low-floor light rail vehicle. Veh. Syst. Dyn. 2024, 1–26. [Google Scholar] [CrossRef]
  15. Viqaruddin, M.; Reddy, D.R. Structural optimization of control arm for weight reduction and improved performance. Mater. Today Proc. 2017, 4, 9230–9236. [Google Scholar] [CrossRef]
  16. Li, J.; Tan, J.; Dong, J. Lightweight Design of front suspension upright of electric formula car based on topology optimization method. World Electr. Veh. J. 2020, 11, 15. [Google Scholar] [CrossRef]
  17. Song, X.G.; Jung, J.H.; Son, H.J.; Park, J.H.; Lee, K.H.; Park, Y.C. Metamodel-based optimization of a control arm considering strength and durability performance. Comput. Math. Appl. 2010, 60, 976–980. [Google Scholar] [CrossRef]
  18. Penadés-Plà, V.; García-Segura, T.; Yepes, V. Accelerated optimization method for low-embodied energy concrete box girder bridge design. Eng. Struct. 2019, 179, 556–565. [Google Scholar]
  19. Ansys®. Ansys Workbench, Release 18.1; ANSYS Inc.: Canonsburg, PA, USA, 2017.
  20. EasyDesign, Design Optimization Inc.: Seoul, Republic of Korea, 2022.
  21. EN 12663-1:2010+A1:2014; Railway Applications–Structural Requirements of Railway Vehicle Bodies–Part 1: Locomotives and Passenger Rolling Stock (and Alternative Method for Freight Wagons). European Committee for Standardization: Brussels, Belgium, 2014.
  22. EN 13749:2011; Railway Applications-Wheelsets and Bogies-Method of Specifying the Structural Requirements of Bogie Frames. European Committee for Standardization: Brussels, Belgium, 2011.
Figure 1. Gangway system.
Applsci 14 09618 g001
Figure 2. Diagram of lower articulation.
Applsci 14 09618 g002
Figure 3. FEM model of lower articulation.
Applsci 14 09618 g003
Figure 4. Load and boundary conditions: (a) tensile case; (b) compression case.
Applsci 14 09618 g004
Figure 5. Stress contour of lower articulation: (a) tensile case; (b) compression case.
Applsci 14 09618 g005
Figure 6. Design variable of lower articulation.
Applsci 14 09618 g006
Figure 7. Results of structural analysis for optimum model: (a) tensile case; (b) compression case.
Applsci 14 09618 g007
Figure 8. Sensitivity analyses on the stress and weight: (a) sensitivity to stress; (b) sensitivity to weight.
Applsci 14 09618 g008
Figure 9. Location of strain gages.
Applsci 14 09618 g009
Figure 10. Structural test of lower articulation: (a) tension and compression; (b) right and left; (c) vertical.
Applsci 14 09618 g010
Figure 11. Input loads in structural tests: (a) tension and compression; (b) right and left; (c) vertical.
Applsci 14 09618 g011
Figure 12. Stress–time curve of structural test: (a) tension; (b) compression; (c) right; (d) left; (e) vertical up; (f) vertical down.
Applsci 14 09618 g012
Figure 13. Definition of fatigue test steps.
Applsci 14 09618 g013
Figure 14. Load histories of components imposed on lower articulation.
Applsci 14 09618 g014
Figure 15. Fatigue test of lower articulation.
Applsci 14 09618 g015
Figure 16. Input load in fatigue test.
Applsci 14 09618 g016
Figure 17. Photograph of liquid penetrant test.
Applsci 14 09618 g017
Table 1. Material properties.
Young’s Modulus
[GPa]
Poisson’s RatioDensity
[kg/m3]
SCM4402050.297850
STB22100.307850
SM45C2050.297850
Table 2. Design variable.
Design VariableMinMax
x1 (Middle Frame)515
x2 (Frame Hold Width)7090
x3 (Frame Edge Width)2545
x4 (Frame Neck Length)5464
x5 (Frame Width)120140
x6 (Core Upper Length)25.531.5
x7 (Core Lower Length)33.539.5
x8 (Core Radius)5866
Table 3. ISCD-II of design matrix.
Casex1x2x3x4x5x6x7x8Stress [MPa]Mass
[kg]
115.070.045.054.014025.539.558.01046.6162.5
25.090.045.064.012025.539.558.0886.1144.4
315.090.025.064.014031.533.558.01300.0136.2
45.070.045.064.014031.539.566.01321.7156.2
55.090.025.054.012031.539.566.01393.4129.2
65.070.025.064.014025.533.566.0702.7134.2
715.070.025.064.012031.539.558.01302.1128.9
815.070.045.054.012031.533.566.0904.9151.0
915.090.045.064.012025.533.558.0795.0147.8
105.090.045.054.014031.533.558.0673.5159.8
1115.090.025.054.014025.539.566.0533.2139.6
125.070.025.054.012025.533.558.0666.1130.5
1310.080.035.059.013028.536.562.0529.7143.7
SAO #113.989.625108.7134.526.351.566649.5134.4
SAO #25.170.425.3107.312025.546.559.5650.1128.7
SAO #35.170.425.4107.212025.546.559.5648.5128.7
Table 4. Structural test conditions.
Direction of Structural TestingTest EquipmentLoad ConditionsTesting Speed
Tension and CompressionMTS Tension and Compression Tester1000 kN2 mm/min
Right and LeftMTS Hydraulic
Actuator
100 kN2 mm/min
VerticalMTS Hydraulic
Actuator
100 kN5 mm/min
Table 5. Comparisons of structural analysis and test.
Type123456789101112
TensionAnalysis (MPa)−59.50 15.29 39.94 −52.12 −15.54 69.56 38.02 −124.78 8.84 4.44 −32.57 −24.42
Experimental (MPa)−66.74 15.65 45.74 −59.89 −16.52 71.10 38.83 −127.71 9.94 5.72 −34.74 −27.85
Error (%)10.92.312.713.06.02.22.12.311.122.46.312.3
CompressionAnalysis (MPa)47.22 −21.61 −160.24 153.32 3.76 −6.01 28.39 21.79 −7.88 −10.11 38.70 28.64
Experimental (MPa)48.21 −22.91 −164.18 159.65 4.37 −7.18 29.11 23.84 −8.10 −10.59 40.37 32.69
Error (%)2.15.72.44.013.916.42.58.62.74.54.112.4
RightAnalysis (MPa)19.55 −2.12 4.89 −17.35 3.19 −8.88 7.25 −20.86 14.11 0.59 −0.38 3.01
Experimental (MPa)21.42 −2.43 5.01 −19.00 3.35 −9.01 7.33 −21.93 15.15 0.62 −0.43 3.40
Error (%)6.86.66.93.34.715.26.711.17.08.911.79.4
LeftAnalysis (MPa)3.04 −37.49 −9.22 −11.36 2.65 −9.97 1.97 −16.52 −0.60 13.41 1.25 0.36
Experimental (MPa)3.26 −40.15 −9.90 −11.75 2.78 −11.76 2.11 −18.58 −0.65 14.72 1.42 0.40
Error (%)8.712.72.58.74.91.41.14.96.95.310.411.7
Vertical UpAnalysis (MPa)−91.13 0.91 −4.45 81.26 −12.51 32.50 −41.98 96.08 4.36 4.36 −2.11 −1.38
Experimental (MPa)−92.68 1.10 −4.80 82.67 −13.23 46.60 −42.27 98.83 4.65 4.41 −2.94 −1.65
Error (%)1.717.47.21.75.530.30.72.86.11.228.316.1
Vertical DownAnalysis (MPa)102.96 −10.22 −6.95 −70.43 9.34 −32.50 46.31 −123.16 −7.41 −7.72 −1.13 −2.25
Experimental (MPa)107.47 −11.06 −7.10 −73.31 10.21 −33.59 48.09 −127.02 −7.73 −7.82 −1.47 −2.79
Error (%)4.27.52.13.98.53.33.73.04.21.323.119.5
Table 6. Fatigue test conditions.
Direction of Fatigue TestingTest EquipmentFatigue Load ConditionsTesting Speed
Tension and CompressionMTS Hydraulic
Actuator
±40 ± 15 kN3 mm/min
Right and LeftMTS Hydraulic
Actuator
±25 kN3 mm/min
VerticalMTS Hydraulic
Actuator
−90 ± 10 kN3 mm/min
Disclaimer/Publisher’s Note: The statements, opinions and data contained in all publications are solely those of the individual author(s) and contributor(s) and not of MDPI and/or the editor(s). MDPI and/or the editor(s) disclaim responsibility for any injury to people or property resulting from any ideas, methods, instructions or products referred to in the content.

