Article

Analysis of Nutritional Composition of the Pearl Oyster Pinctada radiata as a New Mediterranean “Bioresource” for Human Consumption

1
Department of Fisheries & Aquaculture, University of Patras, 30200 Messolonghi, Greece
2
Department of Agriculture, University of Patras, 30200 Messolonghi, Greece
3
Department of Biology, University of Patras, 26504 Rio Patra, Greece
4
MicroPhykos, Aquaculture Systems & Services, Agiou Antoniou 24b, Halandri, 15238 Athens, Greece
*
Author to whom correspondence should be addressed.
Appl. Sci. 2024, 14(21), 9757; https://doi.org/10.3390/app14219757
Submission received: 9 September 2024 / Revised: 5 October 2024 / Accepted: 15 October 2024 / Published: 25 October 2024
(This article belongs to the Special Issue New Insights into Food Analysis Methods)

Abstract

:
Protein intake inadequacy has been considered to be one of the major nutritional problems worldwide for many years and it appears that this issue will continue to increase sharply in the coming decades. This deficiency can be partly overcome by the effective use of protein-rich bioresources such as mollusks. In the present study, the oyster Pinctada radiata, collected from the Aegean Sea, is fully nutritionally characterized as a new non-indigenous bioresource concerning mainly its protein, carbohydrate and fat composition during the different seasons of the year. The results showed that the protein content of the pearl oyster is at satisfactory levels, with its maximum value in winter and minimum in summer. On the contrary, its fat and carbohydrates are at low levels, with their maximum values in the summer period. Regarding the profile of fatty acids, polyunsaturated fats are in the highest proportion, which is very encouraging, as a diet rich in this kind of fat is desired. The entire nutritional profile of the studied oyster demonstrates its high nutritional value and supports its possible use as a “new” seafood source for human consumption in the Mediterranean.

1. Introduction

During the last few years, the worldwide interest in the benefits of shellfish consumption for health has increased. Mollusks are the largest marine invertebrates and represent 12% of the world’s total production. These include species such as gastropods, mussels and oysters, which are popular foods rich in proteins and can be used by all cultures as an important part of their diet [1]. Several studies support the idea that a diet incorporating seafood prevents chronic diseases such as heart disease, some forms of cancer, hypertension, etc. [2]. Edible bivalves are a source of high-quality proteins, vitamins, essential amino acids, and minerals, and are low in fat, containing beneficial polyunsaturated fatty acids (PUFAs), which have significant benefits for human health [3,4]. Many studies on fat analysis in marine organisms have shown that fish and shellfish are important sources of n-3 polyunsaturated fatty acids (PUFAs) such as eicosapentaenoic acid (EPA) and docosahexaenoic acid (DHA), which are not otherwise provided by oils from solid food [5]. This fact is also indicative of the special biological functions of these organisms. However, most studies focus on fish and protozoa such as phytoplankton and zooplankton and not on the various species of mollusks (oysters, scallops, etc.) [6]. The aim of the present study is to add scientific information to this field concerning the invasion of a non-indigenous species (NIS) that is also a well-adapted new “bio-resource” in the Mediterranean: the pearl oyster Pinctada radiata, collected from the Aegean Sea.
Greece has a series of shallow and sheltered bays that allow for aquaculture activities. The Evoikos Gulf is one of the most important fishing locations in the country because of its special characteristics due to the strong tidal current occurring in alternating directions and the natural nutrients and metal enrichment of the water through geological processes [7]. Moreover, the geographical position of Evia, in proximity to central Greece and Athens, gives this location a strategic advantage compared to other more remote bays or islands of the Aegean and Ionian concerning the accessibility to major markets, leading to the attraction of many fish farms in this area [8]. The Saronic Gulf, including its industrial zone gulf of Elefsina and the port of Piraeus, is one of the most developed and industrialized areas of the Eastern Mediterranean. The port of Piraeus is one of the largest ports in the Mediterranean Sea, the main container port in the Eastern Mediterranean basin and one of the top ten container ports in Europe [9]. Moreover, in this location of the Aegean Sea, the first appearance of the pearl oyster P. radiata was reported in the literature [10].
The oyster P. radiata is a benthic species that lives in sandy bottoms and coral reefs (Leach, 1814). It comes from the Indo-Pacific Ocean and the Red Sea and has been recorded in the Mediterranean as a nonendemic species since the 19th century (1874), immediately after the opening of the Suez Canal [11]. In Greece, it seems that it was deliberately introduced for aquaculture in the mid-1950s [10] and since then, although of little commercial interest, it has been exploited as a domestic commercial stock of bivalves [12] with a significant presence in the Aegean Sea [1]. It has also been identified in Crete as one of the worst invasive species in terms of dispersal and impact on Greek waters [13], as it has strong invasive potential, adapts locally and spreads rapidly. A recent assessment of wild stocks in the Aegean showed the availability of resources in sufficient quantities for the possible fishery exploitation of oysters [14,15] and their utilization as seafood for human consumption. To strengthen this effort, promotion is required of the pearl oyster as an edible bivalve. The nacreous shells consist of 60% shell and 40% soft parts, which are usually discarded after the pearls are harvested. The utilization of the soft parts from the oyster harvesting industries in the field of nutrition would lead to increased profit as a result of the added value and lead to a reduction in pollution from the disposal of these parts [2]. Regarding the studied oysters, the characterization of the nutritional profile of its flesh supports the idea of the “new” product coming to the market [16].
In the present study, pearl oysters, P. radiata, were sampled seasonally for a full year, in two regions, the Evia and the Saronic Gulf, where this species occurs in competent populations. Then, they were nutritionally characterized concerning mainly the protein, carbohydrate and fat composition during the different seasons of the year.

2. Materials and Methods

2.1. Study Area and Sampling Positions

Pearl oyster samples were collected and stored from a high- (Saronikos Gulf, 37°59′11.3″ Ε/23°26′059.254″ Ν) and a low (Evoikos Gulf, 38°30′7.83″ E, 23°32′ N)-productivity region in the Western (W) Aegean Sea, during the period February 2019–July 2020, according to the procedure described in previous works [1,15]. Geographical areas and sampling sites from which mussels were collected are indicated in Figure 1.

2.2. Physicochemical Seawater Characterization

Seasonal physicochemical measurements such as pH and salinity were measured in situ with a portable HACH HQ40D instrument.
Water samples were analyzed for the total organic carbon (TOC) and total nitrogen (TN) using a Shimadzu TOC-VCSH TOC/TN analyzer coupled to a chemiluminescence detector (TNM-1 TN unit). This creates a simultaneous analysis system, where TOC analysis is performed using the combustion-infrared method, Standard Method (SM)5310B (Standard Methods for the Examination of Water and Wastewater, American Water Works Association) [17], while TN analysis is performed using the Pyrolysis–Chemiluminescence detection method (ASTM D5176-08) [18,19]. Ammonium, nitrite, nitrate and phosphate ions were measured using a HACH DR2800 absorption spectrophotometer and Hach Lange LCK cuvette tests (ammonium: LCK 304/0.015–2.0 mg/L NH4-N, nitrites: LCK 341/0.015–0.6 mg/L NO2-N, nitrates: LCK 339/0.23–13.50 mg/L NO3-N, phosphates: LCK 349/0.05–1.50 mg/L PO4-P). A Shimadzu UV 1800 spectrophotometer was used for the trichromatic determination (630 nm, 647 nm, 664 nm, 750 nm) of chlorophyll-a. The concentration of chlorophyll-a was calculated according to the equations of Jeffrey and Humphrey (1975) [20].

2.3. Biochemical Composition Analysis

The samples were analyzed for their protein (Kjeldahl), ash (gravimetric, 500 °C, 6 h), carbohydrate (calculated) and total fat (Soxlet) content and their caloric/nutritional value (calculated), while for the fatty acids, a more detailed analysis was performed through gas chromatography to fully identify the fatty acids in the samples. Lyophilized microalgae were analyzed for fatty acids according to the method of Laurens et al. [21]. For each treatment, three biological repeats were analyzed (n = 3). Briefly, in 15 mg lyophilized microalgae, 0.2 mL chloroform/methanol (2:1 v/v) solution (Merck KGaA, Darmstadt, Germany) and 0.3 mL HCl/methanol (5% v/v) (Merck KGaA, Darmstadt, Germany) solution were added simultaneously. The mixture was heated for 1 h at 85 °C in the presence of 250 μg tridecanoic acid methyl ester (Fluka Analytical, Sigma-Aldrich, St. Louis, MO, USA) as an internal standard. The resulting fatty acid methyl esters (FAMEs) were extracted with 1 mL hexane at room temperature for at least 1 h. The FAMEs were analyzed by GC-FID (Agilent 6890 N, Centerville Road, Wilmington, NC, USA) with an HP 88 column (60 m × 0.25 mm i.d. with 0.20 μm film thickness, Agilent Technologies, Santa Clara, CA, USA). The flame ionization detector temperature was set at 260 °C, and the chromatographic analysis involved a temperature-programmed run starting at 50 °C and held for 5 min. The temperature was initially increased at a rate of 5 °C/min to 150 °C followed by an increase at a rate of 1.5 °C/min to 210 °C, at which point, it was eventually maintained for 5 min. Hydrogen was used as the carrier gas with a linear velocity set at 30 cm/s. Each peak was identified and quantified using a 37-component FAME mix standard (Supelco, Sigma-Aldrich, St. Louis, MO, USA).
The identification and quantification of fatty acids also allowed for the calculation of important indicators of the nutritional quality of lipids. Specifically, the nutritional quality of the fatty acids was determined by the following values [22,23]:
  • AI: atherogenicity index (Ulbricht and Southgate 1991) [22]:
A I = C 12 : 0 + 4 × C 14 : 0 + C 16 : 0 Σ M U F A s + Σ P U F A s
2.
TI: thrombogenicity index (Ulbricht and Southgate 1991) [22]:
T I = C 14 : 0 + C 16 : 0 + C 18 : 0 0.5 × Σ M U F A s + 0.5 × Σ n 6 P U F A s + 3 × Σ n 3 P U F A s + ( n 3 n 6 )
3.
HH: hypocholesterolemic/hypercholesterolemic ratios [23]:
H H = C 18 : 1 c i s 9 + C 18 : 2 n 6 + C 20 : 4 n 6 + C 18 : 3 n 3 + C 20 : 5 n 3 + C 22 : 5 n 3 + C 22 : 6 n 3 C 14 : 0 + C 16 : 0
where ΣMUFAs is the quantity of all monounsaturated fatty acids and ΣPUFAs is the quantity of all polyunsaturated fatty acids.
Finally, statistical analysis of the results was carried out with the STATISTICA software (version 10, StatSoft®Inc., Palo Alto, CA, USA), specifically using one-way and two-way ANOVA combined with Tukey’s test (p < 0.05 corresponds to a statistically significant difference) to investigate the correlation of the values of the studied quantities with respect to the change in location, season and year and therefore to evaluate any statistically significant differences between samples.

3. Results and Discussion

3.1. Physicochemical Seawater Parameters of the Sampling Sites

The physicochemical environmental parameters of seawater from both sampling sites for the four seasons are presented in Table 1.
From Table 1, we can see that the pH and salinity do not show any notable differences for all seasons and both studied gulfs (Evoikos and Saronic). The levels of nutrients and organic matter and chlorophyll-a in the water showed a slight seasonal pattern, with the values of TOC, TN, nitrites, nitrates and chlorophyll-a being highest in summer. The main conclusion coming from the TOC and chlorophyll-a time series is that the Evoikos Gulf has a higher productivity than the Saronic Gulf. This favors the development of organisms that are dependent on the productivity of the area they live in, such as the oysters studied in this case [24]. Moreover, the best final yields for the oyster cultures in the bays with high concentrations of chlorophyll-a were directly correlated with better survival/performance rates [25].

3.2. Pearl Oyster Proximate Composition and Calorific Value

The biochemical analysis of the oyster samples in the Evoikos and Saronic Gulfs concerning the ash, crude protein, total fat (%) and carbohydrates (%) over the four different seasons is presented in Figure 2.
From the biochemical analysis of the samples (Figure 2), it can be observed that the proteins have the largest percentage for both locations and the four seasons, with the maximum values being found in the Evoikos Gulf in autumn (69.29% ± 1.43%) and in the Saronic Gulf in spring (65.72% ± 1.29%), indicating that this oyster is a very important source of proteins while it has a very low fat content. Moreover, the above findings agree with those of previous studies for P. margaritifera radiata, which have shown a superior protein content [26,27]. The results of the statistical analysis indicated that statistically significant differences were observed between the Evoikos Gulf in autumn and the Saronic Gulf in summer, Evoikos Gulf in winter and Evoikos Gulf in summer, while the most significant difference was found between the Evoikos Gulf in autumn and the Evoikos Gulf in summer. Consequently, for the Evoikos Gulf location, variations were found with the season and between regions for the different seasons. The results are presented in Figure S1.
Regarding ash, the highest content was measured for the Evoikos Gulf in summer (13.86% ± 1.40%) and for the Saronic Gulf in autumn (16.41% ± 1.18%). As can be seen from Figure S2, for the same location, the year did not affect the ash value. However, there were statistically significant differences for the values between the two sites. It also seems that overall, the change in the season and location significantly affected the values of that component. The most noticeable difference is found between the Evoikos region in winter and the Saronic region in autumn and winter, where the values are significantly higher.
Regarding the levels of carbohydrates measured in the samples, it appeared that none of the examined factors (location and season) led to any statistically significant variation in their values, which shows the relative stability of these components throughout the year (Figure S3). The carbohydrate content reached its highest values in the Evoikos region in spring (20.89% ± 4.84%) and in the Saronic region in summer (19.87% ± 2.51%).
Finally, based on the results of the total fat in the samples, the difference observed in the value for summer in Saronikos was statistically significant, and was found to be higher than the rest, except for that in winter for the same location, where the value was very similar (Figure S4). The detection of higher fat values during the summer agrees with the literature and is attributed to the fact that during this season, the oysters mature [25].
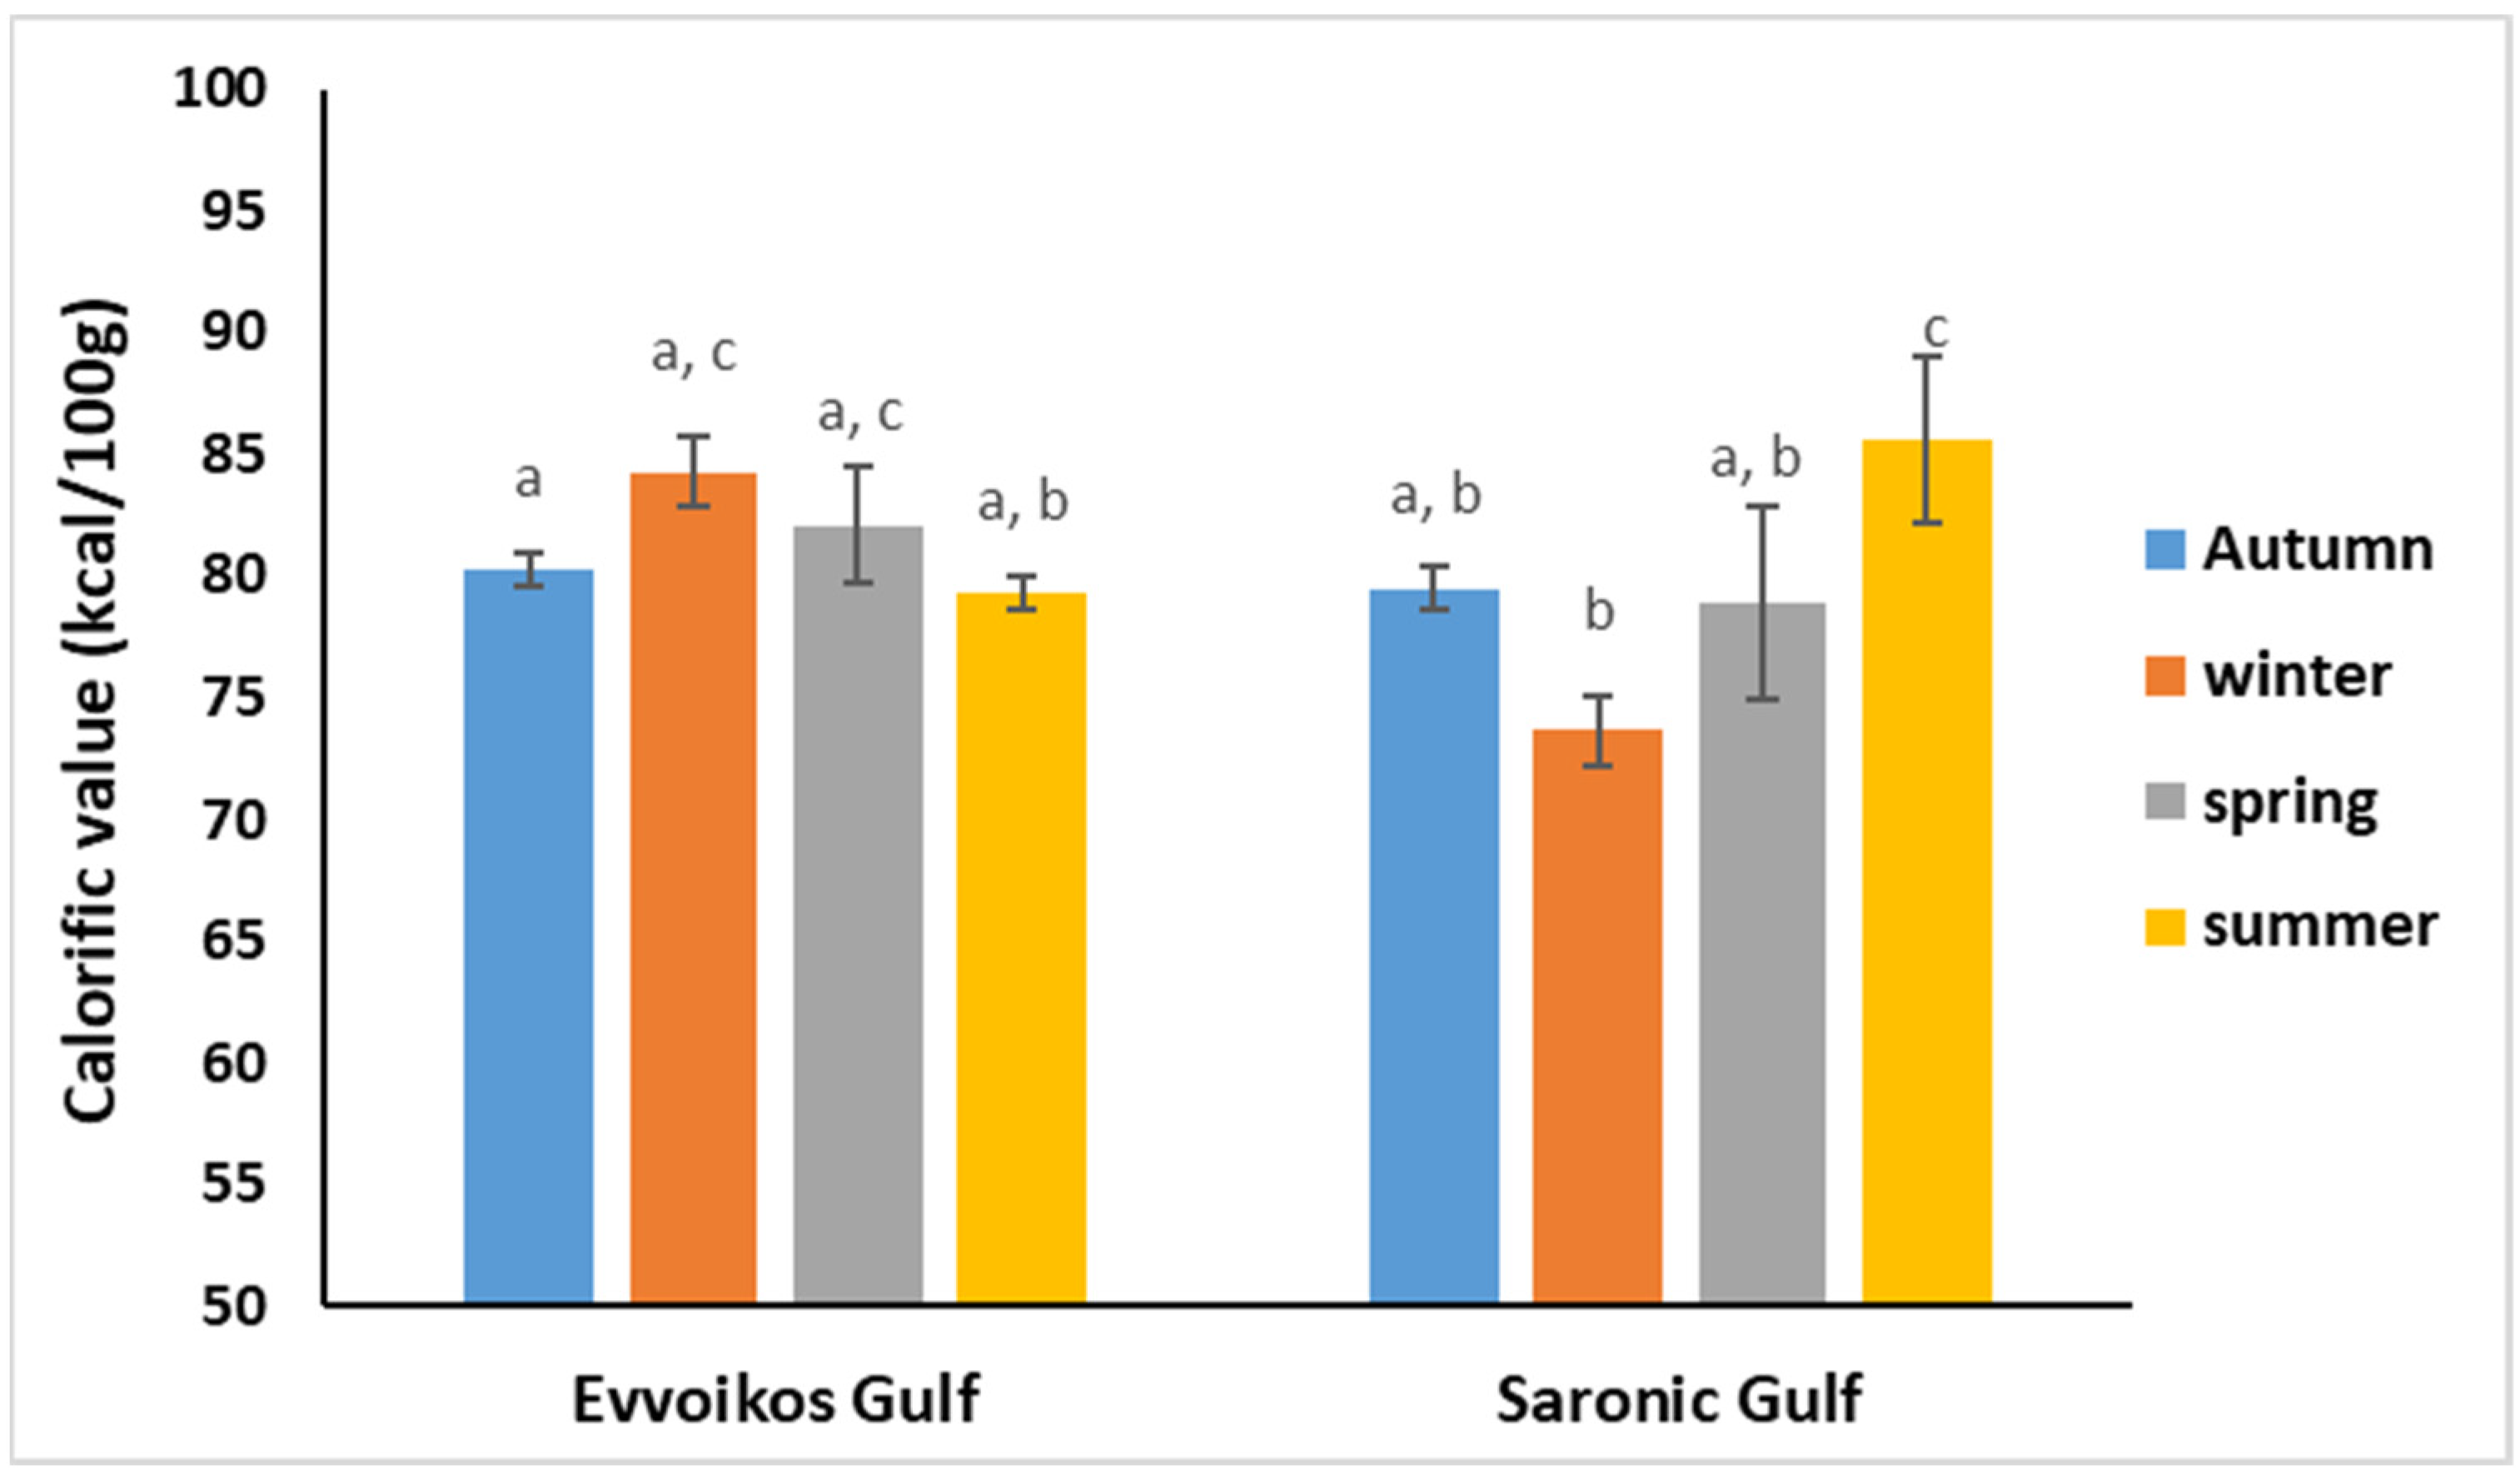
Based on the biochemical analysis of the samples, their corresponding calorific values were also calculated.
The results are presented in Figure 3.
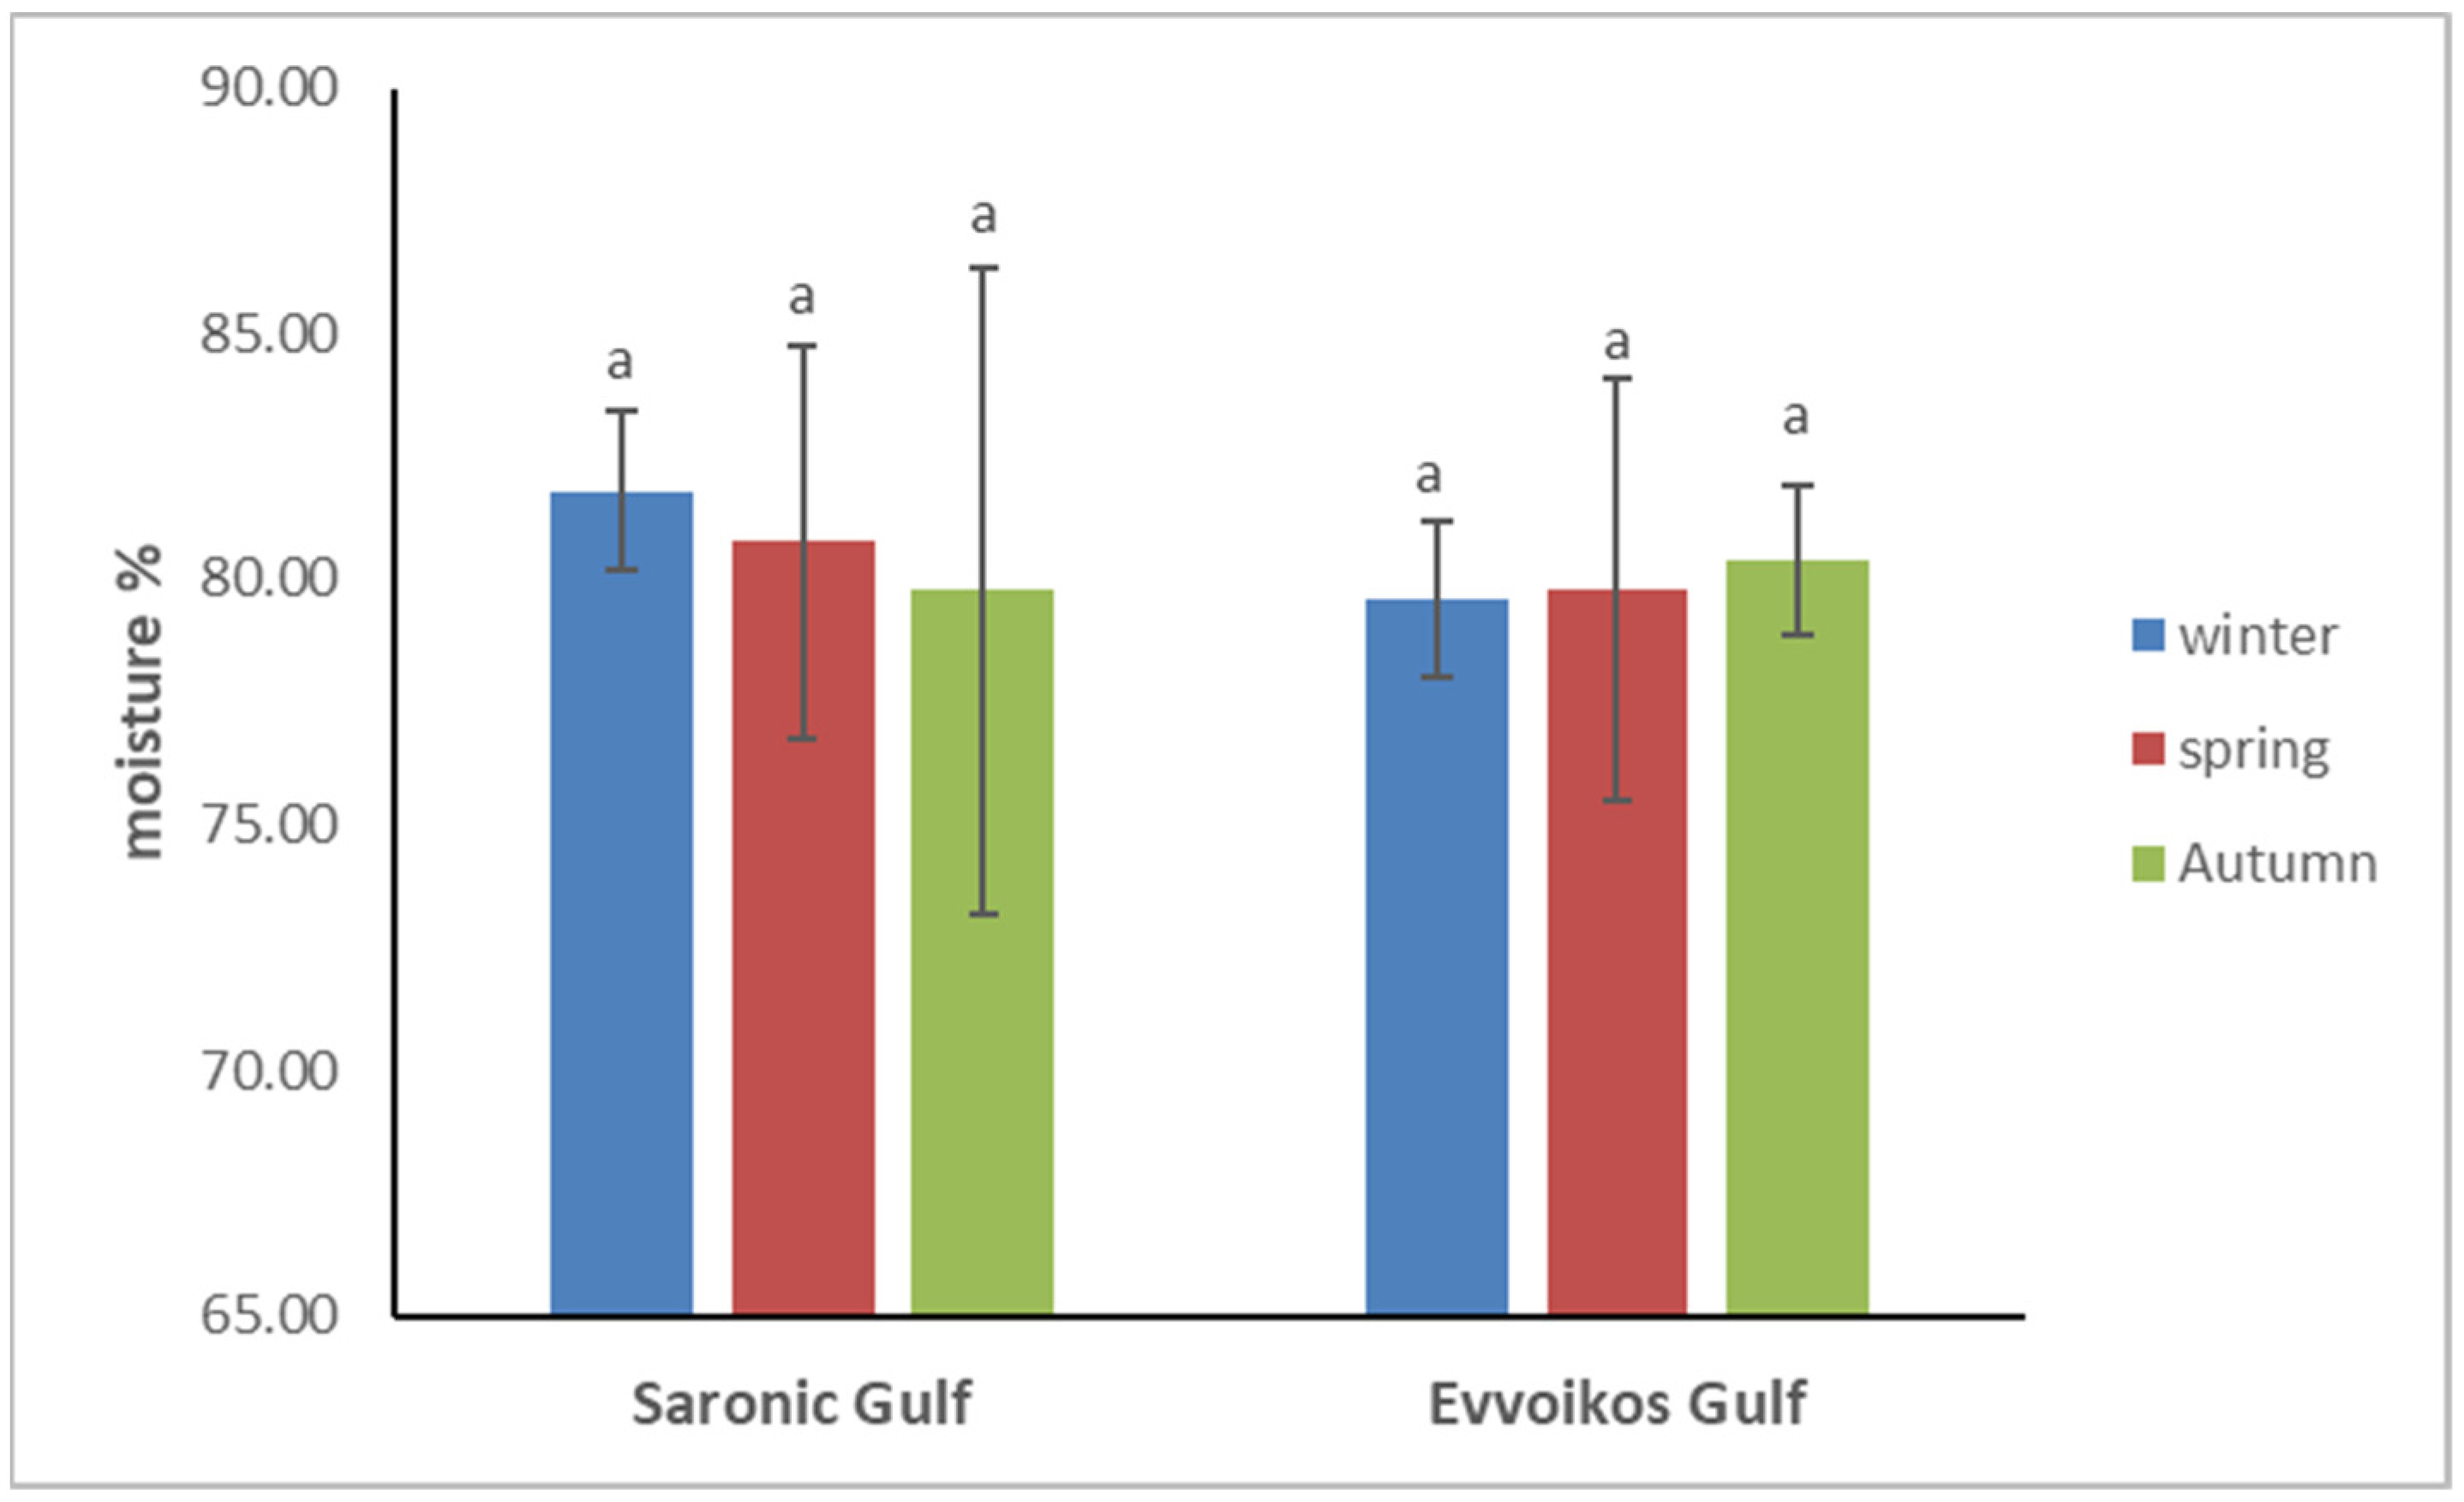
Finally, concerning the moisture content, as shown in Figure 4, it remained relatively constant between the studied seasons and locations without any significant variations. This result is of high importance as it is reported that the moisture content of the edible part indicates the quality and freshness of shellfish since it affects the physical and chemical processes of the flesh [28].

3.3. Total Fatty Acid (TFA) Analysis

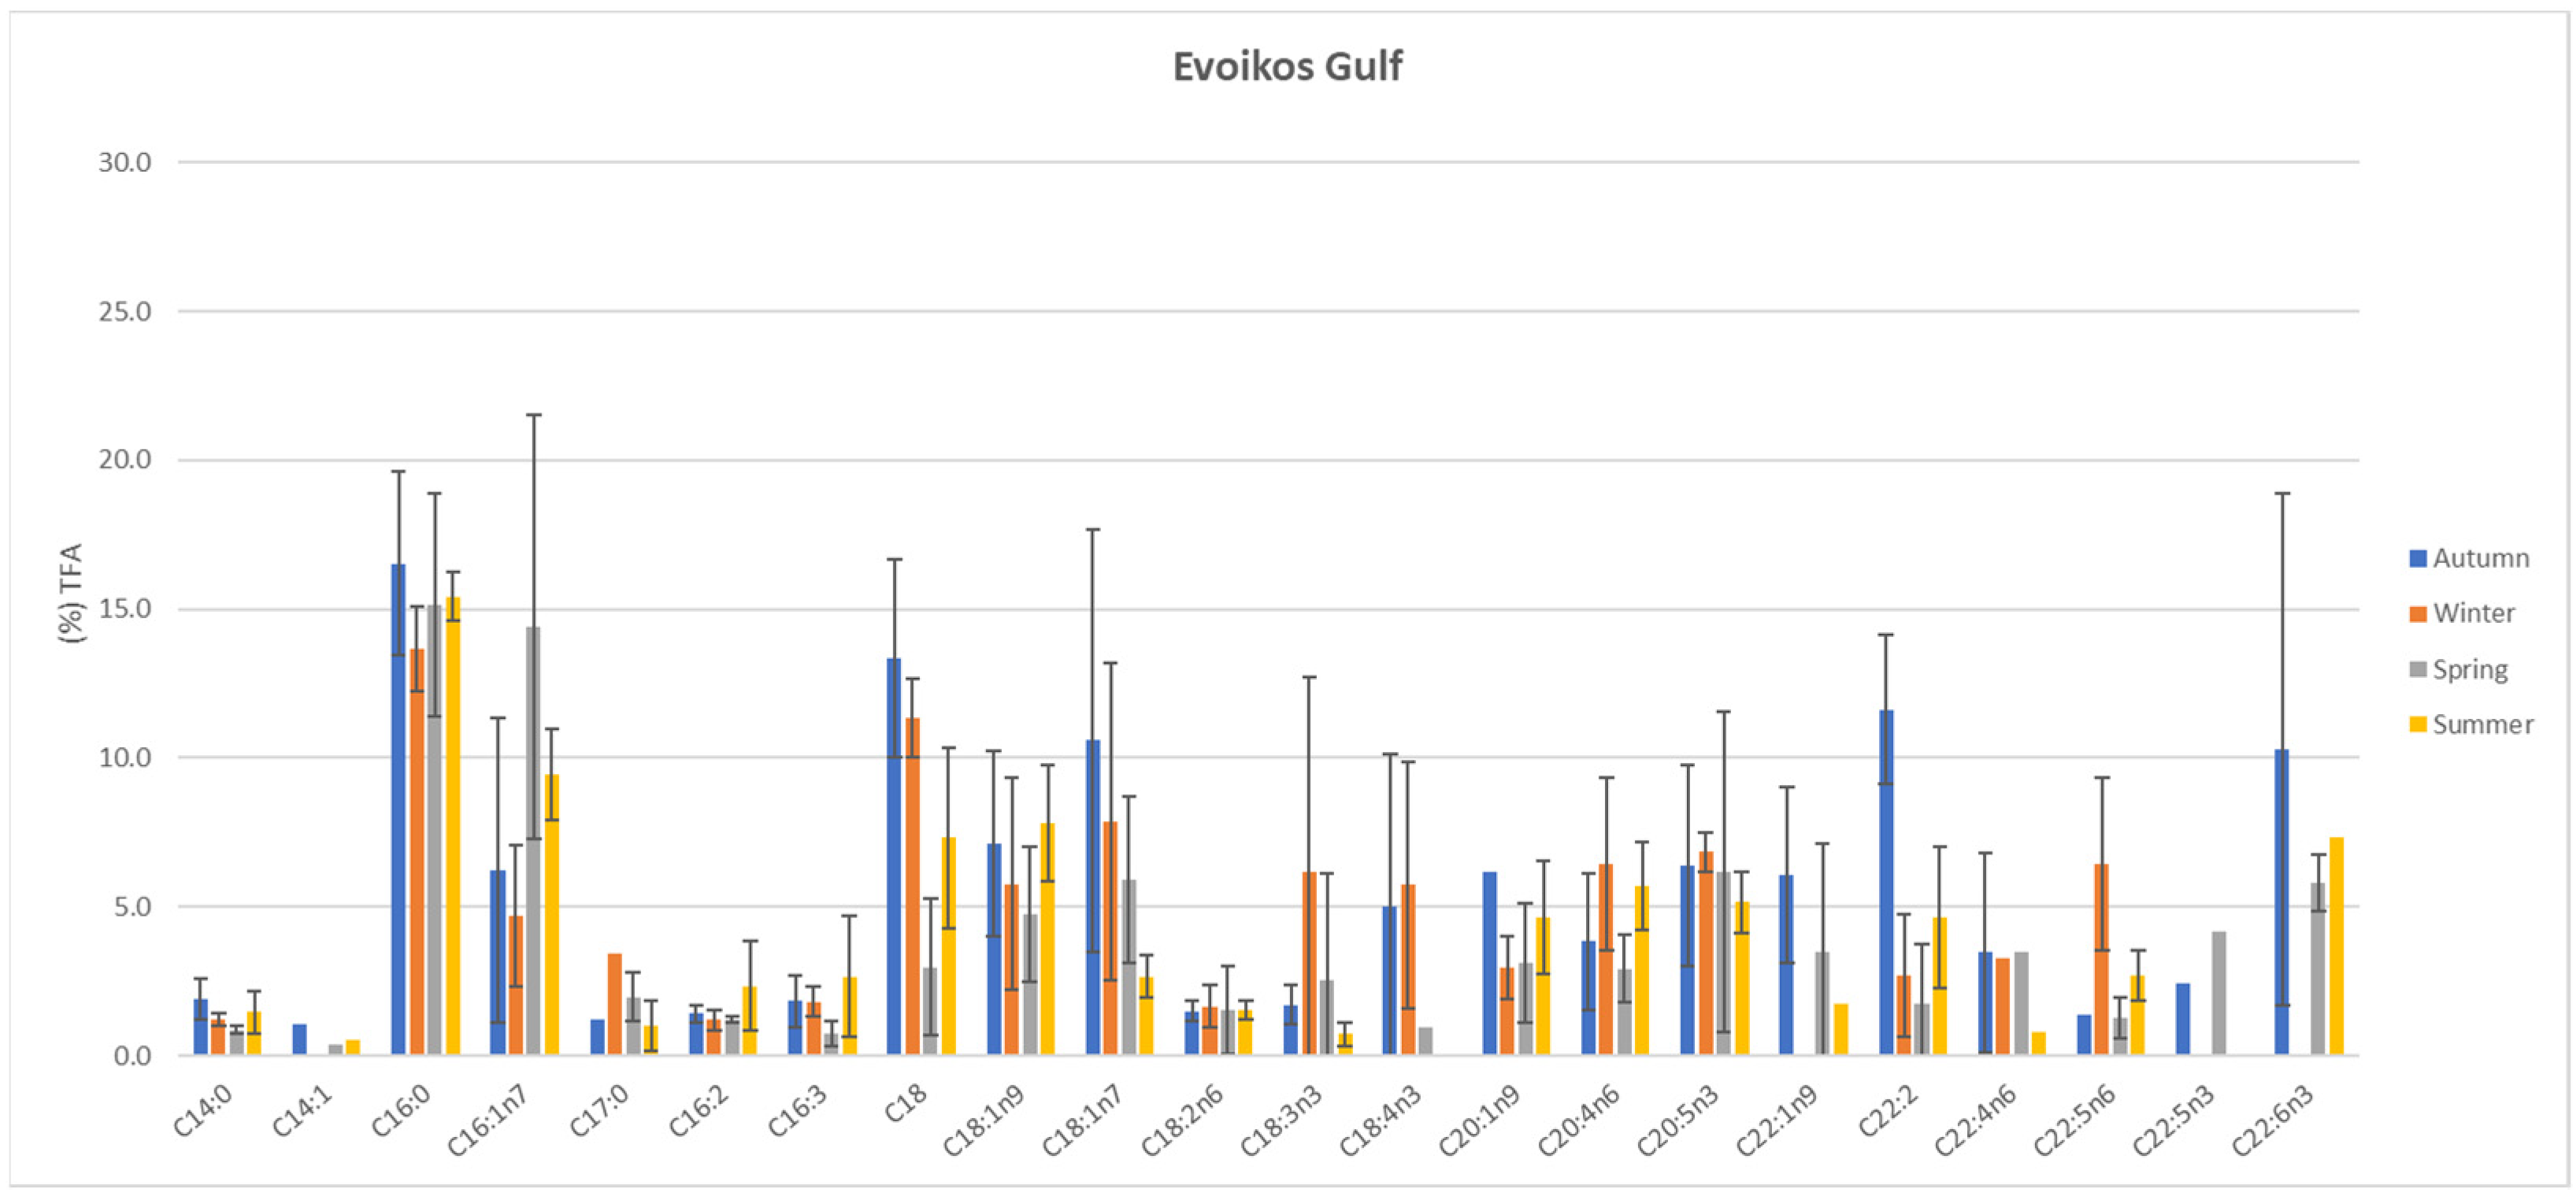
In addition to the determination of total fat (%), a more detailed analysis and identification of the contained fatty acids were carried out for all the samples using gas chromatography. The results are presented in Figure 4 and Figure 5.
As can be seen in Figure 5 and Figure 6, which depict the total fatty acids detected in the samples, for the Evoikos Gulf, it is observed that palmitic acid (C16:0) was detected in the largest amount compared to the other fatty acids throughout the year. It is also observed that the highest fatty acid concentrations were found in autumn (C16:0 = 16.53%, C18:0 = 13.34%, C22:2 = 11.63%, etc.). For the Saronic Gulf, fatty acids C18 (18.03%) and C22:6n3 (16.58%) were detected in the highest concentrations. In addition, it was also observed here that the highest concentration was measured in autumn.
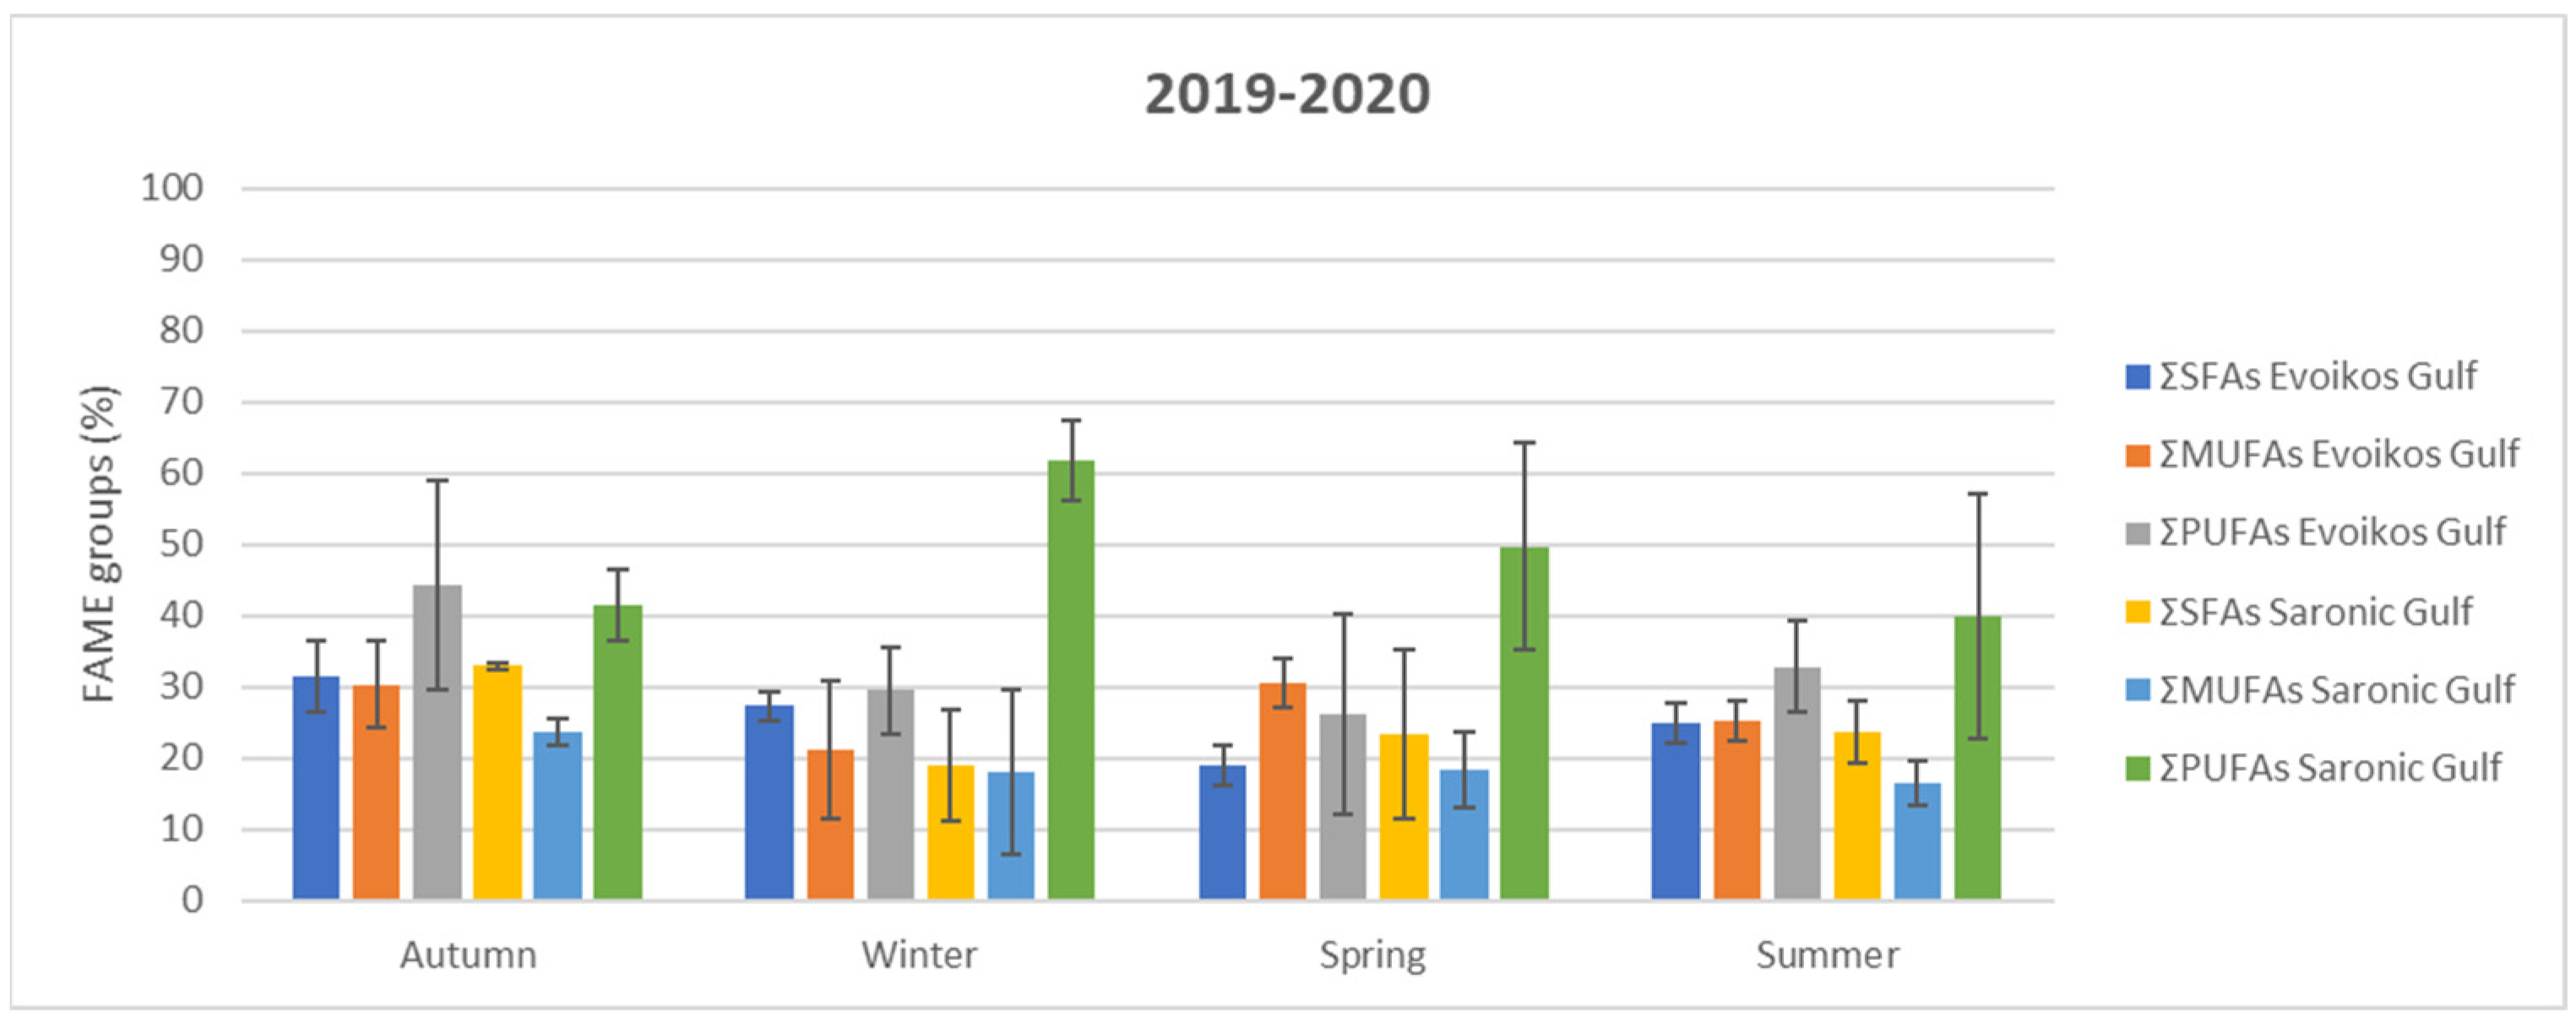
Figure 7 shows the seasonal distribution of grouped fatty acids based on the existence of double bonds in their molecules. From this diagram, it is observed that overall, the polyunsaturated fats were the ones that were detected in the highest amounts for each month and for each location, apart from spring in the Evoikos Gulf, where the monounsaturated fats had a higher value. The values of the grouped fatty acids are also presented in Table 2, where it is verified from their statistical analysis that no statistically significant differences were detected for each category of acids between the locations and seasons. Moreover, in Table 2, the ratios of polyunsaturated to saturated fatty acids are presented, as these parameters are very important indicators of the nutritional quality of seafood [29].
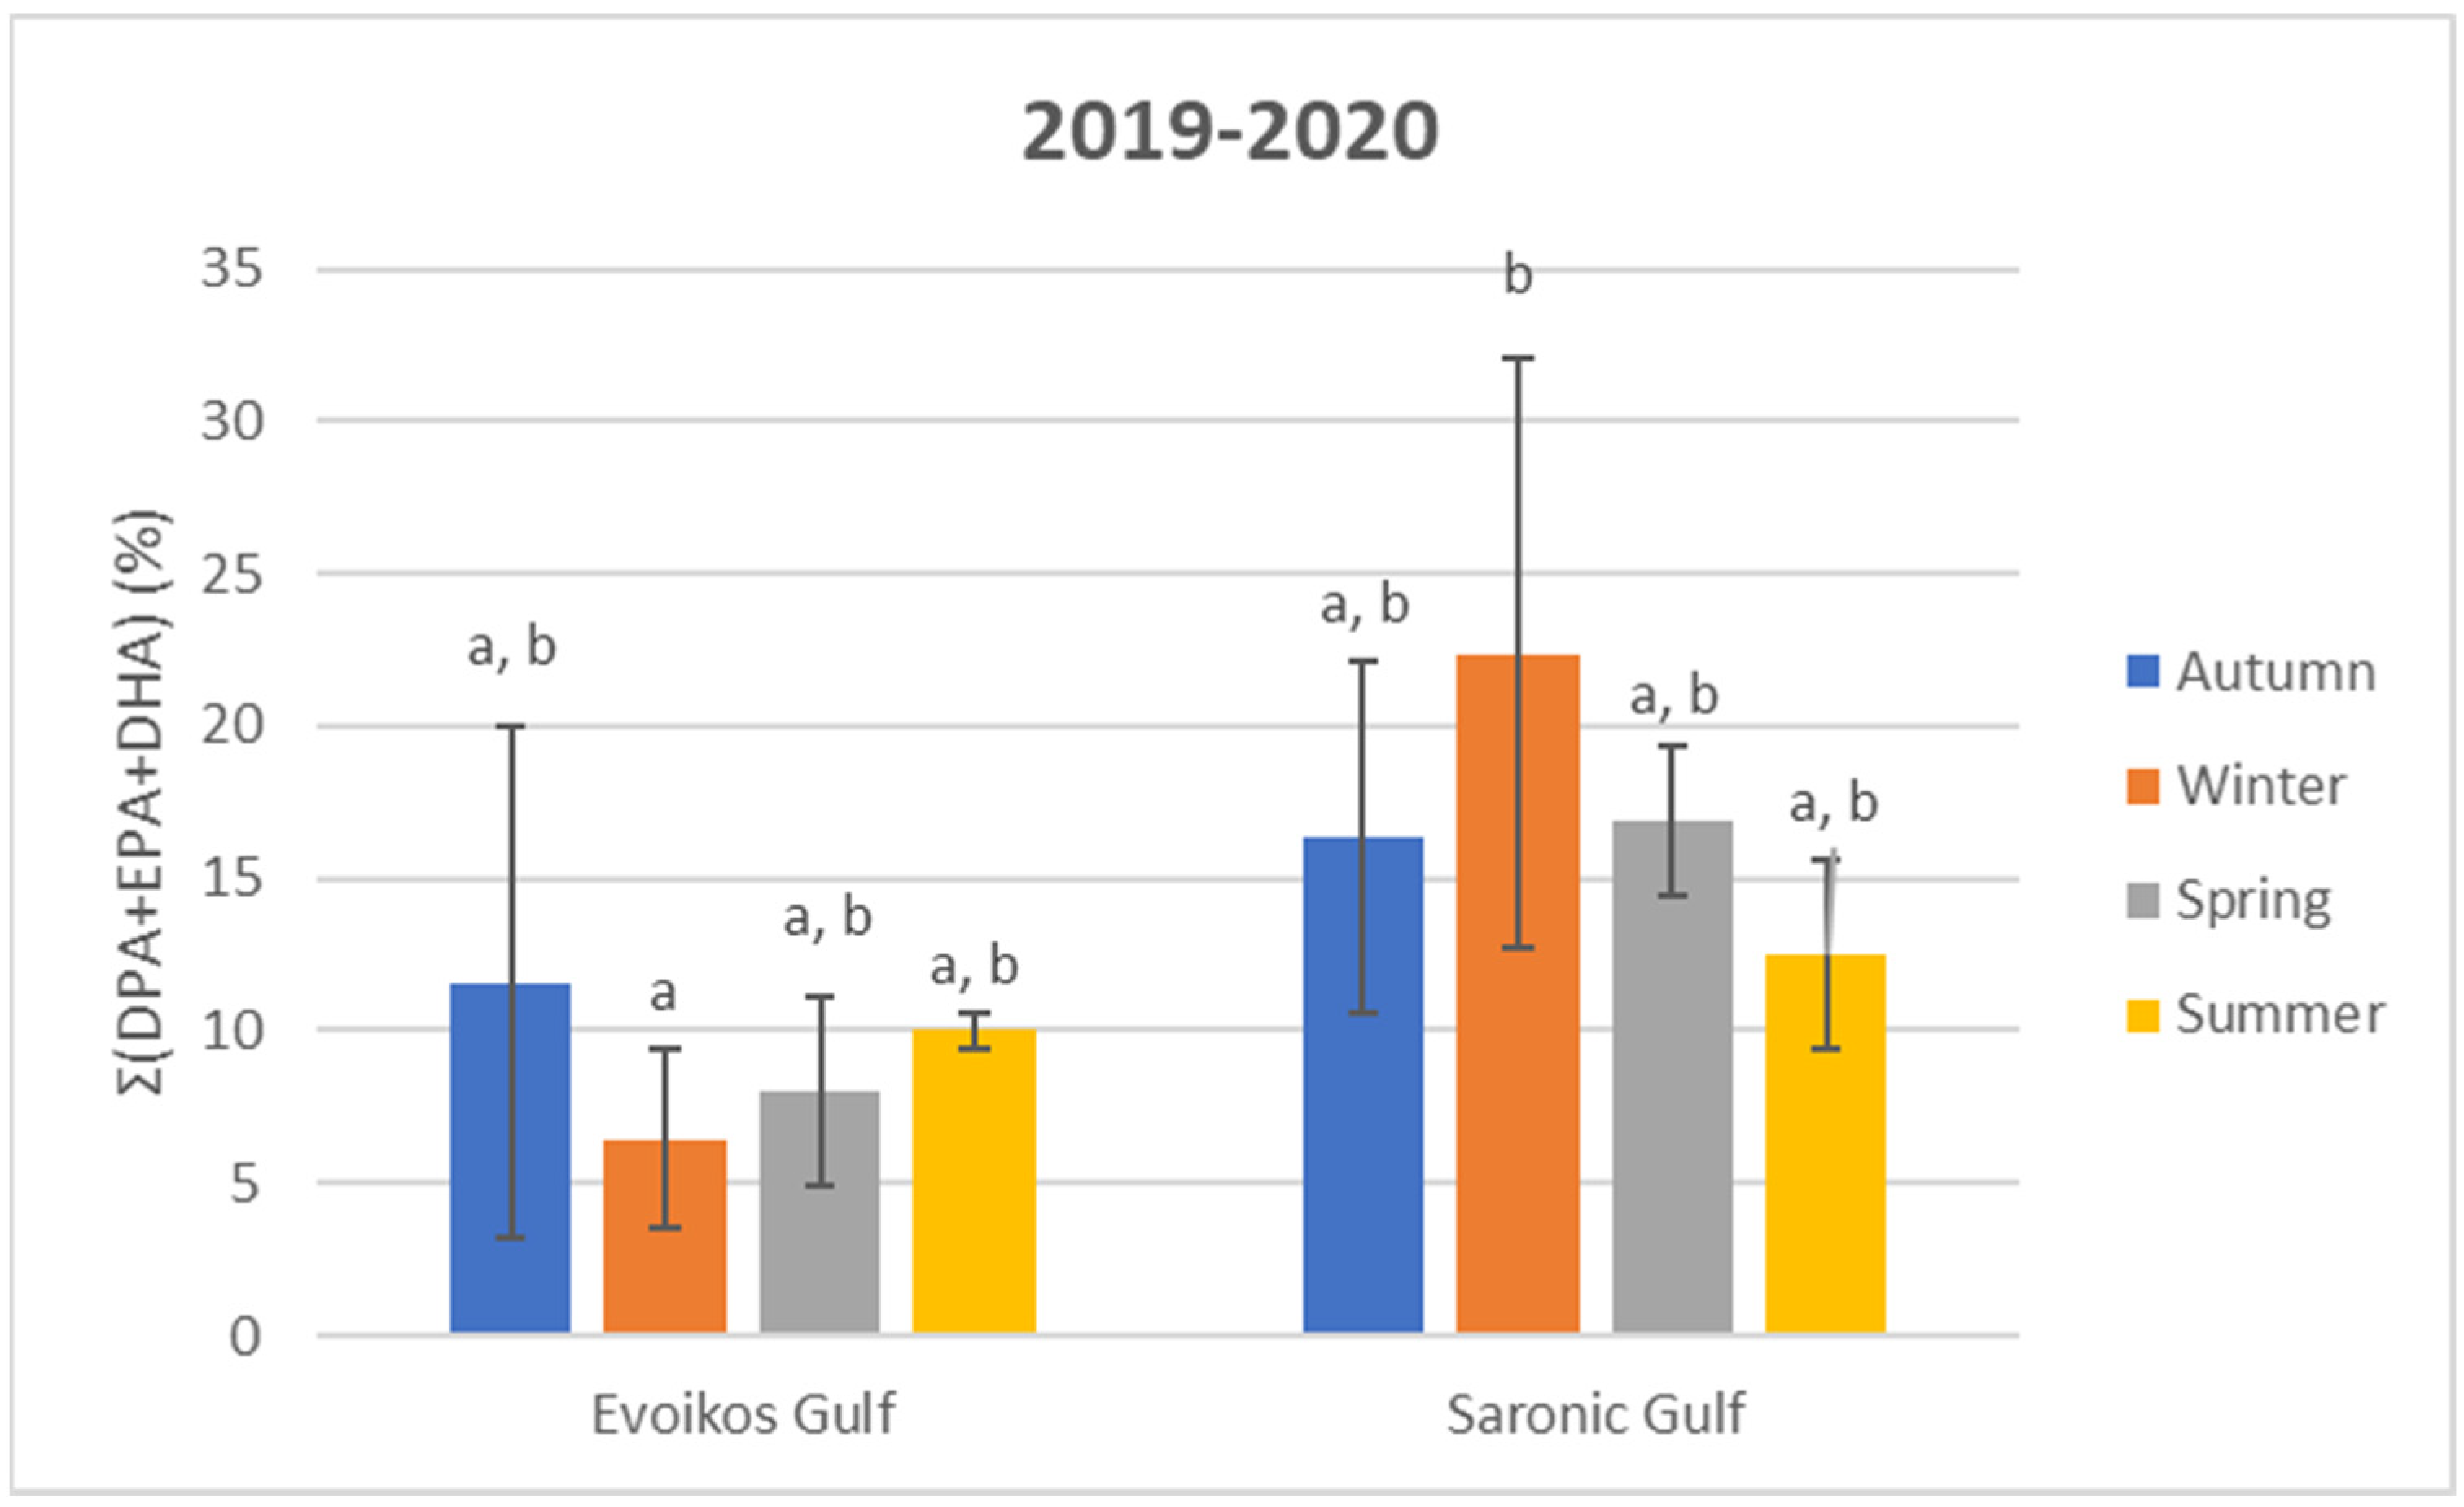
From the polyunsaturated fatty acids, docasapentanoic acid (DPA), eicosapentaenoic acid (EPA) and docosahexaenoic acid (DHA) are very important ingredients for nutrition with proven beneficial properties in the treatment of heart diseases, cancer, etc. [2]. For this reason and as shown in Figure 8, they were also studied separately from the rest of the fatty acids.
From the results presented in Figure 8, it is evident that in the Saronic Gulf, the levels of these specific unsaturated fatty acids were higher than those in the Evoikos Gulf for all four seasons, with the highest amount appearing in the Saronic Gulf in winter, while in the Evoikos Gulf, for the same season, the overall lowest price is detected.
Finally, from the above parameters, the nutritional quality of the fatty acids AI, TI and HH were calculated, and the results are presented in Table 3.
For the AI and TI indices, values between 0.2 and 2.37 and 0.01–1.18, respectively, are reported in the literature for different seafood [5]. The results of the present study are within these limits. Regarding HH, higher values indicate the presence of more PUFAs in the samples. In the literature, values between 0.25 and 3.23 are reported, which seem to be verified except for the samples from winter and spring from the Saronikos Gulf, which have higher values due to the increased polyunsaturated fat content in these samples [5].

4. Conclusions

As the present study shows, the oysters collected from the Aegean Sea are rich in proteins and contain a considerable amount of carbohydrates and few fats. Collectively, it was observed that the protein content of the pearl oyster is at its maximum in winter and at its minimum in summer. The fat content is at its maximum during summer and the carbohydrates are at their maximum in spring, while ash shows its maximum values during autumn. Finally, regarding the profile of fatty acids, several compounds were identified, with polyunsaturated fats being in the highest proportion. In contrast, saturated fat was detected in smaller amounts, which is very encouraging given that a diet rich in such fats increases the risk of cardiovascular disease (CVD) by increasing the blood total cholesterol and low-density lipoprotein (LDL). The nutritional profile of the oyster P. radiata demonstrates its high nutritional value and supports its emergence as a “new” bivalve bioresource; a “superfood” for human consumption in the Mediterranean seafood supply and value chain [30,31].

Supplementary Materials

The following supporting information can be downloaded at https://www.mdpi.com/article/10.3390/app14219757/s1: Figure S1: Plot of mean calculated crude protein values of oyster samples in relation to season and location. The sampling was performed from autumn 2019 to summer 2020; Figure S2: Plot of mean calculated ash (%) values of oyster samples in relation to season and location. The sampling was performed from autumn 2019 to summer 2020; Figure S3: Plot of mean calculated carbohydrate (%) values of oyster samples in relation to season and location. The sampling was performed from autumn 2019 to summer 2020; Figure S4: Plot of mean calculated total fat (%) values of oyster samples in relation to season and location. The sampling was performed from autumn 2019 to summer 2020; Table S1: Total fatty acids as mg/g of dry weight between sampling site and season. Superscripts letters denote statistical differences (p < 0.05); Table S2: Pinctada radiata FAMEs as mg/g dry weight sampled in Evoikos Gulf in different seasons. Highest values with statistical differences (p < 0.05) are marked with a superscript; Table S3: Pinctada radiata FAMEs as mg/g dry weight sampled in Saronic Gulf in different seasons. Superscripts letters denote statistical differences (p < 0.05).

Author Contributions

Conceptualization, J.A.T. and I.T.; methodology, J.A.T., I.T. and V.B.; formal analysis, I.T.; investigation, J.A.T. and I.T.; resources, A.R., X.D. and J.A.T.; data curation, A.R., X.D., I.T., V.B. and J.A.T.; writing—review and editing, V.B., I.T. and J.A.T.; visualization, I.T.; supervision, J.A.T.; project administration, J.A.T.; funding acquisition, J.A.T. All authors have read and agreed to the published version of the manuscript.

Funding

This research was funded by ‘‘Innovation in Fisheries’’ EU-Greece Operational Program of Fisheries and Maritime, EPAL 2014–2020, grant number MIS:5010850.

Institutional Review Board Statement

The animal study protocol was approved by the Institutional Review Board of The University of Patras (632/14-10-2019, protocol code 85340/2019).

Informed Consent Statement

Not applicable.

Data Availability Statement

The original contributions presented in the study are included in the article, further inquiries can be directed to the corresponding author.

Acknowledgments

The present work is a part of the project “Commercial exploitation of the pearl oyster Pinctada imbricata radiata by adding value through the development of processed products” (Code MIS:5010850).

Conflicts of Interest

Author Ioannis Tzovenis was employed by the MicroPhykos, Aquaculture Systems & Services. The remaining authors declare that the research was conducted in the absence of any commercial or financial relationships that could be construed as a potential conflict of interest.

References

  1. Theodorou, J.A.; Makri, M.; Douvi, X.; Ramfos, A.; Spinos, E. Seasonal variation in the biochemical composition, condition index, and meat yield of the non-indigenous pearl oyster Pinctada imbricata radiata (Leach, 1814) from the West of the Aegean Sea, Greece. Aquac. Fish 2023, 8, 451–456. [Google Scholar] [CrossRef]
  2. Moon, S.K.; Kang, J.Y.; Kim, K.D.; Kim, I.S.; Jeong, B.Y. Lipid Components of the Cultured Pearl Oyster (Pinctada fucata martensii) in Korea. Fish Aquat. Sci. 2005, 8, 189–194. [Google Scholar] [CrossRef]
  3. Anacleto, P.; Maulvault, A.L.; Bandarra, N.M.; Repolho, T.; Nunes, M.L.; Rosa, R.; Marques, A. Effect of warming on protein, glycogen and fatty acid content of native and invasive clams. Food Res. Int. 2014, 64, 439–445. [Google Scholar] [CrossRef] [PubMed]
  4. Biandolino, F.; Parlapiano, I.; Grattagliano, A.; Fanelli, G.; Prato, E. Comparative Characteristics of Percentage Edibility, Condition Index, Biochemical Constituents and Lipids Nutritional Quality Indices of Wild and Farmed Scallops (Flexopecten glaber). Water 2020, 12, 1777. [Google Scholar] [CrossRef]
  5. Prato, E.; Fanelli, G.; Parlapiano, I.; Biandolino, F. Bioactive fatty acids in seafood from Ionian Sea and relation to dietary recommendations. Int. J. Food Sci. Nutr. 2020, 71, 693–705. [Google Scholar] [CrossRef]
  6. Shen, Y.-N.; Zhang, D.-l.; Zhang, B.; Jiang, S.; Liu, B.-S.; Huang, G.-J.; Yu, D.-H. A baseline study on lipid and fatty acid composition in the pearl oyster, Pinctada fucata. Aquac. Int. 2016, 24, 523–536. [Google Scholar] [CrossRef]
  7. Tsangaris, C.; Simboura, N.; Strogyloudi, E.; Zeri, C.; Kaberi, H.; Pavlidou, A.; Chatzianestis, I.; Bordbar, L.; Catsiki, A.V.; Tzempelikou, E.; et al. Pollution Pressures and Impacts in the North Evoikos Gulf (Aegean Sea). In The Handbook of Environmental Chemistry; Springer: Berlin/Heidelberg, Germany, 2022; pp. 1–25. [Google Scholar]
  8. Mente, E.; Pantazis, P.; Neofitou, C.; Aifanti, S.; Santos, M.B.; Oxouzi, E.; Bagiatis, V.; Papapanagiotou, E.; Kourkouta, V.; Soutsas, K. Socioeconomic interactions of fisheries and aquaculture in Greece: A case study of south Evoikos gulf. Aquacult. Econ. Manag. 2007, 11, 313–334. [Google Scholar] [CrossRef]
  9. Zenetos, A.; Ovalis, P.; Giakoumi, S.; Kontadakis, C.; Lefkaditou, E.; Mpazios, G.; Simboura, N.; Tsiamis, K. Saronikos Gulf: A hotspot area for alien species in the Mediterranean Sea. Bioinvasions Rec. 2020, 9, 873–889. [Google Scholar] [CrossRef]
  10. Serbetis, C.D. L’acclimatation de la Meleagrina Pinctada margaritifera (Lam.) en Grèce. Rapp. Procès-Verbaux Réunions Comm. Int. Pour L’ Explor. Sci. Mer Méditerranée 1963, 17, 271–272. [Google Scholar]
  11. Antit, M.; Gofas, S.; Salas, C.; Azzouna, A. One hundred years after Pinctada: An update on alien Mollusca in Tunisia. Mediterr. Mar. Sci. 2011, 12, 53–74. [Google Scholar] [CrossRef]
  12. Theodorou, J.A.; Viaene, J.; Sorgeloos, P.; Tzovenis, I. Production and Marketing Trends of the Cultured Mediterranean Mussel Mytilus galloprovincialis Lamarck 1819, in Greece. J. Shellfish Res. 2011, 30, 859–874. [Google Scholar] [CrossRef]
  13. Lodola, A.; Nicolini, L.; Savini, D.; Deidun, A.; Occhipinti-Ambrogi, A. Range expansion and biometric features of Pinctada imbricata radiata (Bivalvia: Pteriidae) around Linosa Island, Central Mediterranean Sea (Italy). Ital. J. Zool. 2013, 80, 303–312. [Google Scholar] [CrossRef]
  14. Yigitkurt, S.; Lök, A.; Kirtik, A.; Acarli, S.; Kurtay, E.; Küçükdermenci, A.; Durmaz, Y. Spat efficiency in the pearl oyster (Leach, 1814) in the surface and bottom water at Karantina Island. Oceanol. Hydrobiol. St. 2020, 49, 184–192. [Google Scholar] [CrossRef]
  15. Moutopoulos, D.K.; Ramfos, A.; Theodorou, J.A.; Katselis, G. Biological aspects, population and fishery dynamics of the non-indigenous pearl oyster Pinctada imbricata radiata (Leach, 1814) in the Eastern Mediterranean. Reg. Stud. Mar. Sci. 2021, 45, 101821. [Google Scholar] [CrossRef]
  16. Zhukova, N.V. Fatty Acids of Marine Mollusks: Impact of Diet, Bacterial Symbiosis and Biosynthetic Potential. Biomolecules 2019, 9, 857. [Google Scholar] [CrossRef]
  17. APHA. Standard Methods for the Examination of Water and Wastewater, 21st ed.; American Public Health Association: Washington, DC, USA, 2005. [Google Scholar]
  18. D5176-08; Standard Test Method for the Total Chemically Bound Nitrogen in Water by Pyrolysis and Chemiluminescence Detection. ASTM International, Designation: West Conshohocken, PA, USA, 2008.
  19. Bekiari, V.; Avramidis, P. Data quality in water analysis: Validation of combustion-infrared and combustion-chemiluminescence methods for the simultaneous determination of Total Organic Carbon (TOC) and Total Nitrogen (TN). Int. J. Environ. Anal. Chem. 2014, 94, 65–76. [Google Scholar] [CrossRef]
  20. Jeffrey, S.W.; Humphrey, G.F. New spectrophotometric equations for determining chlorophylls a, b, c1 and c2 in higher plants, algae and natural phytoplankton. Biochem. Physiol. Pflanz. 1975, 167, 191–194. [Google Scholar] [CrossRef]
  21. Laurens, L.M.L.; Quinn, M.; Van Wychen, S.; Templeton, D.W.; Wolfrum, E.J. Accurate and reliable quantification of total microalgal fuel potential as fatty acid methyl esters by in situ transesterification. Anal. Bioanal. Chem. 2012, 403, 167–178. [Google Scholar] [CrossRef]
  22. Ulbricht, T.L.V.; Southgate, D.A.T. Coronary heart disease: Seven dietary factors. Lancet 1991, 338, 985–992. [Google Scholar] [CrossRef]
  23. Santos-Silva, J.; Bessa, R.J.B.; Santos-Silva, F. Effect of genotype, feeding system and slaughter weight on the quality of light lambs: II. Fatty acid composition of meat. Livest. Prod. Sci. 2002, 77, 187–194. [Google Scholar] [CrossRef]
  24. Della Malva, A.; Santillo, A.; Francavilla, M.; Caroprese, M.; Marino, R.; Sevi, A.; Albenzio, M. Mussel Culture Farming Systems in the Northern Gargano Coast (Adriatic Sea): Changes in the Nutritional Profile of the Mytilus galloprovincialis. Foods 2024, 13, 2205. [Google Scholar] [CrossRef] [PubMed]
  25. de Cássia Divino Lima, R.; Ferreira, J.P.R.; do Espírito Santo, C.M.; da Silva, F.C.; de Miranda Gomes, C.H.A.; de Oliveira Ramos, C.; de Melo, C.M.R. Spat of pacific oysters (Crassostrea gigas) grown in subtropical environments. J. Appl. Aquacult. 2023, 36, 342–364. [Google Scholar] [CrossRef]
  26. Gokoglu, N.; Gokoglu, M.; Yerlikaya, P. Seasonal variations in proximate and elemental composition of pearl oyster (Pinctada radiata, Leach, 1814). J. Sci. Food Agric. 2006, 86, 2161–2165. [Google Scholar] [CrossRef]
  27. Ehteshami, F.; Christianus, A.; Rameshi, H.; Harmin, S.A.; Saad, C.R. Proximate and fatty acid composition of the gonads of wild versus hatchery-conditioned Pinctada margaritifera broodstock. Aquac. Nutr. 2011, 17, e675–e682. [Google Scholar] [CrossRef]
  28. Chen, J.; Liu, H. Nutritional Indices for Assessing Fatty Acids: A Mini-Review. Int. J. Mol. Sci. 2020, 21, 5695. [Google Scholar] [CrossRef]
  29. Jolaosho, T.L.; Elegbede, I.O.; Akinota, S.L.; Jimoh, A.A.-A. Biometric and gonadosomatic indices and chemical constituents of edible tissues and exoskeletons of Callinectes amnicola and their potential for reuse in the circular economy paradigm. Sci. Rep. 2023, 13, 8502. [Google Scholar] [CrossRef]
  30. Theodorou, J.A.; Minasidis, V.; Ziou, A.; Douligeri, A.S.; Gkikas, M.; Koutante, E.; Katselis, G.; Anagnopoulos, N.; Bourdaniotis, N.; Moutopoulos, D.K. New Product Value Chain for The Pearl Oyster Pinctada imbricata radiata: A preliminary survey. J. Mar. Sci. Eng. 2023, 11, 95. [Google Scholar] [CrossRef]
  31. Moutopoulos, D.K.; Minasidis, V.; Ziou, A.; Douligeri, A.S.; Katselis, G.; Theodorou, J.A. Investigating the Acceptance of a New Bivalve Product in the Greek Shellfish Market: The Non-Indigenous Pearl Oyster Pinctada imbricata radiata. J. Mar. Sci. Eng. 2022, 10, 251. [Google Scholar] [CrossRef]
Figure 1. Pearl oyster sampling positions: (EV) Evoikos Gulf; (SAR) Saronic Gulf.
Applsci 14 09757 g001
Figure 2. Biochemical analysis of the oyster samples from the two regions: (a) Evoikos Gulf; (b) Saronic Gulf in four different seasons. The sampling was performed from autumn 2019 to summer 2020. Superscripts letters denote statistically significant different values (p < 0.05) for each component between different seasons.
Applsci 14 09757 g002
Figure 3. Mean values of calorific value of oyster samples in relation to season and location. The sampling was performed from autumn 2019 to summer 2020. Superscripts letters denote statistically significant different values (p < 0.05) between different seasons for each location.
Applsci 14 09757 g003
Figure 4. Mean values of moisture content of oyster samples in relation to season and location. The sampling was performed from autumn 2019 to summer 2020. Superscripts letters denote statistically significant different values (p < 0.05) between different seasons for each location.
Applsci 14 09757 g004
Figure 5. Summary chart of the fatty acid composition of samples from the Evoikos Gulf. The sampling was performed from autumn 2019 to summer 2020.
Applsci 14 09757 g005
Figure 6. Summary chart of the fatty acid composition of samples in the Saronic Gulf. The sampling was performed from autumn 2019 to summer 2020.
Applsci 14 09757 g006
Figure 7. Summary chart of the fatty acid composition of samples in both studied locations. The sampling was performed from autumn 2019 to summer 2020.
Applsci 14 09757 g007
Figure 8. Summary chart of DPA, EPA, and DHA (%) in the samples from both studied locations. The sampling was performed from autumn 2019 to summer 2020. Superscripts letters denote statistically significant different values (p < 0.05) between different seasons for each location.
Applsci 14 09757 g008
Table 1. Environmental seawater parameters (mean ± SE) from both sampling sites for the four seasons.
Sampling SeasonEvoikos GulfSaronikos Gulf
pHAutumn8.1 ± 0.028.2 ± 0.02
Winter8.2 ± 0.028.2 ± 0.02
Spring8.0 ± 0.028.5 ± 0.02
Summer8.4 ± 0.028.4 ± 0.02
Salinity (ppt)Autumn40 ± 339 ± 3
Winter40 ± 339 ± 3
Spring37 ± 339 ± 3
Summer36 ± 337 ± 3
TOC (mg C/L)Autumn6.93 ± 0.5 c3.69 ± 0.3 d
Winter7.13 ± 0.5 c3.96 ± 0.3 d
Spring19.4 ± 1.5 a12.6 ± 1.0 b
Summer19.2 ± 1.5 a12.8 ± 1.0 b
TN (mg N/L)Autumn0.16 ± 0.01 e0.06 ± 0.01 g
Winter0.21 ± 0.02 c,d0.08 ± 0.01 f,g
Spring0.39 ± 0.03 b0.18 ± 0.01 d
Summer0.50 ± 0.03 a0.25 ± 0.02 c
NO3-N (mg N/L)Autumn0.12 ± 0.01 e0.02 ± 0.01 g
Winter0.18 ± 0.01 c0.04 ± 0.01 f
Spring0.36 ± 0.03 b0.16 ± 0.01 d
Summer0.41 ± 0.03 a0.18 ± 0.02 c
NO2-N (mg N/L)Autumn<0.01<0.01
Winter<0.01<0.01
Spring<0.01<0.01
Summer<0.01<0.01
PO4-P (mg P/L)Autumn<0.01<0.01
Winter<0.01<0.01
Spring<0.01<0.01
Summer<0.01<0.01
Chlorophyll-a (µg/L)Autumn0.3 ± 0.05 b,c0.1 ± 0.05 c,d
Winter0.4 ± 0.05 a,b0.2 ± 0.05 c
Spring0.5 ± 0.05 a0.3 ± 0.05 b,c
Summer0.5 ± 0.05 a0.5 ± 0.05 a
Superscripts letters when present, denote statistically significant difference between the values of each parameter (p < 0.05).
Table 2. Content (%) of the samples in saturated (ΣSFAs), monounsaturated (ΣMUFAs), and polyunsaturated (ΣPUFAs) fatty acids and ratio of polyunsaturated/saturated (ΣPUFAs/ΣSFAs) fatty acids for the two studied locations for a whole year.
LocationSeasonΣSFAsΣMUFAsΣPUFAsΣPUFAs/ΣSFAs
Evoikos GulfAutumn31.55 a ± 5.09630.33 a ± 6.12544.34 a ± 14.561.380 a ± 0.235
Winter27.33 a,b ± 2.028 21.25 a ± 9.63929.56 b ± 6.1281.083 a ± 0.226
Spring19.04 b ± 2.93730.60 a ± 3.50626.11 b ± 14.031.321 a ± 0.561
Summer24.86 a,b ± 2.86825.26 a ± 2.67332.80 a,b ± 6.4161.328 a ± 0.304
Saronic GulfAutumn32.94 a ± 0.54323.78 a ± 1.81341.46 b ± 4.9311.260 b ± 0.170
Winter19.08 b ± 7.77718.10 a ± 11.5861.84 a ± 5.5333.665 a ± 1.561
Spring23.47 a ± 11.9318.35 a ± 5.34049.77 b ± 14.383.049 a ± 2.846
Summer23.79 a ± 4.37716.50 a ± 3.02339.88 b ± 17.191.747 a,b ± 0.974
Values per line (season) that do not have the same exponent (superscripts letters) show statistically significant differences (p < 0.05).
Table 3. Dietary lipid quality indices for the Evoikos and Saronic Gulfs over a full year.
LocationSeasonAITIHH
Evoikos GulfAutumn0.297 a,b ± 0.0680.359 a ± 0.0891.615 a± 0.476
Winter0.365 a ± 0.0230.333 a± 0.0541.651 a ± 0.199
Spring0.315 a ± 0.0730.278 a ± 0.0941.650 a ± 1.065
Summer0.370 a ± 0.0480.374 a ± 0.0761.661 a ± 0.337
Saronic GulfAutumn0.306 a,b ± 0.0050.446 a ± 0.1082.019 a ± 0.639
Winter0.108 b ± 0.0080.174 a ± 0.0755.127 b ± 1.047
Spring0.223 a,b ± 0.1200.263 a ± 0.1313.623 a,b ± 1.454
Summer0.278 a,b ± 0.0830.317 a ± 0.0852.240 a ± 0.369
Values per line (season) that do not have the same exponent (superscripts letters) show statistically significant differences (p < 0.05).
Disclaimer/Publisher’s Note: The statements, opinions and data contained in all publications are solely those of the individual author(s) and contributor(s) and not of MDPI and/or the editor(s). MDPI and/or the editor(s) disclaim responsibility for any injury to people or property resulting from any ideas, methods, instructions or products referred to in the content.