Abstract
The Kingdom of Saudi Arabia (KSA) has millions of date palm trees for commercial scale date-fruit production. The respective industry also generates agricultural waste including date palm tree branches. This rich bio-resource can be used for several beneficial applications. The present study therefore investigated the application of granular activated carbon (GAC) produced using date palm tree branches to successfully remove phenol, p-cresol, and copper from synthetic wastewater. The respective adsorption equilibrium results fitted well to the Langmuir-type adsorption isotherm. Furthermore, the pH-dependent adsorption results both for phenol and p-cresol appeared to follow an anionic-type adsorption behavior (i.e., decreasing adsorption with an increase in aqueous phase equilibrium pH). However, the pH-dependent adsorption finding for copper showed a cationic-type adsorption behavior. These adsorption trends were explained employing the pH-dependent speciation of the respective pollutants. In general, findings from the present work indicate that a high-specific-surface-area (SSABET) GAC material from the date palm tree branches can be successfully employed for aqueous phase pollution control.
1. Introduction
Activated carbon is widely used for many industrial and environmental applications such as gold recovery, water/wastewater treatment, and air pollution control [1]. Considering this, the production of activated carbon from a variety of materials remains a very active research area, with a special interest also noted in activated carbon production from many waste materials [2,3]. Such efforts also support the ongoing international sustainable development efforts that focus on the 4R philosophy, i.e., reduce, recycle, reuse, and recover. To this end, the use of agricultural wastes for activated carbon production has received special attention, with many research studies reporting high-efficiency activated carbon synthesis from the respective waste materials [4,5,6].
As many countries around the globe have millions of date palm trees for commercial scale date-fruit production and sales, they also generate huge agricultural waste including date pits and date palm tree branches. This is another rich bio-resource for activated carbon production. Indeed, several studies report activated carbon production from several byproducts including date pits and date palm branches [3,5,6,7,8,9,10,11,12,13,14,15,16,17,18,19,20,21,22,23,24,25,26,27,28]. László et al. [27] prepared activated carbon from agricultural by-products. The authors reported that the activation process enhances both the specific surface area and also the adsorption efficiency of the prepared activated carbon samples. With both phenol and 2,3,4-trichlorophenol in the waste stream, the adsorption of the latter was higher compared to the former, probably because of preferential adsorption. Daifullah and Girgis [28] prepared activated carbon from apricot stone shells by chemical treatment with phosphoric acid. The adsorption of various phenol-based pollutants, i.e., phenol (P), m-, p-cresol (Cr), 2-chlorophenol (2-CP), 4-nitrophenol (4-NP), 2,4-dichlorophenol (2,4-DCP), and 2,4-dinitrophenol (2,4-DNP), showed the following trend: P, Cr < 2-CP < 4-NP < 2,4-DNP < 2,4-DCP. Bouchelta et al. [13] investigated the preparation and characterization of activated carbon from date stones using physical activation with steam. The authors used date pits and pyrolysis and physical activation, to produce activated carbon. Furthermore, the effect of pyrolysis temperature and activation hold time on the textural and chemical surface properties of raw date stones and the carbon materials produced was investigated. A pyrolysis temperature of 700 °C, with 100 cm3 per min nitrogen flow, followed by activation under water vapor at 700 °C for 6 h, yielded an activated carbon sample with a specific surface area of 635 m2/g and a micro-pore volume of 0.716 cm3/g. After pyrolysis, the cellulose and hemicellulose in the date pits were converted to carbon and graphite. Furthermore, though the original date pits contained several oxygen-based functional groups, after pyrolysis, aromatic groups were noted to be dominant. However, a comprehensive investigation on the application of activated carbon produced using ‘date palm tree branches’ for aqueous phase pollution control has not been completed to the best of our knowledge. Nevertheless, such a work would be very useful considering the fact that branches trimmed from millions of date palm trees are another rich bio-resource for activated carbon production. The present study has thus investigated the application of granular activated carbon (GAC) from waste ‘date palm tree branches’ for aqueous phase pollution control. To that end, the present work investigated the removal of phenol, p-cresol, and copper as they represent typical organic and inorganic (heavy metal) pollution sources in several industrial wastewater streams.
2. Materials and Methods
All chemicals used for the present study were of high-purity reagent-grade quality. The major chemicals included phenol/C6H5OH (Riedel-de-Haën), p-cresol/C6H4CH3OH (FISHER), potassium dihydrogen phosphate/KH2PO4 (BAKER), HClO4 (BAKER), NaOH (FISHER), pH calibration standards (FISHER), copper calibration standards (BDH), ethanol (Hayman), nitrogen gas (99.999%), helium gas (99.999%), and high-purity liquid nitrogen (at 77 K).
Date palm tree branches obtained from a local source were first trimmed, cut into smaller pieces, and then mixed with phosphoric acid solutions of 20, 40, and 60% (w/w) at impregnation ratios [R (volume-acid/weight-CB)] of 2 and 2.4. The soaking time was 1 h. Each sample prepared under a specific set of conditions (out of the above-mentioned variables) was then transferred into stainless steel tubes (25 mm inner diameter and 300 mm length) via screw-type end caps. The tubes also had two narrow ports of 1 mm diameter at both ends to expel any reaction gasses. The tubes were then transferred inside a muffle furnace (AWF 12/42 Muffle Furnace, Lenton, UK) which was gradually heated at a rate of 5 °C/min up to the desired hold temperature value which was then maintained for a hold time value of 1 h. The hold temperature values were 500, 600, and 700 °C. At the end of each individual run, the respective sample was transferred to a desiccator and upon cooling, was subjected to thorough washing using deionized water until the wash-water showed pH ≈ 7; the pH analyses were completed using a pH meter setup (ORION, La Verne, CA, USA) that was also regularly calibrated using the pH calibration standards. The washed samples was completely drained and then dried in an oven (750F ISO Temp Oven, FISHER, Waltham, MA, USA) at 120 °C. At all times, the samples were stored in enclosed containers to avoid any cross-contamination.
The Brunauer–Emmett–Teller or BET specific surface area (SSABET) values for the produced GAC samples were determined at 77 K using an automatic specific surface area analyzer (ASAP 2020, MICROMERITICS, Norcross, GA, USA) and high-purity nitrogen gas/liquid. Phenol was analyzed using a UV-Vis spectrophotometer (UV-1601 PC, SHIMADZU, Kyoto, Japan). An appropriate sample volume was transferred into the UV-Vis test cuvette, and to this two drops of phosphate (KH2PO4) buffer solution were added. After this, the sample was transferred to the UV-Vis spectrophotometer and absorbance at 269 nm wavelength was noted. The UV-Vis spectrophotometer was calibrated, using specific phenol standards, before each regular analysis. p-Cresol analysis was also completed using the same UV-Vis Spectrophotometer setup at an absorbance wavelength of 270 nm, with the rest of the procedure being similar to phenol analysis. Copper was analyzed employing an atomic absorption spectrophotometer setup (AVANTA, GBC, Regents Park, NSW, Australia). The AAS setup was always calibrated using the respective metal species standards.
For each adsorption isotherm experiment, a set of clean glass bottles (of equal and appropriate size) was first arranged. After this, GAC quantities typically between 0 and 1.0 g per 100 mL solution were transferred to the individual glass bottles. A blank sample bottle with no GAC was also always included to account for any pollutant loss for reasons other than adsorption. Batches of synthetic wastewater samples were prepared using high-purity water (CORNING Mega PureTM System, Nicholasville, KY, USA) and stock solutions of the respective chemicals. Each bottle for the respective adsorption isotherm experiment was then filled with 100 mL of the target pollutant synthetic wastewater. These bottles were then appropriately sealed, transferred to a shaker (G-10 Shaker, Newbrunswick, NJ, USA), and allowed to equilibrate (for days), after which samples were retrieved from each bottle, followed by the re-sealing and transferring of the set of bottles back to shaker. The retrieved samples were then filtered through a 0.2 μm 25 mm Ø cellulose nitrate membrane filter (WHATMAN, Dassel, Germany) for the effective removal of any particulate matter, and then analyzed for the target pollutant species. This procedure of bottle shaking and sample analyses continued until we noted adsorption equilibrium, i.e., no change in target pollutant concentration with time. The respective adsorption data were then fitted to both Langmuir and Freundlich adsorption isotherms; the Langmuir adsorption isotherm that provided better results is given as: qe = [X/M] = [abCe/(1 + bCe)]. The notations in the above model include X = Amount of pollutant adsorbed at equilibrium = Co − Ce (mg/L); Co = Pollutant’s influent concentration at time zero (mg/L); Ce = Pollutant’s aqueous concentration at equilibrium (mg/L); M = Carbon mass (mg/L); qe = Amount adsorbed at equilibrium/amount of adsorbent at equilibrium; a = Maximum amount adsorbed at equilibrium/amount of adsorbent; and b = Empirical constant (L/mg). The Langmuir adsorption isotherm was linearized as [Ce/(X/M)] = [1/ab] + [(1/a) Ce].
The pH-dependent adsorption studies were conducted using 0.3 g of GAC per 100 mL of target pollutant solution. Again, for each ‘pH vs. adsorption’ experiment, a set of clean glass bottles, with each bottle containing 100 mL of the respective synthetic wastewater sample and a GAC amount equivalent to 0.3 g/100 mL of synthetic wastewater, was first arranged. A blank sample (without GAC and pH adjustment) was also retrieved. The initial pH of each 100 mL sample was measured and adjusted to the desired value using HClO4 or NaOH solutions. The respective sample bottles were then appropriately sealed, transferred to the shaker, and allowed to equilibrate (using the procedure described above for the adsorption isotherm modeling). During each sample retrieval cycle, the samples were first tested for the final equilibrium pH, filtered, and then analyzed for the target pollutant concentration. This procedure continued until adsorption equilibrium was reached. For each adsorption kinetics experiment, we added 2 g of GAC sample to a 1 L batch of synthetic wastewater along with vigorous stirring, and samples were collected at regular time intervals, followed by the target pollutant species analyses and data fitting for ‘reaction order’ determination. The continuous flow column studies were completed using a down-flow plexi-glass column setup, with an inner diameter of 1 cm and a bed length of 15 cm, containing 4 g GAC, that was appropriately secured at the bottom and top using glass-beads and glass-wool supports. The synthetic wastewater was passed through the GAC-packed column at the desired flow rate, and samples were collected at several time intervals. The breakthrough curve was then drawn using the respective data from each continuous column adsorption study.
3. Results
During the initial phase of this research work, several GAC samples were produced employing methodology described earlier [22] and also in the Materials and Methods section. In summary, the GAC sample that was prepared using 40% phosphoric acid at an impregnation ratio of 2, a furnace temperature of 700 °C, and a furnace time of 1 h yielded an SSABET value of ~800 m2/g, which was not significantly lower compared to other high-SSABET-value GAC samples produced in the present study. Furthermore, it was also comparable to the SSABET value of some widely used commercial GAC samples, e.g., FiltraSorb 400 with an SSABET value of 993 m2/g [3]. The pore volume and average pore size using 4V/A by BET values [23] for this specific GAC sample were 0.437 cm3/g and 30.3 Å, respectively.
3.1. Phenol Adsorption
After finishing phase 1, we began to investigate the pollution control efficiency of the selected GAC sample for phenol, p-cresol, and copper adsorption. The phenol adsorption equilibrium isotherm data were first obtained employing the procedure mentioned in the experimental section. The respective adsorption data were fitted to both Langmuir and Freundlich adsorption isotherms. However, the Langmuir adsorption isotherm, i.e., [Ce/(X/M)] = [1/ab] + [(1/a) Ce], provided a better fit; the respective results are given in Figure 1a.
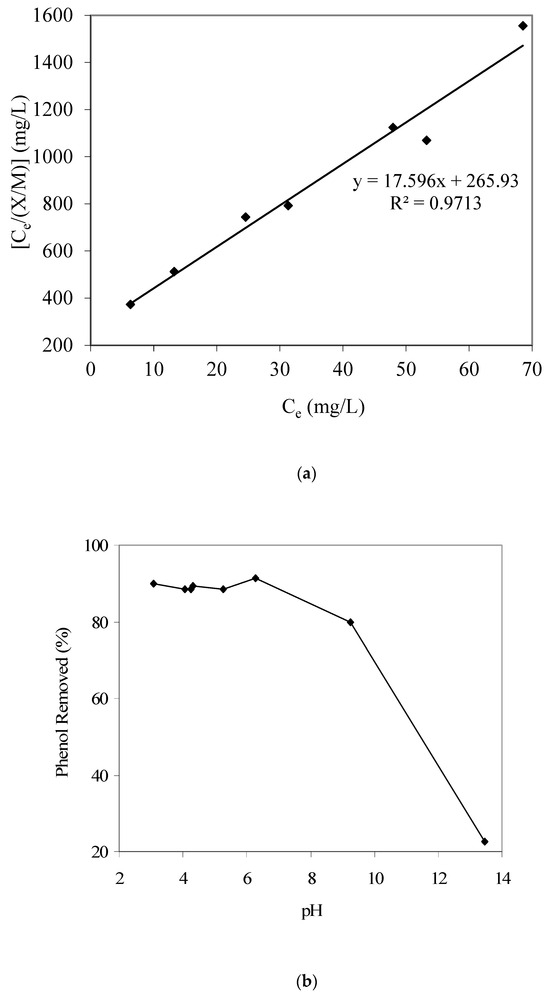
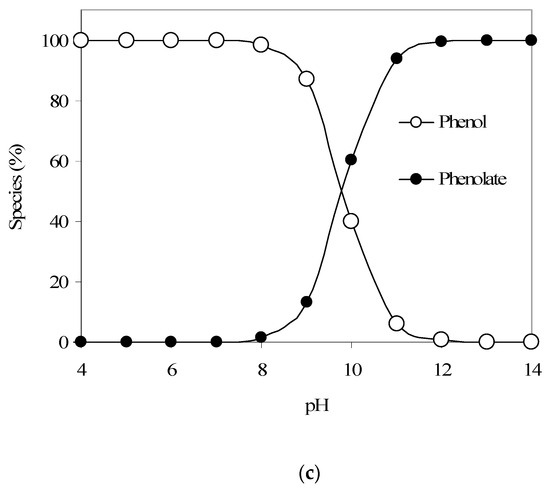
Figure 1.
(a) Langmuir adsorption isotherm parameter fitting for phenol adsorption modeling. (b) Results of phenol removal vs. pH (GAC: 3000 mg/L; initial phenol concentration: 80 mg/L). (c) Calculated qualitative phenol speciation trends with respect to aqueous pH (using pKa 9.82).
The Langmuir adsorption isotherm constant ‘a’ was 0.0568 and constant ‘b’ was 0.066 L/mg. Therefore, in summary, the phenol adsorption model is as follows: qe = [X/M] = [abCe/(1 + bCe)] = [(0.0568)(0.066) Ce]/[(1 + (0.066) Ce)]. Banat et al. [11], who studied methylene blue adsorption equilibrium using date pit-based GAC, also reported that the Langmuir isotherm well described the adsorption equilibrium. Mohan et al. [24], who prepared activated carbon from coconut shells using acid treatment and studied its use for the removal of α-picoline, β-picoline, and γ-picoline from the aqueous phase, also reported that the adsorption equilibrium best fitted to the Langmuir adsorption model. Also, the maximum phenol adsorption capacity for the batch mode was determined to be 56.8 mg/g. Furthermore, Figure 1b provides the pH-dependent adsorption trend for phenol and shows a decreasing phenol adsorption with an increase in pH. We also note a significant and sharp decrease in phenol adsorption above pH 9. Such a pH-dependent phenol adsorption can be explained using changes in phenol and GAC-surface speciation with a change in aqueous pH.
Figure 1c provides the phenol aqueous speciation trends and shows that above pH 9, a significant portion of phenol would start to convert from neutral phenol species to anionic phenolate species (considering a phenol pKa of 9.82). Hence, such a change in the phenol speciation apparently causes the noted decrease in phenol adsorption on the produced GAC sample at higher pH values. Furthermore, the point of zero charge pHpzc for the present GAC was determined to be around 8, which also matches the aforementioned phenol adsorption results; i.e., at pH higher than 8, the surface of GAC would start to be anionic and hence the adsorption of anionic species such as phenolate will be less favorable, as noted in the present work.
Furthermore, the GAC surface functional groups may add to the noted pH-dependent phenol adsorption trend. Chen and Wu [25] identified various acidic functional groups as adsorption sites on the GAC surface. El-Hendawy [26], who investigated biomass-based activated carbon (prepared employing phosphoric acid activation), also reported the development of oxygen-containing surface acidic groups including lactonic, carbonyl, phenolic, hydroxylic, and carboxylic groups. We therefore propose that at higher pH values, the conversion of both phenol (to phenolate species) and the GAC surface functional groups to the anionic forms significantly influences the adsorption of the target pollutant, i.e., phenol (total), at the GAC surface sites because of electrostatic repulsion. This effect is certainly more prominent at pH higher than the pKa of phenol (i.e., 9.82).
The phenol adsorption kinetics results are provided in Figure 2a. The findings show a sharp uptake of phenol by GAC until 40 min. During this time period, approx. 60% phenol is being adsorbed by GAC. However, after 40 min, the adsorption kinetics seems to be slower. The saturation of surface adsorption sites and macro-pores at an earlier stage may leave mostly the meso-pores and micro-pores available for any further adsorption at a later stage. This may cause a slower phenol uptake by the GAC sample at a later time. However, up to 90% phenol removal does transpire by 175 min.
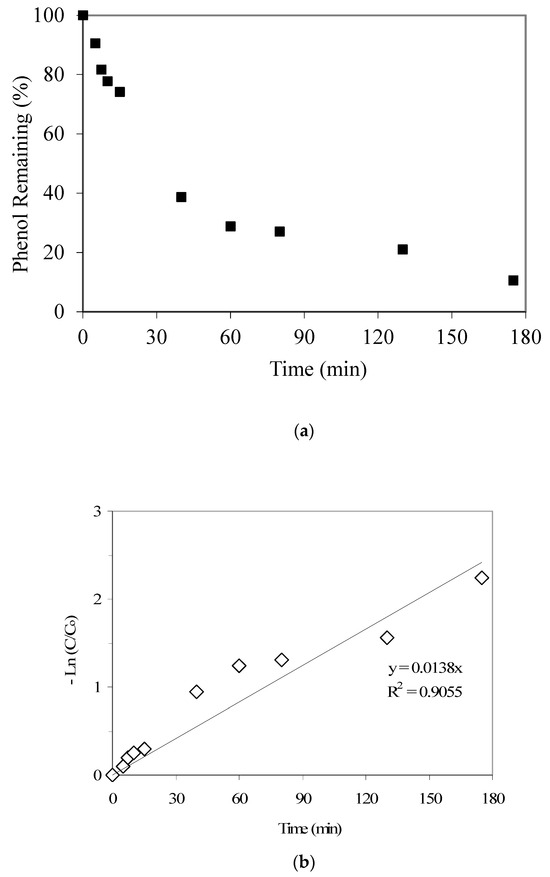
Figure 2.
(a) Results from the phenol adsorption kinetics experiment (the initial phenol and GAC were 21 mg/L and 2000 mg/L, respectively). (b) Phenol adsorption: data fitting to first-order kinetics (the initial phenol and GAC were 21 mg/L and 2000 mg/L, respectively).
Furthermore, Figure 2b shows that phenol adsorption on the GAC sample follows a first-order kinetics, with a rate constant equal to 0.0138 1/min. Also, results from a continuous flow adsorption experiment conducted at an initial phenol concentration of 50 mg/L and a flow rate of 1 mL/min showed an insignificant breakthrough even up to 420 min. However, findings from an experiment using 100 mg/L phenol and a continuous flow rate of 4 mL/min showed that a C/Co value of 0.11 is achieved at 60 min, with near-complete column saturation occurring at around 700 min (C is the pollutant concentration at time t). This indicates better phenol mass transfer at lower flow rate and phenol concentration.
3.2. p-Cresol Adsorption
The p-cresol adsorption equilibrium data from the present work were also fitted to both Langmuir and Freundlich adsorption isotherms. Similar to the phenol results, the Langmuir adsorption isotherm provided a better fit for p-cresol adsorption, as shown in Figure 3a. The value of the respective Langmuir isotherm constant ‘a’ was 0.083 and that of constant ‘b’ was 0.112 L/mg. This also yielded the maximum p-cresol adsorption capacity for the batch mode at 83 mg/g. On the other hand, the maximum phenol adsorption capacity for the batch mode was determined to be 56.8 mg/g, which indicates that p-cresol adsorbs better on the respective GAC surface. In fact, the other p-cresol adsorption results, reported later in this section, also support this observation.

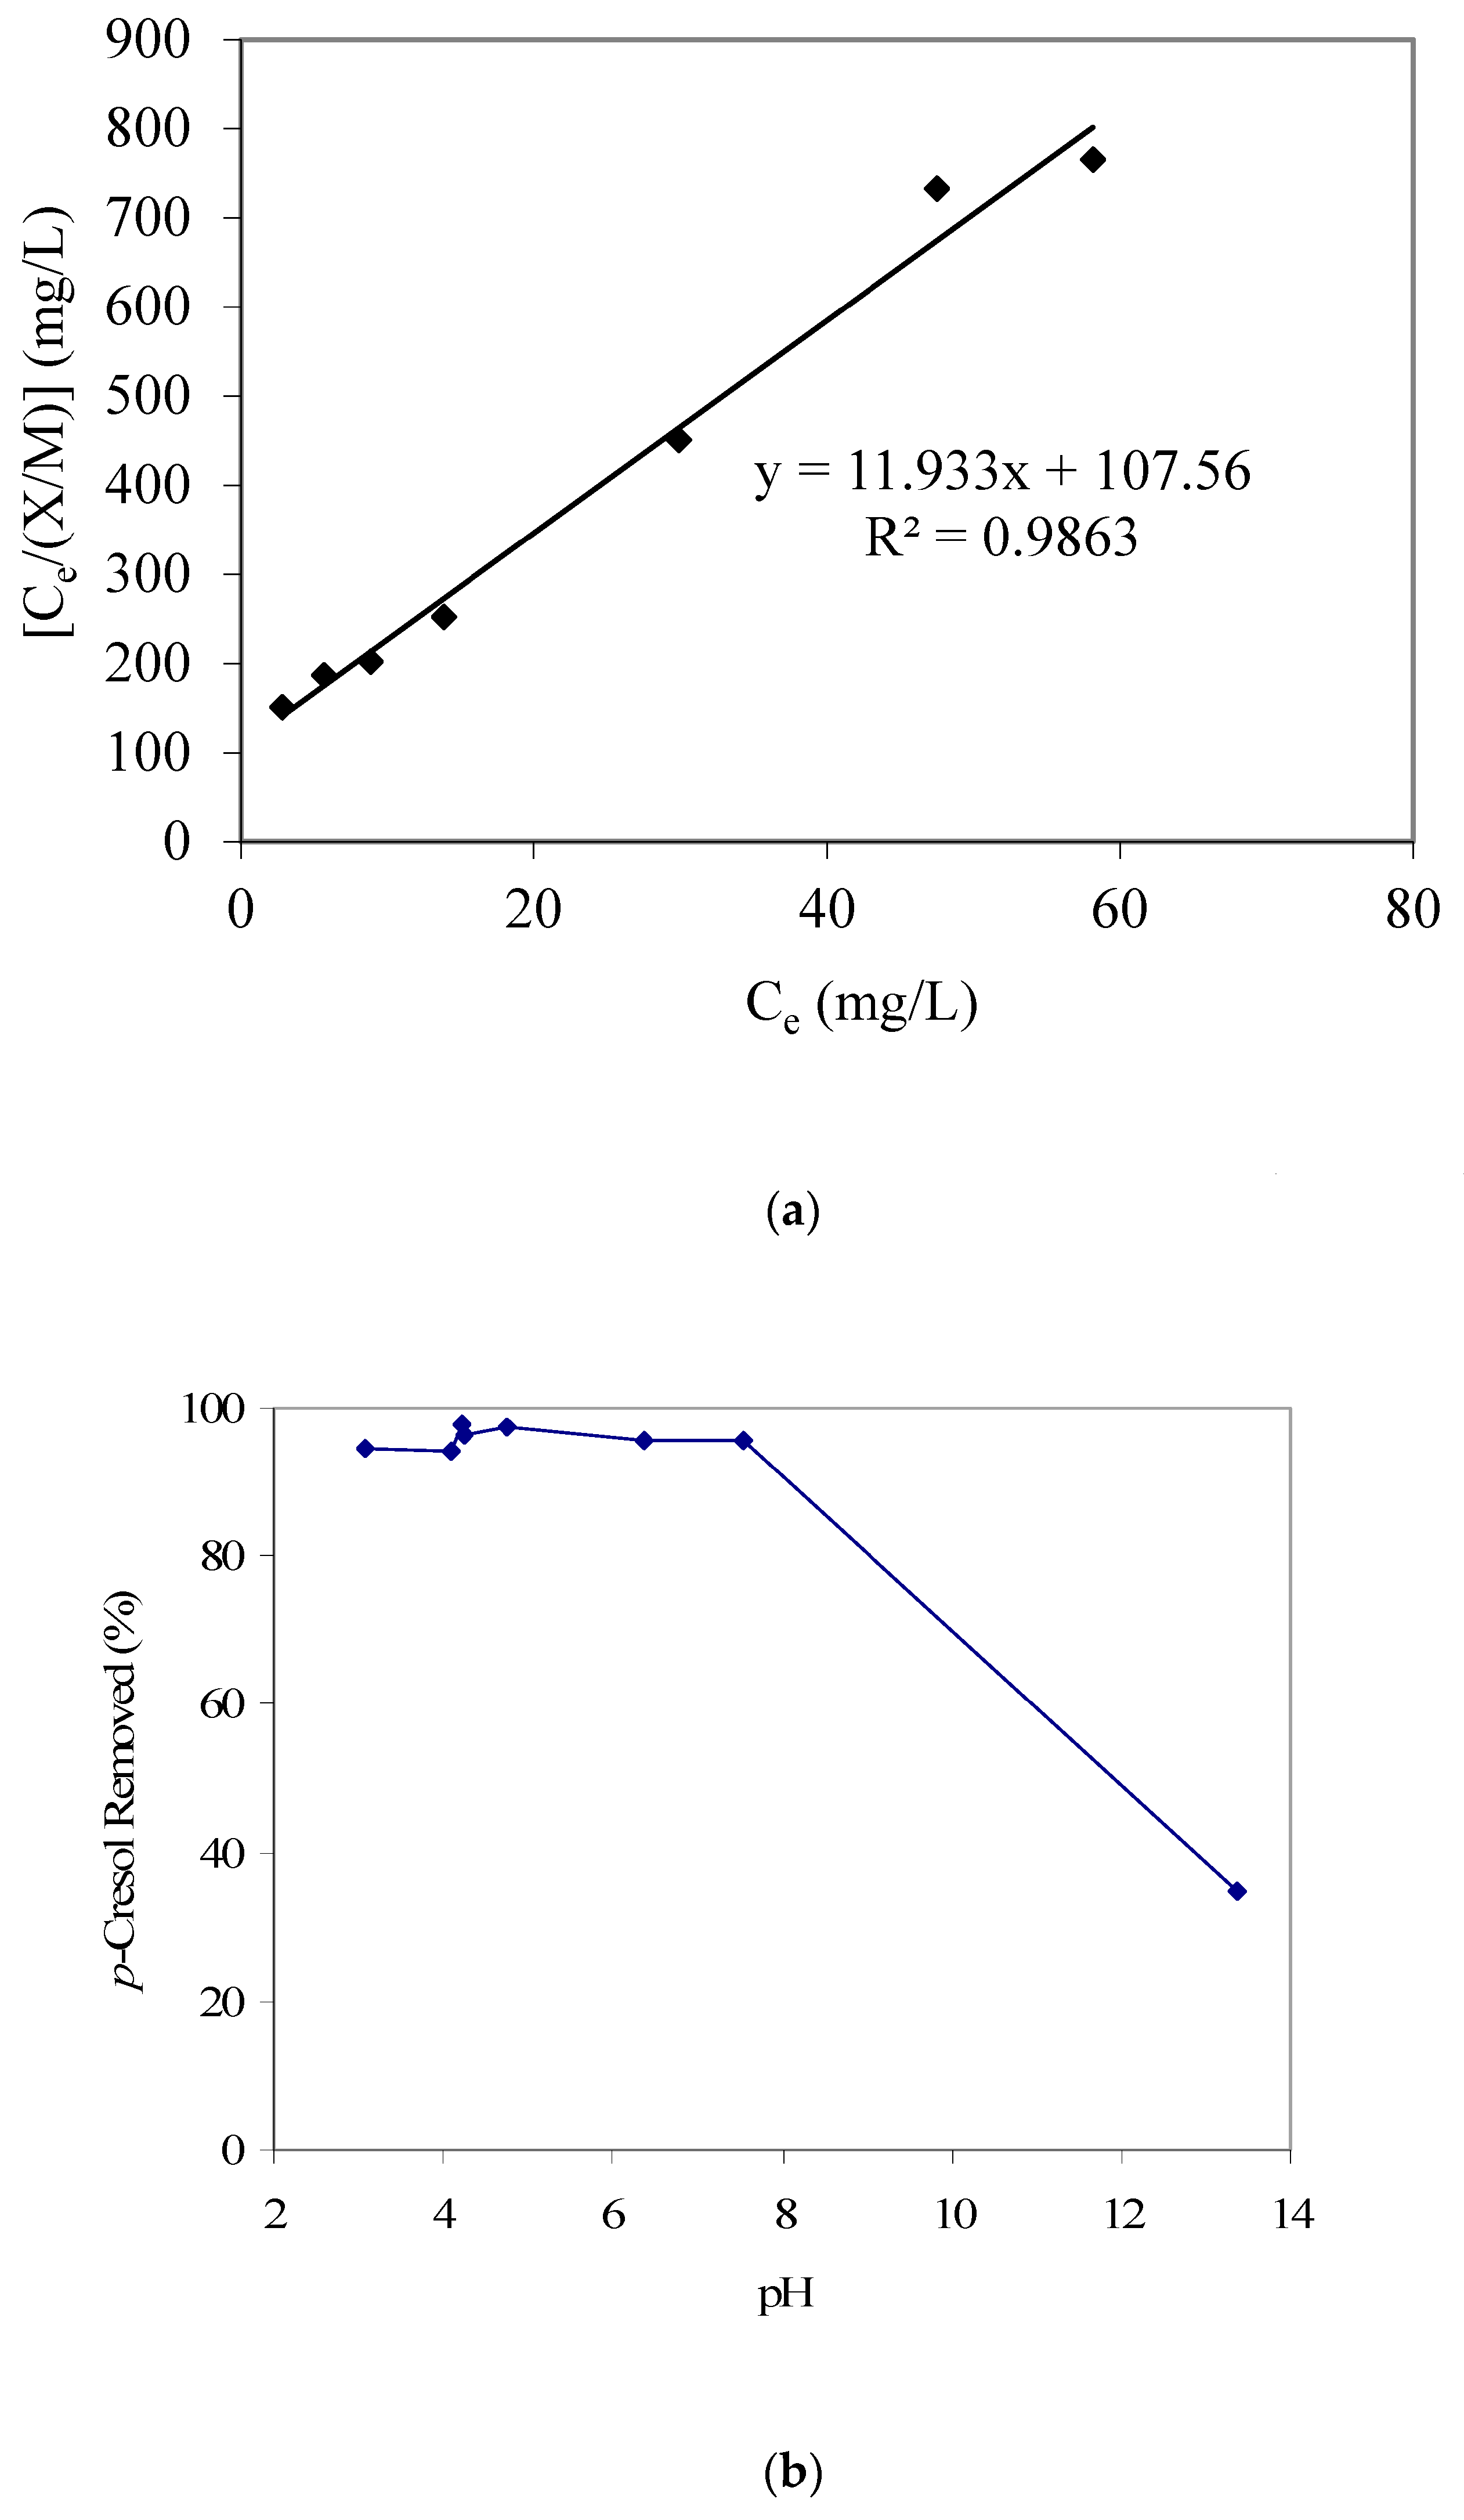
Figure 3.
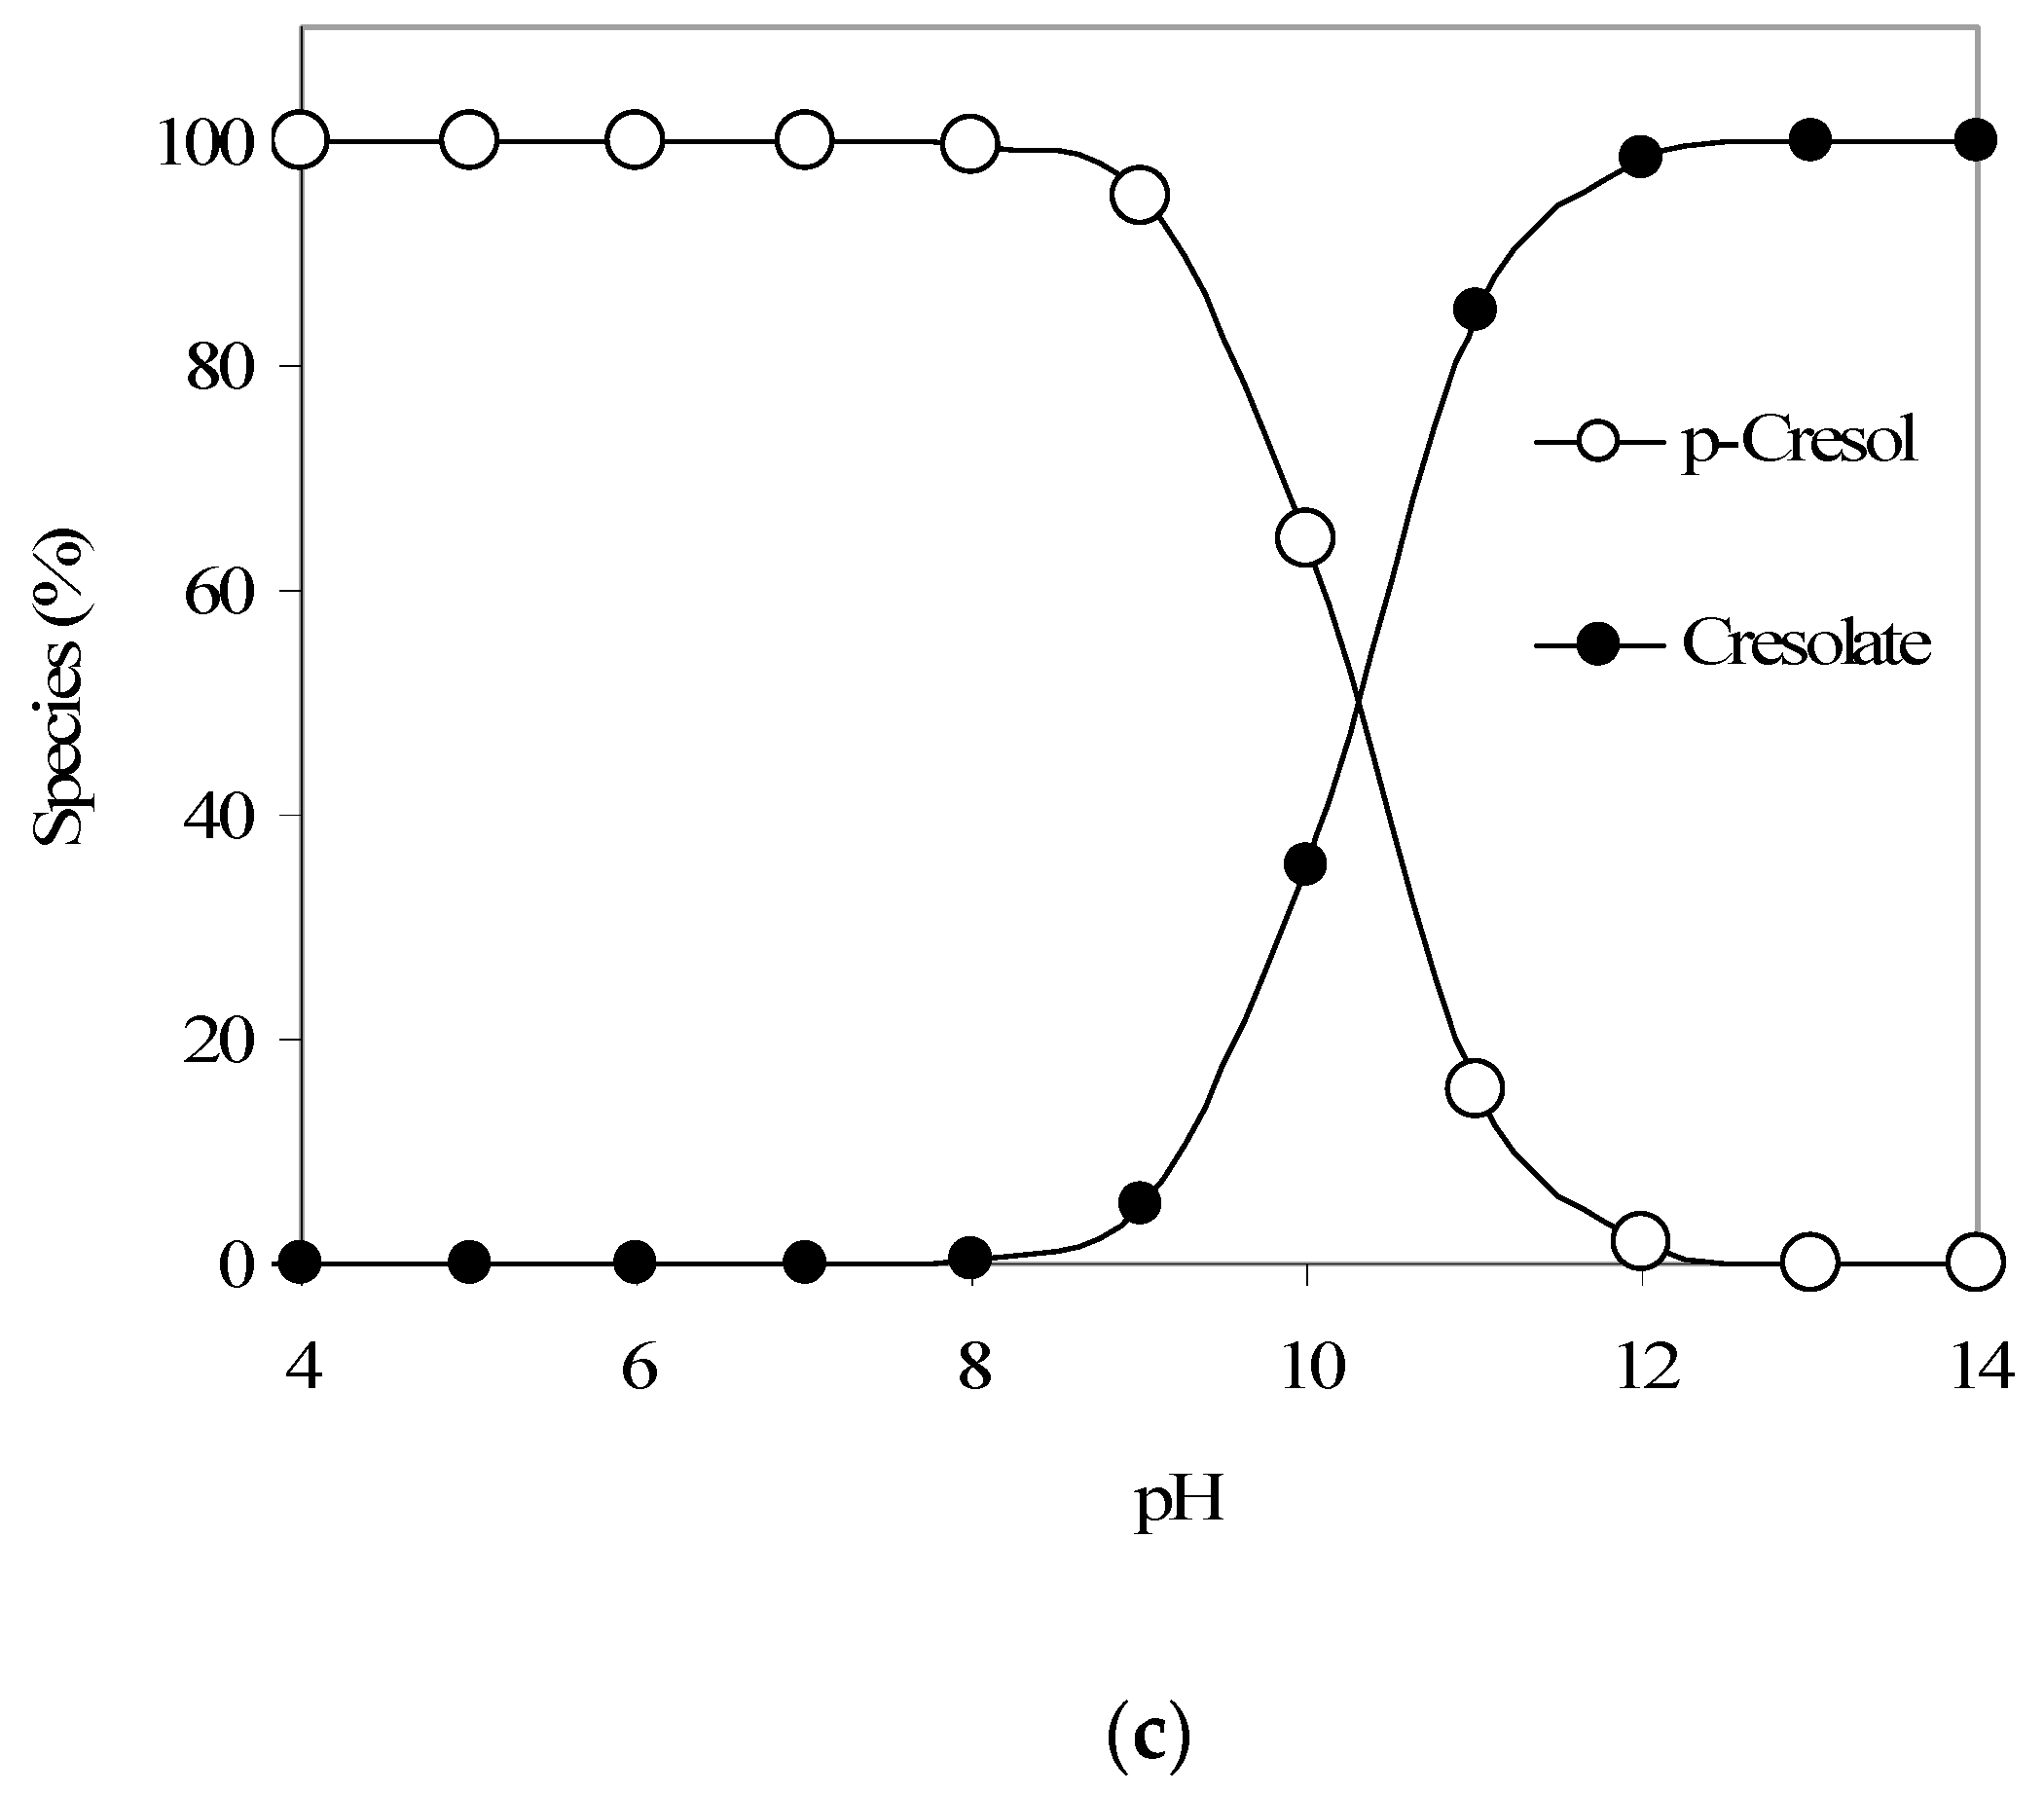
(a) Langmuir adsorption isotherm parameter fitting for p-cresol adsorption modeling. (b) Results of p-Cresol removal vs. pH (GAC: 3000 mg/L; initial p-cresol concentration: 100 mg/L). (c) Calculated qualitative p-cresol speciation trends with respect to aqueous pH (using pKa 10.26).
Furthermore, the pH-dependent p-cresol adsorption trend as given in Figure 3b also shows a decreasing p-cresol adsorption with an increase in pH. Figure 3c provides the p-cresol aqueous speciation trends and shows that above pH 10, a significant portion of p-cresol would start to convert from neutral p-cresol species to anionic cresolate species (considering a p-cresol pKa of 10.26). Also, the speciation of GAC surface functional groups, as discussed earlier, may add to the noted pH-dependent p-cresol adsorption trend. Hence, we propose that at higher pH values, the conversion of both p-cresol (to cresolate species) and the GAC surface functional groups to the anionic forms significantly influences the adsorption of p-cresol (total) because of electrostatic repulsion.
Figure 4a provides the p-cresol adsorption kinetics results and indicates significant p-cresol uptake up to 60 min (i.e., 72%), after which the adsorption kinetics seems to be slower. The respective kinetic data fitting results, as given in Figure 4b, show a first-order kinetics with a rate constant equal to 0.0165 1/min. This value is somewhat higher than the aforementioned phenol adsorption rate constant of 0.0138 1/min. László et al. [27], who prepared activated carbon from agricultural by-products, also noted lower phenol adsorption compared to 2,3,4-trichlorophenol and ascribed it to the preferential adsorption of the latter. Daifullah and Girgis [28], who prepared activated carbon from apricot stone shells by chemical treatment with phosphoric acid, also reported lower phenol adsorption compared to substituted phenols. We suggest that the differences in the stereochemistry of the two pollutants, i.e., phenol and p-cresol, may explain the aforementioned differences in their adsorption kinetics trends.
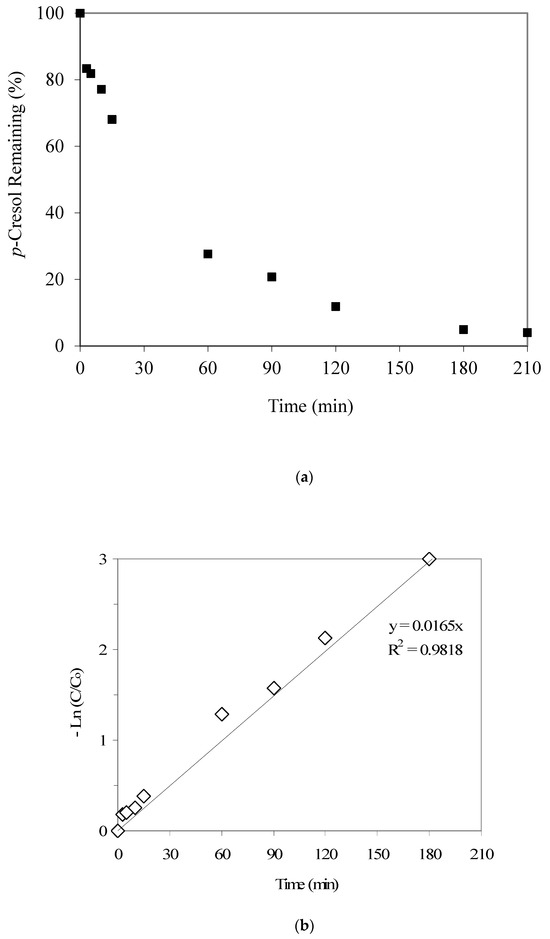
Figure 4.
(a) Results from the p-cresol adsorption kinetics experiment (the initial p-cresol and GAC were 21 mg/L and 2000 mg/L, respectively). (b) p-cresol adsorption: data fitting to first-order kinetics (the initial p-cresol and GAC were 21 mg/L and 2000 mg/L, respectively).
Furthermore, findings from the p-cresol continuous flow adsorption column study, completed at an initial p-cresol concentration of 100 mg/L and a flow rate of 4 mL/min, showed that a C/Co of 0.10 is reached at 120 min and a C/Co of 0.84 at 915 min (Figure 5). Under similar conditions (as reported earlier), the respective phenol removal results showed a C/Co of 0.11 reached at around 60 min, with near-complete column saturation at around 700 min. These findings, along with the respective adsorption isotherm data and also the kinetics results, indicate that the produced GAC has a better affinity for p-cresol compared to phenol adsorption, though in both cases the wastewater treatment efficiency is encouraging.
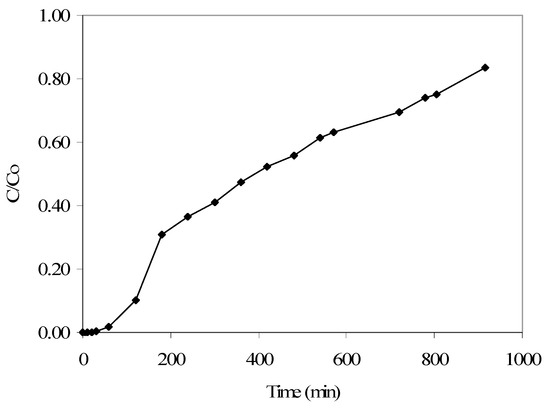
Figure 5.
Breakthrough curve obtained from the continuous flow column study results for p-cresol adsorption (initial p-cresol: 100 mg/L; flow rate: 4 mL/min).
3.3. Copper Adsorption
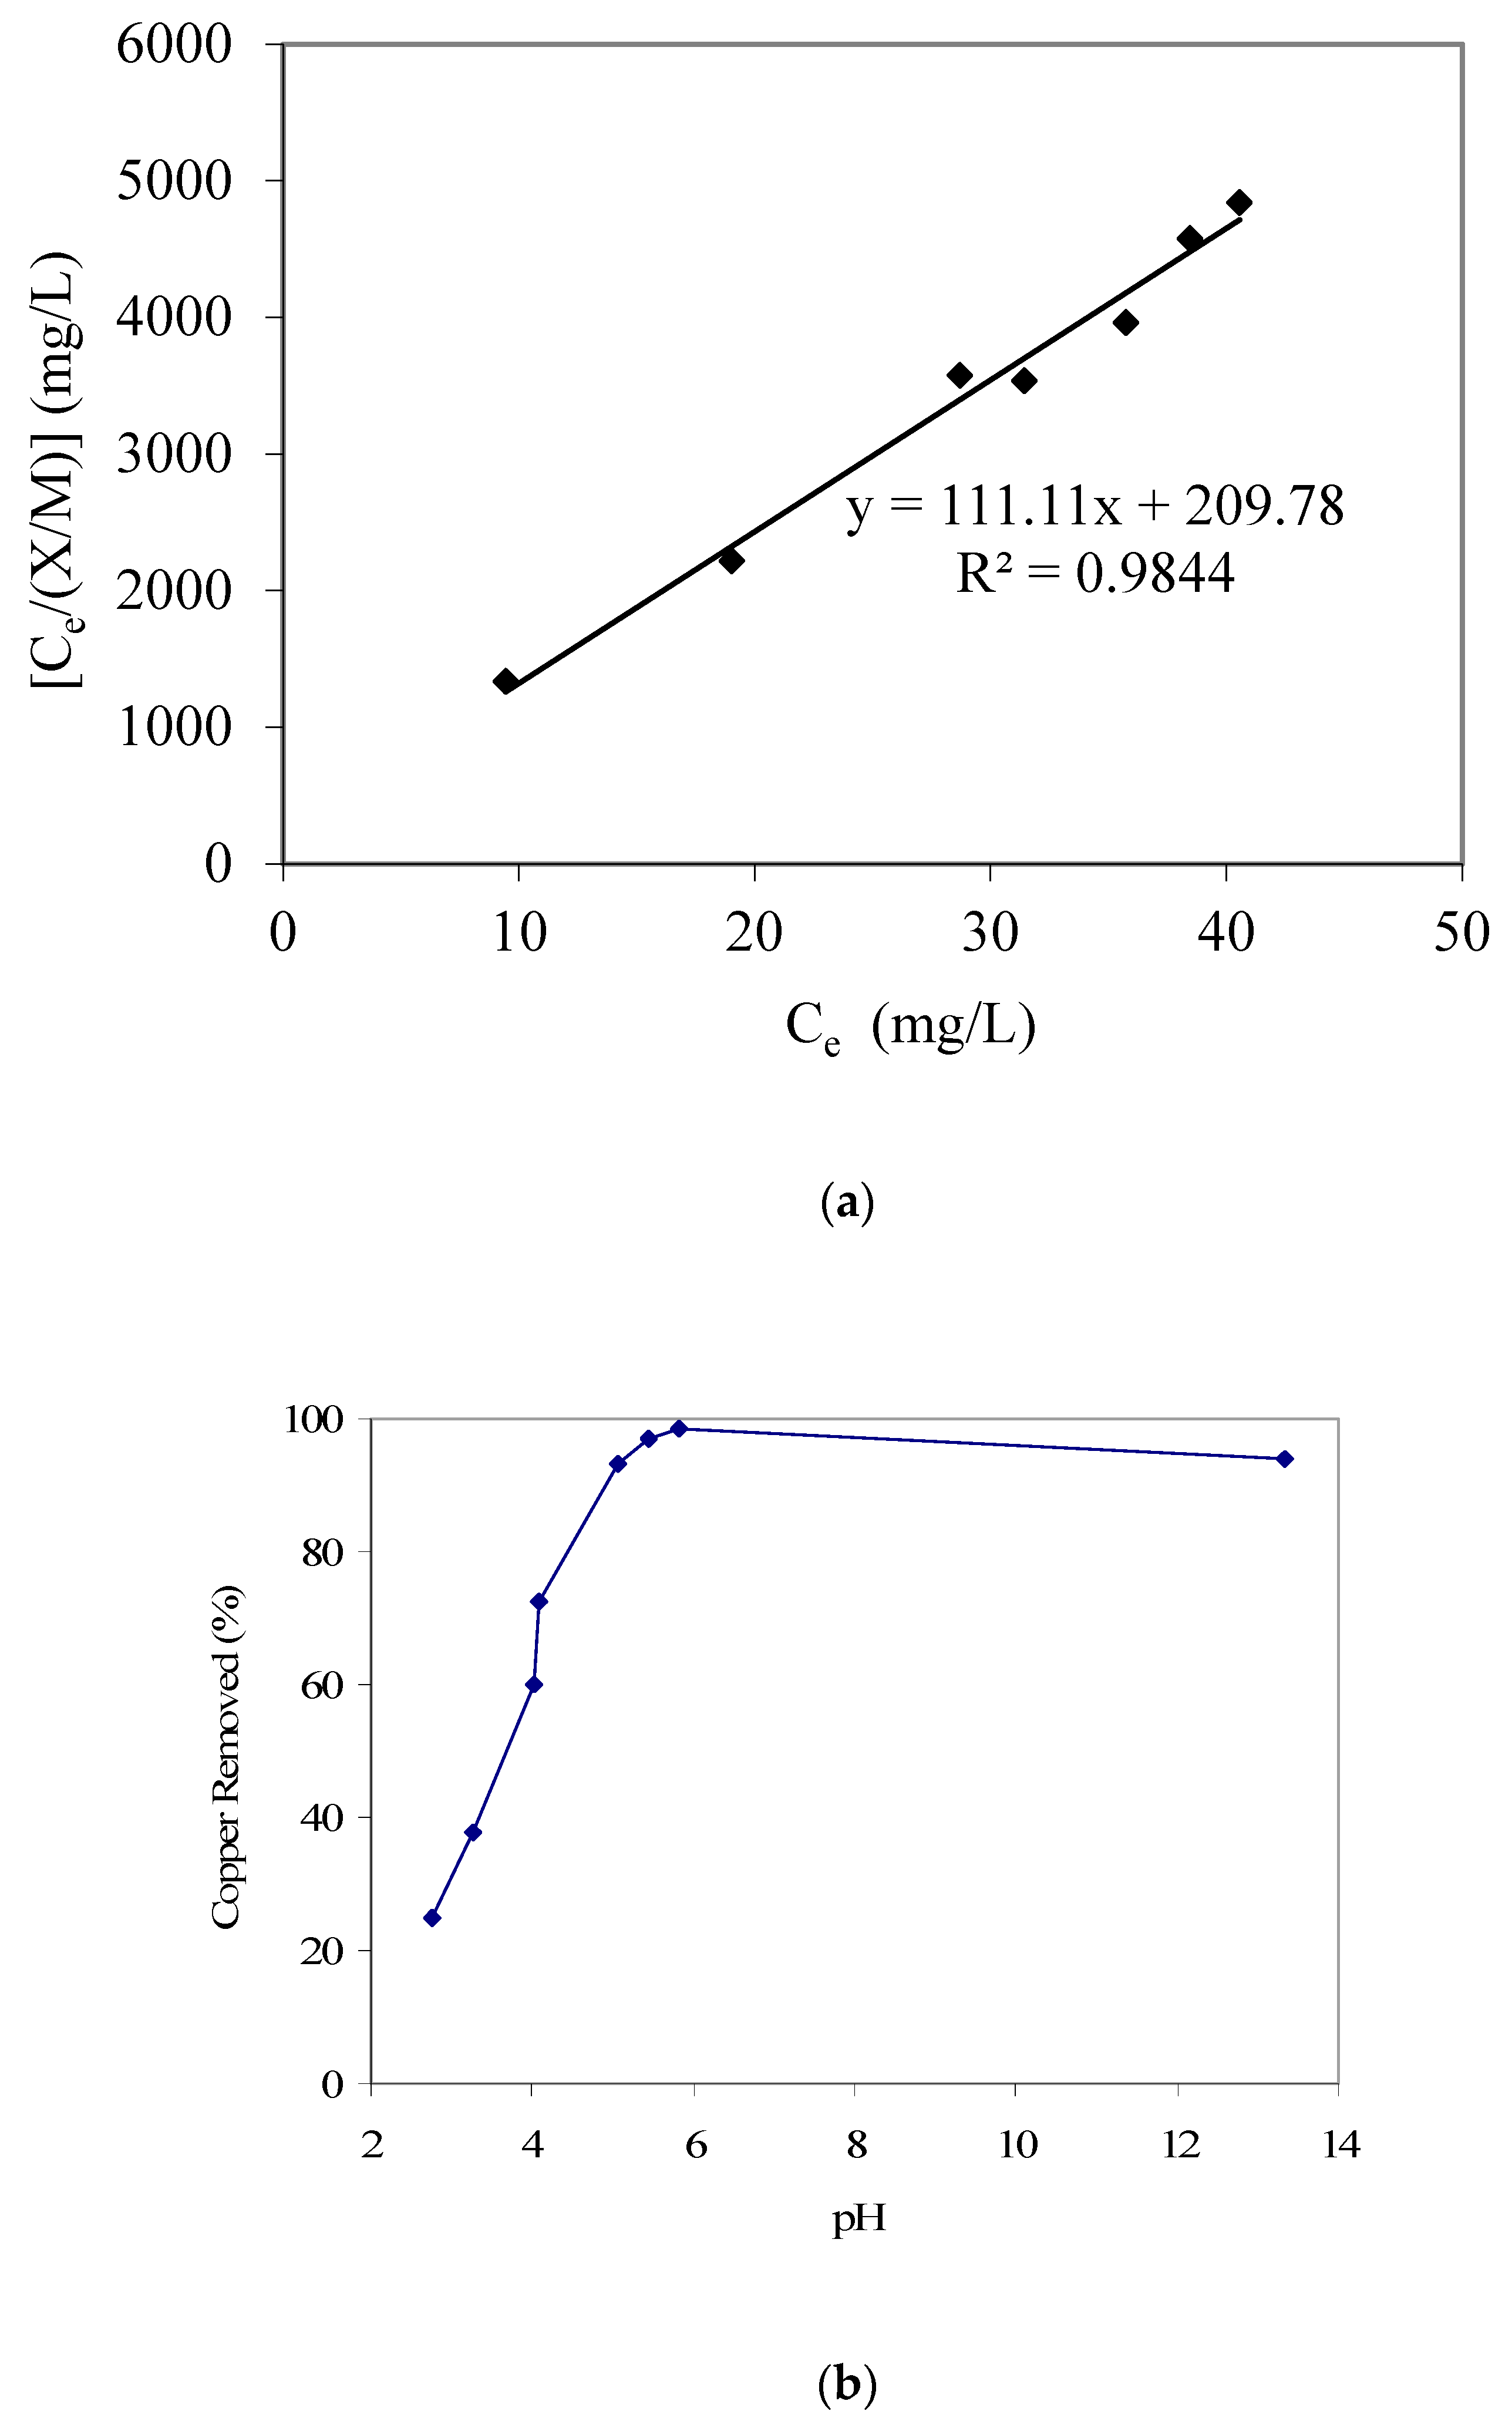
Along with water pollution resulting from organic contaminants, several heavy metal species also negatively impact water quality and hence require appropriate treatment [29,30,31,32,33,34,35]. Therefore, the removal of aqueous phase copper species, using the date palm branch-based GAC, was also investigated. Similar to phenol and p-cresol studies, the Langmuir adsorption isotherm provided a better fit for copper adsorption, with results given in Figure 6a. The value of the respective Langmuir adsorption modeling constant ‘a’ was 0.009 and that of constant ‘b’ was 0.529 L/mg. Furthermore, the pH-dependent adsorption trend for copper is provided in Figure 6b. Different from the previously reported trends for phenol and p-cresol, we note increasing copper removal with an increase in pH. We suggest that the GAC acidic surface functional groups [25] that will be predominantly present in the anionic forms at higher pH will favor cationic copper attachment. Such an electrostatic attraction-initiated adsorption is also conducive for cationic organic pollutants; for example, Banat et al. [11], who studied cationic methylene blue dye adsorption equilibrium using date pit-based GAC, also reported an increase in adsorption with an increase in solution pH. Kadirvelu et al. [36], who produced activated carbon from coir pith agricultural waste and used that for the removal of several heavy metals including Cu(II), also reported that the percent metal removal increased in a pH range of 2 to 6, after which a constant trend was noted until a pH of 10. On the other hand, El-Nemr et al. [16], who investigated aqueous phase chromium removal using GAC produced from date pits, reported that the adsorption efficiency was enhanced with a decrease in pH value, which could be explained based on the anionic speciation of hexavalent chromium. A similar trend was reported by Selvi et al. [37], who also studied hexavalent chromium adsorption on activated carbon from coconut tree sawdust. However, a high copper removal at high pH, as noted in the present study, can also partially result from precipitation.
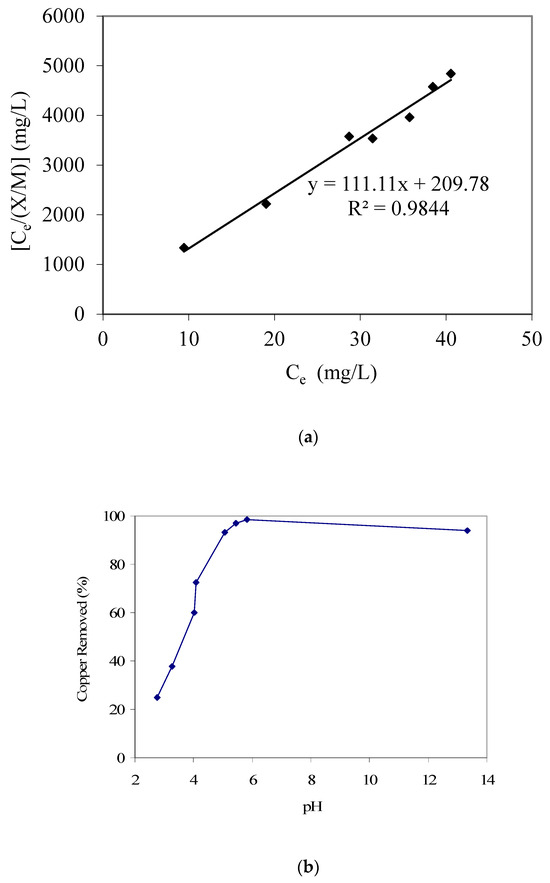
Figure 6.
(a) Langmuir adsorption isotherm parameter fitting for copper adsorption modeling. (b) Results of copper removal vs. pH (GAC: 3000 mg/L; initial copper concentration: 50 mg/L).
4. Conclusions
The results from the present investigation show that the application of high-specific-surface-area granular activated carbon (GAC) produced from an agricultural waste, i.e., date palm tree branches, can be successfully used for the removal of aqueous pollutants phenol, p-cresol, and copper. The adsorption equilibrium results from all pollutants seemed to follow the Langmuir adsorption isotherm model. The adsorption results following the Langmuir isotherm indicate a monolayer coverage along with bonding with specific surface sites. The maximum p-cresol adsorption capacity was noted at 83 mg/g. On the other hand, the maximum phenol adsorption capacity was determined to be 56.8 mg/g, which indicated that p-cresol adsorbs better on the GAC surface. However, copper showed a comparatively lower adsorption capacity of 9 mg/g. Also, the pH-dependent adsorption results for phenol/p-cresol and copper indicated to follow an anionic- and cationic-type adsorption behavior, respectively. Additionally, the adsorption kinetics data for phenol and p-cresol indicated a first-order rate. In summary, the results from the present study indicate that high-specific-surface-area granular activated carbon produced from date palm tree branches can be successfully used to remove phenol, p-cresol, and copper from the aqueous phase.
Author Contributions
M.V. and M.A.-S. contributed towards all aspects including conceptualization, experimental, and writing the manuscript. All authors have read and agreed to the published version of the manuscript.
Funding
The authors are thankful to the Deanship of Research at KFUPM (FT161012) for their support.
Institutional Review Board Statement
Not applicable.
Informed Consent Statement
Not applicable.
Data Availability Statement
The raw data supporting the conclusions of this article will be made available by the authors on request.
Acknowledgments
The authors are thankful to the King Fahd University of Petroleum and Minerals (KFUPM) for providing the lab facilities and to the Deanship of Research at KFUPM for their support.
Conflicts of Interest
The authors declare no conflicts of interest.
References
- Dabhade, M.A.; Saidutta, M.B.; Murthy, D.V.R. Adsorption of phenol on granular activated carbon from nutrient medium: Equilibrium and kinetic study. Int. J. Environ. Res. 2009, 3, 557. [Google Scholar]
- Ahmadpour, A.; King, B.A.; Do, D.D. Comparison of equilibria and kinetics of high surface area activated carbon produced from different precursors and by different chemical treatments. Ind. Eng. Chem. Res. 1998, 37, 1329. [Google Scholar] [CrossRef]
- Vohra, M.; Hussaini, M.; Mohammed, T. Olive branches activated carbon: Synthesis, phenol adsorption and modeling. Chem. Pap. 2023, 77, 485. [Google Scholar] [CrossRef]
- Pollard, S.J.T.; Fowler, G.D.; Sollars, C.J.; Perry, R. Low-cost adsorbents for wasteand wastewater treatment: A review. Sci. Total Environ. 1992, 116, 31. [Google Scholar] [CrossRef]
- Daifullah, A.A.M.; Girgis, B.S. Impact of surface characteristics of activated carbon on adsorption of BTEX. Colloids Surf. A Physicochem. Eng. Asp. 2003, 214, 181. [Google Scholar] [CrossRef]
- Demirbas, A. Agricultural based activated carbons for the removal of dyes from aqueous solutions: A review. J. Hazard. Mater. 2009, 167, 1–9. [Google Scholar] [CrossRef]
- Alhamed, Y.A. Adsorption kinetics and performance of packed bed adsorber for phenol removal using activated carbon from dates’ stones. J. Hazard. Mater. 2009, 170, 763. [Google Scholar] [CrossRef]
- Abdulkarim, M.; Abu Al-Rub, F. Adsorption of lead ions from aqueous solution onto activated carbon and chemically-modified activated carbon prepared from date pits. Adsorpt. Sci. Technol. 2004, 22, 119. [Google Scholar] [CrossRef]
- Al-Muhtaseb, S.A.; El-Naas, M.H.; Abdallah, S. Removal of aluminum from aqueous solutions by adsorption on date-pit and BDH activated carbons. J. Hazard. Mater. 2008, 158, 300. [Google Scholar] [CrossRef]
- Awwad, N.S.; Daifuallah, A.A.M.; Ali, M.M.S. Removal of Pb2+, Cd2+, Fe3+, and Sr2+ from aqueous solution by selected activated carbons derived from date pits. Solvent Extr. Ion Exch. 2008, 26, 764. [Google Scholar] [CrossRef]
- Banat, F.; Al-Asheh, S.; Al-Makhadmeh, L. Evaluation of the use of raw and activated date pits as potential adsorbents for dye containing waters. Process Biochem. 2003, 39, 193. [Google Scholar] [CrossRef]
- Belhachemi, M.; Rios, R.V.R.A.; Addoun, F.; Silvestre-Albero, J.; Sepúlveda-Escribano, A.; Rodríguez-Reinoso, F. Preparation of activated carbon from date pits: Effect of the activation agent and liquid phase oxidation. J. Anal. Appl. Pyrolysis 2009, 86, 168. [Google Scholar] [CrossRef]
- Bouchelta, C.; Medjram, M.S.; Bertrand, O.; Bellat, J.-P. Preparation and characterization of activated carbon from date stones by physical activation with steam. J. Anal. Appl. Pyrolysis 2008, 82, 70. [Google Scholar] [CrossRef]
- Essa, M.H.; Al-Zahrani, M.A. Date pits as potential raw materials for the production of active carbons in Saudi Arabia. Int. J. Appl. Environ. Sci. 2009, 4, 47. [Google Scholar]
- El-Naas, M.H.; Al-Zuhair, S.; Alhaija, M.A. Reduction of COD in refinery wastewater through adsorption on date-pit activated carbon. J. Hazard. Mater. 2010, 173, 750. [Google Scholar] [CrossRef]
- El Nemr, A.; Khaled, A.; Abdelwahab, O.; El-Sikaily, A. Treatment of wastewater containing toxic chromium using new activated carbon developed from date palm seed. J. Hazard. Mater. 2008, 152, 263. [Google Scholar] [CrossRef]
- Girgis, B.S.; El-Hendawy, A.A. Porosity development in activated carbons obtained from date pits under chemical activation with phosphoric acid. Microporous Mesoporous Mater. 2002, 52, 105. [Google Scholar] [CrossRef]
- Haimour, N.M.; Emeish, S. Utilization of date stones for production of activated carbon using phosphoric acid. Waste Manag. 2006, 26, 651. [Google Scholar] [CrossRef]
- Hameed, B.H.; Salman, J.M.; Ahmad, A.L. Adsorption isotherm and kinetic modeling of 2,4-D pesticide on activated carbon derived from date stones. J. Hazard. Mater. 2009, 163, 121. [Google Scholar] [CrossRef]
- Jibril, B.; Houache, O.; Al-Maamari, R.; Al-Rashidi, B. Effects of H3PO4 and KOH in carbonization of lignocellulosic material. J. Anal. Appl. Pyrolysis 2008, 83, 151. [Google Scholar] [CrossRef]
- Merzougui, Z.; Addoun, F. Effect of oxidant treatment of date pit activated carbons application to the treatment of waters. Desalination 2008, 222, 394. [Google Scholar] [CrossRef]
- Vohra, M.; Al-Suwaiyan, M.; Hussaini, M. Gas phase toluene adsorption using date palm-tree branches based activated carbon. Int. J. Environ. Res. Public Health 2020, 17, 9287. [Google Scholar] [CrossRef] [PubMed]
- Brunauer, S.; Emmett, P.H.; Teller, E. Adsorption of gases in multi-molecular layers. J. Am. Chem. Soc. 1938, 60, 309. [Google Scholar] [CrossRef]
- Mohan, D.; Singh, K.P.; Sinha, S.; Gosh, D. Removal of pyridine derivatives from aqueous solution by activated carbons developed from agricultural waste materials. Carbon 2005, 43, 1680. [Google Scholar] [CrossRef]
- Chen, J.P.; Wu, S. Simultaneous adsorption of copper ions and humic acid onto an activated carbon. J. Colloid Interface Sci. 2004, 280, 334. [Google Scholar] [CrossRef]
- El-Hendawy, A.A. Variation in the FTIR spectra of a biomass under impregnation, carbonization and oxidation conditions. J. Anal. Appl. Pyrolysis 2006, 75, 159. [Google Scholar] [CrossRef]
- László, K.; Bóta, A.; Nagyu, L.G. Characterization of activated carbons from waste materials by adsorption from aqueous solutions. Carbon 1997, 35, 593. [Google Scholar] [CrossRef]
- Daifullah, A.A.M.; Girgis, B.S. Removal of some substituted phenols by activated carbon obtained from agricultural waste. Water Res. 1998, 32, 1169. [Google Scholar] [CrossRef]
- Al-Nowaiser, W.K.; Vohra, M.S.; Onaizi, S.A. Hybrid electrocoagulation/adsorption system using aluminum electrodes and novel GO@ ZIF-7 nanocomposite for the effective removal of Pb (II) from wastewater. Sep. Purif. Technol. 2024, 350, 127828. [Google Scholar] [CrossRef]
- Al-Nowaiser, W.K.; Onaizi, S.A.; Vohra, M.S. Synthesis and application of novel GO@ZIF-7 nanocomposite for the removal of lead from aqueous solutions. Emergent Mater. 2024, 7, 3043. [Google Scholar] [CrossRef]
- Ismail, U.M.; Onaizi, S.A.; Vohra, M.S. Novel MgCuAl-layered triple hydroxide for aqueous selenite and selenate treatment. Emergent Mater. 2024, 7, 221. [Google Scholar] [CrossRef]
- Ismail, U.M.; Vohra, M.S.; Onaizi, S.A. Adsorptive removal of heavy metals from aqueous solutions: Progress of adsorbents development and their effectiveness. Environ. Res. 2024, 251, 118562. [Google Scholar] [CrossRef] [PubMed]
- Ismail, U.M.; Ibrahim, A.I.; Onaizi, S.A.; Vohra, M.S. Synthesis and application of MgCuAl-layered triple hydroxide/carboxylated carbon nanotubes/bentonite nanocomposite for the effective removal of lead from contaminated water. Results Eng. 2024, 24, 102991. [Google Scholar] [CrossRef]
- Ibrahim, A.I.; Onaizi, S.A.; Vohra, M.S. Novel CTAB functionalized graphene oxide for selenium removal: Adsorption results and ANN & RSM modeling. Emergent Mater. 2024, 7, 247. [Google Scholar]
- Sabbagh, M.; Hussaini, M.; Ismail, U.; Ahmed, H.R. Al-Suwaiyan, M.; Vohra, M. Novel nafion-palygorskite composite for Pb/Lead treatment. Int. J. Environ. Sci. Technol. 2024, 1–16. [Google Scholar]
- Kadirvelu, K.; Thamaraiselvi, K.; Namasivayam, C. Removal of heavy metals from industrial wastewaters by adsorption onto activated carbon prepared from an agricultural solid waste. Bioresour. Technol. 2001, 76, 63. [Google Scholar] [CrossRef]
- Selvi, K.; Pattabhi, S.; Kadirvelu, K. Removal of Cr(VI) from aqueous solution by adsorption onto activated carbon. Bioresour. Technol. 2001, 80, 87. [Google Scholar] [CrossRef]


Disclaimer/Publisher’s Note: The statements, opinions and data contained in all publications are solely those of the individual author(s) and contributor(s) and not of MDPI and/or the editor(s). MDPI and/or the editor(s) disclaim responsibility for any injury to people or property resulting from any ideas, methods, instructions or products referred to in the content. |
© 2024 by the authors. Licensee MDPI, Basel, Switzerland. This article is an open access article distributed under the terms and conditions of the Creative Commons Attribution (CC BY) license (https://creativecommons.org/licenses/by/4.0/).