Article

Dynamic Optimization of Exclusive Bus Lane Location Considering Reliability: A Case Study of Beijing

School of Transportation Science and Engineering, Civil Aviation University of China, Tianjin 300300, China
*
Author to whom correspondence should be addressed.
Appl. Sci. 2024, 14(21), 9777; https://doi.org/10.3390/app14219777
Submission received: 12 September 2024 / Revised: 20 October 2024 / Accepted: 23 October 2024 / Published: 25 October 2024
(This article belongs to the Section Transportation and Future Mobility)

Abstract

:
For metropolises like Beijing, heavy congestions cause transit passengers’ unreliable travel time, including in vehicle time and waiting time. Comparing with other managerial measures, designing a lane for bus use only is an effective method to improve travel reliability, for it can eliminate the influence on bus-driving conditions. This paper proposes a reliable and practical method to determine exclusive bus lanes (EBL). A reliability-based optimization model is established, in which the tradeoff among bus and private car passengers’ travel time, reliability, and EBL construction cost are considered. Based on the actual network, a user equilibrium demand assignment model is applied to estimate the dynamic bus flow distribution. Since the model is nonlinear, a two-step method is proposed where tangent lines are introduced to constitute an envelope curve to linearize the model. This work conducts the statistical modeling and fitting analysis with actual bus trajectory data, collected on EBL in Beijing during peak hours. Passenger travel time distributions are fitted to estimate the statistical passenger travel time; Lognormal distribution and Gaussian distribution are the best fit. The optimization results indicate that the passenger travel time reliability can be improved by 5.5% by the optimized EBL location scheme. This study will provide a theoretical basis and methodological support for improving the service level of the public transportation system in large cities through the scientific planning of exclusive bus lanes.

1. Introduction

Travel time reliability is defined as the consistency or dependability in travel times. Due to heavily congested traffic in metropolises like Beijing, the operation of transit systems always becomes unreliable. Although bus services have timetables, the unpredictable and frequent road congestion makes commuters’ travel time fluctuate greatly. As a result, low-level travel reliability has significantly influenced passengers to choose the public transportation system. It has become the core issue for transit operation managers and researchers to improve reliability conditions of bus networks and attract more passengers to use the bus system. Recently, the exclusive bus lane (EBL) has been implemented as an effective solution to the above problem in a lot of cities. An EBL is a lane restricted to buses. Compared to the existing transit priority strategies, such as the transit signal priority for buses to pass through intersections first [1,2,3], the queue-jumper lanes that allow buses to easily enter traffic flow in a priority position [4], and the intermittent bus lanes that give buses temporary running priority [5], an EBL can provide an isolated running environment and prevent various disturbances on the road, which is attractive to travel time and reliability, and supports a shift of demand from private cars to public transportation [6].
This paper proposes a practical method for EBL implementation to enhance reliability for transit-commuting passengers. A bi-level optimization model is established, incorporating dynamic demand considerations in the lower-level model. In addition, travel time reliability indexes are defined for bus passengers by considering their in-vehicle and waiting process during the whole trip. Statical regression analysis is used for evaluating the key parameters when estimating the passengers travel time reliability. Finally, a real-world case study is conducted to assess the applicability of the proposed model. The research will provide theoretical support for improving the reliability of bus systems through scientific EBL planning.
The work is organized as follows: in Section 2, the literatures are reviewed; in Section 3, the method for optimizing EBL location and a bi-level optimization model are established; in Section 4, a case study with actual data is discussed; Section 5 and Section 6 give the results, discussions, and conclusions.

2. Literature Review

EBLs are widely applied in many big cities. Due to the provision of dedicated road rights for buses, the use of dedicated bus routes will significantly improve the speed, stability, and convenience of buses for passengers. For example, in the practice of Shanghai [7] and Los Angeles [8], the use of bus lanes has reduced delays by 10% and 14.2%, respectively.
EBL location optimization is a complex optimization problem considering the tradeoff between car and bus passengers [9,10]. As an NP-hard problem, efficiency maximization or cost minimization is usually set as the optimization goal [11,12]. Yu proposed a bi-level optimization model of EBL on the multi-modal network [13]. The upper model considered passenger travel time and comfort, and the lower model was a multi-modal distribution model. Yao analyzed the design method of EBL in random traffic networks from the perspective of the competition relationship between cars and buses, and focused on the uncertainty of bus waiting time [14]. Khoo established a bi-level programming model to study the temporal and spatial characteristics of EBL [15]. Truong compared the application effect of continuous EBL under different scenarios, and proposed the corresponding planning method [16]. Sun analyzed the EBL optimization by three levels including EBL’s structure, layout, and service frequency [17]. The upper model was established from the perspective of urban planners, the middle model considered the optimal operation cost of enterprise, and the lower model aimed to maximize the satisfaction of passengers. Several researchers also combined the EBL location optimization with intersection signal optimization [18,19]. Considering the condition that EBL location optimization was always a complex programming problem under the result of transit assignment [20], different solution algorithms were proposed, such as genetic algorithms [21], branch and bound [22], and benders decomposition [23].
Since EBLs have been widely applied by many transit agencies, a lot of research focused on the evaluation of the operation stability and service reliability after the implementation of EBL [24]. For the EBL location optimization studies, quantified travel time and reliability of both transit and car passengers are key factors. Travel time is usually measured by the Bureau of Public Roads (BPR) function or related functions [25,26,27,28]. For travel reliability, with the development of multi-source data, more data-driving methods are proposed, and AVL data, GIS data, and GPS data are used to estimate reliability conditions. McLeod [29] analyzed headway variance using incomplete data. The research focused on the missing buses or discarded spurious bus headways. Chen [30] analyzed service reliability at the levels of stop, route, and network. Barabino proposed an offline framework for the outputting of time reliability by analyzing AVL data [31,32].
The implementation of EBL considers real-time response to dynamically changing traffic demands, making the design of efficient service processes and solution algorithms the core issue of this research. Similar problems, including studies on the integration of different modes of transport, are generally based on the extension of the vehicle routing problem with time windows [33]. For solving the optimization model, the two main types of algorithms currently are analytical algorithms and heuristic algorithms. For analytical algorithms, since they can obtain the precise solution to the model through a complex mathematical iterative process, they are suitable for solving small-scale problems. In contrast, heuristic algorithms can obtain relatively optimal solutions through a limited number of iterations, and are more widely applied in practice [34,35,36].
Although much research has been conducted to support improving reliability of transit systems by EBL, the following critical issues are deserving of further investigations:
(1)
Travel time is concentrated more in EBL location research. However, in the real-world case, traffic congestions and crowded waiting environments may cause transit systems to become more and more unreliable, which could be the most important factor to dynamic demand.
(2)
With different EBL location plans, travel time and reliability of different bus lines can be changed when part of the trip operates on an EBL. The number of passengers taking related bus lines will be changed correspondingly. This dynamic demand should be analyzed in detail.
(3)
Previous studies were always conducted under numerical grid networks, and different EBL locations and key parameters were tested. However, in big cities, the traffic conditions are complex, and traffic is heavily congested during peak hours. It is indicated that most quantitative analyses resulting from the numerical studies have a larger gap with the actual ones. Therefore, with more detailed travel data from advanced IC card systems and on-vehicle GPS equipment, case studies should be conducted to examine the effect of the EBL location optimization model.

3. Materials and Methods

3.1. Descriptions

In recent years, advancements in data acquisition technology have allowed for more precise descriptions of transit passenger travel patterns using mobile GPS data, which can capture bus trajectories down to the second. In this paper, GPS data collected from onboard devices in Beijing are utilized to estimate parameters related to bus operating reliability.
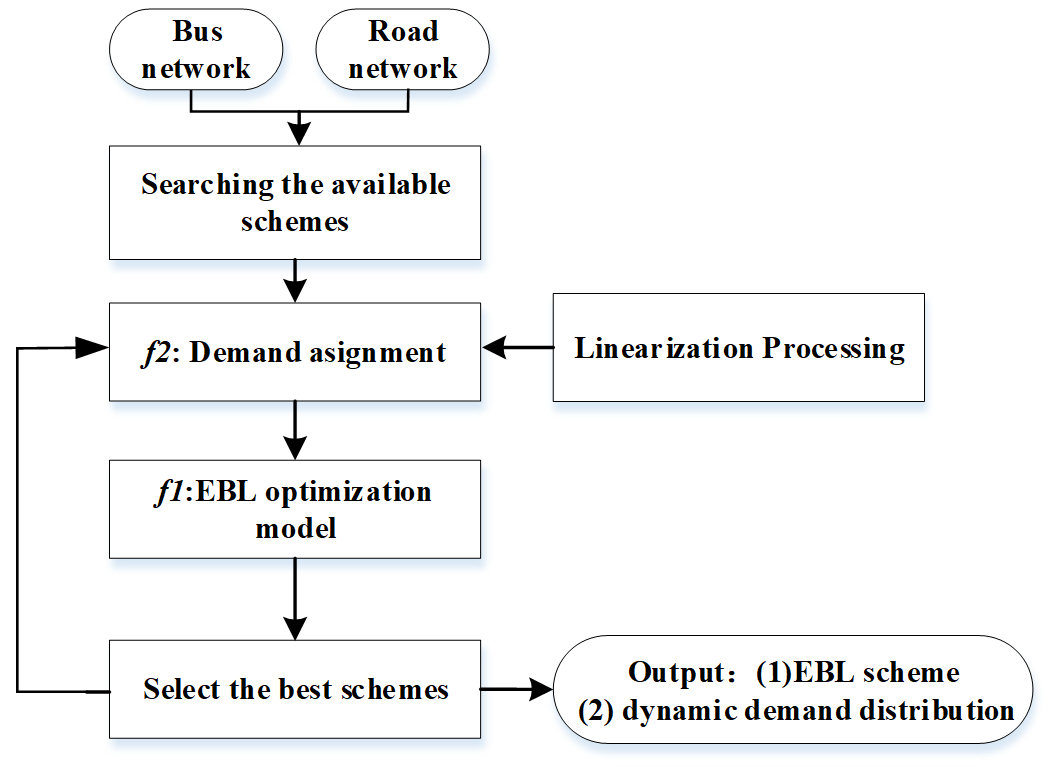
A framework to quantify passenger travel time reliability is proposed and an optimization model to determine EBL location is established considering reliability. Firstly, formulation of passengers’ travel reliability is quantified. Then, optimization formulation is proposed and a corresponding linearization algorithm is designed. Finally, a case study is conducted to validate the model. The optimization model can provide EBL locations in which the real-time passenger demand is considered. The overall flowchart is described in Figure 1.
Parameters and variables in this paper are described in Table 1. The decision variables and corresponding parameters to reflect EBL implementation and passenger travel time and reliability on EBLs are proposed in the model. The other definitions of variables that reflect the transit travel time reliability follows the Ref. [37].

3.2. Estimation of Travel Time Reliability

“Buffer time” is used to reflect reliability which is composed by expected travel time and the potential variation. Travel time reliability will decrease with the increasing of the buffer time [37]. Passenger travel time includes reliability-based in-vehicle time (IVT) and reliability-based waiting time (WT). As Figure 2 shows, IVT and WT are estimated respectively.
t i j = t j t i
t i j i n v e h i c l e = E [ t i j ] + ρ σ ( t i j )
E [ t i j ] = n = 1 N t i j ( n ) N
σ ( t i j ) = 1 N 1 n = 1 N ( t i j n E ( t i j ) ) 2
w = t i t 0
t w a i t i n g = E [ w ] + ρ σ w
E ( w ) = E ( t i t 0 ) = E ( t i ) E ( t 0 )
σ w = D ( w )
P ( T = t ) = ( z w H ) t e z w H t !
E ( t ) = 0 H t P ( T ) d T = z w H
σ t = z w
Equations (1)–(4) reflect the estimation of IVT, and Equations (5)–(8) reflect the estimation of WT. It is mentioned that Equation (2) reflects that the reliability-based IVT of stop i and j is composed of expected time and “buffer time”. Equation (3) reflects the expectation of IVT. Equation (4) reflects standard deviation. Equation (6) reflects the reliability-based WT. The variation of WT is caused by bus arrival time and passenger arrival time. The bus interval h is assumed to follow the certain probability distribution. E(h) is estimated by field GPS data. In public transportation systems, transit passengers’ arrival at bus stops can be regarded as a stochastic process that follows Poisson distribution [0, H] [38].

3.3. Model Formulation and Analysis

3.3.1. General Cost

(1)
Formulation cost of a transit passenger
The general costs include the cost of IVT, WT, extra waiting delay, and transfer time. For the passenger travel arc, the formulations are determined as follows:
Cost of IVT
C s = u t s i n v e h i c l e s S i n v e h i c l e
Cost of WT
C s = u t s w a i t i n g s S w a i t i n g
Cost of extra waiting delay time
Considering the scenario that the boarding and alighting process will be slowed down with the increasing number of passengers [39,40], an extra delay will be caused, which is determined as follows:
d s = β 1 ( y s K ) n s S w a i t i n g
C s = u d s s S w a i t i n g
Equation (14) reflects extra delay time, which is determined by the actual passengers in the bus. The more boarding passengers there are, the longer the delay will be.
Cost of transfer time
Transfer time equals to the additional WT, which is expressed as follows:
C s = u t s t r a n s f e r = u t s w a i t i n g s S t r a n s f e r  
(2)
Formulation of the private car passenger cost
On the basis of the BPR model [25,26,27,28], travel time cost of a private car passenger can be calculated as Equation (17), in which the implementation of an EBL is considered. y c a r means the volume of the car.
C s = u t s 0 1 + a y c a r b ( 1 - φ s ) + N 1 N b φ s β s S i n v e h i c l e
(3)
Formulation of EBL construction cost
The construction cost of an EBL is composed of the unit construction cost and the length of the EBL, which can be calculated as follows:
C s = u l s φ s s S i n v e h i c l e

3.3.2. Model Formulation

The EBL location optimization model can provide the optimal scheme to determine the distribution of an EBL on the road network. Dynamic demand distribution is considered. For transit passengers, an EBL can significantly improve time reliability. However, for private vehicle passengers, after the implementation of an EBL, the road capacity will decrease and the traffic will be more congested. The EBL location optimization model is expressed as follows:
min   f 1 = s u l s φ s + s u ( t s i n v e h i c l e ( 1 φ s ) + t s E B L φ s ) y s + s u t s c a r y s c a r
min   f 2 = s 0 y s c s ( ξ ) d ξ
s.t.
s l s φ s L m a x s S
φ s { 0,1 } s S
y s = o d p y o d p δ o d p s
p P y o d p = q o d   o V , d V
y o d p 0   o V , d V , p P
f1 considers the tradeoff among the transit passenger’s travel time cost, the private car passenger’s travel time cost, and the construction cost of an EBL. In f2, dynamic transit demand is assigned. The objective function of f2 can reflect the sum of the results of integrating the general cost. As Equation (14) shows, extra waiting delay is determined by the real-time volume of waiting passengers The Beckman model is used, as f2 shows, which can demonstrate that the optimal solution is equivalent with user equilibrium [41].
Equation (20) can be expressed as follows:
0 y s c s ξ d ξ = u t s i n v e h i c l e + u ( t s w a i t i n g + d s ) + u l s
Equation (21) reflects the constraint of the maximum length of alternative EBL schemes. Equation (24) reflects that the sum of passengers on all paths should equal the demand of each OD pair. Equation (25) means that the decision variable is non-negative.

3.3.3. Solution Algorithm

The multi-objective model is a bi-level optimization model in which the upper model decides the locations of EBLs, and the lower model describes the demand assignment. In addition, the lower function f2 is a nonlinear optimization model, which is hard to solve. Therefore, a two-stage algorithm based on a feedback-loop process is proposed to solve the bi-level optimization model first. In addition, a linearization algorithm is proposed to transform the nonlinear model into a linear function, which can significantly decrease the difficulty of solving the model [41,42]. For the two-stage algorithm, the first step is searching, which determines the alternative solutions set in function f1. The second step is a feedback-loop process in which each the EBL scheme resulting from the function f1 is applied into function f2, in which the transit demand distribution will be calculated. Then, the result will be input back into function f1. With the continuously cycling iteration, the optimal EBL scheme will be estimated.
Step 1: Searching. Determine the range of decision variables P{P1, P2, P3,…, Pn} in function f1. Delete the unfeasible solutions from the alternative solution set. For roads which can be the candidates to set an EBL, the following conditions of the traffic environment should be met: (1) The number of bus lines running on an EBL is greater than N1. (2) The number of road lanes is greater than N2. (3) The ratio of private car volume and road capacity should be greater than a1, which indicates that only congested roads are suitable for EBL. (4) The maximum total length of an EBL should be less than Lmax.
Step 2: Feedback-loop step. According to feasible EBL schemes P*{P1*, P2*, P3*,…, Pn*}, the results are input into function f2. Then, the passenger-flow distribution results F*{F1*, F2*, F3*,…, Fn*} can be calculated and input back into the upper model again. Using iterations, the best scheme P** is selected. The algorithm is terminated. The solution framework is shown in Figure 3.
The objective function f2 is combined with the costs of an in-vehicle arc, waiting arc, and transfer arc [37]. As Equations (14) and (15) show, f2 includes a part of the nonlinear functions, which are hard to solve and is presented in Equation (27) as follows:
0 y s c s ( ξ ) d ξ = C s ( ξ ) 0 y s = u ρ β 1 n + 1 K n ( y s ) n + 1 s S w a i t i n g
Referring to Ref. [35], a series of tangent lines are introduced to linearize the nonlinear function, which is described as follows:
Step 1. Take the second derivative of Equation (27) and obtain the following
C ( y s ) = d ( d C ( y s ) d y s ) d y s = u ρ β 1 n k n ( y s ) n 1 s S w a i t i n g
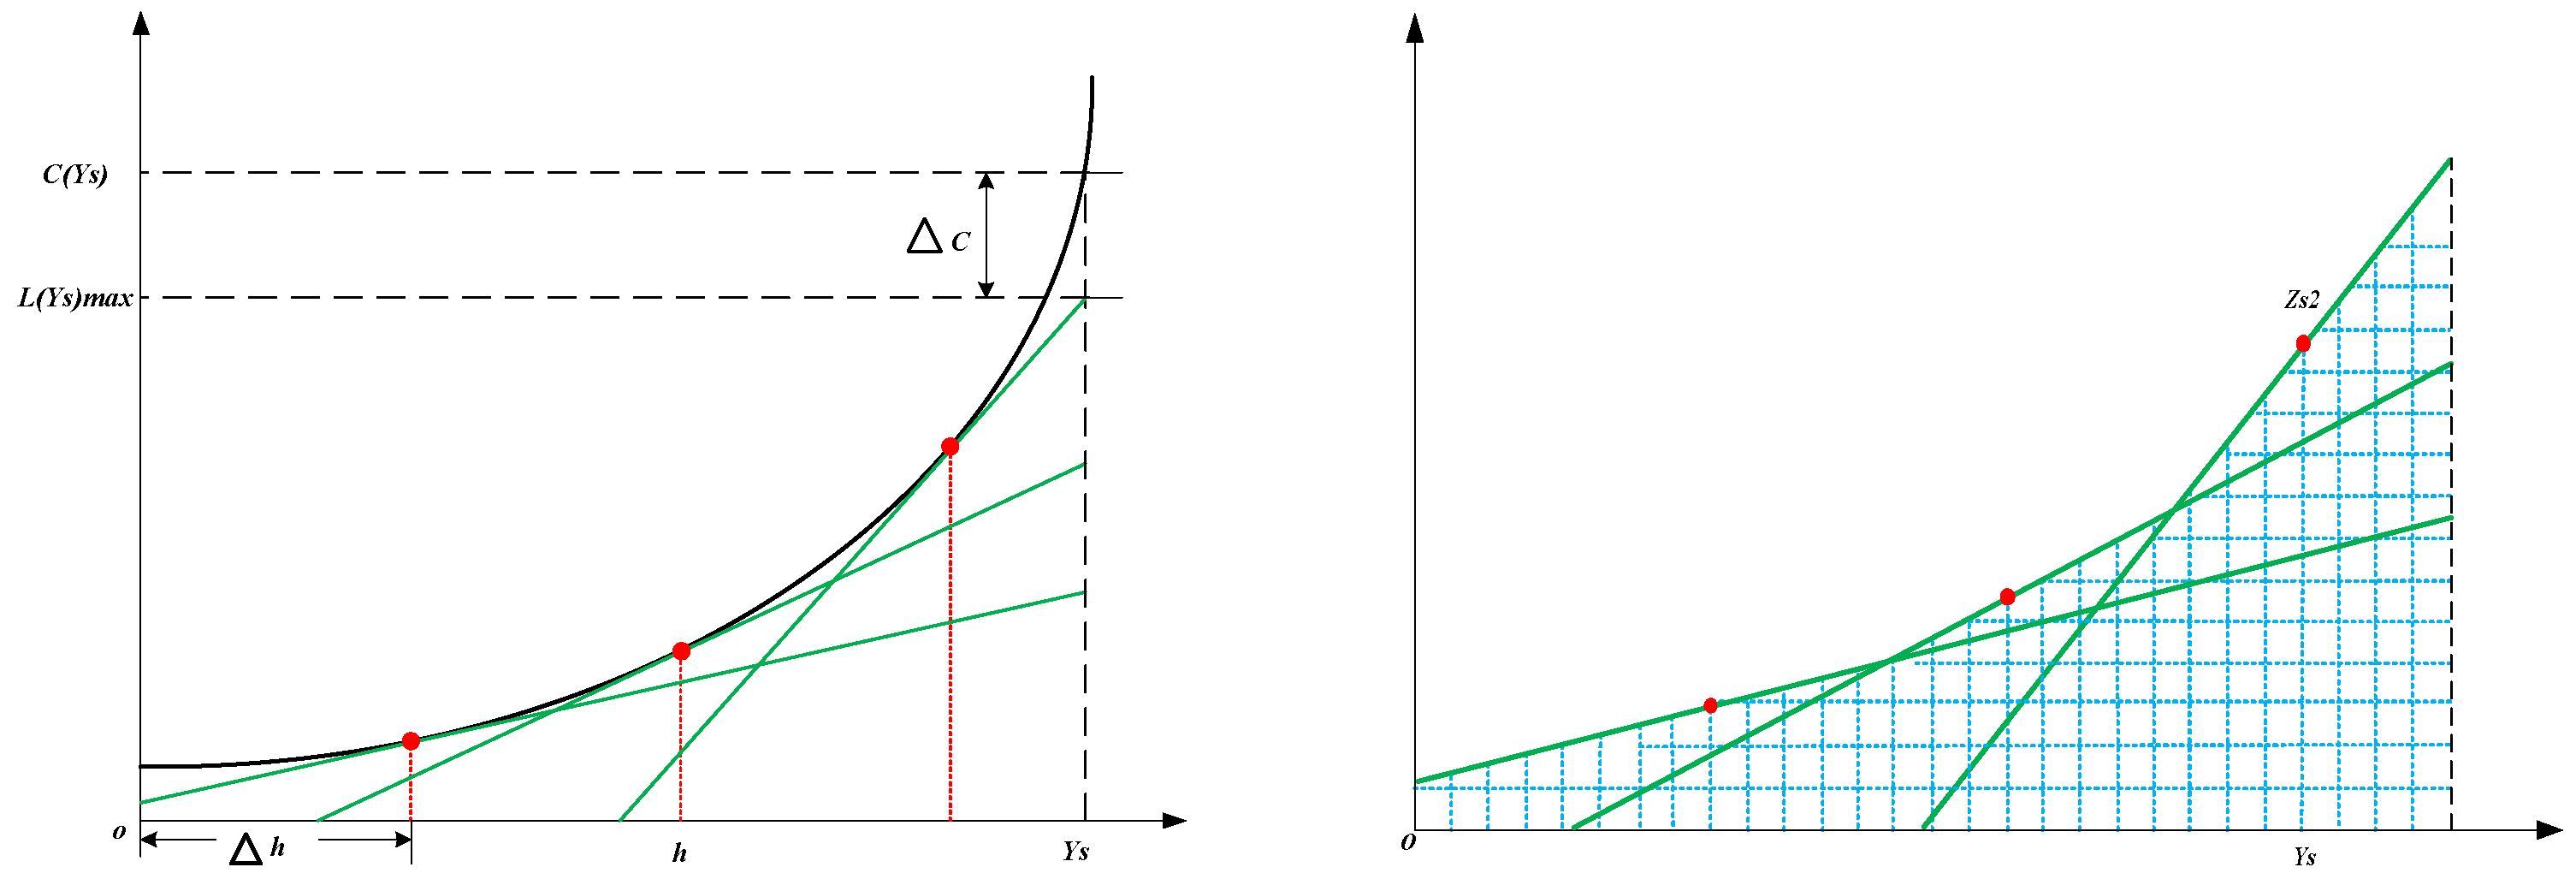
Usually, n 1 ,so C ( y s ) 0 . It is concluded that C ( y s ) is the concave function within the range, which is shown as Figure 4.
Step 2. N nodes are inserted on the curve with space Δ h and a tangent line is added on each node, as Figure 4 shows. It is easily concluded that when N is large enough, the original curve is equivalent to the envelope curve. On any node h, the envelope curve can be expressed as follows:
L : y 1 h y s + y 2 h         h = n Δ h ,   n = 1,2 , , N y 1 h = C h y 2 h = C ( h ) y 1 ( h ) h
Step 3. The assistant decision variable z s is introduced and formulated as follows:
y 1 ( h ) y s + y 2 ( h )   z s             h = n Δ h ,   n = 1,2 , . . . , N
For Equation (30), it is indicated that the value of zs is greater than the value of the ordinate node on the blue grid. For any ys, zs will be restricted in the blank area off the blue grid in Figure 4. The optimization model f2 aims to select the minimum solution, so min   f 2 = s 0 y s c s ( ξ ) d ξ can be replaced by s z s . As a result, for any ys, the nonlinear function s 0 y s c s ( ξ ) d ξ can be replaced by the linear form.
After the linearization processing of f2, the optimization model is transferred into the linear optimization model, which is solved by Python+Gurobi in this paper.

4. Case Study

4.1. Local Bus Network

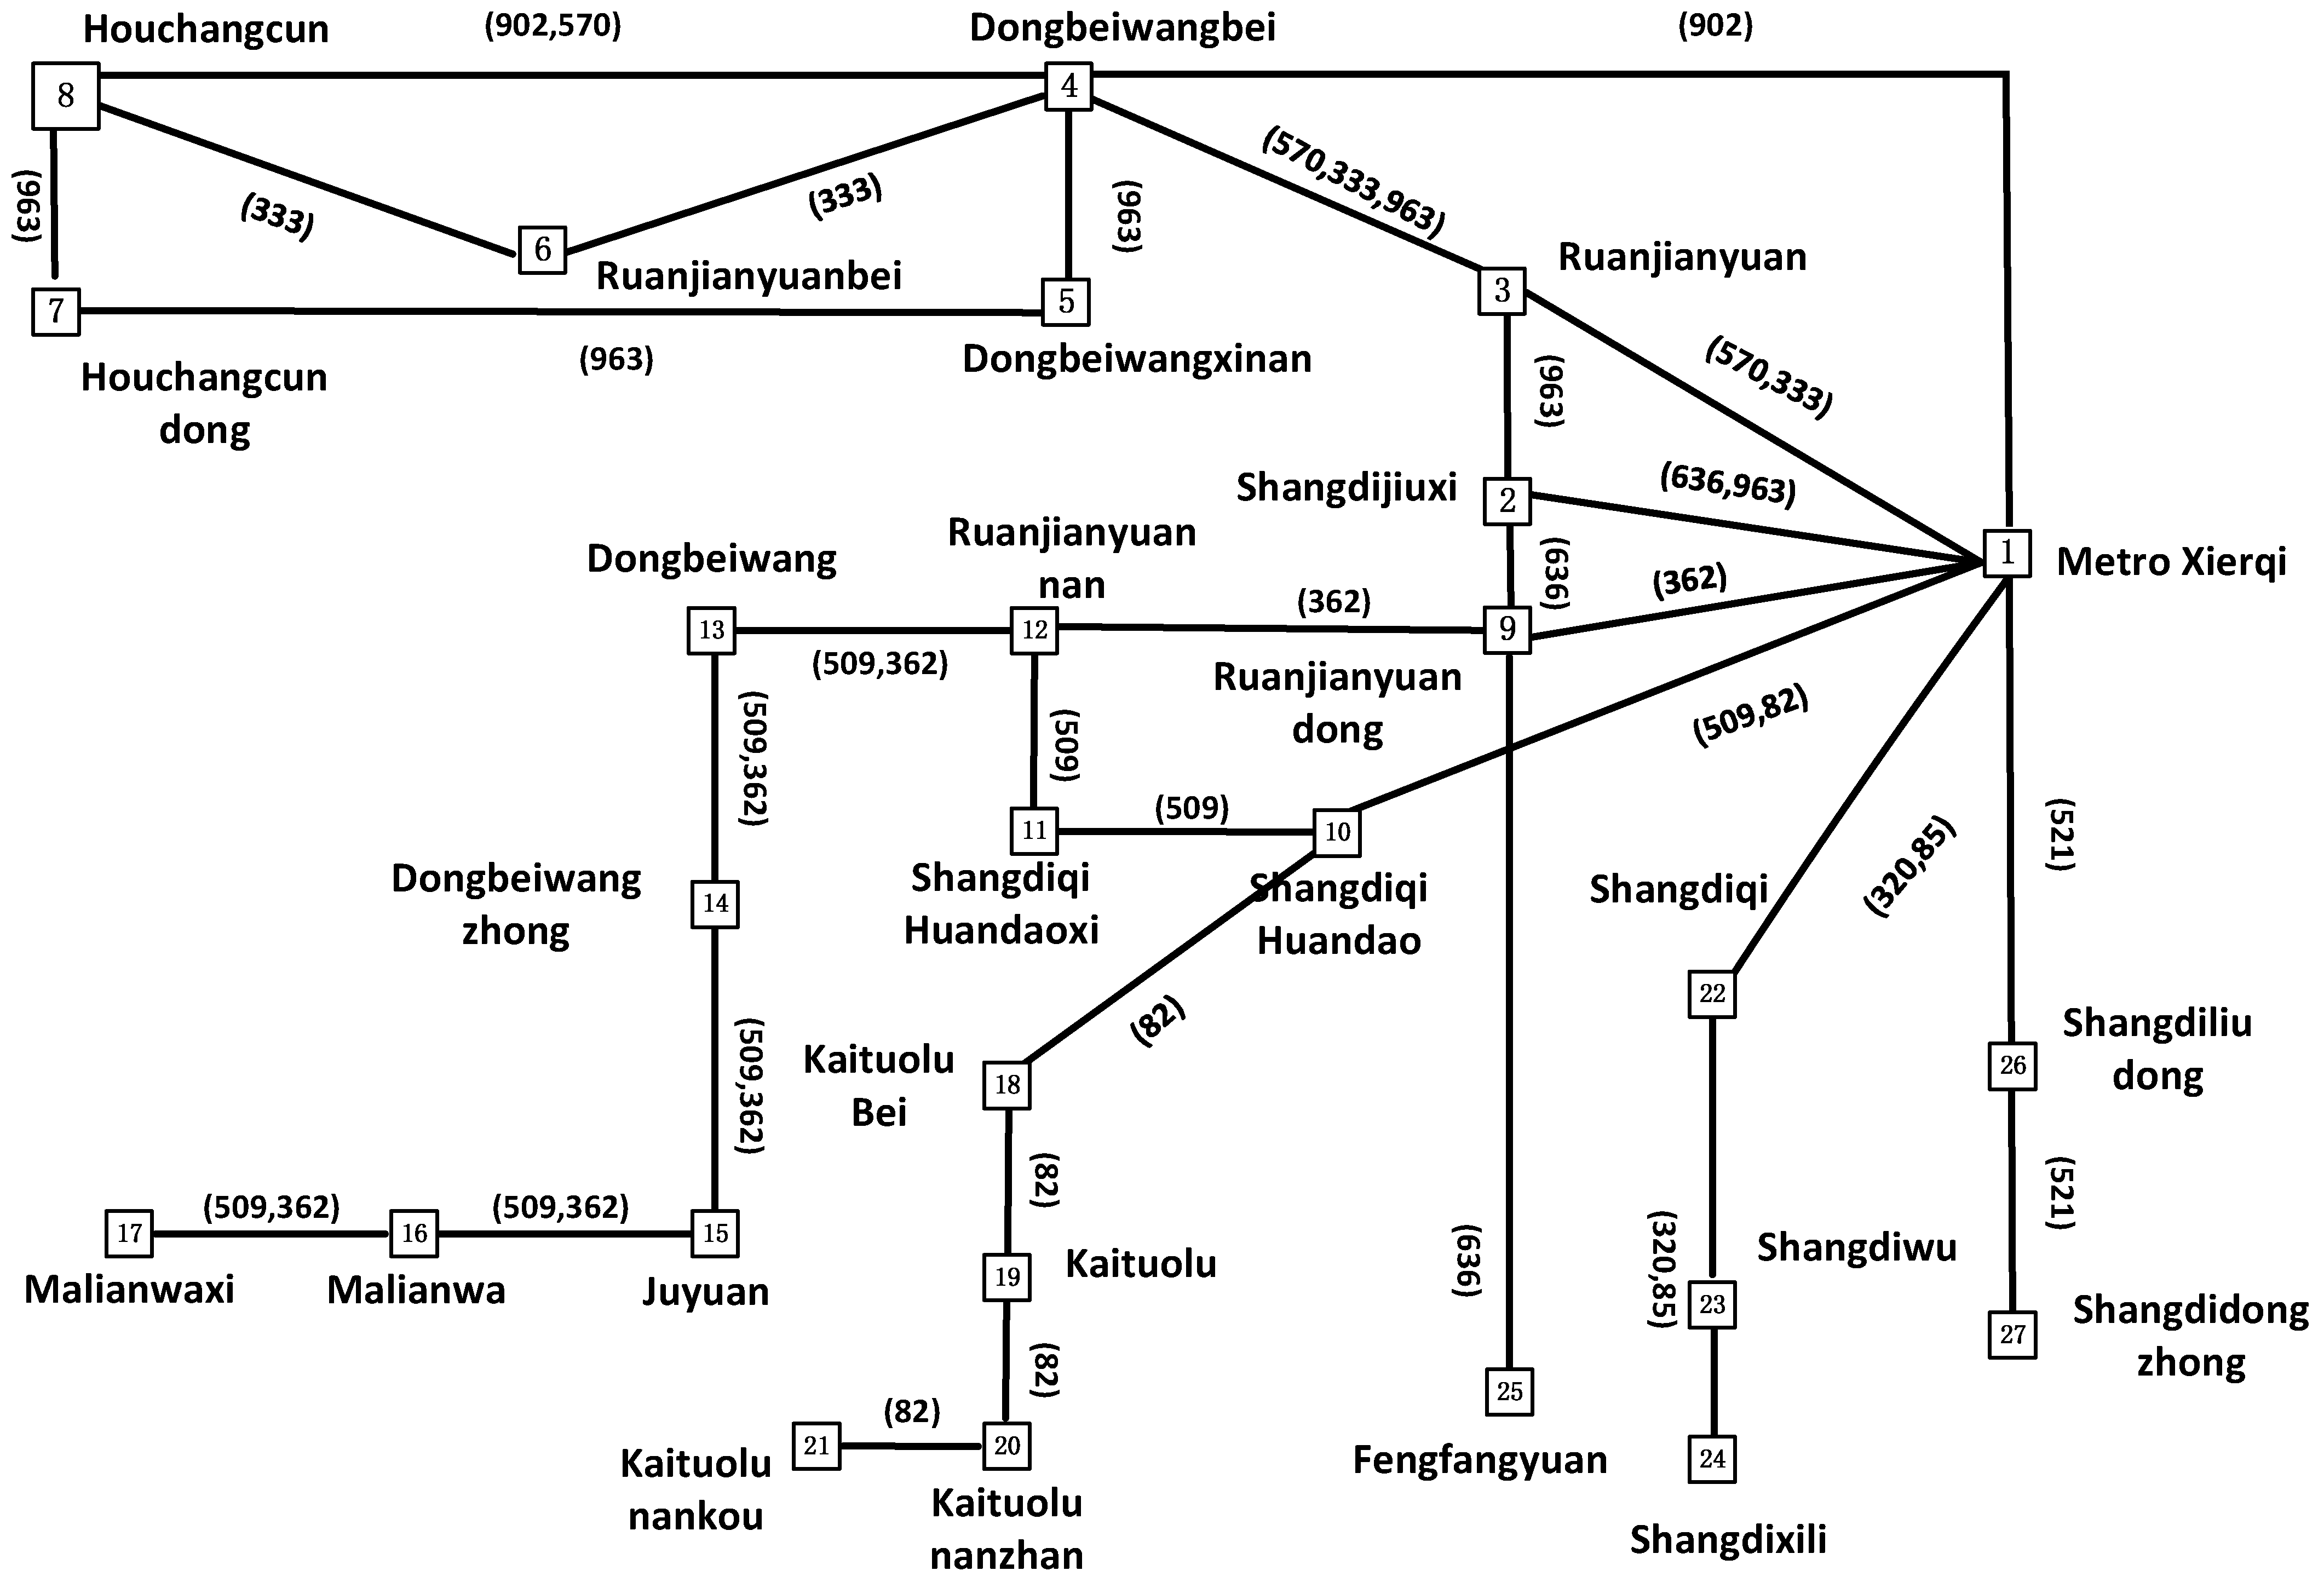
The local transit network of the Zhongguancun Software Park zone is a busy commercial area in Beijing. The heavy traffic congestions occur frequently during peak hours. As a result, when passengers choose the bus for commuting, the travel time becomes unreliable. Therefore, reliability is important for commuters. The transit network of the study area is presented in Figure 5. The travel distance between each stop is shown in Table 2. Table 3 shows the transit demand, which is extracted from the IC card system. The volume of basic data is over five hundred thousand pieces. It reflects the number of passengers that will travel from an origin stop to a destination stop. There are a total of 1962 passengers using buses during the peak hour.
The average ticket for transit costs 0.3 yuan/km. Unit travel time is 11.34 yuan/h, and travel time reliability is 19.27 yuan/h [43]. Reliability preference is determined as 2, in which the potentially unreliable traffic needs extra buffer time [37]. Table 4 gives the key parameters for the proposed optimization model. Other parameters for the optimization model are described in Table 4.

4.2. Travel Time Reliability Estimation

GPS data of 11 bus lines in the case area are collected for fitting analysis. The period of the data is from 6:00 to 11:00 a.m. on Monday. Considering the condition that there is still no EBL in the local area of the case study, to simulate passenger reliability value when the bus is running on an EBL, three bus lines (Line 300 N, Line 300 W, and Line 300 KN) are selected for the case study, which run on the Third Ring Road, completely covered by an EBL during peak hours in Beijing. The sample GPS data are shown on Figure 6.
Passenger travel time distributions are fitted to estimate the statistical passenger travel time. Four typical fits for passenger travel time are applied to select the best statistical distribution. As Figure 7 and Table 5 show, results of a Gaussian fit, Weibull fit, Laplace fit, and Lognormal fit are presented. In addition, the fitting results are validated using Root Mean Square Error (RMSE) and R-squared. It is indicated that for Lines 300 N and 300 KN, Lognormal distributions are the best fit. For Line 300 KN, a Gaussian distribution is the best fit.
On the basis of the best fit distributions, the IVT of bus lines on an EBL and the IVT and WT of conventional lines are estimated, and the results are shown in Table 6 and Table 7. On the EBL, passengers’ average expectation and standard deviation of the IVT are 1.59 min/km and 1.15 km, respectively. Off of the EBL, 11 conventional bus lines in the case study area are selected, and results of the IVT and WT are estimated. For IVT, the expectation and standard deviation are distributed from 2.9 min/km to 3.8 min/km, and from 1.9 min/km to 3.3 min/km. For WT, the distributions are from 2.4 min to 5.1 min, and from 5.6 min to 6.8 min. It is indicated that the variation of WT is larger for the waiting process. After the estimation of bus passengers’ IVT and WT, reliability can be estimated as Equations (2) and (6) described. Then facing different plans of EBL locations, dynamic demand is estimated considering the reliability conditions in the optimization model.

5. Result and Discussions

CRnetwork is used to determine the overall reliability. which can be calculated as follows:
C R n e t w o r k = s u ρ ( σ s + D s ) y s s S i n v e h i c l e S w a i t i n g
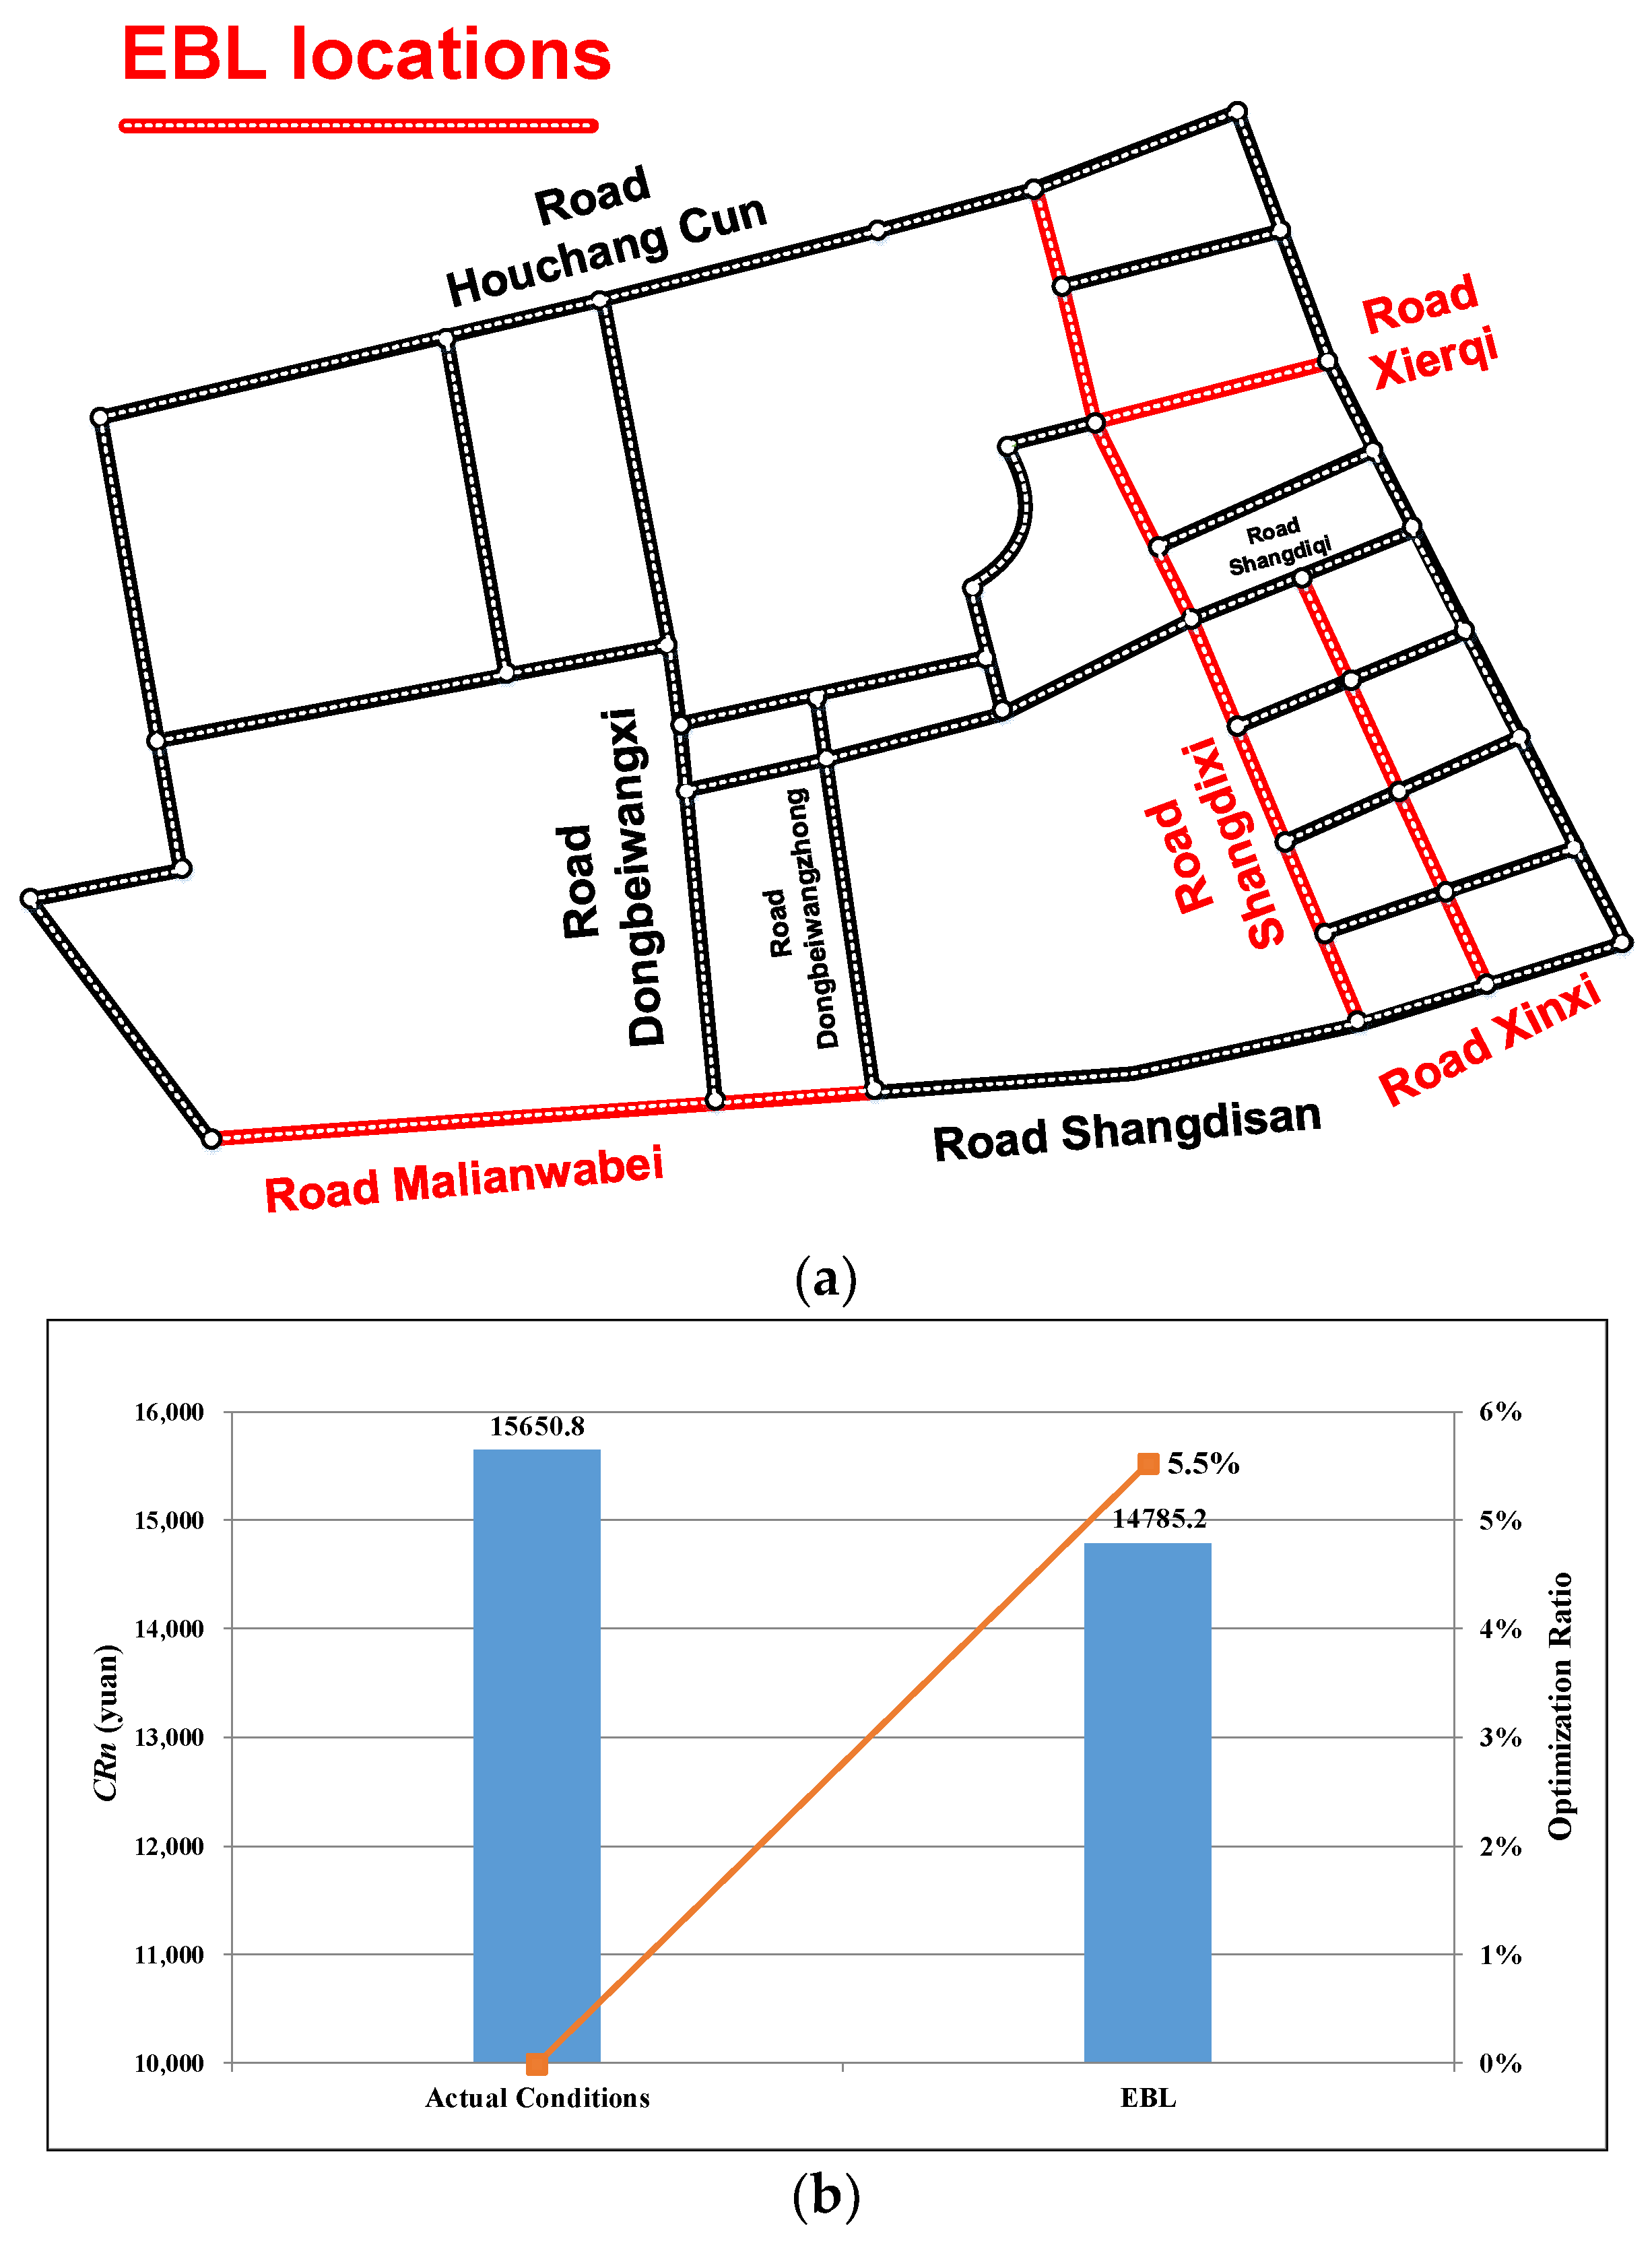
Equation (31) reflects the total buffer time, including passengers’ in-vehicle time and waiting time [43]. There are a total of nine roads that could be implemented with an EBL. If any of them are implemented with an EBL, corresponding travel time and reliability parameters will be changed. As is shown in Table 8, for the optimized EBL location scheme, the following roads are suggested to implement an EBL: Shangdixi, Xierqi, Xinxi, and Malianwabei. According to the calculation results in Figure 8, total reliability cost CRn under the background of an EBL is 14,785.2 yuan, which is 5.5% lower than the actual value of 15,650.8 yuan. This means that when an EBL is implemented, all passengers can save 5.5% of time cost due to various uncertain influencing factors. It is indicated that a reasonable EBL location scheme will significantly improve reliability and reduce the passengers’ extra time cost caused by various unreliable factors.
In addition, comparing with other similar research, the results of this paper are more suitable for the commercial area. Although these areas are small, bus passengers often have extremely high requirements for travel time reliability. At the same time, these areas often experience severe traffic congestion during peak hours. Therefore, implementing an EBL will have a better optimization result.

6. Conclusions

Planning an EBL in big cities can effectively improve the travel time reliability of bus passengers. This paper proposes a reliable and practical method to optimize EBL locations in order to improve travel time reliability on a network, considering the realistic transit demand dynamics. Conclusions are summarized as follows:
(1)
The indicator based on buffer time is defined to quantify the transit passenger travel time reliability, which is composed by passenger reliability preference and time volatility. Comparing the traditional methods of traffic models, the methodology proposed in this paper uses statistical modeling and fitting analysis to evaluate travel time and reliability, based on actual AVL data. Data are collected from bus lines that are operating on the EBL of the Third Ring Road in Beijing during peak hours. Calculation results show that unit expectation and standard deviations of travel time are 1.59 min/km and 1.15 min/km, respectively, which can be important parameters to reflect the fluctuation of passenger travel time reliability in the optimization model.
(2)
A relatively complete framework of a reliability-based EBL location optimization model is established, and is composed of the EBL location and demand assignment optimization. The transit passengers’ dynamic choices are considered under different EBL location schemes. A two-stage solution algorithm on the basis of iteration is designed to solve the nonlinear programming model. To solve the complex nonlinear problem, a linearization method is proposed by cutting tangent lines on the concave curves.
(3)
To validate the model’s quality and robustness, the case study is analyzed in Beijing. Results show that the best-performing bus lane locations mainly depend on travel demand, road structure, and traffic conditions. For the network of bus passengers and private car passengers, the best EBL location scheme resulting from the proposed model can evidently improve the travel time reliability by 5.5% in the case study. In addition, comparing with other cities that have applied the EBL like Los Angeles, Beijing has more business districts and office areas, and commuters have higher requirements for the reliability of bus systems. Therefore, the implementation of an EBL can better improve the service level of the public transportation system within the area of highly concentrated demand. It will attract more passengers to choose the bus for commuting.
There are two main limitations in this paper. First, the impacts from other transportation modes, such as shared bicycles, electric bicycles, and pedestrians, are not considered. Second, the case study in the paper needs to be extended to transit networks with a larger scale. Those limitations need to be improved in future research.

Author Contributions

Conceptualization, W.K.; Methodology, W.K.; Software, W.K.; Validation, W.K.; Formal analysis, W.K.; Investigation, W.K.; Resources, S.Z.; Data curation, W.K.; Writing—review and editing, L.P.; Visualization, W.K.; Supervision, W.K. and F.L.; Project administration, W.K.; Funding acquisition, W.K. All authors have read and agreed to the published version of the manuscript.

Funding

This research was funded by the National Natural Science Foundation of China, grant number 52402413, and the Fundamental Research Funds for the Central Universities, grant number 3122025037.

Institutional Review Board Statement

Not applicable.

Informed Consent Statement

Not applicable.

Data Availability Statement

The data used to support the findings of this study are included within the article. The original GPS and passenger OD data cannot be provided in order to protect the personal privacy of passengers under the regulation of the third-party company.

Conflicts of Interest

The authors declare no conflicts of interest.

References

  1. Guler, S.I.; Kan, W. Optimizing transit signal priority implementation along an arterial. Transp. Res. Record. 2018, 2672, 215–227. [Google Scholar]
  2. Christofa, E.; Papamichail, I.; Skabardonis, A. Person-Based Traffic Responsive Signal Control Optimization. IEEE Trans. Intell. Transp. Syst. 2013, 14, 1278–1289. [Google Scholar] [CrossRef]
  3. Bhattacharyya, K.; Maitra, B.; Boltze, M. Implementation of bus priority with queue jump lane and pre-signal at urban intersections with mixed traffic operations: Lessons learned? Transp. Res. Record. 2019, 2673, 646–657. [Google Scholar] [CrossRef]
  4. Truong, L.T.; Sarvi, M.; Currie, G. An investigation of multiplier effects generated by implementing queue jump lanes at multiple intersections. J. Adv. Transp. 2016, 50, 1699–1715. [Google Scholar] [CrossRef]
  5. Chiabaut, N.; Barcet, A. Demonstration and evaluation of an intermittent bus lane strategy. Public Transp. 2019, 11, 443–456. [Google Scholar] [CrossRef]
  6. Bayrak, M.; Guler, S.I. Optimization of dedicated bus lane location on a transportation network while accounting for traffic dynamics. Public Transp. 2021, 13, 325–347. [Google Scholar] [CrossRef]
  7. Zhao, J.; Zhou, X. Improving the Operational Efficiency of Buses with Dynamic Use of Exclusive Bus Lane at Isolated Intersections. IEEE Trans. Intell. Transp. Syst. 2018, 20, 642–653. [Google Scholar] [CrossRef]
  8. Tang, Q.; Hu, X.; Lu, J.; Zhou, X. Analytical characterization of multi-state effective discharge rates for bus-only lane conversion scheduling problem. Transp. Res. Part B Methodol. 2021, 148, 106–131. [Google Scholar] [CrossRef]
  9. Wu, P.; Chu, F.; Che, A. Mixed-integer programming for a new bus-lane reservation problem. In Proceedings of the 18th International Conference on Intelligent Transportation Systems (ITSC), Gran Canaria, Spain, 2 November 2015; IEEE: Piscataway, NJ, USA, 2015; pp. 2782–2787. [Google Scholar]
  10. Gao, K.; Sun, L.; Tu, H.; Li, H. Heterogeneity in Valuation of Travel Time Reliability and In-Vehicle Crowding for Mode Choices in Multimodal Networks. J. Transp. Eng. Part A Syst. 2018, 144, 04018061. [Google Scholar] [CrossRef]
  11. Jeason, D.; Ferreira, L. Assessing travel time impacts of measure to enhance bus operation. Part II: Assessment criteria and main findings. Road Transp. Res. J. 2000, 9, 3–18. [Google Scholar]
  12. Chen, Q. An optimization model for the selection of bus-only lanes in a city. PLoS ONE 2015, 10, e0133951. [Google Scholar] [CrossRef] [PubMed]
  13. Yu, B.; Kong, L.; Sun, Y.; Yao, B.; Gao, Z.Y. A bi-level programming for bus lane network design. Transp. Res. Part C Emerg. Technol. 2015, 55, 310–327. [Google Scholar] [CrossRef]
  14. Yao, J.; Shi, F.; An, S.; Wang, J. Evaluation of exclusive bus lanes in a bi-modal degradable road network. Transp. Res. Part C Emerg. Technol. 2015, 60, 36–51. [Google Scholar] [CrossRef]
  15. Khoo, H.L.; Teoh, L.E.; Meng, Q. A bi-objective optimization approach for exclusive bus lane selection and scheduling design. Eng. Optim. 2013, 46, 987–1007. [Google Scholar] [CrossRef]
  16. Truong, L.T.; Sarvi, M.; Currie, G. Exploring Multiplier Effects Generated by Bus Lane Combinations. Transp. Res. Rec. J. Transp. Res. Board 2015, 2533, 68–77. [Google Scholar] [CrossRef]
  17. Sun, X.; Lu, H.; Fan, Y. Optimal bus lane infrastructure design. Transp. Res. Rec. J. Transp. Res. Board 2014, 2467, 1–11. [Google Scholar] [CrossRef]
  18. Xu, H.; Zheng, M. Impact of Bus-Only Lane Location on the Development and Performance of the Logic Rule-Based Bus Rapid Transit Signal Priority. J. Transp. Eng. 2012, 138, 293–314. [Google Scholar] [CrossRef]
  19. Wu, J.; Hounsell, N. Bus priority using pre-signals. Transp. Res. Part A Policy Pract. 1998, 32, 563–583. [Google Scholar] [CrossRef]
  20. Chen, B.Y.; Lam, W.H.K.; Sumalee, A.; Shao, H. An efficient solution algorithm for solving multi-class reliability-based traffic assignment problem. Math. Comput. Model. 2011, 54, 1428–1439. [Google Scholar] [CrossRef]
  21. Sun, X.; Wu, J. Combinatorial optimization of bus lane infrastructure layout and bus operation management. Adv. Mech. Eng. 2017, 9, 1687814017703341. [Google Scholar] [CrossRef]
  22. Bingfeng, S.; Ming, Z.; Xiaobao, Y.; Ziyou, G. Bi-level Programming Model for Exclusive Bus Lanes Configuration in Multimodal Traffic Network. Transp. Res. Procedia 2017, 25, 652–663. [Google Scholar] [CrossRef]
  23. Mesbah, M.; Sarvi, M.; Ouveysi, I.; Currie, G. Optimization of transit priority in the transportation network using a decomposition methodology. Transp. Res. Part C Emerg. Technol. 2011, 19, 363–373. [Google Scholar] [CrossRef]
  24. Vedagiri, P.; Arasan, V. Estimating Modal Shift of Car Travelers to Bus on Introduction of Bus Priority System. J. Transp. Syst. Eng. Inf. Technol. 2009, 9, 120–129. [Google Scholar] [CrossRef]
  25. McLeod, D.S.; Morgan, G. Florida’s Mobility Performance Measures and Experience; Florida Department of Transportation: Tallahassee, FL, USA, 2011. Available online: https://www.fdot.gov/docs/default-source/planning/FTO/mobility/trbmpmpaper16.pdf (accessed on 20 October 2024).
  26. Kou, W.; Chen, X.; Yu, L.; Qi, Y.; Wang, Y. Urban commuters’ valuation of travel time reliability based on stated preference survey: A case study of Beijing. Transp. Res. Part A Policy Pr. 2017, 95, 372–380. [Google Scholar] [CrossRef]
  27. Wahba, M.; Shalaby, A. Large-scale application of MILATRAS: Case study of the Toronto transit network. Transportation 2011, 38, 889–908. [Google Scholar] [CrossRef]
  28. Yao, B.; Hu, P.; Lu, X.; Gao, J.; Zhang, M. Transit network design based on travel time reliability. Transp. Res. Part C Emerg. Technol. 2014, 43, 233–248. [Google Scholar] [CrossRef]
  29. McLeod, F. Estimating bus passenger waiting times from incomplete bus arrivals data. J. Oper. Res. Soc. 2007, 58, 1518–1525. [Google Scholar] [CrossRef]
  30. Chen, X.; Yu, L.; Zhang, Y.; Guo, J.F. Analyzing urban bus service reliability at the stop, route, and network levels. Transp. Res. Part A Policy Pract. 2009, 43, 722–734. [Google Scholar] [CrossRef]
  31. Barabino, B.; Francesco, M.D. Diagnosis of irregularity sources by automatic vehicle location data. IEEE Intell. Transp. Syst. Mag. 2021, 13, 152–165. [Google Scholar] [CrossRef]
  32. Barabino, B.; Di Francesco, M.; Mozzoni, S. An Offline Framework for the Diagnosis of Time Reliability by Automatic Vehicle Location Data. IEEE Trans. Intell. Transp. Syst. 2016, 18, 583–594. [Google Scholar] [CrossRef]
  33. Berbeglia, G.; Cordeau, J.F.; Laporte, G. Dynamic Pickup and Delivery Problems. Eur. J. Oper. Res. 2010, 202, 8–15. [Google Scholar] [CrossRef]
  34. Li, Y.; Soleimani, H.; Zohal, M. An improved ant colony optimization algorithm for the multi-depot green vehicle routing problem with multiple objectives. J. Clean. Prod. 2019, 227, 1161–1172. [Google Scholar] [CrossRef]
  35. Masmoudi, M.A.; Braekers, K.; Masmoudi, M.; Dammak, A. A Hybrid Genetic Algorithm for the Heterogeneous Dial-A-Ride Problem. Comput. Oper. Res. 2017, 81, 1–13. [Google Scholar] [CrossRef]
  36. Li, X.; Hu, S.; Fan, W.; Deng, K. Modeling an enhanced ridesharing system with meet points and time windows. PLoS ONE 2018, 13, e0195927. [Google Scholar] [CrossRef]
  37. Jiang, Y.; Szeto, W. Reliability-based stochastic transit assignment: Formulations and capacity paradox. Transp. Res. Part B: Methodol. 2016, 93, 181–206. [Google Scholar] [CrossRef]
  38. Kou, W. Improvement Strategy Modeling for Transit Passengers’ Travel Time Reliability. Ph.D. Dissertation, Beijing Jiaotong University, Beijing, China, 2019. [Google Scholar]
  39. Szeto, W.Y.; Jiang, Y.; Wong, K.I.; Solayappan, M. Reliability-based stochastic transit assignment with capacity constraints: For-mulation and solution method. Transp. Res. Part C Emerg. Technol. 2013, 35, 286–304. [Google Scholar] [CrossRef]
  40. Szeto, W.Y.; Solayappan, M.; Jiang, Y. Reliability-Based Transit Assignment for Congested Stochastic Transit Networks. Comput. Civ. Infrastruct. Eng. 2011, 26, 311–326. [Google Scholar] [CrossRef]
  41. Liu, C.; Lin, B.; Wang, J.; Xiao, J.; Liu, S.; Wu, J.; Li, J. Flow assignment model for quantitative analysis of diverting bulk freight from road to railway. PLoS ONE 2017, 12, e0182179. [Google Scholar] [CrossRef]
  42. Wu, J.; Lin, B.; Wang, J.; Liu, S. A Network-Based Method for the EMU Train High-Level Maintenance Planning Problem. Appl. Sci. 2017, 8, 2. [Google Scholar] [CrossRef]
  43. Kou, W.; Wang, J.; Liu, Y.; Li, C. Last-Mile Shuttle Planning for Improving Bus Commuters’ Travel Time Reliability: A Case Study of Beijing. J. Adv. Transp. 2022, 2022, 1–15. [Google Scholar] [CrossRef]
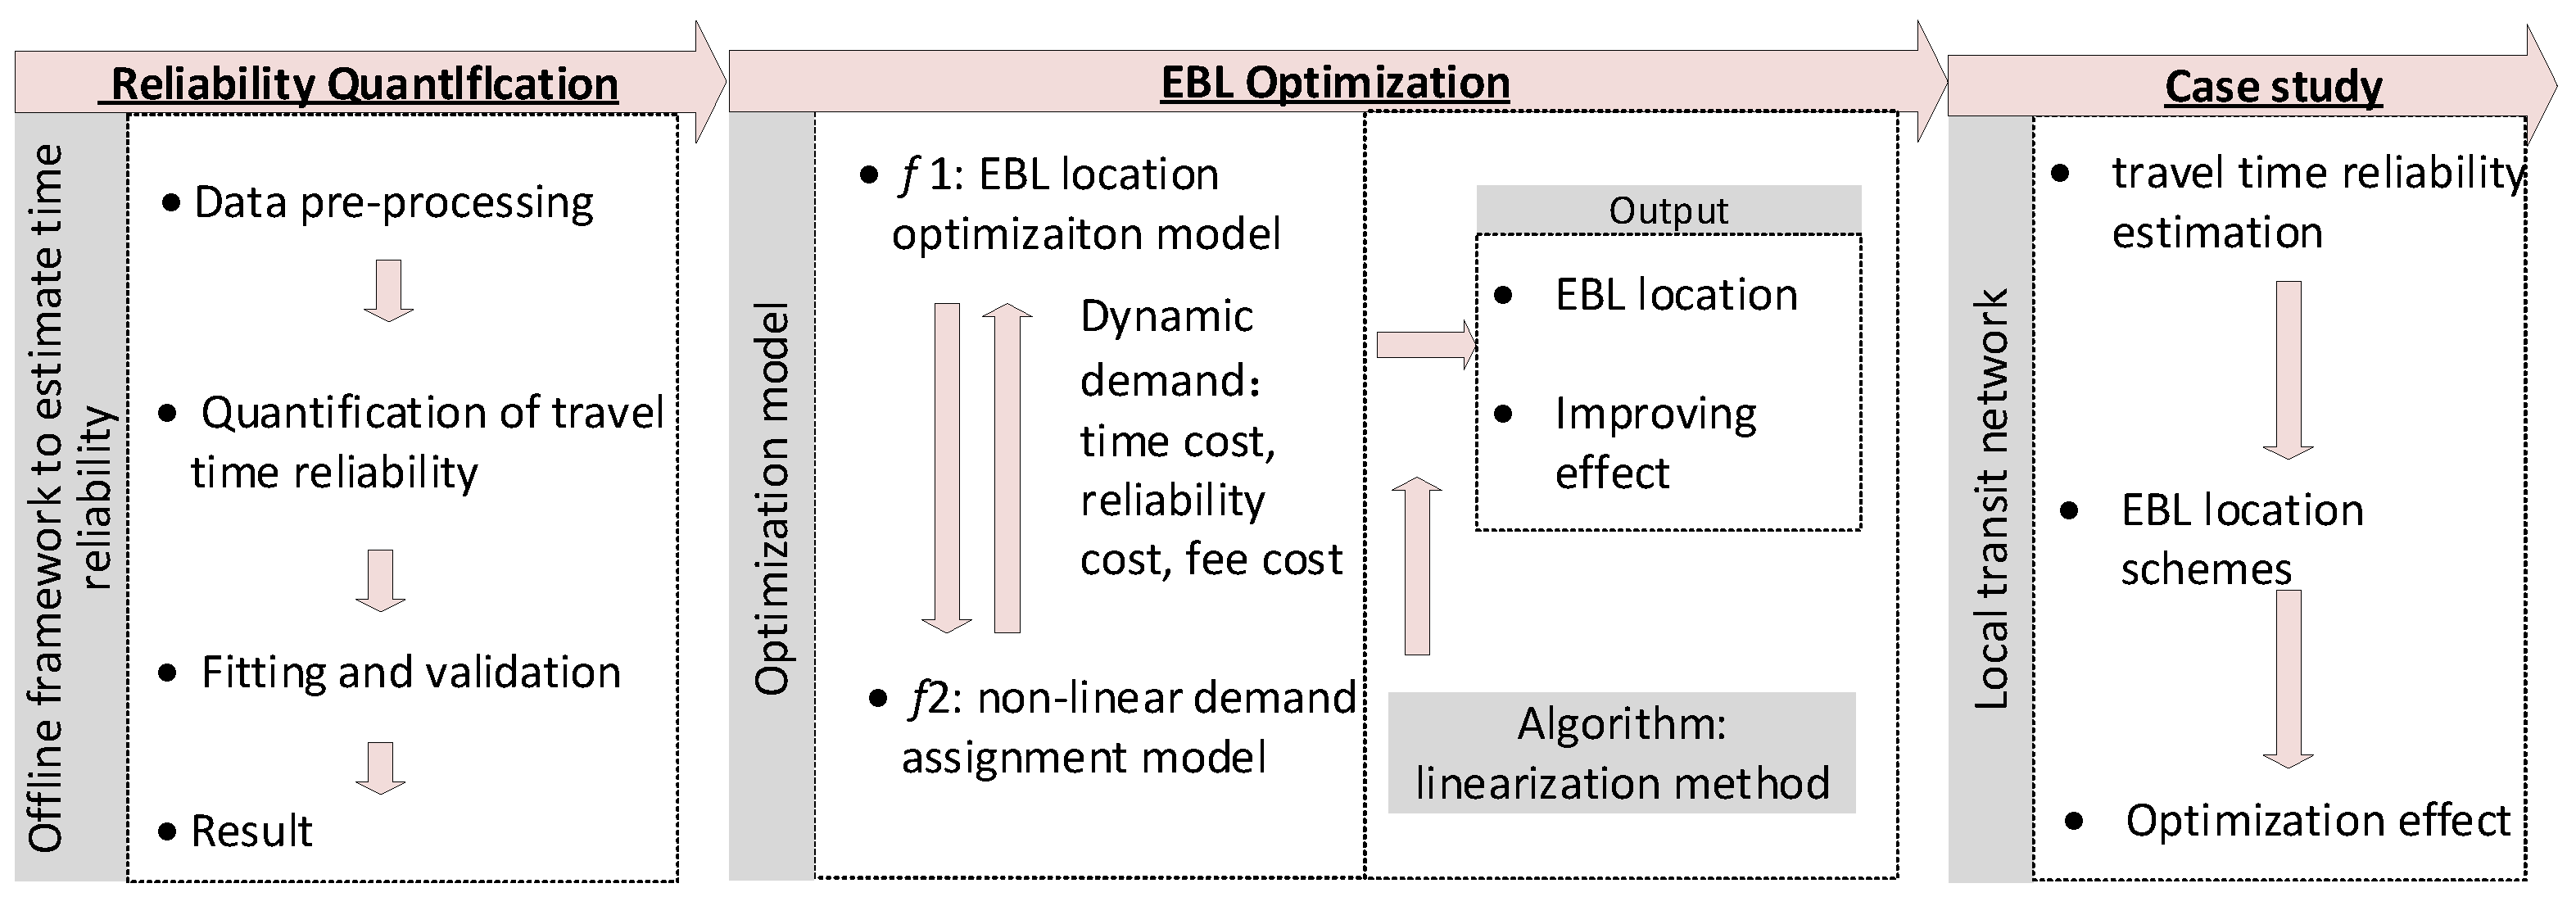
Figure 1. Flowchart of the method framework.
Applsci 14 09777 g001
Figure 2. Illustration of IVT and WT.
Applsci 14 09777 g002
Figure 3. Solution framework.
Applsci 14 09777 g003
Figure 4. Illustration of linear processing.
Applsci 14 09777 g004
Figure 5. Local network.
Applsci 14 09777 g005
Figure 6. Sample GPS data.
Applsci 14 09777 g006
Figure 7. Fitting result.
Applsci 14 09777 g007aApplsci 14 09777 g007b
Figure 8. Result for the optimized EBL scheme. (a) Optimized EBL scheme; (b) Optimized CRnetwork result.
Applsci 14 09777 g008
Table 1. Parameters and variables.
ParametersDescriptions
t j ,   t i Bus arrival time samples of stop i and j.
t i j Sample time from i to j.
t i j i n v e h i c l e Reliability-based in-vehicle time.
E( t i j )Expectation of IVT.
σ ( t i j ) Standard deviation (SD) of ij.
ρ Reliability preference parameter.
NNumber of samples.
wSample waiting time.
t w a i t i n g Reliability-based waiting time.
E( w )Expectation of WT for all the samples.
D(w)Deviation of sample waiting time
σ w Standard deviation of w.
zwExpectation of passenger arrival time/bus arrival interval.
sTravel arc.
CsGeneral cost of Travel arc s.
uUnit travel time cost (yuan/h).
S i n v e h i c l e Set of in-vehicle travel arc.
S w a i t i n g Set of waiting arc.
d s Extra delay time.
y s Number of waiting passengers.
δ o d p s Parameter that determines whether travel arc s passes on path p from node o to node d
y o d p Number of passengers on available path p from nodes ij
KVehicle capacity.
a , b ,   β ,     β 1 , nParameters to be estimated.
S t r a n s f e r Set of transfer arc.
u Unit construction cost.
l s the length of EBL.
t s 0 Unit travel time of car under free flow velocity
y c a r Volume of car.
HPassenger arrival headway
φ s whether the EBL is set on the arc s.
Table 2. Direct distance between bus stops.
Bus StopBus StopDistance
(km)
Bus StopBus StopDistance
(km)
Bus StopBus StopDistance
(km)
141.5230.510110.3
481.919111120.4
1319120.5290.6
340.512130.39251.5
46113141.81261.3
680.914150.726270.7
450.715160.61221.3
570.816170.722230.6
120.31101.123240.8
Table 3. Travel demand in case study.
OD (Person)S2S3S5S8S9S10S12S13S14S15S16S17S18S22S23S24S26
S126 962093712270229149 2327139913
S3 310
S9 59 2346
S11 194
S13 1323
S15 66
S22 1523
S23 14
Table 4. Key parameters in case study.
ParameterIVTWTKn β 1
ESDESD
Value3.38 min/km2.35 min/km4.18 min6.18 min80
person
30.5
Parameteru u C
ValueTravel time
yuan/h
Travel time reliability
yuan/h
14.7
yuan/km
600 pcu/lane
11.34 19.27
Road NameXierqiHouchang CunMalianwa NXinxiDongbeiwang MShangdiqiShangdisan
Traffic Volume
(pcu/h/lane)
5491116692160130634420
Road NameShangdixiDongbeiwang W
Traffic Volume
(pcu/h/lane)
880201
Table 5. Fitting result.
LineGaussianWeibull LaplaceLognormalParameters of Best Fit
300 NR-square0.9000.8820.9090.973a = 0.799
b = 0.356
RMSE0.0550.0600.0520.028
300 WR-square0.8980.8730.9030.967a = 0.728
b = 0.385
RMSE0.0530.0590.0510.030
300 KNR-square0.9580.8970.9360.953a = 0.915 b = 1.877
c = 0.506
RMSE0.0500.0780.0610.052
Table 6. Result of travel time fluctuation.
LineIVT (min/km)
ESD
330 N1.961.27
300 W1.921.25
300 KN0.880.92
Average1.591.15
Table 7. Result of expectation and standard deviation.
LineIVT (min/km)WT (min)
ESDESD
9023.73.32.45.7
3203.72.45.15.6
3333.72.43.65.6
3622.923.65.6
5093.32.25.16.8
5213.72.74.16.4
57031.95.16.8
9633.82.62.45.7
6363.22.24.46.2
8531.95.16.8
823.22.25.16.8
Average3.382.354.186.18
Table 8. Optimized EBL scheme.
Road NameXierqiHouchang CunDongbeiwangzhongShangdiqiDongbeiwangxi
φ10000
Road nameMalianwabeiXinxiShangdisanShangdixi
φ1101
Disclaimer/Publisher’s Note: The statements, opinions and data contained in all publications are solely those of the individual author(s) and contributor(s) and not of MDPI and/or the editor(s). MDPI and/or the editor(s) disclaim responsibility for any injury to people or property resulting from any ideas, methods, instructions or products referred to in the content.