Abstract
The latest World Food Security Outlook predicted stabilization in global food security by 2024; however, nearly one billion people still face the threat of food insecurity. Fertilisers, crucial for maximizing crop yields, are the subject of scrutiny due to their environmental impact and health concerns. Efforts are being made to use fertilisers more efficiently and maintain soil nutrient balance to address these issues. In this research, different solid and liquid wastes from the food industry were used to granulate organic biofertilisers with a rotary drum granulator. This included buckwheat biomass (BBM), buckwheat husks (BH), buckwheat husk ash (BHA), bone meal (BM), molasses solution (MS), and beaten eggs (BE). Using standardized fertiliser testing methods, it was found that the biofertilisers produced by the drum granulator comply with the requirements for bulk fertilisers, as they are rich in plant nutrients, the static strength of their granules is high (7–14 N/granule), and their moisture content is higher (4–8%) than that of conventional mineral fertilisers, but the hygroscopicity of the granules when stored in standard conditions (30–60% humidity, temperature of 20–25 °C) is low. Due to their slightly alkaline pH, it is likely that such fertilisers could be used in acidic soils and would have a double effect—they would improve plant growth and soil properties (increase the amount of organic matter and reduce acidity).
1. Introduction
The latest World Food Security Outlook suggested that global food security should be expected to stabilize in 2024. However, the threat of food insecurity still looms over nearly one billion people [1]. For decades, and at present especially, many questions have been raised about how we can continue to feed the growing global population [2,3]. The agriculture industry has always been the backbone of global food production and fertilisers play a critical role in maximizing crop yields. Achieving optimal crop yields while minimizing environmental impact is a key goal for farmers [4]. A large part of this effort is proper fertilization, which involves the precise combination of nutrients.
This has resulted in further development of the fertiliser industry and the production of commercial fertilisers. Fertilisers provide nutrients that are essential for the development and growth of plants [5,6,7,8]; however, recently, they have acquired somewhat negative connotations and a mixed reputation. This view has been formed as a result of excessive use, and its negative impact on soil properties and human health [9,10,11,12]. Today, suppliers and fertiliser manufacturers are attempting to use fertilisers more efficiently and are focusing on maintaining the balance of soil nutrients and microorganisms for specific crop soils [13,14,15,16]. According to the World Bank, global waste generation is expected to increase by 70% by the year 2050 [17]. Recycling waste into fertiliser is often a part of broader initiatives to promote a circular economy and reduce the environmental impact of waste disposal. According to a report by the Food and Agriculture Organization (FAO), the global volume of food wastage is estimated to be 1.6 Gt of “primary product equivalents”, while the total wastage for the edible part of food is 1.3 Gt [18]. The process typically involves converting organic waste, such as plant residues, plant and animal by-products (bone meal, fish meal), food scraps, and other food waste into nutrient-rich fertilisers through composting or other conversion methods [19,20,21,22].
The circular economy concept emphasizes the importance of closing the loop in the production–consumption cycle by reusing organic waste to create valuable resources (fertiliser) rather than sending it to landfills [23]. Recycling waste into fertilisers helps divert organic waste from landfills, thus reducing the overall volume of waste and mitigating the methane emissions associated with decomposition; using organic fertilisers derived from recycled waste in improving soil structure, fertility, and water retention contributes to sustainable and regenerative agricultural practices; they promote plant growth and reduce the need for synthetic fertilisers [24]. One simple and traditional solution to waste management lies in the transformation of organic waste into compost [25,26,27] or vermicompost [28,29,30]. The resulting compost can be used to enhance soil fertility, reduce the need for chemical fertilisers, and promote sustainable agriculture practices.
Another popular and easily implemented method of waste utilization is pyrolysis. Pyrolysis involves thermal decomposition of organic waste in the absence of oxygen, resulting in the production of biochar, bio-oil, and non-condensable gases. While biochar serves as a carbon-rich soil amendment and fertiliser, other components are not suitable for fertilization and must be further recycled [31,32,33].
Fertilisers, as products with a higher added value, are supplied in liquid form as solutions, or in a solid form. Solid fertilisers are created through bulk pressing, prilling, or granulating [34,35]. These granules combine various raw materials with essential micronutrients to create balanced and nutritionally rich granules and therefore are a key factor in ensuring healthy plants, exceptional growth, disease resistance, and optimized yields. Fertiliser granulation is a process where fertiliser particles become attached to each other through agglomeration. The process of agglomeration transforms powdered raw materials into spherical granules ranging from 2 to 5 mm in size. Due to particle size, physical form, and other physical properties, granular fertilisers are considered to be the most efficient option for application to soil by spreading machines.
Waste from other processes (animal or plant residue) could be used as a raw material for fertilisers. However, difficulties in packaging, transporting, storage, and spreading bulk organic residue lead to a more localized use of fertiliser [36,37,38]. Granular fertiliser made from waste or organic residue is increasingly being suggested, but the compatibility of other raw materials needs to be evaluated.
There are several methods that can be used in the granulation process for fertilisers: pan granulation, drum granulation, extrusion granulation, roller press granulation, and fluid bed granulation. The choice of method and equipment depends on factors such as the specific characteristics of raw materials, the desired granule properties, and the scale of production. Each method has its advantages and limitations, and the choice between them should be based on the specific requirements of the organic fertiliser production process used [39,40,41]. As technology has advanced, fertiliser manufacturing with rotary discs was replaced by rotary drum granulation. During this process, raw materials are added to a rotary drum together with steam or hot water. The rotation effect, with proper temperature and humidity, results in a granulated product which needs to be dried/cooled [42,43].
In conclusion, waste–fertiliser conversion breakthroughs offer immense potential in advancing sustainability and addressing the challenges associated with waste management. The growth of the organic fertiliser market is mainly attributed to the increasing demand for organic foods, rising awareness about environmental safety, advances in organic fertiliser manufacturing processes, and the abundant availability of organic waste. In terms of value, the organic fertiliser market is expected to reach a value of USD 15.9 billion by 2027 [44]. As we continue to explore and invest in such solutions, we move closer to a greener and more sustainable future. Considering changes in soil health, the need for environmentally friendly organic fertilisers, and the amount of waste generated in the food industry, this study aimed to create easy-to-use, high-quality granular organic biofertilisers from different wastes from the food industry. Waste accumulated in Lithuania (buckwheat production, animal waste utilization, sugar industry, poultry farming) was used in the study, but such waste can be found in any country, so the conducted research is relevant and significant on a global scale. According to Jha et al., buckwheat is one example of an underutilized crop species, despite having an abundance of nutritional and bioactive components [45]. Therefore, the aim of this work is to propose a waste–organic fertiliser production technology using different wastes from the food industry.
2. Materials and Methods
2.1. Raw Materials for Organic Biofertiliser Production
During the production of buckwheat groats at the company “Ekofrisa” (Naraukelio village, Prienai district, Lithuania) wastes such as buckwheat biomass (BBM), buckwheat husks (BH), and buckwheat husk ash (BHA) are generated in the bio-boiler. “Ekofrisa” accumulates 600 tons of raw biomass (BBM), 700 tons of buckwheat hulls (BH), and 110 tons of ash (BHA) per year. This is solid waste with different physical properties and chemical compositions; however, all of it contains nutrients which plants need [46]. Bone meals (BMs) from the joint Lithuanian–Latvian company “BIOVAST” (Kalakutiškės village, Rietavas district, Lithuania) which processes all categories of animal by-products, makes products (proteins, bone meal) which, depending on the category, can be used in the feeding, fertiliser, fuel, soap, and cosmetics industries [47]. About 50,000–60,000 t of animal waste is processed by “BIOVAST” and about 4000 t of bone meal (BM) is produced from it. Two liquid substances—molasses solution (MS) and broken eggs (BEs)—are used as a binder. The yield of molasses (MS) from the mass of beets accounts for 3–4%, so about 10,000 tons of molasses are produced by the company “Lietuvos cukraus fabrikas” (Marijampolė, Lithuania) in one season (from September to January). The composition of molasses depends on the climatic conditions of the beet growth, on the conditions of beet cultivation (e. g. fertilization), and the technological regime of beet processing. The composition of molasses (“Lietuvos cukraus fabrikas”) varies within the following ranges (%): dry particle content ranges from 76 to 82, sucrose content varies within the range 46–51, non-sugar substances range from 32 to 34, reducing materials vary within the range of 0.5–2.5, raffinose falls into the interval between 0.6 and 1.4, lactic acid ranges from 4 to 6, acetic acid varies within the interval of 4–8, and conductometric ash ranges from 6 to 10. Molasses also contains microelements (the interval of 80–600 mg/kg contains concentrations of Fe, Mn, Cu, Co, Si, and Mo) and heavy metals (less than 10 mg/kg of Ni, Cr, Pb, and Sn). An analysis of molasses was carried out in accordance with the EU Commission Regulation (EB/152/2009) and the relevant standards [48,49,50]. Broken eggs (BEs) in poultry farms comprise up to about 1–2 percent of production, i.e., about 800–1000 kg per day, and this is a big problem. In this experiment, Bes waste was prepared by blending eggs with shells in a Conair Waring laboratory blender (Merck KGaA, Darmstadt, Germany).
2.2. Plant Nutrient Concentration
The concentrations of primary plant nutrients N (as Ntotal), P (as P2O5), and K (K2O) in the granular fertilisers were determined using the standard fertilisers analysis methods: LST EN 13654-1:2002; LST EN 13650:2006 [51,52]. The nitrogen concentration was determined according to the Kjeldahl method with a Gerhardt VAPODEST 45s (C. Gerhardt GmbH & Co. KG. Koenigswinter, Germany) distiller. Organic raw materials were mineralized with concentrated H2SO4. After mineralization, the sample was titrated with 0.2 N HCl using an automatic Kjeldahl titration system. The phosphorus content in the biofertilisers was determined using the yellow colour spectrophotometric method with a PG Instruments Limited T70/T80 UV–VIS spectrophotometer (PG Instruments Limited, Lutterworth, UK). Absorbance was measured in standard rectangular 10 mm path optical glass cuvettes, compared with a blank, at 450 nm. The standard solution was prepared by dissolving 1.9175 g of KH2PO4 in concentrated H2SO4 and diluting it to 1 dm3 with distilled water. The standard solution was used to plot the calibration curve. Flame photometry was used to determine the potassium concentration in the samples. A JENWAY Model PFP7 (Cole-Parmer Ltd., Staffordshire, UK) flame photometer was used for this study. A standard solution of 0.1 mg/cm3 was prepared to plot the calibration curve. The concentrations of secondary plant nutrients, calcium (as CaO) and magnesium (as MgO), were determined by complexometric titration using different indicators (chalcone carboxylic acid and dark blue chromogen, respectively) and titrating with 0.025 N Ethylenediaminetetraacetic acid solution.
The following chemicals were used for the chemical analysis: potassium chloride (KCl) p. a., “Reachem”, Bratislava, Slovakia; sodium alkali (NaOH) p. a., “Reachem”, Bratislava, Slovakia; hydrochloric acid (HCl) p. a., “Chempur”, Warsaw, Poland; sulfuric acid (H2SO4) p. a., “Chempur”, Warsaw, Poland; nitric acid (HNO3) p. a., “Lachema”, Brno, Czech Republic; boric acid (H3PO4) p. a., “Chempur”, Warsaw, Poland; potassium dihydrogen phosphate (KH2PO4) p. a., “Reachem”, Bratislava, Slovakia; ammonium molybdate ((NH4)6Mo7O24 4H2O) p. a., “Sigma Aldrich”, Burlington, MA, USA; ammonium vanadate ((NH4VO3)) p. a., “Chempur”, Warsaw, Poland; ethylenediaminetetraacetic acid (C10H16N2O8)), p. a., Unichem, Hamburg, Germany; distilled water.
2.3. Organic Matter Content
Organic matter (or ash) content (%) was determined according to the modified LST EN 13039:2012 standard. Samples of the raw materials, without additional pretreatment, were placed in a porcelain plate and dried at 90 °C in a laboratory dryer until a constant weight was achieved. The samples were weighed with an accuracy of ±0.001 g. and the dried samples were then reduced to ash at 900 °C in a muffle furnace SNOL 82/1100 (UAB Umey, Utena, Lithuania) for 1 h. The porcelain plates with the ashes were cooled and weighed on a scale with an accuracy of ±0.001 g. The organic matter content in the samples was calculated based on the weight loss [53]. The measurements were repeated twice to ensure the reliability of the results.
2.4. Granulation of Biofertilisers
A laboratory drum granulator–dryer (a prototype of the granulator that is used in the production of commercial bulk fertilisers) was used to granulate waste-to-organic-biofertiliser. The particles of solid raw materials (BBM, BH, BHA, BM) measured ≤ 2 mm in diameter; different amounts of liquid phase, i.e., MS (ration molasses/water = 1:1 and 1:2), and BEs were used for the granulation process. Dry raw materials were qualitatively mixed, and then a liquid binder was added to the mixture of the raw materials and qualitatively mixed again. The granulation process was carried out according to the following conditions: the drum tilt angle was 5°, the rotation speed was 26 rpm/min, the operating temperature ranged from 65.1 ± 1.4 to 75.1 ± 1.8 °C, and the granulation cycle time was 10–15 min. The granulation experiment, which gave the best granulometric composition, was repeated three times to ensure the reliability of the results.
2.5. Size Distribution of Granular Biofertilisers
The particle distribution by diameter was determined using RETSCH (Retsch, GmbH, Haan, Germany) woven-wire sieves with aperture sizes of 0.2 mm, 0.5 mm, 1 mm, 2 mm, 3.15 mm, 4 mm, 5 mm, and 7 mm. Each fraction of different diameter granules was collected, weighed, and expressed as a percentage by mass. The commercial fraction of the product consisted of granules measuring 2–3.15 mm and 3.15–4 mm in size. Granules smaller than 2 mm and larger than 4 mm were collected separately; these can be returned to the process for recycling.
The average particle size of the fraction (d50) is a very important indicator of fertiliser technology efficiency and product sales. This is indicated as the size, which is smaller than 50% of the product mass and is bigger than 50% of mass. It was calculated [54] as follows:
where Zn—nominal sieve mesh size in mm, whose cumulative approaches but does not exceed 50% of the weight; Zn+1—the nominal sieve mesh size in mm, whose cumulative approaches and exceeds 50% of weight; Cn—cumulative weight in % on sieve n; Cn+1—cumulative weight (%) on sieve n+1.
Size guide number (SGN)—the diameter of the fertiliser granules based on the median—was calculated from the results of granulometric composition:
SGN = d50·100, mm
This means that half of the fertiliser granules are larger than the set SGN and another half are smaller [55,56,57].
2.6. Moisture Content of Granules
The moisture content of individual raw materials, each granulation mixture, and each granulated commercial product (the size of granules 2–3.15 mm and 3.15–4 mm) was determined with an electronic moisture analyser KERN MLS 50-3HA160N (KERN & Sohn GmbH, Balingen, Germany). The drying program uses a uniform increase in temperature of up to 120 °C, and the obtained moisture content result is given as a percentage. The measurements were repeated three times to ensure the reliability of the results.
2.7. Static Crushing Strength of Granules
The commercial fraction granules measuring 2–3.15 mm and 3.15–4 mm in diameter were separately used for static crushing strength measurements. To perform this study, 20 granules that were similar in size and shape were selected from each fraction. A crushing strength tester ИПГ-2 (AO “УHИXИM c OЗ”, Yekaterinburg, Russia) was used during the experiment [57]. Crushing strength is defined as the amount of compression (expressed as N/granule) applied to the granule until the first crack. Reliable measurements range from 5 to 200 N/granule.
2.8. pH Determination
To measure the pH values of the granulated product, the granules were filled with water (10% solution of biofertilisers), kept for 24 h, and filtered using a Buchner filtration system with a porcelain filter and a water pump. The pH values were determined with HANNA instruments: pH 211 microprocessor (HANNA instruments, Woonsocket, RI, USA) and pH-meter (pH accuracy ±0.01 pH, pH resolution 0.01 pH, measurement limits −2–+16 pH, temperature measurement interval −9.9–+120 °C).
2.9. Tapped Bulk Density
The bulk density of the biofertilisers was measured in accordance with European Standard, DIN EN 1236 [58] (tapped density). The general principle is to weigh the contents of a graduated 100 cm3 cylinder. For the tapped density, the cylinder is subject to vibrations and compaction occurs until a constant volume is reached. The calculated mass difference between the empty cylinder and the cylinder with the material is equal to the mass of the tapped material per volume unit. The bulk density (tapped) is expressed in grams per cubic centimetre (g/cm3 or kg/m3). The measurements were repeated twice to ensure the reliability of the results.
2.10. Hygroscopicity of Granular Biofertilisers
The study was performed by placing weighed biofertiliser granules of commercial fraction (2–4 mm size) into a porcelain dish and into a desiccator of two different environments: saturated water vapor and saturated sodium nitrite solution vapor. To determine the amount of moisture absorbed, the analysed samples were weighed daily until they reached a constant weight, or until mould began to be observed in the samples. During the experiment, the temperature in the water-filled desiccator was 21.5 ± 0.4 °C and the relative humidity was 99.5 ± 1.1%. The temperature in the desiccator filled with saturated sodium nitrite solution was 21.8 ± 1.6 °C, with a humidity of 62.4 ± 1.2%. The measurements were repeated twice to ensure the reliability of the results.
2.11. Scanning Electron Microscopy and Energy-Dispersive Spectroscopy Analysis
The morphological structure of biofertilisers was determined using a scanning electron microscope and energy-dispersive spectroscopy (SEM-EDS). Surface morphology, elemental composition, and a map of the elements were determined using the scanning electron microscope model S-3400N, (“Hitachi”, Tokyo, Japan). It has a built-in Bruker Quad 5040 EDS detector (“Hitachi”, Tokyo, Japan). The electron source was a pre-centred cartridge-type tungsten hairpin filament. The electron acceleration voltage was 15 kV. A secondary electron detector was used to produce a topographic SEM image.
2.12. Statistical Analysis
The studies on the properties of granular organic biofertilisers were repeated several times to ensure the reliability of the obtained results and to eliminate random errors. The results were expressed as the arithmetic mean of no less than three measurements ± standard deviation (SD). The results were calculated with 95% probability. In all cases, the significance level was p ≤ 0.05. One-way analysis of variance (ANOVA) was used to evaluate the differences of the means between groups.
3. Results and Discussion
All the above raw materials were mixed in various ratios and granulated by wet granulation with a drum granulator to obtain spherical granules. Different amounts of liquid binder (MS or BE) were used to improve the agglomeration of organic raw materials. Eight different fertiliser compositions were created from the above-mentioned dry raw materials and a binder:
- 20% BHA + 40% BH + 40% BBM + BE
- 20% BHA + 40% BH + 40% BBM + MS
- 40% BHA + 30% BH + 30% BBM + BE
- 40% BHA + 30% BH + 30% BBM + MS
- 20% BHA + 20% BH + 20% BBM + 40% BM +BE
- 20% BHA + 20% BH + 20% BBM + 40% BM +MS
- 40% BHA + 10% BH + 10% BBM + 40% BM +BE
- 40% BHA + 10% BH + 10% BBM + 40% BM +MS
Percentages of raw materials in the initial stage (compositions I–IV) were selected based on the amount of relevant waste generated in the industry. After analysing the properties of the granulated product with this composition, it was determined that the granules are not strong enough (less than 5 N/gran), so bone meal was additionally added to their composition (compositions V–VIII). Based on the chemical composition of bone meal [59,60] and personal experimental experience, it was assumed that its addition to the composition will increase the strength of granules and enrich organic biofertilisers with phosphorus and calcium.
According to compositions I–IV, when the moisture content of the raw material mixture ranged from 34% to 46%, the amount of commercial fraction (2–4 mm) of granulated fertilisers was up to 60%. The main properties of these granules vary depending on the ratio of solid raw materials, the binder used, and its amount. After granulating the mixture of raw materials, which contained less BHA than BH and BBM (compositions V, VI), the moisture content of the commercial product (2–4 mm) after drying was 5–7% with BE binder and 4–6% with MS binder. Prevalence of BHA over BH and BBM (compositions VII, VIII) resulted in similar (4–6%) moisture content of the commercial product.
The pH value of the 10% solution of the granular product was slightly higher when more ash was used compared to the product containing less ash, i.e., 10 and 8–9%, respectively. This is completely understandable and explained by the high alkalinity of the ash. It was observed that the binder does not affect the pH of the product.
The bulk density of the commercial product is slightly higher in the case where the mixture of raw materials contains more BHA than BH and BBM, i.e., in compositions III and IV, because the initial bulk density of ash is higher than that of other waste from the buckwheat groats industry.
However, when measuring the strength of the granules, it was found that the granules are very plastic and their static crushing strength is lower than the measuring limit of the device, i.e., less than 5 N/granule. Such plastic granules are not suitable for storage and transportation, so the fertiliser composition was changed by adding BM (compositions V–VIII).
Granulated and dried biofertilisers of compositions V–VIII were fractionated to determine the dependence of the granulometric composition and the amount of the commercial fraction on the composition of the raw material mixture (V–VIII) and moisture. As can be seen from Figure 1, the granulometric composition of individual compositions differs, but common features can also be found. In the case when the moisture content of the raw material mixture is between 31 and 34%, the 2–3.15 mm size fraction prevails, but many 1–2 mm size granules are also formed. As the moisture content of the raw material mixture increases (35–36%), the number of larger granules increases. The highest quantities (57–68%) of the commercial fraction of biofertilisers of different compositions (2–3.15 and 3.15–4 mm size granules) are obtained at a 32–35% moisture content of raw materials.
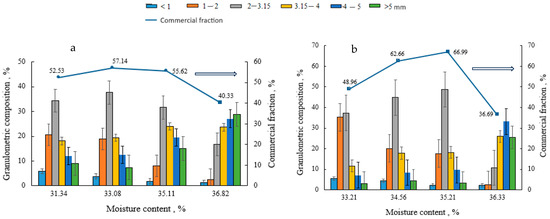
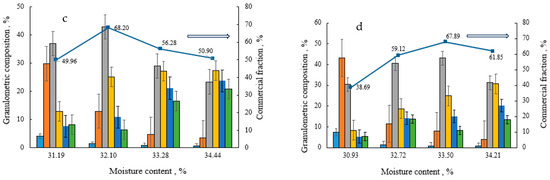
Figure 1.
Dependence of the granulometric composition and the amount of the commercial fraction on the moisture content and composition of the raw material mixture: (a) composition V; (b) composition VI; (c) composition VII, and (d) composition VIII. The arrow shows on which axis the data is presented.
It can also be concluded from the presented results that, when a lower amount of BHA is used (composition V and VI), more binder is needed to obtain a large amount of commercial fraction. The type of the binder does not significantly affect the amount of the commercial fraction.
The granulometric composition of the granulated product is directly related to two other parameters, d50 or SGN, which are usually called the characteristics of the granulated fertiliser. SGN measurements are essential when creating a bulk blend; however, they are important for all granular products, as these numbers indicate the uniformity of the fertiliser granules. Fertilisers (for bulk-blended fertilisers) with SGNs that have no more than a difference of 10 [61] are preferred because, as the difference in SGN increases, the unevenness of the fertiliser particle size increases, which leads to a high risk of product segregation during storage and spreading. In this study, these parameters (d50 and SGN) were also calculated and the SGNs of different samples are presented in Table 1.

Table 1.
SGN values of biofertiliser samples.
The obtained data show that not all cases produce enough granular product to calculate the SGN. An insufficient marketable fraction may be the result of using too little or too much binder. The difference between the SGNs of the fertiliser (Table 1) compositions VI and VIII (MS binder) is not great (less than 20) and it can be expected that spreading such fertilisers will be successful enough. However, in compositions V and VII (BE binder), the SGN difference is large (50–59), which means that the amount of BE has a significant influence on the granulometric composition. In this case, it is necessary to ensure a very homogeneous mixing of the raw materials before the mixture reaches the granulator.
The moisture content of the raw material mixtures prepared for granulation, as well as the physical properties of the granular product after drying at 80 °C to a constant mass, are presented in Table 2. These results, calculated with a 95% probability and standard deviation (±SD), are presented with each average value to provide an estimate of the variation in the data.
Table 2.
The main properties of the granular organic biofertilisers.
Since the commercial fertiliser fraction does not consist of granules of one particular size, it is important to know whether products of different sizes have the same, very similar, or different properties. To evaluate this, granules from two fractions (2–3.15 mm and 3.15–4 mm) were analysed. As can be seen from the data in Table 2, in cases where the moisture content of the raw material mixture is between 31 and 36%, more granules with a size of 2–3.15 mm are formed. However, when the moisture content of the raw material mixture is higher than 36%, larger granules are formed, i.e., 3.15–4 mm in size (samples 4 and 8).
This ratio between smaller and larger granules is not very favourable when evaluating the product in terms of static strength, because the 3.15–4 mm granules have higher strength. For example, in composition V, the strength of smaller granules varies between 7.89 and 9.71 N/granule, and in case of the larger ones, strength values fall into the interval of 8.50–13.46 N/granule; in composition VII, strength values range between 7.92 and 11.84 N/granule and 10.94–15.57 N/granule, respectively. It should be noted that the strength of the granules also depends on their composition. It is very important to note that, in compositions V–VIII, when BM was added to other raw materials, all granules became much stronger. When BE was used as a binder, granules with a raw material ratio of BHA:BH:BBM:BM = 2:2:2:4 (composition V) were weaker than granules from the raw material ratio BHA:BH:BBM:BM = 4:1:1:4 (composition VII). Analogous results can be seen in the case where MS was used as a binder. This means that BM and a higher BHA content increases the strength of the granules, and the waste from the buckwheat groat industry determines their plasticity. However, the origin of the binder does not significantly affect the strength of the granules. Based on the obtained data, it can be stated that the strength of the granules of the commercial fraction of compositions V–VIII is sufficient to spread them widely and to use the spinner disk at a high speed (>800 rpm) [61].
Another parameter of fertilisers that is important in determining properties such as granule static strength and bulk density is the moisture content of the commercial product. The moisture of mineral NPK fertilisers cannot exceed 2–3% [62,63], but when producing fertilisers from organic and biodegradable materials and using binders such as MS or BE, it was not possible to dry them up to the limit specified for mineral fertilisers. The moisture content of the granules was directly related to the size of the granules, i.e., larger granules had a higher moisture content. However, the difference was small. The moisture content of the commercial product also depends slightly on the binder used. With BE (compositions V and VII), the moisture content of the granules was slightly higher than with MS (compositions VII and VIII) at 4.39–6.80% and 3.26–6.17%, respectively.
Because, like all solid materials, fertilisers are compacted during transport or longer storage [64], the tapped bulk density of both fractions was measured, and it was found that the numerical value of this parameter depends very little on the size of granules. The bulk density of the raw materials (ground to particles smaller than 1 mm) was quite low and different: 503.2 kg/m3 of BHA, 476.7 kg/m3 of BH, 497.5 kg/m3 of BBM, and 680.71 kg/m3 of BM. This is in accordance with Malmgren’s statement: typically, fluffy and dry materials such as dry sawdust, straw, grass, and shredded paper are lighter than 200 kg/m3 [65]. However, after they are mixed, moistened with a binder, and granulated, the difference between the produced granules of the same compositions was small. As can be seen from Table 2, the data of bulk density vary: between 435.7 g/cm3 and 503.0 kg/m3 for composition V; between 489.7 kg/m3 and 521.0 kg/m3 for composition VI; between 497.8 kg/m3 and 567.8 kg/m3 for composition VII; between 551.2 kg/m3 and 619.9 kg/m3 for composition VIII. Analysing the influence of the composition, it can be stated that the tapped bulk density of the biofertilisers increases with the use of greater amounts of BHA and MS; however, the change is not significant. Similar bulk density is an important and positive factor, because, in this case, a constant storage volume is required, segregation during transportation is reduced, and the uniform spreading of fertilisers in the fields is ensured. A high bulk density is very important in packaging and transportation and is desirable as it can significantly reduce costs. However, since it is determined not only by the chosen granulation method but also by the raw materials, which in this case are light, the bulk density of the produced biofertilisers is not very high and does not equal the density of mineral NPK fertilisers, which is 900–1100 kg/m3 depending on the kind [66].
Analysis of the pH values of these organic biofertilisers shows that they are alkaline. A greater amount of BHA in the mixture of raw materials (compositions VII and VIII) increases their alkalinity from about 9.5 to 10.4. It is likely that such fertilisers could be used in acid soils and act as liming agents.
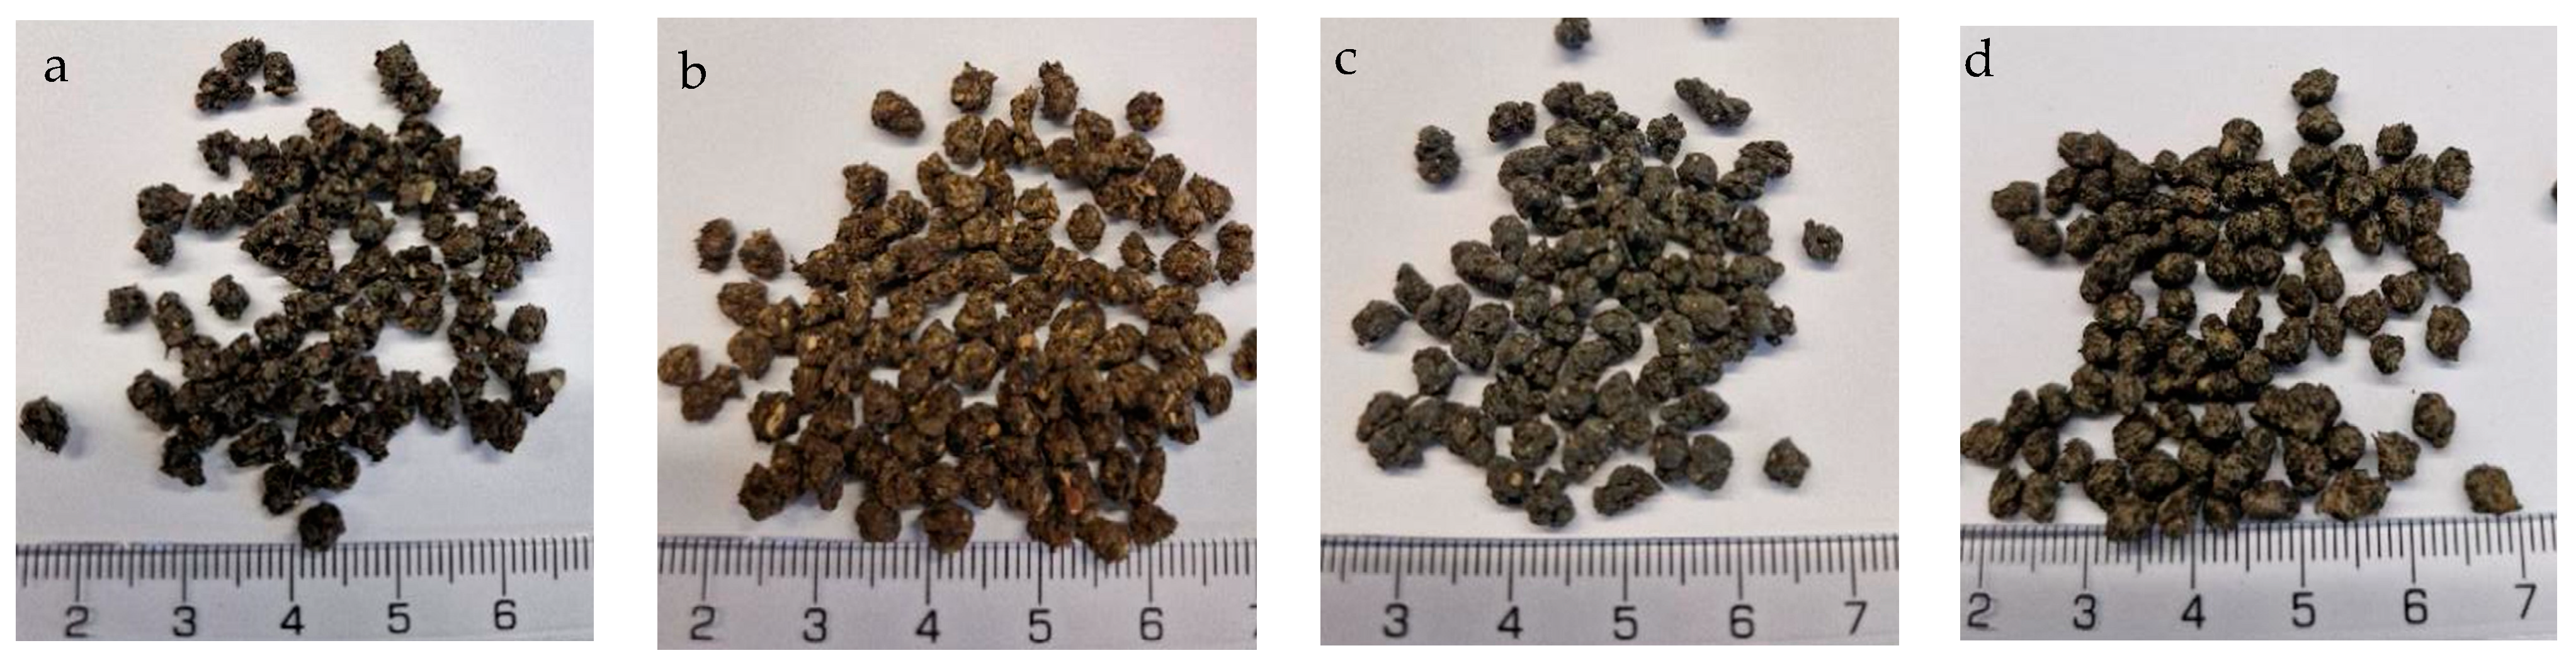
Particle shape can vary among fertilisers and can be classified as round (spherical or egg-shaped), cubic, rectangular, or irregular. The shape can influence the behaviour of material during conveyance and fertilization. Round particles generally roll along and then roll off the spinner vanes. Irregularly shaped particles tend to slide along the vanes; here, the coefficient of friction is more influential on particle dynamics, such as exit velocity, than it is in the case of spherical particles [67]. In this case, irregularly shaped granules are spread on the soil surface less evenly than spherical ones. Therefore, the shape and homogeneity of fertilisers of different compositions were evaluated both visually (Figure 2) and by SEM-EDS methods (Figure 3).
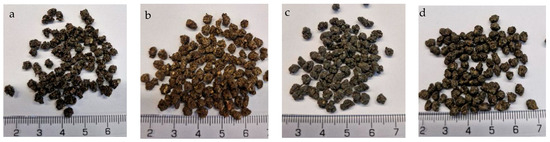
Figure 2.
Images of granular product (size 3.15–4 mm) samples: (a) 2; (b) 7; (c) 10; (d) 15.
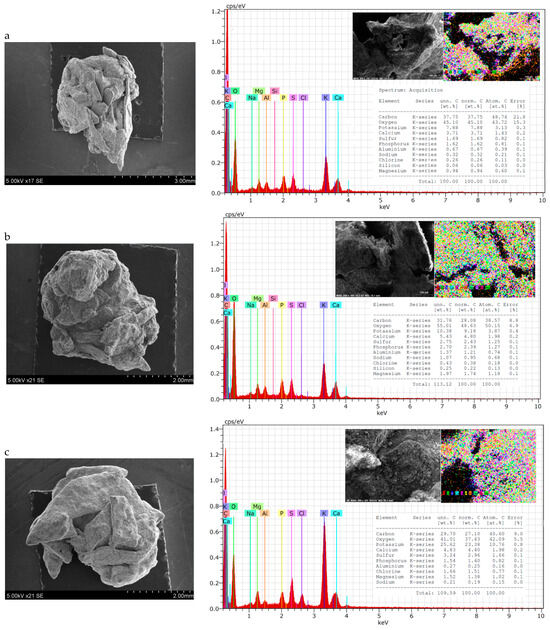

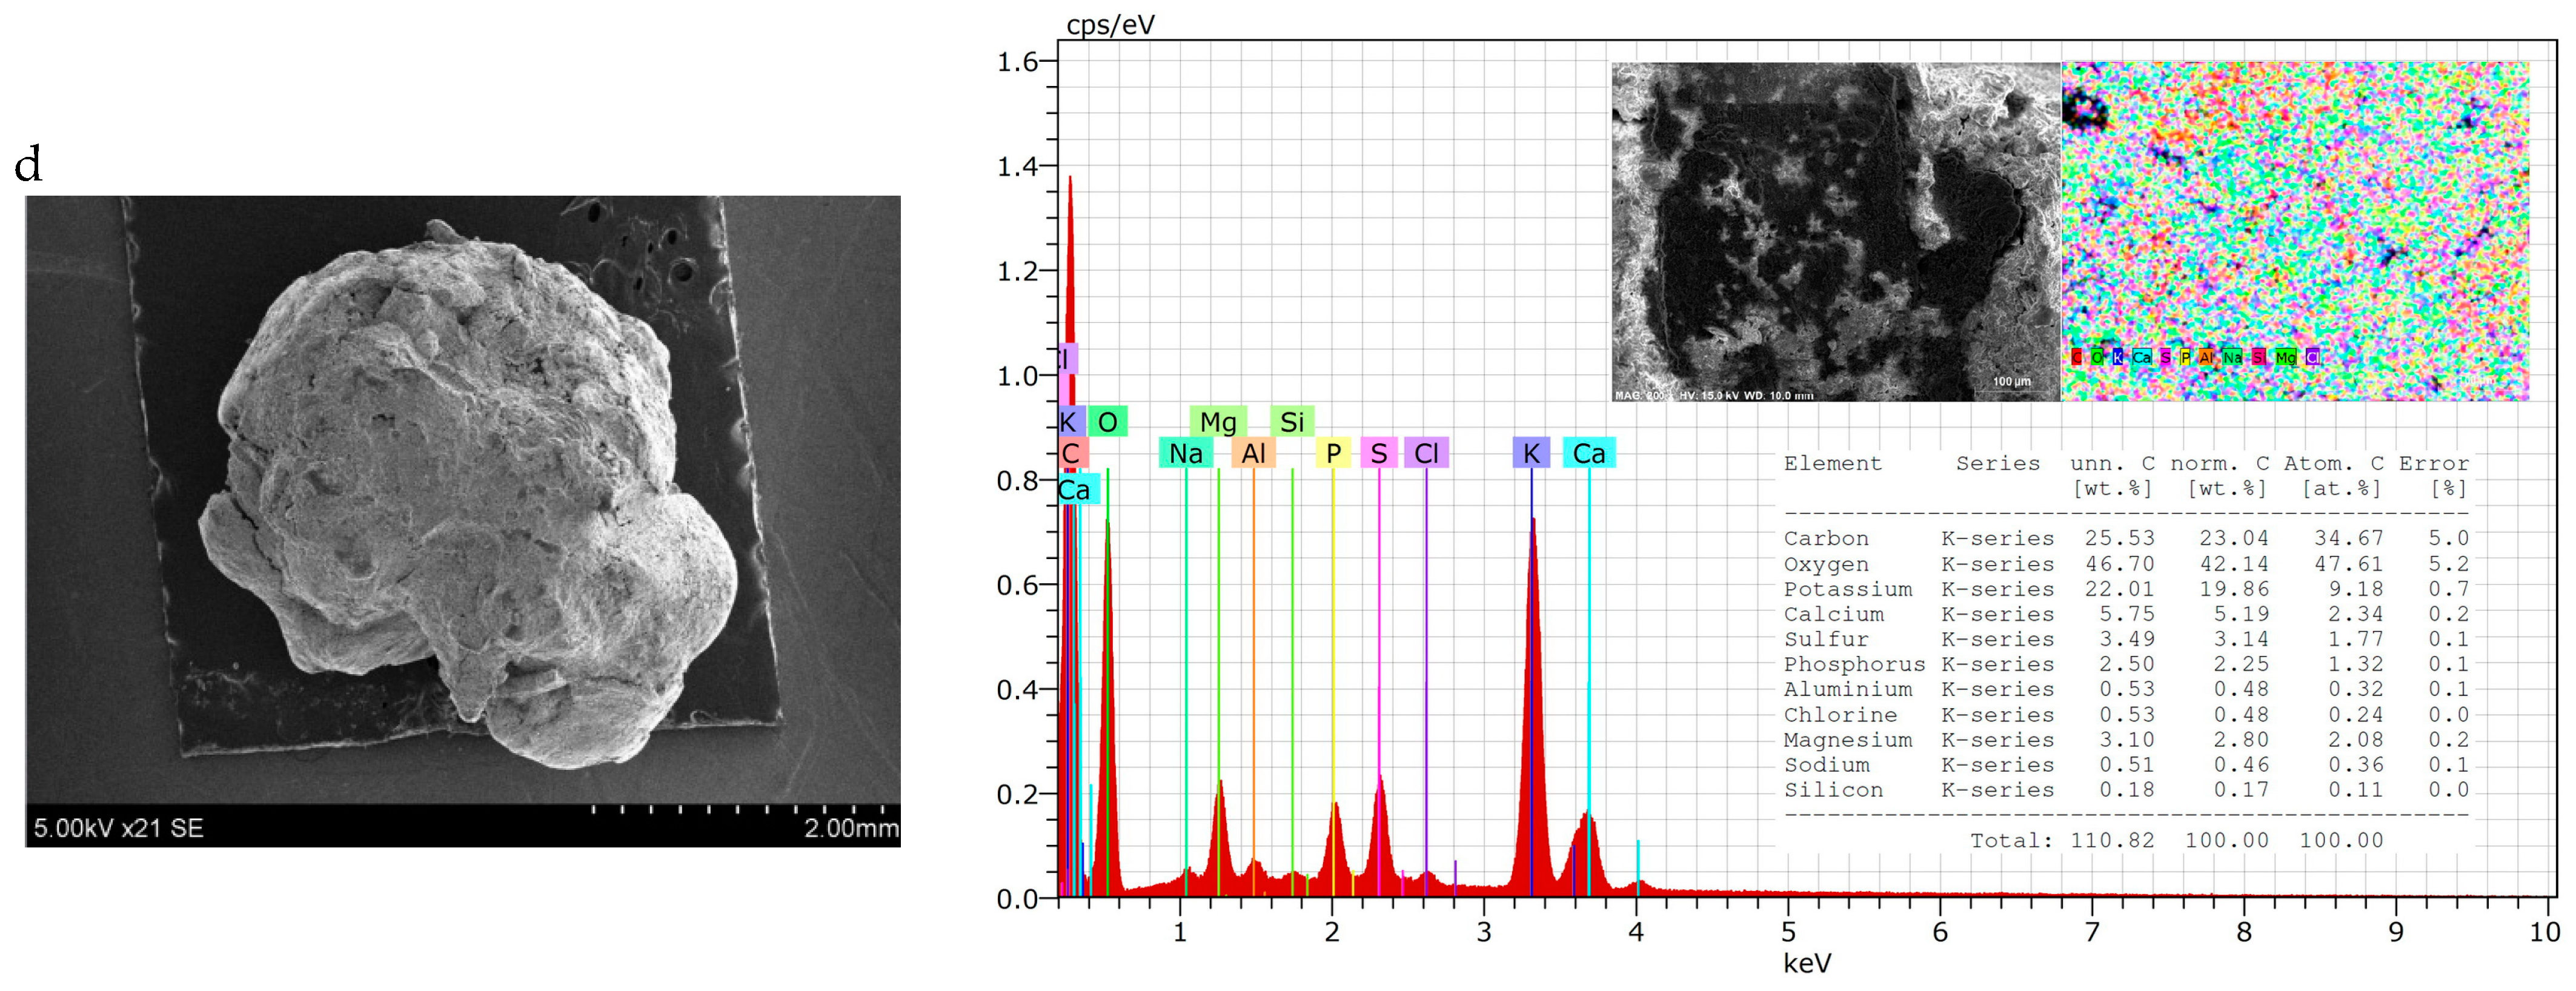
Figure 3.
SEM–EDS data of granular product (size 3.15–4 mm) samples: (a) 2; (b) 7; (c) 10; (d) 15.
From the photos in Figure 2, it can be seen that the shape of the granules is spherical in all cases, but there are more angles and irregularities when the BE binder was used (composition V and VII). This can be explained by the fact that it was more complicated to mix raw materials, because BE itself is not in a homogeneous liquid phase. It is possible to draw the same conclusion from the results of the PGI analysis—it is necessary to ensure a very homogeneous mixing of the raw materials before they reach the granulator.
Although the general shape of the biofertiliser granules can be seen from the photographs, a more accurate evaluation of the shape and homogeneity of the granules came from the SEM–EDS data. It can be seen from the presented SEM photographs that, when BE was used for agglomeration of dry raw materials (Figure 3a,c), the granules were spherical, but they were quite angular and their surface was rough, with cavities and bumps. Meanwhile, when MS was used as a binder (Figure 3b,d), the granules were round, and their surface was more uniform. These differences in granule shape and surface can be explained by the physical properties of the binder. BE is a heterogeneous system consisting of both liquid (egg yolk and protein) and solid (crushed eggshell) phases, so its uniform distribution among dry raw materials is problematic. MS, on the other hand, is a homogeneous solution that, after mixing, distributes itself evenly throughout the raw material mixture and fills the spaces between the particles without any problems.
Analysing the EDS maps of elements, it can be seen that the elements are distributed quite evenly on the surface. The spectra show the same main elements arranged in an analogous sequence according to decreasing concentration: carbon, oxygen, potassium, calcium, sulphur, phosphorus, etc. However, the concentration of these elements varies in different samples. Fertiliser compositions VII and VIII, with higher BHA content, contain less carbon (~25–30%) but more potassium (~22–26%) compared with fertiliser compositions V and VI, with lower BHA content. Here, the carbon content is ~32–38% and the potassium content is ~8–10%. All the tested fertiliser samples contained 2–4% S, 4–6% Ca, and up to 3% Mg. However, it is very strange that nitrogen was not found when testing fertilisers using this method, although its concentration is not low and ranges from 3.56% to 4.73% when chemical analysis methods (Table 3) are applied.
Table 3.
Concentrations of primary and secondary macronutrients in the biofertiliser samples.
It is important to mention that the numerical values of the concentrations of some other plant nutrients, such as P (as P2O5), calcium (as CaO), and magnesium (as MgO), determined by chemical analysis methods (Table 3), correlate well with the data of element maps (Figure 3). However, in samples 10 and 15, a significantly lower concentration of potassium (as K2O) was determined by the chemical analysis (Table 3) method than by EDS (Figure 3). Evaluating the composition of sample 10 (composition V) and sample 15 (composition VI), it can be assumed that this is due to the insoluble form of potassium present in the ash.
Because all fertilisers are more or less hygroscopic (which means that they start to absorb moisture at a specific level of humidity or at a certain water vapour pressure; this plays a role in fertiliser losses during storage [68]), the hygroscopicity of the granular products was determined (Figure 4).
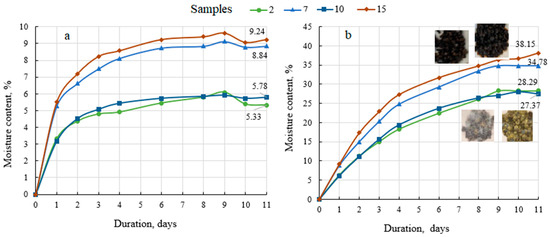
Figure 4.
Hygroscopicity data of biofertilisers under different conditions in the surroundings: (a) saturated NaNO2 solution at 21.8 ± 0.6 °C and humidity 62.4 ± 1.2%; (b) H2O at 21.5 ± 0.4 °C and the relative humidity 99.5 ± 1.1%.
Figure 4 shows that these are classical absorption curves, in that they initially rise upwards while the biofertiliser absorbs moisture from the environment and fluctuate minimally depending on environmental conditions once equilibrium is reached. When the biofertiliser samples are stored in a saturated sodium nitrite environment (62–63% of relative humidity), the equilibrium is reached after 4–5 days and the maximum absorbed moisture content is 5–6% with the BE binder and 8–9% with the MS binder (Figure 4a). Unlike mineral fertilisers [67], organic biofertilisers are not under threat of caking, but they start to mould due to the bioactive substances in the fertiliser. Mould was recorded in all biofertiliser samples after 5–7 days of storage in an environment of 99.5% relative humidity of water vapour. Again, the moisture uptake was higher in the biofertilisers with MS as the binder than in the fertiliser granulated with BE, i.e., 35–38% and 27–28%, respectively. Such absorption is significant and may have undesirable consequences for fertiliser products: the particles gradually become soft and sticky, the particles begin to break up and discolour, and the strength of the particles decreases [69]. Therefore, such fertilisers require appropriate storage conditions or the selection and application of biodegradable coatings on the fertiliser in the conditioning drums. However, given that such organic fertilisers are already classified as slow-release fertilisers, a coating would further slowdown the entry of nutrients into the plant.
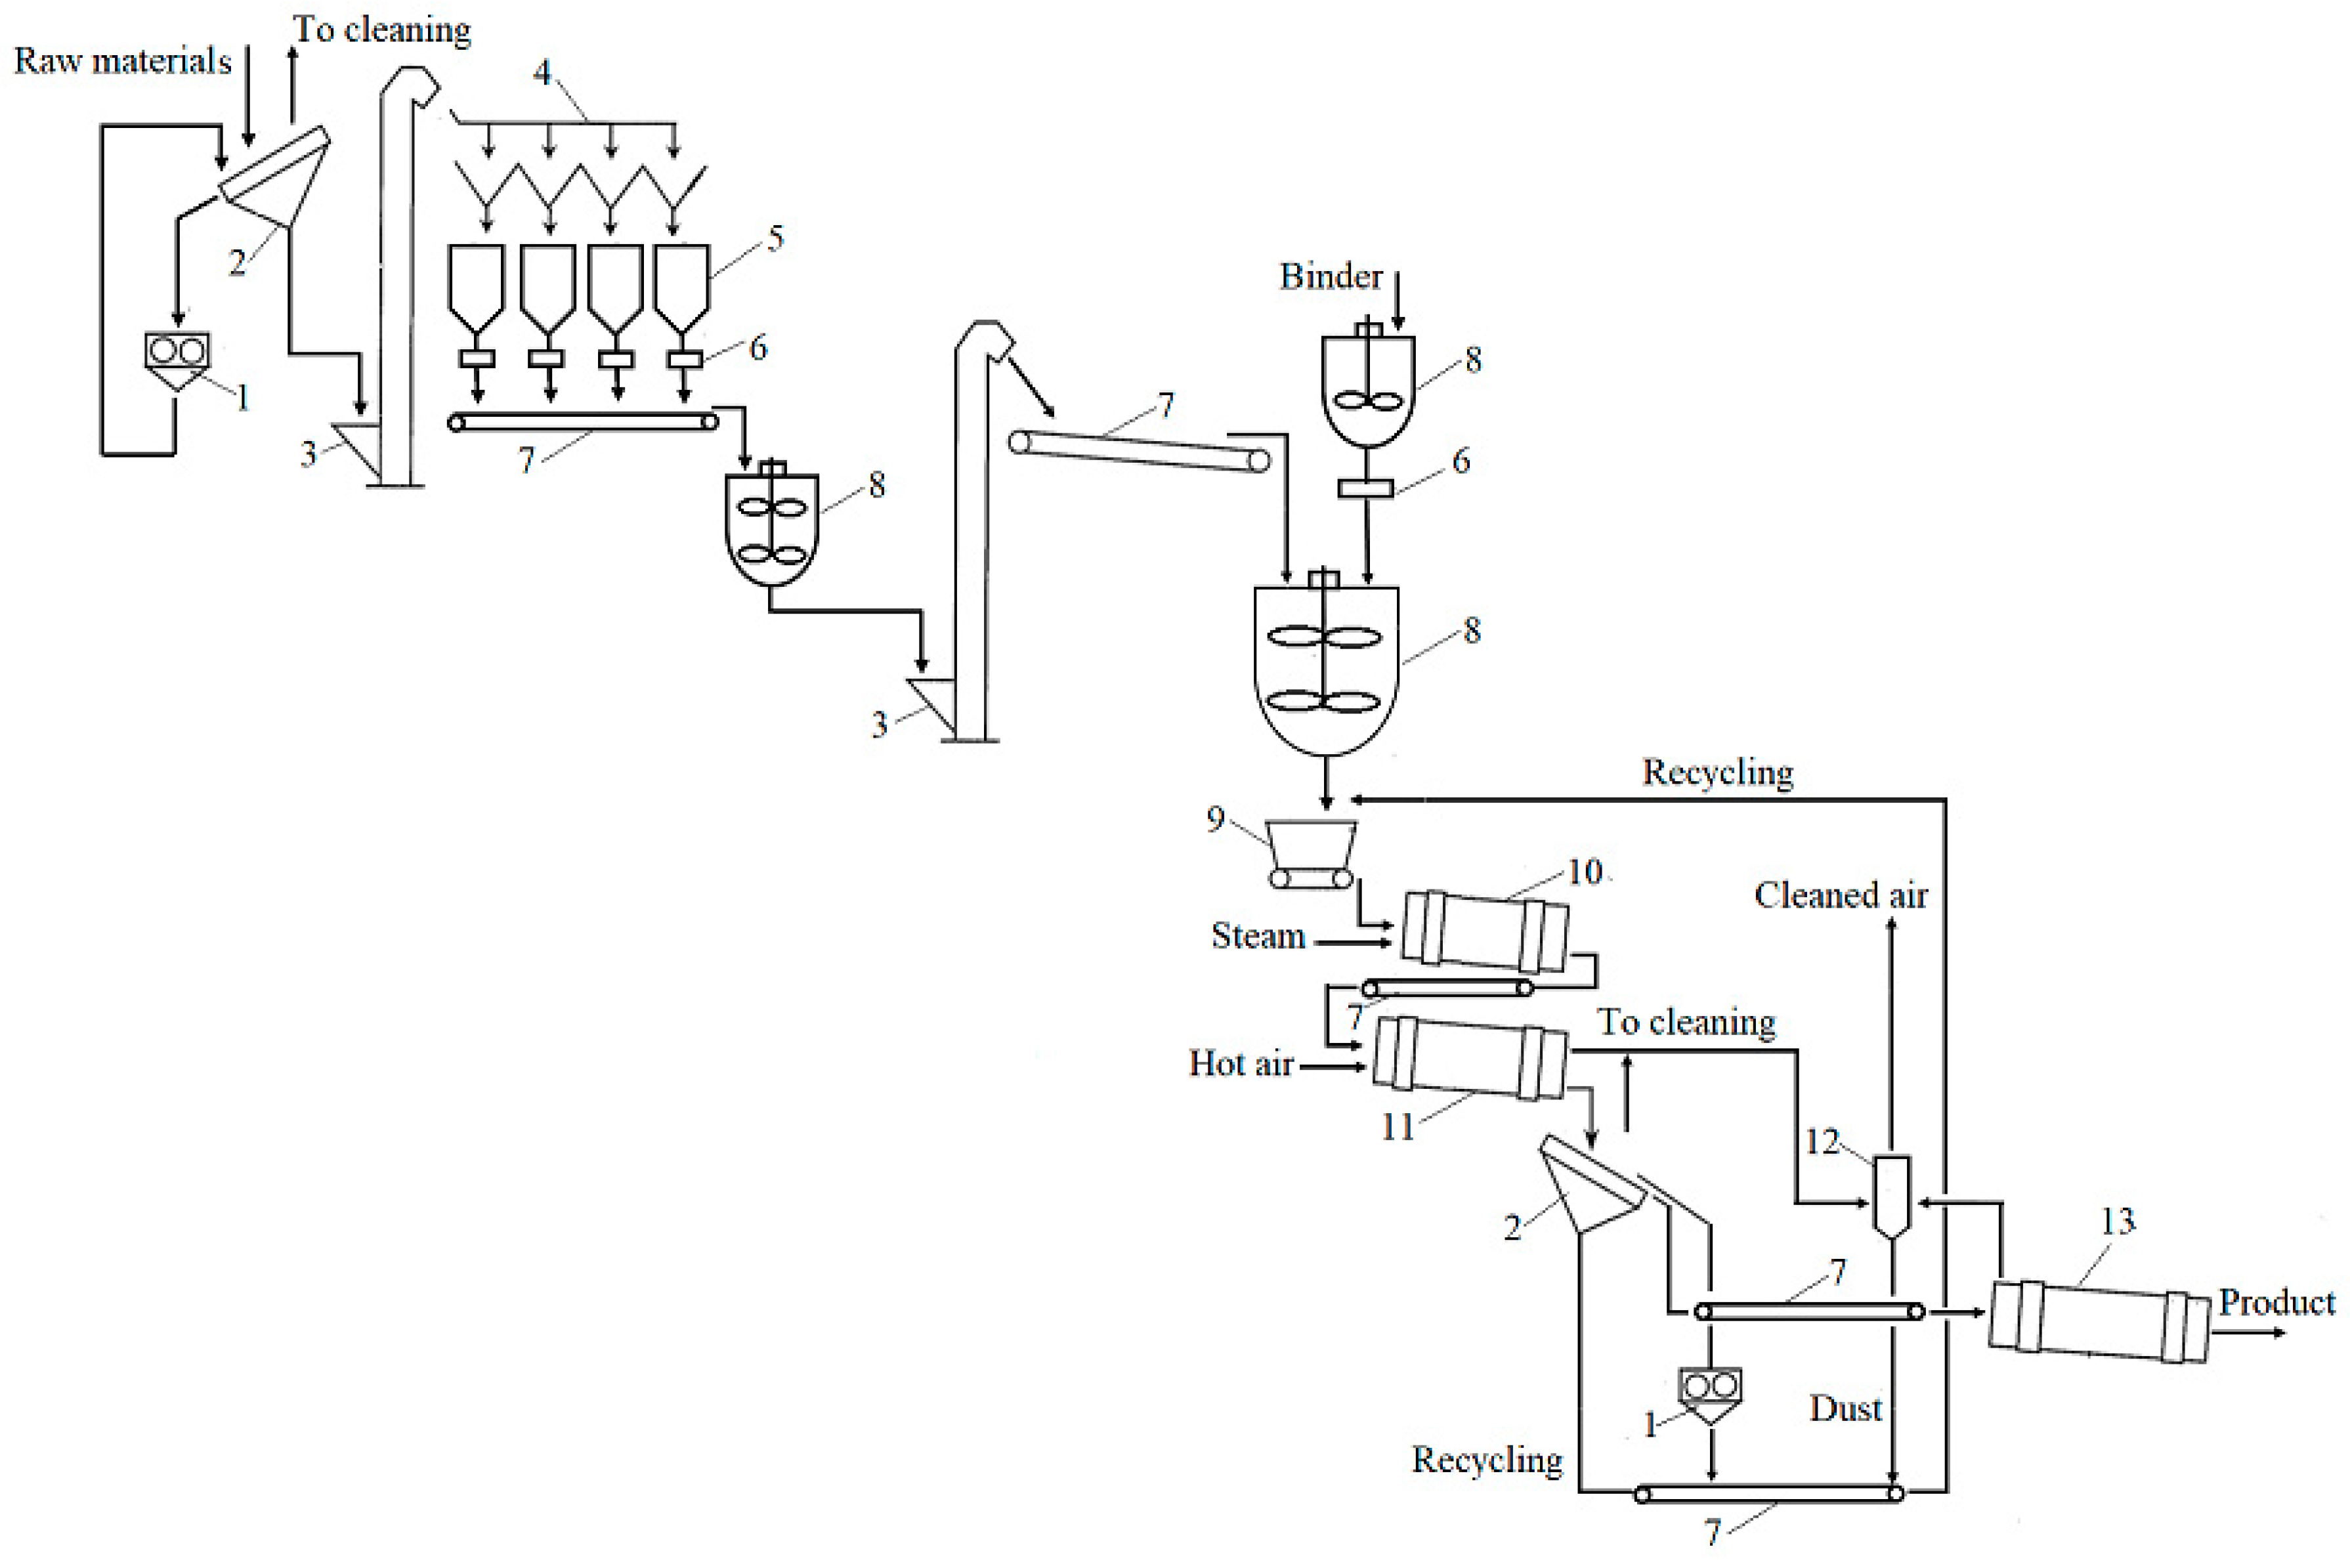
The evaluation of the granulation of these organic biofertilisers under laboratory conditions and of the properties such as the granulometric composition and moisture content of the product, allows one to distinguish the main stages of production of organic biofertilisers, as follows: preparation of the raw materials and the binder; mixing of the solid and liquid raw materials; granulation; fractionation; return of recycled material; drying; packaging; storage. All these stages are presented in Figure 5 as a technological scheme of the principal process.
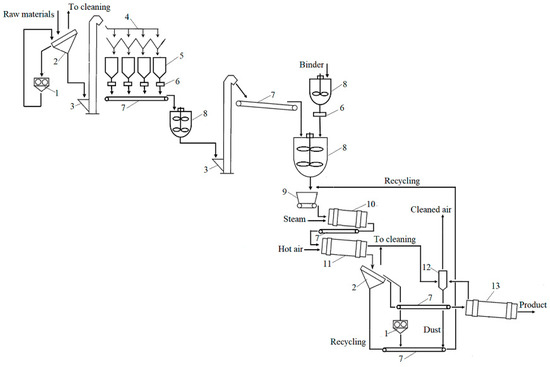
Figure 5.
Technological scheme to produce granular organic biofertilisers: 1—mill; 2—sieves; 3—elevator; 4—distribution device; 5—container; 6—dispenser-scale; 7—transporter; 8—container with mixer; 9—dispenser–distributor; 10—drum granulator; 11—drum dryer; 12—cyclone; 13—cooling drum.
The technological scheme primarily shows the sieving of the raw materials, the crushing of oversized particles (larger than 2 mm), and their distribution into containers. Before entering the mixer, the raw materials are weighed and then fed into another larger mixer, where the raw materials are mixed with the binder. Wetted raw materials are supplied to the drum granulator through a distribution dispenser, and then they move to the dryer. If necessary, steam can be supplied to the granulator, and warm air is supplied to the dryer. After drying, the product must be sieved, because, according to the results of the experiment, a certain number of granules smaller than 2 mm and larger than 4 mm is always formed; such granules are recycled back into the technological line. The appropriate-sized commercial fraction (2–4 mm) is cooled and stored. Because dusty air is produced during the crushing, sieving, and drying processes, it will be cleaned using a cyclone.
Analysis of the results of this study makes it obvious that the quality of the developed product should be improved, and this should primarily be performed by maximising the amount of commercial fraction and by minimizing the moisture content of this fraction to ensure the desired granule size and strength. Also, is very important that the raw material mixture should be mixed well before granulation to achieve the desired granule shape and size; this is especially the case when using BE, which is responsible for an irregular shape of granules. The correct shape, size, and density of the granules ensures that they are evenly distributed over the soil surface. Better drying is likely to ensure the long-term stability of the product, which is an important factor for fertilisers. The influence of the recycled fraction (the formation of which is inevitable and provided for in the technological scheme) on the granulation process should also be analysed and taken into account. Solving all these problems would further improve the quality of the created organic bio-fertilisers and their competitiveness; granular organic fertilisers are often designed for slow-release applications [70], providing a steady supply of nutrients over an extended period of time. This slow-release feature helps prevent nutrient leaching and reduces the risk of nutrient runoff. Like other organic fertilisers, these would have a dual effect—improving both plant growth and soil properties by increasing the amount of organic matter and reducing acidity.
4. Conclusions
All the analysed industrial wastes from food production—buckwheat biomass (BBM), buckwheat husks (BH), buckwheat husk ash (BHA), bone meals (BMs) from animal by-products, molasses solution (MS), and beaten eggs (BE)—are suitable for use in the production of organic biofertilisers. The moisture content of the raw material mixture significantly influences the size distribution of granules. At a moisture level of 32–35%, 57–68% of the produced biofertilisers are of the commercial fraction (2–4 mm size). A lower amount of BHA in the raw material mixture requires more binder to obtain a higher commercial fraction; however, of the type of binder does not affect this outcome.
SGN values are a key parameter in the uniformity of the products. Depending on the composition and the binder used, SGN values range across wider or narrower intervals. When MS is used, SGN values are less than 20, and when BE is used, the differences between SGA values are large (up to 60). Variations were observed using the BE binder, requiring the homogenization of the raw material mixture prior to granulation.
Larger granules exhibit higher static strength values (7.89–13.46 N/granule) compared to smaller ones (7.92–15.57 N/granule). Adding bone meal (BM) enhances the strength of all granules, indicating its significant contribution to the product’s mechanical properties; meanwhile, the choice of binder has minimal impact on granule strength.
The moisture content of organic fertilisers slightly exceeds the acceptable 3% norm for mineral NPK fertilisers, but the product remains stable for a long time (up to 8 months) when stored in ambient conditions.
Spherical granules were produced in all cases, but those produced with BE binders exhibit more angularity and irregularities, which could be due to the heterogeneous nature of the binder. SEM-EDS analysis confirms that produced with BE binder granules are spherical yet angular with rough surfaces, while those made with MS binders are rounder and more uniform.
Analysis of EDS maps reveals an even distribution of elements on the fertiliser surface, with carbon, oxygen, potassium, calcium, sulphur, and phosphorus among the main elements identified. Fertilisers containing higher BHA content have a lower carbon (~25–30%) concentration but they are richer in potassium (~22–26%). Chemical analysis indicates nitrogen (Ntotal) concentrations ranging from 3.56% to 4.73%, phosphorus (P2O5) concentrations ranging from 4.26% to 6.23%, potassium (K2O) concentrations ranging from 6.47% to 12.37%, calcium (CaO) concentrations ranging from 2.10% to 3.85%, and magnesium (MgO) concentrations ranging from 1.13% to 2.06%.
Such fertilisers can be used in acidic soil, as their 10% solution has pH values of 9–10.
Author Contributions
Conceptualization, R.Š.; methodology, O.P.; formal analysis, O.P.; data curation, O.P. and R.Š.; writing—original draft preparation, O.P. and R.Š.; writing—review and editing, R.Š. and O.P.; visualization, O.P. and R.Š.; supervision, R.Š. All authors have read and agreed to the published version of the manuscript.
Funding
This research received no external funding.
Institutional Review Board Statement
Not applicable.
Informed Consent Statement
Not applicable.
Data Availability Statement
The raw data supporting the conclusions of this article will be made available by the authors on request.
Conflicts of Interest
The authors declare no conflicts of interest.
References
- The World Bank. Research Newsletter: Food and Nutrition Security. 2024. Available online: https://www.worldbank.org/en/research/brief/research-newsletter-food-and-nutrition-security-february-2024 (accessed on 5 April 2024).
- Ranganathan, J.; Waite, R.; Searchinger, T.; Hanson, C. How to Sustainably Feed 10 Billion People by 2050, in 21 Charts. World Resources Institute, 2018. Available online: https://www.wri.org/insights/how-sustainably-feed-10-billion-people-2050-21-charts (accessed on 14 May 2024).
- Agricen. Growing for the Future. Available online: https://www.agricen.com/access-growing-future-booklet (accessed on 12 April 2024).
- Sutton, M.A.; Bleeker, A.; Howard, C.M.; Erisman, J.W.; Abrol, Y.P.; Bekunda, M.; Datta, A.; Davidson, E.; Vries, W.d.; Oenema, O.; et al. Our Nutrient World Centre for Ecology and Hydrology (CEH); UK Centre for Ecology & Hydrology: Edinburgh UK, 2013; p. 128. ISBN 978-1-906698-40-9. [Google Scholar]
- Javed, A.; Ali, E.; Afzal, K.B.; Osman, A.; Riaz, S. Soil Fertility: Factors Affecting Soil Fertility, and Biodiversity. Responsible for Soil Fertility. Int. J. Plant Anim. Environ. Sci. 2022, 12, 21–33. [Google Scholar] [CrossRef]
- YARA. Kowledge Grows. Why Do Plants Need Fertilizers? 2024. Available online: https://www.yara.com/knowledge-grows/why-do-plants-need-fertilizers/ (accessed on 14 May 2024).
- IFA. Micronutrients. How Fertilizers Help to Address the Problems of Hunger and Malnutrition. 2023. Available online: https://www.fertilizer.org/key-priorities/human-nutrition/micronutrients/ (accessed on 12 April 2024).
- Pahalvi, H.N.; Rafiya, L.; Rashid, S.; Nisar, B.; Kamili, A.N. Chemical Fertilizers and Their Impact on Soil Health. Microbiota and Biofertilizers. 2021, Volume 2, pp. 1–20. Available online: https://link.springer.com/chapter/10.1007/978-3-030-61010-4_1 (accessed on 4 June 2024).
- Roy, R.N.; Finck, A.; Blair, G.J.; Tandon, H.L.S. Plant Nutrition for Food Security. FAO Fertilizer and Plant Nutrition Bulletin 16. Available online: https://www.fao.org/3/a0443e/a0443e.pdf (accessed on 14 May 2024).
- IFA. Re-Thinking the Role of Plant Nutrients. Food System Summit. 2022. Available online: https://www.scribd.com/document/521183161/2021-IFA-Re-thinking-the-Role-of-Plant-Nutrients (accessed on 12 April 2024).
- Ayilara, M.S.; Olanrewaju, O.S.; Babalola, O.O.; Odeyemi, O. Waste Management through Composting: Challenges and Potentials. Sustainability 2020, 12, 4456. [Google Scholar] [CrossRef]
- Szymańska, M.; Gubiec, W.; Smreczak, B.; Ukalska-Jaruga, A.; Sosulski, T. How Does Specialization in Agricultural Production Affect Soil Health? Agriculture 2024, 14, 424. [Google Scholar] [CrossRef]
- Buneviciene, K.; Drapanauskaite, D.; Mazeika, R.; Baltrusaitis, J.A. Mixture of Green Waste Compost and Biomass Combustion Ash for Recycled Nutrient Delivery to Soil. Agronomy 2021, 11, 641. [Google Scholar] [CrossRef]
- Wambacq, E.; Alloul, A.; Grunert, O.; Carrette, J.; Vermeir, P.; Spanoghe, J.; Sakarika, M.; Vlaeminck, S.E.; Haesaert, G. Aerobes and phototrophs as microbial organic fertilizers: Exploring mineralization, fertilization and plant protection features. PLoS ONE 2022, 17, e0262497. [Google Scholar] [CrossRef] [PubMed]
- A New Paradigm for Plant Nutrition. The Scientific Group for the UN Food Systems Summit. 2021. Available online: https://sc-fss2021.org/wp-content/uploads/2021/03/FSS_Brief_New_Paradigm_for_Plant_Nutrition.pdf (accessed on 7 May 2024).
- Yadav, K.K.; Sarkar, S.S. Biofertilizers, Impact on Soil Fertility and Crop Productivity under Sustainable Agriculture. 2018. Available online: https://www.researchgate.net/publication/329238918_Biofertilizers_Impact_on_Soil_Fertility_and_Crop_Productivity_under_Sustainable_Agriculture (accessed on 14 June 2024).
- The World Bank. Press Realease. Global Waste to Grow by 70 Percent by 2050 Unless Urgent Action is Taken: World Bank Report. 2018. Available online: https://www.worldbank.org/en/news/press-release/2018/09/20/global-waste-to-grow-by-70-percent-by-2050-unless-urgent-action-is-taken-world-bank-report (accessed on 4 April 2024).
- FAO. Food Wastage Footprint. Impacts on Natural Resources. Summary Raport. 2013. Available online: https://www.fao.org/3/i3347e/i3347e.pdf (accessed on 8 April 2024).
- Karps, O.; Aboltins, A.; Palabinskis, J. Biomass ash utilization opportunities in agriculture. In Proceedings of the 8th International Scientific Conference, Kaunas, Lithuania, 23–24 November 2017; Aleksandras Stulginskis University: Kaunas, Lithuania, 2017; pp. 193–198. [Google Scholar] [CrossRef]
- Stankowski, S.; Chajduk, E.; Osińska, B.; Gibczyńska, M. Biomass ash as a potential raw material for the production of mineral fertilisers. Agron. Res. 2021, 19, 1999–2012. [Google Scholar] [CrossRef]
- Chew, K.W.; Chia, S.R.; Yen, H.-W.; Nomanbhay, S.; Ho, Y.-C.; Show, P.L. Transformation of Biomass Waste into Sustainable Organic Fertilizers. Sustainability 2019, 11, 2266. [Google Scholar] [CrossRef]
- Greinert, A.; Mrówczyńska, M.; Szefner, W. Study on the Possibilities of Natural Use of Ash Granulate Obtained from the Combustion of Pellets from Plant Biomass. Energies 2019, 12, 2569. [Google Scholar] [CrossRef]
- Bhatia, L.; Jha, H.; Sarkar, T.; Sarangi, P.K. Food Waste Utilization for Reducing Carbon Footprints towards Sustainable and Cleaner Environment: A Review. Int. J. Environ. Res. Public Health 2023, 20, 2318. [Google Scholar] [CrossRef]
- Yang, M.; Chen, L.; Wang, J.; Msigwa, G.; Osman, A.I.; Fawzy, S.; Rooney, D.W.; Yap, P.-S. Circular economy strategies for combating climate change and other environmental issues. Environ. Chem. Lett. 2023, 21, 55–80. [Google Scholar] [CrossRef]
- Thomson, A.; Price, G.; Arnold, P.; Dixon, M.; Graham, T. Review of the potential for recycling CO2 from organic waste composting into plant production under controlled environment agriculture. J. Clean. Prod. 2022, 333, 130051. [Google Scholar] [CrossRef]
- Chemicals & Waste. 2023. Available online: https://www.foodpackagingforum.org/news/world-health-assembly-adopts-resolution-on-chemicals-waste-and-pollution (accessed on 14 March 2024).
- Rayara, T.; Basheer-Salimia, R.; Hawamde, F.; Sánchez, A. Recycling of Organic Wastes through Composting: Process Performance and Compost Application in Agriculture. Agronomy 2020, 10, 1838. [Google Scholar] [CrossRef]
- Hajam, Y.A.; Kumar, R.; Kumar, A. Environmental waste management strategies and vermi transformation for sustainable development. Environ. Chall. 2023, 13, 100747. [Google Scholar] [CrossRef]
- Elema, W.R. Preparation and characterization of vermicompost made from different sources of materials. Environ. Sci. Agric. Food Sci. 2021, 6, 42–48. [Google Scholar] [CrossRef]
- Choudhary, A.K.; Suri, V.K. Low-Cost Vermi-Composting Technology and Its Application in Bio-Conversion of Obnoxious Weed Flora of North-Western Himalayas into Vermi-Compost. Commun. Soil Sci. Plant Anal. 2018, 49, 1429–1441. [Google Scholar] [CrossRef]
- Al-Rumaihi, A.; Shahbaz, M.; Mckay, G.; Mackey, H.; Al-Ansari, T. A review of pyrolysis technologies and feedstock: A blending approach for plastic and biomass towards optimum biochar yield. Renew. Sustain. Energy Rev. 2022, 167, 112715. [Google Scholar] [CrossRef]
- Tripathi, M.; Sahu, J.N.; Ganesan, P. Effect of process parameters on production of biochar from biomass waste through pyrolysis: A review. Renew. Sustain. Energy Rev. 2016, 55, 467–481. [Google Scholar] [CrossRef]
- Biogreen Apart of VOW. Pyrolisis-Definition. Available online: https://www.biogreen-energy.com/what-is-pyrolysis (accessed on 12 April 2024).
- Bacher, C.; Olsen, P.M.; Bertelsen, P.; Sonnergaard, J.M. Compressibility and compactibility of granules produced by wet and dry granulation. Int. J. Pharm. 2008, 358, 69–74. [Google Scholar] [CrossRef]
- Burchart-Korol, D.; Korol, J.; Francik, P. Application of the new mixing and granulation technology of raw materials for iron ore sintering process. Metal. Zagreb 2012, 51, 187–190. [Google Scholar]
- Espacenet Patent Search. Screen Drum Device for Drying and Screening Granular Organic Fertilizer. CN216368875U, 26 April 2022. Available online: https://worldwide.espacenet.com/patent/search/family/081247970/publication/CN216368875U?q=CN216368875U (accessed on 12 April 2024).
- Espacenet Patent Search. Granular Bio-Organic Fertilizer and Production Process Thereof. CN115710139A, 24 February 2023. Available online: https://worldwide.espacenet.com/patent/search/family/085236095/publication/CN115710139A?q=CN115710139A (accessed on 12 April 2024).
- Fertilizers Europe. Guidance for the Storage, Handling and Transportation of Solid Mineral Fertilizers. 2015. Available online: https://www.fertilizerseurope.com/wp-content/uploads/2007/08/Final-version-Storage-handling-and-transport-of-solid-fertilizers-18112015.pdf (accessed on 3 May 2024).
- Malman, J. Granulation of Fertilizers: Overview and Equipment Selection. Metso. 2020. Available online: https://www.metso.com/insights/blog/mining-and-metals/granulation-of-fertilizers-overview-and-equipment-selection/ (accessed on 6 April 2024).
- Espacenet Patent Search. Granular Organic Fertilizer Production Line. CN202829863U, 27 March 2013. [Google Scholar]
- Espacenet Patent Search. Roller Granulator for Producing Granular Organic Fertilizer. CN215783204U, 11 February 2022. [Google Scholar]
- De Simone, V.; Caccavo, D.; Lamberti, G.; D’Amore, M.; Barba, A.A. Wet-granulation process: Phenomenological analysis and process parameters optimization. Powder Technol. 2018, 340, 411–419. [Google Scholar] [CrossRef]
- Le Capitaine, S. Systems for Granular Fertilizer and Soil Amendment Production. Feeco International. Available online: https://feeco.com/systems-for-granular-fertilizer-and-soil-amendment-production/ (accessed on 6 March 2024).
- Reserch and Markets. Organic Fertilizer Market: Trends, Opportunities and Competitive Analysis to 2030. Available online: https://www.researchandmarkets.com/reports/5691830/global-organic-fertilizer-market-to-2027 (accessed on 6 April 2024).
- Jha, R.; Zhang, K.; He, Y.; Mendler-Drienyovszki, N.; Magyar-T’abori, K.; Quinet, M.; Germ, M.; Kreft, I.; Meglic, V.; Ikeda, K.; et al. Global nutritional challenges and opportunities: Buckwheat, a potential bridge between nutrient deficiency and food security. Trends Food Sci. Technol. 2024, 145, 104365. [Google Scholar] [CrossRef]
- Pociene, O.; Slinksiene, R. Studies on the Possibilities of Processing Buckwheat Husks and Ash in the Production of Environmentally Friendly Fertilizers. Agric. Basel 2022, 12, 193. [Google Scholar] [CrossRef]
- BIOVAST. Available online: https://www.biovast.lt/en/apie-mus/rietavas-2/ (accessed on 23 April 2024).
- LST EN 17053:2018. 2018. Available online: https://lsd.lrv.lt/uploads/lsd/documents/files/Biuletinis/2018/LSTbiuletenis201804.pdf (accessed on 3 May 2024).
- FAOLEX Database. Commission Regulation (EC) No. 152/2009 Laying Down the Methods of Sampling and Analysis for the Official Control of Feed. Available online: https://www.fao.org/faolex/results/details/en/c/LEX-FAOC085543/ (accessed on 14 March 2024).
- EUROPEAN STANDARDS BS EN 17053:2018; Animal Feeding Stuffs: Methods of Sampling and Analysis. Determination of Trace Elements, Heavy Metals and Other Elements in Feed by ICP-MS (Multi-Method). Available online: https://standards.iteh.ai/catalog/standards/cen/5d8612ed-c2c0-416d-8d96-212f130d1156/en-17053-2018?srsltid=AfmBOorF4_994YRL5naa-B6D0NcAcEiY_uBXRS_0UMfsEqDpW5fn8TO1 (accessed on 29 March 2024).
- LST EN 13654-1:2002; Soil Improvers and Growing Media—Determination of Nitrogen—Part 1: Modified Kjeldahl Method. Lithuanian Department of Standardization: Vilnius, Lithuania, 2002.
- LST EN 13650:2006; Soil Improvers and Growing Media—Extraction of Aqua Regia Soluble Elements. Lithuanian Department of Standardization: Vilnius, Lithuania, 2006.
- UNE EN 13039:2012; Soil Improvers and Growing Media—Determination of Organic Matter Content and Ash. 2012. Available online: https://standards.iteh.ai/catalog/standards/cen/825ecadd-2c72-4dc9-a38c-1e4bdeac857f/en-13039-2011?srsltid=AfmBOooz_F9IxYAtrlG6fAUUKstnc6_Ha2dtLUXzQiLiIFRFQq-rXtzp (accessed on 2 April 2024).
- Lance, G.E.N. Handbook of Solid Fertilizer Blending, Code of Good Practice for Quality; EFBA/AFCOME Quality Committee: Laval, France, 2013. [Google Scholar]
- LebanonTurf. Turf Fertilizer. Choosing the Right Granular Fertilizer. 2019. Available online: https://www.lebanonturf.com/education-center/turf-fertilizer/choosing-the-right-granular-fertilizer (accessed on 14 June 2024).
- Atkinson, J. Getting the Most out of Granular Blends—Fertilizer Physical Characteristics. 2022. Available online: https://harrells.com/Blog/Post/getting-the-most-out-of-granular-blends-%E2%80%93-fertilizer-physical-characteristics (accessed on 29 March 2024).
- Jiggens, M. Making Sense of the Numbers. 2012. Available online: https://www.turfandrec.com/making-sense-of-the-numbers-2954/ (accessed on 23 April 2024).
- EUROPEAN STANDARDS DIN EN 1236 Fertilizers—Determination of Bulk Density (Loose) (ISO 3944:1992, Modified). Available online: https://www.en-standard.eu/din-en-1236-fertilizers-determination-of-bulk-density-loose-iso-3944-1992-modified/ (accessed on 2 April 2024).
- Barker, A.V. Fertilizers. 2019, pp. 134–144. Available online: https://www.sciencedirect.com/topics/chemistry/bone-meal (accessed on 2 April 2024).
- Sulabo, R.; Stein, H.H. Digestibility of Phosphorus and Calcium in Meat and Bone Meal Fed to Growing Pigs. 2012. Available online: https://www.researchgate.net/publication/233892665_Digestibility_of_phosphorus_and_calcium_in_meat_and_bone_meal_fed_to_growing_pigs (accessed on 14 June 2024).
- Fulton, J.; Port, K. Physical Properties of Granular Fertilizers and Impact on Spreading. OSU.EDU. 2016. Available online: https://ohioline.osu.edu/factsheet/fabe-5501 (accessed on 14 June 2024).
- Wang, W.; Song, S. Impacts of Antecedent Soil Moisture on the Rainfall-Runoff Transformation Process Based on High-Resolution Observations in Soil Tank Experiments. Water 2019, 11, 296. [Google Scholar] [CrossRef]
- Regulation (EC) No 2003/2003 of the European Parliament and of the Council. 2003. Available online: https://www.legislation.gov.uk/eur/2003/2003/attachments (accessed on 15 April 2024).
- GRDC. 2023. Available online: https://groundcover.grdc.com.au/agronomy/soil-and-nutrition/new-resources-for-growers-considering-fertiliser-options-amid-shortages (accessed on 3 May 2024).
- Malmgren, A.; Riley, G. Biomass Power Generation. In Reference Module in Earth Systems and Environmental Sciences; Elsevier: Amsterdam, The Netherlands, 2018. [Google Scholar] [CrossRef]
- Pacific Fertilizers. 2017. Available online: https://pacificfertiliser.com/2017/05/fertiliser-bulk-densities/ (accessed on 6 May 2024).
- Ulusal, A.; Avsar, C. Understanding Caking Phenomena in Industrial Fertilizers: A Review. Chem. Biochem. Eng. Q. 2021, 34, 209–222. [Google Scholar] [CrossRef]
- Novotny, E.H.; Mattos, B.B.; de Carvalho, C.M.; de Oliveira, R.S.; Rech, J.; Polidoro, J.C.; Teixeira, P.C.; Bonagamba, T.J. NMR Relaxometry for Hygroscopicity Evaluation in Fertilizers. In Proceedings of the 17th NMR Users Meeting, Rio de Janeiro, Brazil, 3–7 August 2019. [Google Scholar]
- YARA. Fertiliser Handling and Safety. 2023. Available online: https://www.yara.co.uk/crop-nutrition/fertiliser-handling-and-safety2/physical-properties-of-fertilisers/ (accessed on 3 May 2024).
- Shaji, H.; Chandran, V.; Mathew, L. Organic Fertilizers as a Route to Controlled Release of Nutrients. In Controlled Release Fertilizers for Sustainable Agriculture; Elite Publishing House: Delhi, India, 2021; pp. 231–245. Available online: https://www.researchgate.net/publication/346275809_Organic_fertilizers_as_a_route_to_controlled_release_of_nutrients (accessed on 14 June 2024).


Disclaimer/Publisher’s Note: The statements, opinions and data contained in all publications are solely those of the individual author(s) and contributor(s) and not of MDPI and/or the editor(s). MDPI and/or the editor(s) disclaim responsibility for any injury to people or property resulting from any ideas, methods, instructions or products referred to in the content. |
© 2024 by the authors. Licensee MDPI, Basel, Switzerland. This article is an open access article distributed under the terms and conditions of the Creative Commons Attribution (CC BY) license (https://creativecommons.org/licenses/by/4.0/).