Abstract
Hospital intensive care units (ICUs) frequently experience inadequate lighting conditions, with low daytime and excessive nighttime illuminance, which can negatively affect patient recovery and the work performance of health personnel. This study examines the impact of window design parameters—specifically, window-to-wall ratio (WWR) and window position—and interior surface reflectance on visual comfort, lighting performance, energy consumption, and human well-being in intensive care units (ICUs) in Mediterranean climates, according to orientation. Using dynamic lighting metrics, such as daylight autonomy (DA) and circadian stimulus autonomy (CSA), this research quantifies the influence of these design factors. The results suggest that a WWR of 25% is optimal for achieving sufficient DA and CSA values, with centered window configurations preferred for uniform daylight distribution and circadian stimulus. This study further emphasizes the significance of interior reflectance, recommending bright coatings to maximize outcomes, while advising against dark finishes, particularly in north-facing rooms or with smaller WWRs. Although Seville shows slightly better performance than Barcelona, the proposed configurations are effective across both locations, highlighting the prioritization of window sizing, positioning, and reflectance over Mediterranean geographical differences. These findings offer practical guidance for ICU design to enhance natural lighting, supporting patient recovery and overall well-being through improved circadian alignment.
1. Introduction
1.1. State of the Art
For decades, hospital architecture design has been governed by the parameters of energy efficiency, effectiveness of use, and the promotion of patient well-being and health [1,2]. In critical environments such as the intensive care unit (ICU), it becomes particularly important for architectural design to create healthy environments, enabling adequate visual and work performance.
One of the key factors that the built environment must promote is the appropriate sleep cycle of patients. Various studies have highlighted that poor sleep quality in ICU patients [3,4] can have consequences for the recovery process [5]. Low sleep quality appears to influence metabolic, immune, respiratory, cardiovascular, and neurological systems [3,6,7,8,9,10,11], as well as episodes of delirium and cognitive impairment [12,13]. While sleep disorders are a complex and multifactorial problem, with factors such as the impact of diseases, anxiety, medication, and possible interventions playing a role [14], environmental factors also have a significant impact. These environmental factors, dependent on good architectural design, include noise and particularly, lighting evolution throughout the day and night [5,11,12,13,15,16]. In this way, excessive noise levels in ICU environments have been shown to disrupt sleep, increase stress, and negatively impact patient outcomes. In addition, these high noise values can also contribute to hypertension, delayed wound healing, and even prolonged hospital stays [17].
In the case of lighting in hospital environments, at the end of the 19th century, it was already recognized that light and day–night rhythms were of significant importance in the restoration of patients’ health [18]. This is because the regulation of melatonin, a hormone that plays a crucial role in sleep [19], is greatly dependent on perceived light, both in its spectral composition and its luminous flux [20]. Specifically, the suppression of melatonin production in the pineal gland, known as the circadian stimulus (CS), is largely induced by exposure—for at least half an hour— of the melanopic photoreceptors in the eye to light with a high short-wavelength spectral component, typically with a spectral peak around 460 nm, commonly referred to as “royal blue” light [21,22]. This spectral composition of the light coincides with natural daylight in the early hours of the day. Therefore, proper circadian synchronization through exposure to natural light can improve sleep quality, alertness, and other biological factors [23].
However, it has been observed that the typical light spectrum in ICU environments, where patients can spend more than an average of 6 days [24], often does not enable optimal activation of melanopic photoreceptors [25,26,27]. Several specific studies have highlighted that it is common to find illuminance values in the ICU that are too low during the day and too high during the night [15,28]. This can also be observed in reviews regarding the design of ICU spaces in the project phase and their impact on circadian entrainment, both in terms of electric and natural lighting [29]. These reviews recommend the introduction of cyclic lighting systems [26,30,31], promoting access to natural light [1], and limiting illuminance levels during sleep hours [31,32].
In the case of using electric lighting systems, multiple studies have analyzed various lighting system proposals that promote circadian entrainment. These include cyclic systems—regulating their luminous flux throughout the day—and tunable white (TW) systems—with the ability to adjust color temperature and luminous flux. There are also biodynamic (BDL) systems—capable of regulating spectral distribution and light flux [33]. The latter systems are notable for their effective control of the resulting spectrum to match activity and time of day, according to biological needs [33]. The results of some experimental trials [34] with TW and BDL systems in nuclear power plants [35], windowless laboratories [36], hospital rooms [37,38], and ICUs [31,39] support the improvement in the regulation of melatonin and cortisol levels. However, while it is necessary to continue studying the impact of lighting in environments with high demands for visual performance [40,41], such as those involving rotating shift workers and occupants with high vulnerability, such as those in an ICU [39], this requires a balance between the needs of the healthcare workers to remain alert due to rotating shifts, the enhancement of their chromatic discretization capacity in regards to visual recognition [42], and the improvement of patients’ sleep [1].
However, electric lighting must necessarily serve as a complementary system to natural light, since the rational utilization of natural light allows for a significant reduction in energy consumption associated with the use of these electric lighting systems [33,43,44]. Moreover, it promotes the improvement of both patient well-being and circadian entrainment [1]. The use of natural light in these spaces through proper window design should therefore be a priority in the architectural process.
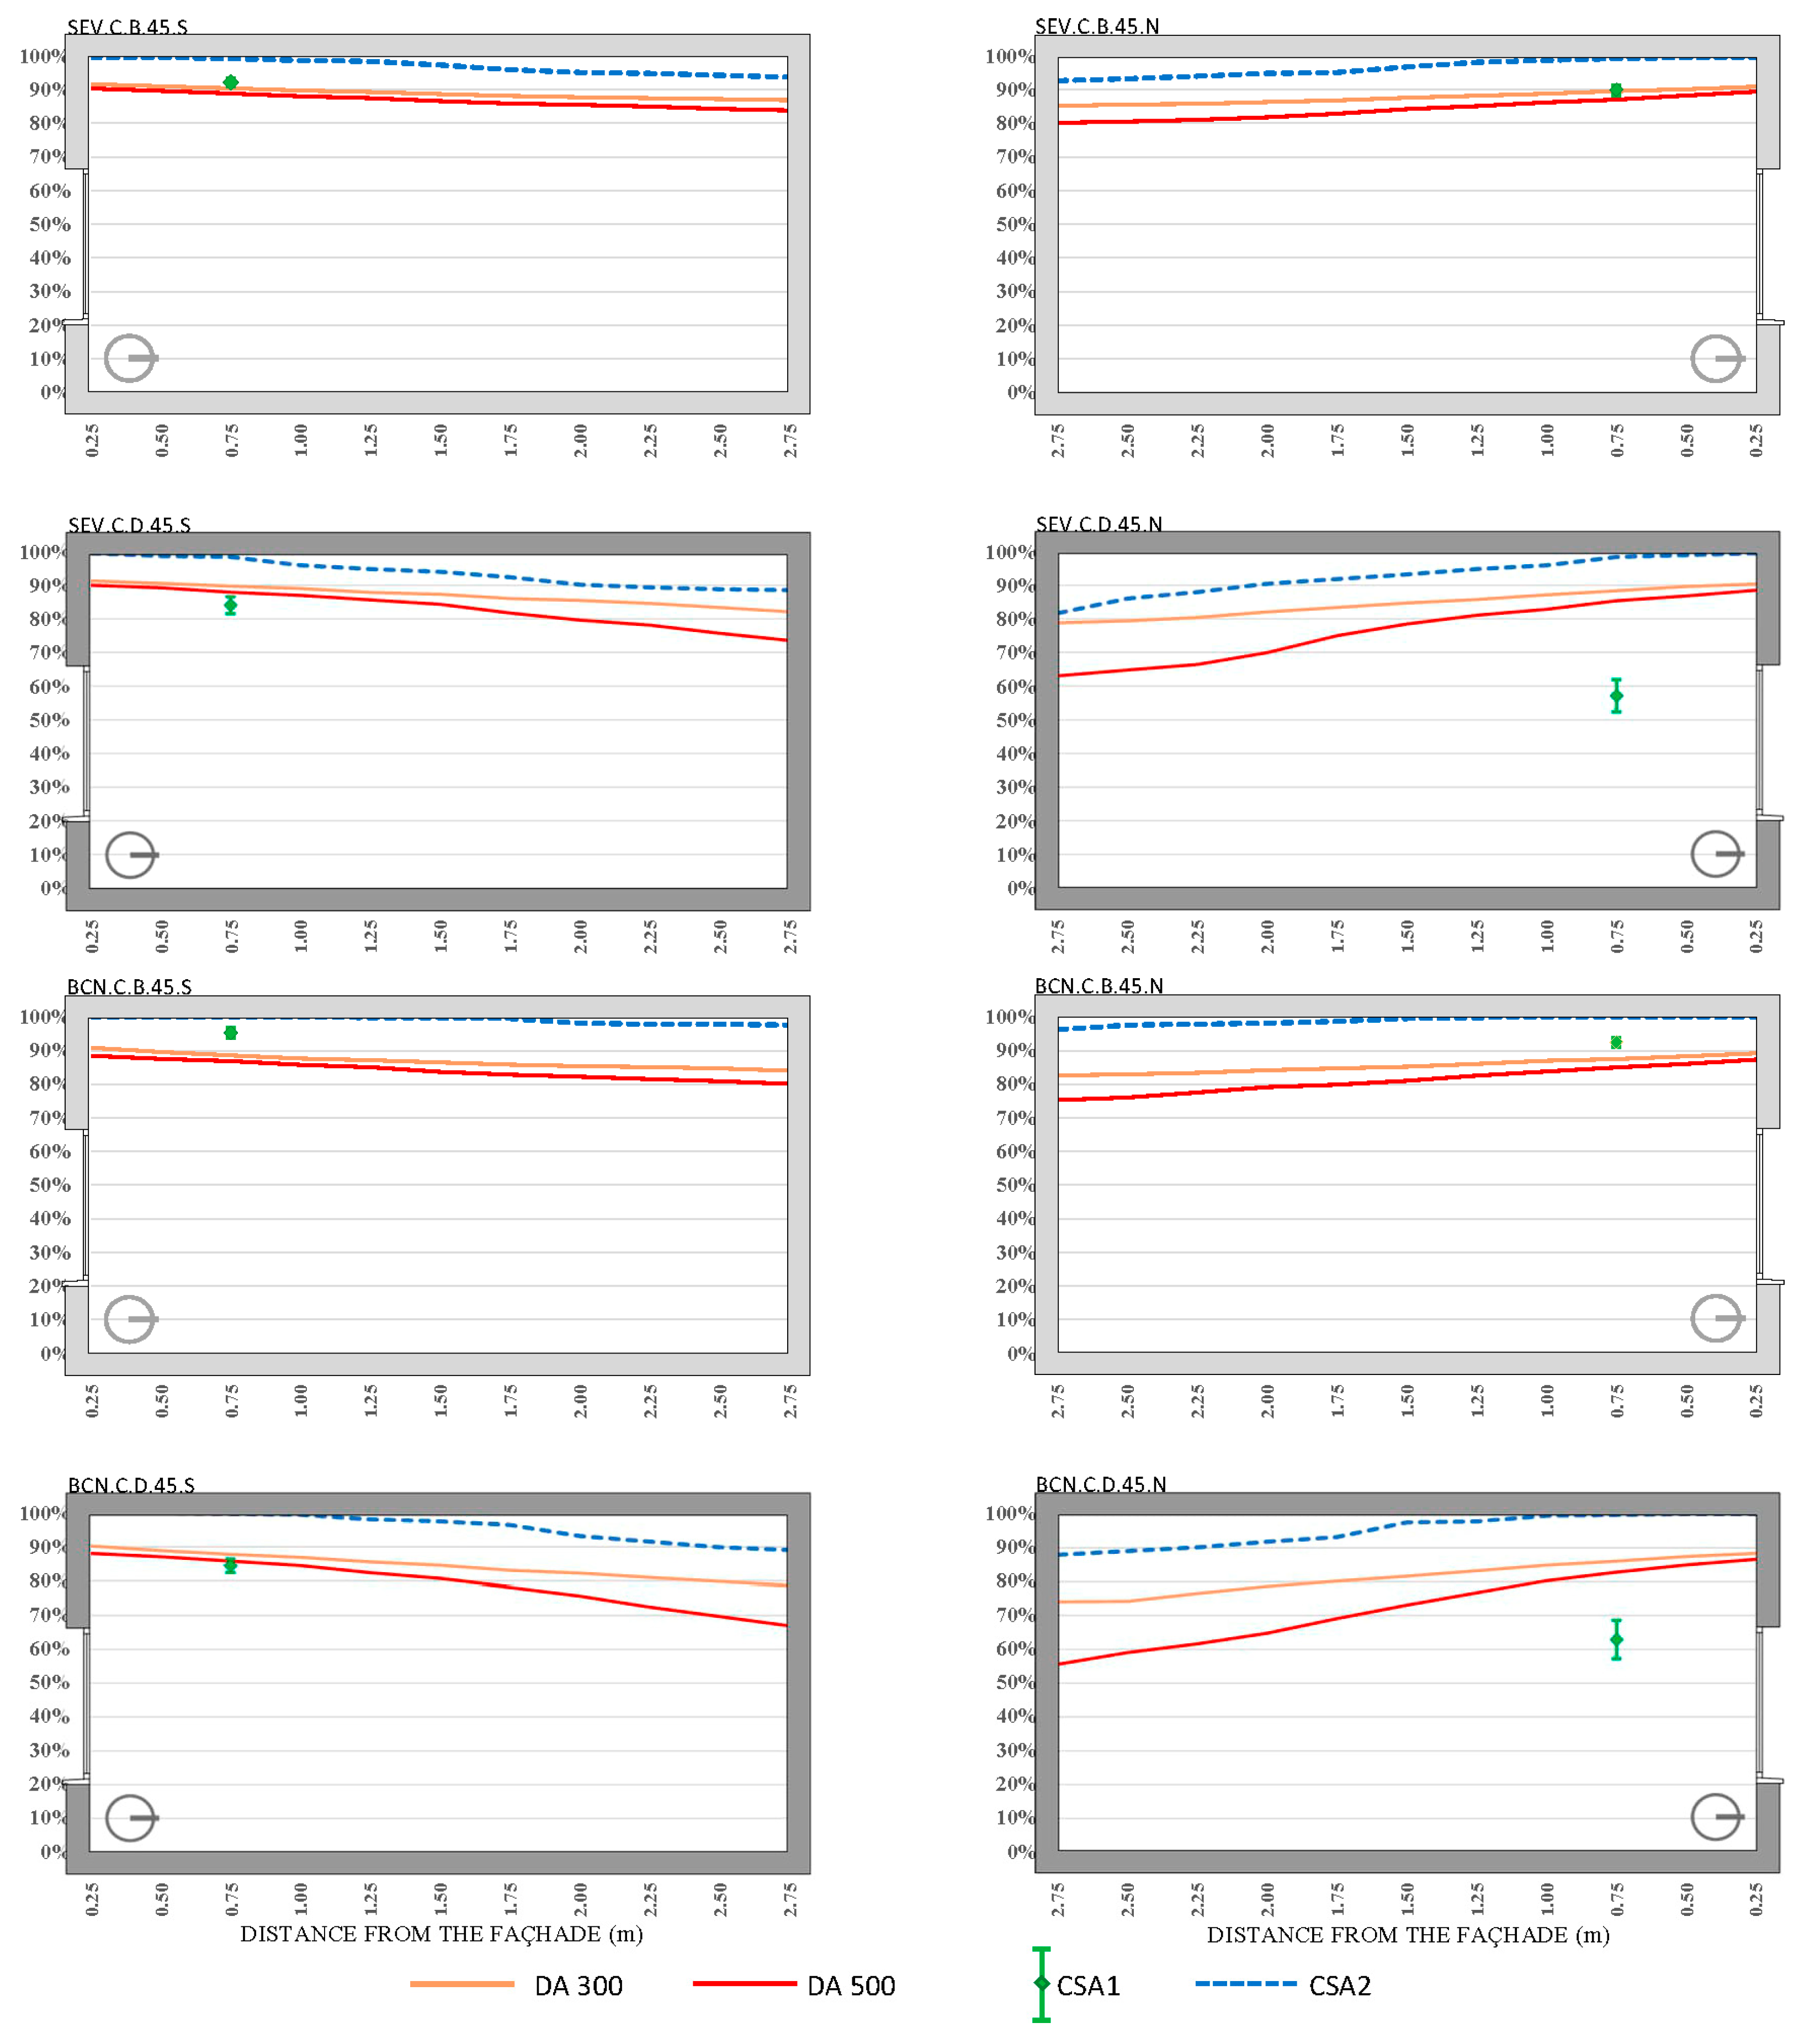
To optimize this design, there are multiple lighting metrics, both static [45,46,47] and dynamic. Two of these dynamic metrics stand out for their simplicity and reliability: daylight autonomy (DA) [48], which allows for the determination of the percentage of hours of annual use in which electric lighting is not necessary because required illuminance levels are met by natural light, and circadian stimulus autonomy (CSA) [1,33], which allows for the assessment of the suppression of the circadian stimulus over the year due to perceived light. In both cases, these dynamic metrics incorporate the spatial, climatic, and usage conditions of the evaluated spaces into their assessment.
Using lighting metrics, various previous studies have focused on optimizing window design in different building types [2,49], such as offices [41,50,51,52], educational centers [33,53,54,55], residential buildings [56,57,58,59], and even hospital settings [1,60,61,62]. However, in the case of hospital environments, particularly critical spaces like the ICU, there is often a lack of simultaneous consideration of lighting criteria for promoting circadian entrainment and improving work and visual performance. This is why the present study can serve as a guide for window design for ICU environments, applicable in both the design phase and for renovations of existing buildings.
1.2. Motivations of the Study
The primary objective of the present study is to evaluate the optimal window design for bedroom units within intensive care units (ICUs), considering lighting and health parameters. These units are spaces where patients remain hospitalized throughout the day, receiving continuous care from healthcare personnel, which includes visual assessment. This research investigates the impact of climatic conditions, with a focus on two representative European cities in the Mediterranean area—Barcelona and Seville—as well as room orientation. The study quantifies the influence of the dimensional parameters of the windows on visual comfort, performance, electric lighting energy consumption, and human well-being, using dynamic lighting metrics such as DA and circadian stimulus autonomy (CSA).
The methodology employed encompasses several key steps, including defining the study model, selecting locations and orientations, choosing a validated calculation engine for simulations, and choosing appropriate indicators for further analysis.
2. Methodology
The present methodology involves creating a virtual model of an intensive care unit (ICU) cubicle, a single room which includes a single window in the façade and side partitions between cubicles, each equipped with a single glass opening. The analysis was conducted by placing this cubicle in two cities of the Mediterranean area, Barcelona and Seville, spanning latitudes from 37° to 41°. This selection aims to provide insights into the influence of location conditions, such as latitude and sky luminance. Furthermore, calculations have been conducted considering windows with both southern and northern orientations.
The calculation of the lighting indicators is performed using Radiance Render v.6.0a, a previously validated calculation engine, and these indicators are then compared with those of a monitored test cell located in one of the cities included in the study. Once the tool’s validity is established, DA is employed to measure the portion of time when electric lighting remains switched off during occupied hours, as well as to analyze the adequate visual and performance comfort achieved with daylight alone. Furthermore, CSA is used to assess the impact of daylight exposure on the regulation of circadian rhythms by quantifying melatonin suppression (CS), according to the specific illuminance value and to the incident spectrum on the eyes of the occupants.
2.1. Properties of the Virtual Cubicle Model
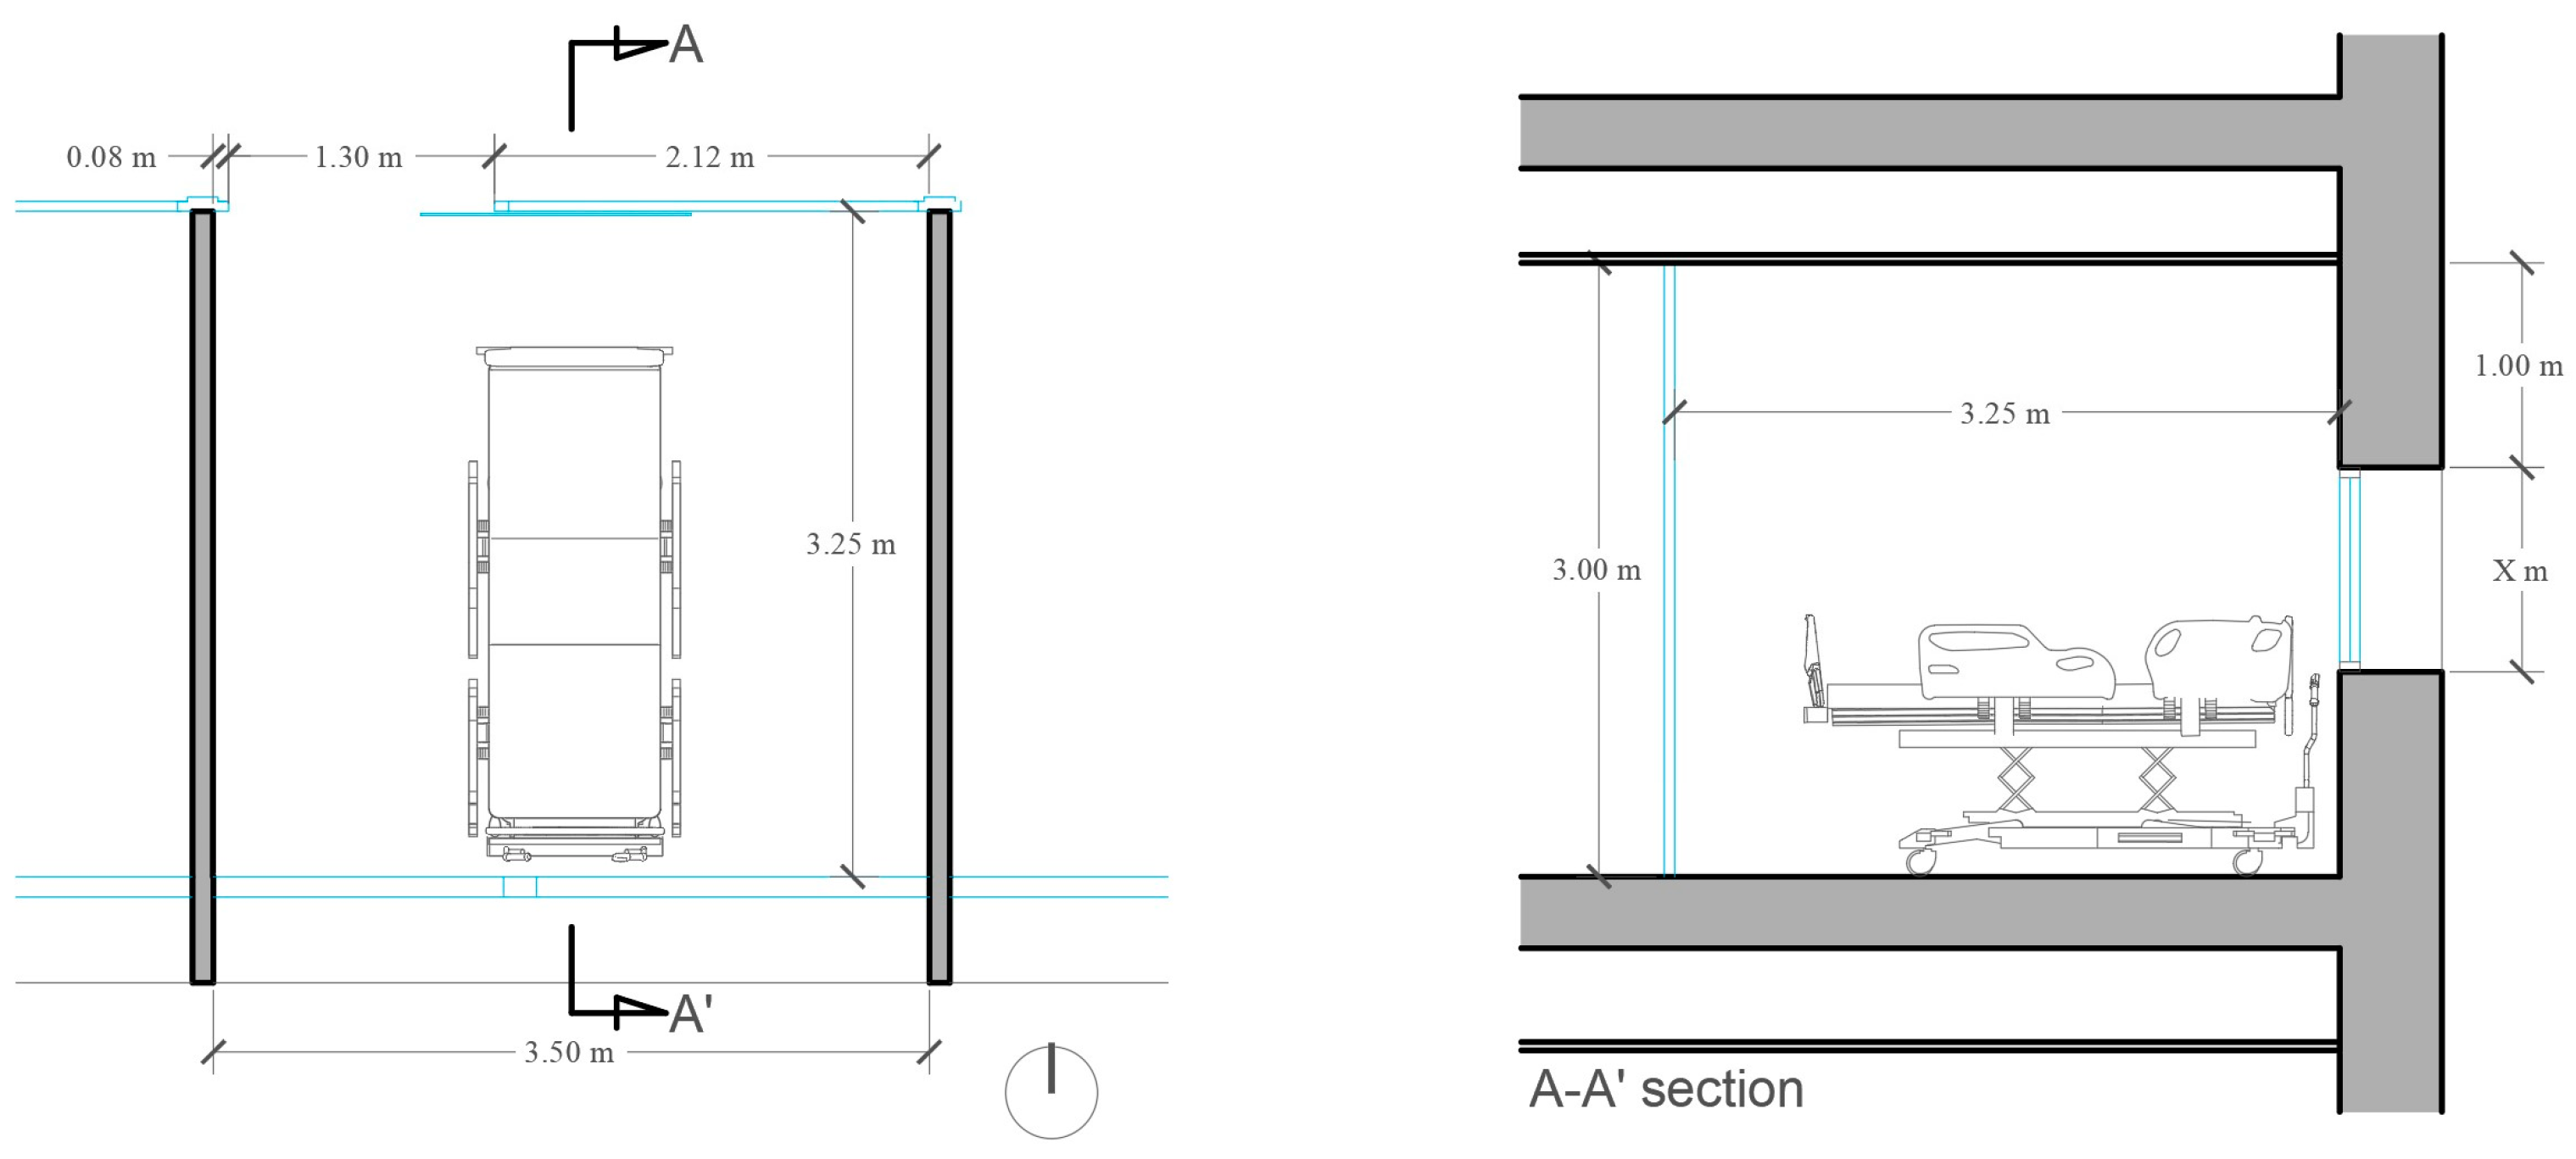
The space utilized as a calculation model in this study is based on a standard single ICU cubicle, with dimensions of 3.0 m in height, 3.5 m in width, and 3.25 m in depth. There is a single window, with a visible transmittance of 0.70 in the façade, matching its width and with a variable height, to achieve a window-to-wall ratio (WWR) of 15, 25, 35, and 45%. When choosing the range of WWR to analyze in the study, it was necessary to discard ratios that would not be feasible in a real ICU environment according to energy consumption performance. While a completely transparent façade would probably obtain the best results in terms of DA, CSA, and reduced lighting energy consumption, other kinds of consumption, such as heating or cooling, would drastically increase.
The window position has two configurations: the first with its upper part at 1 m from the ceiling (defined as “centered”, as depicted in Figure 1), and the second with its upper part flush with the ceiling (defined as “upper”). Table 1 provides the two reflectance values options (bright and dark) of the room surfaces, considered as diffuse reflectors, in accordance with the recommendations of EN 12464-1 [63]. These dimensions, totaling approximately 63.25 square meters, are representative of a standard single cubicle within an intensive care unit (ICU).
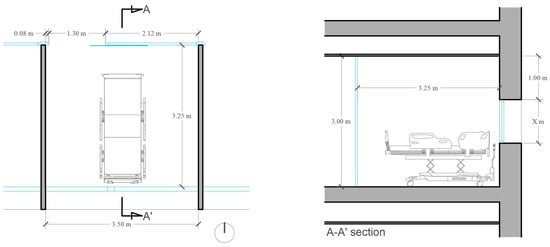
Figure 1.
Dimensions of the virtual cubicle model. The line A-A′ on the floor plan marks the vertical plane where section A-A′ is made.

Table 1.
Reflectance values of the cubicle surfaces.
Patient beds and medical equipment were excluded in this study due to their minimal impact on light reflection compared to the ICU surfaces. As the location of the medical equipment is often temporary, its inclusion could reduce the reliability of results. Similarly, bed sheets, typically white, could lead to more favorable results by increasing reflected light.
For the daylight autonomy (DA) calculations, a longitudinal array of points was utilized. Horizontal illuminance values were computed at intervals of 0.25 m (one-meter height, equivalent to the height of the bed). These calculation points were centered along an axis perpendicular to the façade plane, as illustrated in Figure 2a.

Figure 2.
Location of calculation points (marked with crosses) and their viewing directions (marked with arrows) for the following: (a) energy efficiency calculations, DA; (b) CSA trials with the headboard of the bed adjacent to the façade (CSA 1); (c) CSA trials with the headboard of the bed adjacent to one of the side walls (CSA 2).
In the case of circadian stimulus autonomy (CSA), two different arrangements of calculation points were employed, as depicted in Figure 2. The first one (Figure 2b) is a line of vertical illuminance points which are placed 0.75 m from the façade, with a spacing of 0.25 m between the studied points. These points were positioned at a one-meter height and were oriented toward the back wall, replicating the view of a patient from a bed whose headboard is adjacent to the façade. The second one (Figure 2c) is a line of vertical illuminance points placed at 0.75 from one of the side walls, with the same spacing and height. This line replicates the view of a patient from a bed whose headboard is adjacent to the interior side partition. This last arrangement has been recommended by previous studies [62].
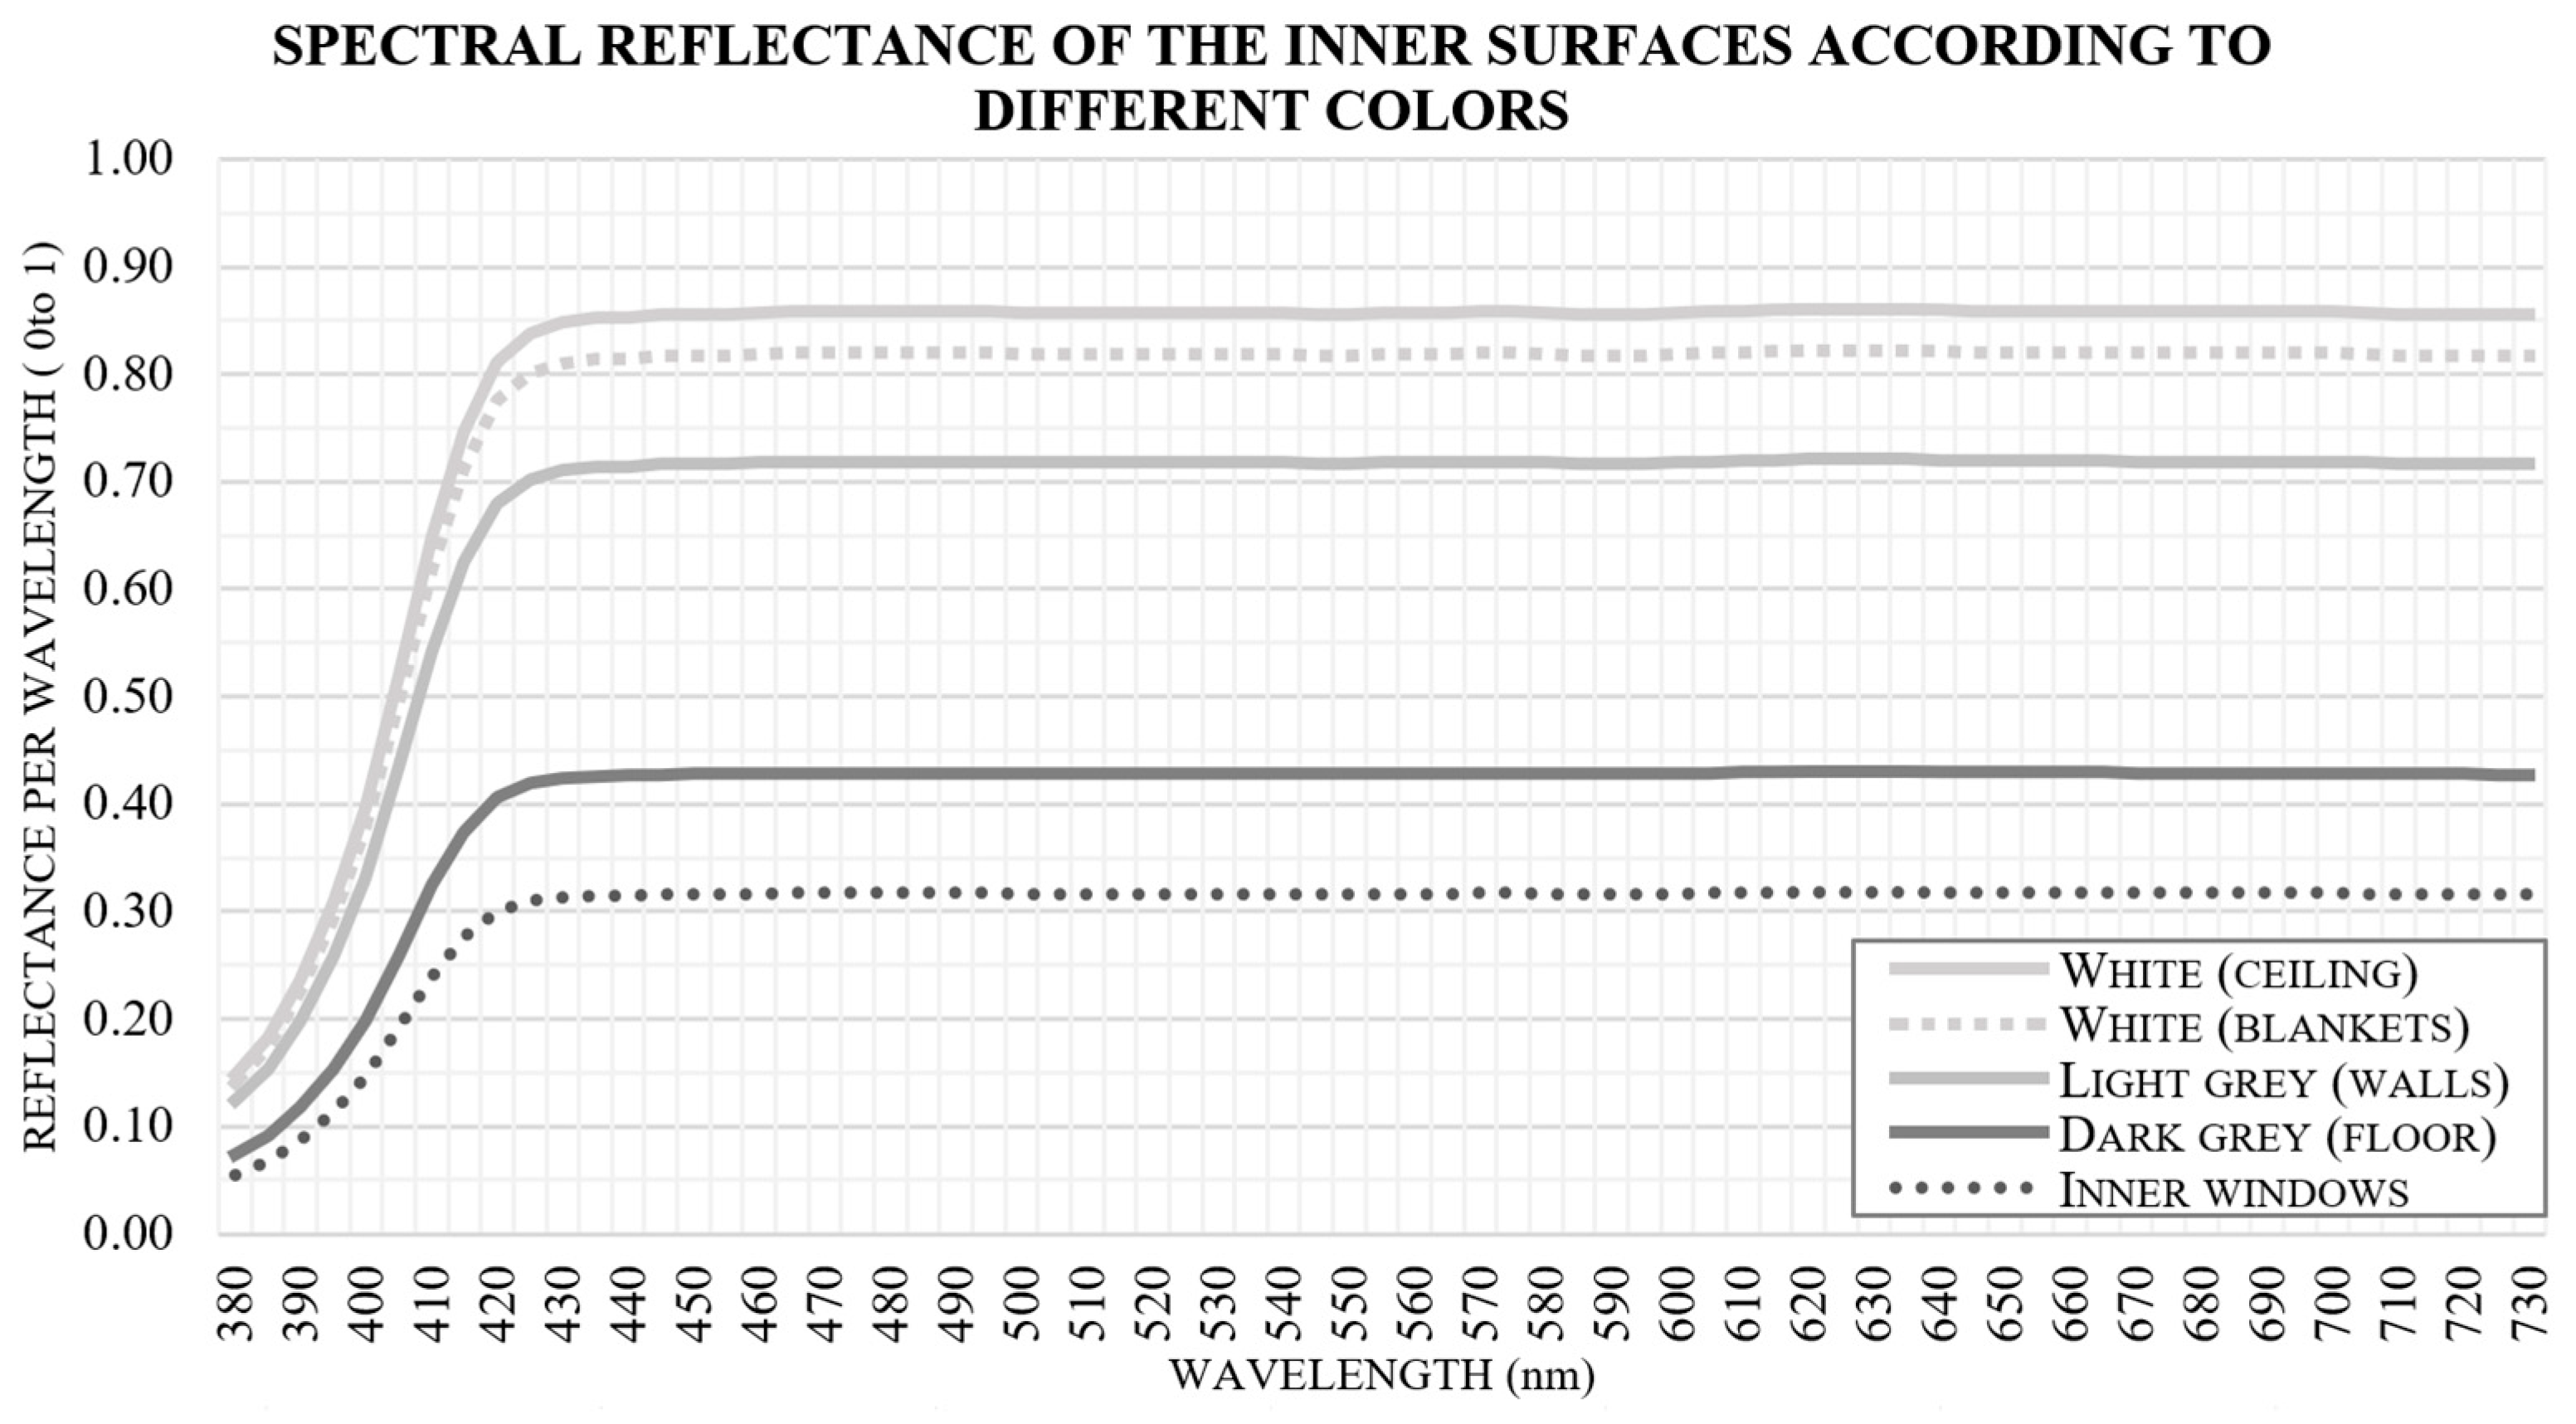
The reflectance of each surface within the cubicle’s interior can play a critical role in determining the resulting spectral irradiance incident on the occupants’ eyes. This factor is essential when the occupant’s position results in a significant portion of their field of vision being occupied by a wall. Figure 3 illustrates the theoretical spectral reflectance assigned to each surface within the interior of the model, which directly impacts the spectrum perceived by the observer’s eye. The visual field of an average occupant in the enclosure can be distributed as follows: the inner face of the partitions and the inner windows each occupy approximately 20% of the field of view, the ceiling and floor each occupy 15%, and the bed (including its blankets) also occupies 10% of the view [41].
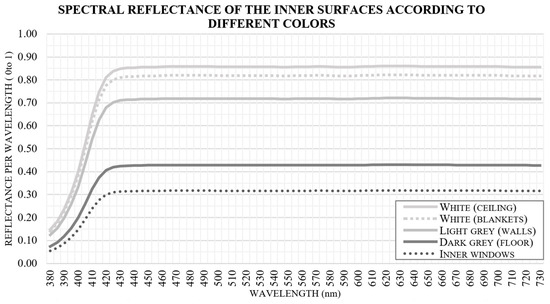
Figure 3.
Spectral reflectance for each surface within the interior of the cubicle.
2.2. Location and Orientation of the Cubicle Model
To determine the suitable dimensions for the window in a patient cubicle and to assess the effects of remote obstructions using dynamic metrics such as DA or CS, simulations were conducted for the studied cubicle model in two European cities of the Mediterranean area: Barcelona (situated at 41° N, with mostly intermediate skies) and Seville (located at 37° N, with primarily clear skies). These cities were selected to encompass two of the most typical climatic conditions of the region. Weather data for these simulations were obtained from the EnergyPlus reference [64].
The virtual model of the single cubicle model was oriented to face both north and south to obtain the results for the metrics under consideration, considering that this space under analysis is typically occupied for most of the day.
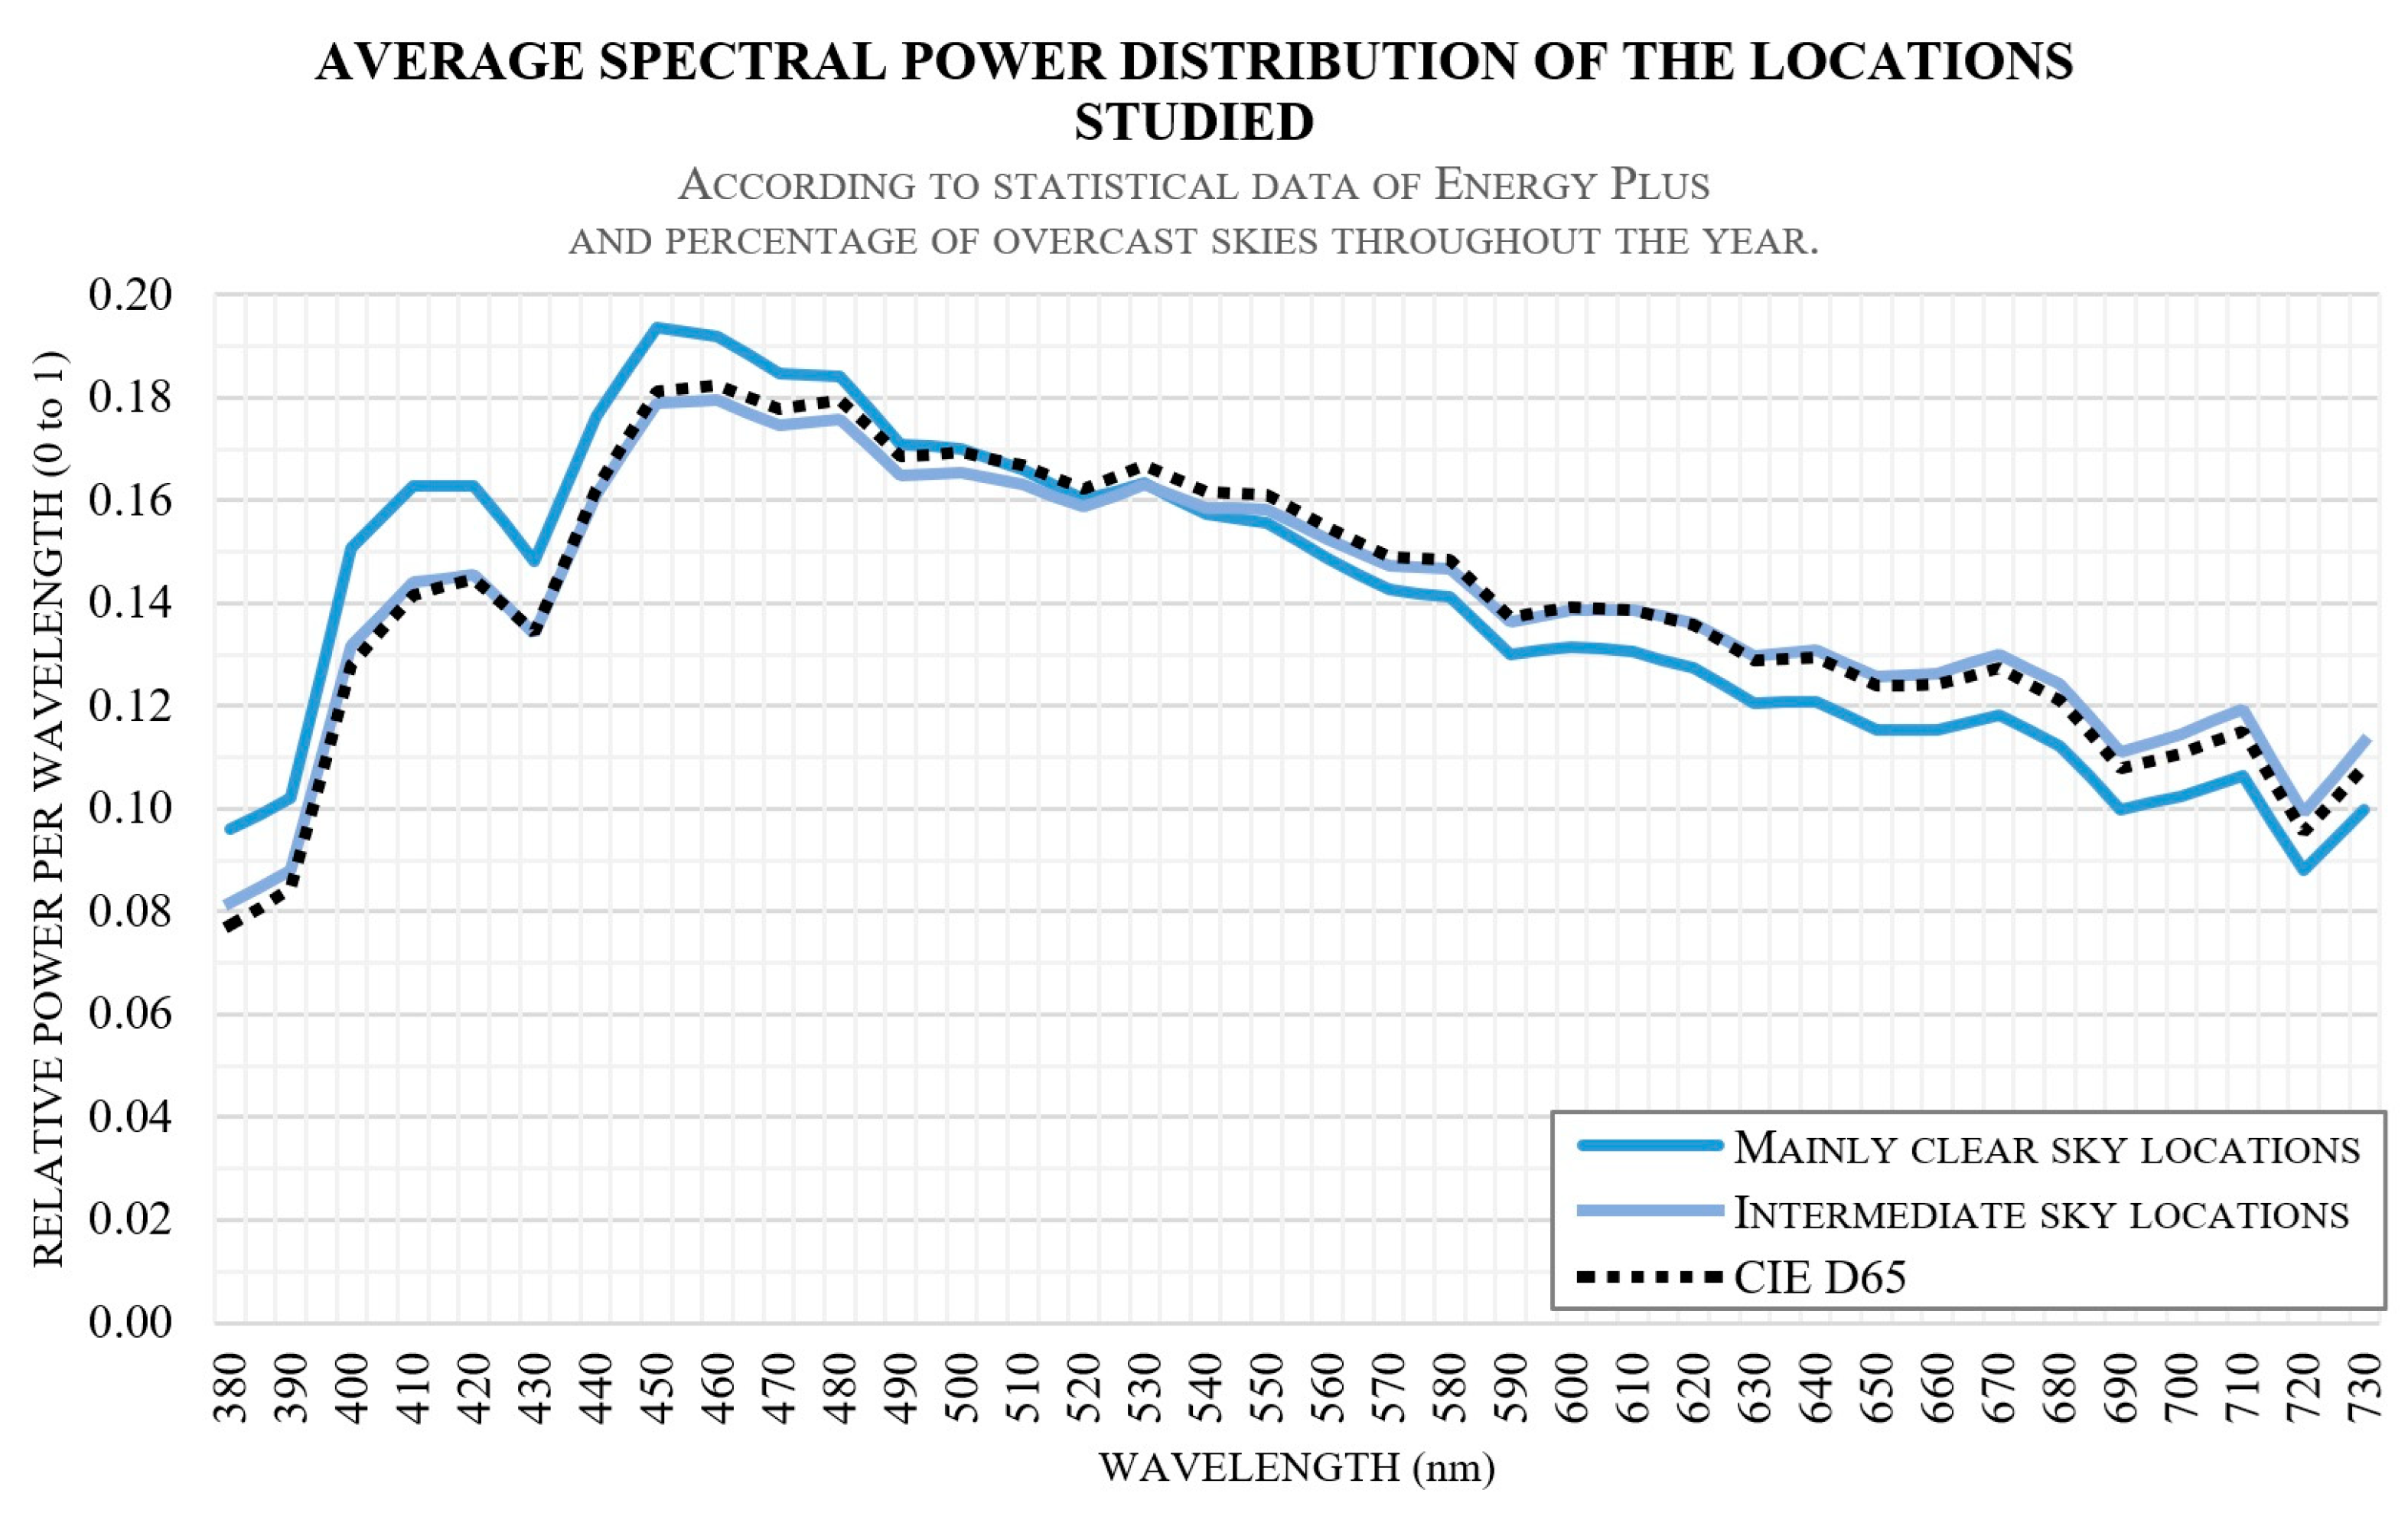
To evaluate the CSA, it is essential to include the impact of the spectral power distribution (SPD) of natural light. Therefore, an average SPD has been proposed for the sky in both Mediterranean locations, based on their latitudes and climatic conditions, as illustrated in Figure 4.
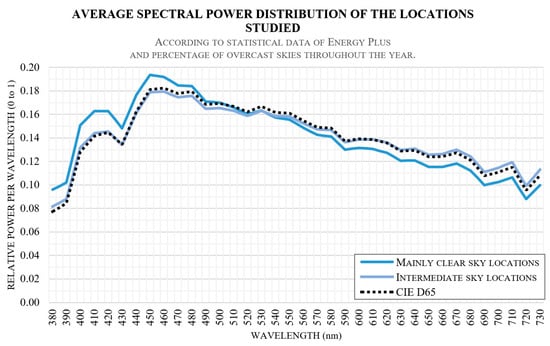
Figure 4.
Average value of sky SPD proposed in both Mediterranean locations.
This data was generated using statistical climatic information, included the frequency of overcast skies over a typical year [64] and the climatic conditions of each location. Additionally, the typical SPD for the sky vault—CIE D65—is included for reference. This SPD curve is similar to the distribution of intermediate sky locations. Furthermore, in locations where clear skies are prevalent, the SPD exhibits a marginally higher value in the short-wavelength range compared to that in the aforementioned CIE D65 distribution.
2.3. Calculation Metrics
The evaluation of how the size and position of the window size can affect the energy savings, the visual performance and circadian entrainment of an ICU cubicle necessitated the implementation of two distinct dynamic daylighting metrics: The first is the daylight autonomy (DA), and the second is the circadian stimulus autonomy (CSA).
DA, or daylight autonomy, can be described as “the percentage of the year when a minimum illuminance threshold is achieved solely by daylight”. In other words, DA represents the portion of the year when sufficient natural daylight is available, reducing the need for electric lighting (with lighting switched off). This is expressed in Equation (1), from which it can be observed that the lower the DA value, the greater the need for electric lighting, thus resulting in higher associated electrical consumption, as follows:
where ti is the “occupied time of the studied room, represented as a time interval per day”, wfi defines the “weighting factor which depends on the illuminance threshold”, ED represents the “daylight illuminance defined at a given point”, and EL defines the “illuminance threshold defined by lighting requirements”.
Another important metric used is CSA (circadian stimulus autonomy), which focuses on assessing the expected circadian entrainment due to light effects. As mentioned previously, CSA can be expressed as “the percentage of days when a threshold for adequate melatonin suppression is met solely by daylight during a specific time of the day, typically in the morning” [1,33,41,56]. The main factors that affect CSA are the spectral power distribution (SPD) of light and the illuminance perceived by the observer in terms of circadian light (CLA).
The mathematical development of CSA is outlined through the phototransduction model [21] and is expressed using Equation (2) [1]:
The CS (circadian stimulus) value obtained is directly linked to the predicted level of melatonin suppression induced by the perceived light effect, ranging between full suppression (0.0) and the saturation threshold (0.7). This prediction assumes that the average observer is exposed for a one-hour period to the given lighting conditions, considering an eye with a pupil size of 2.3 mm. To achieve an appropriate circadian entrainment, a CS value of 0.4 is considered adequate [19]. Thus, CSA must be calculated using this minimum light exposure—a CS value of 0.4—based on the light flux received and its combined SPD, taking into account the inner reflections in the ICU cubicle [41,56].
2.4. User and Patient Requirements
In the analysis of energy consumption and visual comfort and performance, occupancy hours were considered for the entire week, simulating a full-time workday schedule during daytime hours, extending from 8 in the morning to 8 in the evening. Breaks are not considered, as the study focuses on the lighting conditions that affect the patient. This battery of simulations takes into account the implementation of Daylight Saving Time (DST).
The minimum illuminance threshold for adequately conducting a simple examination in intensive care environments is tabulated at 300 lx [65], and this value is used for calculating the DA. Another standard threshold for these tasks is 500 lx [63]. Therefore, the present study uses both thresholds, 300 and 500 lx, for the calculation of DA. In cases where a higher average illuminance is required for more in-depth examinations or patient treatment (1000 lx), or in the case of emergency examinations (2000 lx) [65], specific electric lighting is considered necessary.
To assess the adequate circadian entrainment of a patient in an ICU single cubicle, the evaluation period extends throughout the entire week, from 9 to 10 in the morning [41,42,53,56].
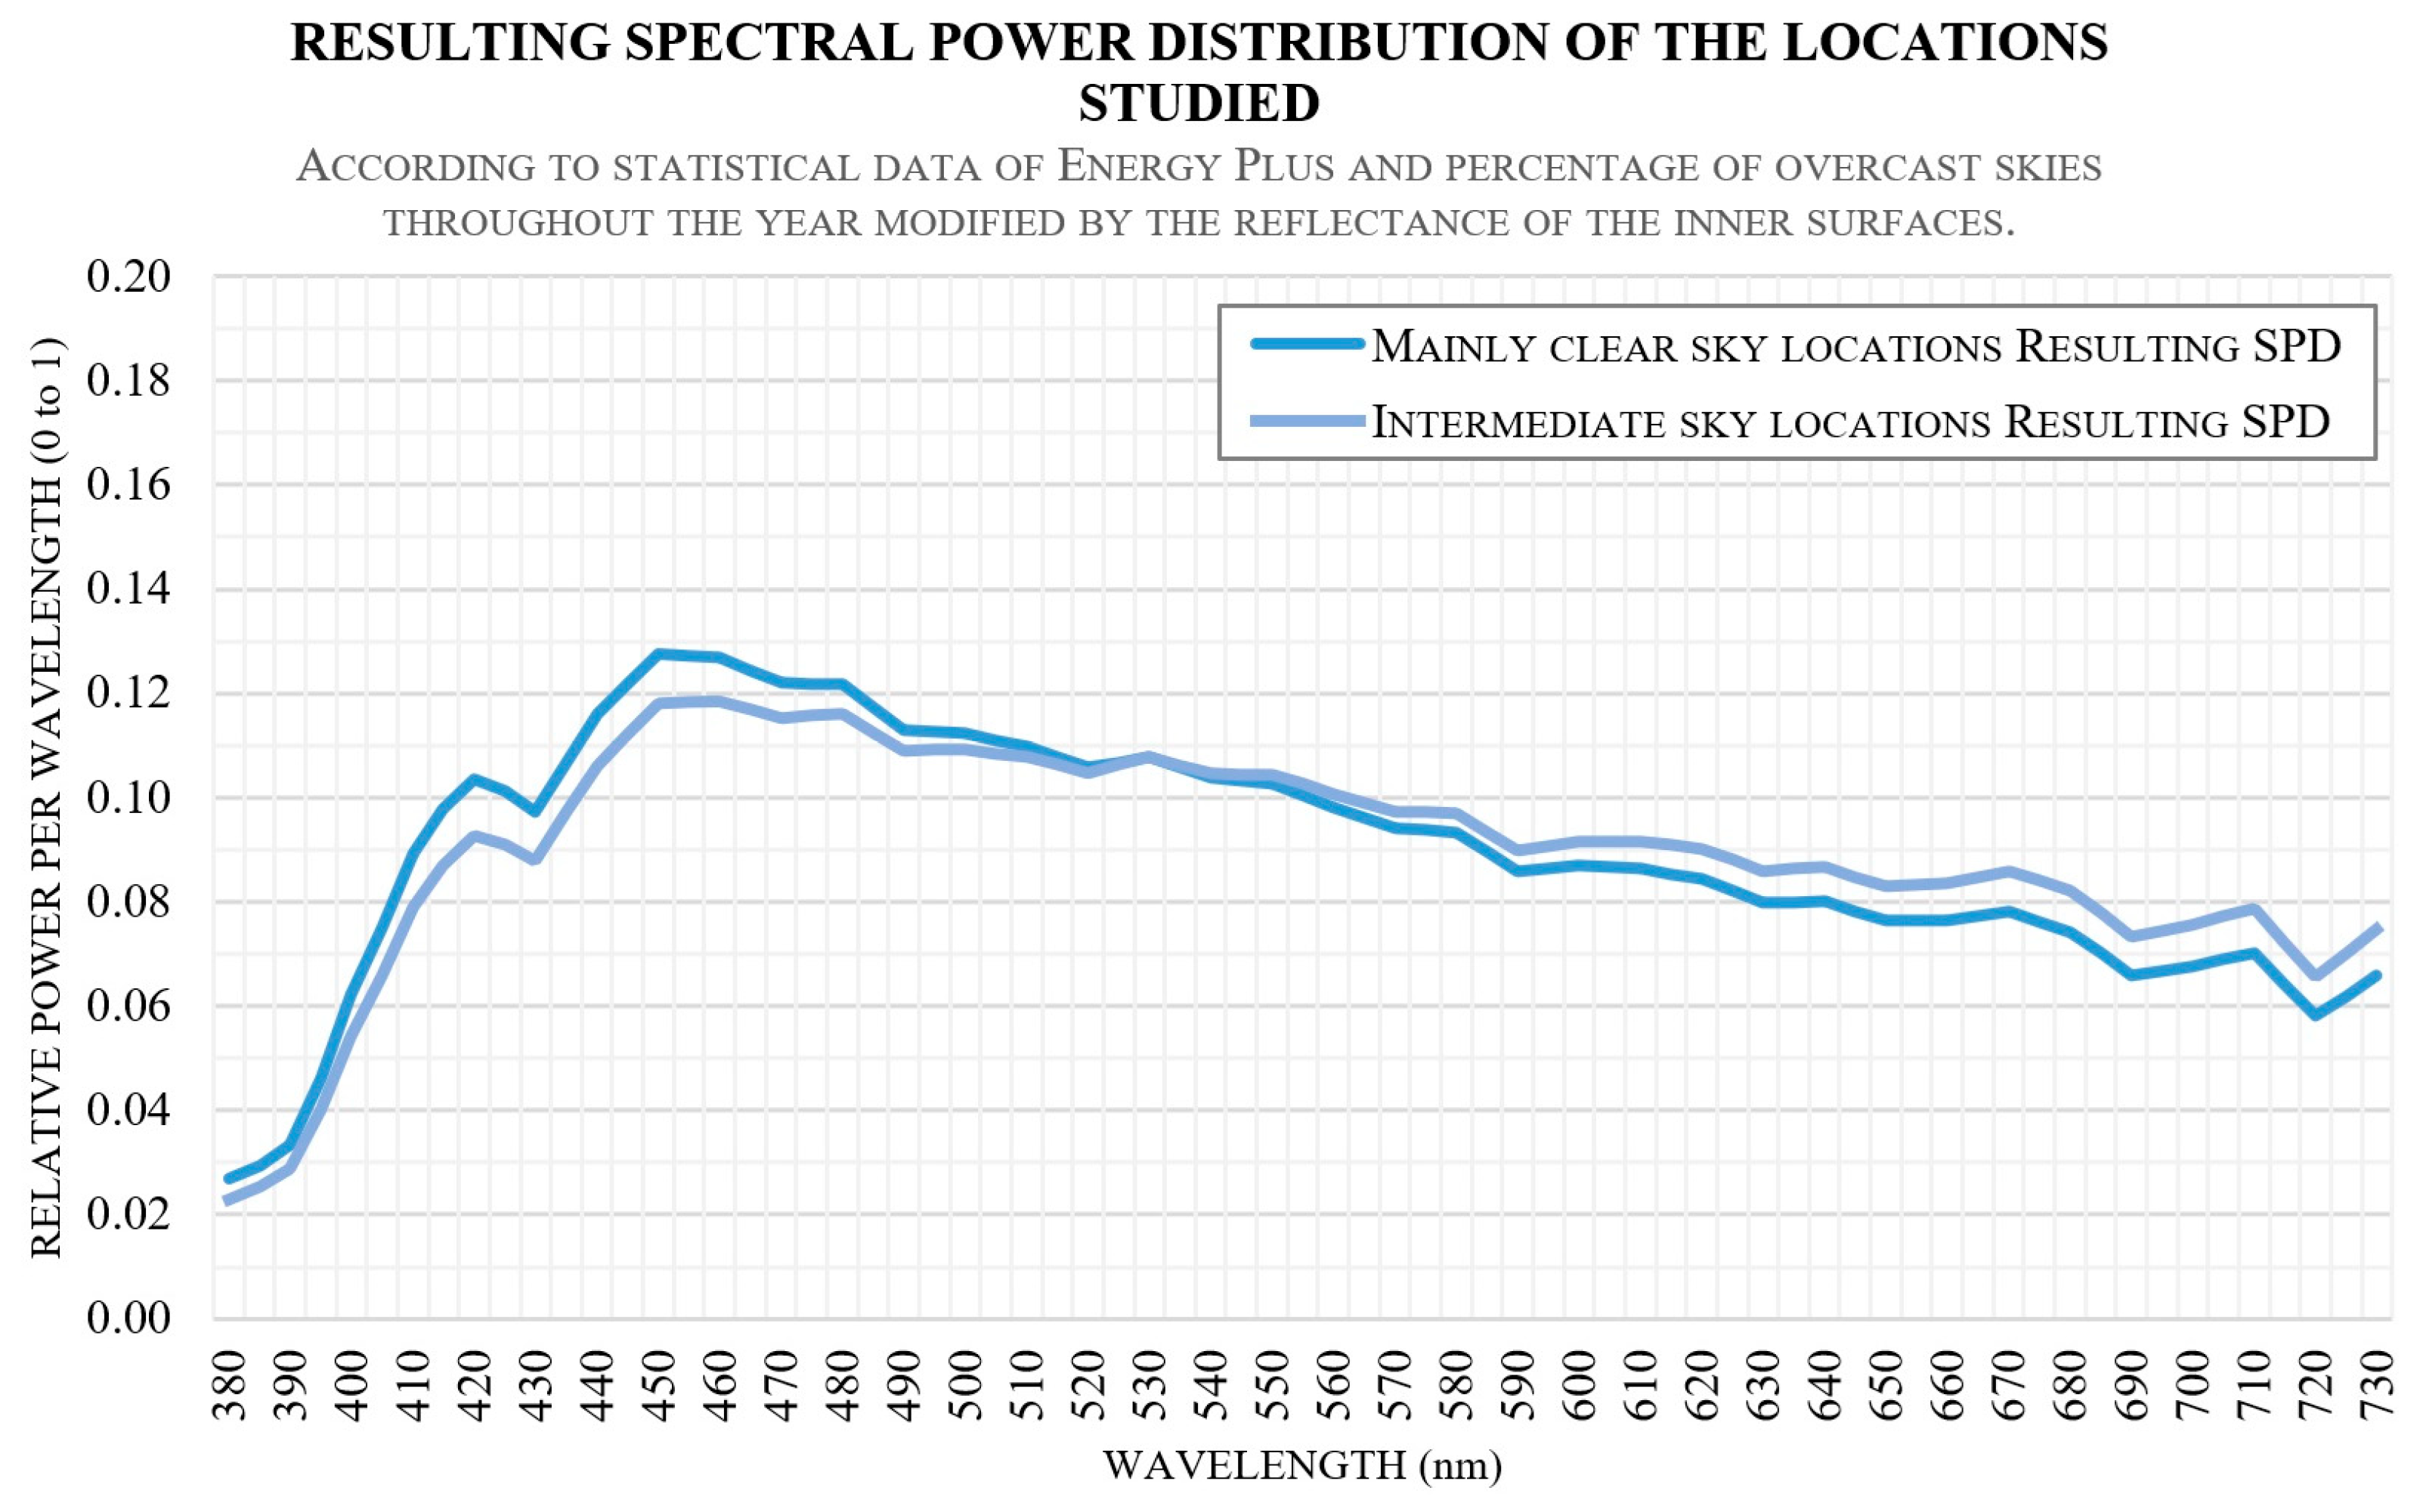
Figure 5 presents the average spectral irradiance distribution derived from the SPD of clear and intermediate skies, considering indoor reflections, for the two Mediterranean locations indicated in Figure 4. This resulting SPD was utilized in the calculation of CSA. It is worth noting that all the SPDs examined demonstrated a substantial decrease in the short-wavelength portion. This phenomenon is primarily attributed to the reduced spectral reflectance values of the surfaces within the room for these wavelengths. This spectral information is essential for assessing circadian entrainment.
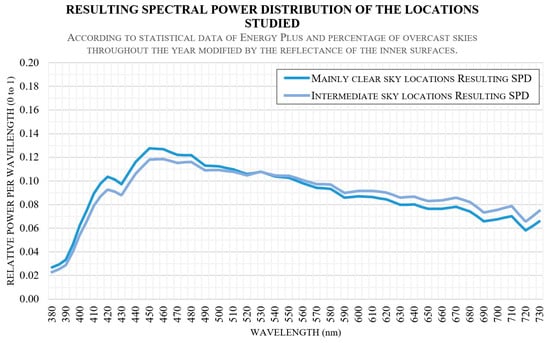
Figure 5.
Modified SPD of daylight according to the inner reflections for Seville and Barcelona.
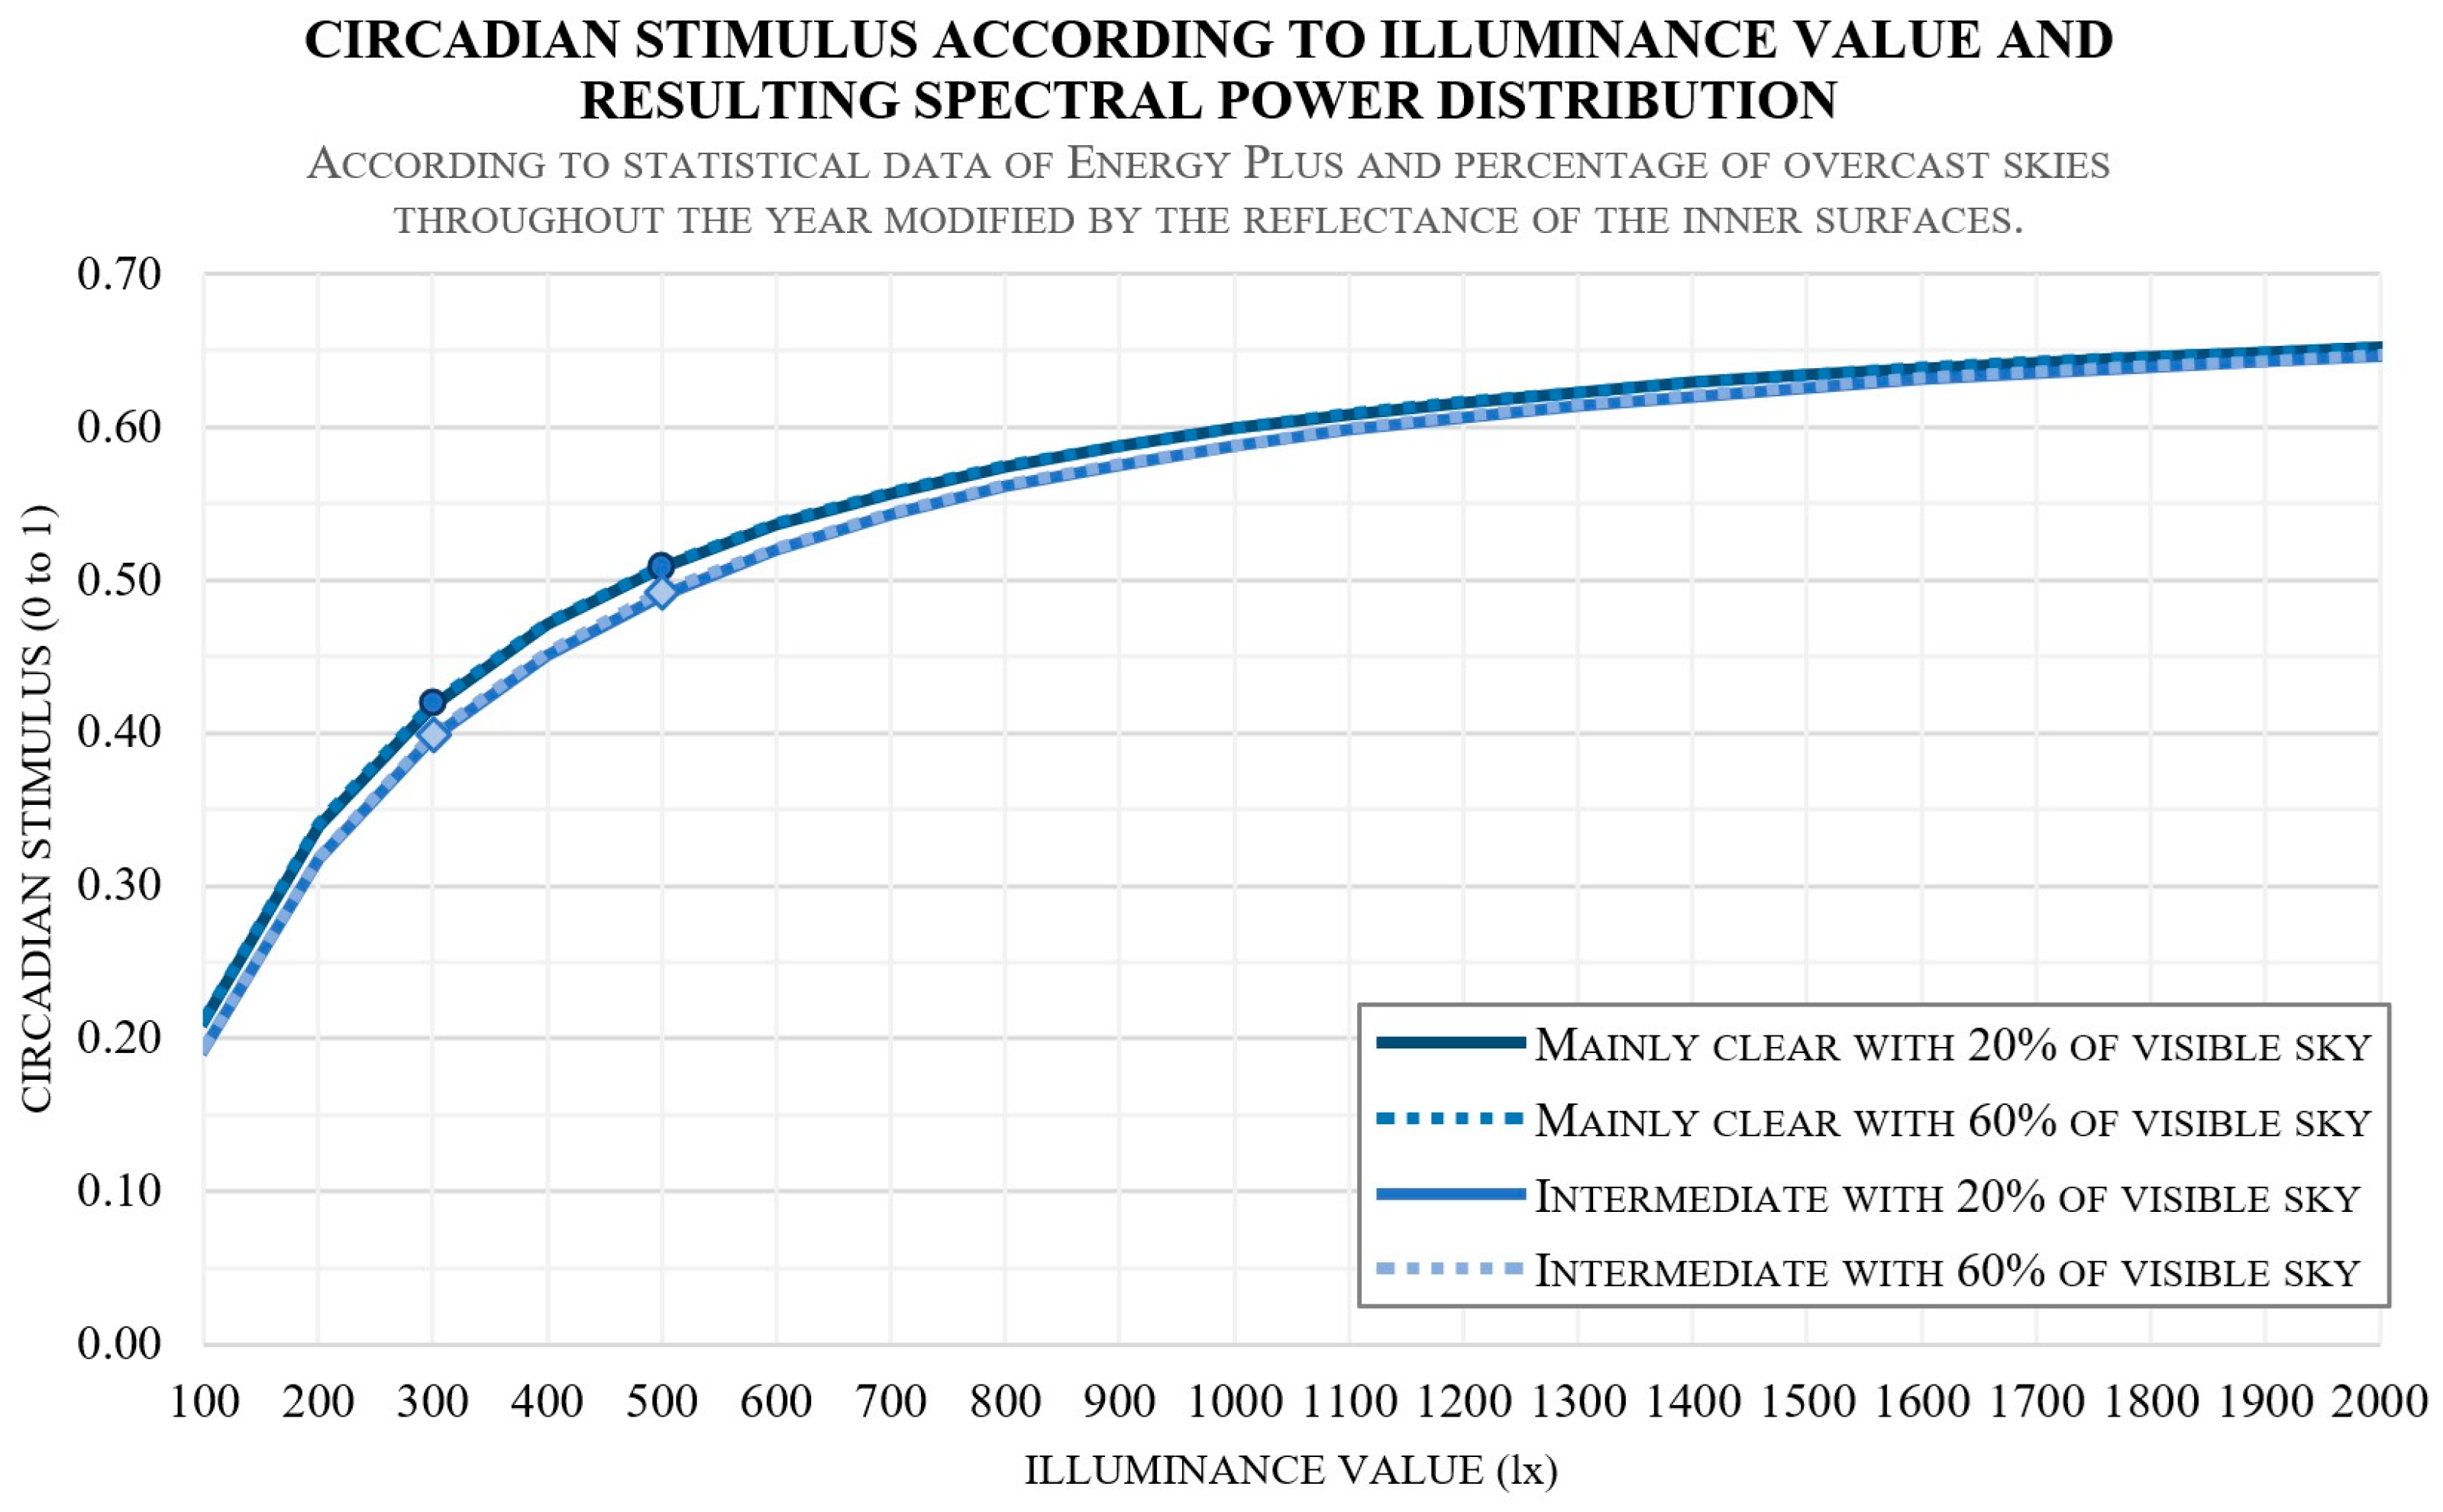
Taking into account the modified SPD shown in Figure 5 and using Equation (2), it is possible to calculate the relationship between CS and the illuminance value, as demonstrated in Figure 6. Notably, with the illuminance set at 300 lux, the resulting CS values fall within the range of 39.7% to 42.0%, considering these Mediterranean climate conditions. Therefore, this study establishes an illuminance threshold for CSA at 300 lux for the cases under examination. This threshold provides a valuable reference for assessing circadian entrainment in the specified scenarios, since in conventional situations, the effect of natural light’s SPD variation, based on location and climate, has a very limited influence on melatonin suppression throughout the day.
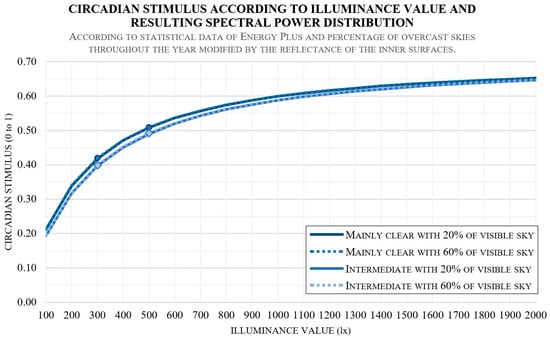
Figure 6.
Relationship between CS and illuminance, according to the spectral irradiances depicted in Figure 5. The circles mark the calculated CS values for 300 and 500 lx with mainly clear skies, while the diamonds mark these CS values for intermediate skies.
2.5. Combination of Variables for Defining the Calculation Models
Table 2 displays the various variables that generate the calculation models in this study, resulting in a total of 256 models. Each variable has been assigned a code between brackets that will later be used to differentiate each hypothesis.

Table 2.
Variables and metrics considered for the development of the calculation models.
2.6. Selection and Validation of the Calculation Engine
This study has been conducted using ClimateStudio 1.8, a graphic interface which uses the Radiance Render calculation engine [66]. This engine incorporates dynamic metrics for the current sky concept [67] and is widely adopted by the scientific community and designers [41,56]. Its validation was carried out in previous studies through adherence to the CIE (International Commission on Illumination) Test Cases [46,68,69,70,71], along with the inclusion of comparisons with annual lighting values derived from real sky conditions [72]. One of these comparisons involves the monitoring of an existing test cell situated in Seville, one of the study locations. This test cell was specifically designed to mimic a household room with similar characteristics [41,42,56,73].
The comparison conducted in these previous studies in Seville verified that the DA values obtained for different thresholds (100, 250, and 500 lx), both during annual monitoring and through simulation using Radiance, resulted in a standard deviation of less than 10% (95% confidence level) in all cases, with an average standard deviation of 6.6% [41,42,56]. These validation procedures allow for the affirmation of the tool’s accuracy and suitability for its intended applications.
3. Results
3.1. Dynamic Metrics Obtained
The working hypotheses of this research are systematically organized through various analyses evaluating the impact of room geometry, including window size and position. Additionally, we examine the influence of interior environmental characteristics, considering both light and dark interior surfaces. The study further explores the effects of natural lighting conditions in two distinct locations, Seville and Barcelona. Lastly, we analyze the role of the north–south orientation of façades containing openings, investigating their contribution to the studied parameters.
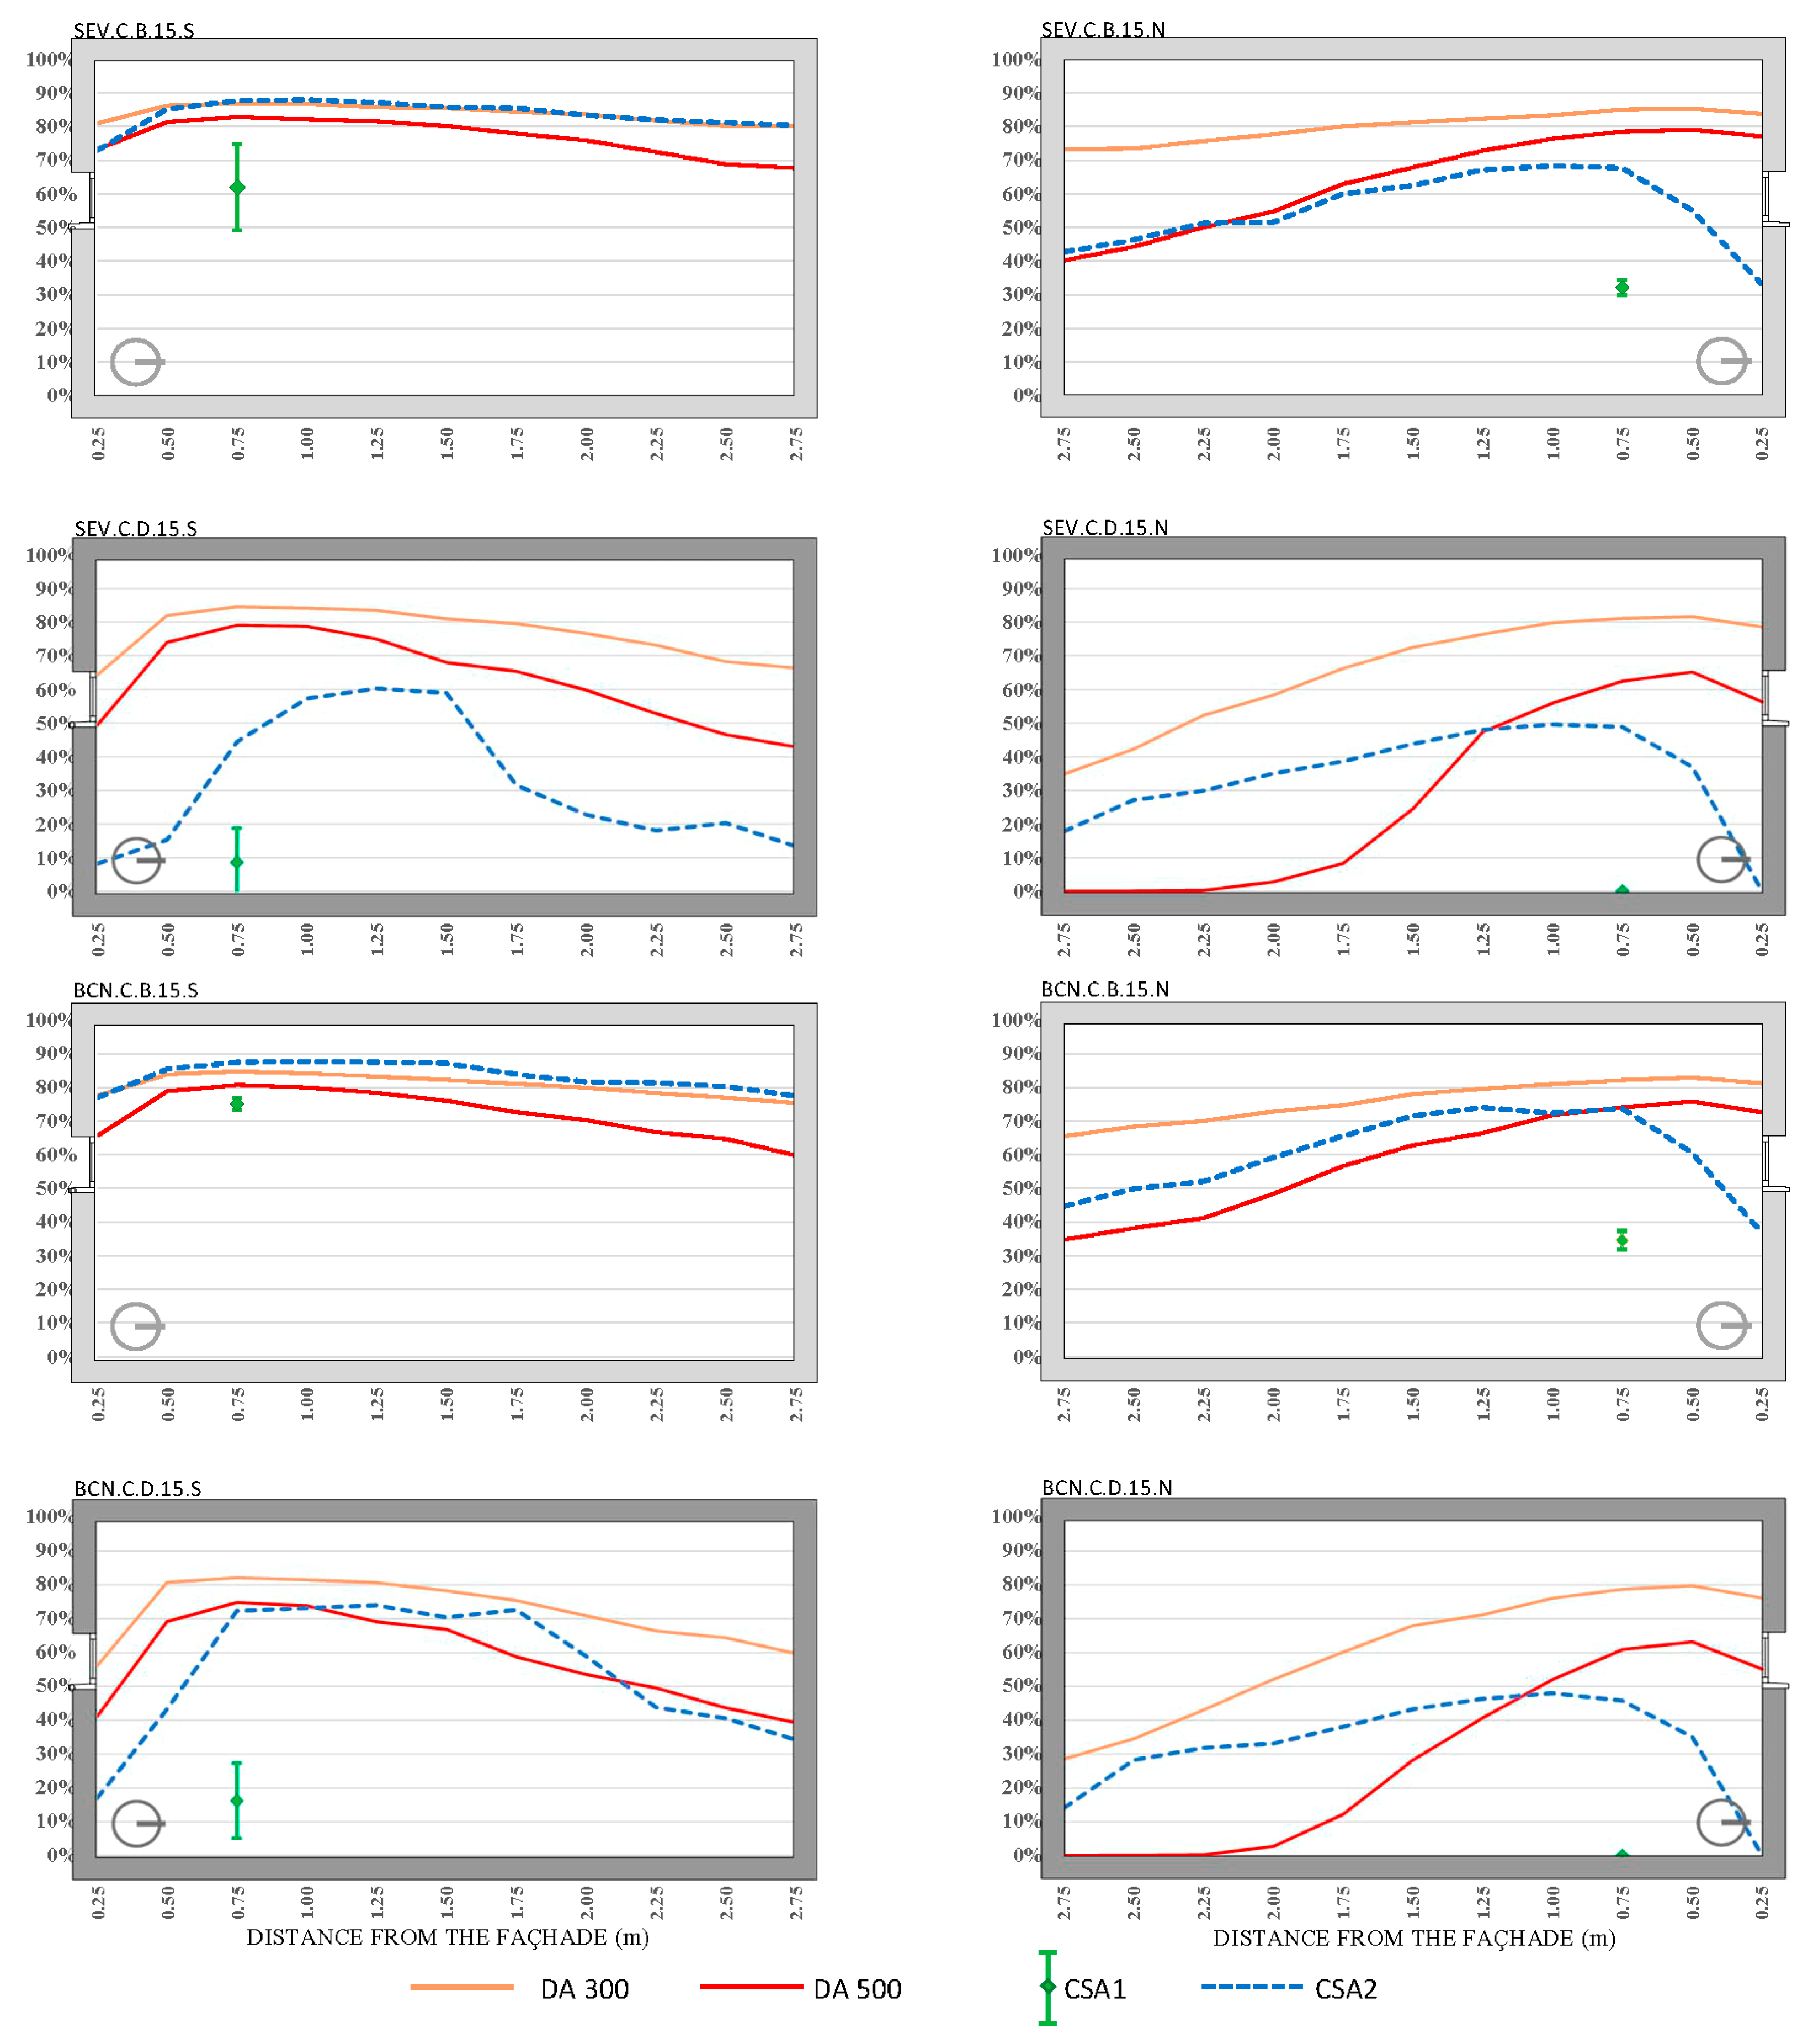
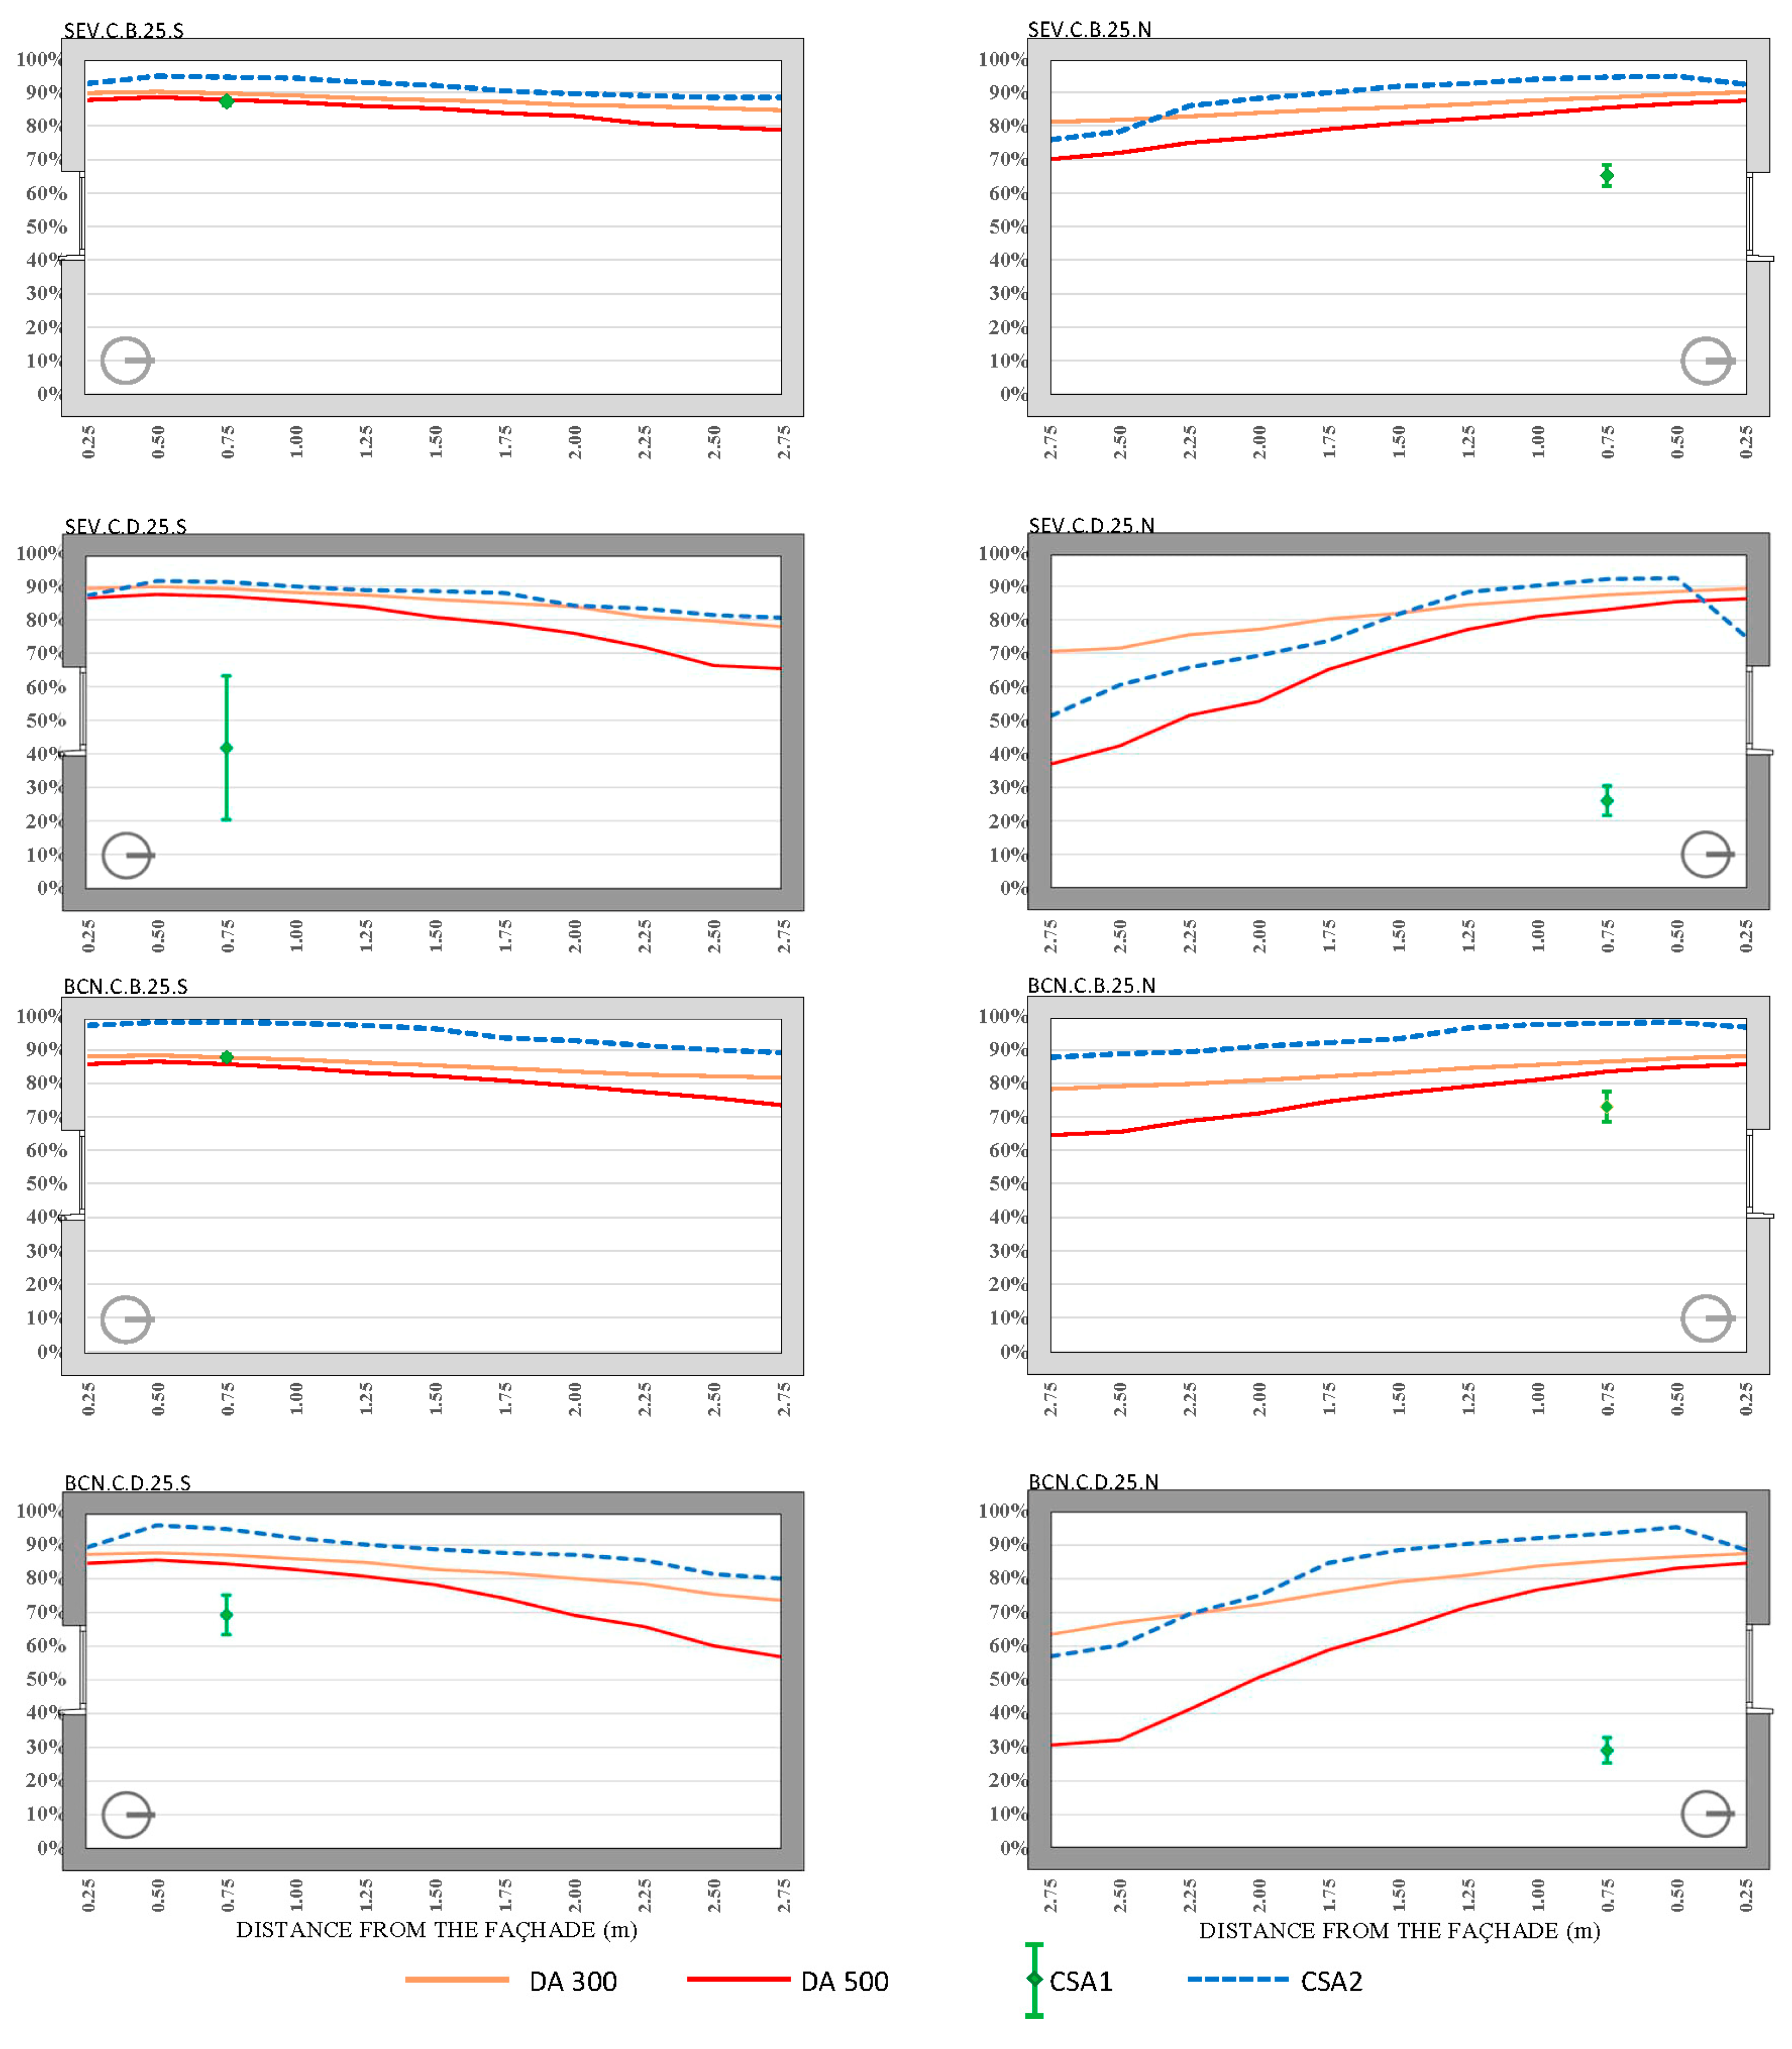
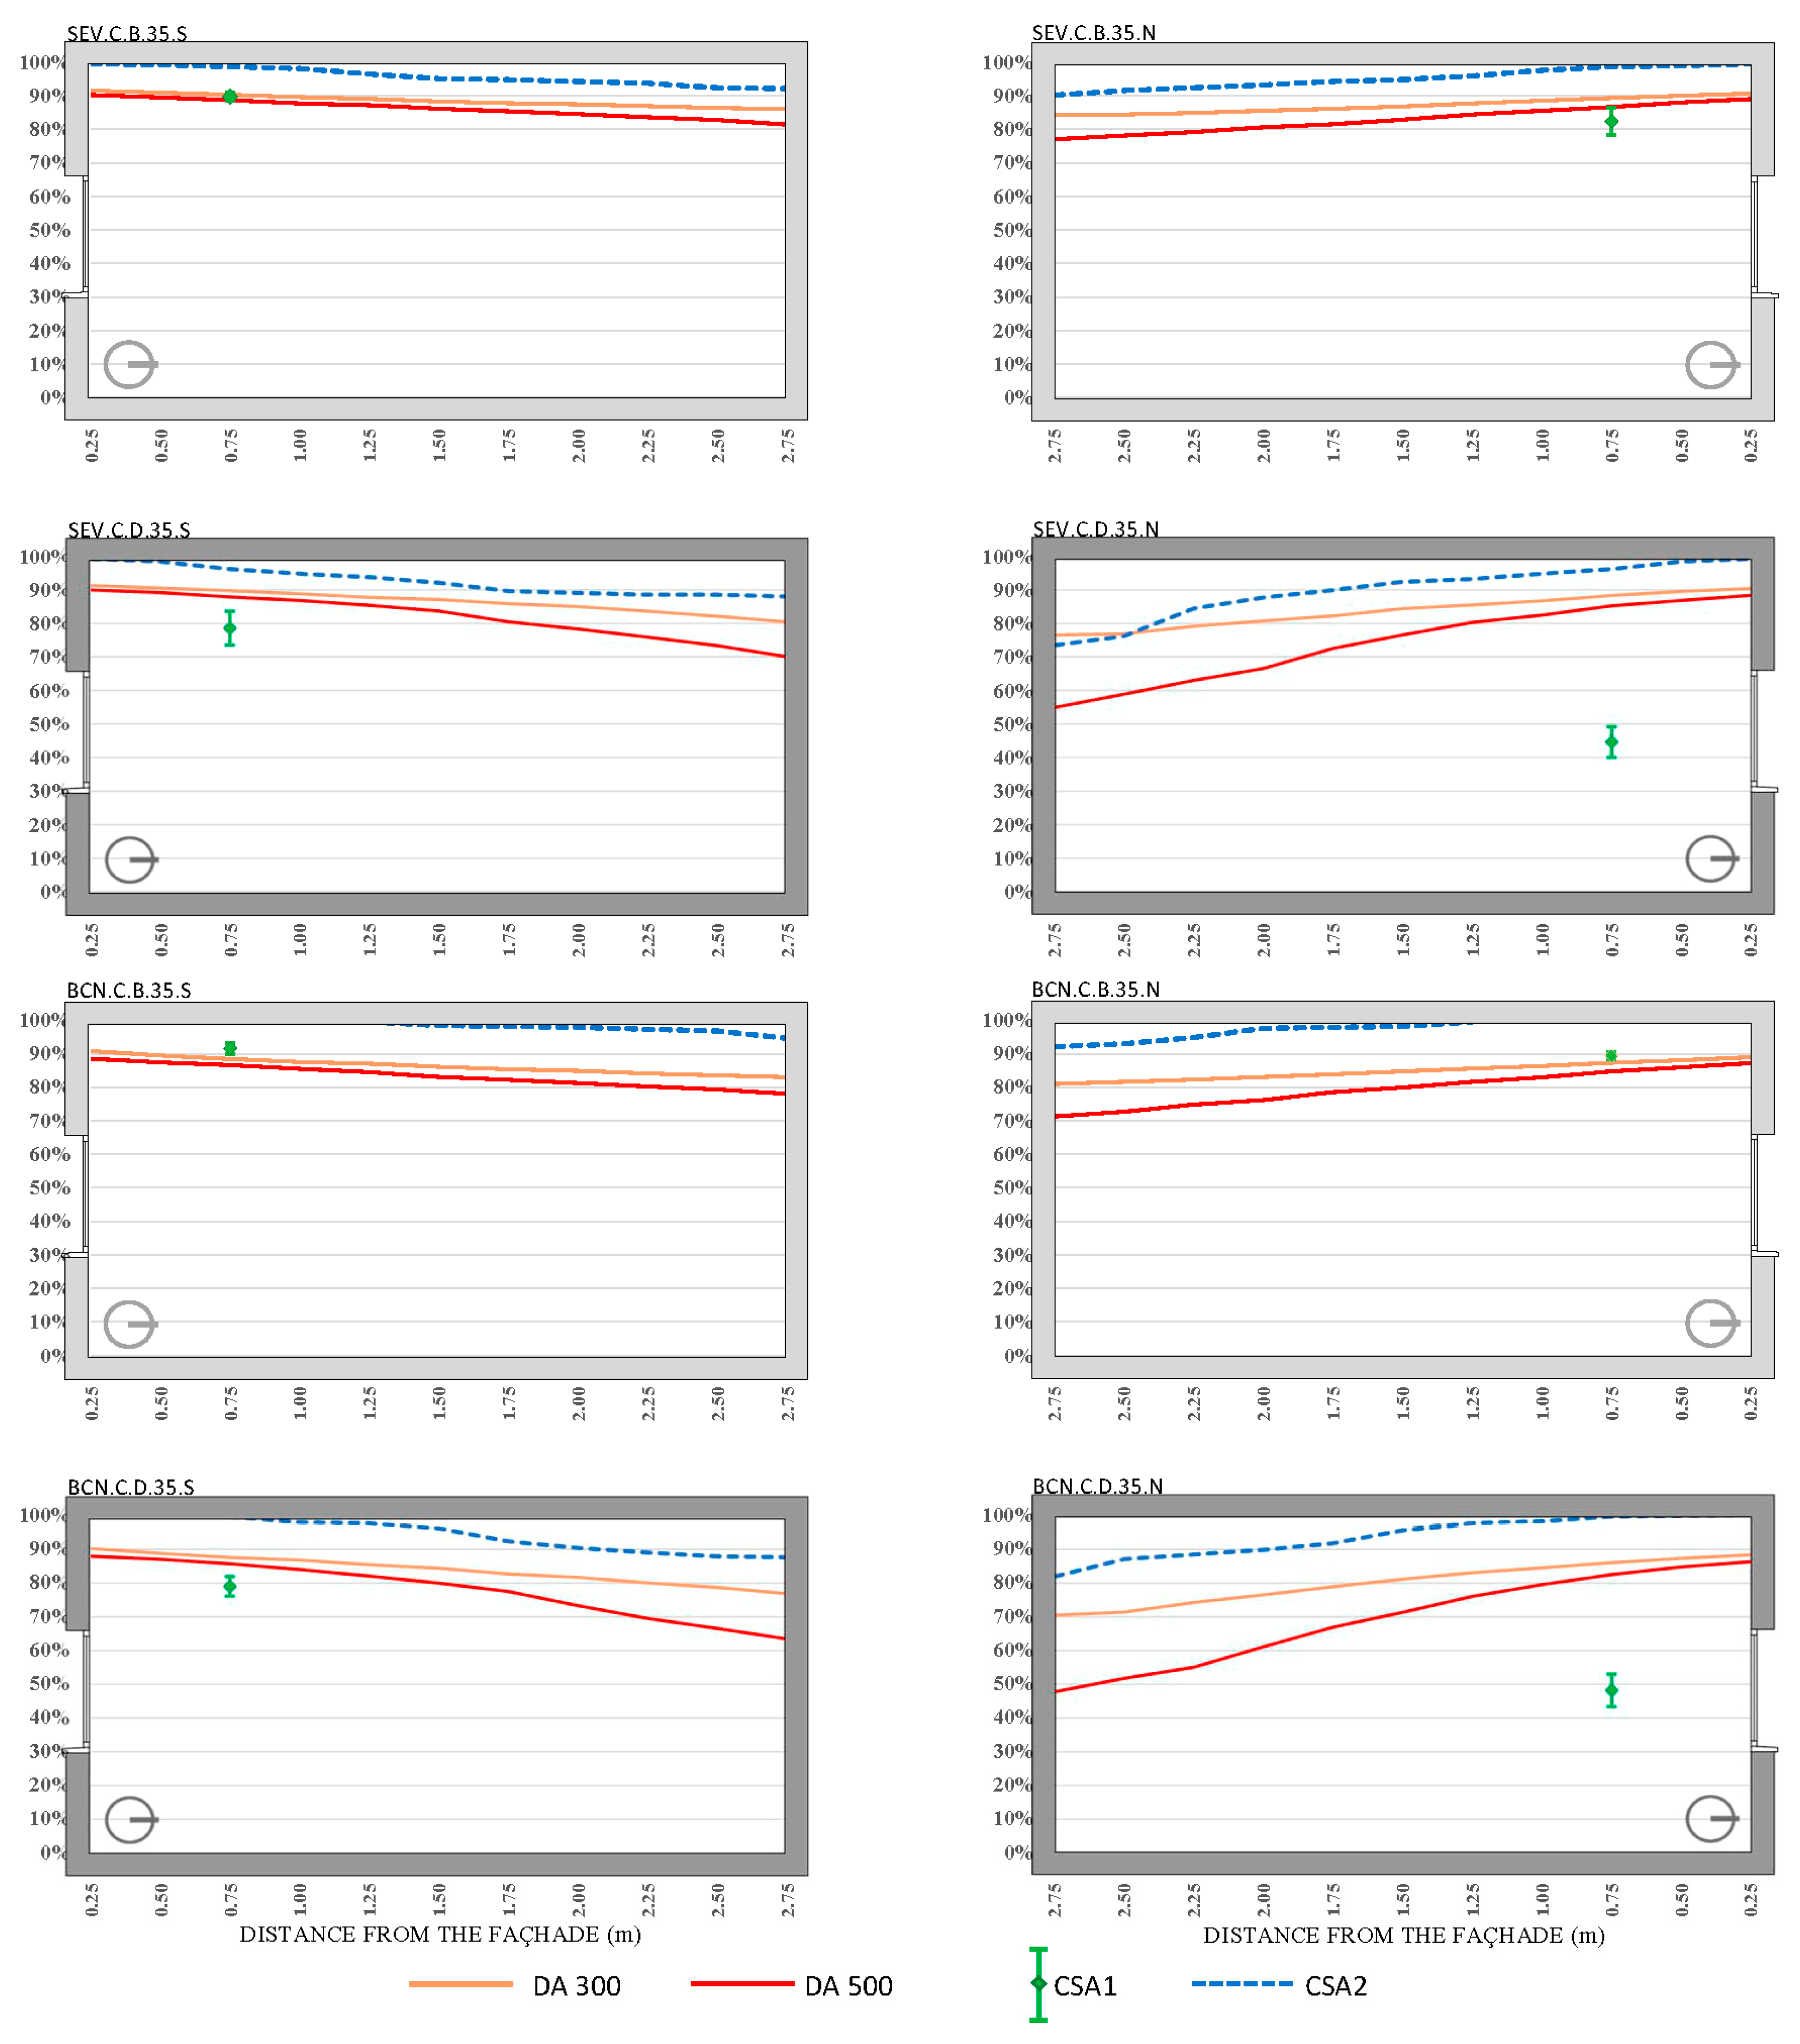
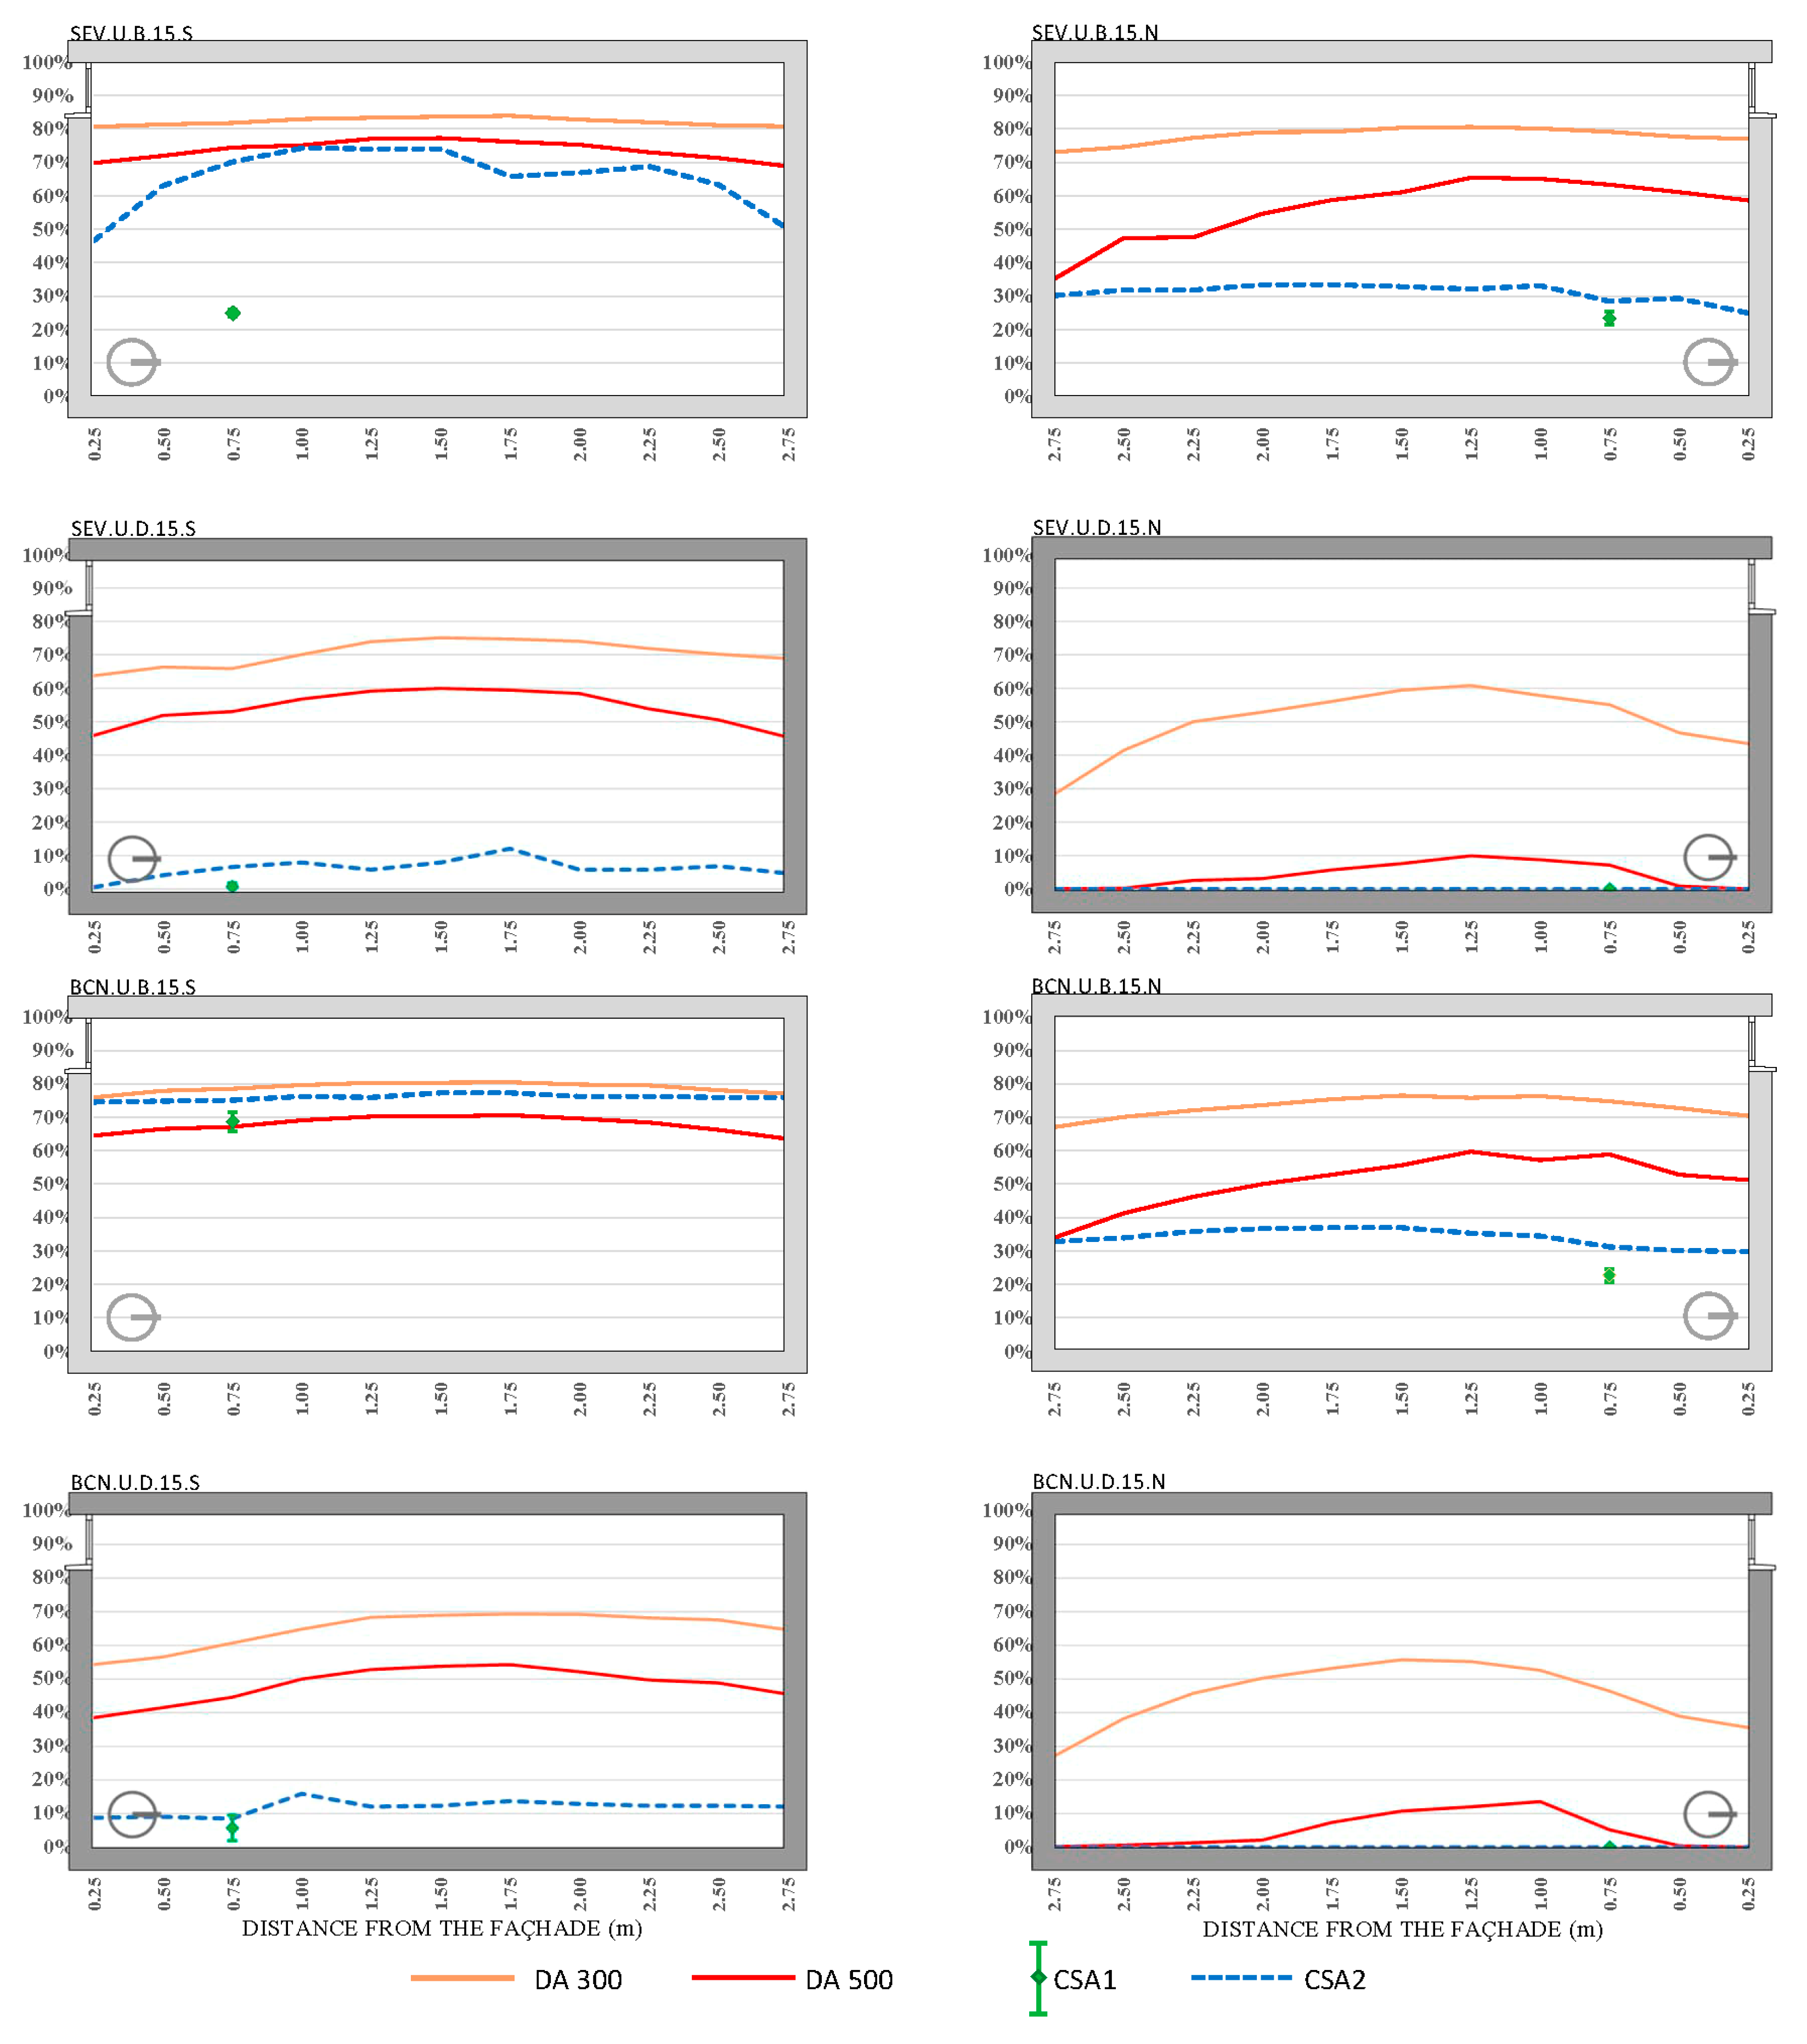
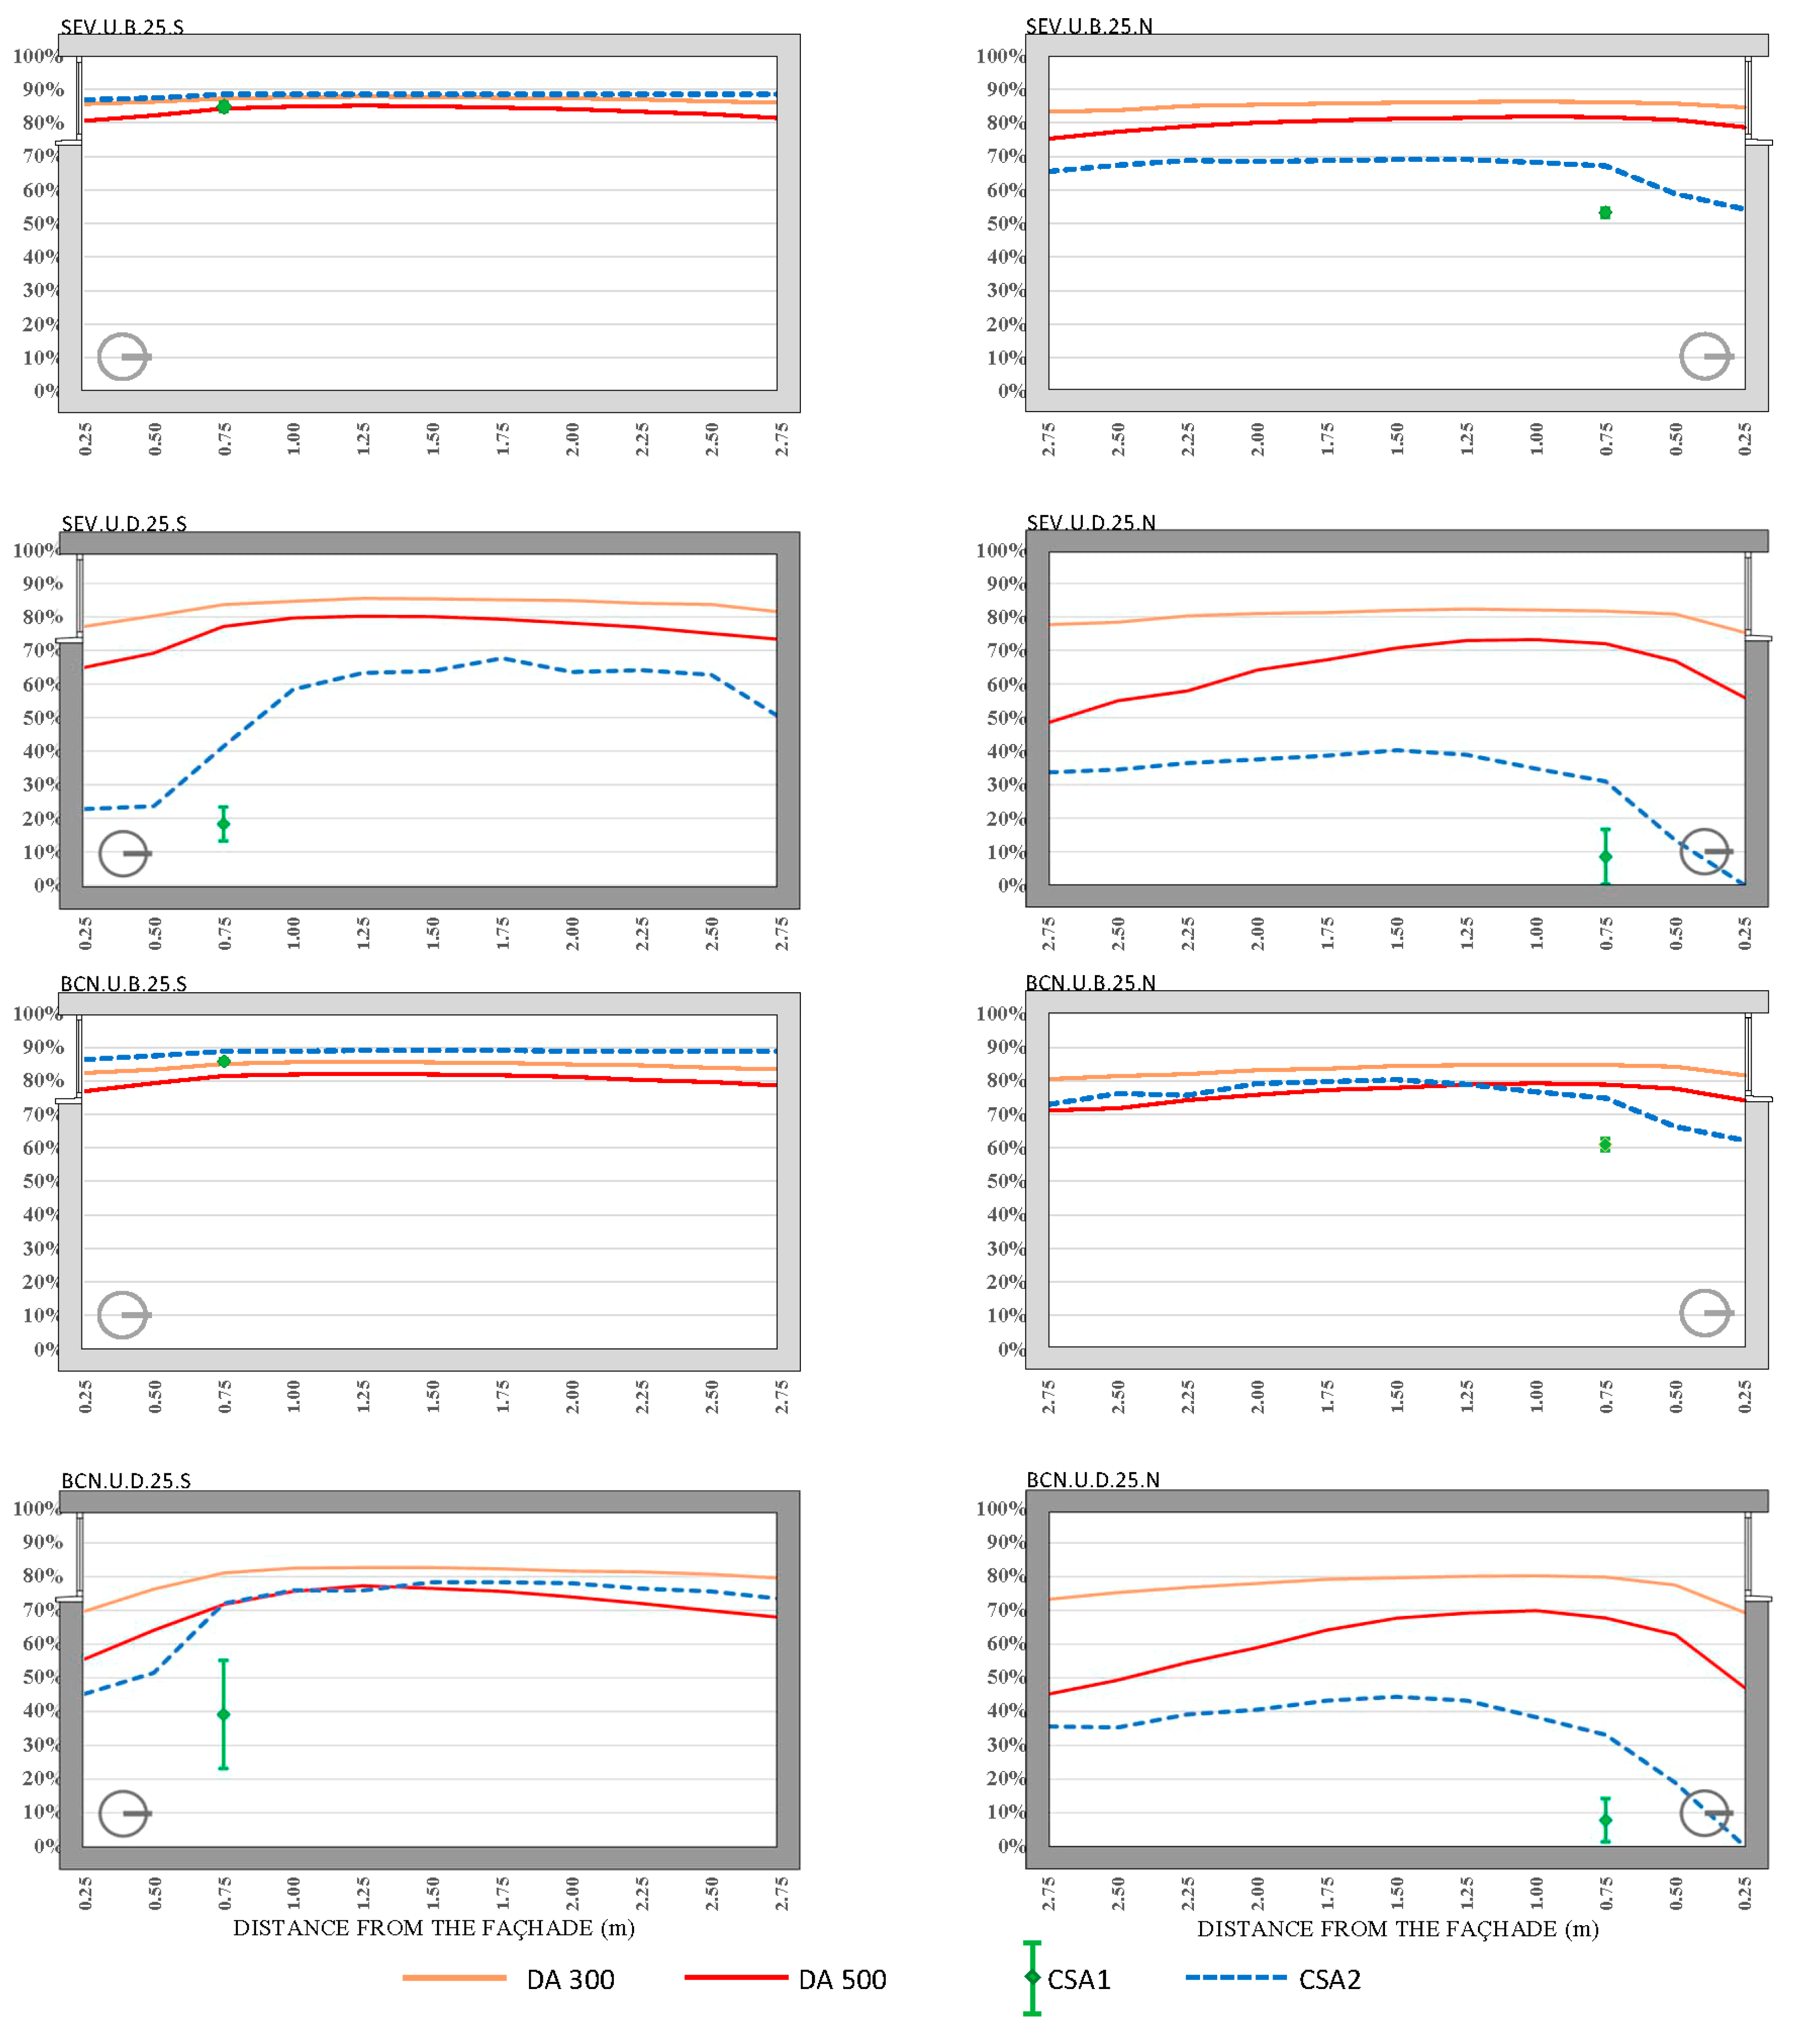
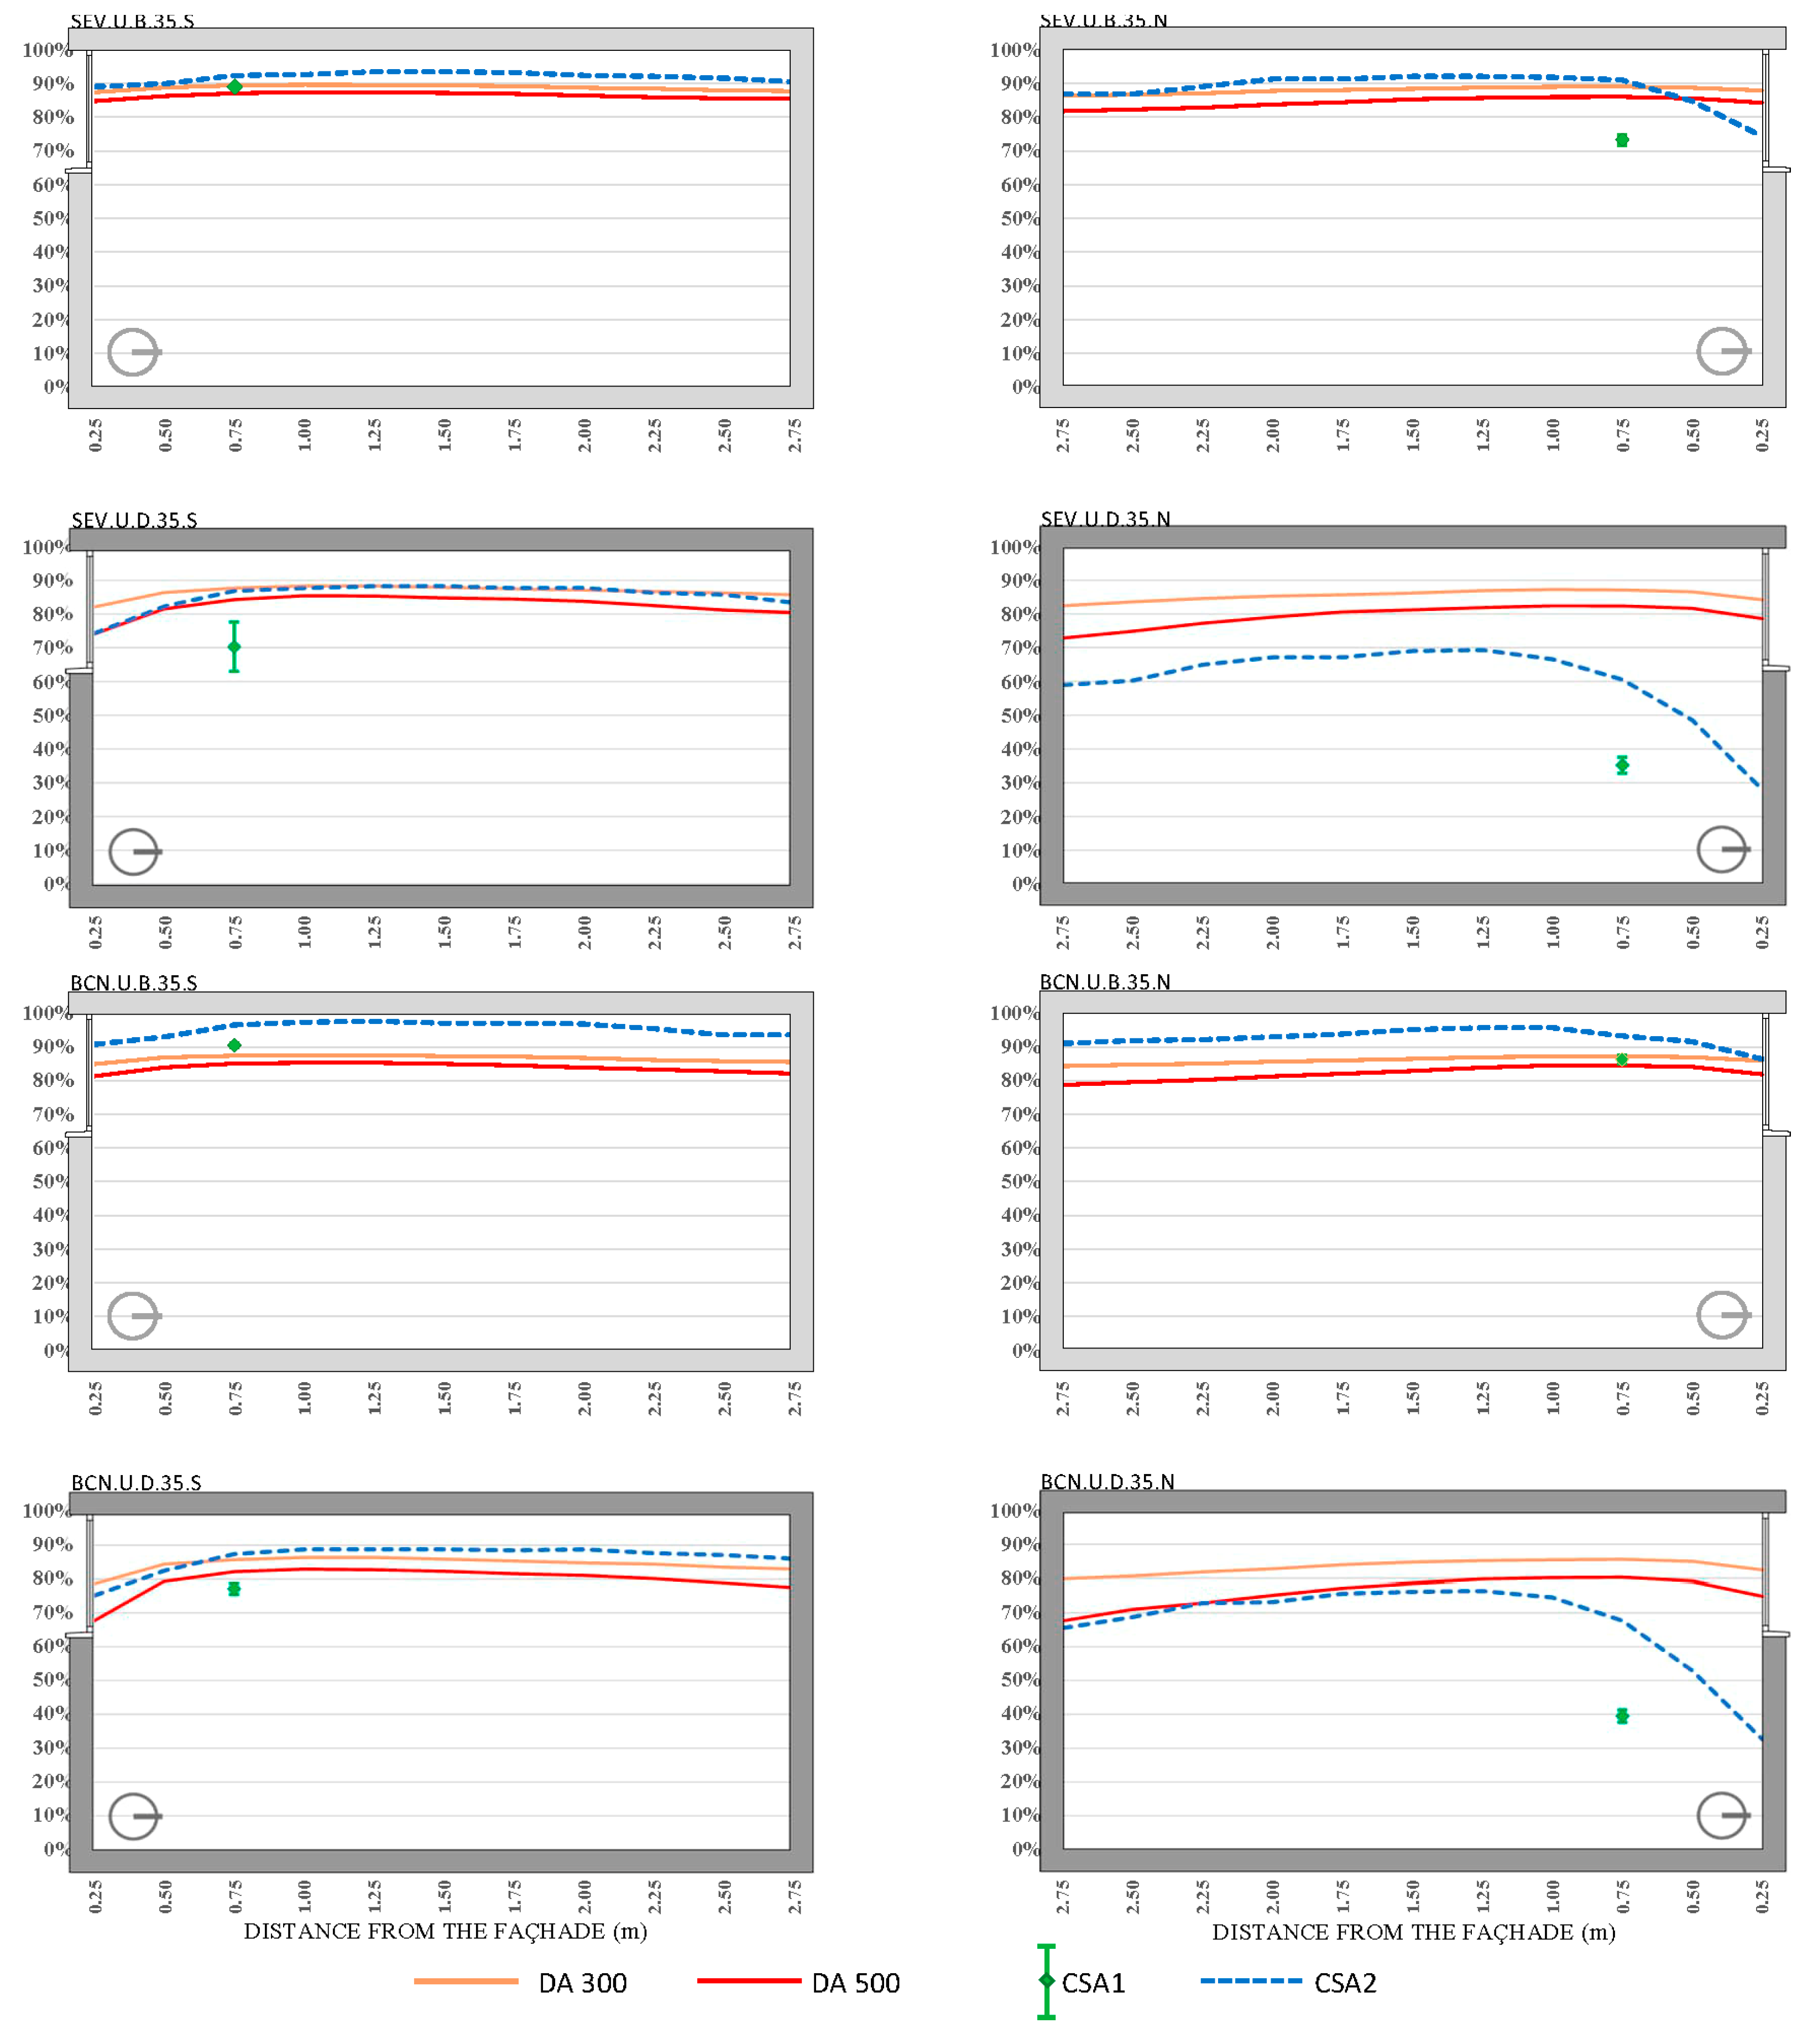
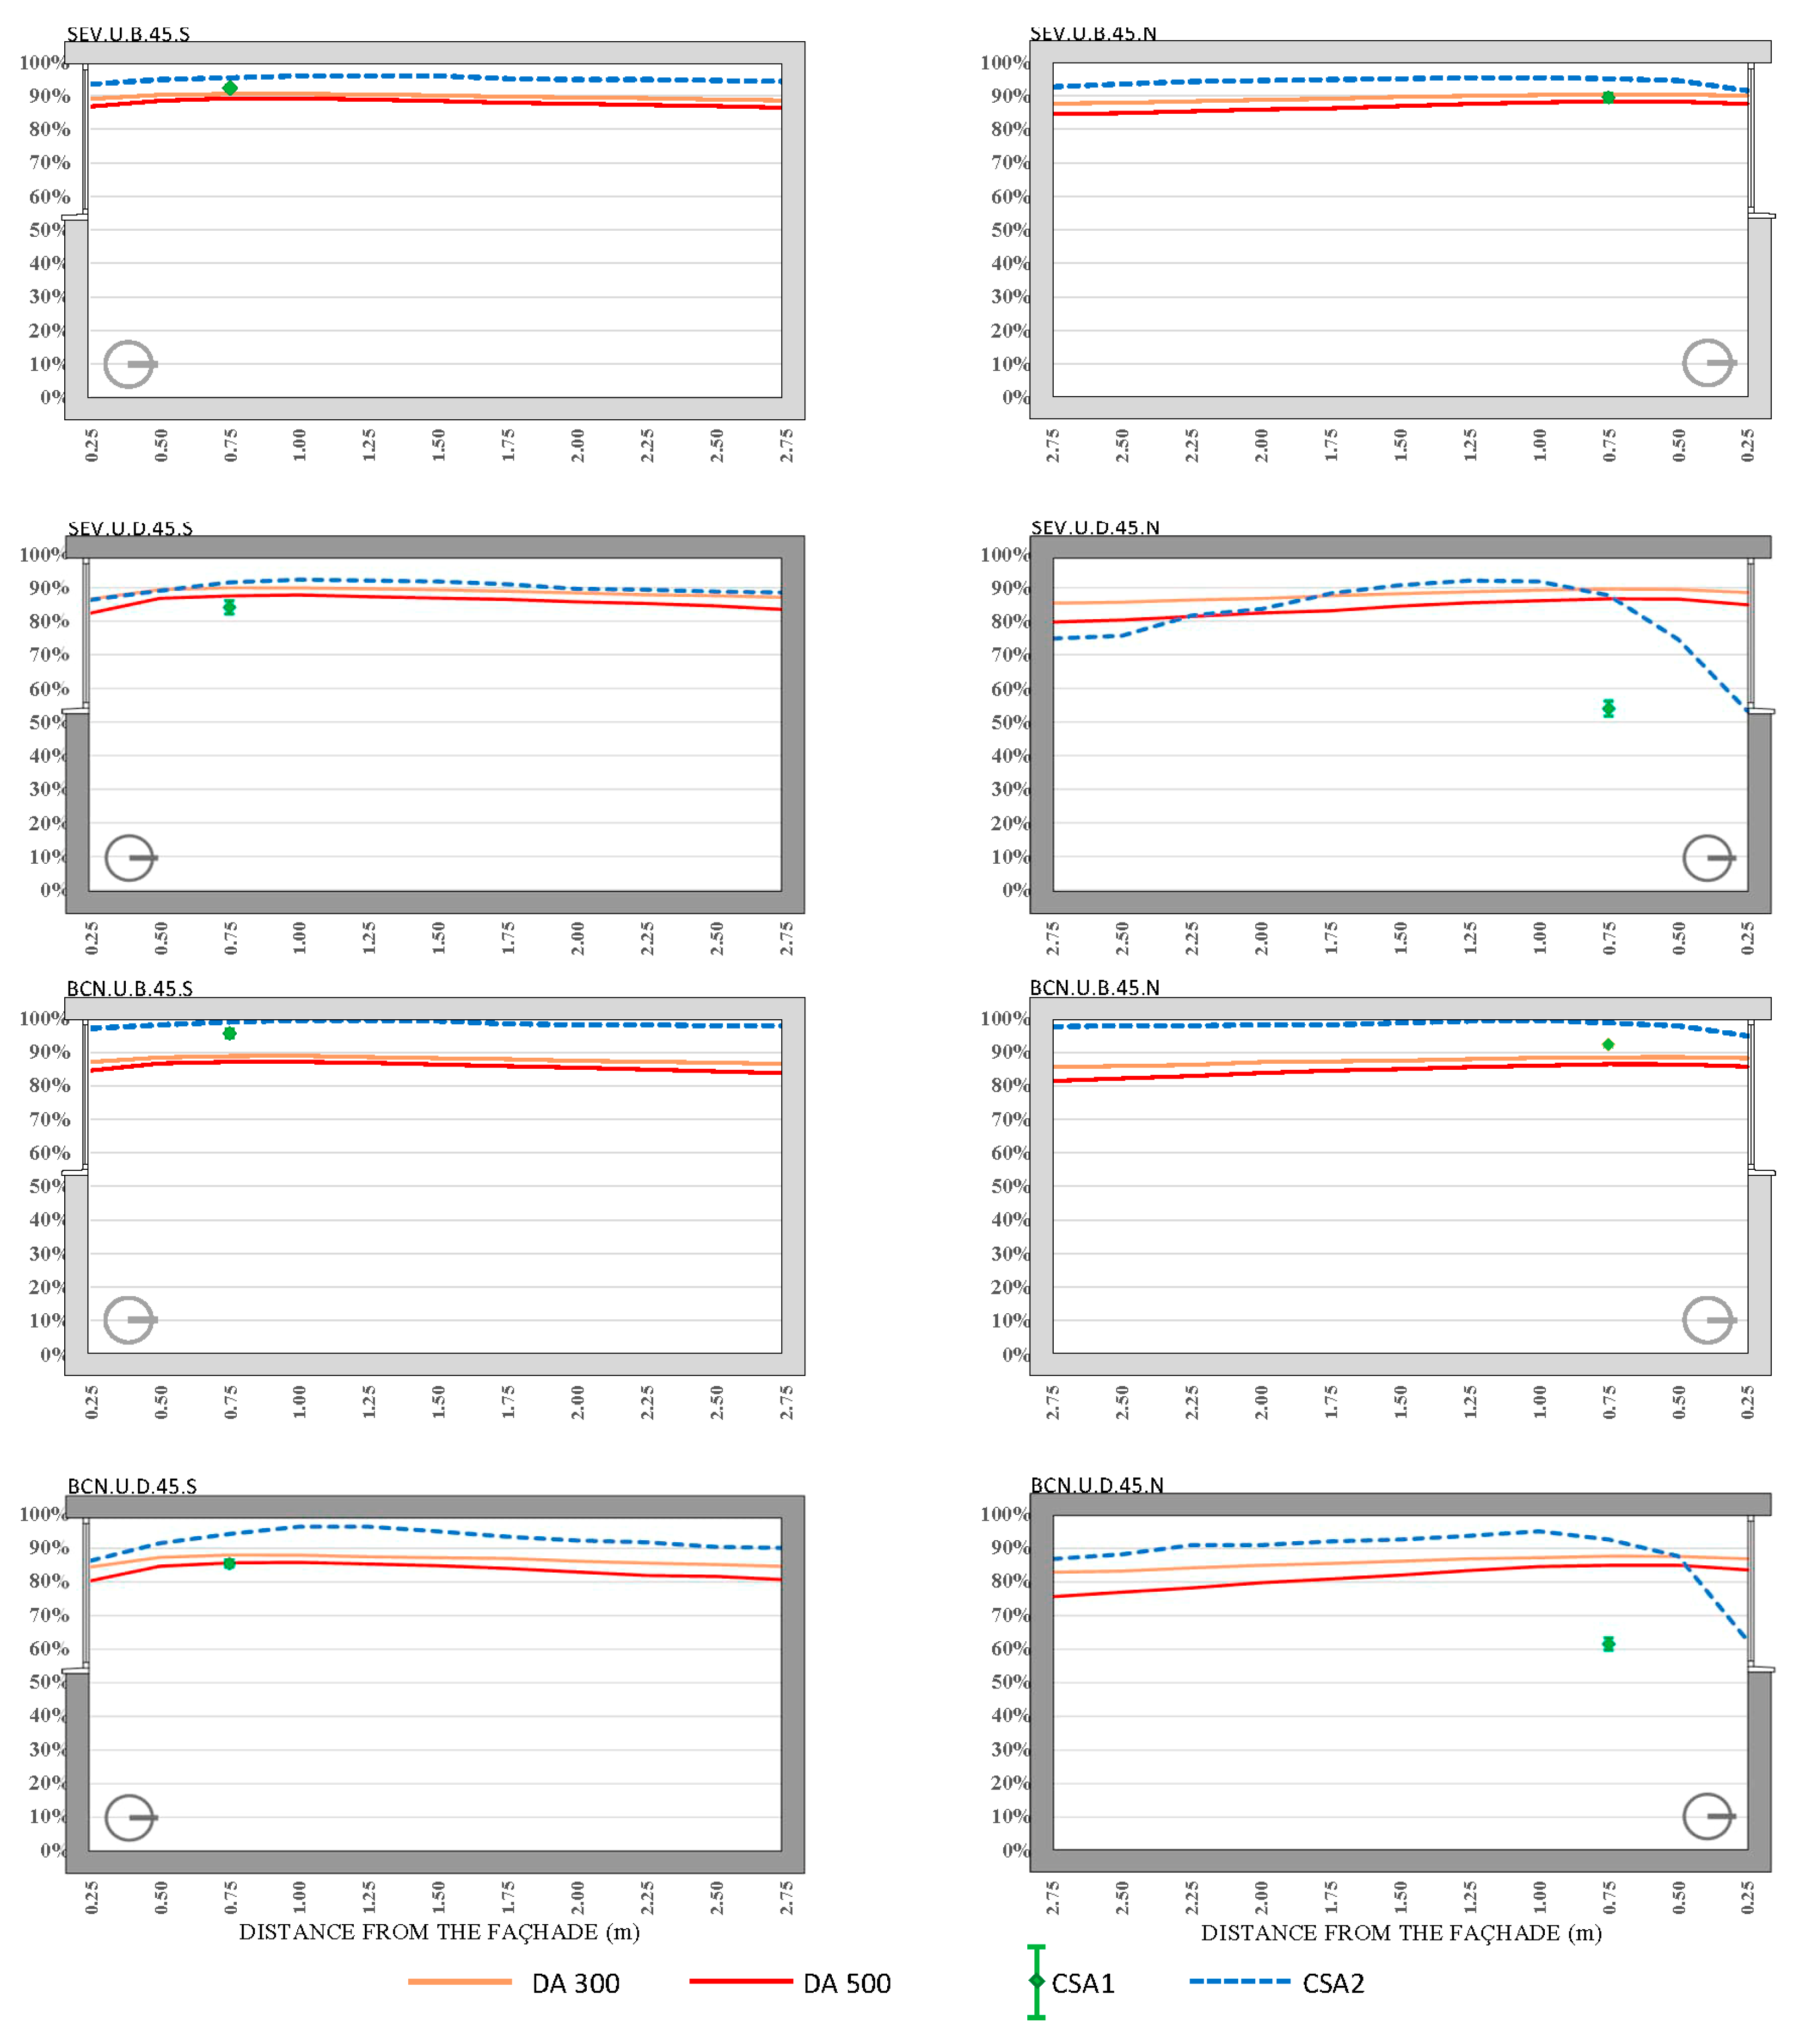
The parameters outlined in Figure 2 were analyzed based on hypotheses involving two different locations (Seville and Barcelona), two window positions (upper and centered), two interior surface finishes (light and dark), four window surface areas (15%, 25%, 35%, and 45%), and two orientations (south and north) for the different thresholds of DA and calculation lines of CSA (DA300, DA500, CSA1, and CSA2), across the various hypotheses, resulting in a total of 265 outcomes, which are detailed in Figure 7, Figure 8, Figure 9, Figure 10, Figure 11, Figure 12, Figure 13 and Figure 14. Table 2 presents the codes used to describe the corresponding variables for each hypothesis.
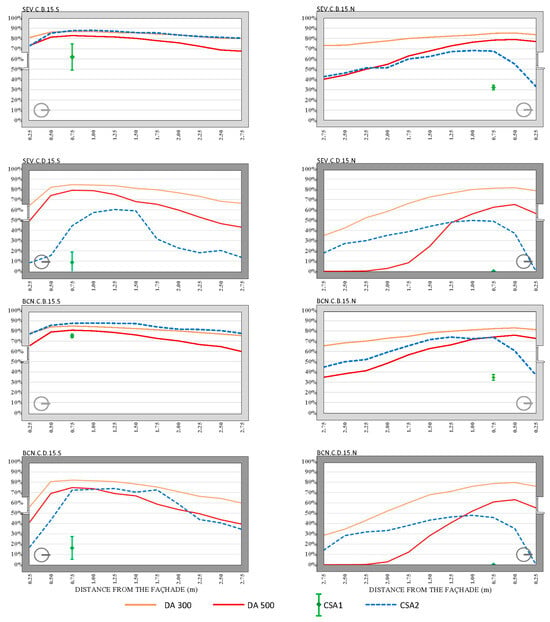
Figure 7.
DA and CSA results for the ICU single cubicle with a WWR of 15% and the upper part of the window at 1 m from the ceiling. The cubicles were located in Seville (SEV) and Barcelona (BCN), with two window positions, upper (U) and centered (C); two interior surface finishes, bright (B) and dark (D); four window surface areas, 15%, 25%, 35%, and 45%; and two orientations, south (S) and north (N).
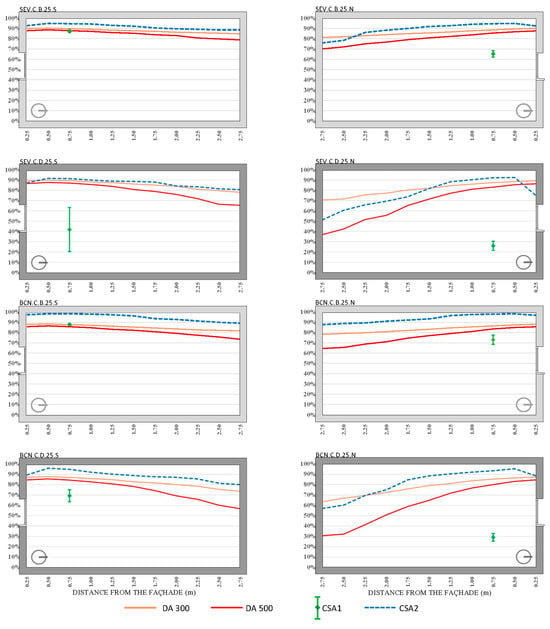
Figure 8.
DA and CSA results for the ICU single cubicle with a WWR of 25% and the upper part of the window at 1 m from the ceiling. The cubicles were located in Seville (SEV) and Barcelona (BCN), two window positions, upper (U) and centered (C); two interior surface finishes bright, (B) and dark (D); four window surface areas, 15%, 25%, 35%, and 45%; and two orientations, south (S) and north (N).
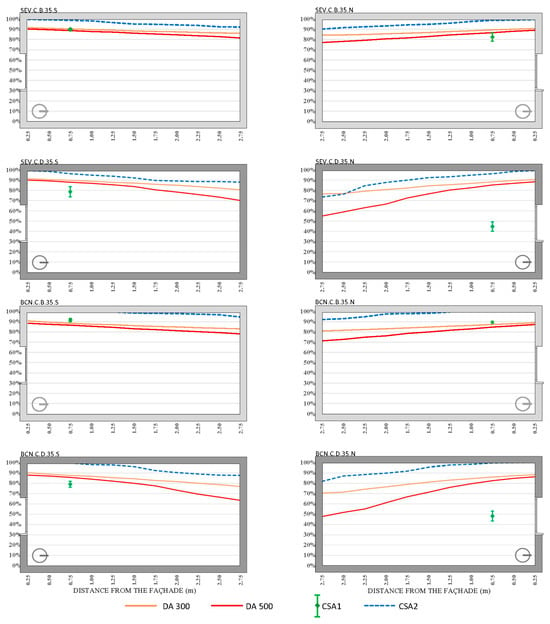
Figure 9.
DA and CSA results for the ICU single cubicle with a WWR of 35% and with the upper part of the window at 1 m from the ceiling. The cubicles were located in Seville (SEV) and Barcelona (BCN), with two window positions, upper (U) and centered (C); two interior surface finishes, bright (B) and dark (D); four window surface areas, 15%, 25%, 35%, and 45%; and two orientations, south (S) and north (N).
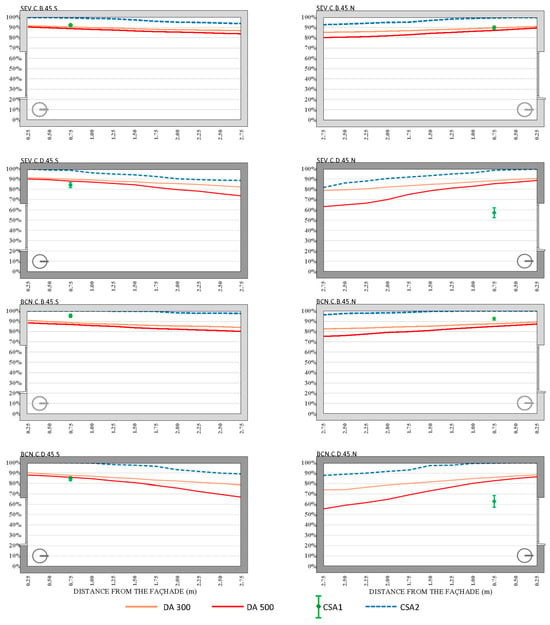
Figure 10.
DA and CSA results for the ICU single cubicle with a WWR of 45% and with the upper part of the window at 1 m from the ceiling. The cubicles were located in Seville (SEV) and Barcelona (BCN), with two window positions, upper (U) and centered (C); two interior surface finishes, bright (B) and dark (D; four window surface areas, 15%, 25%, 35%, and 45%; and two orientations, south (S) and north (N).
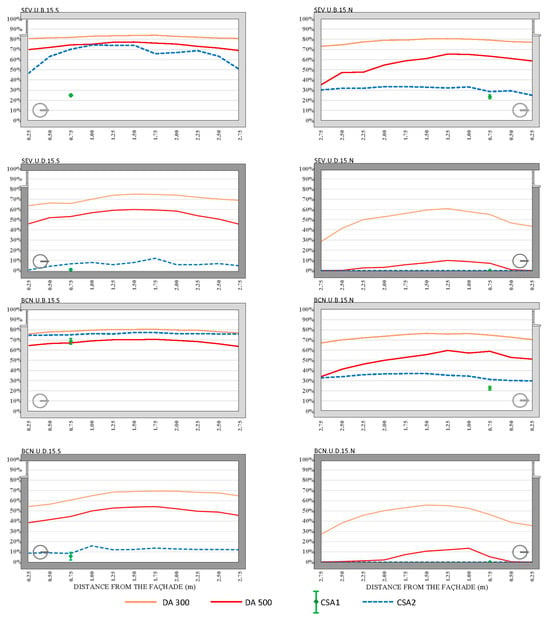
Figure 11.
DA and CSA results for the ICU single cubicle with a WWR of 15% and with the upper part of the window flush with the ceiling. The cubicles were located in Seville (SEV) and Barcelona (BCN), with two window positions, upper (U) and centered (C); two interior surface finishes, bright (B) and dark (D); four window surface areas, 15%, 25%, 35%, and 45%; and two orientations, south (S) and north (N).
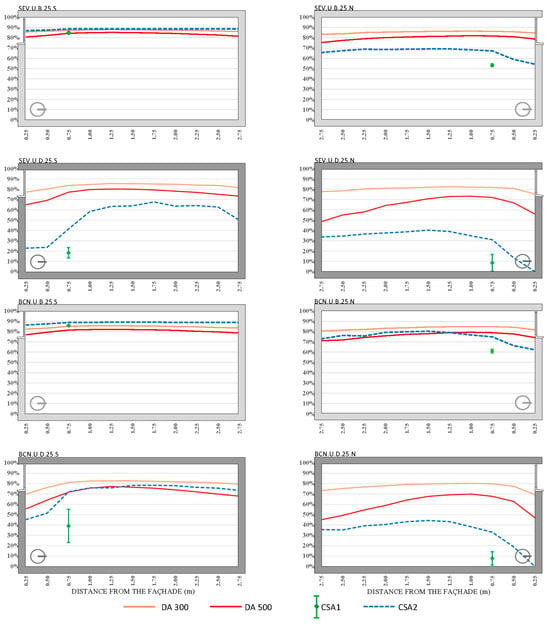
Figure 12.
DA and CSA results for the ICU single cubicle with a WWR of 25% and with the upper part of the window flush with the ceiling. The cubicles were located in Seville (SEV) and Barcelona (BCN), with two window positions, upper (U) and centered (C); two interior surface finishes, bright (B) and dark (D); four window surface areas, 15%, 25%, 35%, and 45%; and two orientations, south (S) and north (N).
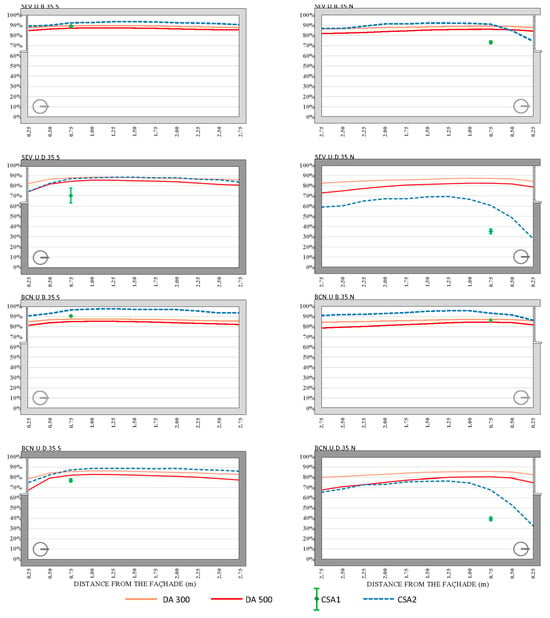
Figure 13.
DA and CSA results for the ICU single cubicle with a WWR of 35% and with the upper part of the window flush with the ceiling. The cubicles were located in Seville (SEV) and Barcelona (BCN), with two window positions, upper (U) and centered (C); two interior surface finishes, bright (B) and dark (D); four window surface areas, 15%, 25%, 35%, and 45%; and two orientations, south (S) and north (N).
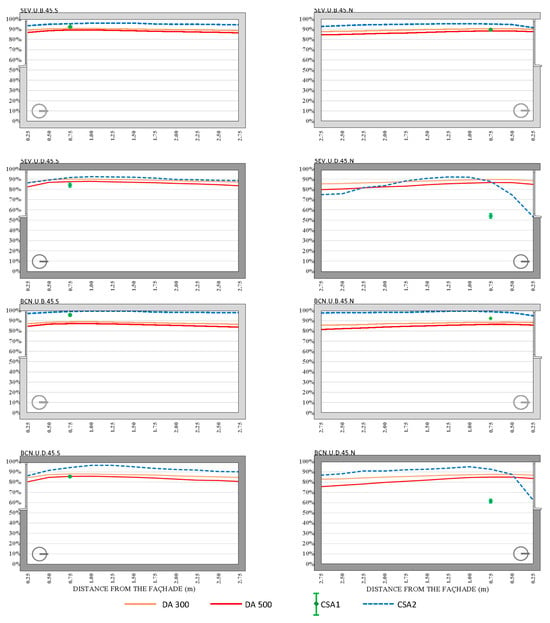
Figure 14.
DA and CSA results for the ICU single cubicle with a WWR of 45% and with the upper part of the window flush with the ceiling. The cubicles were located in Seville (SEV) and Barcelona (BCN), with two window positions, upper (U) and centered (C); two interior surface finishes, bright (B) and dark (D); four window surface areas, 15%, 25%, 35%, and 45%; and two orientations, south (S) and north (N).
3.2. Daylight Autonomy (DA)
The analysis of the daylight autonomy (DA300 and DA500) results across various configurations of window-to-wall ratios (WWR), orientations, locations (Seville and Barcelona), and interior reflectances (bright and dark coatings), as shown in Figure 7, Figure 8, Figure 9, Figure 10, Figure 11, Figure 12, Figure 13 and Figure 14, reveals distinct patterns, as follows:
3.2.1. Influence of Window-to-Wall Ratio (WWR, 15% to 45%)
Larger window openings yield higher DA300 and DA500 values, attributable to increased daylight access, although there is a notable decline towards the back of the rooms. For WWRs between 25% and 45%, the DA300 values are approximately 5% higher with windows centered on the façade compared to those obtained with windows in an upper position, with averages around 90% in Seville and 85% in Barcelona. Specifically, DA500 values for bright interior coatings range from 80% to 87%, showing consistent levels throughout the room’s depth, while dark coatings display a wider dispersion of DA500 values, depending on the type of opening.
For a 15% WWR, the DA500 values in south orientations are significantly lower than those for other window sizes, averaging around 15%. For north orientations, these values increase, reaching up to 30% towards the back of the rooms. A notable ceiling effect causes a substantial decrease in DA500 values, with a nearly 30% difference between centered and upper window configurations. Additionally, for a 15% WWR, centered windows facing north in both locations show DA500 values of 55%, increasing to 64% between 0.50 and 0.75 m but dropping below 0.05 beyond 2.00 m.
3.2.2. Influence of Window Position (Upper/Centered)
The position of the window (upper versus centered) significantly impacts daylight distribution and overall performance metrics. Centered windows consistently outperform upper windows in terms of DA300 and DA500 values, providing more uniform light distribution throughout the space and minimizing areas with low daylight exposure. For example, in north-facing rooms with 25% to 45% WWR and bright coatings, centered windows start with DA500 values between 70% and 90% in Seville and 65% and 88% in Barcelona, while upper configurations begin with slightly lower values (79% to 87%), but these decline less steeply, leading to higher average DA500 values at the room’s end.
3.2.3. Influence of Orientation (North/South)
For north-oriented windows, the DA300 values remain relatively stable across all sizes for bright coatings, except for the values for the 15% WWR with dark finishes, where the DA300 values decrease both near the façade and towards the back of the room, with peaks between 1.00 and 2.00 m from the façade. North-facing rooms display marked differences in DA500 behavior between centered and upper (C/U) window positions. For WWRs ranging from 25% to 45%, the DA500 values for bright coatings in centered configurations start between 70% and 90% in Seville, and 65% and 88% in Barcelona, decreasing linearly towards the room’s rear. Upper configurations begin with slightly lower values (79% to 87%), but these decline less steeply, resulting in higher average values at the room’s end.
In south orientations, the average DA500 values for Seville range from 87% (45% WWR, centered) to 63% (25% WWR, upper), while Barcelona’s values range from 95% (45% WWR, centered) to 48% (25% WWR, upper). Additionally, a south window lintel effect reduces DA levels within 0.50 m of the window, and this effect is more pronounced for dark coatings (30% reduction) compared to bright coatings (20%).
3.2.4. Location (Seville/Barcelona)
The results indicate slightly higher DA values in Seville compared to Barcelona. For example, the mean DA300 values for bright coatings exceed 80% in Seville and 74% in Barcelona. This trend is consistent across various WWRs and orientations, although the differences are generally modest. In both locations, south-facing 15% WWR centered windows display DA500 values of 71% in Seville and 60% in Barcelona, with increases at certain distances from the façade, followed by linear declines. Similarly, for north-facing configurations, Seville’s DA500 values typically start higher and show fewer steep declines compared to those for Barcelona.
3.2.5. Interior Reflectance (Bright/Dark Coatings)
Bright coatings consistently result in higher DA values compared to those for dark coatings. For instance, the DA500 values for bright interiors typically range from 80% to 87% for WWRs between 25% and 45%, maintaining consistency throughout the room’s depth. In contrast, dark finishes lead to greater variability and lower values, particularly in north orientations and smaller WWRs. In scenarios with a 15% WWR and dark coatings, DA values often fall below 50%, especially for north orientations with upper window positions, highlighting the significant impact of interior reflectance on daylight performance.
Overall, the DA300 values exceed 50% in most configurations, except for specific cases with a 15% WWR, dark coatings, and north orientations. DA500 values frequently fall below this threshold for dark coatings with a north orientation and upper windows, as well as for south orientations in upper positions with a 15% WWR. Additionally, some regions in rooms with centered windows, with a 15% WWR and dark coatings facing north, as well as those with bright coatings facing south, also demonstrate DA values below 50%.
3.3. Circadian Stimulus Autonomy (CSA)
The analysis of circadian stimulus autonomy (CSA) results, as shown in Figure 7, Figure 8, Figure 9, Figure 10, Figure 11, Figure 12, Figure 13 and Figure 14, has been categorized again by the influence of orientation (north/south), window-to-wall ratio (WWR, 15% to 45%), location (Seville/Barcelona), and interior reflectance (bright/dark finishes) as follows:
3.3.1. Influence of Window-to-Wall Ratio (WWR, 15% to 45%)
The CSA2 values are higher with larger window dimensions, demonstrating the significant impact of WWR on circadian stimulus performance. For a WWR of 35% or greater and centered configurations, CSA2 values near the façade approach 100%, decreasing linearly to 90% in Seville and 82% in Barcelona. In configurations with smaller window sizes, particularly 15% WWR, CSA2 values are significantly lower; for north orientations, the CSA2 value is often null, and for south orientations, it barely reaches 15%.
CSA1 values are generally lower in all scenarios with a 15% WWR, regardless of location or window position (centered or upper). Specifically, for dark coatings and a north orientation at a 15% WWR, CSA1 values are null. Conversely, with increased WWR (up to 45%), CSA1 values for bright coatings and a south orientation range from 62% (Seville, centered, 15%) to 95% (Barcelona, upper, 45%).
3.3.2. Influence of Window Position (Upper/Centered)
The position of the window (upper versus centered) affects CSA2 values differently, depending on other parameters. For bright coatings and centered configurations, CSA2 values are slightly higher towards the back of the room, while the reverse is true for upper window positions. For upper windows with a 15% WWR and a north orientation, CSA2 values are null, and for south orientations, they barely reach 15%. Conversely, in centered configurations with south-facing bright coatings and WWRs of 25% to 45%, CSA2 values consistently exceed 80%.
3.3.3. Influence of Orientation (North/South)
CSA1 values for cubicles with dark interior finishes generally show significant variability, especially in north orientations, where a noticeable decline is observed within a band approximately 0.75 m from the façade. In contrast, for south orientations, CSA1 values are consistently higher, with narrower dispersion across different configurations. CSA2 values for a 15% WWR are spatially similar across most configurations, especially in north orientations with dark coatings. In these cases, the CSA2 begins at low values, often near zero, and peaks at 0.75 to 1.00 m from the window before gradually declining with a shallow slope towards the back of the room.
The type of orientation also significantly affects CSA2 values. In north orientations, especially for larger window dimensions, the CSA2 exhibits minimal deviation between Seville and Barcelona, with slightly lower values in Barcelona. For south-facing rooms, the presence of a window lintel impacts the area within 0.50 m of the window, causing a distinct decrease in CSA2 levels.
3.3.4. Influence of Location (Seville/Barcelona)
While CSA values show some variance between Seville and Barcelona, the location has a less pronounced impact compared to that of the window size and interior finishes. However, CSA2 values for rooms with bright coatings are consistently elevated above 80% in both Seville and Barcelona for south and north configurations, particularly for centered windows with WWRs between 25% and 45% and upper windows with WWRs between 35% and 45%. Slight differences are noted, with values being marginally higher in Seville than Barcelona.
3.3.5. Influence of Interior Reflectance (Bright/Dark Coatings)
The interior finish plays a critical role in influencing CSA results, particularly CSA1 values. Bright coatings significantly enhance CSA1, with values between 20% and 25% higher compared to those for dark coatings across all orientations and WWRs. For bright coatings, CSA2 values exceed 80% for both south and north configurations, especially in rooms with centered and upper window configurations and WWRs between 25% and 45%. The distribution of CSA2 values for bright interiors is more consistent, while for dark finishes, the variability increases notably, particularly in north-facing orientations.
Dark coatings generally produce lower CSA1 values, with only 20% to 25% of the values obtained for bright coatings. The effect of dark coatings is particularly pronounced in north orientations, where CSA1 values range from 0% (15% WWR) to 63% (Barcelona, centered, 45% WWR). In contrast, for south-facing configurations with dark coatings, CSA1 values are slightly higher but are still significantly lower than for those with bright coatings.
Overall, the CSA results are more influenced by interior reflectance and window size than by location. The orientation further impacts the distribution, with south orientations generally yielding higher CSA1 values and less variability compared to north orientations.
4. Discussion
The comprehensive analysis of daylight autonomy (DA300 and DA500) and circadian stimulus autonomy (CSA1 and CSA2) has underscored the critical impact of various parameters—namely window-to-wall ratio (WWR), orientation, location (Seville/Barcelona), and interior reflectance (bright/dark finishes)—on natural daylight penetration and circadian stimulus in hospital cubicles. The goal is to optimize these configurations to enhance patient recovery through improved visual comfort and circadian alignment. The findings suggest specific recommendations for window positioning, WWR, and interior reflectance to achieve optimal performance for both the DA and CSA metrics.
4.1. Analysis of the Influence of Window-to-Wall Ratio (WWR, 15% to 45%)
The results consistently show that larger window openings (higher WWR) enhance both DA and CSA values, thus facilitating greater daylight access and circadian stimulus. For optimal daylighting performance, WWR values of 25% are recommended, with centered window configurations generally outperforming upper window positions in terms of consistent daylight distribution throughout the room. WWR values higher than 25% have been shown to marginally increase DA and CSA values. However, it is debatable whether these diminishing returns really justify the resulting decline in energy consumption due to the higher thermal transmittance of glass compared to that of the facade or the additional thermal gains from solar radiation.
For bright coatings, the DA300 values are approximately 90% in Seville and 85% in Barcelona for centered configurations with a 25% to 45% WWR. Similarly, the CSA2 values near the façade reach 100%, gradually declining to 90% in Seville and 82% in Barcelona for larger WWRs.
In scenarios with a lower WWR of 15%, both DA and CSA performance diminish significantly. Specifically, for south orientations, the DA500 values average only 15%, while for north orientations, these values reach up to 30% towards the back of the rooms. For CSA, particularly in north-facing configurations with dark coatings, the CSA2 values are often null or minimal, barely reaching 15% in south orientations. Thus, configurations with a 15% WWR are not recommended due to their inadequate performance in providing sufficient daylight and circadian stimulus.
4.2. Analysis of the Influence of Window Position (Upper/Centered)
The position of the window—either centered or upper—significantly influences DA and CSA values, impacting the spatial distribution of daylight within the room. Centered window positions generally offer superior performance for both the DA and CSA metrics, providing a more uniform distribution of light throughout the room. This configuration minimizes areas with low daylight exposure, thus enhancing overall visual comfort and circadian stimulus. For DA500, centered windows with WWRs of 25% to 45% consistently achieve higher values, maintaining levels at over 80% throughout the room’s depth in bright-coated scenarios.
In contrast, upper window positions, while still effective for larger WWRs, tend to exhibit a more pronounced decline in light levels towards the back of the room. This configuration often results in greater variability and less consistent light distribution, which can compromise visual comfort and circadian effectiveness. For instance, DA500 values in upper window positions decrease more steeply, resulting in lower average values at the room’s rear compared to centered configurations.
Similarly, CSA values are affected by the window position, with centered configurations yielding more favorable outcomes, particularly in rooms with bright finishes and larger WWRs. CSA2 values are notably higher in centered positions, with maximum levels occurring closer to the window and gradually declining with a more controlled gradient compared to upper positions.
Therefore, centered window positions are recommended for achieving the best balance of daylight distribution and circadian stimulus, especially in hospital settings where uniform lighting is critical for patient well-being. Upper window configurations can still be selected in specific cases but may require additional design considerations, such as increasing the WWR or optimizing the reflectance, to mitigate their less favorable light distribution characteristics.
4.3. Analysis of the Influence of Orientation (North/South)
Orientation plays a substantial role in daylight and circadian performance. For north-facing rooms, both the DA and CSA values show greater stability across various configurations with bright coatings, except in scenarios with dark finishes and lower WWRs, where values diminish significantly. For instance, DA300 values remain relatively stable across all WWRs, but DA500 values exhibit marked differences between centered and upper window positions, especially for larger WWRs where centered configurations tend to maintain higher average values.
South-facing orientations generally yield higher CSA1 values with narrower dispersion, particularly in rooms with bright coatings and larger WWRs. However, the presence of a window lintel reduces CSA levels near the window by approximately 20% for bright coatings and up to 30% for dark coatings. For optimal performance in south orientations, centered configurations with WWRs of 35% to 45% are recommended to maximize both the DA and CSA values, while upper window positions may be less effective due to the greater variability in daylight distribution.
4.4. Analysis of the Influence of Location (Seville/Barcelona)
Although the DA and CSA values are slightly higher in Seville compared to Barcelona, the impact of location is less pronounced than that of WWR and interior reflectance. For bright coatings, DA300 values exceed 80% in Seville and 74% in Barcelona across various WWRs and orientations. Similarly, CSA2 values for bright coatings remain elevated above 80% in both locations for south and north configurations, particularly with centered and upper windows with WWRs between 25% and 45%.
Given these findings, it is recommended to prioritize larger WWRs and centered window configurations in both Seville and Barcelona, paying additional attention to maximizing daylight access in Seville, where possible. The observed differences in DA and CSA performance between the two locations do not necessitate distinct configurations but highlight the importance of optimizing other factors such as reflectance and window positioning.
4.5. Analysis of the Influence of Interior Reflectance (Bright/Dark Coatings)
Interior reflectance is the most influential parameter affecting DA and CSA outcomes. Bright coatings consistently result in superior DA and CSA values, with DA500 values ranging from 80% to 87% for WWRs between 25% and 45% and CSA1 values showing increases of 20% to 25% compared to those of dark coatings. In contrast, dark finishes introduce significant variability and lower values, particularly in north orientations and configurations with smaller WWRs.
To achieve optimal lighting and circadian conditions, bright interior finishes are highly recommended across all orientations and window configurations. Dark coatings should be avoided, particularly in north-facing rooms and in scenarios with lower WWRs, as they result in substantially lower DA and CSA values. When dark finishes are unavoidable, increasing the WWR and opting for centered window configurations can help mitigate some of the negative effects, but their performance will still be inferior to that of bright finishes.
5. Conclusions
Hospital architecture is driven by the need to balance energy efficiency, operational effectiveness, and the promotion of patient health and well-being. In intensive care units (ICUs), particularly in Mediterranean climates, the integration of natural light through thoughtful window design is critical. ICUs often face the challenge of suboptimal illuminance levels—too low during the day and too high at night—potentially disrupting patient recovery. This study quantifies the influence of window dimension parameters (Window-to-Wall Ratio and position) and the reflectance of inner surfaces on visual comfort, performance, electric lighting energy consumption, and human well-being, employing dynamic lighting metrics such as daylight autonomy (DA) and circadian stimulus autonomy (CSA).
The findings of this study provide actionable insights for the design of hospital cubicles to optimize daylight access and circadian stimulus. The analysis suggests that a WWR of 25% is optimal, achieving sufficient DA and CSA values. WWRs of 35% and above show an increase in DA and CSA that is not representative when compared to the possible rise in thermal treatment energy consumption. Centered window configurations are preferred over upper positions, as they enhance uniform daylight distribution and circadian stimulus. However, upper window positions should be used cautiously and supplemented with design strategies to mitigate their limitations, such as non-uniform daylight distribution.
While the study indicates that Seville generally offers marginally better DA and CSA performance than Barcelona, the recommended configurations are effective across both locations. This underscores the importance of focusing on window size, positioning, and interior reflectance over geographical location. South-facing windows consistently provide superior DA and CSA values, particularly when combined with bright coatings and larger WWRs. For north-facing configurations, bright interior finishes and centered window placements are recommended to maintain optimal performance.
The reflectance of interior surfaces plays a crucial role in maximizing DA and CSA outcomes. Bright interior coatings are essential, while dark finishes should be avoided, especially in north-facing rooms or configurations with lower WWRs, due to their negative impact on light distribution and circadian effectiveness.
These guidelines aim to inform architectural design decisions in hospital ICUs, particularly regarding patient cubicles, to enhance natural lighting and circadian alignment. By prioritizing daylight access and optimizing window configurations, hospitals can create environments that support patient recovery, ultimately improving health outcomes and overall well-being.
Author Contributions
Conceptualization, M.Á.C., I.A. and P.B.; methodology, M.Á.C., I.A. and P.B.; software, M.Á.C., G.G.-M., I.A. and P.B.; validation, M.Á.C., G.G.-M., I.A. and P.B.; formal analysis, M.Á.C., G.G.-M., I.A. and P.B.; investigation, M.Á.C., I.A. and P.B.; resources, M.Á.C., I.A. and P.B.; data curation, M.Á.C., G.G.-M., I.A. and P.B.; writing—original draft preparation, M.Á.C., I.A. and P.B.; writing—review and editing, M.Á.C., G.G.-M., I.A. and P.B.; visualization, M.Á.C., I.A. and P.B.; supervision, M.Á.C., I.A. and P.B.; project administration, M.Á.C., I.A. and P.B.; funding acquisition, M.Á.C., I.A. and P.B. All authors have read and agreed to the published version of the manuscript.
Funding
The outcomes of this study were financially supported through Grant PID2020-117563RB-I00), funded by MICIU/AEI/10.13039/501100011033 and by ERDF/EU, and Grant PID2023-151631OA-I00, funded by MICIU/AEI/10.13039/501100011033 and by ERDF/EU.
Institutional Review Board Statement
Not applicable.
Informed Consent Statement
Not applicable.
Data Availability Statement
All the data used in this work can be found in this document, as well as in the references [41,56].
Acknowledgments
The authors express their gratitude for all assistance received, including support from the research project titled “CARELight_Lite: Biodynamic Lighting for Circadian Rhythm Regulation of Healthcare Personnel in Pediatric Intensive Care Units” (Ref PI-0136-2019). The authors also extend their sincere appreciation to Blas-Lezo for providing valuable moral support.
Conflicts of Interest
The authors declare no conflict of interest. The funders had no role in the design of the study; in the collection, analyses, or interpretation of data; in the writing of the manuscript; or in the decision to publish the results.
References
- Acosta, I.; Leslie, R.P.; Figueiro, M.G. Analysis of Circadian Stimulus Allowed by Daylighting in Hospital Rooms. Light. Res. Technol. 2017, 49, 49–61. [Google Scholar] [CrossRef]
- Ghaeili Ardabili, N.; Wang, J.; Wang, N. A Systematic Literature Review: Building Window’s Influence on Indoor Circadian Health. Renew. Sustain. Energy Rev. 2023, 188, 113796. [Google Scholar] [CrossRef] [PubMed]
- Beltrami, F.G.; Nguyen, X.-L.; Pichereau, C.; Maury, E.; Fleury, B.; Fagondes, S. Sleep in the Intensive Care Unit. J. Bras. Pneumol. 2015, 41, 539–546. [Google Scholar] [CrossRef] [PubMed]
- Pulak, L.M.; Jensen, L. Sleep in the Intensive Care Unit: A Review. J. Intensive Care Med. 2016, 31, 14–23. [Google Scholar] [CrossRef]
- Kamdar, B.B.; Needham, D.M.; Collop, N.A. Sleep Deprivation in Critical Illness: Its Role in Physical and Psychological Recovery. J. Intensive Care Med. 2012, 27, 97–111. [Google Scholar] [CrossRef]
- Chang, V.A.; Owens, R.L.; LaBuzetta, J.N. Impact of Sleep Deprivation in the Neurological Intensive Care Unit: A Narrative Review. Neurocrit. Care 2020, 32, 596–608. [Google Scholar] [CrossRef]
- Medic, G.; Wille, M.; Hemels, M. Short- and Long-Term Health Consequences of Sleep Disruption. Nat. Sci. Sleep 2017, 9, 151–161. [Google Scholar] [CrossRef]
- Chellappa, S.L.; Vujovic, N.; Williams, J.S.; Scheer, F.A.J.L. Impact of Circadian Disruption on Cardiovascular Function and Disease. Trends Endocrinol. Metab. 2019, 30, 767–779. [Google Scholar] [CrossRef]
- Figueiro, M.G.; Pedler, D. Cardiovascular Disease and Lifestyle Choices: Spotlight on Circadian Rhythms and Sleep. Prog. Cardiovasc. Dis. 2023, 77, 70–77. [Google Scholar] [CrossRef]
- Bullough, J.D.; Rea, M.S.; Figueiro, M.G. Of Mice and Women: Light as a Circadian Stimulus in Breast Cancer Research. Cancer Causes Control 2006, 17, 375–383. [Google Scholar] [CrossRef]
- Pauley, S.M. Lighting for the Human Circadian Clock: Recent Research Indicates That Lighting Has Become a Public Health Issue. Med. Hypotheses 2004, 63, 588–596. [Google Scholar] [CrossRef] [PubMed]
- Showler, L.; Ali Abdelhamid, Y.; Goldin, J.; Deane, A.M. Sleep during and Following Critical Illness: A Narrative Review. World J. Crit. Care Med. 2023, 12, 92–115. [Google Scholar] [CrossRef] [PubMed]
- Korompeli, A.; Muurlink, O.; Kavrochorianou, N.; Katsoulas, T.; Fildissis, G.; Baltopoulos, G. Circadian Disruption of ICU Patients: A Review of Pathways, Expression, and Interventions. J. Crit. Care 2017, 38, 269–277. [Google Scholar] [CrossRef] [PubMed]
- Nesbitt, L.; Goode, D. Nurses Perceptions of Sleep in the Intensive Care Unit Environment: A Literature Review. Intensive Crit. Care Nurs. 2014, 30, 231–235. [Google Scholar] [CrossRef] [PubMed]
- Bani Younis, M.; Hayajneh, F.; Alshraideh, J.A. Effect of Noise and Light Levels on Sleep of Intensive Care Unit Patients. Nurs. Crit. Care 2021, 26, 73–78. [Google Scholar] [CrossRef]
- Miranda-Ackerman, R.C.; Lira-Trujillo, M.; Gollaz-Cervantez, A.C.; Cortés-Flores, A.O.; Zuloaga-Fernández del Valle, C.J.; García-González, L.A.; Morgan-Villela, G.; Barbosa-Camacho, F.J.; Pintor-Belmontes, K.J.; Guzmán-Ramírez, B.G.; et al. Associations between Stressors and Difficulty Sleeping in Critically Ill Patients Admitted to the Intensive Care Unit: A Cohort Study. BMC Health Serv. Res. 2020, 20, 631. [Google Scholar] [CrossRef]
- Simons, K.S.; Verweij, E.; Lemmens, P.M.C.; Jelfs, S.; Park, M.; Spronk, P.E.; Sonneveld, J.P.C.; Feijen, H.M.; Van Der Steen, M.S.; Kohlrausch, A.G.; et al. Noise in the Intensive Care Unit and Its Influence on Sleep Quality: A Multicenter Observational Study in Dutch Intensive Care Units. Crit. Care 2018, 22, 250. [Google Scholar] [CrossRef]
- Davies, R. ‘Notes on Nursing: What It Is and What It Is Not’. (1860): By Florence Nightingale. Nurse Educ. Today 2012, 32, 624–626. [Google Scholar] [CrossRef]
- Figueiro, M.G.; Steverson, B.; Heerwagen, J.; Kampschroer, K.; Hunter, C.M.; Gonzales, K.; Plitnick, B.; Rea, M.S. The Impact of Daytime Light Exposures on Sleep and Mood in Office Workers. Sleep Health 2017, 3, 204–215. [Google Scholar] [CrossRef]
- Rea, M.S.; Figueiro, M.G.; Bullough, J.D.; Bierman, A. A Model of Phototransduction by the Human Circadian System. Brain Res. Rev. 2005, 50, 213–228. [Google Scholar] [CrossRef]
- Brainard, G.C.; Hanifin, J.P.; Greeson, J.M.; Byrne, B.; Glickman, G.; Gerner, E.; Rollag, M.D. Action Spectrum for Melatonin Regulation in Humans: Evidence for a Novel Circadian Photoreceptor. J. Neurosci. 2001, 21, 6405–6412. [Google Scholar] [CrossRef] [PubMed]
- Thapan, K.; Arendt, J.; Skene, D.J. An Action Spectrum for Melatonin Suppression: Evidence for a Novel Non-Rod, Non-Cone Photoreceptor System in Humans. J. Physiol. 2001, 535, 261–267. [Google Scholar] [CrossRef] [PubMed]
- Leslie, R.P.; Radetsky, L.C.; Smith, A.M. Conceptual Design Metrics for Daylighting. Light. Res. Technol. 2012, 44, 277–290. [Google Scholar] [CrossRef]
- Ministerio de Sanidad del Gobierno de España. Informe Anual Del Sistema Nacional de Salud 2020–2021. Resumen Ejecutivo; Ministerio de Sanidad del Gobierno de España: Madrid, Spain, 2022. [Google Scholar]
- Wasden, K.; Intihar, T.; Knauert, M. Light Spectra: An Important Consideration for Circadian Alignment in the Medical ICU. Chest 2021, 160, A2425. [Google Scholar] [CrossRef]
- Pamuk, K.; Turan, N. The Effect of Light on Sleep Quality and Physiological Parameters in Patients in the Intensive Care Unit. Appl. Nurs. Res. 2022, 66, 151607. [Google Scholar] [CrossRef] [PubMed]
- Boots, R.; Mead, G.; Rawashdeh, O.; Bellapart, J.; Townsend, S.; Paratz, J.; Garner, N.; Clement, P.; Oddy, D. Circadian Hygiene in the ICU Environment (CHIE) Study. Crit. Care Resusc. 2020, 22, 361–369. [Google Scholar] [CrossRef]
- Intihar, T.; Wasden, K.; Knauert, M. Light Patterns of the Medical ICU: Are We Disrupting Circadian Rhythms? Chest 2021, 160, A2424. [Google Scholar] [CrossRef]
- Breeding, J.; Buscher, H.; Nair, P.; Baker, N.; Frost, C.; Mathews, N.; McGauley, J.; Welch, S.; Whittam, S.; Burrows, F. Sound and Light in ICU during Different Environmental Conditions. Aust. Crit. Care 2018, 31, 135. [Google Scholar] [CrossRef]
- Engwall, M.; Fridh, I.; Johansson, L.; Bergbom, I.; Lindahl, B. Lighting, Sleep and Circadian Rhythm: An Intervention Study in the Intensive Care Unit. Intensive Crit. Care Nurs. 2015, 31, 325–335. [Google Scholar] [CrossRef]
- Giménez, M.C.; Geerdinck, L.M.; Versteylen, M.; Leffers, P.; Meekes, G.J.B.M.; Herremans, H.; de Ruyter, B.; Bikker, J.W.; Kuijpers, P.M.J.C.; Schlangen, L.J.M. Patient Room Lighting Influences on Sleep, Appraisal and Mood in Hospitalized People. J. Sleep Res. 2017, 26, 236–246. [Google Scholar] [CrossRef]
- Czempik, P.F.; Jarosińska, A.; Machlowska, K.; Pluta, M. Impact of Light Intensity on Sleep of Patients in the Intensive Care Unit: A Prospective Observational Study. Indian J. Crit. Care Med. 2020, 24, 33–37. [Google Scholar] [CrossRef] [PubMed]
- Acosta, I.; Campano, M.A.; Leslie, R.; Radetski, L. Daylighting Design for Healthy Environments: Analysis of Educational Spaces for Optimal Circadian Stimulus. Sol. Energy 2019, 193, 584–596. [Google Scholar] [CrossRef]
- Kompier, M.E.; Smolders, K.C.H.J.; de Kort, Y.A.W. A Systematic Literature Review on the Rationale for and Effects of Dynamic Light Scenarios. Build. Environ. 2020, 186, 107326. [Google Scholar] [CrossRef]
- Lowden, A.; Åkerstedt, T. Assessment of a New Dynamic Light Regimen in a Nuclear Power Control Room without Windows on Quickly Rotating Shiftworkerseffects on Health, Wakefulness, and Circadian Alignment: A Pilot Study. Chronobiol. Int. 2012, 29, 641–649. [Google Scholar] [CrossRef] [PubMed]
- Wang, T.; Li, J.; Wang, Y.; Dai, S.; Shao, R.; Hao, L. Active Interventions of Dynamic Lighting on Human Circadian Rhythm and Sleep Quality in Confined Spaces. Build. Environ. 2022, 226, 109766. [Google Scholar] [CrossRef]
- van Lieshout-van Dal, E.; Snaphaan, L.; Bongers, I. Biodynamic Lighting Effects on the Sleep Pattern of People with Dementia. Build. Environ. 2019, 150, 245–253. [Google Scholar] [CrossRef]
- Bagci, S.; Wieduwilt, A.; Alsat, E.A.; Blickwedel, J.; Strizek, B.; Di Battista, C.; Lachner, A.; Plischke, H.; Melaku, T.; Müller, A. Biodynamic Lighting Conditions Preserve Nocturnal Melatonin Production in Pregnant Women during Hospitalization: A Randomized Prospective Pilot Study. Front. Endocrinol. 2022, 13, 1043366. [Google Scholar] [CrossRef]
- Jensen, H.I.; Markvart, J.; Holst, R.; Thomsen, T.D.; Larsen, J.W.; Eg, D.M.; Nielsen, L.S. Shift Work and Quality of Sleep: Effect of Working in Designed Dynamic Light. Int. Arch. Occup. Environ. Health 2016, 89, 49–61. [Google Scholar] [CrossRef]
- Ru, T.; de Kort, Y.A.W.; Smolders, K.C.H.J.; Chen, Q.; Zhou, G. Non-Image Forming Effects of Illuminance and Correlated Color Temperature of Office Light on Alertness, Mood, and Performance across Cognitive Domains. Build. Environ. 2019, 149, 253–263. [Google Scholar] [CrossRef]
- Bellia, L.; Acosta, I.; Campano, M.Á.; Fragliasso, F. Impact of Daylight Saving Time on Lighting Energy Consumption and on the Biological Clock for Occupants in Office Buildings. Sol. Energy 2020, 211, 1347–1364. [Google Scholar] [CrossRef]
- Campano, M.Á.; Acosta, I.; Domínguez, S.; López-Lovillo, R. Dynamic Analysis of Office Lighting Smart Controls Management Based on User Requirements. Autom. Constr. 2022, 133, 104021. [Google Scholar] [CrossRef]
- Leslie, R.P.; Raghavan, R.; Howlett, O.; Eaton, C. The Potential of Simplified Concepts for Daylight Harvesting. Light. Res. Technol. 2005, 37, 21–40. [Google Scholar] [CrossRef]
- Ricciardi, P.; Buratti, C. Environmental Quality of University Classrooms: Subjective and Objective Evaluation of the Thermal, Acoustic, and Lighting Comfort Conditions. Build. Environ. 2018, 127, 23–36. [Google Scholar] [CrossRef]
- CIE 110-1994: Spatial Distribution of Daylight—Luminance Distributions of Various Reference Skies; Commission Internationale de l’Éclairage: Vienna, Austria, 1994; ISBN 978-3-00734-52-7.
- International Organization for Standardization. ISO 15469:2004. Spatial Distribution of Daylight—CIE Standard General Sky; Commission Internationale de l’Éclairage, Ed.; International Standarisation Office: Geneva, Switzerland, 2004. [Google Scholar]
- Acosta, I.; Campano, M.A.; Domínguez, S.; Fernández-Agüera, J. Minimum Daylight Autonomy: A New Concept to Link Daylight Dynamic Metrics with Daylight Factors. LEUKOS—J. Illum. Eng. Soc. N. Am. 2019, 15, 251–269. [Google Scholar] [CrossRef]
- Reinhart, C.F.; Mardaljevic, J.; Rogers, Z. Dynamic Daylight Performance Metrics for Sustainable Building Design. LEUKOS—J. Illum. Eng. Soc. N. Am. 2006, 3, 7–31. [Google Scholar] [CrossRef]
- Hraska, J. Chronobiological Aspects of Green Buildings Daylighting. Renew. Energy 2015, 73, 109–114. [Google Scholar] [CrossRef]
- Zeng, Y.; Sun, H.; Lin, B.; Zhang, Q. Non-Visual Effects of Office Light Environment: Field Evaluation, Model Comparison, and Spectral Analysis. Build. Environ. 2021, 197, 107859. [Google Scholar] [CrossRef]
- Woo, M.; MacNaughton, P.; Lee, J.; Tinianov, B.; Satish, U.; Boubekri, M. Access to Daylight and Views Improves Physical and Emotional Wellbeing of Office Workers: A Crossover Study. Front. Sustain. Cities 2021, 3, 690055. [Google Scholar] [CrossRef]
- Boubekri, M.; Lee, J.; MacNaughton, P.; Woo, M.; Schuyler, L.; Tinianov, B.; Satish, U. The Impact of Optimized Daylight and Views on the Sleep Duration and Cognitive Performance of Office Workers. Int. J. Environ. Res. Public. Health 2020, 17, 3219. [Google Scholar] [CrossRef]
- Ruiz, A.; Campano, M.Á.; Acosta, I.; Luque, Ó. Partial Daylight Autonomy (DAp): A New Lighting Dynamic Metric to Optimize the Design of Windows for Seasonal Use Spaces. Appl. Sci. 2021, 11, 8228. [Google Scholar] [CrossRef]
- Ezpeleta, S.; Orduna-Hospital, E.; Solana, T.; Aporta, J.; Pinilla, I.; Sánchez-Cano, A. Analysis of Photopic and Melanopic Lighting in Teaching Environments. Buildings 2021, 11, 439. [Google Scholar] [CrossRef]
- Bellia, L.; Pedace, A.; Barbato, G. Lighting in Educational Environments: An Example of a Complete Analysis of the Effects of Daylight and Electric Light on Occupants. Build. Environ. 2013, 68, 50–65. [Google Scholar] [CrossRef]
- Acosta, I.; Campano, M.Á.; Bellia, L.; Fragliasso, F.; Diglio, F.; Bustamante, P. Impact of Daylighting on Visual Comfort and on the Biological Clock for Teleworkers in Residential Buildings. Buildings 2023, 13, 2562. [Google Scholar] [CrossRef]
- Nagare, R.; Woo, M.; MacNaughton, P.; Plitnick, B.; Tinianov, B.; Figueiro, M. Access to Daylight at Home Improves Circadian Alignment, Sleep, and Mental Health in Healthy Adults: A Crossover Study. Int. J. Environ. Res. Public Health 2021, 18, 9980. [Google Scholar] [CrossRef] [PubMed]
- Abidi, S.; Rajagopalan, P. Investigating Daylight in the Apartment Buildings in Melbourne, Australia. Infrastructures 2020, 5, 81. [Google Scholar] [CrossRef]
- Bellia, L.; Pedace, A.; Barbato, G. Winter and Summer Analysis of Daylight Characteristics in Offices. Build. Environ. 2014, 81, 150–161. [Google Scholar] [CrossRef]
- Amleh, D.; Halawani, A.; Haj Hussein, M. Simulation-Based Study for Healing Environment in Intensive Care Units: Enhancing Daylight and Access to View, Optimizing an ICU Room in Temperate Climate, the Case Study of Palestine. Ain Shams Eng. J. 2023, 14, 101868. [Google Scholar] [CrossRef]
- Kolberg, E.; Pallesen, S.; Hjetland, G.; Nordhus, I.; Thun, E.; Flo-Groeneboom, E. Insufficient Melanopic Equivalent Daylight Illuminance in Nursing Home Dementia Units across Seasons and Gaze Directions. Light. Res. Technol. 2022, 54, 163–177. [Google Scholar] [CrossRef]
- Jafarifiroozabadi, R.; Joseph, A.; Bridges, W.; Franks, A. The Impact of Daylight and Window Views on Length of Stay among Patients with Heart Disease: A Retrospective Study in a Cardiac Intensive Care Unit. J. Intensive Med. 2023, 3, 155–164. [Google Scholar] [CrossRef]
- EN 12464-1:2021; Light and Lighting. Lighting of Work Places. Indoor Work Places. CEN—European Committee for Standardization: Brussels, Belgium, 2021.
- LBNL. Lawrence Berkeley National Laboratory Technical Report (2012) 1278—EnergyPlus Engineering Reference. The Reference to EnergyPlus Calculations; LBNL: Berkeley, CA, USA, 2012. [Google Scholar]
- Comité Español de IIuminación; Instituto para la Diversificación y Ahorro de la Energía; Ministerio de Ciencia y Tecnología, G. de España. Guía Técnica de Eficiencia Energética En Iluminación. Hospitales y Centros de Atención Primaria; Instituto para la Diversificación y Ahorro de la Energía: Madrid, Spain, 2001. [Google Scholar]
- Crone, S. Radiance Users Manual Vol. 2; Lawrence Berkeley Laboratory: San Francisco, CA, USA, 1992. [Google Scholar]
- Perez, R.; Seals, R.; Michalsky, J. All-Weather Model for Sky Luminance Distribution-Preliminary Configuration and Validation. Sol. Energy 1993, 50, 235–245. [Google Scholar] [CrossRef]
- Aguilar-Carrasco, M.T.; Díaz-Borrego, J.; Acosta, I.; Campano, M.Á.; Domínguez-Amarillo, S. Validation of Lighting Parametric Workflow Tools of Ladybug and Solemma Using CIE Test Cases. J. Build. Eng. 2023, 64, 105608. [Google Scholar] [CrossRef]
- Reinhart, C.F.; Breton, P.-F. Experimental Validation of Autodesk® 3ds Max® Design 2009 and Daysim 3.0. LEUKOS—J. Illum. Eng. Soc. N. Am. 2009, 6, 7–35. [Google Scholar] [CrossRef]
- Darula, S.; Kittler, R. CIE General Sky Standard Defining Luminance Distributions. In Proceedings of the International Building Performance Simulation Association (IBPSA), Montreal, QC, Canada, 11–13 September 2002; pp. 11–13. [Google Scholar]
- Mardaljevic, J. Daylight Simulation: Validation, Sky Models and Daylight Coefficients. Ph.D. Thesis, Loughborough University, Loughborough, UK, 1999. [Google Scholar]
- Mardaljevic, J. Validation of a Lighting Simulation Program under Real Sky Conditions. Light. Res. Technol. 1995, 27, 181–188. [Google Scholar] [CrossRef]
- Campano, M.Á.A.; Acosta, I.; León, A.L.L.; Calama, C. Validation Study for Daylight Dynamic Metrics by Using Test Cells in Mediterranean Area. Int. J. Eng. Technol. 2018, 10, 487–491. [Google Scholar] [CrossRef]
Disclaimer/Publisher’s Note: The statements, opinions and data contained in all publications are solely those of the individual author(s) and contributor(s) and not of MDPI and/or the editor(s). MDPI and/or the editor(s) disclaim responsibility for any injury to people or property resulting from any ideas, methods, instructions or products referred to in the content. |
© 2024 by the authors. Licensee MDPI, Basel, Switzerland. This article is an open access article distributed under the terms and conditions of the Creative Commons Attribution (CC BY) license (https://creativecommons.org/licenses/by/4.0/).

