Article

Experimental Study of Bedform Development Characteristics and Their Effects on Sediment Transport

1
Yellow River Institute of Hydraulic Research, Yellow River Conservancy Commission, Zhengzhou 450003, China
2
Key Laboratory of Lower Yellow River Channel and Estuary Regulation, Ministry of Water Resources, Zhengzhou 450003, China
3
State Key Laboratory of Simulation and Regulation of Water Cycle in River Basin, Beijing 100048, China
4
China Institute of Water Resources and Hydropower Research, Beijing 100048, China
*
Author to whom correspondence should be addressed.
Appl. Sci. 2024, 14(21), 9823; https://doi.org/10.3390/app14219823
Submission received: 18 September 2024 / Revised: 22 October 2024 / Accepted: 23 October 2024 / Published: 28 October 2024

Abstract

:
Bedforms are complex and varied features on riverbeds created by the interaction between flow and sediment particles. Bedform evolution is crucial for understanding sediment transport, bed resistance, and the ecological environment of rivers. In this study, a series of movable-bed dune experiments were conducted utilizing advanced 3D topographic laser scanning technology to precisely measure the 2D and 3D dune bedforms under various conditions. This enabled the detailed analysis of the bedform parameters, including the dune length and height, the crest height, and the trough depth. Furthermore, this study examined the relationship between bed resistance and dune morphology and investigated how the intensity of bedload transport affects bed resistance. The findings indicate that bedload mass transport on the riverbed significantly contributes to increased bed resistance. Given the limitations of the traditional bedload transport rate formulas for dune bedforms, this research introduces a new formula derived from the experimental data. The accuracy of this formula was confirmed using the nonlinear least squares method. Our study enhances the accuracy of sediment transport predictions and provides scientific support for river management and engineering practices.

1. Introduction

Bedforms such as ripples and dunes [1] are prevalent sedimentary structures in alluvial river channels. Their development and evolution significantly influence the flood risk, river transport, and infrastructure stability [2,3,4]. The kinetic energy of water flow primarily shapes these bedforms, such as dunes [5,6], and both bed resistance and sediment transport undergo changes during their formation and development [1,7,8]. Additionally, bed resistance plays a crucial role in river energy dissipation [9,10], and it is closely related to sediment transport. Consequently, bedforms, sediment transport, and bed resistance interact in a complex network [11,12], which complicates the accurate prediction of sediment transport and bed resistance. Thus, research into the characteristics of bedform evolution and their impact on sediment transport is essential to provide technical support for the stable operation of river engineering projects and flood control and siltation reduction practices.
Extensive research on river dynamics has focused on the features of bedforms, sediment transport patterns, and the characteristics of bed resistance distribution, yielding significant results. The data for bedforms characterization are primarily obtained through indoor flume experiments and field observations. These data are used to elucidate the mechanisms of interaction between the physical characterization parameters of bedforms (e.g., dune length and height) and hydrodynamic factors (e.g., discharge and velocity). This approach has led to the establishment of empirical relationships between these parameters and the development of bedform size recognition tools [13,14,15,16,17,18]. Certain researchers have quantified the distribution patterns of bedforms using statistical analysis of field-measured physical parameters [5,19]. Bed resistance significantly influences sediment transport. It is worth mentioning that the research results on bed resistance changes caused by changes in bed morphology can be roughly divided into the following categories. The first approach involves the determination of the effective shape roughness height using empirical methods [20]. The second approach is based on numerical simulations that yield empirical formulas for hydraulic roughness of different bedforms with varying lee side angles [21]. Most recently, research has integrated the actual flow patterns and dune geometry influences by applying the principles of momentum and energy balance equations and introduced an empirical bed form drag coefficient to study the contribution of dunes to flow resistance [22].
Additionally, numerical simulations of river bedforms have been conducted based on experimental data [23,24,25]. Regarding sediment transport patterns, most existing studies have derived empirical sediment transport formulas from indoor experimental data [26,27,28,29,30], typically using uniform sand particles. In recent years, numerical simulation methods have been employed to develop sediment transport prediction models [31,32,33,34,35]. Bed resistance comprises sediment resistance caused by sediment particles and shape resistance caused by dunes. In the presence of dunes on the bed, shape resistance often dominates bed resistance [36,37,38,39]. The development and evolution of dunes directly affect shape resistance, thereby determining the sediment transport capacity. These findings indicate that research has extensively explored the bedform features, the sediment transport patterns, and the bed resistance distribution characteristics, establishing empirical relationships and numerical models related to hydrodynamics and dune bedforms [21,40,41,42,43,44]. However, owing to the complexity of changes in bedforms, sediment transport patterns, bed resistance distribution, and their interactions, the practical application of these empirical relationships and models often yields unsatisfactory results [3,45,46].
The previous studies have made significant theoretical and numerical advancements in understanding bedforms and their effects. However, there remains a lack of the quantitative analysis of bedforms and the thorough examinations of empirical data. Moreover, the existing empirical formulas require enhancements in terms of applicability and accuracy, especially under complex bed conditions such as dune bedforms. Prior research has not adequately distinguished between the features of 2D and 3D dune bedforms, overlooking their differences in development and sediment transport capabilities, which results in the misinterpretation of dune characteristics. The traditional formulas for sediment transport rates have been designed for uniform sediment and are less effective when applied to dune bedforms, leading to inaccuracies in predicting the sediment transport processes. Furthermore, the resistance characteristics of dune bedforms and the impact of bedload transport have not been comprehensively explored, resulting in an incomplete understanding of the development of dune bedforms and sediment transport mechanisms.
To address these limitations, this study established a flow–sediment movement and 3D bedform measurement system within a large-scale flume and conducted a series of movable-bed dune experiments. The objectives of this study were to (1) quantitatively analyze the features of 2D and 3D dune bedforms, (2) investigate the impact of dune bedforms on the bedload transport rate, and (3) examine the relationships between bed resistance, dune morphology, and sediment transport. The goal was to elucidate the processes by which dune bedforms influence sediment transport and bed resistance through experimental observations and theoretical analysis, thereby enhancing the accuracy of sediment transport predictions and providing scientific support for river management and engineering practices.

2. Experimental Setup and Methods

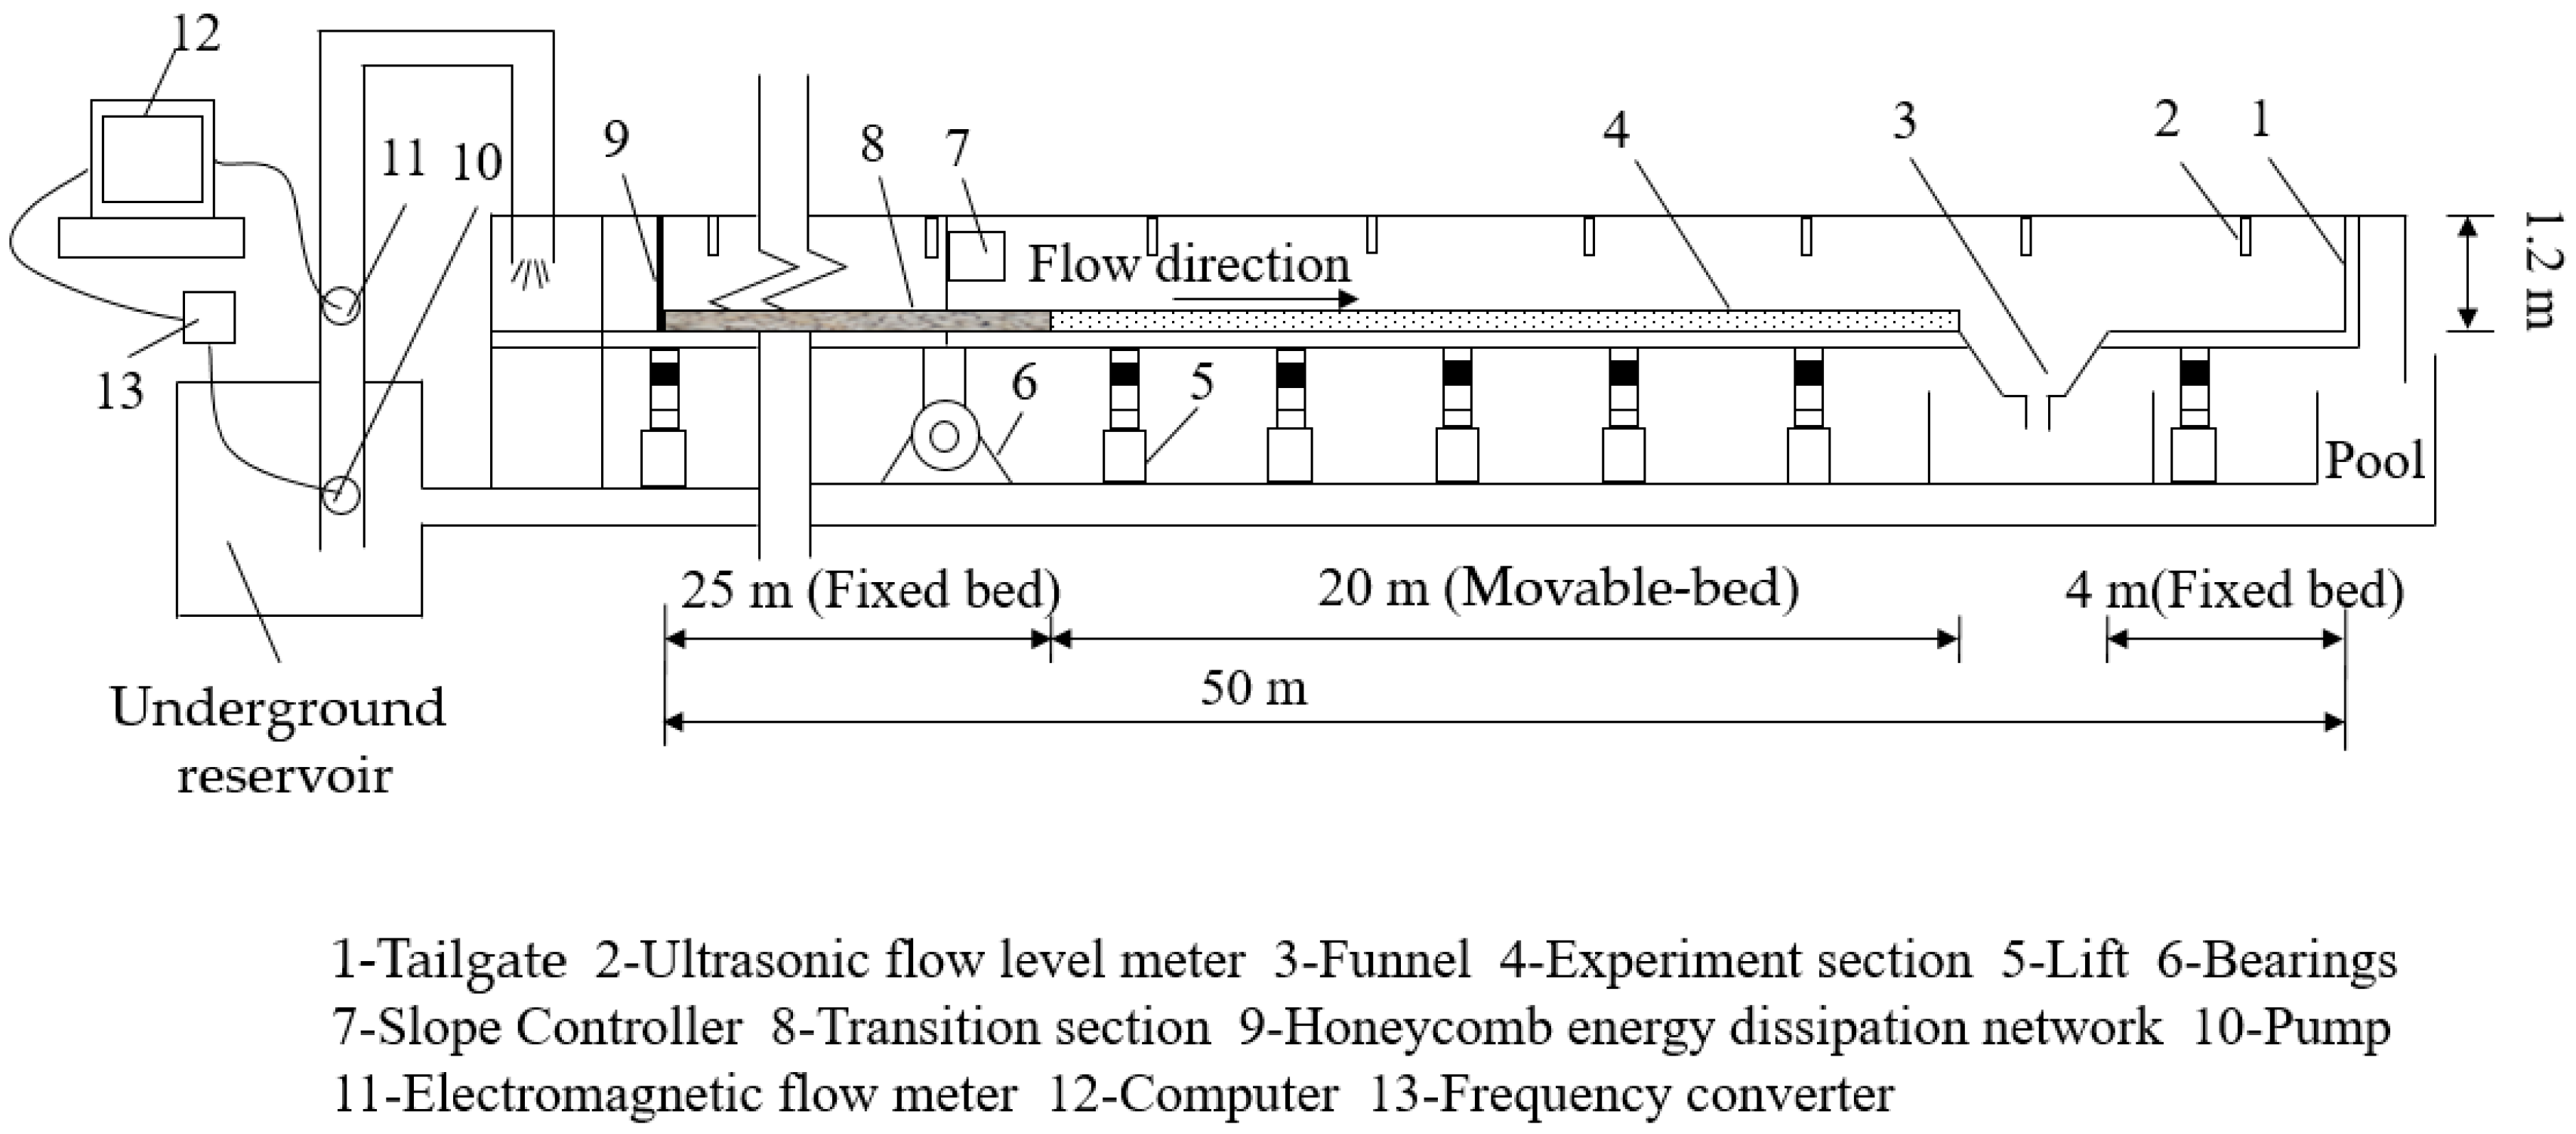
2.1. Experimental Setup

The experiments were conducted at the Daxing experiment base of the China Institute of Water Resources and Hydropower Research. The experiment flume, as depicted in Figure 1, measures 50 m in length, 1 m in width, and 1.2 m in height, with an adjustable slope range of 0–0.01 and a 200 m3 underground reservoir. The flume is equipped with a sophisticated measurement and control system that adjusts the flow rate through a computer-controlled frequency converter with feedback closed-loop control and measures the flow rate using an electromagnetic flow meter before flow enters the flume. The flow level and depth along the flume are monitored by eight ultrasonic-level meters mounted above the flume and twelve steel straightedges affixed to the flume sides. The transparent glass sides of the flume enable clear observation of sediment particle movement on the bed surface and the dynamics of dune movement. The slope gradient refers to the glass flume inclination angle. The slope gradient was adjusted using lifts, which automatically set the flume to the desired inclination before the experiment.
Approximately 25 m upstream of the flume, a transition section consisting of a 10 cm thick layer of 20 mm pebbles was installed, and the experiment section was situated about 20 m downstream of the flume. A funnel (length: 1 m; width: 1 m; depth: 0.8 m) was positioned between the end of the experiment section and the tailgate to collect sediment. The sediment captured in the funnel during the experiment was classified as bedload particles. The experiment sediment comprised uniformly sized crushed quartz sand particles with a median grain size of 0.83 mm, as depicted in the grading curve displayed in Figure 2.

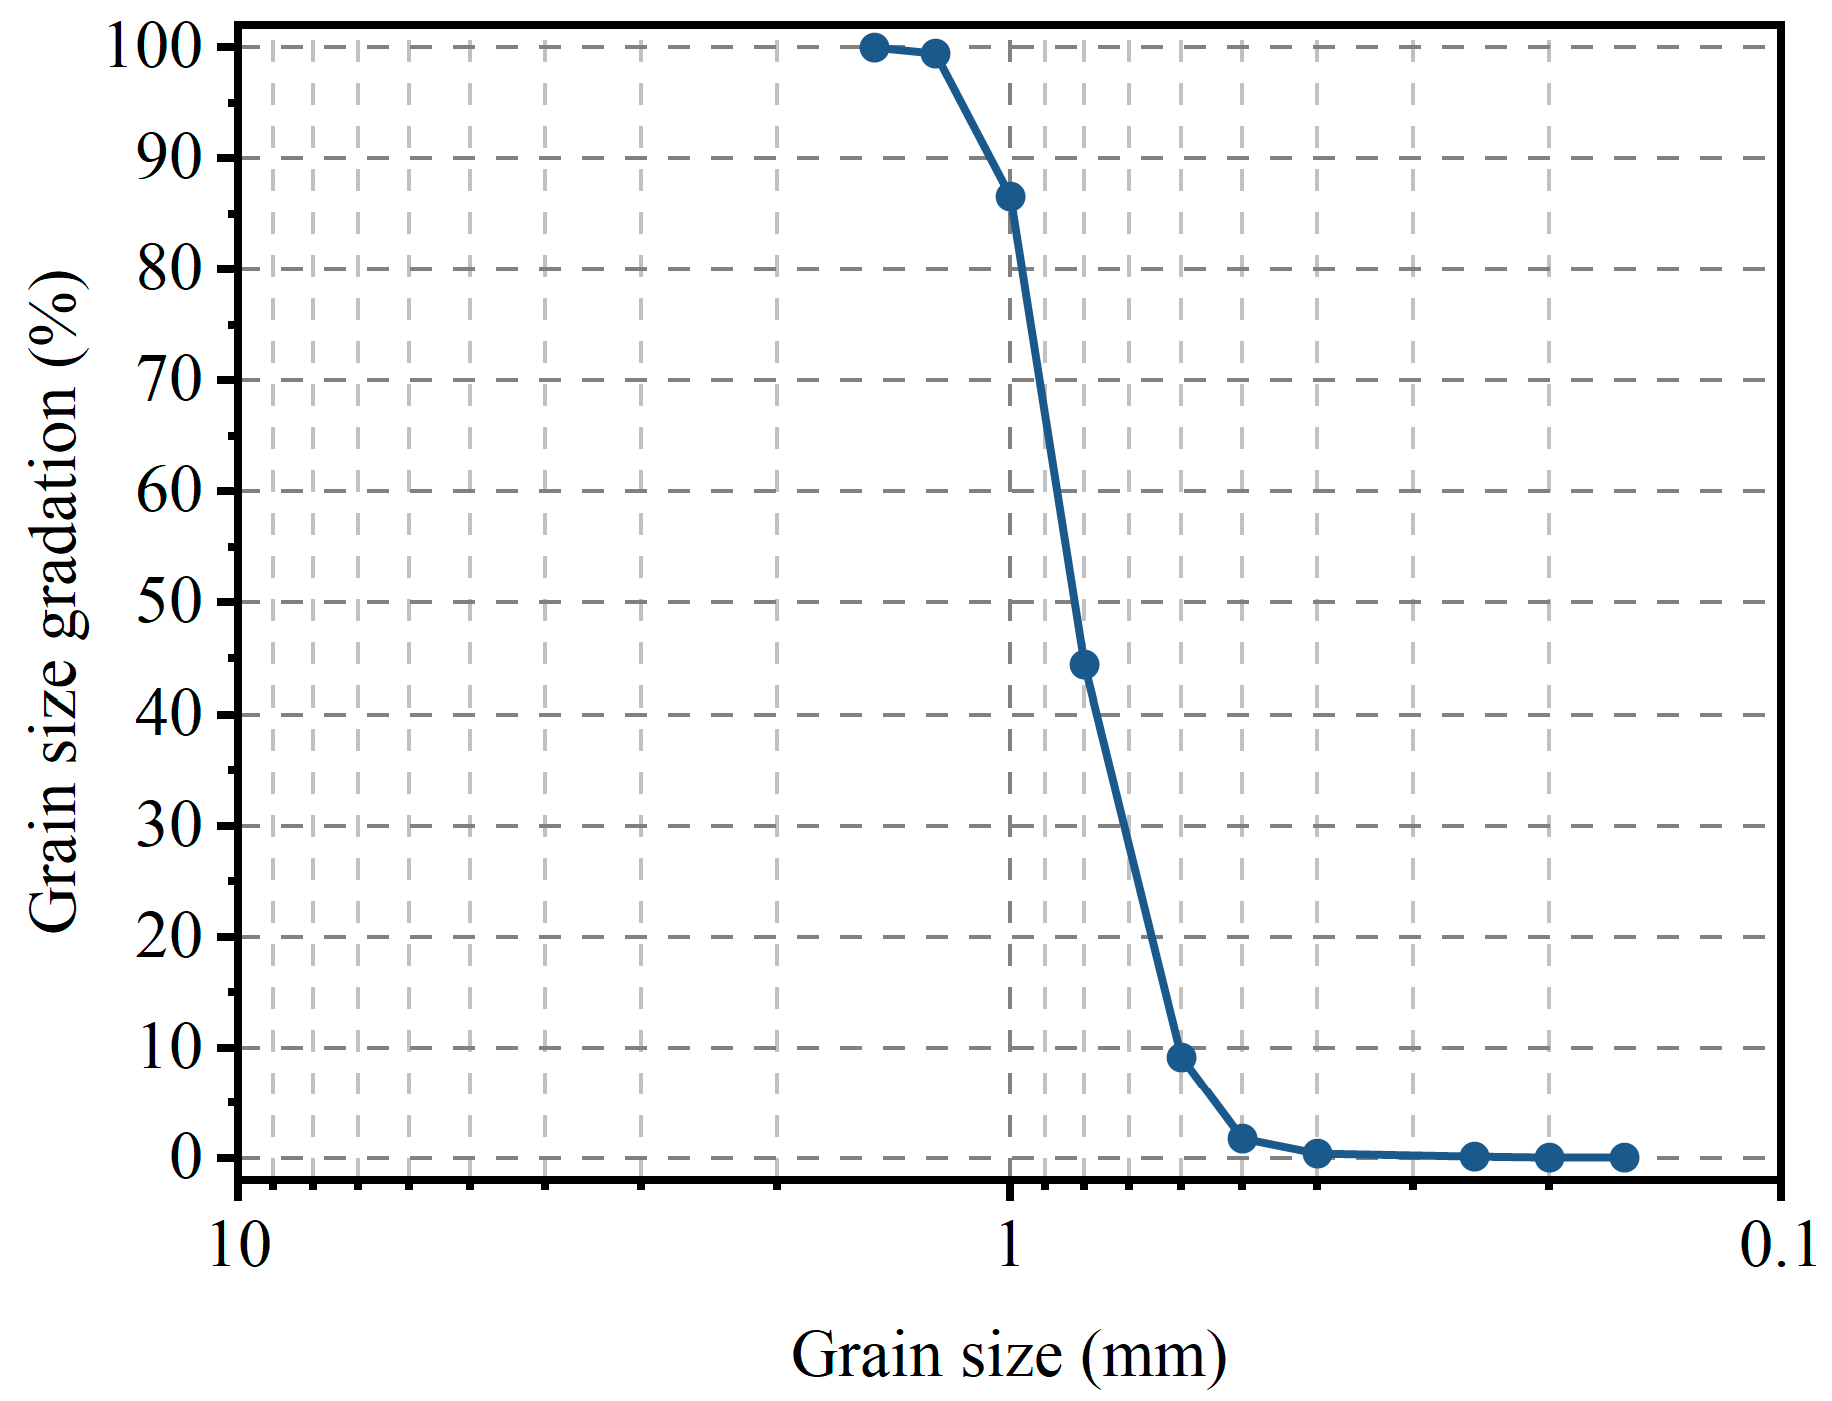
2.2. Experimental Design and Methods

Prior to initiating the experiment, a 10 cm thick layer of experiment sand was placed in the experiment section of the flume. To preserve the bedforms, the tailgate was initially closed, the flow rate at the inlet was set to a low value, and reverse flow from downstream was utilized. Once the water depth in the flume reached approximately 5 cm, the speed of the flume pump was adjusted to achieve the desired discharge for the experiment. Subsequently, the tailgate was adjusted to equalize the flow levels upstream and downstream of the flume, and the formal experiment commenced following the establishment of uniform flow.
Each experiment lasted between 14 and 20 h, with the exact duration depending primarily on the stability of the bedforms. The height of the bedforms was monitored and recorded every half hour. Once the bedforms stabilized, the experiment concluded. At the end of each experiment, the tailgate was closed, and the remaining water in the flume was gradually drained to prevent damage to the bedforms. After draining all the water, the bedforms were measured.
The conventional measurement methods for dune bedforms provide only basic data, such as dune length and height, which limit the depth of spatial analysis that can be conducted on the dunes. In contrast, a 3D laser scanner, specifically the Faro S350, offers high accuracy, speed, and a large volume of data. Practical experience has demonstrated that when the scanner head is oriented upwards, it can be obscured by the surrounding bedforms, creating a blind zone that hinders measurements at the flume bottom. Consequently, in this study, the scanner head was oriented downward, as illustrated in Figure 3.
In this study, six white target balls were uniformly distributed along the inner side of the experiment section in the flume. Four measurement positions were established to assess the bedforms across the entire experiment section. The topographic data from these positions were integrated using the target balls to create a complete point cloud representation of the bedforms of the experiment. Data integration was performed using Faro SCENE software (v. 2024.0), resulting in a point cloud containing over 100 million points. To enhance the data processing efficiency, while maintaining measurement accuracy, we employed a spatial thresholding method, wherein data points spaced less than 1 mm apart were excluded.
The experimental setup included three slope gradients: 1‰, 2‰, and 4‰. For each slope, seven trials were conducted, i.e., twenty-one experiments in total. The parameters for each experiment are detailed in Table 1. The minimum flow rate at which the bedload movement and partial bedforms formation started was determined experimentally. Initially, the bedforms in each experiment were flat. The flow rate plays a key role in the formation of bedforms. Specifically, when the open channel flow moves at a certain rate, the bedforms are subjected to shear stress from the water flow, causing sediment particles to move in a regular pattern, eventually forming bedforms with distinct characteristics.
Ripples are the initial stage of bedform development, and the size of the ripples is generally small. As the flow rate increases, the ripples continue to develop and gradually increase in size, forming dunes. There is no clear distinction between ripples and dunes, and both belong to the shape of bedforms. In this study, we focused on the shape characteristics of bedforms, and therefore made no distinction between the ripples and the dunes.
The water depth h was read using a steel ruler mounted on the outer wall of the glass flume. Twelve steel rulers were installed along the glass flume for the easy reading of water depth. The Froude number (Fr) and the friction velocity (u*) were calculated using formulas.

2.3. Measurement Parameters

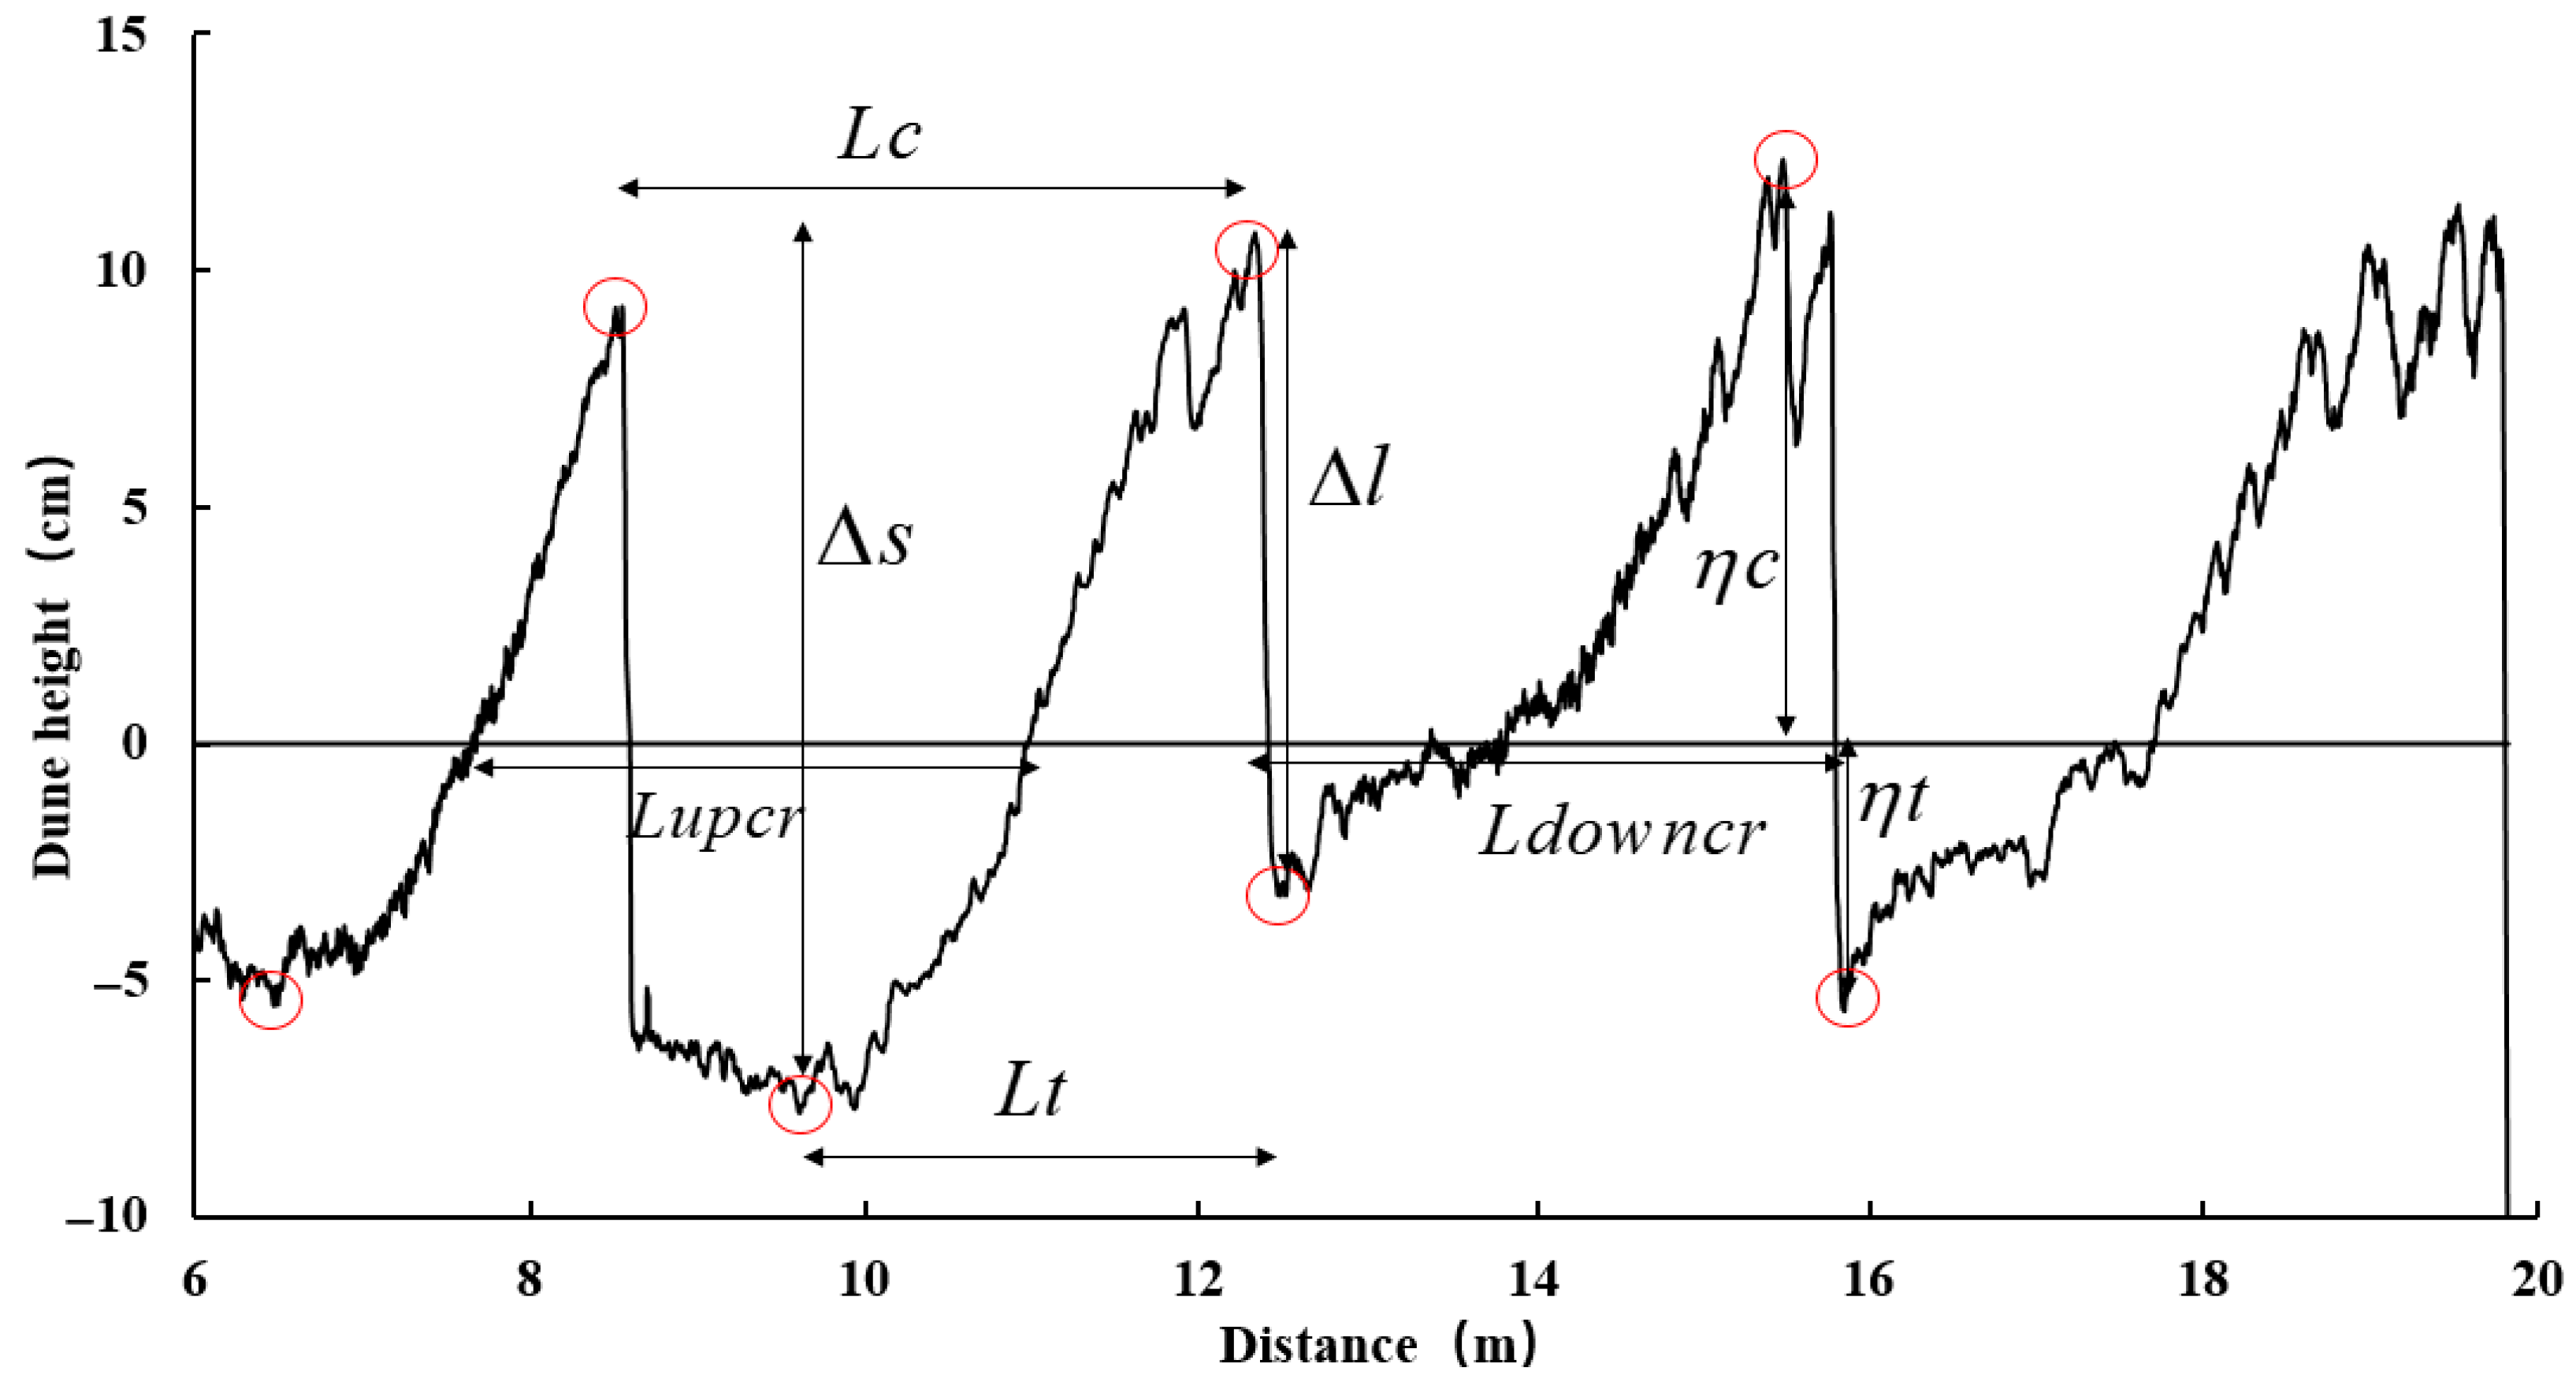
2.3.1. Bedform Parameters

The bedforms generated in this experiment exhibit both 2D and 3D topographies. In this study, three longitudinal profiles were extracted: one from the center of the flume width and two others at intervals of 20 cm to the left and right. Additionally, cross-sectional profiles were extracted every 3 m along the length of the flume, starting from the 2 m position, as shown in Figure 4. From the longitudinal profile perspective, the arrangement of crests and troughs on the 2D bedform is noticeably more regular than that on the 3D bedform (Figure 4a,c). From the cross-sectional profile perspective, the elevation variation across the flume width is significantly smaller for the 2D bedform compared to that for the 3D bedform (Figure 4b,d).
To analyze the evolution of bedform features, four longitudinal profiles of bed elevation were extracted at 20 cm intervals across the flume width (excluding the boundaries) from left to right for each experiment.
In this study, the 2D and 3D dune bedforms were analyzed after detrending using the original bed height as the zero axis at equilibrium. Subsequent to each experiment, the length, height, crest height, and trough depth of the dunes were examined. The relative positions of these bedform parameters are illustrated in Figure 5.
(1) Dune length
This research defines four types of dune lengths: Lc, the horizontal distance between the adjacent crests; Lt, the horizontal distance between the adjacent troughs; Lupcr, the horizontal distance between two adjacent nodes with positive slopes on the zero axis at equilibrium; and Ldowncr, the horizontal distance between two adjacent nodes with negative slopes on the zero axis at equilibrium. The average lengths for each type are denoted as Lc-ave, Lt-ave, Lupcr-ave, and Ldowncr-ave, respectively. The “average” value for each bedform parameter was calculated as the arithmetic mean of the corresponding values obtained from the identified bedforms.
(2) Dune height
Dune heights are typically categorized into two types: the stoss-side dune height (Δs), which is the vertical distance between the crest and the adjacent upstream trough, and the lee-side dune height (Δl), which is the vertical distance between the crest and the adjacent downstream trough. The average stoss-side and lee-side dune heights are denoted as Δs-ave and Δl-ave, respectively.
(3) Crest height and trough depth
In this study, the crest height (ηc) is defined as the vertical distance from the crest to the zero axis at equilibrium, whereas the trough depth (ηt) represents the vertical distance from the trough to the zero axis at equilibrium. The average values for the crest height and the trough depth are represented as ηc-ave and ηt-ave, respectively.

2.3.2. Bedload Transport Intensity and Flow Intensity

The bedload transport rate during the experiment was measured using test pits. The sand captured by the funnel was considered as the bedload particles. The streamwise bedload transport rate (gb) was calculated using the following formula:
g b = m t L
where gb denotes the streamwise bedload transport rate, kg/m/min; m denotes the mass of the bedload falling into the funnel within the time interval t, kg; t denotes the time interval, min; and L indicates the width of the flume, m.
Φ = g b r s ( r r s r ) 1 / 2 ( 1 g D 3 ) 1 / 2
where Φ denotes the bedload transport intensity, N/(s·m); rs denotes the specific gravity of experiment sand, N/m3; r denotes the specific gravity of experiment water, N/m3; and D denotes the experiment sand particle size, m.
ψ = 1 θ
where Ψ denotes the flow parameter; θ denotes the Shields parameter, which represents the flow intensity and is expressed as τ 0 ( r s r ) D ; and τ0 denotes shear stress on the bed. This is expressed as τ 0 = ρ g R J , N/m2.
The parameters Φ and θ are well-known Einstein parameters for the bedload transport rate. In this study, the calculation formulas for these two parameters are provided for an thorough explanation of the experimental process.

2.3.3. Bed Resistance

Predicting bed resistance is a challenging aspect of river dynamics. Bed resistance comprises sediment resistance, which arises from the uneven distribution of sediment particles on the bed surface, and shape resistance, which results from undulations of the dune bedforms [27]. This study analyzed bed resistance using Manning’s formula, derived from the data obtained during the movable-bed dune experiments:
u = 1 n R 2 / 3 J 1 / 2
where u denotes the average flow velocity, m/s; n indicates Manning’s roughness, which represents the bed resistance; R represents the hydraulic radius, m; and J indicates the slope gradient.

3. Results

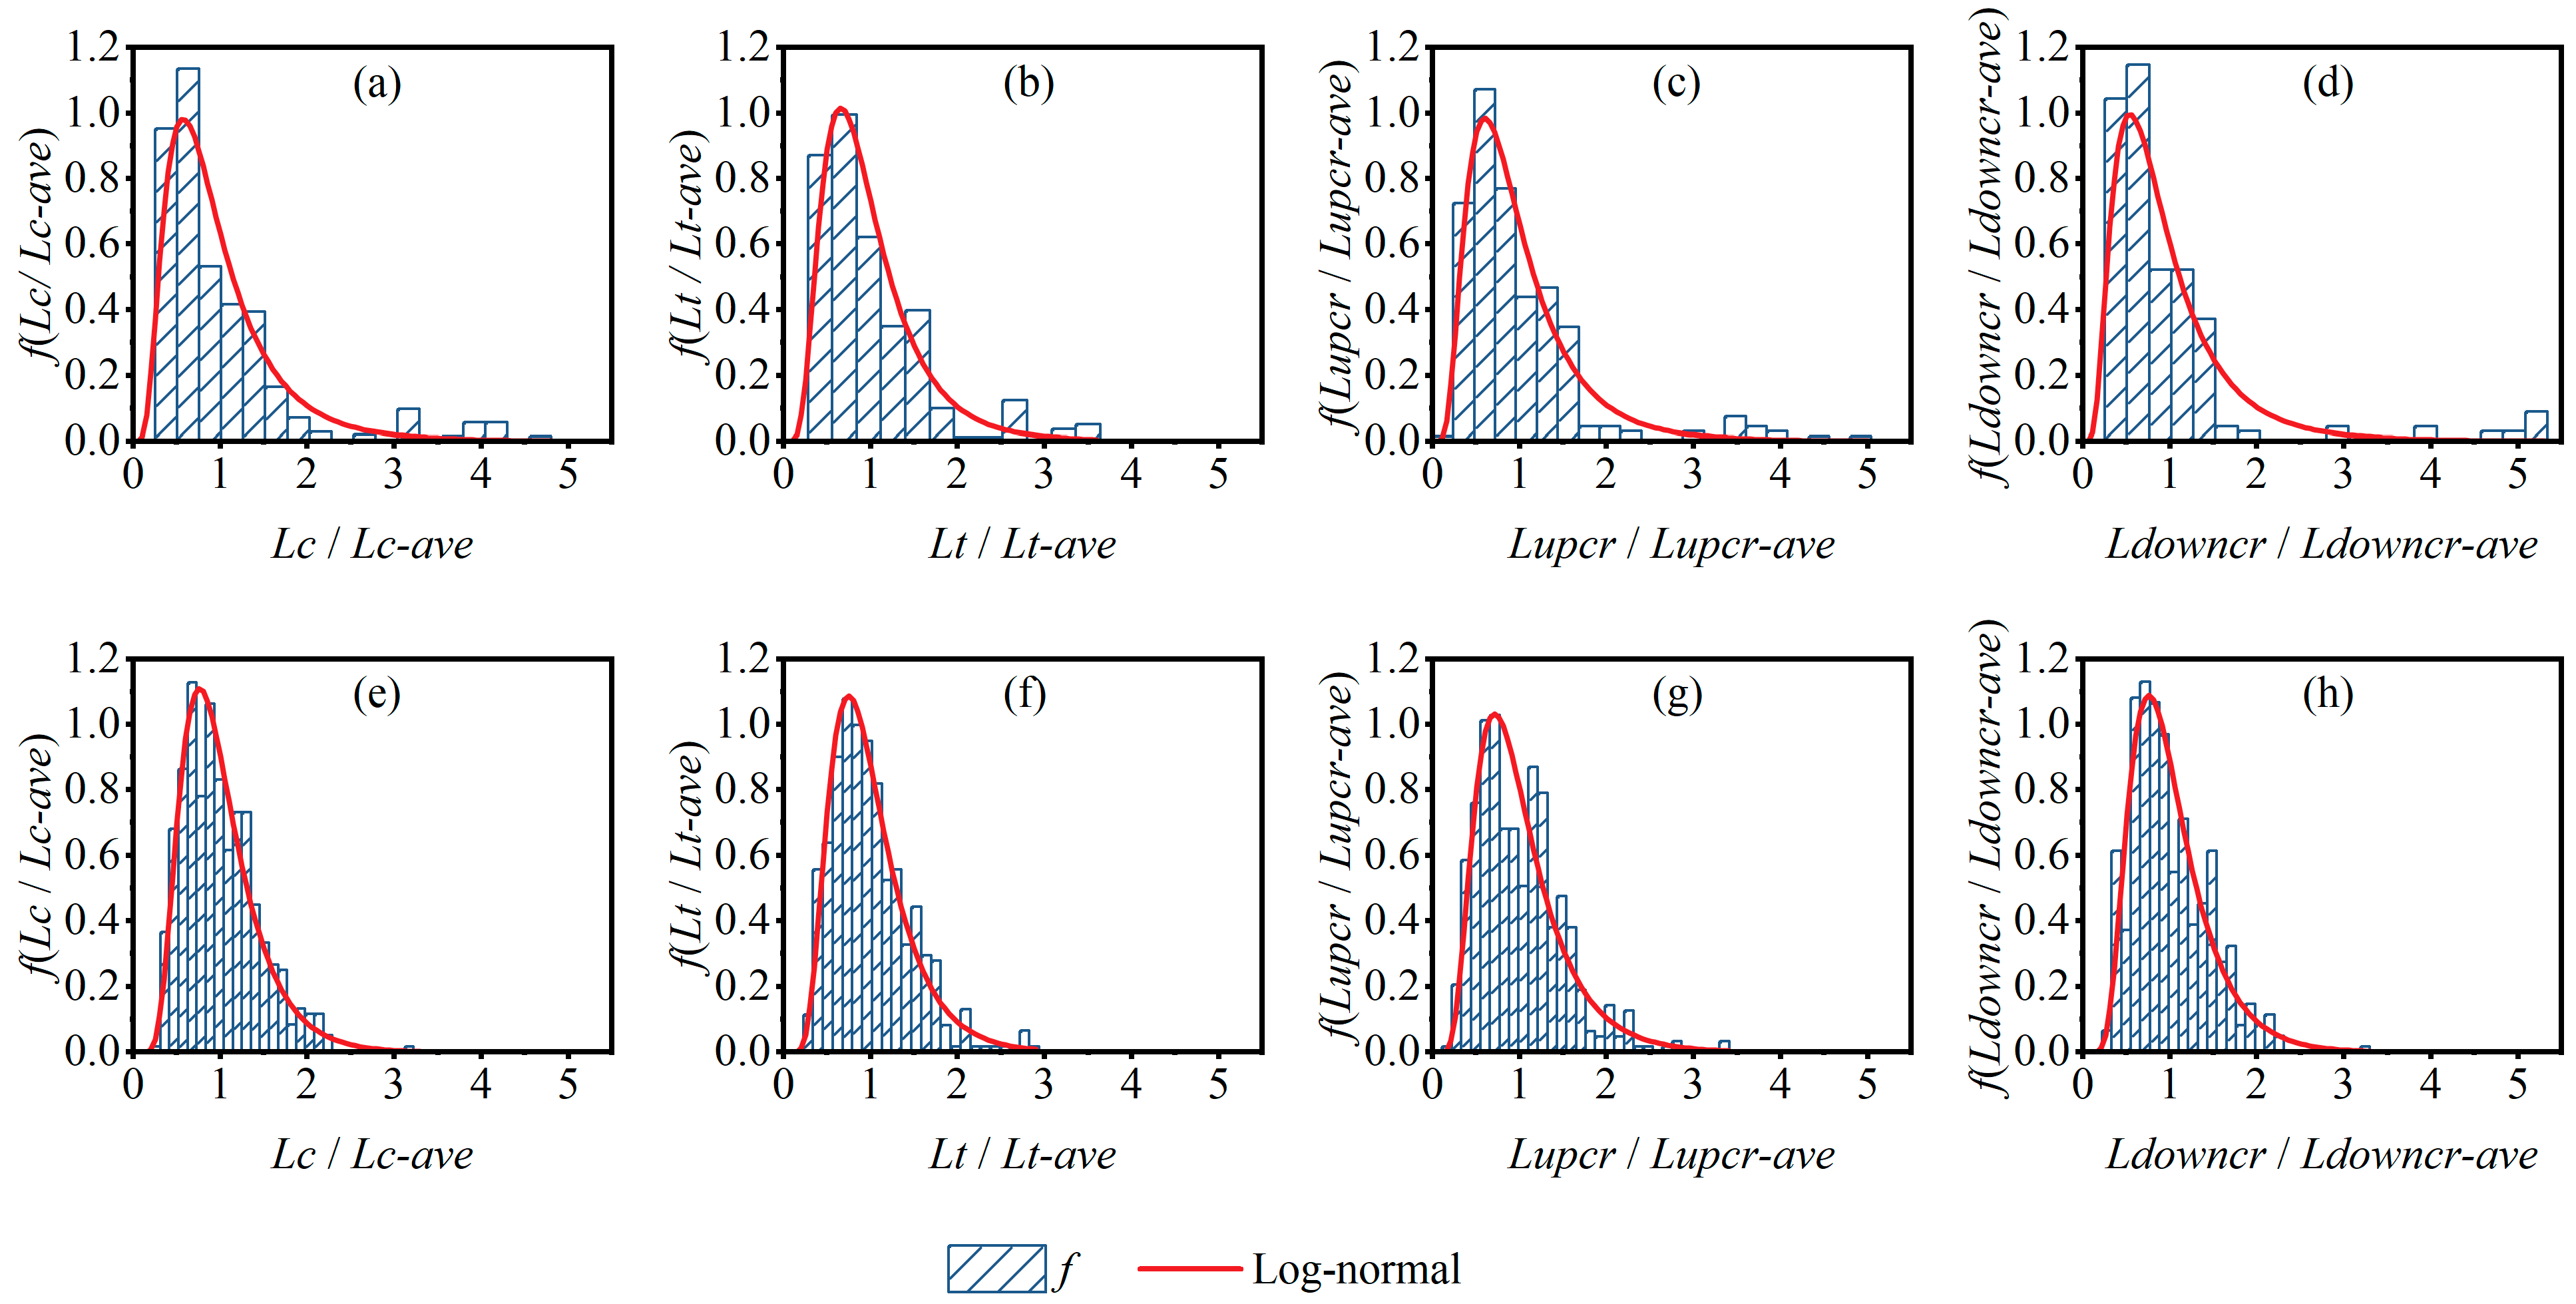
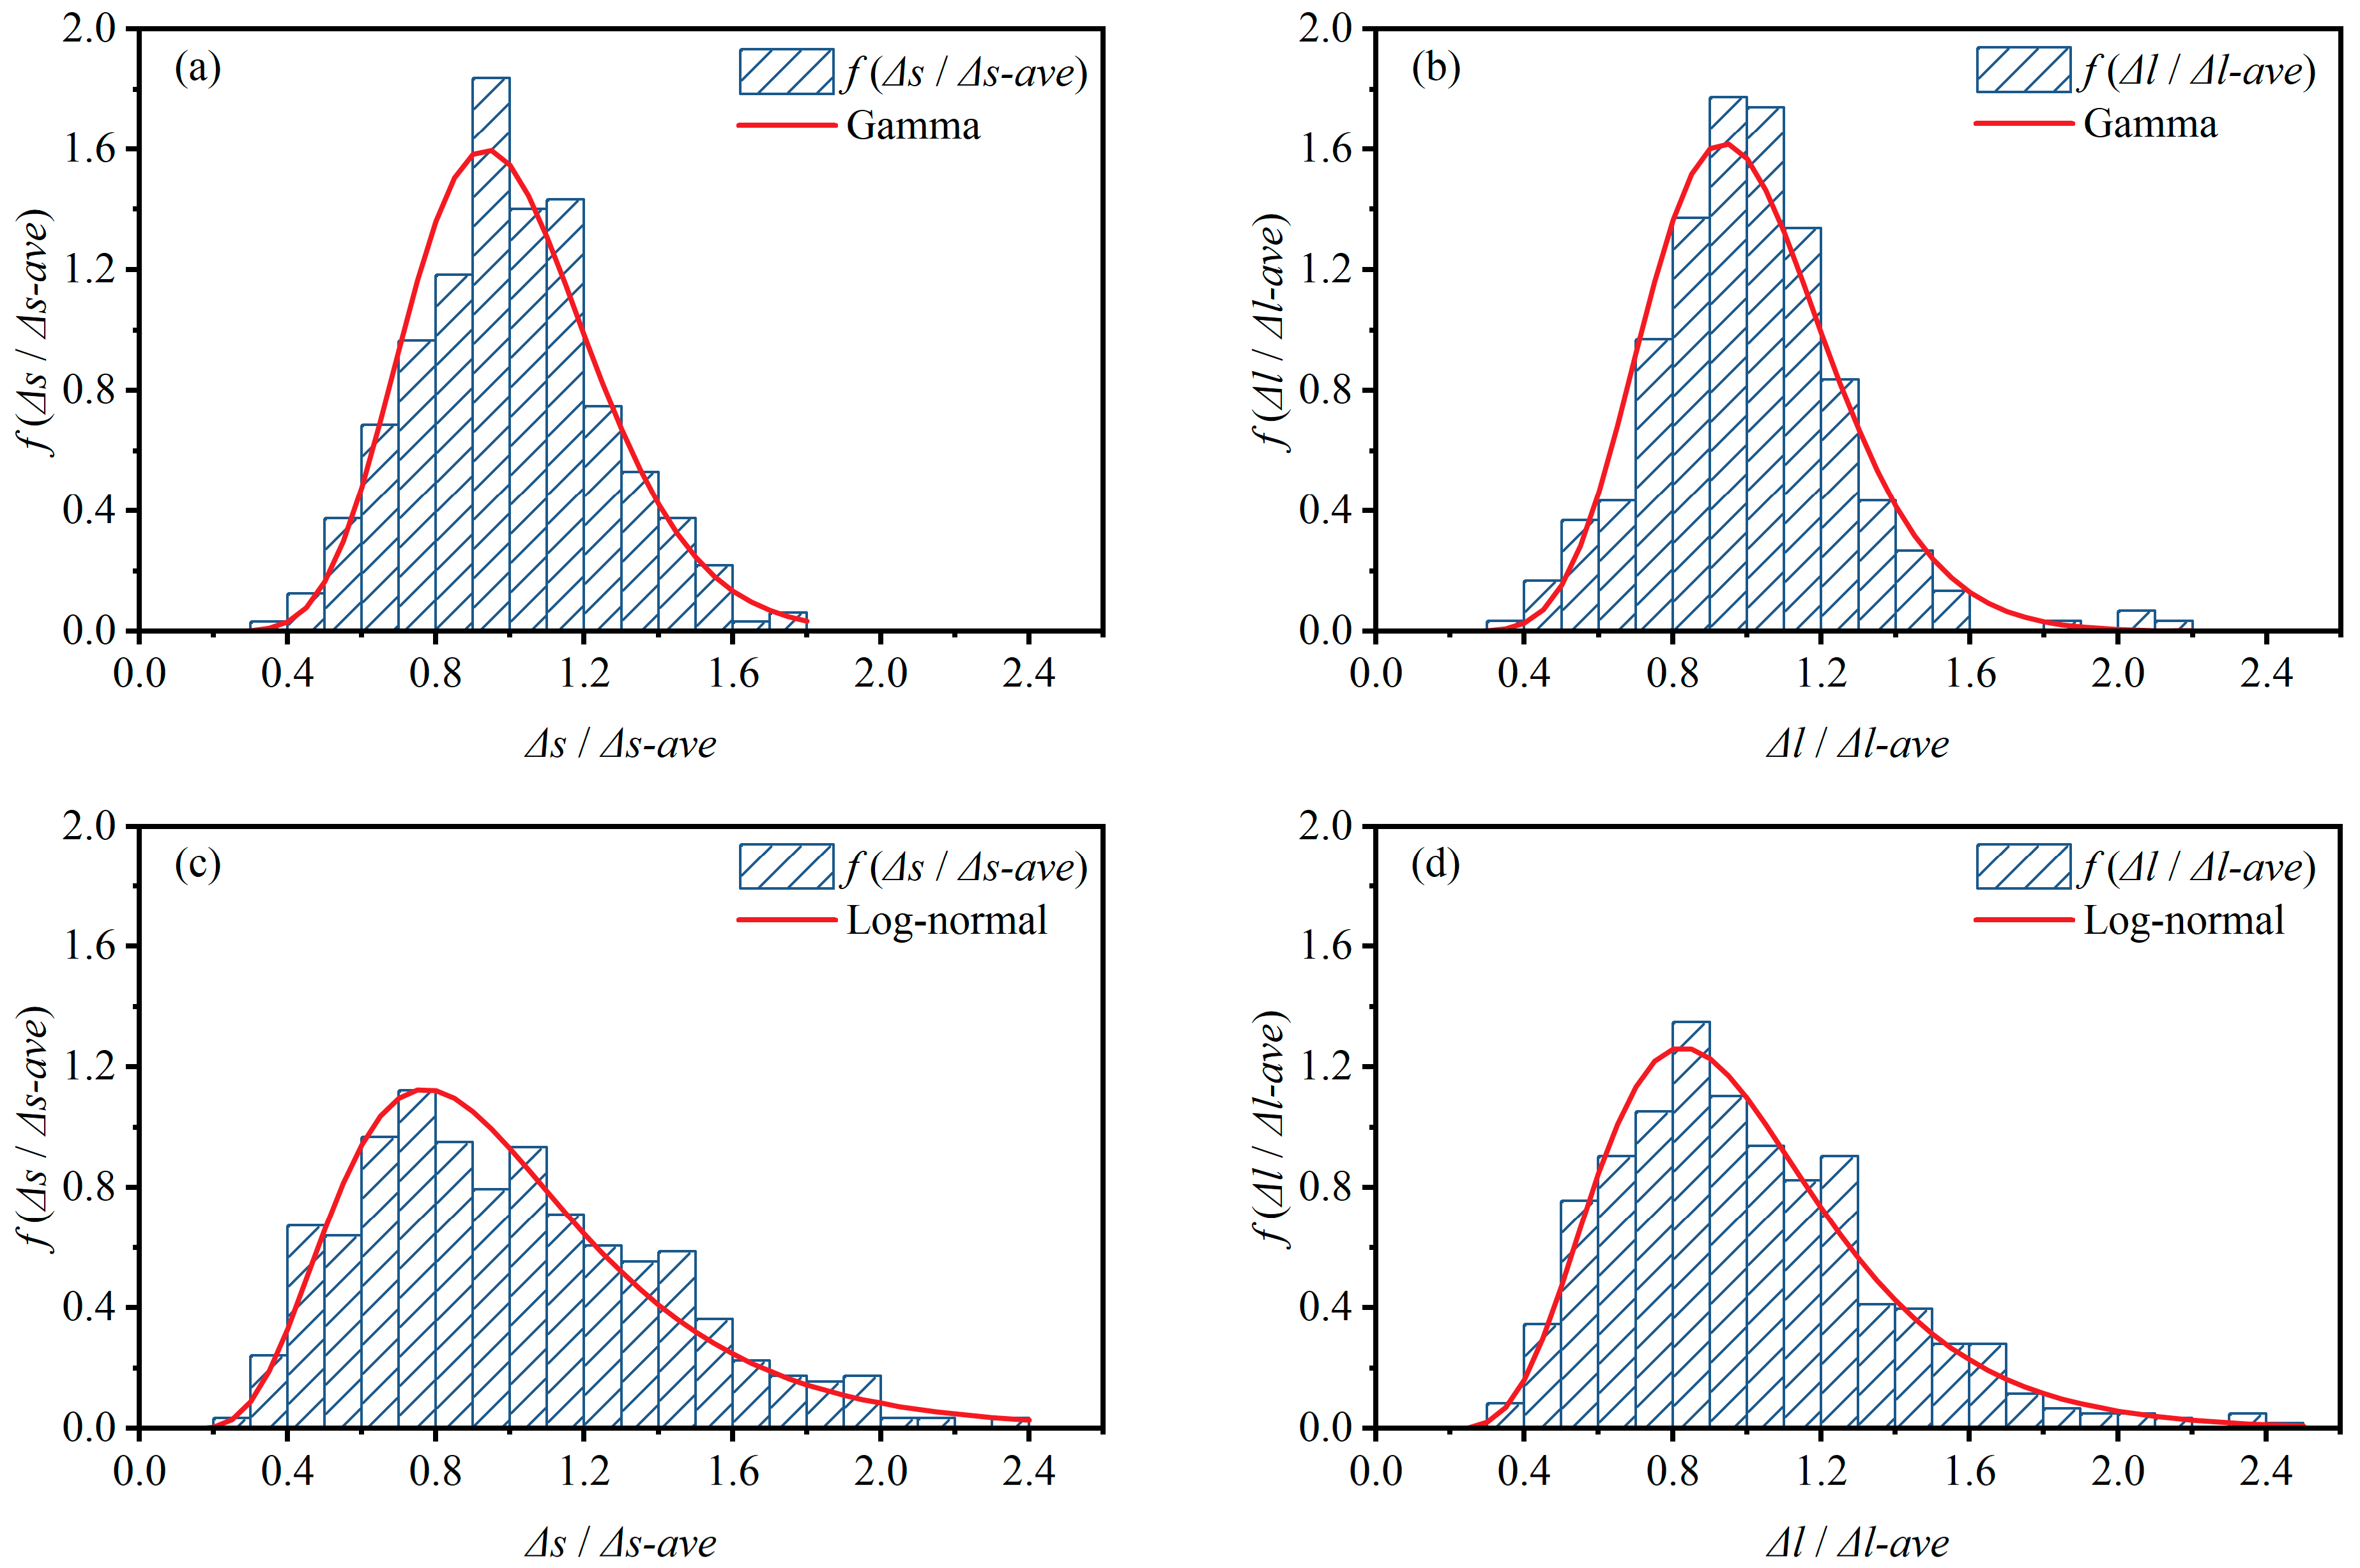
3.1. Statistical Patterns of Bedform Features

The topographic data collected using a 3D laser scanner revealed that at a 1‰ slope, two-dimensional (2D) bedforms formed at a discharge between 30 and 50 L/s, while three-dimensional (3D) bedforms developed at a discharge of 60–90 L/s. At slopes of 2‰ and 4‰, only 3D bedforms were observed across all the experiment discharges.

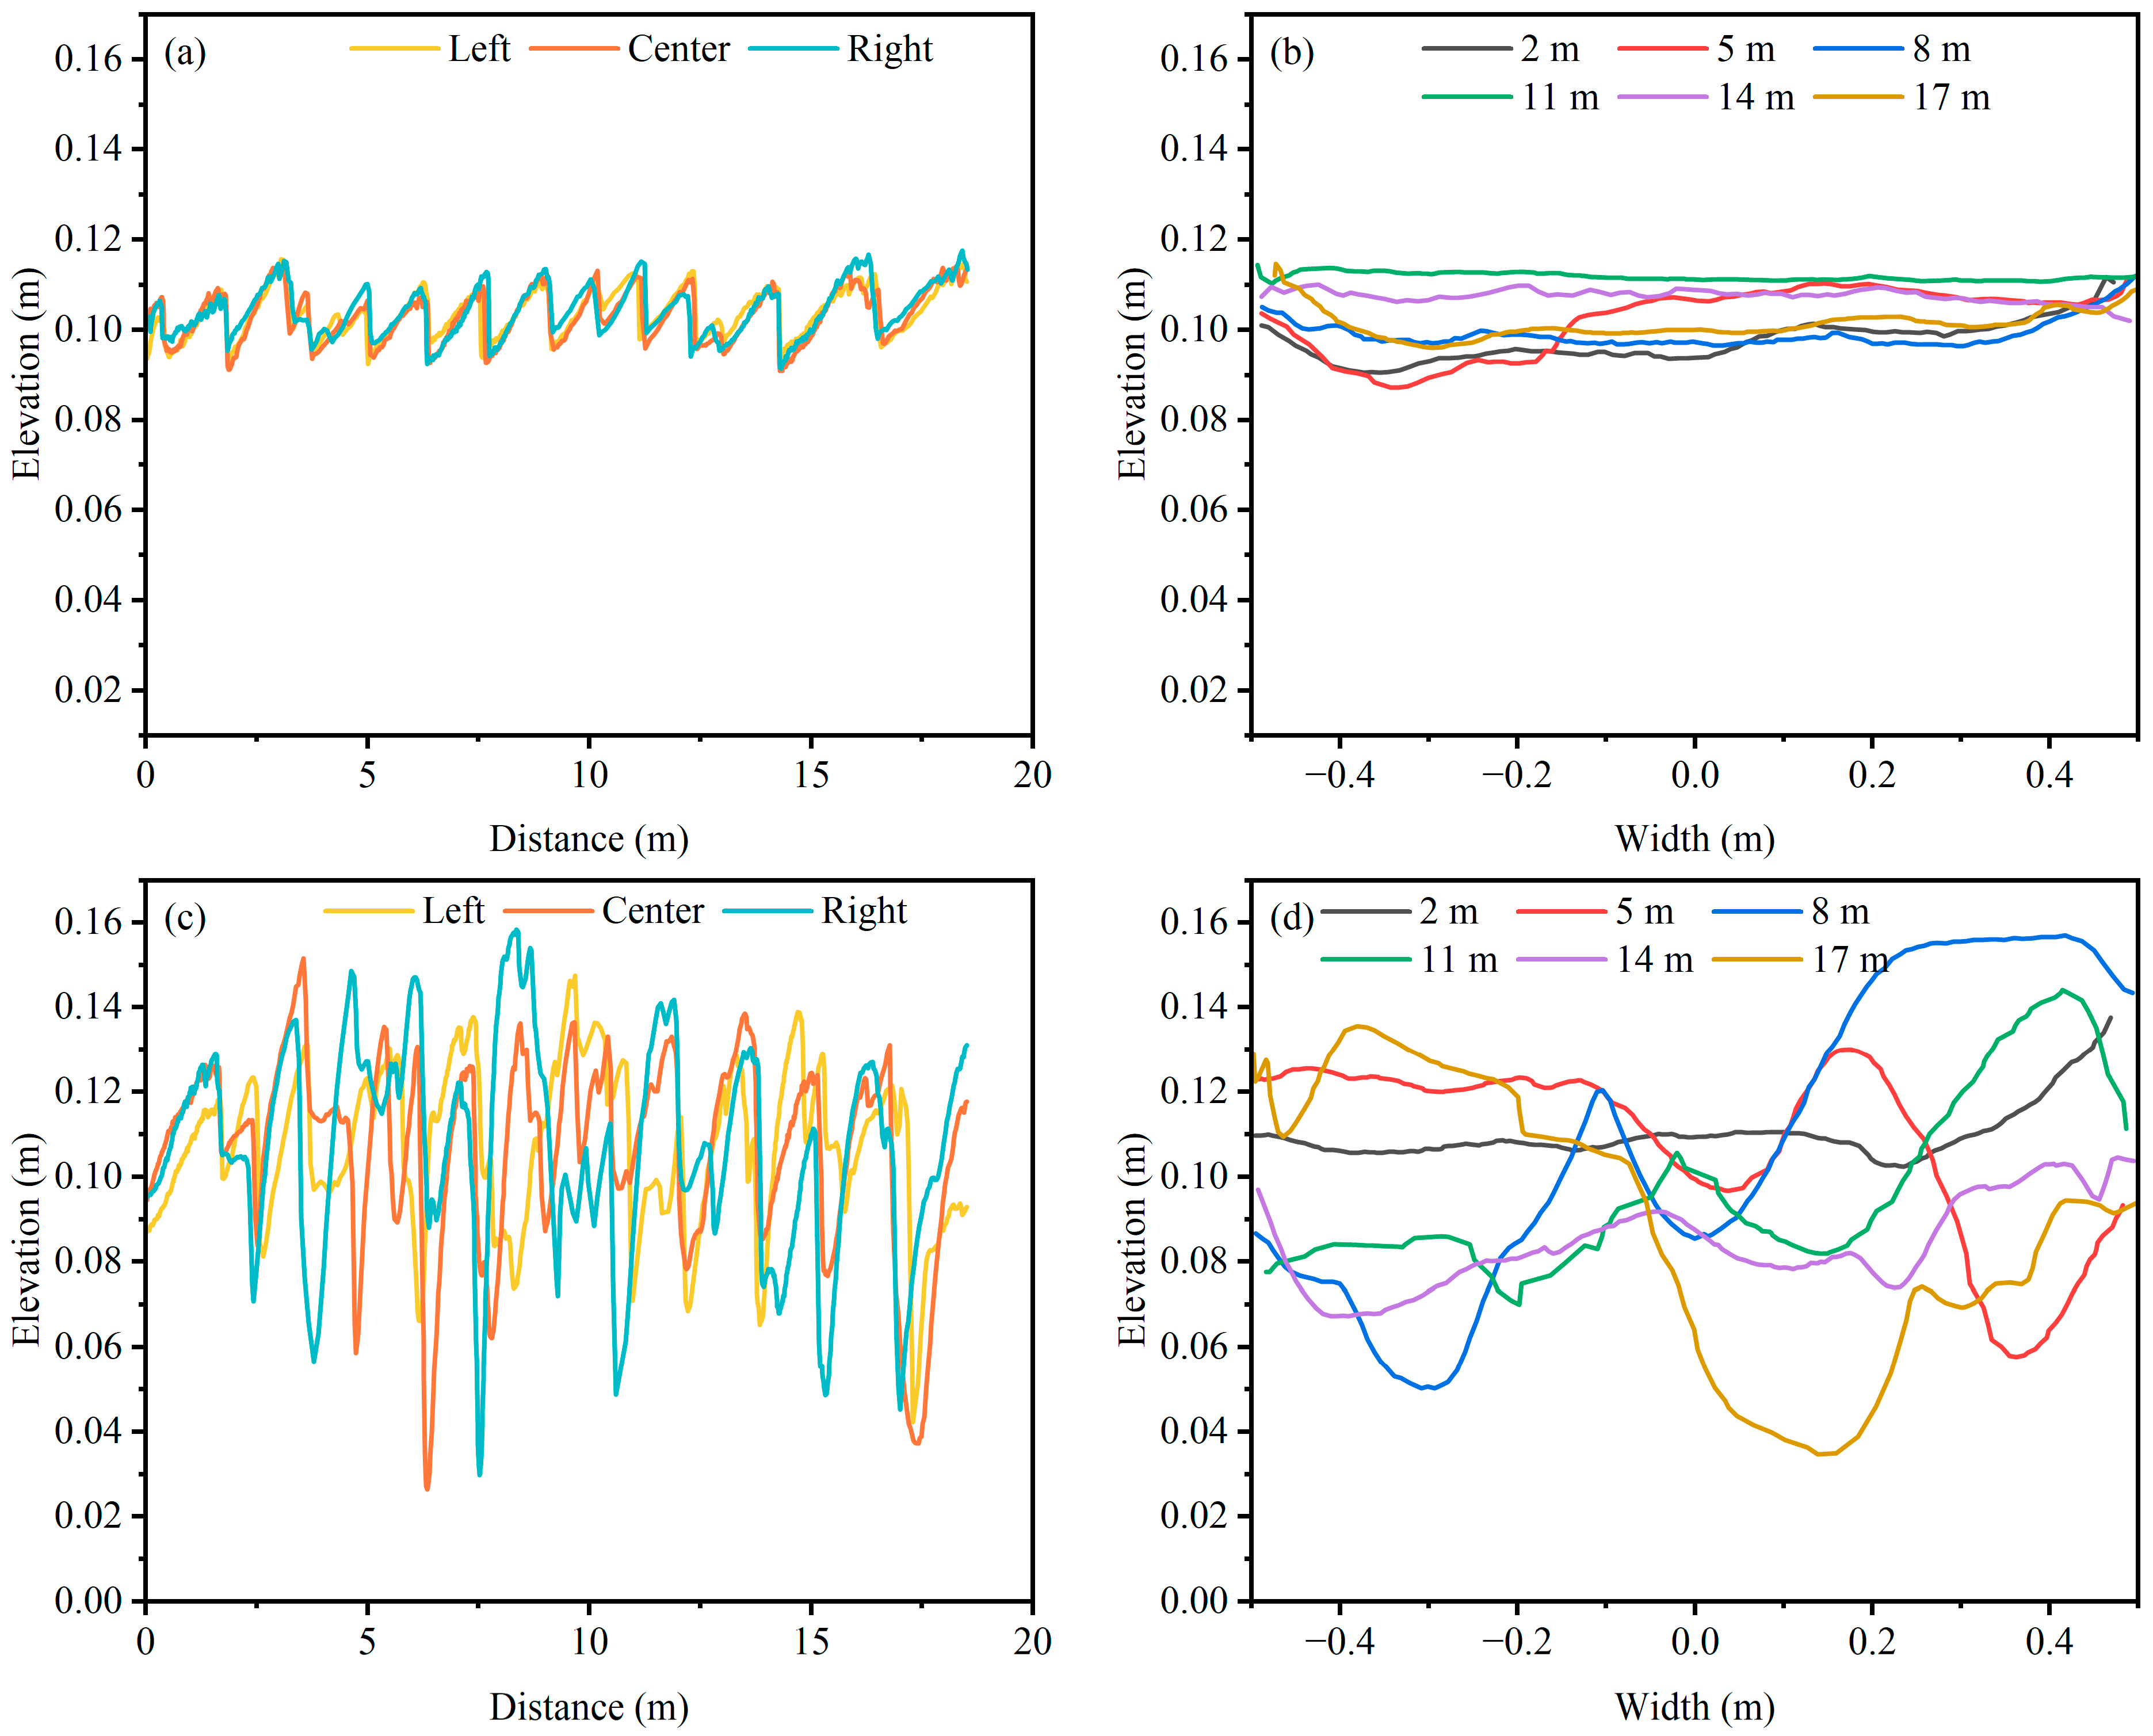
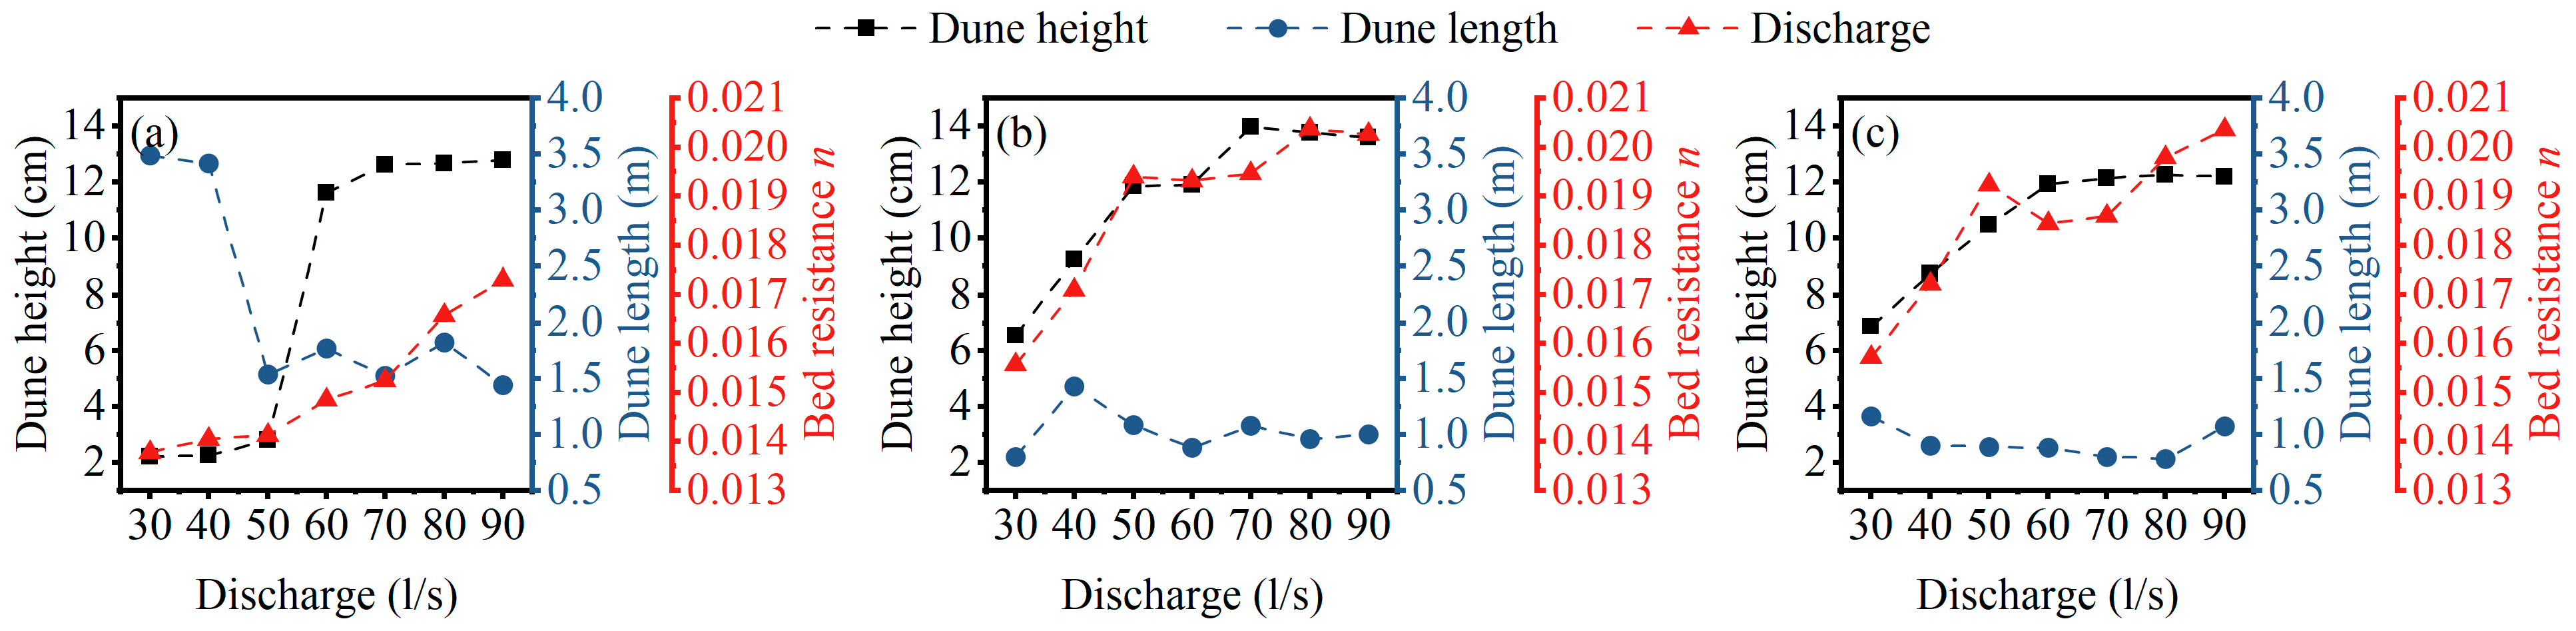
3.1.1. Dune Length Variation Characteristics

The probability density distribution of dune length, as fitted by the program, is depicted in Figure 6. Panels (a) through (d) of Figure 6 illustrate the distribution of the dune lengths (Lc, Lt, Lupcr, and Ldowncr) for the 2D bedforms, while panels (e) through (h) display the distribution for the 3D bedforms. The results indicate that the four dune lengths (Lc, Lt, Lupcr, and Ldowncr) for both the 2D and 3D bedforms adhere to a lognormal distribution. The parameters of the lognormal distribution for the dune length of the 2D and 3D bedforms are listed in Table 2. According to Table 2, the mean log standard deviations for the dune length of the 2D and 3D bedforms are 0.58 and 0.45, respectively. The mean log standard deviation for the 2D bedforms is marginally higher than that for the 3D bedforms by 0.13, which reflects a disparity in the distribution of dune lengths, as depicted in Figure 6a–d.

3.1.2. Dune Height Variation Characteristics

The probability density distribution of dune height, as fitted by the program, is shown in Figure 7. Panels (a) and (b) of Figure 7 depict the distributions of dune heights (Δs and Δl) for the 2D bedforms, and panels (c) and (d) illustrate the distributions for the 3D bedforms. The results reveal that the dune heights (Δs and Δl) for the 2D bedforms follow a Gamma distribution, whereas those for the 3D bedforms follow a lognormal distribution. The distribution parameters for the dimensionless dune heights of the 2D and 3D bedforms are detailed in Table 3. For the 2D bedforms, the Gamma distributions of Δs and Δl exhibit shape parameters of 15.185 and 15.610, respectively, and scale parameters of 0.066 and 0.064, respectively. The shape and scale parameters for Δs are similar to those for Δl. The mean and standard deviations corresponding to the lognormal distributions of Δs for the 3D bedforms exhibit characteristics similar to those of Δl.

3.1.3. Crest Height and Trough Depth Variation Characteristics

The probability density distributions of the crest height and the trough depth fitted by the program are shown in Figure 8. Figure 8a,b represents the distributions of the crest height ηc and the trough depth ηt of the 2D bedforms, and Figure 8c,d represents the distributions of the crest height ηc and the trough depth ηt of the 3D bedforms. The results demonstrate that the ηc and ηt of the 2D bedforms obey the normal distribution, and the ηc and ηt for the 3D bedforms obey the Gamma distribution. Table 4 outlines the distribution parameters for the dimensionless crest height and trough depth of both the 2D and 3D bedforms. The standard deviation for the crest height of the 2D bedforms, which follows a normal distribution, is 0.334. This value is slightly smaller than that for the trough depth, resulting in a steeper probability density distribution curve for the crest height compared to that of the trough depth. Conversely, the scale parameter for the trough depth of the 3D bedforms following a Gamma distribution is 0.324, which is slightly larger than that for the crest height. This attribute produced a more dispersed probability density distribution curve for the trough depth compared to that of the crest height.

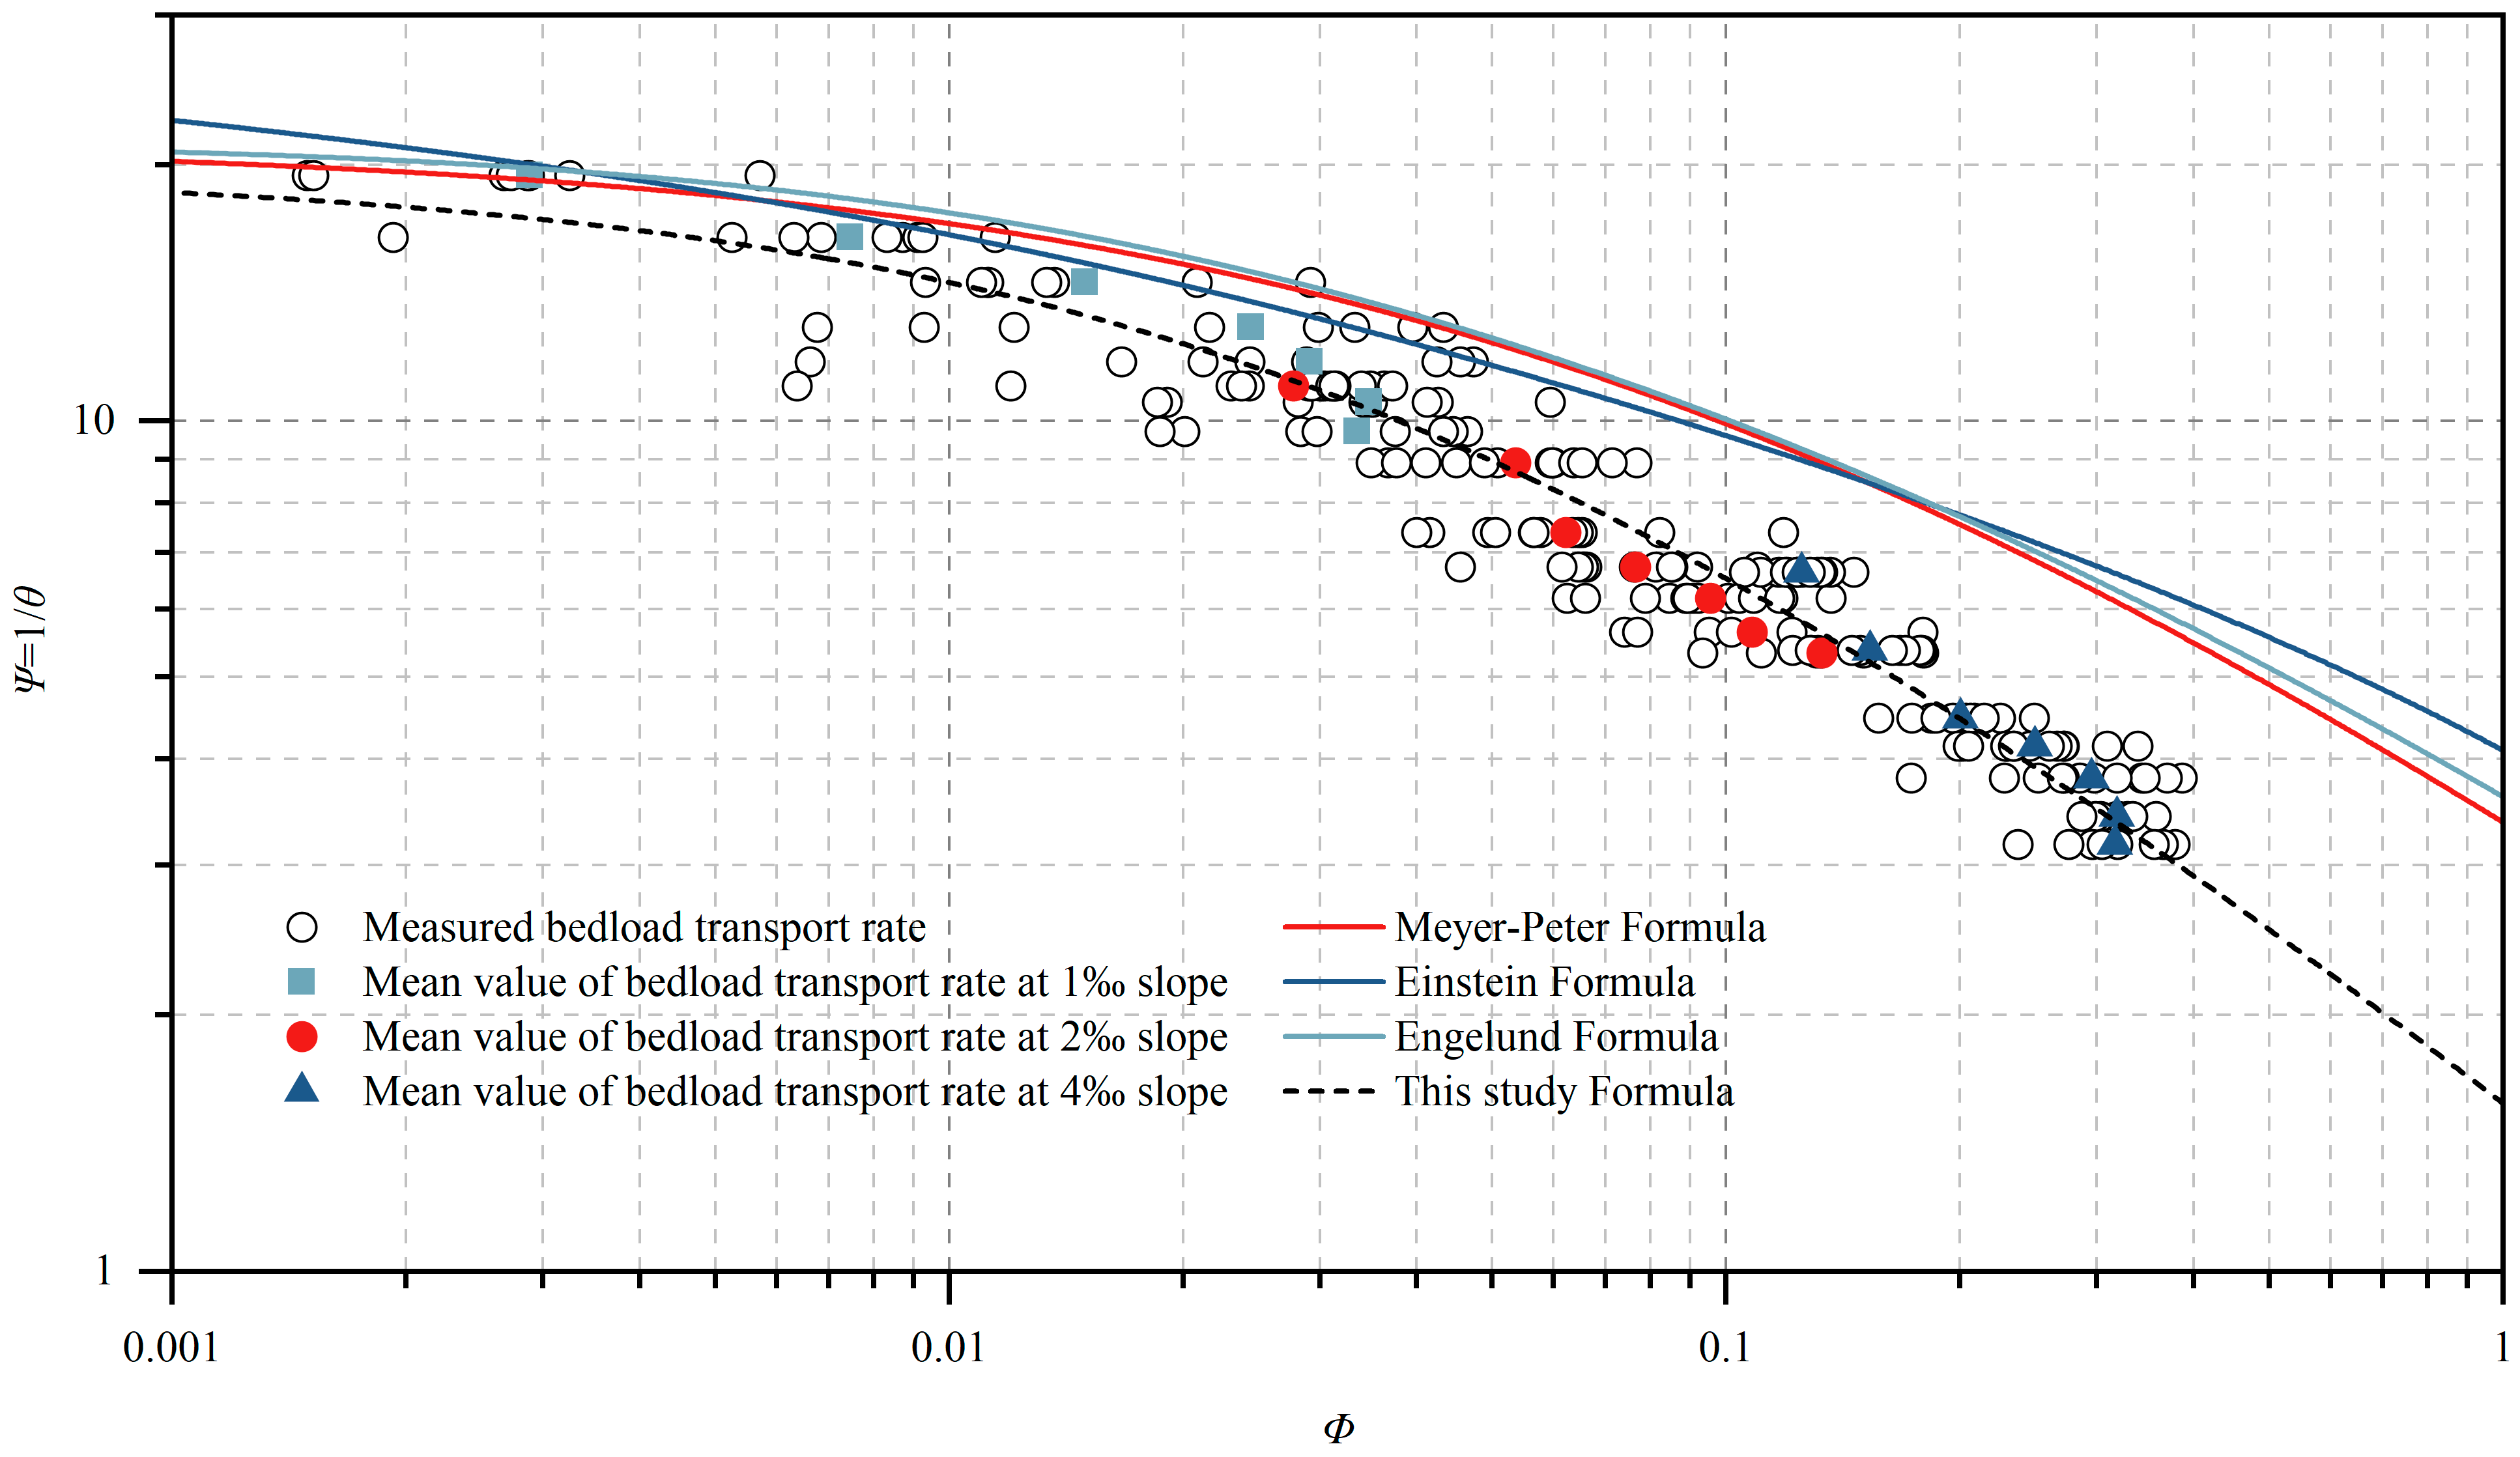
3.2. Bedload Transport Rate on Dune Bedforms
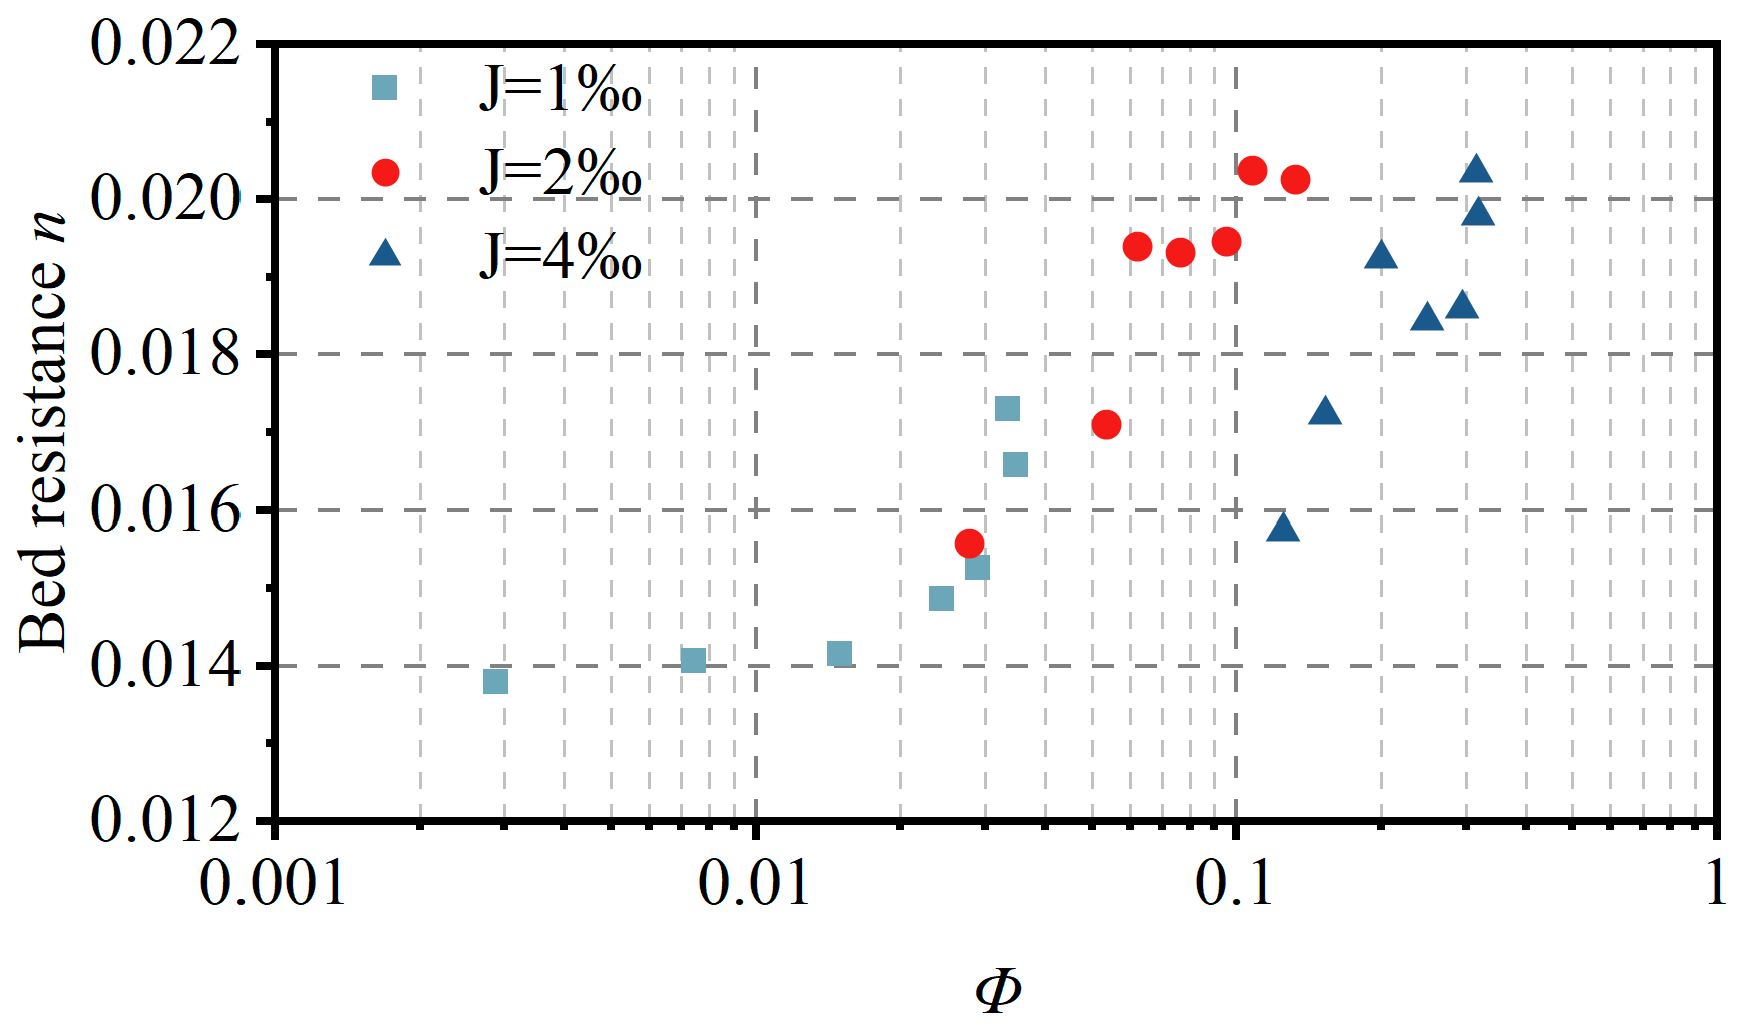
In the late 19th century, Du Boys in France initially proposed a theory of drag forces for bedload transport [47]. Subsequently, numerous researchers have expanded on this topic, developing a variety of formulas and theoretical frameworks [48]. Notable among these are the Meyer–Peter formula [26,27] and the Engelund formula [29]. Later, Chinese scholars streamlined these bedload transport formulas and standardized their format [49].
Based on the bedload transport rate measured during the experiment and the flow conditions (Table 1), the bedload transport intensity and the flow intensity at the different slopes were computed. These calculations were performed using the representative bedload transport formulas derived from the experimental results, as illustrated in Figure 9.
Figure 9 indicates that in the presence of dunes, the bedload transport rates estimated by the representative formulas for uniform sediment deviate from the measured sediment transport rates. These deviations are more pronounced at higher flow intensities and in more fully developed dune bedforms. Specifically, at a low flow intensity (θ < 0.1), the sediment transport rates calculated by the representative formulas approximate the average measured sediment transport rate; however, at a medium-to-high flow intensity (θ ≥ 0.1), the calculated rates generally exceed the average measured rate.
At low flow intensities, significant variability was observed in the bedload transport rates measured in each experiment group, particularly in the experiments conducted on low-slope bedforms, where the maximum rate exceeded the minimum by more than fivefold. This variability can be attributed to the group transport of bedload particles. When dunes are present on the bed surface, their movement during the low-flow-intensity tests (θ < 0.1) is relatively slow. Consequently, during the measurement of the bedload transport rates, the dune crests and troughs alternately enter the pit during different measurement periods, leading to substantial fluctuations in the measured transportation rates. Conversely, in the experiments conducted at medium-to-high flow intensities (θ ≥ 0.1), the dunes move more rapidly, and multiple dunes enter the pit during each measurement period, thereby reducing the variability in the measured bedload transport rates.
This study employed a nonlinear least square fitting method to derive a bedload transport formula for dune bedforms based on the measured rates and flow intensities as follows. The meaning of each physical parameter is the same as above:
Φ = 2.03 ( θ 0.05 ) 1.32
The comprehensive error of the bedload transport formula for dune bedforms was quantified using the Mean Square Error (MSE) between the experimentally measured and calculated sediment transport rates, as expressed in Equation (6). The results indicate a comprehensive error of 0.016, demonstrating the high accuracy of the proposed formula.
M S E = 1 N I = 1 N ( Φ i m e a s u r e d Φ i c o m p u t e d ) 2
where N denotes the total number of measurements of bedload transport intensities; Φi-measured and Φi-computed denote the i-th measured and calculated bedload transport intensities, respectively.

3.3. Bed Resistance

The experimental data were used to determine the average lengths and heights of the dunes under the different slopes, and these were analyzed alongside corresponding the bed resistance measurements, as illustrated in Figure 10.
On the same slope, an increase in flow intensity generally corresponds to an increase in dune height, with bed resistance exhibiting a significant positive correlation with dune height. Notably, the maximum bed resistance recorded was 0.0204 on both the 2‰ and 4‰ slopes. However, the dune heights at these slopes were 12.2 cm and 13.8 cm, respectively, indicating that although bed resistance increases with flow intensity, the dune height does not consistently follow this trend.
The relationship between bed resistance and dune length under varying flow conditions across the three slopes is not clearly defined. From the experiments results, there is no direct and obvious correlation between bed resistance and the dune length.
To further examine the patterns of change in bed resistance, the correlation between measured bed resistance and bedload transport intensity was analyzed and is illustrated in Figure 11. This figure reveals a significant positive correlation between bed resistance and bedload transport intensity. Within the same slope, the data from the different experiment groups are distributed across distinct regions; however, they exhibit a consistent overall trend of increasing bed resistance with heightened bedload transport intensity.

4. Discussion

4.1. Quantification of Bedforms

The previous studies have classified dune length and height into various distribution types based on bedform data from flume experiments and field observations. For instance, the probability density distribution of bedform elevation has been described as a Rayleigh distribution [50], a Weibull distribution [51], an Exponential distribution [52], a Gamma distribution [53], and a Beta distribution [54]. In this study, dune bedforms were categorized into 2D and 3D types, a distinction not commonly observed in prior research. Additionally, this paper employed multiple definitions of dune length and height (Figure 5), referencing the existing literature [5]. The distribution patterns of dune length and 2D dune height observed in this study align with those reported in earlier studies [5], specifically lognormal and Gamma distributions, which indirectly supports the validity of the conclusions drawn in this research.
However, the 3D dune heights in this study followed a lognormal distribution and differed from the distribution pattern of the 2D dune heights, and the crest heights and trough depths also differed from the previous findings [5,51,52,53]. The primary reason for these discrepancies is that this study distinguished the dune bedforms into 2D and 3D according to the characteristics of the longitudinal and cross-sectional morphology profiles after the experiments to analyze the shape parameters distribution patterns separately. From the perspective of enhancing the scope of existing research, differentiating the bedforms to characterize the distribution of physical parameters of dunes is particularly significant.
This study focused on the characteristics of the dune length and height, the crest height, and the trough depth. Future research should include additional bedform features, such as continuity and directionality. Moreover, examining a broader range of flow conditions and bedload grain size compositions is essential to validate the applicability of the findings presented here.

4.2. Bedload Transport Rate Related to Bedforms

The objective of this study was to enhance the understanding of bedload transport theories, specifically focusing on transport properties over dune bedforms. A comparison of the classical bedload transport theories—including Du Boys’ [47] drag force theory and the formulas by Meyer–Peter and Müller [26], Einstein [27], and Engelund and Fredsøe [29]—revealed that the theoretical values calculated using these models deviated from the measured values when dunes were present. This discrepancy aligns with the findings from previous studies [55,56,57], suggesting that dune bedforms may significantly influence the deviation in the estimated bedload transport rates. Consequently, the existing equations may require adjustments to accommodate the effects of dune bedforms, which is crucial for accurate flood forecasting and river management.
To address this issue, this study employed a nonlinear least squares fitting method to derive a new bedload transport formula (Equation (5)) based on the measured data of bedload transport rates and flow intensities in the experiments. This proposed formula accounts for the relationship between bedload transport intensity and flow intensity, incorporating the Shields parameter and bed shear stress as the key variables. The accuracy of this formula was confirmed by calculating the Mean Square Error (MSE, Equation (6)), which was low at 0.016, indicating strong predictive capability. However, it is acknowledged that any formula has limitations in its applicability; thus, the behavior of the proposed formula under different hydraulic and sediment conditions remains to be verified.
Given the complexities of bedload transport, which is influenced by various factors [39,58,59], future research should explore bedload transport patterns across different grain sizes and flow conditions, as well as the mechanisms by which bedforms affect bedload transport. Additionally, integrating numerical simulations with field observations [24,60,61] could yield a more comprehensive understanding of bedload transport complexities, providing a more robust scientific foundation for river engineering and sediment management.

4.3. Bed Resistance Associated with Bedforms

This study extensively explored the challenging problem of bed resistance prediction in river dynamics. Utilizing the data from movable-bed dune experiments and applying Manning’s formula, this study quantitatively analyzed bed resistance to elucidate the inherent relationship between bed resistance and dune morphology. The findings indicate a clear positive correlation between the dune height and bed resistance. However, the influence of dune length on bed resistance appeared less significant, aligning with the conclusions from prior research [3,62].
Notably, at high flow intensities, the dune height does not consistently increase with bed resistance; for instance, the dune height on a 4‰ slope is smaller than that on a 2‰ slope [63,64]. Given the resistance of uniform sediment remains constant, an increase in resistance from other sources must compensate for the diminished bed resistance due to the reduced dune height [27], potentially caused by increased mass bedload transport.
To verify this hypothesis, this study examined the relationship between bedload transport intensity and bed resistance. Analysis demonstrated a significant positive correlation: bed resistance increases with heightened sediment transport intensity (Figure 11). This finding signifies that the mass bedload transport at high flow intensities significantly contributes to increased bed resistance. Understanding this relationship is crucial for comprehending sediment transport in rivers, highlighting the role of bed resistance in influencing the sediment transport capacity of actual rivers.
This study both quantitatively and qualitatively assessed bed resistance in the presence of dunes using experimentally measured data, offering new insights into the understanding of bed resistance. With advancements in technologies, such as remote sensing [65], numerical simulation [66], and artificial intelligence [67], more precise measurements and predictions of bed resistance are anticipated. Integrating data from diverse sources, including topography, flow velocity, and the sediment size, will enhance the comprehensive understanding of bed resistance formation mechanisms, which will facilitate the development of more accurate and reliable prediction models.

5. Conclusions

This study developed a system for measuring flow–sediment movement and three-dimensional bedforms, collected data under various slopes and flow conditions, and analyzed the statistical distribution patterns of two-dimensional and three-dimensional bedforms characterization parameters. It also examined the characteristics of bedload transport on dune bedforms and assessed the impact of bedload transport on bed resistance. The major conclusions are stated as follows:
The experiments demonstrated that the bedforms can evolve into two-dimensional and three-dimensional dunes under different slopes and flow conditions. The statistical analysis of bedform parameters, such as the dune length, the dune height, the crest height, and the trough depth exhibited that the dune length followed a lognormal distribution, whereas the dune height followed Gamma and lognormal distributions for the two-dimensional and three-dimensional bedforms, respectively. The crest height and the trough depth followed normal and Gamma distributions, respectively. These findings provide a quantitative framework for predicting bedform evolution.
This study challenged the applicability of the traditional bedload transport formulas to dune bedforms and experimentally showed that the sediment transport rates calculated by these formulas significantly deviated from the measured values in the presence of dunes. A new bedload transport formula was proposed and derived from fitting the measured data using the nonlinear least squares method. This formula considers the relationship between bedload transport intensity and flow intensity, demonstrating high accuracy, with a comprehensive error of 0.016. This proposed formula is significant for improving the accuracy of the prediction of bedload transport rates.
At high flow intensities, mass bedload transport significantly contributes to increased bed resistance. The dune height was positively correlated with bed resistance, whereas the influence of dune length on bed resistance was less significant. Although the dune height did not consistently increase with rising flow intensity, the increase in bedload transport notably contributed to bed resistance. This insight is crucial for understanding and predicting the sediment transport capacity of rivers.

Author Contributions

Conceptualization, W.C.; methodology, X.G. and C.L.; formal analysis, X.G. and G.Z.; data curation, X.G. and G.Z.; writing—original draft preparation, X.G.; writing—review and editing, X.G., W.C., C.L. and G.Z.; supervision, C.L.; project administration, X.G., W.C. and C.L.; funding acquisition, X.G., W.C. and C.L. All authors have read and agreed to the published version of the manuscript.

Funding

This research was supported by the National Natural Science Foundation of China (Grant Nos.: U2243218; 12072373), the China Institute of Water Resources and Hydropower Research (IWHR) Research & Development Support Programs (SE0145B022021), and the Yellow River Institute of Hydraulic Research (YRIHR) Science & Technology Development Foundation (HKF202307).

Institutional Review Board Statement

Not applicable.

Informed Consent Statement

Not applicable.

Data Availability Statement

Data recorded in the current study are available in all tables and figures of the manuscript.

Acknowledgments

All the authors would like to thank the editor and the expert reviewers for their detailed comments and suggestion for the manuscript. These were very useful to hopefully improve the quality of the manuscript.

Conflicts of Interest

The authors declare no conflicts of interest.

References

  1. Ashley, G.M. Classification of large-scale subaqueous bedforms; a new look at an old problem. J. Sediment. Res. 1990, 60, 160–172. [Google Scholar]
  2. Kostaschuk, R. A field study of turbulence and sediment dynamics over subaqueous dunes with flow separation. Sedimentology 2000, 47, 519–531. [Google Scholar] [CrossRef]
  3. Julien, P.; Klaassen, G.; Ten Brinke, W.; Wilbers, A. Case study: Bed resistance of Rhine River during 1998 flood. J. Hydraul. Eng. 2002, 128, 1042–1050. [Google Scholar] [CrossRef]
  4. Wilbers, A. The Development and Hydraulic Roughness of Subaqueous Dunes; Utrecht University: Utrecht, The Netherlands, 2004. [Google Scholar]
  5. Van der Mark, C.; Blom, A.; Hulscher, S. Quantification of variability in bedform geometry. J. Geophys. Res. Earth Surf. 2008, 113, F03020. [Google Scholar] [CrossRef]
  6. Naqshband, S.; Hurther, D.; Giri, S.; Bradley, R.; Kostaschuk, R.; Venditti, J.; Hoitink, A. The influence of slipface angle on fluvial dune growth. J. Geophys. Res. Earth Surf. 2021, 126, e2020JF005959. [Google Scholar] [CrossRef]
  7. Engel, P.; Lau, Y.L. Computation of bed load using bathymetric data. J. Hydraul. Div. 1980, 106, 369–380. [Google Scholar] [CrossRef]
  8. Venditti, J.G.; Bennett, S.J. Spectral analysis of turbulent flow and suspended sediment transport over fixed dunes. J. Geophys. Res. Oceans 2000, 105, 22035–22047. [Google Scholar] [CrossRef]
  9. Coleman, S.; Nikora, V. Fluvial dunes: Initiation, characterization, flow structure. Earth Surf. Process. Landf. 2011, 36, 39–57. [Google Scholar] [CrossRef]
  10. Unsworth, C.; Parsons, D.; Hardy, R.; Reesink, A.; Best, J.; Ashworth, P.; Keevil, G. The impact of nonequilibrium flow on the structure of turbulence over river dunes. Water Resour. Res. 2018, 54, 6566–6584. [Google Scholar] [CrossRef]
  11. Best, J. The fluid dynamics of river dunes: A review and some future research directions. J. Geophys. Res. Earth Surf. 2005, 110, F04S02. [Google Scholar] [CrossRef]
  12. Shugar, D.H.; Kostaschuk, R.; Best, J.L.; Parsons, D.R.; Lane, S.N.; Orfeo, O.; Hardy, R.J. On the relationship between flow and suspended sediment transport over the crest of a sand dune, Río Paraná, Argentina. Sedimentology 2010, 57, 252–272. [Google Scholar] [CrossRef]
  13. Van Dijk, T.A.; Lindenbergh, R.C.; Egberts, P.J. Separating bathymetric data representing multiscale rhythmic bed forms: A geostatistical and spectral method compared. J. Geophys. Res. Earth Surf. 2008, 113, F04017. [Google Scholar] [CrossRef]
  14. Gutierrez, R.R.; Abad, J.D.; Parsons, D.R.; Best, J.L. Discrimination of bed form scales using robust spline filters and wavelet transforms: Methods and application to synthetic signals and bed forms of the Río Paraná, Argentina. J. Geophys. Res. Earth Surf. 2013, 118, 1400–1418. [Google Scholar] [CrossRef]
  15. Cisneros, J.; Best, J.; van Dijk, T.; Almeida, R.P.d.; Amsler, M.; Boldt, J.; Freitas, B.; Galeazzi, C.; Huizinga, R.; Ianniruberto, M. Dunes in the world’s big rivers are characterized by low-angle lee-side slopes and a complex shape. Nat. Geosci. 2020, 13, 156–162. [Google Scholar] [CrossRef]
  16. Wang, L.; Yu, Q.; Zhang, Y.; Flemming, B.W.; Wang, Y.; Gao, S. An automated procedure to calculate the morphological parameters of superimposed rhythmic bedforms. Earth Surf. Process. Landf. 2020, 45, 3496–3509. [Google Scholar] [CrossRef]
  17. Scheiber, L.; Lojek, O.; Götschenberg, A.; Visscher, J.; Schlurmann, T. Robust methods for the decomposition and interpretation of compound dunes applied to a complex hydromorphological setting. Earth Surf. Process. Landf. 2021, 46, 478–489. [Google Scholar] [CrossRef]
  18. Zomer, J.; Naqshband, S.; Hoitink, A. Short communication: A tool for determining multiscale bedform characteristics from bed elevation data. Earth Surf. Dyn. 2022, 10, 865–874. [Google Scholar] [CrossRef]
  19. Wren, D.G.; Kuhnle, R.A.; Langendoen, E.J. Sediment transport and bed-form characteristics for a range of step-down flows. J. Hydraul. Eng. 2020, 146, 04019060. [Google Scholar] [CrossRef]
  20. Rijn, L. Equivalent Roughness of Alluvial Bed. J. Hydraul. Div. ASCE 1982, 108, 1215–1218. [Google Scholar] [CrossRef]
  21. Lefebvre, A.; Winter, C. Predicting bed form roughness: The influence of lee side angle. Geo-Mar. Lett. 2016, 36, 121–133. [Google Scholar] [CrossRef]
  22. Schippa, L.; Cilli, S.; Ciavola, P.; Billi, P. Dune Contribution to Flow Resistance in Alluvial Rivers. Water 2019, 11, 2094. [Google Scholar] [CrossRef]
  23. Aberle, J.; Nikora, V.; Henning, M.; Ettmer, B.; Hentschel, B. Statistical characterization of bed roughness due to bed forms: A field study in the Elbe River at Aken, Germany. Water Resour. Res. 2010, 46. [Google Scholar] [CrossRef]
  24. Lee, J.; Musa, M.; Guala, M. Scale-dependent bedform migration and deformation in the physical and spectral domains. J. Geophys. Res. Earth Surf. 2021, 126, e2020JF005811. [Google Scholar] [CrossRef]
  25. Vittori, G.; Blondeaux, P. Predicting offshore tidal bedforms using stability methods. Earth-Sci. Rev. 2022, 235, 104234. [Google Scholar] [CrossRef]
  26. Meyer-Peter, E.; Müller, R. Formulas for bed-load transport. In Proceedings of the 2nd Meeting of the International Association for Hydraulic Structures Research, Delft, The Netherlands, 7 June 1948; pp. 39–64. [Google Scholar]
  27. Einstein, H.A. The Bed-Load Function for Sediment Transportation in Open Channel Flows; US Department of Agriculture: Washington, DC, USA, 1950.
  28. Bagnold, R.A. An Approach to the Sediment Transport Problem from General Physics; US Government Printing Office: Washington, DC, USA, 1966.
  29. Engelund, F.; Fredsøe, J. A sediment transport model for straight alluvial channels. Hydrol. Res. 1976, 7, 293–306. [Google Scholar] [CrossRef]
  30. Ackers, P.; White, W. Bed material transport: A theory for total load and its verification. In Proceedings of the International Symposium on River Sedimentation, Beijing, China, 24–29 March 1980. Paper B. [Google Scholar]
  31. Garcia, M. Sedimentation Engineering: Processes, Measurements, Modeling, and Practice; American Society of Civil Engineers: Reston, VA, USA, 2008. [Google Scholar]
  32. Poorhosein, M.; Afzalimehr, H.; Sui, J.; Singh, V.P.; Azareh, S. Empirical bed load transport equations. Int. J. Hydraul. Eng. 2014, 3, 93–101. [Google Scholar]
  33. Guala, M.; Heisel, M.; Singh, A.; Musa, M.; Buscombe, D.; Grams, P. A mixed length scale model for migrating fluvial bedforms. Geophys. Res. Lett. 2020, 47, e10.1029/2019GL086625. [Google Scholar] [CrossRef]
  34. Ancey, C. Bedload transport: A walk between randomness and determinism. Part 1. The state of the art. J. Hydraul. Res. 2020, 58, 1–17. [Google Scholar] [CrossRef]
  35. Ancey, C. Bedload transport: A walk between randomness and determinism. Part 2. Challenges and prospects. J. Hydraul. Res. 2020, 58, 18–33. [Google Scholar] [CrossRef]
  36. Bridge, J.S. The interaction between channel geometry, water flow, sediment transport and deposition in braided rivers. Geol. Soc. Lond. Spec. Publ. 1993, 75, 13–71. [Google Scholar] [CrossRef]
  37. Talebbeydokhti, B.N.; Hekmatzadeh, A.; Rakhshandehroo, G.R. Experimental modeling of dune bed form in a sand-bed channel. Iran. J. Sci. Technol. Trans. B Eng. 2006, 30, 503–516. [Google Scholar]
  38. Lefebvre, A.; Ernstsen, V.B.; Winter, C. Estimation of roughness lengths and flow separation over compound bedforms in a natural-tidal inlet. Cont. Shelf Res. 2013, 61, 98–111. [Google Scholar] [CrossRef]
  39. Zomer, J.Y.; Vermeulen, B.; Hoitink, A.J. Coexistence of two dune scales in a lowland river. Earth Surf. Dyn. Discuss. 2023, 2023, 1283–1298. [Google Scholar] [CrossRef]
  40. Yuhong, Z.; Wenxin, H. Application of artificial neural network to predict the friction factor of open channel flow. Commun. Nonlinear Sci. Numer. Simul. 2009, 14, 2373–2378. [Google Scholar] [CrossRef]
  41. Brakenhoff, L.; Schrijvershof, R.; van der Werf, J.; Grasmeijer, B.; Ruessink, G.; van der Vegt, M. From ripples to large-scale sand transport: The effects of bedform-related roughness on hydrodynamics and sediment transport patterns in delft3d. J. Mar. Sci. Eng. 2020, 8, 892. [Google Scholar] [CrossRef]
  42. Cho, J.; Nelson, P.A. Patterns of alluviation in mixed bedrock-alluvial channels: 2. Controls on the formation of alluvial patches. J. Geophys. Res. Earth Surf. 2024, 129, e2023JF007293. [Google Scholar] [CrossRef]
  43. Mir, A.A.; Patel, M. Machine learning approaches for adequate prediction of flow resistance in alluvial channels with bedforms. Water Sci. Technol. 2024, 89, 290–318. [Google Scholar] [CrossRef]
  44. Cho, J.; Nelson, P.A. Patterns of alluviation in mixed bedrock-alluvial channels: 1. Numerical model. J. Geophys. Res. Earth Surf. 2024, 129, e2023JF007292. [Google Scholar] [CrossRef]
  45. Smith, M.W. Roughness in the earth sciences. Earth-Sci. Rev. 2014, 136, 202–225. [Google Scholar] [CrossRef]
  46. Bradley, R.W.; Venditti, J.G. Mechanisms of dune growth and decay in rivers. Geophys. Res. Lett. 2021, 48, e2021GL094572. [Google Scholar] [CrossRef]
  47. Du Boys, M. The Rhone and streams with movable beds. Ann. Des Pontes Chaussees 1879, 18, 141–195. [Google Scholar]
  48. Chien, N.; Wan, Z. Mechanics of Sediment Transport; American Society of Civil Engineers: Reston, VA, USA, 1999. [Google Scholar]
  49. Chien, N. A Comparison of the Bed Load Formulas. J. Hydraul. Eng. 1980, 1–11. [Google Scholar]
  50. Nordin, C.F. Statistical Properties of Dune Profiles; US Government Printing Office: Washington, DC, USA, 1971.
  51. Wang, W.; Shen, H. Statistical properties of alluvial bed forms. In Proceedings of the 3rd International Symposium on Stochastic Hydraulics, Tokyo, Japan, 5–7 August 1980; pp. 371–389. [Google Scholar]
  52. Annambhotla, V.S.; Sayre, W.W.; Livesey, R.H. Statistical properties of Missouri River bed forms. J. Waterw. Harb. Coast. Eng. Div. 1972, 98, 489–510. [Google Scholar] [CrossRef]
  53. Leclair, S.F.; Bridge, J.S.; Wang, F. Preservation of cross-strata due to migration of subaqueous dunes over aggrading and non-aggrading beds: Comparison of experimental data with theory. Geosci. Can. 1997, 24. [Google Scholar]
  54. Prent, M.T.; Hickin, E.J. Annual regime of bedforms, roughness and flow resistance, Lillooet River, British Columbia, BC. Geomorphology 2001, 41, 369–390. [Google Scholar] [CrossRef]
  55. Sternberg, R.W. Predicting Initial Motion and Bedload Transport of Sediment Particles in the Shallow Marine Environment; University of Washington Press: Seattle, WA, USA, 1971. [Google Scholar]
  56. Yang, C.S. On Bagnold’s sediment transport equation in tidal marine environments and the practical definition of bedload. Sedimentology 1986, 33, 465–486. [Google Scholar] [CrossRef]
  57. Van den Berg, J.H. Bedform migration and bed-load transport in some rivers and tidal environments. Sedimentology 1987, 34, 681–698. [Google Scholar] [CrossRef]
  58. Naqshband, S.; Hoitink, A.; McElroy, B.; Hurther, D.; Hulscher, S.J. A sharp view on river dune transition to upper stage plane bed. Geophys. Res. Lett. 2017, 44, 11437–11444. [Google Scholar] [CrossRef]
  59. Leary, K.C.; Buscombe, D. Estimating sand bed load in rivers by tracking dunes: A comparison of methods based on bed elevation time series. Earth Surf. Dyn. 2020, 8, 161–172. [Google Scholar] [CrossRef]
  60. Lokin, L.; Warmink, J.; Bomers, A.; Hulscher, S. River dune dynamics during low flows. Geophys. Res. Lett. 2022, 49, e2021GL097127. [Google Scholar] [CrossRef]
  61. Lefebvre, A.; Cisneros, J. The influence of dune lee side shape on time-averaged velocities and turbulence. Earth Surf. Dyn. 2023, 11, 575–591. [Google Scholar] [CrossRef]
  62. Wang, S.; White, W.R. Alluvial resistance in transition regime. J. Hydraul. Eng. 1993, 119, 725–741. [Google Scholar] [CrossRef]
  63. Kostaschuk, R. Sediment Transport Mechanics and Subaqueous Dune Morphology; Cambridge University Press: Cambridge, UK, 2006. [Google Scholar]
  64. Naqshband, S.; Ribberink, J.S.; Hulscher, S.J. Using both free surface effect and sediment transport mode parameters in defining the morphology of river dunes and their evolution to upper stage plane beds. J. Hydraul. Eng. 2014, 140, 06014010. [Google Scholar] [CrossRef]
  65. Latella, M.; Notti, D.; Baldo, M.; Giordan, D.; Camporeale, C. Short-term biogeomorphology of a gravel-bed river: Integrating remote sensing with hydraulic modelling and field analysis. Earth Surf. Process. Landf. 2024, 49, 1156–1178. [Google Scholar] [CrossRef]
  66. Sharifi, M.; Tabatabai, M.R.M.; Najafabadi, S.H.G. Numerical simulation of flow structures over dunes to develop an empirical relationship for separation zone dimensions. Flow Meas. Instrum. 2023, 89, 102275. [Google Scholar] [CrossRef]
  67. Bassi, A.; Mir, A.A.; Kumar, B.; Patel, M. A comprehensive study of various regressions and deep learning approaches for the prediction of friction factor in mobile bed channels. J. Hydroinform. 2023, 25, 2500–2521. [Google Scholar] [CrossRef]
Figure 1. Schematic of experiment flume.
Applsci 14 09823 g001
Figure 2. Cumulative sediment curve of experiment sand.
Applsci 14 09823 g002
Figure 3. Illustration of scanning range of scanner and obstruction by bedforms. (a) Bedform measurement in flume, upside down scanner, and target spheres, and (b) illustration of scanning range of scanner and obstruction by dunes.
Applsci 14 09823 g003
Figure 4. Schematic diagram of the longitudinal and cross-sectional features of the 2D and 3D bedforms. (a,b) represents the longitudinal and cross-sectional profiles of the 2D bedform, respectively, while (c,d) represents the longitudinal and cross-sectional profiles of the 3D bedform.
Applsci 14 09823 g004
Figure 5. A schematic diagram of the relative positions of the bedform parameters.
Applsci 14 09823 g005
Figure 6. Probability density distribution of dune length. (ad) probability density distributions of dune length of 2D bedforms, and (eh) probability density distributions of dune length of 3D bedforms.
Applsci 14 09823 g006
Figure 7. Probability density distribution of dune height. (a,b) probability density distributions of dune height of 2D bedforms, (c,d) probability density distributions of dune height of 3D bedforms.
Applsci 14 09823 g007
Figure 8. Probability density distributions of crest height and trough depth. (a,b) represent 2D bedforms, and (c,d) represent 3D bedforms.
Applsci 14 09823 g008
Figure 9. Comparison of measured and calculated bedload transport rates.
Applsci 14 09823 g009
Figure 10. Relationship between dune morphology parameters and bed resistance. (a) J = 1‰, (b) J = 2‰, and (c) J = 4‰.
Applsci 14 09823 g010
Figure 11. Relationship between bedload transport intensity and bed resistance.
Applsci 14 09823 g011
Table 1. Parameters of each experiment under movable-bed conditions.
JNo.QhuFrReu*gb
l/scmm/s×104cm/skg/m/min
1‰1307.860.3820.4352.592.5810.042
2409.560.4180.4323.362.8060.108
35011.080.4510.4334.092.9830.216
46012.880.4660.4154.773.1700.354
57014.500.4830.4055.433.3210.421
68016.740.4780.3735.993.5080.503
79018.640.4830.3576.563.6500.485
2‰8306.820.4400.5382.643.4310.401
9408.680.4610.4993.413.8090.775
105010.860.4600.4464.114.1840.898
116012.190.4920.4504.824.3851.105
127013.550.5170.4485.514.5731.380
138015.250.5250.4296.134.7881.561
149016.430.5480.4316.774.9261.920
4‰15305.520.5430.7392.704.4171.807
16407.000.5710.6903.514.9092.214
17508.650.5780.6274.265.3792.896
18609.460.6340.6585.055.5873.609
197010.500.6670.6575.795.8354.262
208011.920.6710.6216.466.1464.598
219013.110.6860.6057.136.3844.572
In this table, No. represents the test number; Q denotes the flow rate, l/s; h indicates the water depth, cm; u denotes the average flow velocity, m/s; Fr denotes the Froude number; Re represents the Reynolds number; u* represents the friction velocity, cm/s; and gb denotes the streamwise sediment transport rate, kg/m/min.
Table 2. Parameters of dune length distributions for different bedforms.
Statistic2D Bedforms3D Bedforms
Distribution FormDistribution ParametersDistribution FormDistribution Parameters
Log Mean (μ)Log Standard Deviation (σ)Log Mean (μ)Log Standard Deviation (σ)
LcLognormal−0.2050.595Lognormal−0.0910.432
LtLognormal−0.1500.524Lognormal−0.0970.446
LupcrLognormal−0.1900.580Lognormal−0.1150.488
LdowncrLognormal−0.2470.622Lognormal−0.0960.445
Table 3. Parameters of dune height distributions for different bedforms.
Statistic2D Bedforms3D bedforms
Distribution FormDistribution ParametersDistribution FormDistribution Parameters
Shape Parameter (α)Scale Parameter (β)Log Mean (μ)Log Standard Deviation (σ)
ΔsGamma15.1850.066Lognormal−0.0840.420
ΔlGamma15.6100.064Lognormal−0.0630.358
Table 4. Parameters of crest height and trough depth distributions for different bedforms.
Statistic2D Bedforms3D Bedforms
Distribution FormDistribution ParametersDistribution FormDistribution Parameters
Mean
(μ)
Standard Deviation
(σ)
Shape Parameter
(α)
Scale Parameter
(β)
ηcNormal1.00.334Gamma4.9060.204
ηtNormal1.00.416Gamma3.0830.324
Disclaimer/Publisher’s Note: The statements, opinions and data contained in all publications are solely those of the individual author(s) and contributor(s) and not of MDPI and/or the editor(s). MDPI and/or the editor(s) disclaim responsibility for any injury to people or property resulting from any ideas, methods, instructions or products referred to in the content.

