Article

Comparing Virtual and Real-Life Rapid Prototyping Methods for User Testing Smart City Interfaces: A Case Study

1
Department of Industrial Systems Engineering and Product Design, imec-mict-UGent, 9000 Ghent, Belgium
2
Department of Social Sciences, imec-mict-UGent, 9000 Ghent, Belgium
3
Department of Product development, Faculty of Design Sciences, University of Antwerp, 2000 Antwerp, Belgium
*
Author to whom correspondence should be addressed.
Appl. Sci. 2024, 14(21), 9918; https://doi.org/10.3390/app14219918
Submission received: 15 July 2024 / Revised: 23 August 2024 / Accepted: 17 October 2024 / Published: 30 October 2024

Abstract

:

Featured Application

This research can be used for future designers and developers who aim to integrate Virtual Reality into their product development workflow.

Abstract

In the development of complex embedded interactive systems, a tension arises between, on the one hand, ever shorter and highly iterative design processes, and, on the other hand, the need for user testing with early prototypes to validate systems from a user-centred design perspective. This study focuses on the integration of Virtual Reality (VR) into prototyping embedded interactive systems, examining its potential to bridge the gap between rapid prototyping and user-centered design validation. Adopting a comparative research approach, we analyze a case study: the development of a cultural smart city experience. It juxtaposes in situ, low-fidelity prototype testing with VR-based testing, evaluating their realism, interactivity, functionality, presence and task difficulty. This mixed-method research design incorporates both qualitative and quantitative methodologies, engaging 27 design students in a comparative study, conducting participatory research and 8 expert interviews. These findings reveal divergent roles in field testing and VR in the new product development process, highlighting VR’s strengths in visualizing procedures and facilitating discussion. This study identifies the limitations of VR in mimicking realistic interactions and incorporating social context yet underscores its superiority over paper prototypes in its realism and interactivity. Where field testing can hold broader contextual insights, the VR prototype gives more concrete and applied insights. The main advantage of VR testing is its visualisation of procedures and its final materialisation according to the participants interviewed. According to the experts interviewed, VR can be used as a useful tool within the development process especially for visualisation and testing user flows of complex interfaces.

1. Introduction

Prototypes are viewed as an essential part of user-centered design and testing. One major challenge is the difficulty in developing larger interactive prototypes facilitating complex interactions in the early stages of the design trajectory. This hampers iterative prototyping and testing cycles [1]. Therefore, it is hard to communicate these prototypes to the relevant stakeholders [2,3]. They are essential because quick and cheap materialisations make the validation of assumptions possible at an early stage [4]. The need for early testing is also indicated by the increased interest in new development models, such as Agile UX models and Lean Product Development [5,6]. Existing prototyping tools and methods are mostly based on screen-based interactions such as those with laptops, tablets and smartphones. This makes prototyping for complex systems difficult because they are embedded in a non-existing context (e.g., smart hospital, smart factory line, etc.). The more this context matters, the more important ecological validity becomes in prototyping and testing activities [7,8]. Neurological processes should be developed and tested in ecological contexts [9]. Virtual prototypes use VR for creating immersive representations of a product. As technology advances, VR is becoming an increasingly interesting option for the simulation and manipulation of this context. An existing study by Maurya [10] dug into this research already but has neglected to focus on one specific NPD (New Product Development) process. For this reason, the present methodological paper investigates systematically how VR prototypes can help in the design process of new interfaces with an NPD process focusing on a smart city application. We focused on the comparison of two evaluation methods used in one NPD where the role of VR was considered. In the early stage, testing in the field (TIF) with low-fidelity prototypes was evaluated. At the end of the NPD cycle, the finished product was evaluated. The application of VR testing (VRT) was hypothesised in the middle stage of the NPD cycle and compared to both of the evaluation methods. Specifically, its realism, presence, interactivity, functionality and task difficulty were analysed as partial aspects.

1.1. Low-Fidelity Prototypes for In Situ Testing

Studying prototyping methods comparatively [11] requires a clear definition of each method that is used. The definition of low-fidelity prototyping used in this study was formulated by Sefelin [11]: “…Low-fidelity prototyping, as we understand it, is the visualization of design ideas at early stages of the design process. The result is a prototype which is simple and whose development does not need very much time. It may be developed using paper and other “low-fidelity-materials” or using any user-friendly programming tool…”. In contrast, high-fidelity prototyping can be defined as: “…computer-based, and usually allow realistic (mouse-keyboard) user interactions. High-fidelity prototypes take you as close as possible to a true representation of the user interface. High-fidelity prototypes are assumed to be much more effective in collecting true human performance data (e.g., time to complete a task), and in demonstrating actual products to clients, management, and others [12]”. Goel emphasizes that high-fidelity prototypes offer more interaction [13]. Traditional low-fidelity prototyping, such as paper models, is currently used in design education and shows limitations in terms of realism and user interaction. When feedback is necessary early in the process, Liikanen states that it is always a good idea to test early materialisations of a product with the target user group [14]. Furthermore, low-fidelity prototypes are best tested in the field to account for the external validity of its concept. There are many benefits to in situ testing such as revealing implicit usability problems, extended periods of test sessions, realistic tasks, and homeliness to the environment [15]. However, testing in the field has several drawbacks. In the first place, organising transportation can be a tedious task, especially when transporting large prototypes or when travelling to remote locations. A recent study by Kang evaluates the role of paper prototyping in combination with augmented reality (AR); she specifically points to the difficulties of requirement elicitation in low-fidelity prototypes [16].
A goal of this research is to evaluate how valuable the environment is in testing in situ in the early stage of the development process. There is ample research on comparing in situ testing with in vitro testing. Kaikkonen [17] argues that testing in the field may be time consuming but can hold insights on how the user behaves in the context of use. A recent study by Marcilly [18] points to the benefits of early low-fidelity testing. However, in the case of physical prototyping, testing in situ remains expensive, e.g., Morphome [19] built proactive systems and devices, installed these systems into homes, and interviewed and observed the people who used them [17]. This approach lends itself to utilising the elements of participatory research. In the new field of participatory research, reflection and action are carried out in a sequential manner to collect local knowledge. This forms the basis for research and planning. Moreover, these steps are carried out with and by local people rather than on them [20]. In another study, Ali [21] argues that although low fidelity plays a central role to design, little attention is geared at understanding low-fidelity prototyping itself. For lo-fi prototypes to be successful, they should evoke scenarios of the future, tell stories and communicate a vision for the future. High-fidelity prototypes for validation testing offer the most realistic experiences. Their role is simulating experiences that are as close to reality as possible, after general ideas have been challenged and fundamental choices have been made.

1.2. Virtual Prototyping and Testing in the Lab

The collaborative effectiveness of AR, studied by Wang and Chen [22], revealed that AR holds significant potential for user testing. The communicative effectiveness of paper- based media appeared lower in comparison to AR communication when it came to working with multiple stakeholders. This finding is reiterated by Russo [23] in a more recent study, stating that AR deepens this topic and stimulates a democratization process. Kandi [24] researched, in the domain of construction engineering education, how VR technologies are impacting design skills. VR showed benefits such as improved communication, user involvement and feedback. Their data indicated that using VR in combination with 2D drawings resulted in larger knowledge insights compared to using the drawings on their own. VR technology can address these challenges by providing a more dynamic and flexible learning environment. Interestingly, virtual prototyping in the lab might resolve the tedious [25] and price-related aspects attributed to physical prototyping and testing in the field. A common definition for virtual prototyping was posed by Seth [26]: “Virtual Prototyping (VP) is a relatively new technology which involves the use of Virtual Reality (VR) and other computer technologies to create digital prototypes”. Central to this definition is the use of VR for virtual prototyping. VR tools can be utilised as a design validation tool by the designer. Here, designers use VR to check whether their design makes sense on a 1:1 scale. Many of these design-oriented tests are situated in the domain of car design, architectural design, system design and engineering. These brief tests are used as reassurance rather than to collect user insights [27]. More recent research highlights the potential of the usage of VR over the entire development process [28], highlighting its potential in aesthetic evaluation, usability and market testing. G. G. Wang [29] posed an even more specific and relevant definition for virtual prototyping: “By virtual prototyping, we refer to the process of simulating the user, the product, and their combined (physical) interaction in software through the different stages of product design, and the quantitative performance analysis of the product”. Alternatively, VR could be utilised as a tool to validate and cocreate designs with other uninformed users as well. In modern days, the designer takes up the role of an evaluator while working on projects. There has been ample research focusing on the transition between designer and end-user evaluation [30]. Generally, tests are performed in this stage because the situation or product is difficult to (re)create, is dangerous or is unavailable [31]. The results of these types of experiments are mostly of a quantitative nature and have used statistics to validate their claims. The goal of this study is to evaluate how useful simulating the environment is when testing in the early stage of a development process. The use of virtual reality carries potential downsides, including the risk of inducing negative effects such as spatial disorientation [32] and visual fatigue [33]. These drawbacks make virtual reality a less appealing option for extended tests or experiences involving dynamic environments and significant physical movement.

1.3. High-Fidelity Prototypes for Validation Testing

Even more realistic than VR testing is performing high-fidelity tests with the near-final product. A high-fidelity test would give more insights into user behaviour compared to the evaluation methods mentioned earlier. Normally, a product evaluation is performed against competitor products, as in the research of Zhou [34]. However, since there is no competitor product at hand, evaluations were conducted as a system review and a usability test at the end of the development process. Qualitative measurements were established using a semi-structured interview with the experts involved in the project. Mukherjee researched how people receive novel product attributes [35] and its effect on product evaluation. He argues that the introduction of novel (smart) attributes can improve product evaluation but only for low-complexity products. We also expect usability problems when this new interface becomes too complex for novel users. However, it remains interesting to analyse novel attributes through virtual or paper media. To obtain a better grip on the user experience during testing in the field, virtual reality testing and final prototype testing, several metrics are applied, the main dimensions being control vs. validity, presence and realism, functionality and interactivity and the role within the NPD. These aspects resemble the approach to the research of Walker [36] and Zhou [34], analyzing user experience comparing conditions using multiple measures.

1.4. Evaluating VR Prototyping

In this study, we compare VR to non-VR prototyping in different ways, firstly focusing on experimental control and external validity in order to receive valuable insights into the user experience. The testing of contextual realism as a metric of external validity was viewed through the context framework of Calder [37]. In their research, external validity is defined as whether an observed causal relationship should be generalized to and across different measures, persons, settings and times. For this purpose, the field test and context in VR were introduced. In his paper, Kjeldskov [38] defines realism and control as two major trade-offs when testing in situ or in vitro. Related to this, Peeters [39] uses a graph for mapping research methods in respect to these two major trade-offs (see Figure 1). The blue rectangles indicate the hypothesised mapping of the research techniques discussed in this study: testing in the field (TIF) and virtual reality testing (VRT). This study envisions VRT to cause more experimental control compared to TIF. Also, VRT should allow similar levels of ecological validity compared to TIF.
Next, to control the validity, other important aspects of VR are the presence and realism of VR experiences. The optimisation of these aspects sees continuous improvement in correspondence with the development of VR technology throughout the years. For one, the visual fidelity of headsets has been improving and the production cost of lenses implemented in these headsets is becoming cheaper. Also related to the hardware development of VR technology, immersive interaction (hand tracking) and motion tracking (full body tracking) are becoming more available. This results in more accurate depictions of virtual avatars and richer interaction possibilities. Together with the improved lenses, higher rendering quality and more immersive interaction/tracking, the level of realism keeps improving. This study borrows its definition of realism from Lipp [40]. According to her, realism can be broken down into four relevant features: scene realism, audience behaviour, audience appearance and sound realism. This research mainly targets scene realism. The perceived realism can be measured using the six-item questionnaire developed by Lipp [40]. These questions were adapted for the depiction of realism in films to virtual reality. The participants indicated the degree to which they perceived each of the six elements using a response scale that varied from 0 (no, not at all) to 10 (yes, entirely). In accordance with the definition of scene realism by Lipp [40], this study hypothesises that the VR prototype is more realistic compared to the low-fidelity prototype tested in the field.
Closely related to realism is the level of presence a user experiences while being in VR. A modern definition is proposed by Slater [41]: “Presence within the context of virtual reality is defined as one’s sense of being in the virtual world. The illusion is perceptual but not cognitive, as the perceptual system identifies the events and objects and the brain-body system automatically reacts to the changes in the environment, while cognitive system slowly responds with a conclusion of what the person experiences is an illusion”. Schwind [42] developed a presence scale for use in VR applications. In line with this, we hypothesised that the participants felt more present when using the VR prototype compared to the low-fidelity prototype.
Interactivity means, according to Steuer [43], “The degree to which users of a medium can influence the form or content of the mediated environment.” To facilitate interaction, interactive prototypes must be built. Before VR prototyping, prototypes were mainly electronic or screen-based prototypes. These fulfil the need for a functional prototype. This means providing the visual appearance in combination with the intended design. Nowadays, the same results could be established using VR prototypes, which are much more cost efficient and immersive (meaning that they can provide the right context more easily). The questions used to research interactivity originated from the research of Mütterlein [44]. Mutterlein poses that presence and interactivity lead to immersion. His findings indicate that interactivity has a direct positive influence on presence and immersion. We hypothesise that the participant experiences more interactivity when using the VR prototype compared to the low-fidelity prototype, and therefore is more immersed in the experience.
Related to interactivity is the level of functionality experienced when testing out a prototype. Functionality in this paper is approached as applied with the mobile application rating scale (MARS) [45]. It can be subdivided into performance, ease of use, navigation and gestural design. Functionality resembles, in this case, the extent to which a user can perform tasks with the prototype. The key is utility, which refers to the design’s functionality. In simple terms, does it do what the user needs? In this research we hypothesised that the participants experienced better functionality when using the VR prototype compared to the low-fidelity prototype.
Usability is a quality attribute that assesses how easy user interfaces are to use. A clear depiction of this can be found in Aaron Walter’s pyramid, which he used for Designing for Emotion [46]. He states that prototypes start in a functional stage, but user experience can be incrementally elevated to reliable, usable and pleasurable stages. According to Nielsen Norman Group, the word “usability” also refers to methods for improving ease-of-use during the design process [47]. The usability domain originated from the ethnology and was later followed by psychologists. In a later stage, digital usability became relevant for software development. Usability is defined by five quality components: learnability, efficiency, memorability, errors and satisfaction. This study focused on gaining more insight into user satisfaction. Specifically, the ASQ covers the rating of the ease of the task, the amount of time the task took to complete, and the level of support received throughout the process [48]. More specifically, it focuses on task difficulty. Task difficulty reflects the overall difficulty of the scenario, in turn leading to insights in usability. As a starting point, we hypothesise that the participant experienced less task difficulty when using the VR prototype compared to the low-fidelity prototype.
From Nielsen’s [49] mapping methods (Table 1), we learn that design-related user research methods serve a purpose as formative tools and the methods for launch and assessment serve a purpose as summative tools. Under formative methods, we understand an ongoing, iterative type of testing [50]. This reflects itself in concept testing, interviews and field studies. Meanwhile, summative evaluation is used to measure and compare results [50]. This reflects itself in comparative usability benchmarking and unmoderated UX testing. In this research is it important to analyse usability in both a formative and more summative way. Low-fidelity prototype testing was used in the field as a formative evaluation method (testing in the field referred to as TIF), where VR (virtual reality testing referred to as VRT) and the testing of the final product (referred to as FP) were more summative evaluation methods. A proposed mapping can be seen in Table 1 and Figure 2. Qualitative methods were used to analyse the place in the NPD wherein the field testing and VR testing fit. To structure this design process, we applied the product innovation cycle of Pahl and Beitz [51] which can be seen in Figure 2. We hypothesised that virtual reality testing fits most in the embodiment phase in the product innovation cycle of Pahl and Beitz compared to testing in the field earlier in the conceptual design phase (final product at the end of detail design). As stated by Cross [52], design methods are still based on the approach of Pahl and Beitz today. Cross also highlights that design generation should keep in mind both the problem and proposed solution at the same time.

2. Method

2.1. Use Case

The project emerges from the use case of the smart city application of “the CoGent box”. The goal of the CoGent project is to make the collection of cultural heritage accessible for suburban residents. The idea was to create a shipping container-sized box that travels to remote parts of the city to inspire civilians and connect with the heritage of their specific neighbourhood. The use of VR in this project was specifically useful because of the spatial aspect of the CoGent box. Also, since the project had many different project partners, VR could be used as a visualisation method (see Figure 3a) for internal use as well before the final set-up was built (see Figure 3b,c).

2.2. Testing Protocol

The main goal of this explorative research is to gain insight into how VR prototype applications can help in the design process of new interfaces. In the first place, we focus on a comparison between the differences in testing in the field and VR testing. A mixed method comparative study was conducted applying low-fidelity (TIF) and VR (VRT) prototyping and testing. This was conducted within the cycle-wise design process of the new technological interfaces within the CoGent box. At the end, an evaluation of the final product (FP) was performed as well.
At the end of each test a questionnaire focusing on the experience of the participant and their view through the lens of an experimenter followed. Several questionnaires were used such as the system usability scale, a questionnaire with specific questions on immersion, a questionnaire surveying perceived testability and a questionnaire surveying the participants’ opinion on the interfaces. Complementary to the research, opinions of the experimenter and developer roles are included in the result section. The questionnaire data are publicly available in an OSF repository (https://osf.io/vqjdr/?view_only=66e1426d95b64feeaf4644b4592053e5) (accessed on 16 April 2024).

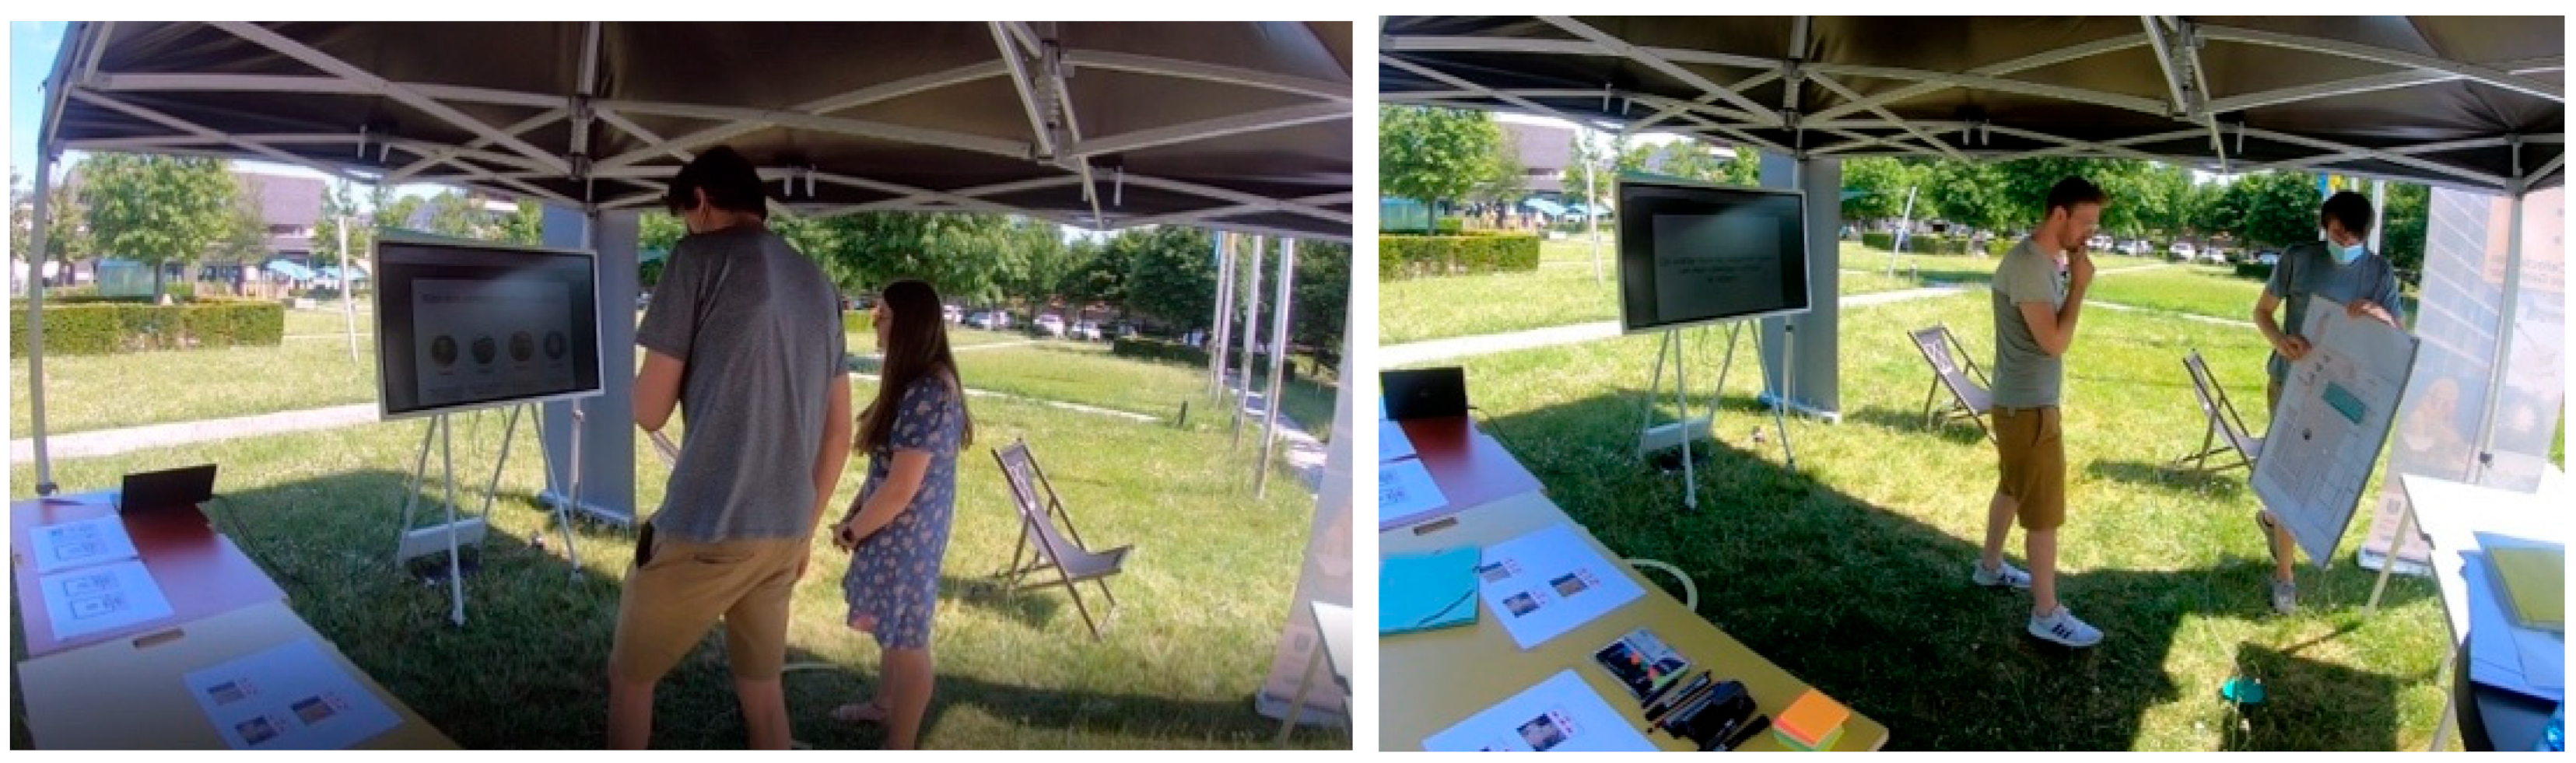
2.3. Physical Prototyping and Testing in the Field (TIF)

In the first phase, the tests were executed in an ‘in vivo’ context specifically located in the place where the CoGent box would be placed. A test set-up was deployed in this location to evaluate these interactions with the final audience in their expected environment (see Figure 4). These tests were performed in June 2021. The tools used were Figma on a touch screen and cardboard prototyping, and touchless interaction was tested using leap motion. It took little time to create the prototypes. The time and effort regarding the prototyping and testing were four workdays (2 days for the prototype, 2 days for transportation and testing). The three interactions were represented by low-fidelity prototypes. The test we performed within this field lab was multi-faceted. First, we introduced the CoGent box by explaining the concept, showing images and renders. Then, we introduced the participants to their first interaction. This was a circle on the floor that the participants could follow around between the interfaces used for spatial guidance. Subsequently, the participants explored the three interfaces using novel types of interactions, specifically gestural, foot-activated and walk-along interactions. During the test, the participants were asked to provide feedback by means of the think aloud protocol [53] about their interactions, and their comments were recorded using a GoPro camera. This feedback was transcribed and analysed.

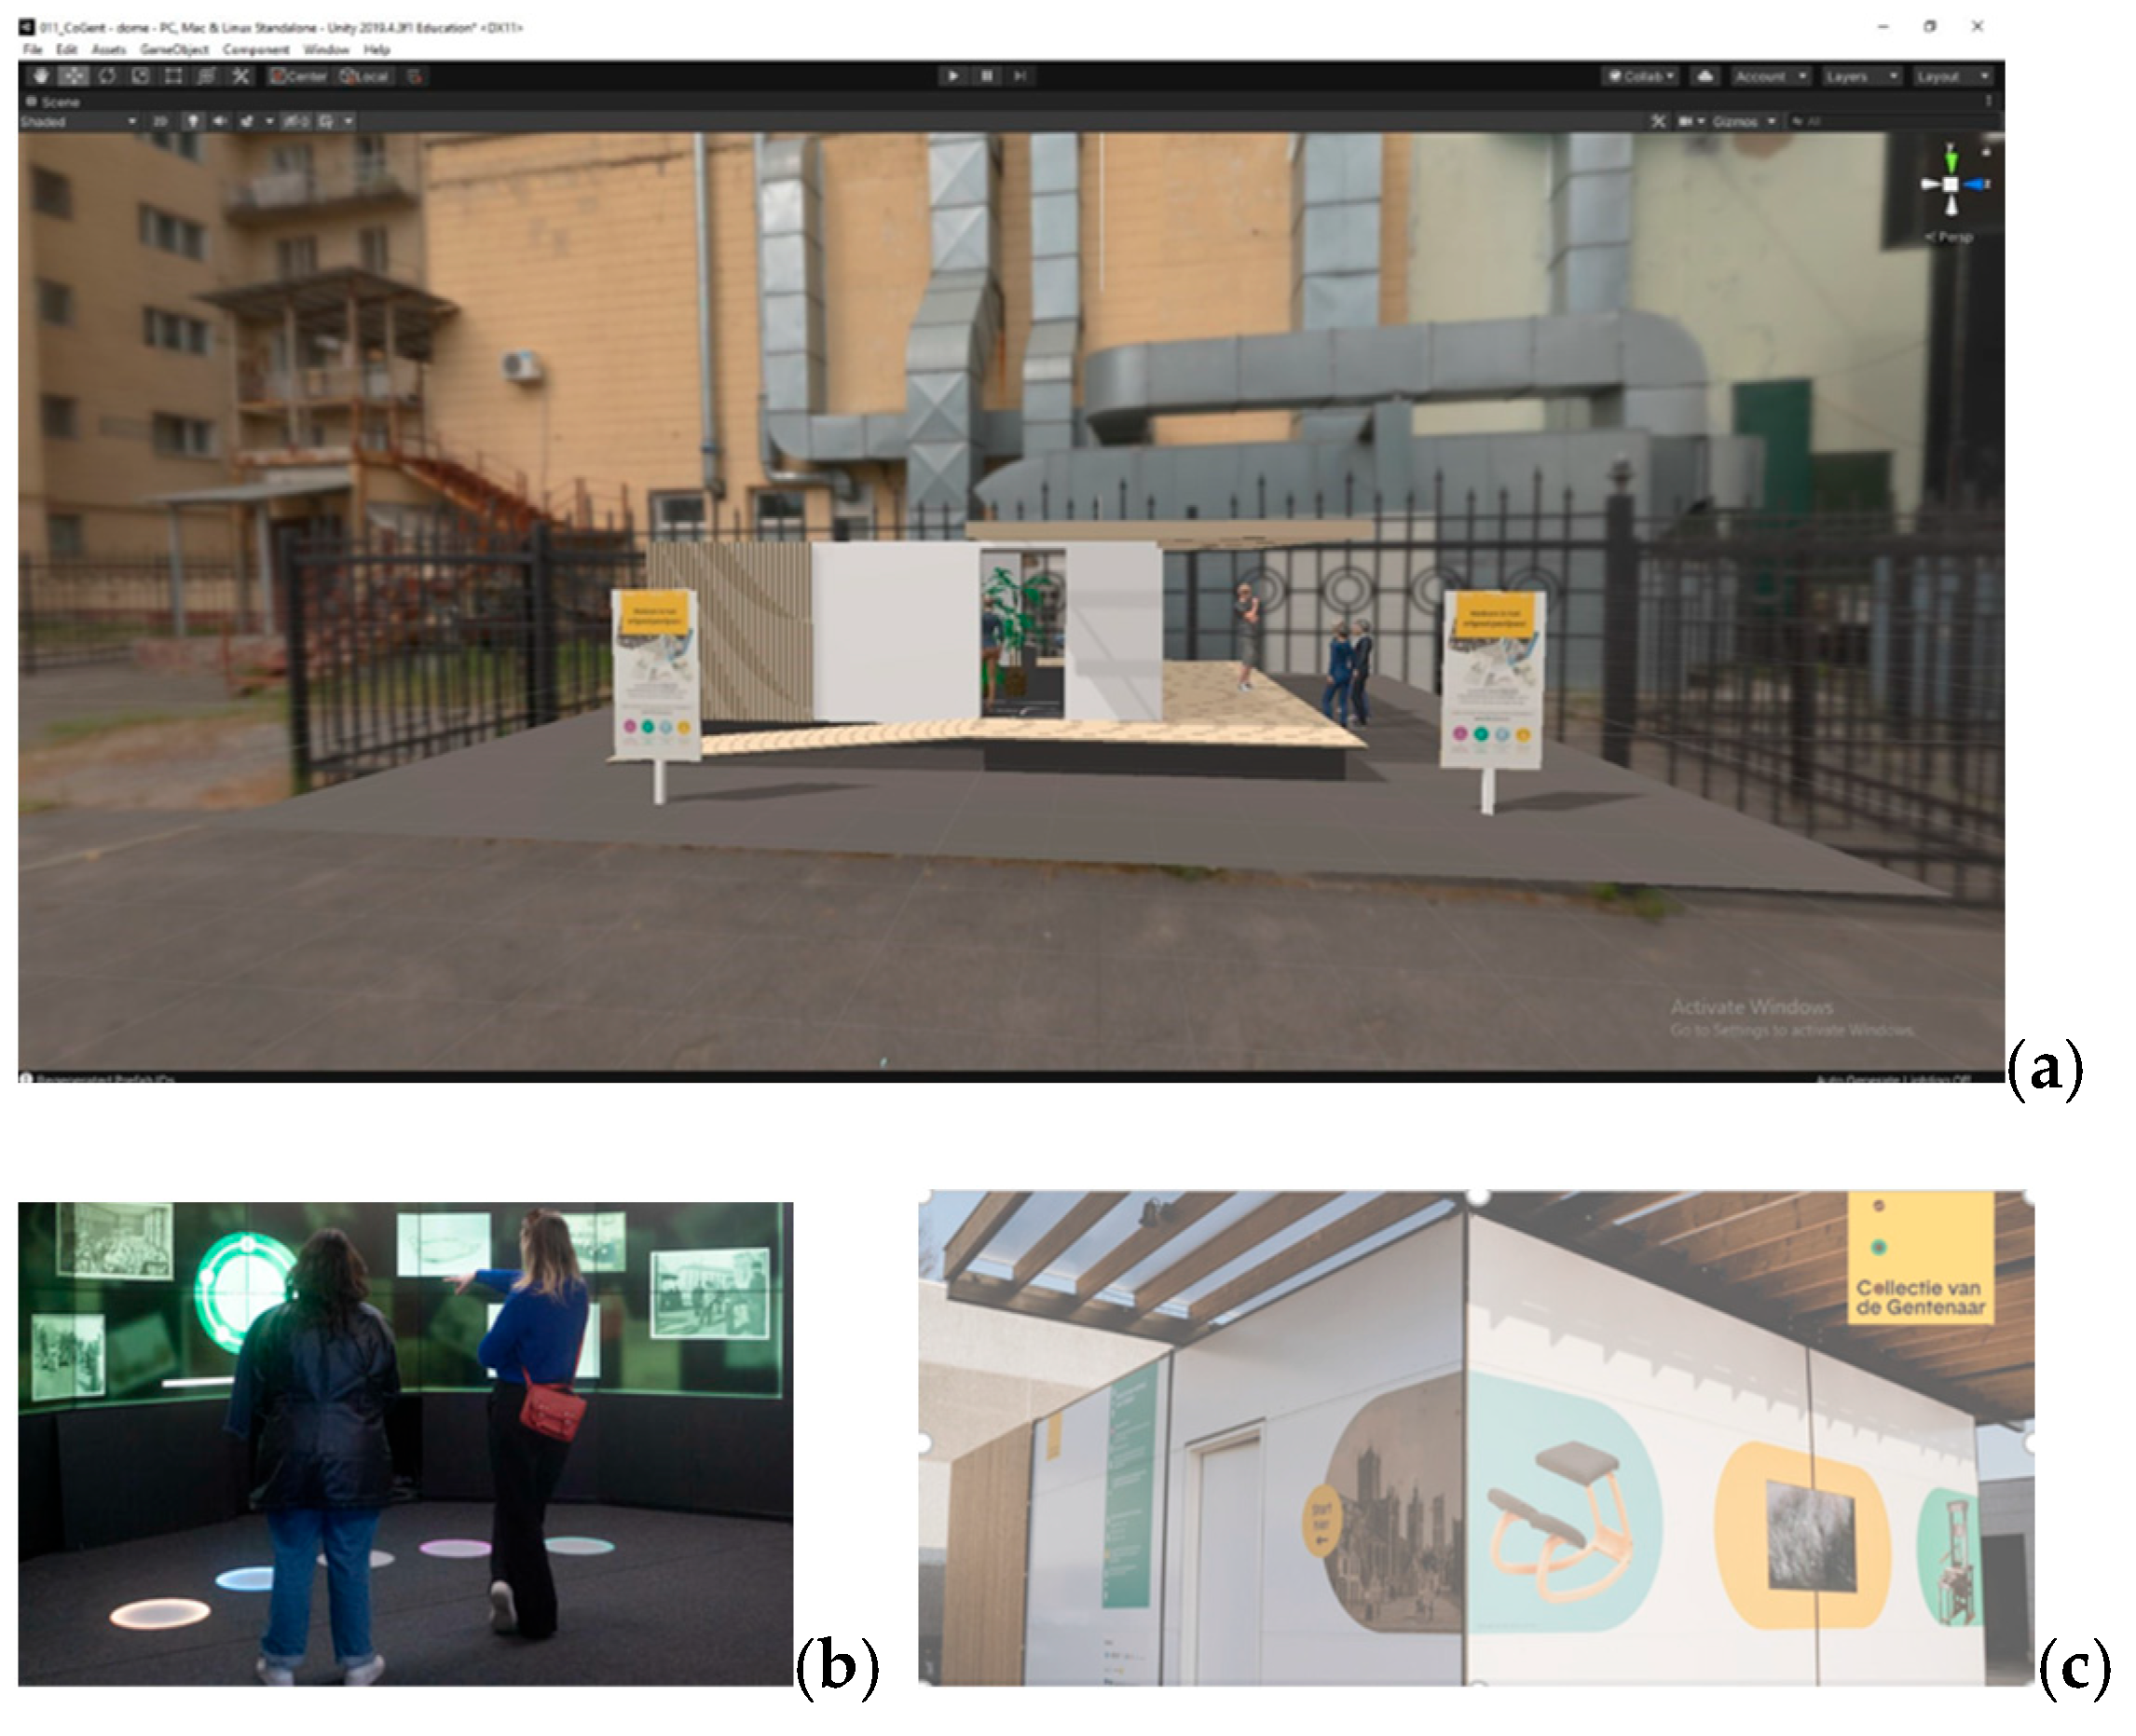
2.4. Virtual Prototyping and Testing in the Lab (VRT)

Like during testing in the field, three interfaces were tested in VR as well (see Figure 5). These tests were carried out in November 2021. The first of these interfaces was an introductory touch screen. Afterwards, the visitor could follow arrows on the ground to the next interface. This second interface was controlled using step-activated tiles. The next interface was adapted, as the interaction of walking along confused the participants in the first user test (TIF). After following the arrows on the ground to the last interface, the participants arrived at a touch screen table. For the virtual reality testing, an Oculus Quest 2 headset was used with a Unity-based VR application. This application was built using a framework developed for performing experiments in VR. This framework aims at creating a highly immersive product-testing experience. It objectively measures interactions, cognitive–affective states and user behaviour. By applying a think aloud protocol, more qualitative input was gathered from the participants. The designed experience was kept short (5–10 min) which reduced the chance of visual fatigue. This study also applied an onboarding condition to familiarize the participants with a virtual environment to counter negative effects such as disorientation and a lack of control during the experience.

2.5. Final Product High-Fidelity Testing (FP)

The final evaluation was performed in the finished CoGent box (see Figure 6). This test was carried out in June 2022. The interfaces tested were identical to the VR test. They consisted of the introductory screen at the entrance, a 180-degree video wall with step-activated buttons and a touch table. The final version of the CoGent box does not have arrows on the ground for wayfinding.

2.6. Evaluation Methods

Two prototyping methods were compared during this study, the first prototyping method being low-fidelity prototyping and the second method being virtual prototyping. These two types of prototyping were analysed using quantitative and qualitative user research methods:
1.
Observations
Three test labs have been set up for performing qualitative observations. The first test lab was a prototype tested in the field (TIF), where locals could test out their interaction using paper and basic digital screens. The second test lab was a VR lab at the faculty (VRT). The last observation was performed with the final product (FP). Six researchers from within the fields of communication science, experimental psychology and industrial design were scouted for this comparative study. In all the conditions, the participants experienced 3 prototyped interactions: an introduction screen, a wall-sized interface and a touch table. During the VR study (VRT), one participant failed to participate. So, the results were analysed for 5 researchers instead of the original 6. These social science researchers had limited knowledge of virtual reality. The assessment of participants’ observations of the final product was carried out with two participants since this was not the focus of the study.
2.
Quantitative analysis of questionnaire data
For the assessment of the imagination of the test person, we used several questionnaires related to several topics. These topics were presence, realism, functionality, interactivity and task difficulty. The questionnaire consisted of relevant subsets of questionnaires for each category. Task difficulty was measured using an after-scenario questionnaire (ASQ) [54]. The Cronbach alpha values of the 3 questions revolving around task difficulty were sufficiently high (α = 0.83). Functionality was measured using the mobile application rating scale (MARS) [45]. The Cronbach alpha values of the 4 questions revolving around functionality were sufficiently high (α = 0.789). The perception of factual realism was measured using the VR Realism scale developed by Lipp [40]. The Cronbach alpha values of the 3 questions revolving around realism were sufficiently high (α = 0.873). Questions regarding presence were formulated using the group presence questionnaire [42]. The Cronbach alpha values of the 3 questions revolving around presence were sufficiently high (α = 0.90). The questions regarding interactivity originated from the research of Mütterlein [44] (IT1, IT2, IT3). The Cronbach alpha values of the 3 questions revolving around interactivity were sufficiently high (α = 0.8736). The test sample consisted of 27 industrial design students of different ages (20 male, 7 female, mean age = 21.3, std dev = 3.8). This test was performed in May 2022 and used a within-subject design. Along with the test, 5 hypotheses (see Introduction) were evaluated based on the onset of this study. The lack of disentanglement of the interactions resulting from overall system analyses could lead to incomplete findings. A trade-off between validated scales that are not able to capture the detail of highly complex nuanced interactions and specific measurement approaches is required. In this approach, to comprehend the feedback on the complete system, quantitative measurement was supplemented with an interpretative method (observations and expert interviews) that complemented the quantitative insights. This contributed to a holistic understanding of the studied system’s perception.
3.
Expert interviews
After the launch of the CoGent box, expert interviews of this project’s partners (n = 8) were performed wherein they reflected on their use of VR testing in this project. The interviews took place in June 2022. These interviews featured the partners reflecting on their opinions on the use of VR as a prototyping medium for experiencing and evaluating the CoGent box. These semi-structured interviews were based on the topics described in this paper. Questions about the realism, immersion, usability and value were asked. These experts fulfilled differing roles in the project. The panel consisted of 2 experts on project management, 1 expert on product design, 4 experts on content creation and 1 expert on social cohesion. After completing the interviews, the conversations were transcribed and coded in NVivo. Next, the codes were clustered, and the findings are written in the Results section.

3. Results

3.1. Physical Prototyping and Testing in the Field (TIF)

Control vs. validity: Testing the concept in its correct context without the correct physical materialisation caused some problems regarding external validity. This was especially true for the walk along interface, which was hard to imagine for the participants. Control over the environment was difficult to maintain as well (e.g., the setting was too noisy). Regarding the context, the participants mentioned that it was fun to look at their surroundings and see which real-life environment the final product would be placed in. The main finding reported was that the validity and control could be high if the tested prototype was in its final stage;
“I could imagine that I was present in this Pop-up Museum, but the experience still felt like separate tests. It is a little too far removed from the visualization (render).”
(Participant in the field lab test)
Presence and realism: In terms of immersion, the participants agreed that they could imagine being in the envisioned application. They noted that digital screen-based interfaces were more immersive compared to paper prototypes. The digital screen-based interactions were perceived to be more immersive, more interactive, cheaper and adaptable. The execution of tasks was perceived as realistic. The points of improvement that were suggested were working on the real-life scale of the final product and connecting the separate tests into a more coherent whole. Another proposed point of improvement was increasing the immersion. The question of how realism could be increased in this early stage without high development efforts upfront arises;
Functionality and interactivity: The interactivity and functionality of the prototypes was sufficient to grasp the general concept of the product. On a cognitive level, the participants reported that they did not have to think a lot when using the paper prototypes and that they were easy to use when somebody gave them instructions. Paper prototyping was well-received as a prototyping method but, unfortunately, it is unresponsive by itself and can be difficult to interpret sometimes. The functionalities of the prototypes were fun to explore since the test was short and the results of the interactions became instantly visible. The participants reported that they liked paper prototyping but preferred digital prototypes. Notwithstanding that paper prototypes can be useful in specific occasions, it remains difficult to compete with the versatility and responsiveness of digital prototypes;
Note: When rewatching the recorded videos of these tests, very little hesitation was witnessed in the patients during testing in the field. The frictionless experience resulted in some participants smiling when going through the scenario.
Usability: The participants found the prototypes easy to use, intuitive and easy to learn, and found it easy to interact with the functionalities of the prototypes. The interviews indicated that the prototypes were moderately fun to test out. The exploration of the prototypes was possible given that there was enough assistance provided by the experimenter. When this condition was met, the contents of the prototypes were informative and experienceable. However, more information was desirable. The participants responded that they would use this way of testing themselves and would not need technical support to perform these types of tests. The envisioned technical support encompassed UX and software engineering. A graphic/VFX designer would be useful as well. The researchers reported that this way of testing made their lives easier and that they would be able to perform testing in this fashion. Regarding effort expectancy, the test was perceived as easy to set up by the participants and their interactions with the system were clear;
TIF in NPD: In the participants’ view, the prototypes added value to the evaluation. They were viewed as innovative and interactive, and allowed for in-depth questioning to see if people understood the prototype. They facilitated concept validation in the early phase, with the right target audience as well.
“I really liked the fact that field testing puts you in the right environment, you also get closer contact to your stakeholders.”
(Participant in field lab test)
The participants agreed that performing tests in a pop-up lab could be useful before investing time and money into the project, mainly because collecting the opinions of the target audience quickly becomes possible. From a research perspective, the participants proposed testing in a digital fashion as much as possible. The developers who worked to make this test possible agreed on the significant effort it took to obtain the materials on location. The participants preferred digital screen-based prototypes the most, both from a research perspective and from a prototype fidelity perspective.

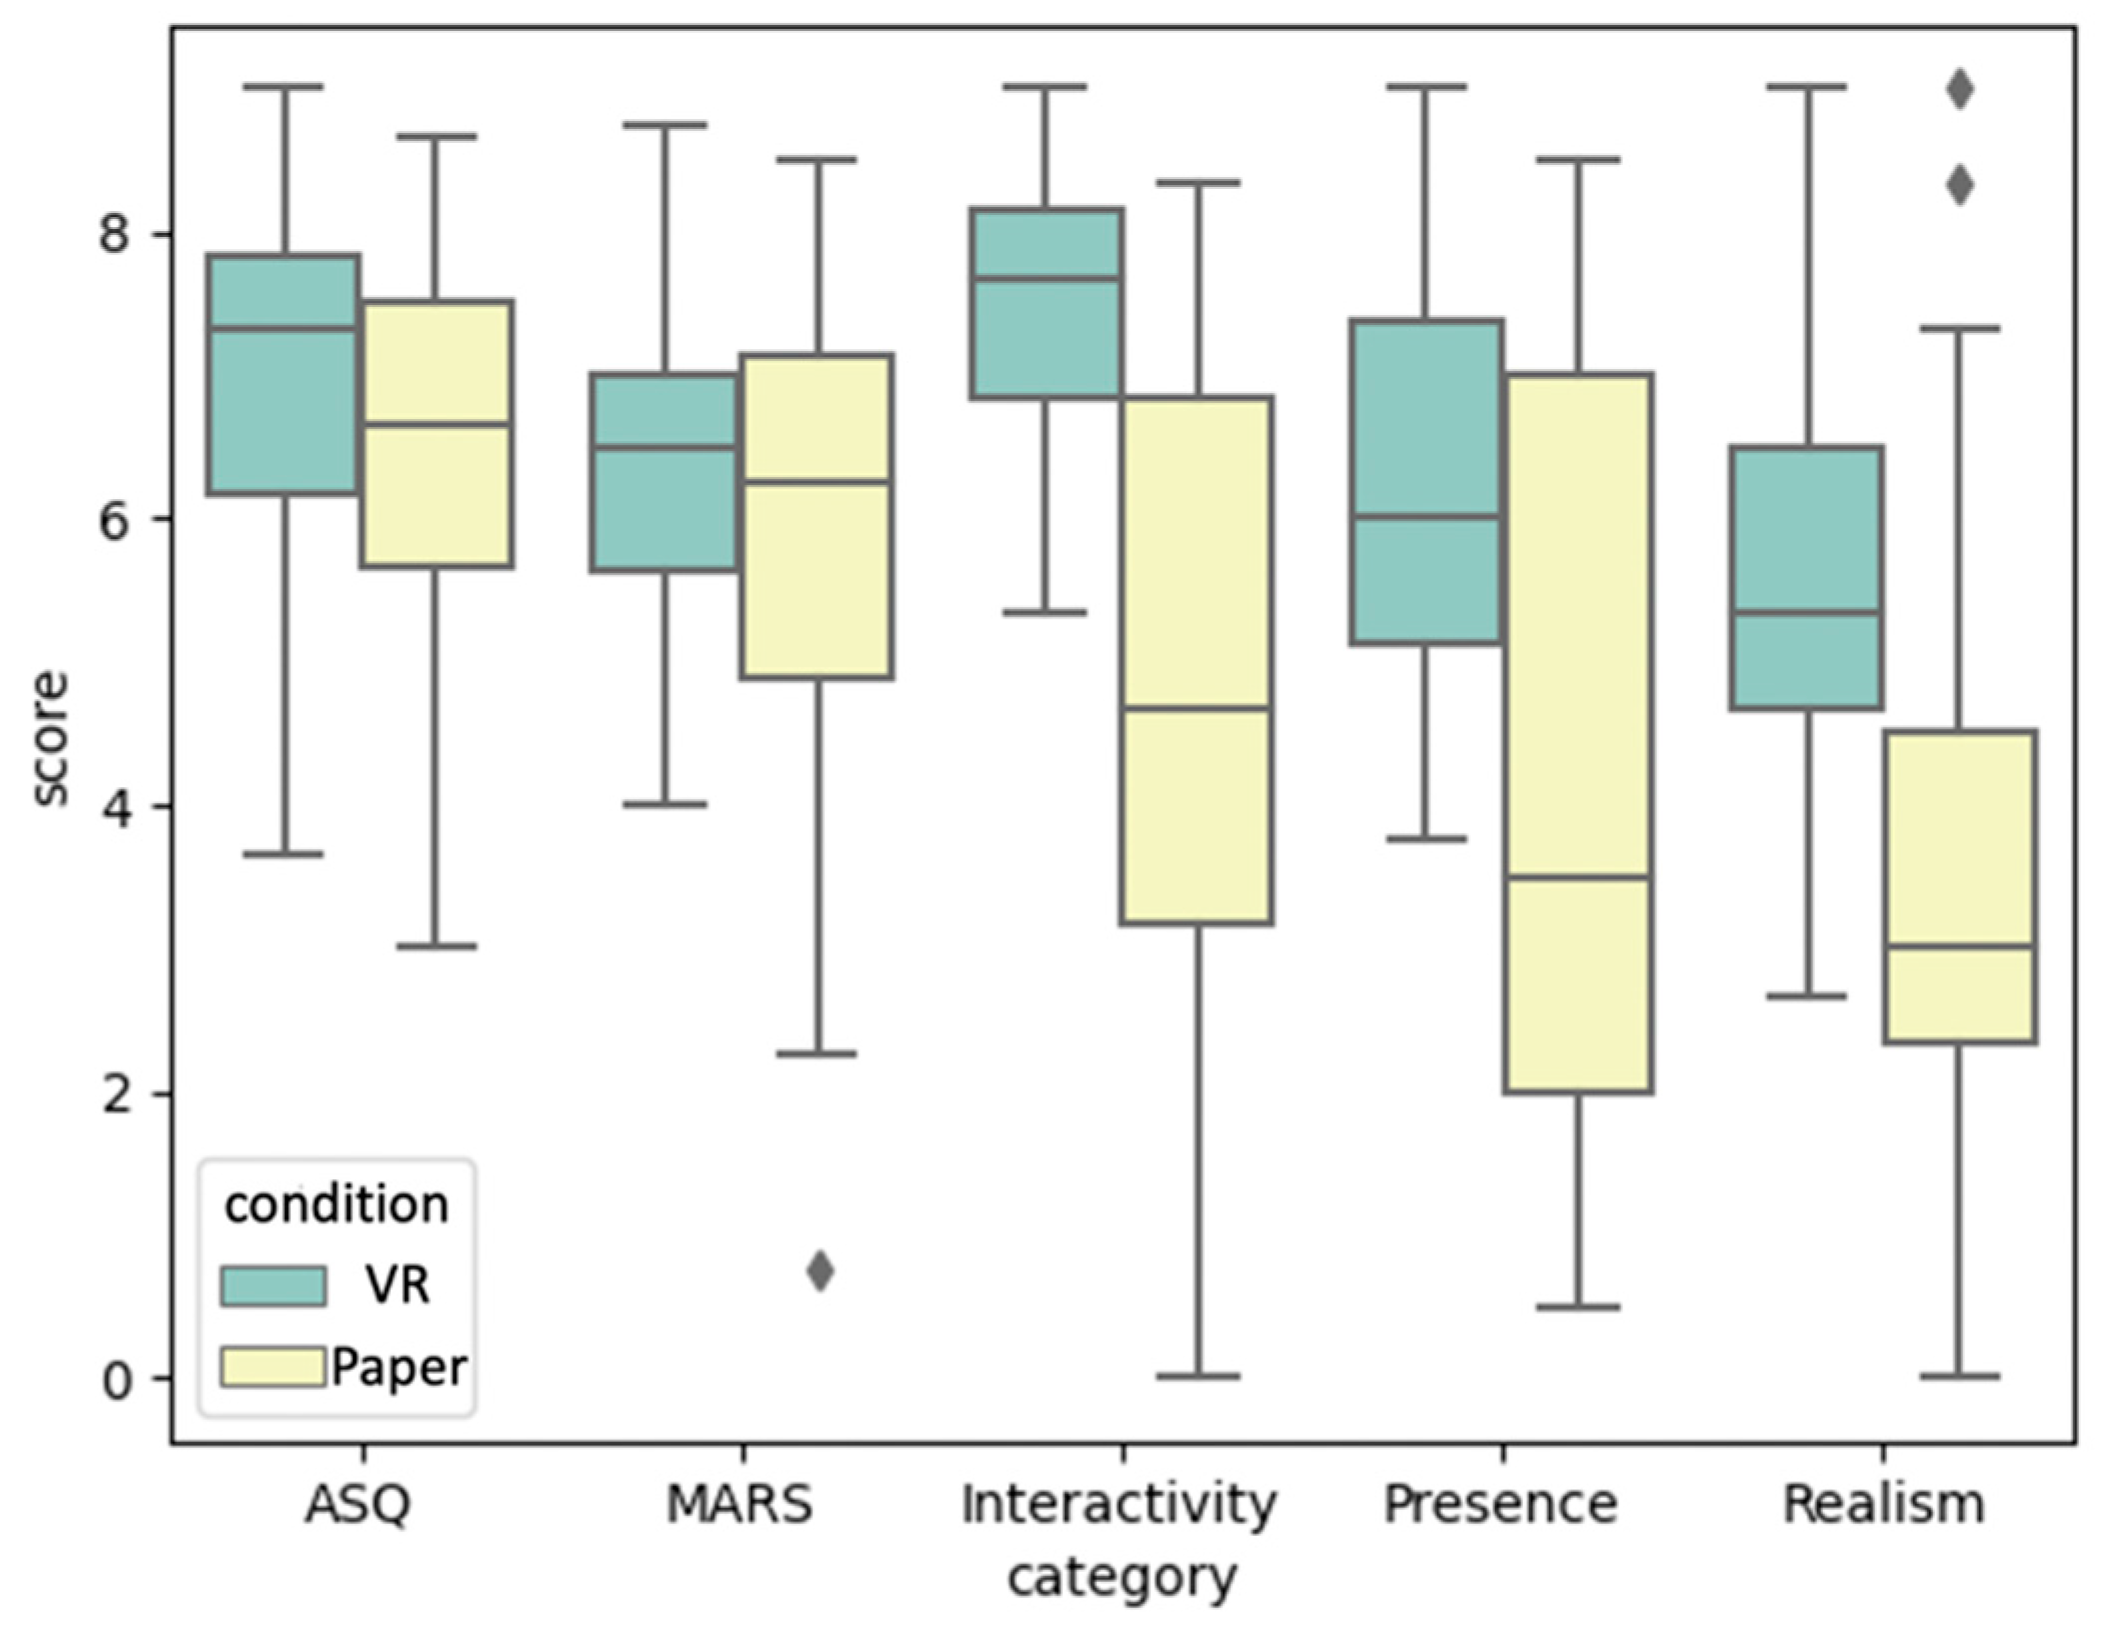
3.2. Virtual Prototyping and Testing in the Lab (VRT)

  • Quantitative comparative test
During the quantitative comparative test, the students delivered some interesting insights. When looking at the questionnaire data, we see that the participants (n = 27) rated the VR environment better in terms of interactivity, presence and realism (see Figure 7). However, more use-oriented items such as functionality (excerpt from the MARS questionnaire) and overall task difficulty do not seem to differ all that much. The normality tests (Appendix A, Table A1) indicate that the data regarding presence, task difficulty and functionality are not normally distributed, while the results for realism and interactivity are normally distributed. After running a paired samples t-test or a Wilcoxon signed rank on each element, it turned out that there were significant effects found for interactivity, presence and realism.
According to our hypothesis, we expected the VR prototype to be rated as more realistic compared to the low-fidelity prototypes tested in the field. The results of the paired samples t-test confirm that the VR test (M = 5.6, SD = 1.64) was more realistic compared to the paper test (M = 3.75, SD = 2.29) (t(27) = 3.96, p = 0.001). For the second hypothesis, we expected that the participants would feel more present when using the VR prototype compared to the low-fidelity prototype. The results of the Wilcoxon signed rank test confirm that the VR test (Mdn = 6) induced more presence than the paper test (Mdn = 3.5) (Z = −3.11, p = 0.002). According to our hypothesis, the participants should have experienced more interactivity when using the VR prototype compared to the low-fidelity prototypes. The results of the paired samples t-test confirm this effect where the VR test (M = 7.5, SD = 0.91) is more interactive than the paper test (M = 4.81, SD = 2.3) (t(27) = 6.13, p < 0.001). Our hypothesis expected the participants to experience better functionality when using the VR prototype compared to the low-fidelity prototype. However, the p-value of the Wilcoxon signed rank test was too high for statistical significance (Mdn(VR) = 6.5, Mdn(Paper) = 6.3) (Z = −1.292, p = 0.2). According to our hypothesis, we expected the participants to experience less difficulty when performing tasks with the VR prototype compared to the low-fidelity prototype. The p-value resulting from the linear mixed model analysis was too high for statistical significance (Mdn(VR) = 7.3, Mdn(Paper) = 6.85) (Z = −1.668, p = 0.098). When using α = (0.05/8) as the Bonferroni correction to account for the family-wise error rate, the results do not differ.
2.
Qualitative reporting
Control vs. validity: The VRT setup allowed for more control over the experienced scenario. The content expert mentioned that some people struggled with using the buttons; this could be easily resolved by giving a tutorial first;
“Some of my colleagues really couldn’t handle VR properly. They sometimes said: I’m too old for this, I can’t do this. Some things were just difficult such as picking up an object. Sometimes VR does not do what you would expect it to do.”
(Expert on content creation)
Presence and realism: The perceived visual realism was quite high. The participants reported that they could imagine that they were in a pop-up lab rather than looking at several different screens. According to the experts interviewed, the main advantage that VR delivered in this research was a clear visual representation. The experts mentioned that VR brought the people working on the project closer together and that the VR prototype induced a lot of conversation. Lengthy discussions on the customers’ journeys resulted from testing the VR prototype. This could mean that VR created the common ground to facilitate discussions as well. On the one hand, the experts said that VR helped in imagining how the result of the product would look, whereas, on the other hand, they mentioned that a lot more can be perceived in real life. The participants noted that the images were not the same, but looked the same with regards to spatial dimensions (having a 1-to-1 scale). The participants who viewed themselves as not into technological novelties also mentioned that VR was particularly useful to envision the finished result. It defined the boundaries of the finished result and the visualization became more concrete. When there are many ideas and expectations, VR helps in delimiting these options, noted an expert. Renders of the design were viewed as not concrete enough. Apart from this, traction and enthusiasm resulted from the VR test as well. The spatial insight gained from viewing the product in VR left an impression of the user experience and how the screens related to each other. The use of avatars instilled the realism experienced in VR. Seeing an avatar performing context-related actions allowed for the visualization of the proportions of a person, but also presented the use of the product for the participants. VR offers a clear representation of the finished product, which can be useful as input for discussions and understanding.
“When I finally saw the finished result, if felt already familiar in a way.”
(Expert on social cohesion)
VR also provided good insight for the designers on the project. For example, the designer working on the spatial model benefitted a lot from viewing the space in VR. For the designer working on the screens, the wholistic experience in VR made it a good first in-context test. VR can be used as a tool for visualizing spaces and can elicit more understanding of those spaces, which makes it more educational than renders. It also puts the box in a relevant and concrete setting. This was performed because context plays a crucial role in perception. This means that the use of VR is not only useful for communication towards others, but also as an internal design tool. Along with the realistic experience of viewing the dimensions of the box, three actionable tweaks to implement in the final product were proposed.
“VR places the product in a context and allows the user to see the product on a 1-to-1 scale. The same idea applies for smaller products that are 3D printed or viewed using Figma. It (VR) has a big added value for internal use even with people (designers) who have a lot of spatial cognition”
(Expert on product design)
Content-wise, the VR prototype made it easier to assess how much textual information there should be on the screens. It also allowed for different spatial positions for the viewer to see if everything could be viewed from specific angles. This because it is extremely useful for first impressions. Another opinion that was voiced by a content creator was the false impression that the prototype could not be changed anymore. Some interviewees expressed the desire to use the VR model as a sandbox to explore different options regarding the spatial placement of furniture. These insights could then, in turn, be linked to the physical model when it was being constructed. The designers admitted that they are used to imagining a lot in their role and noted that it would be particularly useful to be able to convey the vision inside their heads as realistically as possible to the customer. They reported that the visual quality was high enough, but that the limiting factor was keeping up with the knowledge of Unity to visualize projects in VR. The release of a good plugin for this would convince the design team to start working with VR themselves. Since Unity has become a lot more user-friendly, they envision themselves using the Oculus Quest soon.
VR helped with imagining the final experience of the CoGent box; during testing with experts and lead users it became clear that it did not induce much creativity, except for the parts that still had to be defined. For example, when testing a touch table with lead users was carried out on a virtual touch table with visible but non-interactive content, many ideas surfaced about how this touch screen could be used. The VR prototype filled in the fuzziness of their own imagination and replaced this with a concrete visualization of a final experience;
Functionality and interactivity: During expert interviews it became apparent that the main advantage VR delivered in this research was interactivity. VR simulated the feeling of visiting the box. Most of the partners involved in the project did not understand Figma files intuitively or could not express what they saw in Figma to others. The Figma files were difficult to interpret in a spatial manner. By using the VR prototype, multiple screen and interaction types that are hard to imagine on Figma files could be validated. Moreover, looking at renders does not allow one to experience the intrinsic features of their setting. This also shows how people tackle their interaction with the envisioned ‘final’ product. The prototyped interaction was realistic enough for the participants to understand the procedures that would happen in the final product. Notwithstanding that VR is still in its early days of interaction capabilities, some possibilities and difficulties were witnessed in this study. In specific questions about the interfaces, the participants reported the limited interactivity and UX flaws of the general concept. The participants noted that the setup was portable, the prototype could be adapted easily, and variations could be tested. According to some of the experts interviewed, VR could be used to collect feedback. It helps to make something tangible in an iterative way;
“…with renders I cannot perform the actions. I really like that the experience was included with the visualization”
(Expert on content creation)
“I was impressed, I think this technology will keep improving as well. Most dimensions of the VR model were good, the proportions and structure of the VR model came very close to the final result”
(Expert on project management)
“I think it (VR prototype) produces procedural knowledge…you can explore the actions you can do in the final product…”
(Expert on social cohesion)
Usability: In terms of perceived testability, the usability of the functions was rated as good. Assessing the usability of the designed product was harder due to some VR-related issues that occurred. Moreover, using teleporting for displacement was not very intuitive to the participants. Related to the test itself, several participants reported that some information about the functionalities was lacking, e.g., they were not sure what the possibilities were, or they needed a lot of help with handling interactions in VR from the experimenter. The information was regarded as complete, but suggestions were given such as making the text bigger or relocating the icons. The participants rated this system as adequate for testing because of some hindrance in terms of giving feedback on the side of the user. Some recommendations that came up were establishing a training scenario, resolving technical issues, such as tracking, and including a safety talk before the experiment. The interviews revealed that the experience was viewed as tangible and enjoyable by the experts and participants.
“VR helped with the ability to experience interfaces and use of the to be developed product, it made the product immediately clear”
(Expert on project management)
Some of the experts and participants rated the prototype as fun to explore. The answers about technology acceptance indicated that testing the VR prototype was fun when the participants knew how to control the experience well. The participants felt the need to test out all the functionalities, especially the people who had never experienced VR before; they were pleasantly surprised and indicated that using VR was fun. The prototype caused enthusiasm and imagination among the external partners within the project;
“I think it was a lot of fun to do since it was my first VR experience”
(Expert on content creation)
VRT in NPD: The general opinion of the participants and experts involving the timing of this test within the NPD process was that the VR prototype came slightly too late. The difficulty in this situation was the delivery of the 3D model before starting to work on the VR experience. The VR development was performed quite rapidly. This 3D model was delivered after major design decisions were already made, leaving little room for comparing different versions of the prototype in VR. The experts on project management were fond of a situation where they could view the ongoing process in VR and follow along with the choices that had been made up to that point in the development process. They expressed that this prototype could have been tested before physical materialization. Since the VR development happened in parallel with the rest of the project, it is important to communicate the findings from the testing in time with the other project partners. In this way, the project partners can follow which choices have already been made and help make decisions for the choices that still must be made. More critical-minded experts noted that it could be costly to create different comparative or iterative models. They stated that implementation a little bit earlier in the process, right before the decision on the final concept, would be the most opportune moment to introduce VR into the NPD process.
Some project partners noted that it was good that there was only one prototype created, since it could have been confusing testing different versions. However, they also agreed that more iterative testing would have prevented ad hoc testing in real life. VR reduced this effect by performing some testing within this medium, but did not fully address the need for a more co-creative approach. Some experts wondered if it could be used for ABC testing. In the beginning, there was a lot of confusion about the type of interaction the box would offer (sandbox or storytelling box). It would have been interesting for project management to have tested both types of boxes. This indicates that multiple VR prototypes could be more beneficial to the development process than the one prototype developed in this research.
“We want to be quite certain of the high-level concept before we start drawing in 3D. The original concept was made on paper, so VR can only be used after this phase in the development process.”
(Expert on product design)
The experts interviewed expressed that the VR testing translated to facilitating conversations and discussions and levelled out the understanding of the project for stakeholders. It created a common ground to talk about niches and expertise. The VR prototype enabled discussion for the group working on the content of the project. In the discussions, the people knew what they were discussing better. VR brought the people working on the project closer together. Most of the project partners admitted in hindsight that it would have been useful to compare the versions of the final product in VR as a conversation starter before deciding on the definitive version (especially partners not involved with development and design). The VR prototypes added value by making the user flow experienceable. Also, the actions of participants could be validated (e.g., watching the screen, entering, exiting, etc.). The participants reported on VR being a very adaptable and useful medium to test in as well. It delivered a clear materialization of the abstract terms that were coined within the project and oriented the efforts of the project partners in the same direction.
The development of the VR prototype took 8 days. The experts on project management mentioned that building a physical test set-up would have taken more time to be tested on the same level as the VR experience. These experts also remarked that it is important to gain time on projects and especially on European projects. There, it is more important than saving the budget. They reported that the thing that comes closest to this physical test set-up would be a movie set-like experience, which would be expensive and a mess of cables. The prototype does not have to be developed physically. This can lead to time, space and cost efficiency. How much time was needed to alter the prototype was not clear to the project managers either. Also, both the participants and experts were not sure which (financial) means they needed to complete the development of such a test. The experts on project management mentioned that with physical prototypes it would only be possible to test parts of the complete experience, which would lead to a fragmented impression. With minimal effort, an elevated level of imagination was reached within the prototyping budget (50 k). AR was proposed as a viable alternative as well. The participants reported that they would use this way of testing for specific cases, weighing the cost to develop this kind of test.
“The (Oculus) Quest is easy because it is very portable, so there is not a lot of overhead. Multiplayer is cool, but too much of a hassle to implement”
(Expert on project management)
Some opportunities were mentioned. Most of the comments of the participants focused on the remoteness of the set-up and heightened interactivity. For example, walking around using wireless VR and VR gloves, testing at home and further development of the physical interactions were proposed. Full-body tracking, a tutorial and even more detailed functional interfaces were requested features. In an expert’s opinion, the testing in the field should have been combined with the VR visualization. Resistance to propose new options after testing VR became clear when compared to testing in the field, where participants produced broader suggestions.
“It is partly our job to take up an expert role and choose from this perspective and even have a preference for certain options.”
(Expert on product design)
From a project management view, there was slight regret in not having used the VR prototype more actively, as many doubts were encountered during the process. Regardless, there were no expectations of this prototype and these doubts came quite late in the process.

3.3. Final Product High-Fidelity Testing (FP)

Control vs. validity: In the real environment, social hindrances were noted in the experience. The presence of other people and contextual noise made it harder to focus on the content. When there is a group present, this might create a social barrier to entry. The participants reported that the visual effect was the same as in VR, but the feeling was different. VR felt more like a test, while real-life testing enabled full control over the environment;
Presence and realism: The participants felt present in the final product test. The participants reported that the spatial feeling was similar in VR and real life. This scenario yielded the highest level of realism but resulted in a neutral experience due to some uncomfortable contextual factors (heat, ambient noise, etc.). The implications of the ambient noise and sunlight were also difficult to assess in VR along with contextual estimations about the real environment. All in all, it remained difficult to assess beforehand what aspects would be realistic in VR and which would not;
“I am not gonna say it is the same, it looks the same.”
(Expert on content creation)
Functionality and interactivity: During the interview with the experts attention was brought to the comparison between the VR version and the final physical box. In real life, people tend to be less disoriented since they are not using teleportation as a method of displacement. This might cause the VR visualization to appear smaller than the real box. Some parallels between VR and real life were clear like walking past certain interfaces. A lack of understanding of the general user flow and doubts were encountered with the new interaction types;
“In VR everything seemed closer together and the prototype looked smaller. Also, pressing buttons made it unnatural for some people”
(Expert on project management)
Usability: Many changes regarding content and user flow were proposed by the participants. Some tests were difficult to perform in VR, like tests with people with limited mobility or perception. For example, an experience in VR becomes almost impossible for a wheelchair user. Overall, people could perform the physical test and commented on the user-friendliness of the interactions. The functions were ready to use, and the look and feel were rated as good. In the view of the participants, VR functioned as a good teaser, but many waited until the box was delivered to form their final opinion. This means that VR can be useful for collecting insights, but it might be beneficial to follow VR tests with another more physical test;
FP in NPD: The final product test made less sense to the participants since little changes regarding the design needed to happen. In hindsight, to some of the participants, VR seemed like an experience they had to complete. A multi-person user test should have happened in advance. The participants reported that the social aspect might have been neglected during testing. Physical testing remains the most useful. The lab in the field was criticized for requiring displacement in the initial stages of the project where it produced little findings. In real life, people share more stories and first-hand experiences.
“It was very noisy and warm inside. I felt more uncomfortable in real life. The VR test itself was realistic, but there might have been too little focus on the social context.”
(Participant final test)

4. Discussion

The findings from this study offer valuable insights into the comparative effectiveness of virtual reality (VR) and real-life rapid prototyping methods in the context of user testing for smart city interfaces. The discussion below explores the implications of these findings for design practices, highlights the strengths and limitations of VR prototyping and suggests directions for further research.

4.1. VR as a Bridge Between Prototyping and User-Centred Design Validation

One of the key takeaways from this study is the potential of VR to serve as a bridge between rapid prototyping and user-centred design validation. The ability of VR to provide a high level of visual fidelity and an immersive experience makes it particularly useful in scenarios where traditional prototyping methods fall short. Downsides in the field-testing approach (TIF) were noticed. A new iteration would be necessary when things go wrong, or the interaction needs of the prototype increased. The developers of the test noted, however that contrary to the assumption of the participants, the field test was not easy to set-up. In conclusion, it might be perceived as easier to perform than it is in reality. A combination of different prototyping techniques was deemed necessary to perform the test in the most rapid way possible. The difficulty to for the visitors of the neighbourhood to imagine being in a the CoGent box resulted in limited findings. This was unfortunate, given the efforts it took to create and deploy the physical test setup.
The VRT was perceived as more interactive and realistic than paper prototyping after performing statistical analyses. The participants also felt more present during VRT compared to paper prototyping. However, more user-oriented items such as functionality (excerpt from the MARS questionnaire) and overall task difficulty did not seem to differ all that much. This could mean that the tasks based on paper or VR medium were perceived as equally difficult by the participants and did not make any difference for performing actions. However, more experience-related aspects such as presence, interactivity and realism benefited from the virtual medium. Future research might further question how large the difference in interactivity, presence and realism is compared to other prototyping methods. VR’s capability to simulate a 1:1 scale environment allows designers and stakeholders to experience the spatial and functional aspects of a design before physical prototypes are constructed. This is especially valuable in complex systems like smart city interfaces, where the interaction between the user and the environment plays a critical role. In terms of usability, it became clear that people were not able to test the complete experience on their own; there was a person who needed to guide them through the process. VR may not be as intuitive as some researchers in the field expect. Many people have never experienced VR before; thus, onboarding stays important even in quite ‘simple’ applications.

4.2. The Role of VRT in the Design Process

The use of VR resulted in improved in-design reviews between project partners. Similar to Kandi et al. [24], we found that VR can improve skills in identifying mistakes. During quick and dirty prototyping, it was also hard to communicate the design to the relevant stakeholders. Also, for this reason, it would be appropriate in large projects where the impact of the VR is meaningful, especially when it is used for communicating about the doubts faced during the project. VR could help in reducing the fuzziness involved in the design process. It is remarkable how clearly people could understand the prototype with little VR development effort. This visualization made the buzzwords used in the project tangible since many partners only had the description of the project as a reference, which was too abstract. The VR test made the project visual and explicit. This aligns with previous research by de Regt et al. [31], which emphasizes VR’s potential to enhance communication and collaboration in design processes. The visual and interactive nature of VR prototypes helps to overcome the abstract nature of traditional design representations, enabling a more concrete and shared understanding of the design among stakeholders. Contrary to this, testing the low-fidelity concept in its correct context without the correct physical materialization caused some problems regarding external validity. For example, renders caused confusion in respect to the scale of the box. In line with this, testing in an open tent lacked proper cues like depth, sound and the visual look and feel of the interfaces. As a critical note, it was reported by a researcher that paper prototypes during the testing in the field did not add much value. From the researchers applying the test’s view, the VR prototype could have been deployed in this part of the NPD cycle. Since VR also has the potential to be used within testing in the field, (mobile) VR could become a practical tool for testing outside of a lab environment. For instance, combining VR with full colour passthrough, AR or lidar environment scanning could enhance the contextual realism of the testing environment. This multi-modal approach could offer a more comprehensive evaluation of the product’s usability and user experience, leading to more successful design outcomes. The ease of use of VRT also helped a lot with inducing enthusiasm and fun while testing. This, in turn, helped in onboarding people onto the project. VR can be a powerful tool for eliciting enthusiasm, which can help to maintain involvement. Later, a physical setup could be built resulting from the feedback of the VR test in the field.
The level of fidelity as opposed to the freedom to change the design was also discussed with the expert on project management, debating how far the imagination of the participant can be pushed; the developer in the loop (flexible model) vs. a final fixed build arose (rigid model) was also discussed. This demonstrates that there are still opportunities to explore. It implies that VR can be applied in more creative ways than envisioned at the start of the development. The higher the level of realism, the more that useful assumptions and conclusions can be drawn from the VRT (e.g., when using foot tracking by placing Vive trackers on foot). Iterative VR tests could be used to look for solutions when problems occur during testing. Also, using VR instead of a real test setup during COVID was a clever idea. It made the barrier for testing lower, since the headset could be delivered to the participants’ workplaces. All in all, while VR was useful, it remains difficult to assess beforehand which aspects will be realistic to evaluate in VR and which will not.
A difficult question to assess as well, is the duration of the development of VR tests in advance. It is partly determined by the complexity of the assignment and expertise level of the developer. This is an issue that might be hard to address using the current tools. It might be possible to provide users with a template in which virtual reality is already provided and basic interactions can be prototyped.
The study’s findings suggest that VR is most effective when used in the embodiment phase of the product innovation cycle. In this phase, VR can be utilized to refine and validate design concepts before final decisions are made. The ability to visualize and interact with the design in a simulated environment allows for more informed decision-making and can prevent costly changes later in the development process. The VR prototype was also useful to produce content for the experience since the final product was not ready in time. So, this experience could replace the real one, potentially saving time in the development process. However, the VR prototype was being developed in parallel with other parts of the project, which made it, on the one hand, independent of other parties, but difficult to assume time-saving at the end of the process. Iterative VR testing could also have taken place several months earlier, during the development phase of the 3D model, so the feedback could be implemented in an earlier design. However, such an approach was not applied in this study. VR cannot be used in the last stages of the NPD cycle, since the product must become physical at some point. Moreover, VR is also known as a bad choice for detail design. Feedback for changes should be provided when parts of the experience do not work as intended. Thus, waiting to test for problems when building the final box would have left no opportunity for revising the development.
Finally, we still consider the main issue to be the neglect of the social context in this test, rendering VR still suitable during the embodiment phase of the product innovation cycle for its spatial aspects and user flow. A multi-person experience (e.g., VR arcades) would have been useful, but did not fit within the budget. Another option, building a physical dev kit, would have implied more work and thus a higher cost and lead time. This was an advantage of VR over physical prototype development. This implies that if the cost of VR development decreases or becomes more predictable, it could be easier to implement VR in the NPD process. These findings could also indicate that VR might be used in more technical or practical use cases in contrast to social or open-ended scenarios.

4.3. Enhancing VR Prototyping for Future Research

The study points to several areas where VR prototyping can be further enhanced to better support the NPD process. One of the key challenges identified is the lack of realistic interactions in VR. The weak spot of VR at this moment is rendering subtle interaction elements since they can be hindered by the level of technological development today. Future research could assess how much a concept can be trimmed down to still elicit valuable and creative reactions from participants. This leaves us with a remaining question: whether interactions will ever become realistic enough and if this type of research should be focused on realistic interactions, as some interactions did not always work as intended, partially due to too little onboarding and partially due to some malfunctioning of the system. VR limited testing things exactly as in reality in terms of interaction, for example, when play space boundaries showed up. Another example was the difficulty to distinguish between the parts of the experience that were interactive and those that were not. This implies that VR can be used as a tool for assessing usability but can be challenging in execution.
Some interactions remain difficult both in VR and in real life such as, the understanding of a stepping interaction on a light emitting disc. Some interactions, like grabbing a ticket, turned out to be much harder in VR compared to real life. This received some criticism. This implies that caution is still needed when analysing and assessing interaction functionalities in VR. This is especially true when the interactions are precise and intricate or if the interaction consists of multiple steps. Nonetheless, VRT remains especially useful for visual things (e.g., getting one’s attention, showing the way).
This study reveals that while VR can reduce the need for physical prototypes and potentially save time and resources, it is not a replacement for final product testing. The final physical product test yielded the highest level of validity. As a result, more of the weaknesses of VR became apparent only when testing in real life, the most remarkable being obstructed visuals, standing still for a long time and the difference in perception between avatars and real people. This main issue was the result of the neglect of social context. When the real box was delivered, many other small, detailed problems rose to the surface that were too subtle to see in VR (for example, providing a bin for used tickets, ambient noise or excessive heat). When testing with multiple users at the same time would have been an option, personal space could have been tested in more detail. It is still hard to assess which problems will remain after testing with VR prototypes. It should be noted that changes to the final product were not possible anymore, leaving little room for experimental control or adjustments. VR might have introduced a kind of novelty effect that resulted in more positive reception compared to the final test. In terms of functionality, some parallels between VR and real life can be drawn. Some examples were walking past certain interfaces, not understanding the general user flow and doubts encountered with new interaction types. More research is needed for assessing which specific parallels can be drawn with regards to functionality. Additionally, the use of more detailed and robust evaluation instruments such as multimodal interaction analysis (by including gesture and eye-tracking analysis) and specific interaction questionnaires could aid in clarifying the difference observed between virtual and real-life evaluation. The use of event-driven process chain analysis and the application of a human–computer–context interaction framework for mapping interactions might facilitate discerning differences between virtual testing and testing with the final prototype as well.

5. Conclusions

This research investigates the potential of rapid prototypes in immersive virtual environments (IVEs) for user testing. Such virtual environments embody novel ways of design and testing interactions with products in the early stages of development. However, these innovative research and development approaches are still poorly understood. Hence, this paper studies which characteristics of VR testing are beneficial to the NPD process and provides a better understanding of the shortcomings.
The main conclusions of this work were, first, that when it comes to the main attributes of user testing and rapid prototyping in VR, the visual fidelity (being able to holistically grasp the product and the environment in a visual way) is the main advantage VR testing delivered to enhance the design phase within a multistakeholder NPD process. More specifically, VR enabled a level of visualization beyond the traditional capabilities of 3D renders or sketches. As a consequence, during the early and middle stages of the development process, this establishes better mutual conceptual understanding between the wide variety of (internal and external) stakeholders. In future research, this could be extended to mixed reality settings, which would allow for more realistic visual elements (see, for example, Kjeldskov and Skov [38]), e.g., testing with full-colour passthrough or lidar environment scanning on newer types of hardware combined with multi-person testing. This could be an interesting follow-up study to explore more contextual realism in the visual domain.
Second, besides the visual fidelity, this study also revealed that VR testing is perceived as more interactive and realistic compared to paper prototyping, which could be labelled as the degree of interaction fidelity in line with the research of Sefelin [11]. As innovative products are increasingly interactive in nature, entailing complex, ubiquitous, embodied, contextual interactions, such interaction fidelity will gain importance and traditional screen-based prototyping and testing will be challenged and the interactions will become harder to design and research.
However, the potential of VR testing is dependent on a couple of boundary conditions that need to be well-understood and taken into account to maximize the fidelity of the test. The first boundary condition is the realism in VR environments compared to the real world. Although the interaction fidelity of VR environments is higher compared to paper prototyping, and users are able to understand and experience the product at a conceptual level, some more complex interactions are still perceived as rather difficult and can impact the usability assessment of the system. As discussed by Maurya et al. [10], for example, MR applications could relate to more realistic test user behaviour compared to VR applications. Similarly, using hand tracking in combination with haptic interfaces interactions could further improve the interaction fidelity (as proposed by Seth et al. [26]).
A second boundary condition is the relationship between the medium and the message. Being in VR is still new for a lot of people, which causes interrelated behaviour (being in the medium and interacting with the medium), e.g., when onboarding and learning to work with the technology. One should consider their degree of familiarity with VR and consider sufficient warming-up, explanation and time to become familiar with the system (decreasing medium-related novelty effects, joy bias and errors).
A final boundary condition is the social context. While the interactions and physical environment are adequately experienced, the validity of multi-user/multi-agent interaction contexts require high levels of agent realism. Merely adding static, non-responsive avatars is insufficient to fully represent the intricacies of such complex contexts. Nevertheless, this has a high impact on the way the product is being used and experienced. As a result, the effect of realistic avatar interaction on user experience should be explored in future research [55,56].
This research sheds new light on the domain of user research in virtual environments by comparatively studying different prototyping environments within a single NPD process. Similar research like, for example, that of Kang [16], leverages AR technology for the evaluation of products designed for operation and the experience of a single user. This study’s findings closely relate to Kang’s, but broaden the scope by involving stakeholders from diverse domains and backgrounds in an ongoing development phase. Unlike most studies, which typically compare multiple competing products (e.g., Palacios [3]), our research focuses on examining prototypes within a single product. This contribution adds to the field by systematically analysing multiple methods of prototyping using different evaluation methods. This study concludes with a favourable evaluation of the use of VR testing in the prototyping and user testing process, where visual and interaction fidelity are promising attributes to consider. Nonetheless, three boundary conditions were identified to consider in future research.

Author Contributions

Conceptualization, B.R., B.B. and J.J.; methodology, B.R., B.B. and J.J.; software, J.J.; validation, J.J.; formal analysis, J.J. and B.B.; data curation, J.J.; writing—original draft preparation, J.J.; writing—review and editing, J.J.; visualization, J.J.; supervision, J.S., K.B., L.D.M. and B.B.; project administration, B.B.; funding acquisition, B.B. All authors have read and agreed to the published version of the manuscript.

Funding

This project was co-financed by the European Regional Development Fund through the Urban Innovation Actions (UIA) initiative.

Institutional Review Board Statement

This study was conducted in accordance with the conduct of the city of Ghent, and approved by the Institutional Review Board (or Ethics Committee) of Ghent University.

Informed Consent Statement

Informed consent was obtained from all the subjects involved in this study.

Data Availability Statement

The datasets generated during and/or analysed during the current study can be consulted via the following link: https://osf.io/vqjdr/?view_only=66e1426d95b64feeaf4644b4592053e5 (accessed on 16 April 2024).

Conflicts of Interest

The authors declare no conflict of interest.

Appendix A

Table A1. Normality test.
VariableShapiro_wShapiro_pKolmogorov_dKolmogorov_pParametric/
Non-Parametric
Involvement_paper0.870.000.110.51Non-parametric
Involvement_VR0.950.200.150.10Parametric
Presence_paper0.910.020.160.07Non-parametric
Presence_VR0.960.420.120.42Parametric
Realism_paper0.940.150.150.14Parametric
Realism_VR0.980.790.100.73Parametric
Interactivity_paper0.970.540.090.83Parametric
Interactivity_VR0.970.550.120.45Parametric
MARS_paper0.920.040.140.18Non-parametric
MARS_VR0.980.920.090.79Parametric
ASQ_paper0.940.120.140.23Parametric
ASQ_VR0.930.080.200.01Non-parametric

References

  1. Soute, I.; Vacaretu, T.; De Wit, J.; Markopoulos, P. Design and evaluation of RaPIDO, A platform for rapid prototyping of interactive outdoor games. ACM Trans. Comput.-Hum. Interact. 2017, 24, 1–30. [Google Scholar] [CrossRef]
  2. Söderman, M. Virtual reality in product evaluations with potential customers: An exploratory study comparing virtual reality with conventional product representations. J. Eng. Des. 2005, 16, 311–328. [Google Scholar] [CrossRef]
  3. Palacios-Ibáñez, A.; Pirault, S.; Ochando-Martí, F.; Contero, M.; Camba, J.D. An examination of the relationship between visualization media and consumer product evaluation. IEEE Trans. Vis. Comput. Graph. 2023, 30, 3636–3649. [Google Scholar] [CrossRef]
  4. Lim, Y.K.; Stolterman, E.; Tenenberg, J. The anatomy of prototypes: Prototypes as filters, prototypes as manifestations of design ideas. ACM Trans. Comput.-Hum. Interact. 2008, 15, 1–27. [Google Scholar] [CrossRef]
  5. Hoppmann, J.; Zurich, E.; Dombrowski, U.; Zahn, T. A Framework for Organizing Lean Product Development. Eng. Manag. J. 2011, 23, 3–15. [Google Scholar] [CrossRef]
  6. Quaresma, M.; Soares, M.M.; Correia, M. UX Concepts and Perspectives–From Usability to User-Experience Design. In Handbook of Usability and User-Experience; CRC Press: Boca Raton, FL, USA, 2022; pp. 3–16. [Google Scholar]
  7. Araújo, D.; Davids, K.; Passos, P. Ecological validity, representative design, and correspondence between experimental task constraints and behavioral setting: Comment on Rogers, Kadar, and Costall (2005). In Ecological Psychology; Lawrence Erlbaum Associates Inc.: Mahwah, NJ, USA, 2007; Volume 19, pp. 69–78. [Google Scholar] [CrossRef]
  8. Holleman, G.A.; Hooge, I.T.; Kemner, C.; Hessels, R.S. The ‘real-world approach’and its problems: A critique of the term ecological validity. Front. Psychol. 2020, 11, 721. [Google Scholar] [CrossRef]
  9. Nastase, S.A.; Goldstein, A.; Hasson, U. Keep it real: Rethinking the primacy of experimental control in cognitive neuroscience. NeuroImage 2020, 222, 117254. [Google Scholar] [CrossRef]
  10. Maurya, S.; Takeda, Y.; Mougenot, C. Enabling designers to generate concepts of interactive product behaviours: A mixed reality design approach. In Proceedings of the International Conference on Engineering Design, ICED, Delft, The Netherlands, 5–8 August 2019; Cambridge University Press: Cambridge, UK, 2019; pp. 1933–1942. [Google Scholar] [CrossRef]
  11. Sefelin, R.; Tscheligi, M.; Giller, V. Paper Prototyping-What is it good for? A Comparison of Paper-and Computer-based Low-fidelity Prototyping. In CHI’03 Extended Abstracts on Human Factors in Computing Systems; Association for Computing Machinery: New York, NY, USA, 2003; pp. 778–779. [Google Scholar]
  12. Affairs, P. 2014. Available online: https://www.usability.gov/how-to-and-tools/methods/prototyping.html (accessed on 1 May 2022).
  13. Goel, V. Sketches of Thought; MIT Press: Cambridge, MA, USA, 1995. [Google Scholar]
  14. Liikkanen, L.A.; Kilpiö, H.; Svan, L.; Hiltunen, M. Lean UX—The next generation of user-centered Agile development? In Proceedings of the NordiCHI 2014: The 8th Nordic Conference on Human-Computer Interaction: Fun, Fast, Foundational, Helsinki, Finland, 26–30 October 2014; Association for Computing Machinery: New York, NY, USA, 2014; pp. 1095–1100. [Google Scholar] [CrossRef]
  15. Oztoprak, A.; Erbug, C. Field versus Laboratory Usability Testing: A First Comparison. 2008. Available online: https://www.researchgate.net/profile/Cigdem-Erbug/publication/228982599_Field_versus_laboratory_usability_testing_A_first_Comparison/links/54476a5a0cf22b3c14e0d7fc/Field-versus-laboratory-usability-testing-A-first-Comparison.pdf (accessed on 21 October 2024).
  16. Kang, B.; Crilly, N.; Ning, W.; Kristensson, P.O. Prototyping to elicit user requirements for product development: Using head-mounted augmented reality when designing interactive devices. Des. Stud. 2023, 84, 101147. [Google Scholar] [CrossRef]
  17. Kaikkonen, A.; Kekäläinen, A.; Cankar, M.; Kallio, T.; Kankainen, A. Usability Testing of Mobile Applications: A Comparison between Laboratory and Field Testing. J. Usability Stud. 2005, 1, 23–28. [Google Scholar]
  18. Marcilly, R.; Monkman, H.; Pelayo, S.; Lesselroth, B.J. Usability Evaluation Ecological Validity: Is More Always Better? Healthcare 2024, 12, 1417. [Google Scholar] [CrossRef]
  19. Koskinen, I.; Kuusela, K.; Battarbee, K.; Soronen, A.; Mäyrä, F.; Mikkonen, J.; Zakrzewski, M. Morphome: A Constructive Field Study of Proactive Information Technology in the Home. 2006. Available online: https://www.misterhouse.net (accessed on 16 October 2024).
  20. Cornwall, A.; Jewkes, R. What Is Participatory Research? Soc. Sci. Med. 1995, 41, 1667–1676. [Google Scholar] [CrossRef] [PubMed]
  21. Ali, H. Understanding the Roles of Low-fidelity Prototypes in Engineering Design Activity Understanding Practical Ingenuity Through the Roles of Low-Fidelity Prototyping in Engineering Design Activity. In Proceedings of the ASEE Annual Conference, Tampa, FL, USA, 16–19 June 2019. [Google Scholar]
  22. Wang, X.; Chen, R. An experimental study on collaborative effectiveness of augmented reality potentials in urban design. CoDesign 2009, 5, 229–244. [Google Scholar] [CrossRef]
  23. Russo, M. AR in the Architecture Domain: State of the Art. Appl. Sci. 2021, 11, 6800. [Google Scholar] [CrossRef]
  24. Kandi, V.R.; Castronovo, F.; Brittle, P.; Ventura, S.M.; Nikolic, D. Assessing the Impact of a Construction Virtual Reality Game on Design Review Skills of Construction Students. J. Archit. Eng. 2020, 26, 04020035. [Google Scholar] [CrossRef]
  25. Koretsky, M.; Kelly, C.; Gummer, E. Student perceptions of learning in the laboratory: Comparison of industrially situated virtual laboratories to capstone physical laboratories. J. Eng. Educ. 2011, 100, 540–573. [Google Scholar] [CrossRef]
  26. Seth, A.; Vance, J.M.; Oliver, J.H. Virtual reality for assembly methods prototyping: A review. Virtual Real. 2011, 15, 5–20. [Google Scholar] [CrossRef]
  27. Guiseppe, C.; Giuliniana, U.; Jelena, P. JCAD-VR: A collaborative design tool for architects. In Proceedings of the 4th International Conference on Collaborative Virtual Environments, Bonn, Germany, 30 September–2 October 2002; pp. 153–154. [Google Scholar]
  28. Coburn, J.Q.; Freeman, I.; Salmon, J.L. A review of the capabilities of current low-cost virtual reality technology and its potential to enhance the design process. J. Comput. Inf. Sci. Eng. 2017, 17, 031013. [Google Scholar] [CrossRef]
  29. Wang, G.G. Definition and review of virtual prototyping. J. Comput. Inf. Sci. Eng. 2002, 2, 232–236. [Google Scholar] [CrossRef]
  30. Yen, P.-Y.; Bakken, S. A Comparison of Usability Evaluation Methods: Heuristic Evaluation versus End-User Think-Aloud Protocol—An Example from a Web-based Communication Tool for Nurse Scheduling. In AMIA Annual Symposium Proceedings; American Medical Informatics Association: Bethesda, MD, USA, 2009; Volume 2009, p. 714. [Google Scholar]
  31. de Regt, A.; Barnes, S.J.; Plangger, K. The virtual reality value chain. Bus. Horiz. 2020, 63, 737–748. [Google Scholar] [CrossRef]
  32. Bhandari, J.; MacNeilage, P.R.; Folmer, E. Teleportation without Spatial Disorientation Using Optical Flow Cues. In Proceedings of the Graphics Interface, Toronto, ON, Canada, 8–11 May 2018; pp. 162–167. [Google Scholar]
  33. Iskander, J.; Hossny, M.; Nahavandi, S. A review on ocular biomechanic models for assessing visual fatigue in virtual reality. IEEE Access 2018, 6, 19345–19361. [Google Scholar] [CrossRef]
  34. Zhou, Y.; Guo, H. Research on methods of product evaluation based on user experience. In ACM International Conference Proceeding Series; Association for Computing Machinery: New York, NY, USA, 2018; pp. 282–287. [Google Scholar] [CrossRef]
  35. Mukherjee, A.; Hoyer, W.D. The Effect of Novel Attributes on Product Evaluation. 2001. Available online: https://academic.oup.com/jcr/article/28/3/462/1830079 (accessed on 16 October 2024).
  36. Walker, M.; Takayama, L.; Landay, J.A. High-Fidelity or Low-Fidelity, Paper or Computer? Choosing Attributes When Testing Web Prototypes. 2002. Available online: http://guir.berkeley.edu/prototypefidelity (accessed on 16 October 2024).
  37. Calder, B.J.; Phillips, L.W.; Tybout, A.M. The Concept of External Validity. 1982. Available online: https://www.jstor.org/stable/2488620 (accessed on 16 October 2024).
  38. Kjeldskov, J.; Skov, M.B. Studying Usability In Sitro: Simulating Real World Phenomena in Controlled Environments. Int. J. Hum. Comput. Interact. 2007, 22, 7–36. [Google Scholar] [CrossRef]
  39. Peeters, M. Experiential Design Landscapes: Design Research in the Wild. 2013. Available online: https://www.nordes.org (accessed on 16 October 2024).
  40. Lipp, N.; Sterna, R.; Duzmańska-Misiarczyk, N.; Strojny, A.; Poeschl-Guenther, S.; Strojny, P. VR Realism Scale-Revalidation of contemporary VR headsets on a Polish sample. PLoS ONE 2021, 16, e0261507. [Google Scholar] [CrossRef] [PubMed]
  41. Slater, M. Immersion and the illusion of presence in virtual reality. Br. J. Psychol. 2018, 109, 431. [Google Scholar] [CrossRef] [PubMed]
  42. Schwind, V.; Knierim, P.; Haas, N.; Henze, N. Using presence questionnaires in virtual reality. In Proceedings of the Conference on Human Factors in Computing Systems, Glasgow, UK, 4–9 May 2019; Association for Computing Machinery: New York, NY, USA, 2019. [Google Scholar] [CrossRef]
  43. Steuer, J.; Reeves, B. Defining Virtual Reality: Dimensions Determining Telepresence. 1992. Available online: http://www.cyborganic.com/ (accessed on 16 October 2024).
  44. Mütterlein, J. The Three Pillars of Virtual Reality? Investigating the Roles of Immersion, Presence, and Interactivity. 2018. Available online: http://hdl.handle.net/10125/50061 (accessed on 16 October 2024).
  45. Terhorst, Y.; Philippi, P.; Sander, L.B.; Schultchen, D.; Paganini, S.; Bardus, M.; Santo, K.; Knitza, J.; Machado, G.C.; Schoeppe, S.; et al. Validation of the mobile application rating scale (MARS). PLoS ONE 2020, 15, e0241480. [Google Scholar] [CrossRef]
  46. Aaron, W. Designing for Emotion; New York, NY, USA. 2011. Available online: https://theswissbay.ch/pdf/Gentoomen%20Library/The%20Actually%20Useful%20Programming%20Library/Design/Designing%20for%20Emotion%20-%20Spool%20-%20A%20Book%20Apart%20%282011%29.pdf (accessed on 14 September 2022).
  47. Nielsen Group. Available online: https://www.nngroup.com/articles/usability-101-introduction-to-usability/ (accessed on 14 September 2022).
  48. Lewis, J.R. Psychometric Evaluation of an after-Scenario Questionnaire for Computer Usability Studies: The ASQ. ACM Sigchi Bull. 1991, 23, 78–81. [Google Scholar] [CrossRef]
  49. Group, N.N. When to Use Which User-Experience Research Methods. (n.d.). Nielsen Norman Group. Available online: https://www.nngroup.com/articles/which-ux-research-methods/ (accessed on 14 September 2022).
  50. Harlen, W.; James, M. Assessment and learning: Differences and relationships between formative and summative assessment. Int. J. Phytoremediation 1997, 21, 365–379. [Google Scholar] [CrossRef]
  51. Pahl, G.; Beitz, W. Engineering Design; London, Springer. 1996. Available online: https://link.springer.com/book/10.1007/978-1-4471-3581-4 (accessed on 16 April 2024).
  52. Cross, N. Engineering Design Methods: Strategies for Product Design; John Wiley & Sons: Hoboken, NJ, USA, 2021. [Google Scholar]
  53. Van Someren, M.; Barnard, Y.F.; Sandberg, J. The Think Aloud Method: A Practical Guide to Modelling Cognitive Processes; Academic Press: Cambridge, MA, USA, 1994. [Google Scholar]
  54. Valdespino, A. After-Scenario Questionnaire (ASQ). 2019. Available online: https://help.qualaroo.com/hc/en-us/articles/360039070552-After-Scenario-Questionnaire-ASQ- (accessed on 16 October 2024).
  55. Hayes, A.L.; Ulinski, A.C.; Hodges, L.F. That avatar is looking at me! social inhibition in virtual worlds. In Proceedings of the Intelligent Virtual Agents: 10th International Conference, IVA 2010, Philadelphia, PA, USA, 20–22 September 2010; Springer: Berlin/Heidelberg, Germany, 2010; pp. 454–467. [Google Scholar]
  56. Zheleva, A.; Emmerechts, E.; Declercq, A.; Bombeke, K.; Talsma, D.; De Marez, L. Identity in Pixels: The Interplay of Personality, Self-Discrepancy, and Avatar Type in Social Virtual Reality Communication. In Etmaal van de Communicatiewetenschap; Ghent University Researchers Location: Songdo, Republic of Korea, 2024. [Google Scholar]
Figure 1. Peeters’ landscape of user research methods [39].
Applsci 14 09918 g001
Figure 2. Product innovation cycle according to Pahl and Beitz [51].
Applsci 14 09918 g002
Figure 3. (a) Virtual rendering of the test environment; (b) picture of the inside of the final materialisation of the CoGent box; (c) picture of the outside of the final materialisation of the CoGent box.
Applsci 14 09918 g003
Figure 4. Testing early prototypes in the field.
Applsci 14 09918 g004
Figure 5. (a) The first interface—an introductory touch screen; (b) the 180-wall second interface was controlled using step-activated tiles and was adapted since the interaction of walking along confused participants in the first user test; (c) the final interface—a touch table; (d) arrows on the ground were followed to the next interface.
Applsci 14 09918 g005
Figure 6. Final evaluation in the finished CoGent box.
Applsci 14 09918 g006
Figure 7. Results of comparative test between VR and paper prototyping resulting significant differences of interactivity, presence and realism.
Applsci 14 09918 g007
Table 1. Nielsen’s mapping of methods on the product development stage [49].
Product Development Stage
StrategizeDesignLaunch and Assess
Applsci 14 09918 i001Applsci 14 09918 i002Applsci 14 09918 i003
Research goal:
Find new directions and opportunities
Research goal:
Improve usability of
design
Research goal:
Measure product performance against itself or its competition
Generative research methodsFormative research methodsSummative research
methods
Example Methods
Field studies, diary studies, interviews, surveys,
participatory design, concept testing
Card sorting, tree testing,
usability testing, remote testing (moderated and
unmoderated)
Usability benchmarking, unmoderated UX testing, A/B testing, clickstream analytics, surveys
Disclaimer/Publisher’s Note: The statements, opinions and data contained in all publications are solely those of the individual author(s) and contributor(s) and not of MDPI and/or the editor(s). MDPI and/or the editor(s) disclaim responsibility for any injury to people or property resulting from any ideas, methods, instructions or products referred to in the content.

