Article

Performance Verification and Evaluation of Semi-Active Actuator System Using Quarter Car Lab Simulation with RLDA Data

1
School of Automotive Engineering, Kyungpook National University, Daegu 41566, Republic of Korea
2
Department of Intelligent Systems and Robotics, Chungbuk National University, Cheongju 28644, Republic of Korea
*
Author to whom correspondence should be addressed.
Appl. Sci. 2024, 14(22), 10093; https://doi.org/10.3390/app142210093
Submission received: 14 September 2024 / Revised: 23 October 2024 / Accepted: 30 October 2024 / Published: 5 November 2024

Abstract

:
This study outlines a methodology for determining the durability specifications of electronically controlled dampers by examining performance degradation observed on actual driving roads. It identifies areas of performance decline and the primary causes affecting major actuator dampers. Traditionally, the durability performance of automobile parts has been assessed by calculating damage based on load profiles. However, analyzing actual road conditions is essential because the control commands of electronically controlled suspension systems change in real time according to load conditions. Simulations based on Road Load Data Acquisition (RLDA) use statistically independent representative road surfaces to assess damper deterioration performance. Following this analysis, a rig test of the damper is performed to establish the durability specifications for damper actuator products. The primary form of performance degradation observed was a change in the tensile damping force, which was more substantial than the degradation observed on the compression side. Oil leakage and cavitation were identified as significant influencing factors from a Failure Mode and Effects Analysis (FMEA) perspective. The study concludes that additional design research is necessary, focusing on damper oil and leakage, while also considering the control algorithm’s effects in designing electronically controlled dampers.

1. Introduction

1.1. Background

A car’s suspension system supports its own weight and, at the same time, absorbs and alleviates vibration caused by irregular road surfaces and prevents the vibration from being transmitted as a direct impact to the car body. Through this mechanism, the suspension device can improve the riding comfort of vehicle occupants and reduce dynamic stress transmitted to each part of the vehicle body. In order to perform the function of this suspension device, a general suspension device is composed of a spring with appropriate elasticity as an elastic element that softens vibration and a damper (shock absorber) as a vibration damping element that can dampen the vibration softened by the spring. The spring absorbs and softens the vibration caused by shocks that occur depending on the road surface conditions. The role of the damper is to shorten the periodic movement time of the spring, which continues the periodic movement of the natural frequency due to its unique elastic coefficient.
In response to consumers’ desire for more comfort, automobile suspension systems have developed remarkably through fierce competition and research and development among each manufacturer. Research has recently been conducted to realize more advanced riding comfort with new systems. The development of dampers with active variable damping force dominates the recent development trend of automobile suspension systems. A good example is a continuous variable damper such as the semi-active damper that our company is developing. Unlike the existing passive damper, which has damping force characteristics arbitrarily determined by the operating speed regardless of existing irregular road surface conditions and changes in the driving environment, such as sudden braking, sudden steering, or tire rotation speed, the semi-active damper is designed to adapt to the driving environment of the car. It is an active damper that changes the damping force characteristics of the damper to suit the driving environment as it changes. In other words, it is a type of damping force-variable damper that controls the damping force characteristics by selecting and changing the size of the orifice of the damper valve judged by the ECU based on the data input from various sensors that are attached to the car body and recognize the driving environment.
Recently, as with the performance of automobile parts, one of the things that consumers greatly demand is the durability and reliability of the product’s performance. The reliability of durability performance is one of the essential matters to consider during the design stage of an automobile. In addition, when the demand for weight reduction and safety is growing, its importance is already being emphasized to all manufacturers. In particular, the quality warranty period is being extended at home and abroad by the recent trend of rapid technological improvement in automobiles and the strengthening of consumer rights protection, so the development of reliability test technology for the durability performance of products can be considered an essential technology in terms of quality assurance.

1.2. Purpose of the Study

In the past, vehicle durability tests were typically conducted at the proving ground (PG) to evaluate the durability of vehicle actuator systems. These tests are advantageous because they are carried out under real-world conditions, allowing for an accurate evaluation of the vehicle’s durability and its components. However, there are issues with the long duration of the tests and their susceptibility to weather and other external factors. As a result, Computer-Aided Testing (CAT) technology has been developed to simulate driving conditions in a lab setting, offering improved test reproducibility and cost reduction.
To verify the suitability of vehicle design, three tests are necessary: a lab simulation test, target durability test, and consumer environmental test. If a design passes all three tests, it is deemed suitable. However, the consumer environmental test, which is conducted under real driving conditions, is time-consuming. The main goal of the traditional durability evaluation method is to obtain the load road profile. However, in the case of electronically controlled suspension, the load condition of the system is not constant but varies significantly depending on the road surface condition and driving condition. This variability, particularly the impact of the road surface and driving condition, is a critical factor that the suspension system control algorithm must account for. In other words, a load profile that considers the appropriate control pattern for the actual road is required, which explains the necessity of RLDA-based simulation.
The reliability of electronically controlled suspension systems is determined by the load conditions generated according to driving conditions as additional input conditions of the control system. Therefore, unlike the durability evaluation mode of general mechanical parts, an evaluation mode should be developed by identifying the characteristics of the control system that occur in general conditions. This study proposes a lab simulation environment and operating conditions corresponding to the severity of conditions to establish durability specifications and system reliability criteria for electronically controlled suspension systems and develop a reliability evaluation mode for electronically controlled dampers. Based on this evaluation method, the performance degradation phenomena and causes of electronically controlled dampers were analyzed, and the primary direction for defining durability specifications was proposed.

1.3. Related Works

The durability of vehicle parts is usually tested by gathering road load data and evaluating the severity of the conditions applied to the parts. Studies have also been conducted to assess durability performance by replicating real road conditions in controlled environments, considering multiaxial load situations. Durability evaluation and prediction research has been conducted to verify the structural fatigue strength and rigidity of vehicle parts by measuring actual vehicle loads. Efficient durability performance evaluation research mainly uses accelerated durability or CAE methods [1,2,3]. The MPIP method uses wavelet transform to edit load spectra, reducing time duration without significant index changes [4]. The TCFD method, based on a multi-section minimum standard deviation spectrum, proves practical and representative of proving ground load spectra [5].
Similarly, a Wigner–Ville transform-based editing method incorporating a genetic algorithm for threshold optimization shows superior time duration retention and matching load effects with the original spectrum [6]. These methods offer efficient and accurate accelerated editing techniques for multiaxial load spectra in durability testing, enhancing evaluation processes in automotive and mechanical component testing [7,8,9,10]. Halfpenny provides insights into accelerating dynamic durability tests, which can be crucial for enhancing testing efficiency. Additionally, Gobbi et al. discuss test rigs for automotive suspension characterization, which can offer complementary perspectives on test methods [11,12]. However, it is important to highlight that research on the durability of electronically controlled actuators, crucial in varying the real-time damping force in semi-active systems, is lacking. This underscores the need for further investigation and development in this area.

1.4. Study Outline

This research process, of significant importance in the field of vehicle durability evaluation, can be broadly divided into two parts. Firstly, it can be divided into the RLDA (Road Load Data Acquisition) process. This process plays a crucial role in standardizing the usage environment of general consumers, a key factor in ensuring the reliability of the research. Secondly, the process involves durability evaluation through a simple target durability test and comparative durability evaluation through the lab simulation test.
RLDA conducted actual vehicle testing from two perspectives. First, an analysis was conducted from the perspective of damper movement by performing a ballast test to check the overall severity of the damper operation, and an additional measurement test was performed to simulate a lab environment.
The simulation test, a key component of this research, was conducted with meticulous attention to detail. It involved the selection of the type of sensor to measure the road input load that occurs when driving an actual vehicle on a general road, careful selection of the installation location, and the thorough analysis of data through RLDA. The driving patterns of actual consumers were investigated to determine the actual vehicle driving mode, and road spectra were developed accordingly, ensuring the accuracy of the results.
Simulation tests are performed using road data generated during actual vehicle driving on general roads. The correlation between the actual custom driving environment and the target durability test is confirmed by comparison with the simplified target durability test results, and damper fatigue and damping force degradation are evaluated.

2. System and Failure Mode Analysis

2.1. CDC System and Operation Principle

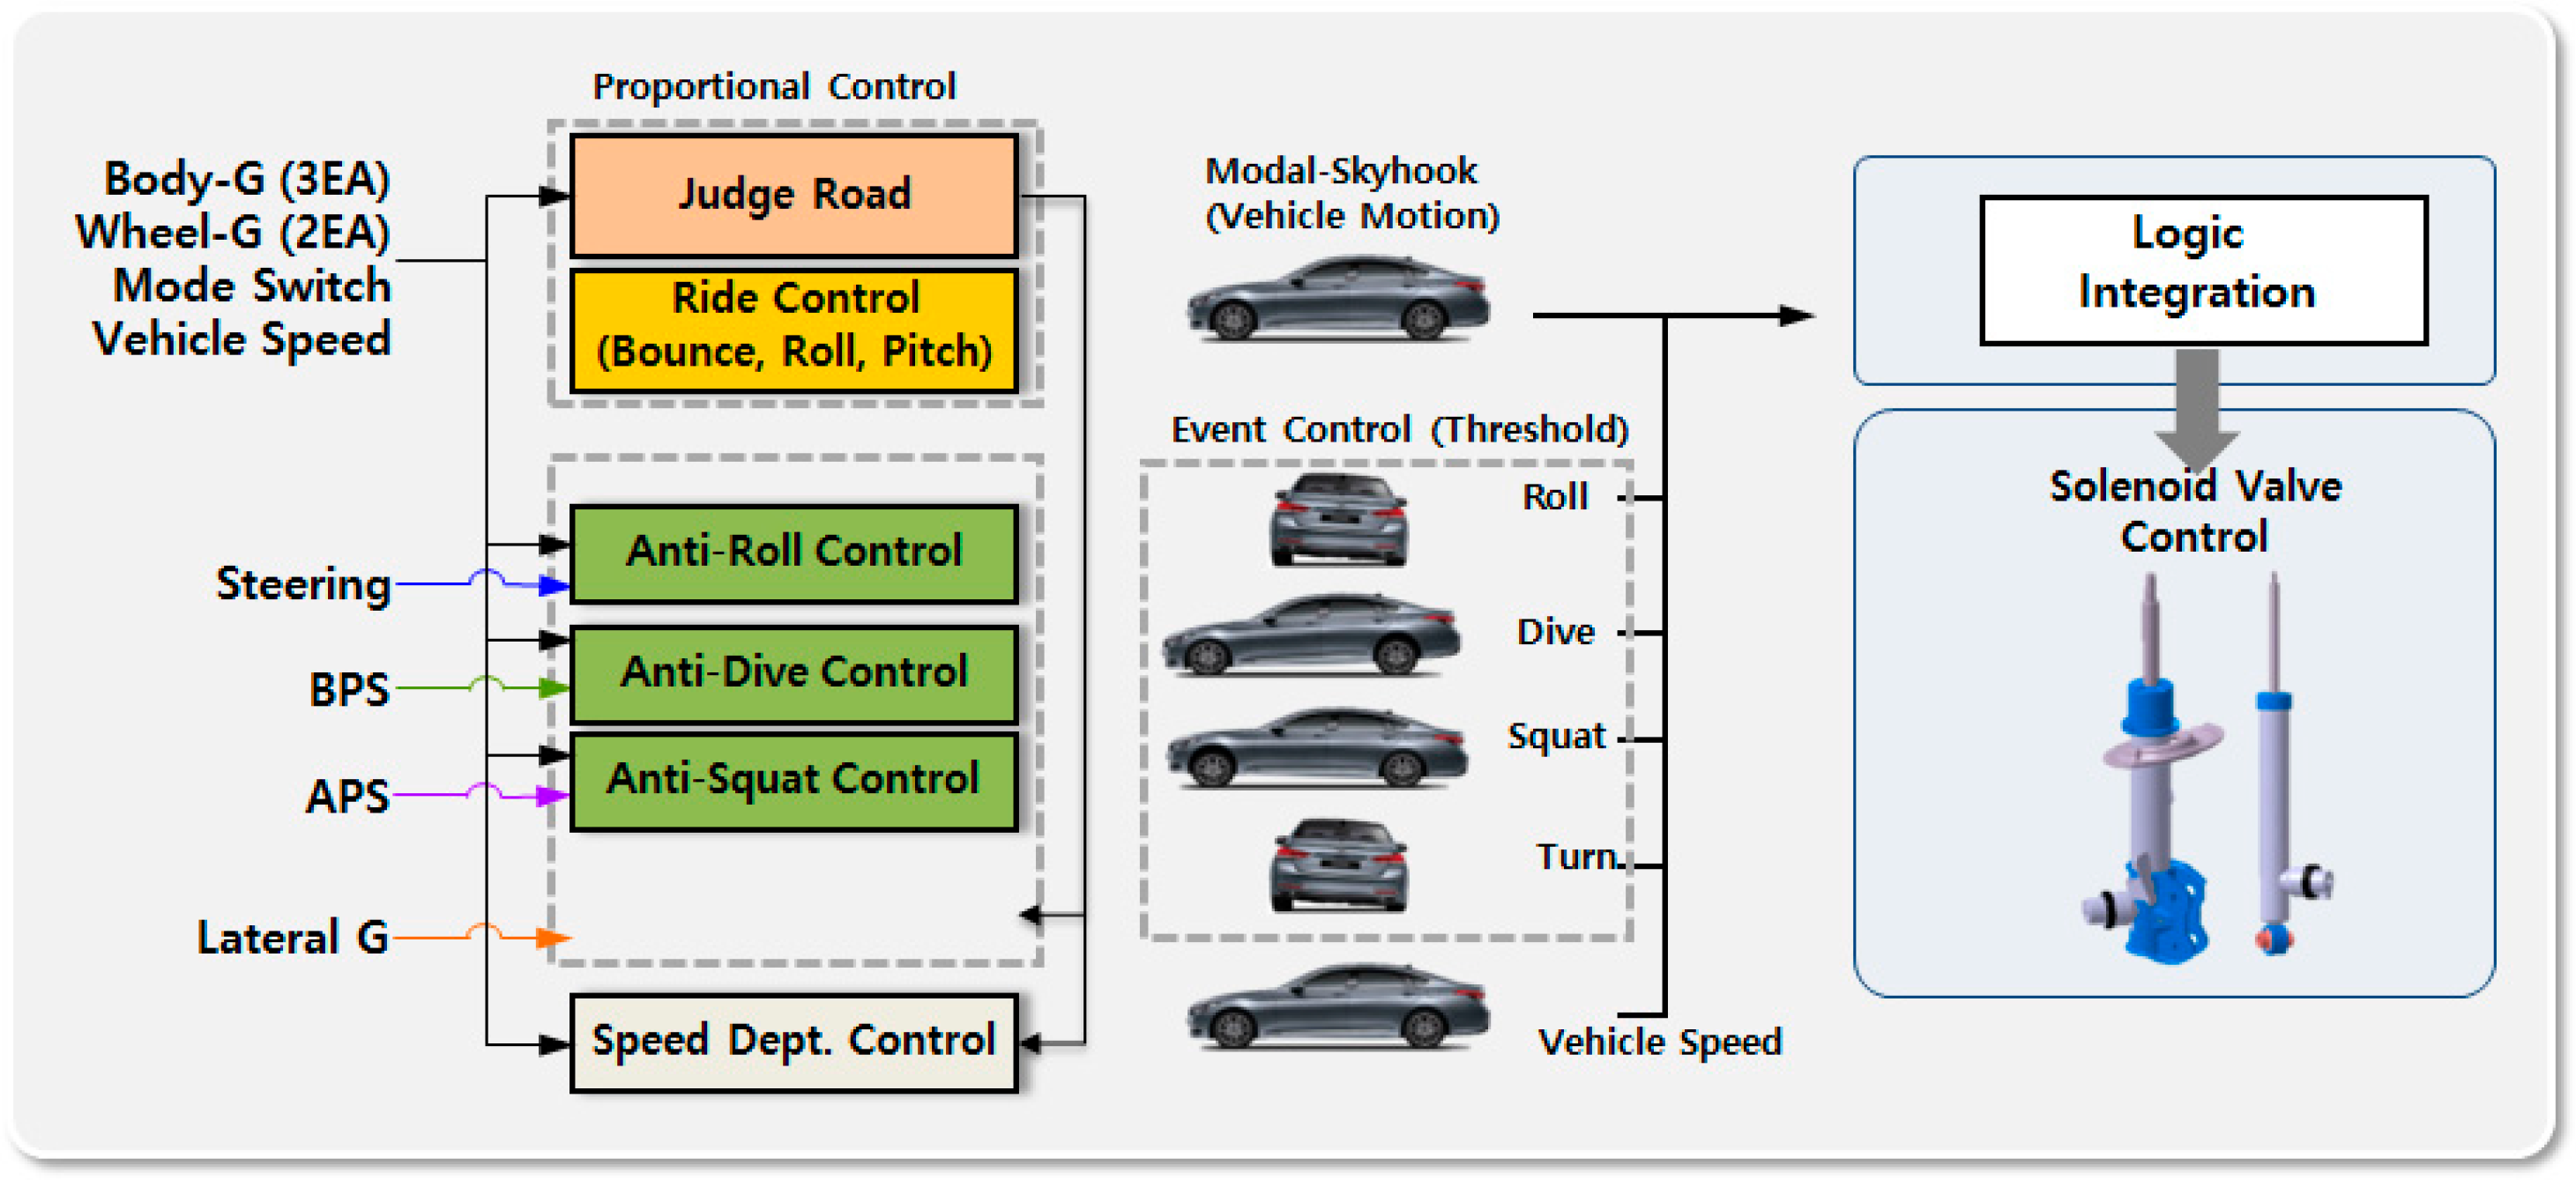
The CDC system optimizes the vehicle’s riding comfort and steering stability by changing the damping force in real time using the acceleration sensor and the vehicle’s internal signals. It receives input from the vehicle’s vertical acceleration sensor, calculates the target damping force to control the vehicle’s behavior, and changes the damping force by changing the solenoid current inside the variable damper. Figure 1 shows the system configuration.
The control logic that generates the necessary target damping force by analyzing the vehicle’s behavior based on the acceleration sensor and internal vehicle signals is schematized in Figure 2. Based on the vehicle acceleration sensor, skyhook control theory is applied to perform real-time damping force proportional control, which controls vehicle ride comfort [13,14,15,16]. Moaaz and Ghazaly explored similar control approaches in semi-active suspension systems using skyhook and groundhook controllers, providing additional insights into control strategies [17]. Additionally, during an event such as a lane change, braking, or acceleration event, control is performed to control vehicle behavior. By integrating the damping force command value based on each vehicle behavior state, proportional solenoid control for changing the damper’s damping force is performed in real time, and the appropriate change in damping force affects vehicle performance [18,19].
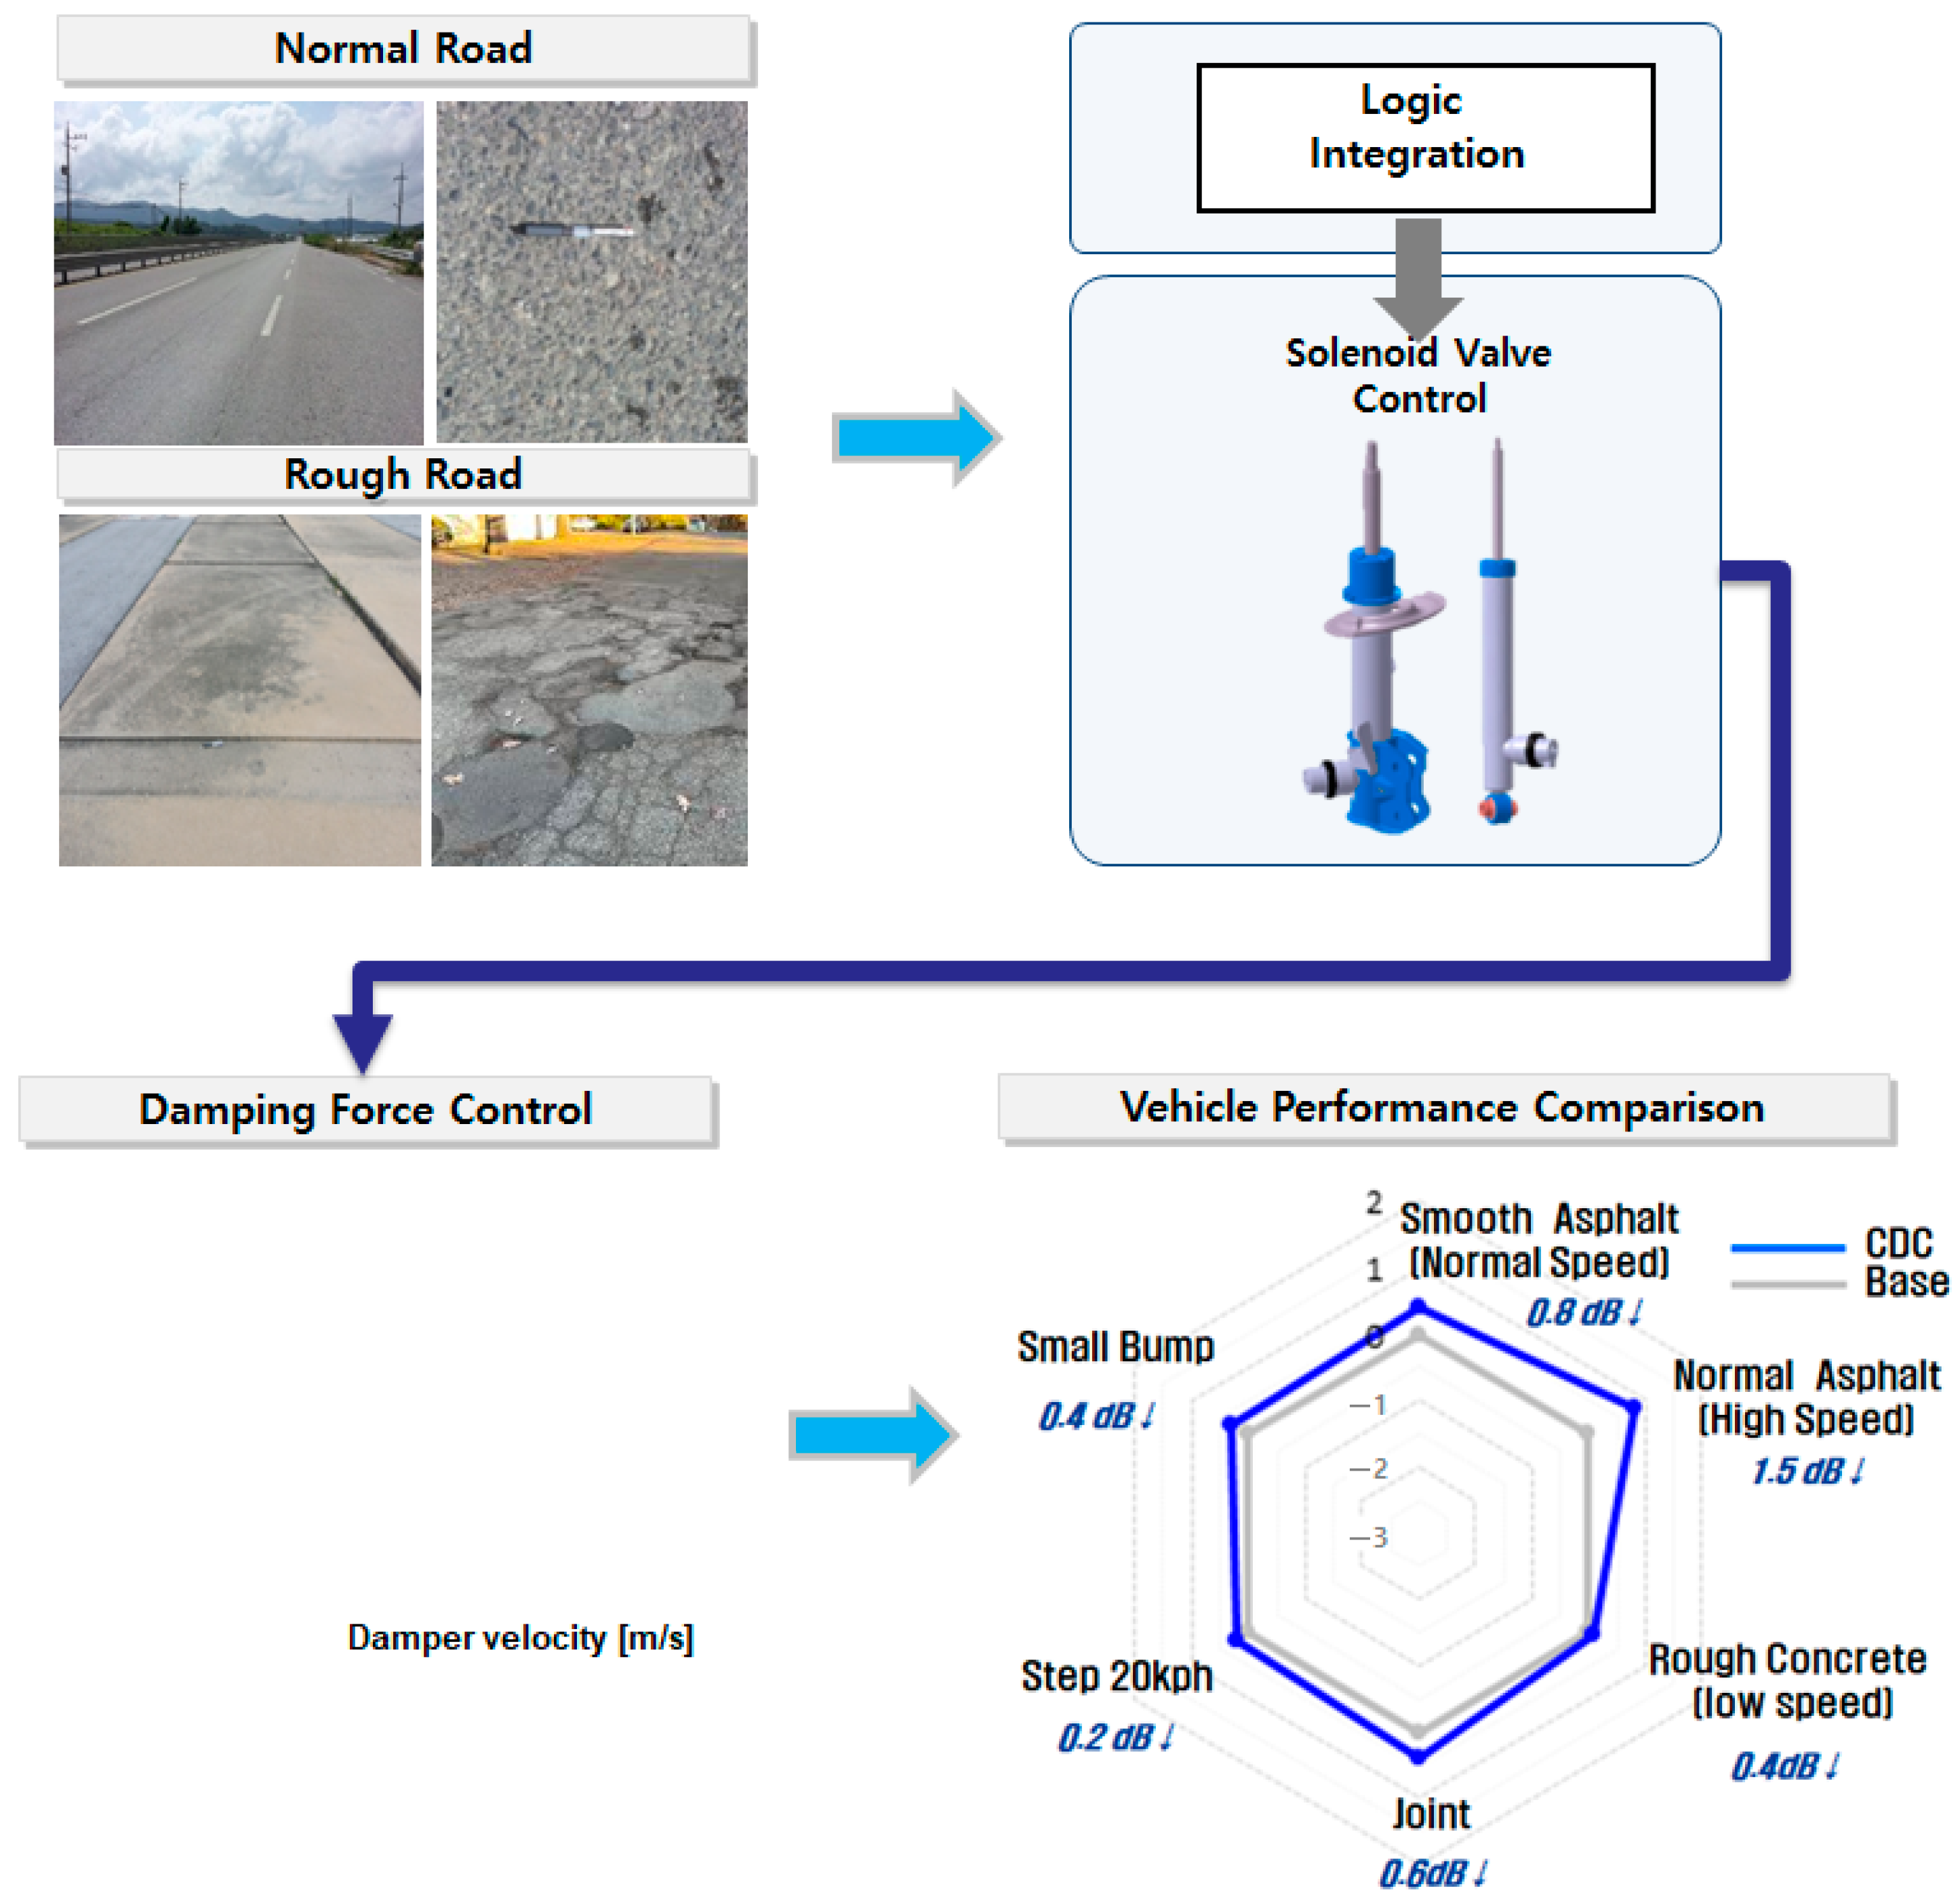
Figure 3 provides an example of how changes in damping force affect vehicle control performance. When the vehicle’s behavior is influenced by the road surface, the system’s damping force control is instrumental in minimizing this impact or bringing it close to an appropriate target physical quantity. This adaptive control is crucial in ensuring optimal vehicle performance, as it allows for constant changes in damping force to be generated, thereby improving vehicle performance. It is important to monitor these changes in damping force performance and major failures while driving to ensure the system’s effectiveness.

2.2. Failure Mode Analysis

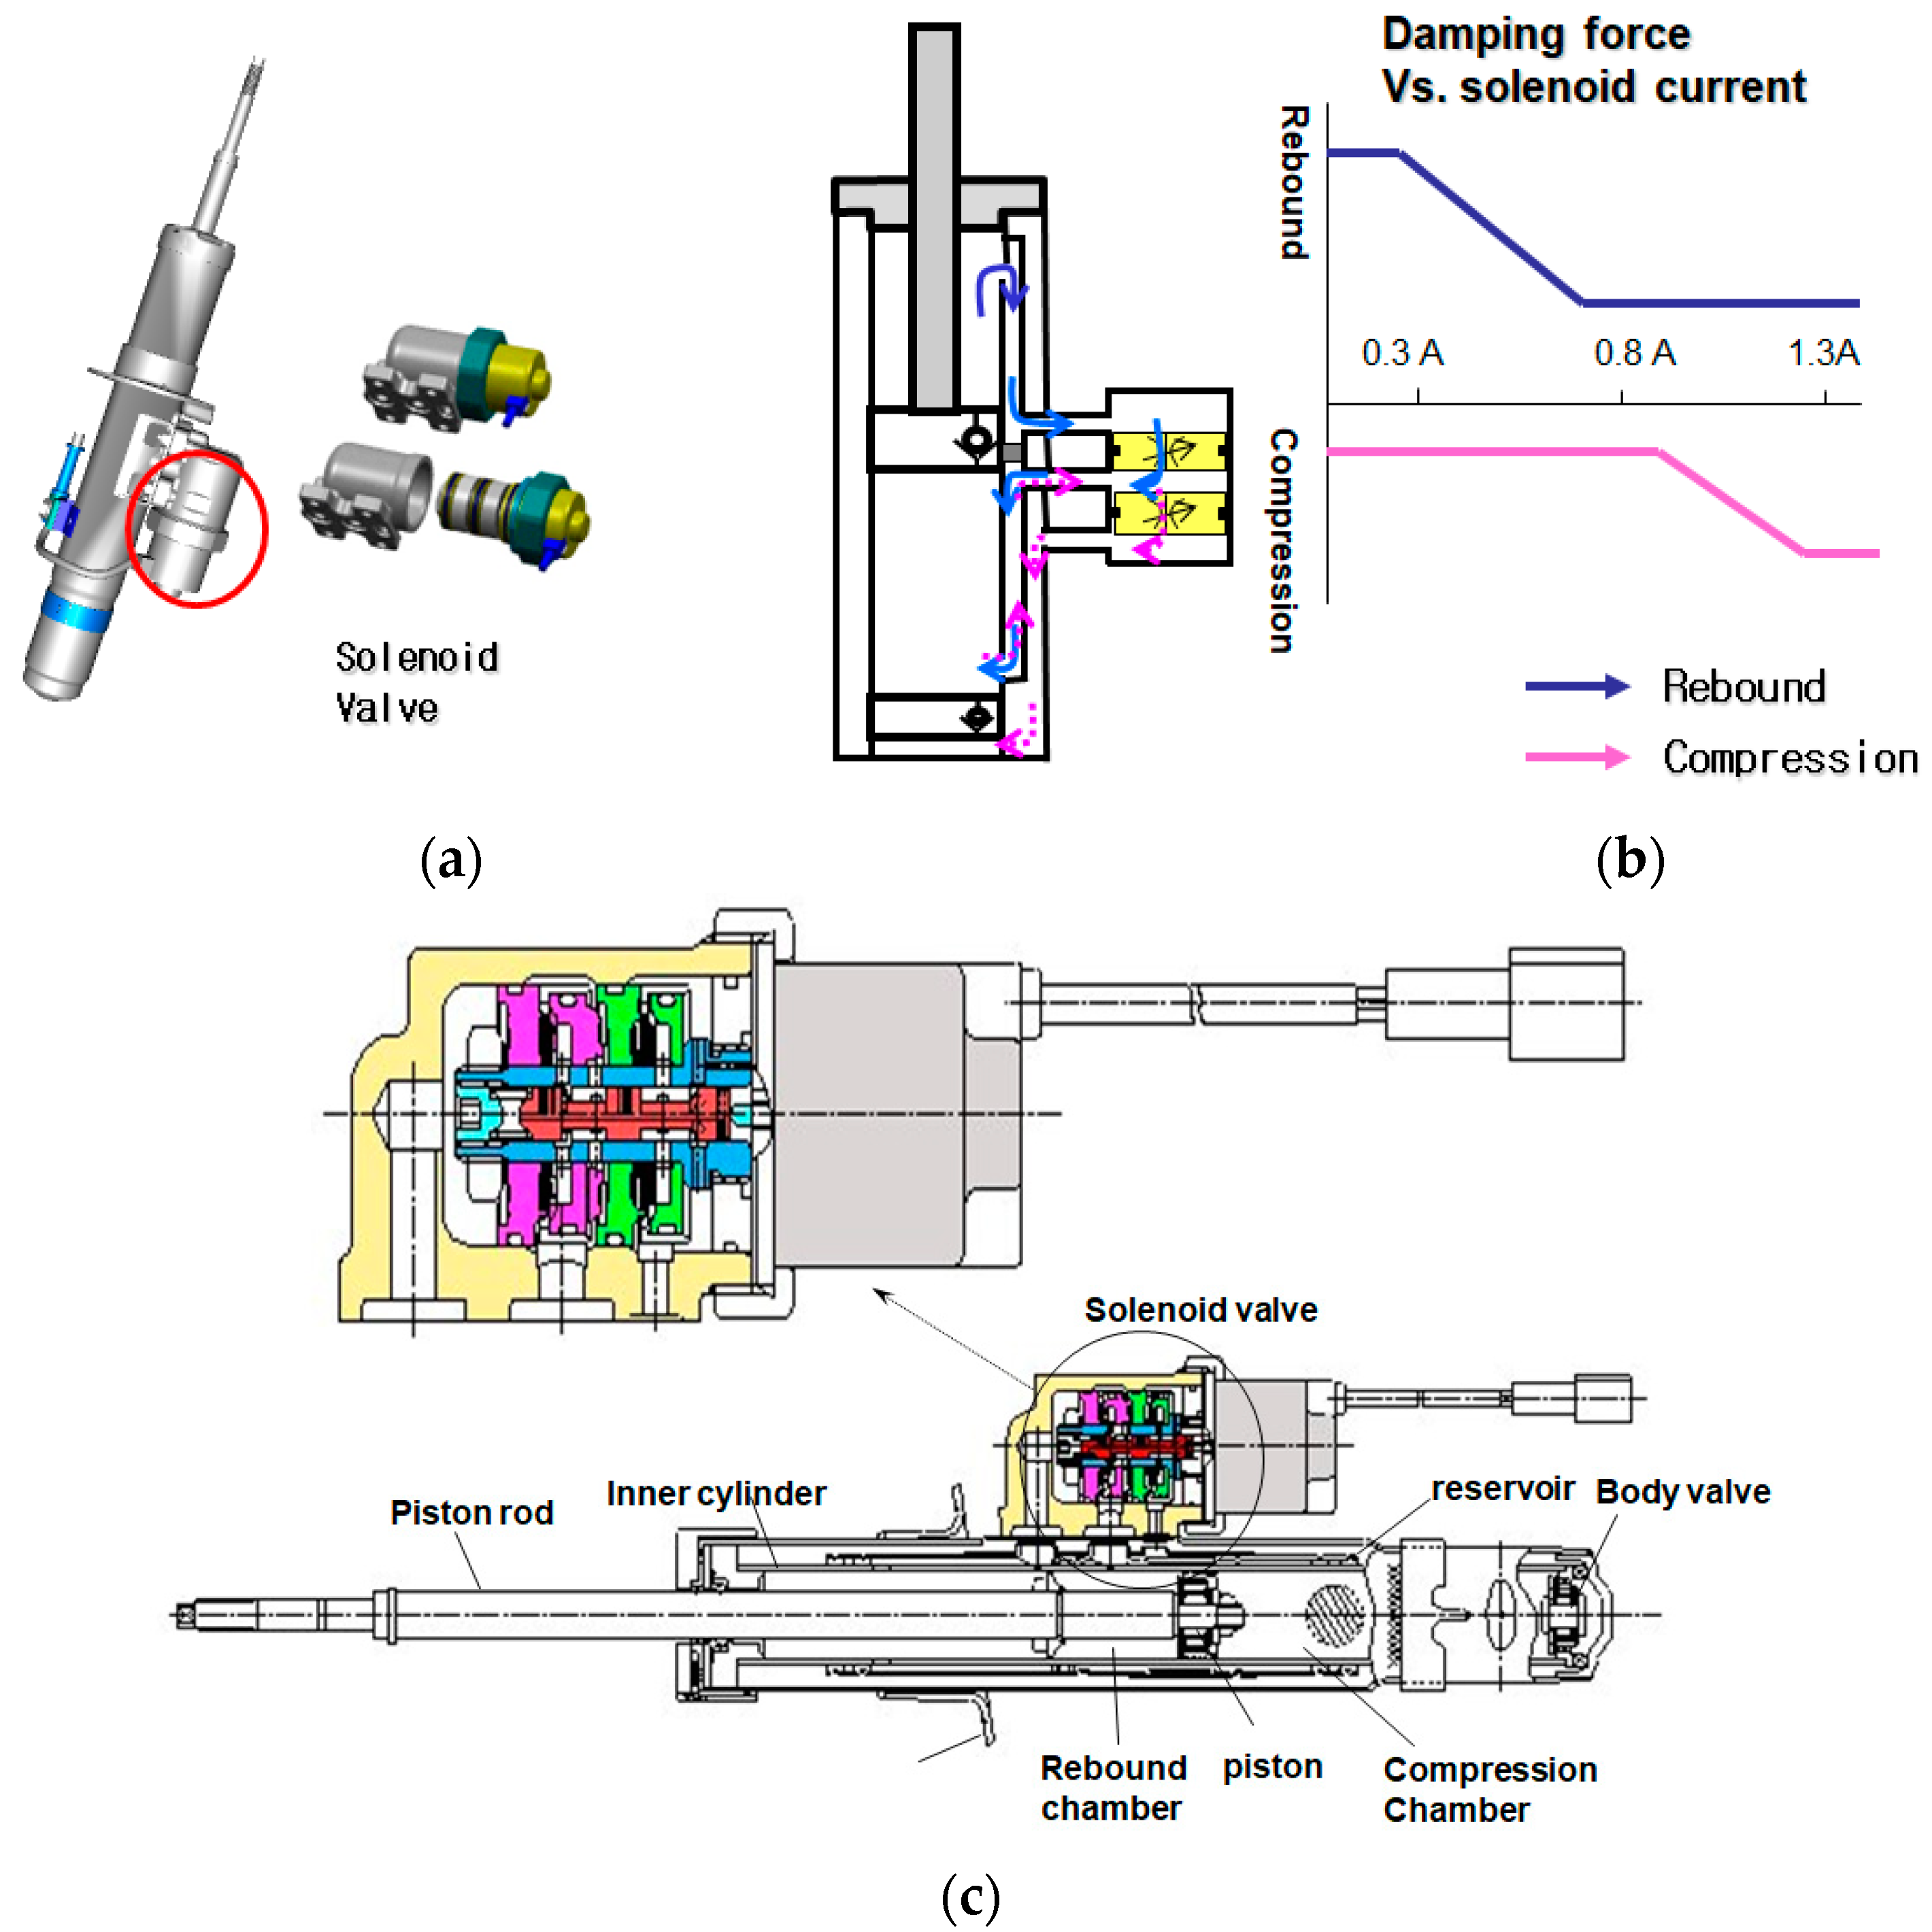
The damping force build-up is related to the pressure generation mechanism of the CDC damper inner components. The damper consists of a piston rod and the end of the piston that separates the rebound chamber and the compression chamber, an inner cylinder that guides the piston’s reciprocating motion, a body valve and rod guide that is mounted on the end of the cylinder, and a rebound chamber that is fitted on the outside of the inner cylinder. An intermediate cylinder forms a flow path through which oil from the rebound chamber and compression chamber can flow to the variable valve, a storage compartment guide that is inserted into the intermediate cylinder and serves to prevent gas in the storage compartment from entering the variable valve. The valve adapter and valve plate connect to the variable valve, and these structures are installed; the base shell that forms the storage compartment and the oil seal is installed and inserted into the piston rod so that the rod guide and inner cylinder are fixed to the base shell. In summary, damping force is generated by the physical movement of the damper and the control current generated by the vehicle’s behavior.
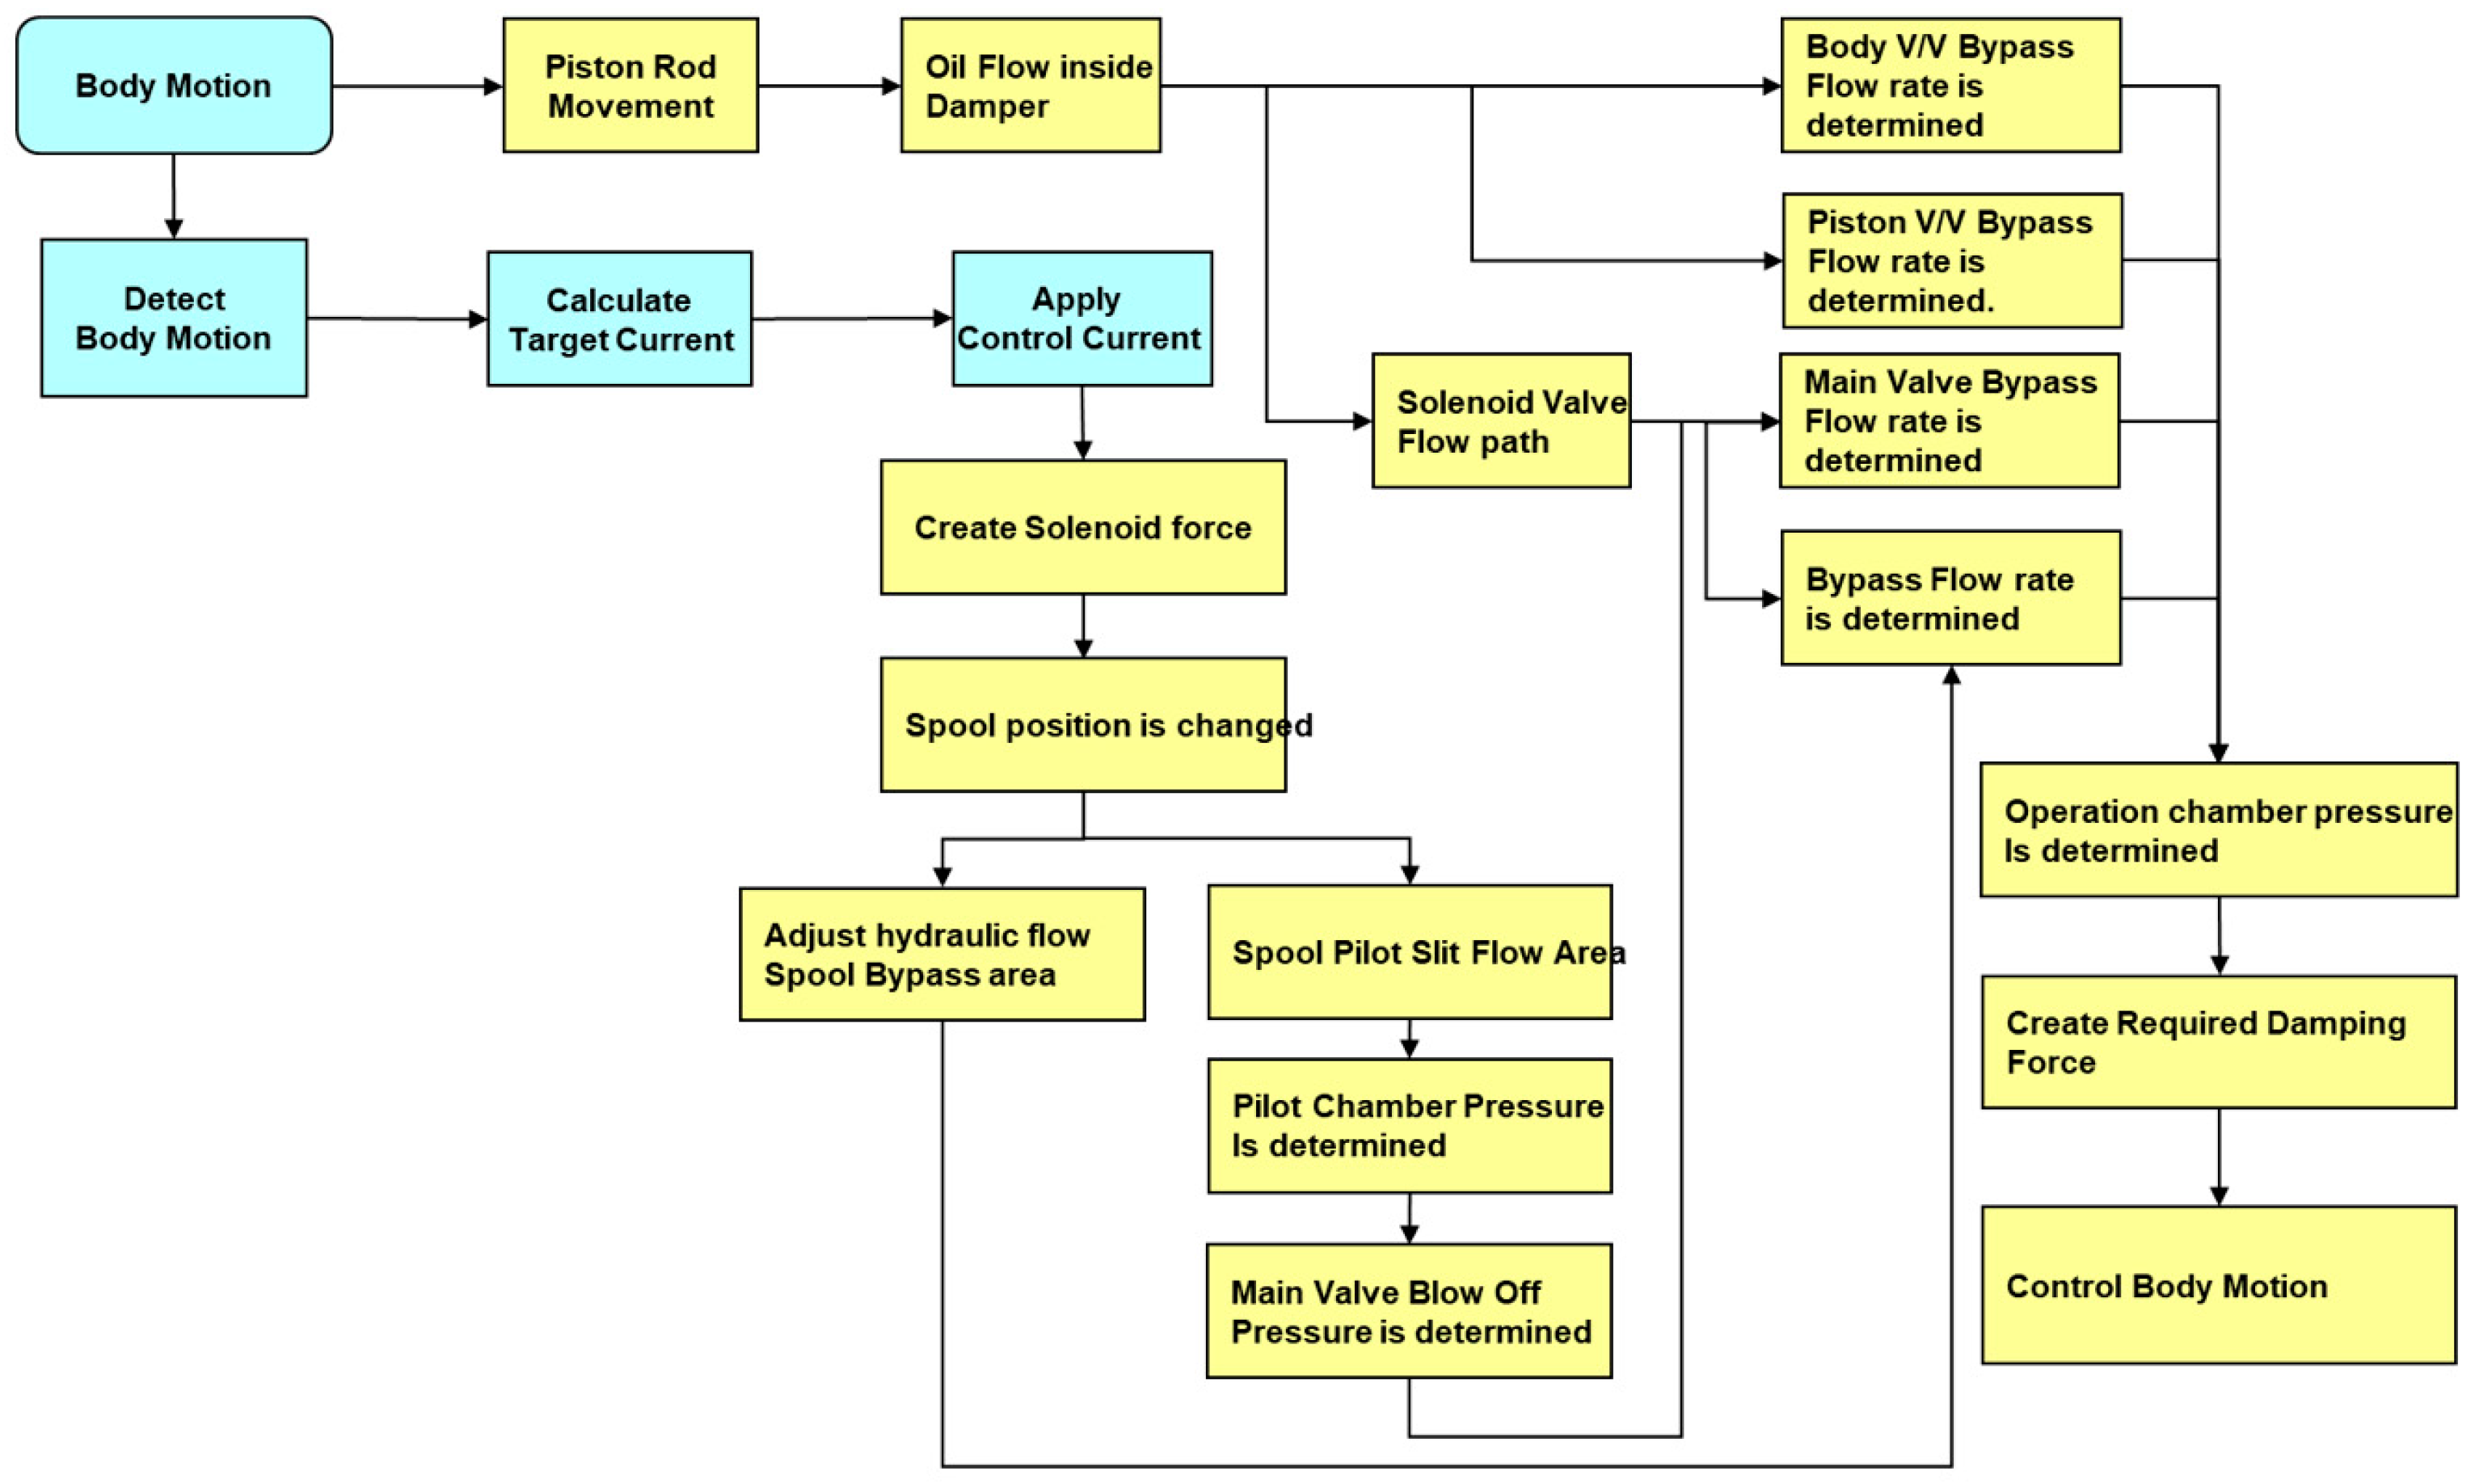
In Figure 4b, the pressure produced in each valve creates a damping force determined by the flow rate resulting from the movement of the piston in the damper. The total of these pressure-producing elements constitutes the damping force. Figure 5 details the process by which alterations in vehicle behavior are assessed, the target damping force is computed, solenoid valve control is executed, pressure is produced within the damper, and ultimately vehicle behavior is modified.
When analyzing the cases in which damping force is not generated in Figure 4 and Figure 5, there are cases where the pressure generation ability is reduced due to damper oil leakage and cases where the pressure generation of the valve responsible for tension and compression is poor. Cases where the pressure generation of the valve is defective include cases where internal foreign substances affect the valve flow path and cases where the cavitation of the hydraulic oil occurs, and damping force is not generated well. If the damping force control amount and the stroke, which generates a lot of damping kinetic energy, increase, this can be seen as a potential cause for performance deterioration.

3. RLDA and Severity Analysis

RLDA was conducted on general roads within Seoul and local cities, national roads, highways, and unpaved roads to measure the environment used by general consumers.

3.1. Data Aquisition

The purpose of collecting road data to evaluate the durability of parts is to measure external loads, such as those that a vehicle or target part receives from the driver’s operation or the road surface while driving the vehicle. This requires an understanding of the functions and characteristics of the target product. The primary function of the damper is to absorb sudden upward and downward loads applied to the vehicle and reduce vibration. Therefore, the most significant load on the damper occurs in the vertical movement, and additional lateral and longitudinal forces also act. A strain gauge and accelerometer were used to measure this load. Pathare and Nimbalkar provide a detailed approach to the design and development of quarter car suspension test rigs, which can be beneficial in understanding the setup for accurate simulation and measurement [20].
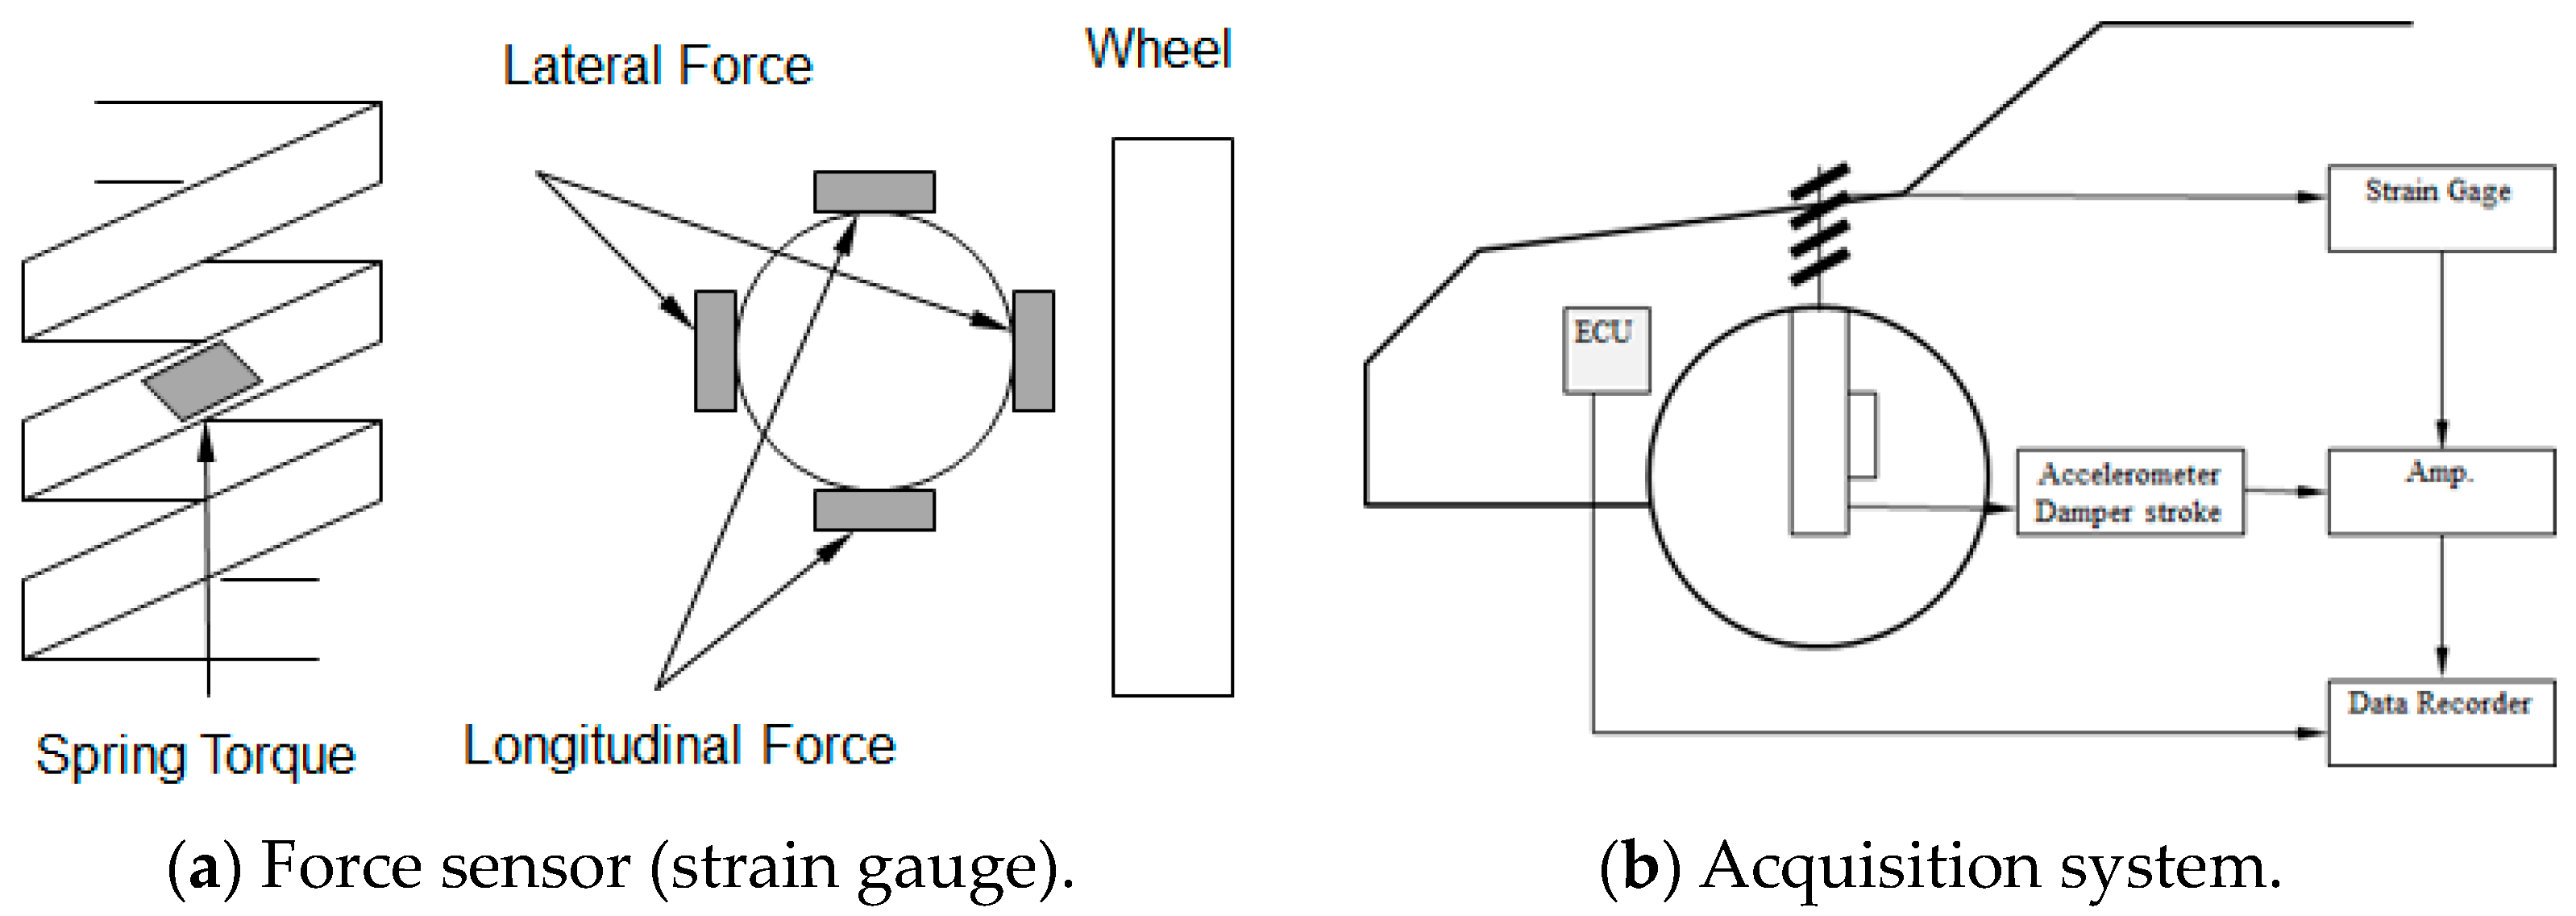
In order to measure the movement in the vertical direction, a torque strain gauge was attached to the spring to measure the torque caused by the spring’s tension and compression. Strain gauges were installed to measure the force caused by the bending of the damper at the top and bottom of the damper body to measure the lateral and longitudinal movement. Accelerometers were attached to both the left and right wheels to measure acceleration.

3.2. RLDA System and Aquisition Process

The measurement system for RLDA consists of an accelerometer, strain gauge, amp., tape recorder, and an FET drive signal recording device that records the current signal to control the solenoid valve of the damper in the vehicle’s ECU. The accelerometer and strain gauge are connected to the amp for signal amplification, and the signal is transmitted to the tape recorder through the amp. The detailed installation configuration is described in Figure 6. The control signal from the ECU’s FET driving frequency detection unit is also input to the tape recorder, and all of this equipment is mounted on the vehicle. It was continuously recorded during the driving test, and the data sampling speed of the tape recorder was 2.5 kHz, which was sufficient for use in the simulation. The detailed specifications of the acquisition facilities are described in Table 1.
General consumers must measure various chassis loads, speeds, movements, and operating information while driving a car. However, the consumer’s operating environment is very diverse due to the wide range of changes in each individual’s characteristics and external environment, such as each individual’s occupation and inclination, road conditions, and climatic conditions in the area of use, so there are many complex problems that must be solved to standardize it uniformly. Research on this includes the Ford Customer Satisfaction Surveys, which surveyed about 3000 consumers and installed measuring equipment on applicants’ vehicles to measure the usage environment of actual consumers, but this required an enormous workforce and expenses. Therefore, by primarily surveying those with the poorest usage conditions rather than all consumers, it will be possible to reduce the number of people surveyed, reduce costs, and develop technology through a more efficient comparison of test results. In this study, RLDA was conducted using an appropriate road composition ratio.

3.3. RLDA Data Analysis

3.3.1. RLDA and Preprocessing

RLDA on general roads (city roads, highways, national roads, unpaved roads) was conducted using a test vehicle for approximately 3300 km. The RLDA course for each road was decided across roads across the country, and RLDA was conducted with as many different courses as possible. The overall road surface classification ratio is shown in Table 2.
Basic signal processing was performed via the following preprocessing.
  • Spike processing:
  • Search the graph along the timeline and check for spikes. When a spike is found, set an interval including it and perform interpolation to remove it.
  • Filtering:
  • After identifying the frequency characteristics of the signal with Power Spectral Density, unnecessary high-frequency components were removed using a Fourier Filter.
  • Damper velocity calculations:
  • The displacement was differentiated to calculate the velocity.

3.3.2. Damage Definition and Results

The failure modes considered in this study were fatigue failure in terms of basic strength and oil leakage, which causes an important reduction in damping force in the ECS system. The damage determination method was to estimate damage using pseudo stress and define relative motion related to oil leakage.
Because the front and rear road damage vary greatly, the equivalent amplitude was applied for analysis, and damage was defined and calculated from the results of rain flow counting using damper speed. Here, the k value corresponds to steel.
D = n i N S i E . A ( E q u a v a l e n t   A m p i t u d e ) = D k
where
  • D = Damage
  • n i : Actual counting number that occurred
  • N S i : Number of repetitions until failure for each load level
As can be seen from the above Figure 7, each data group shows linearity, so they can be judged to have normality, and the discrimination between groups is clear.
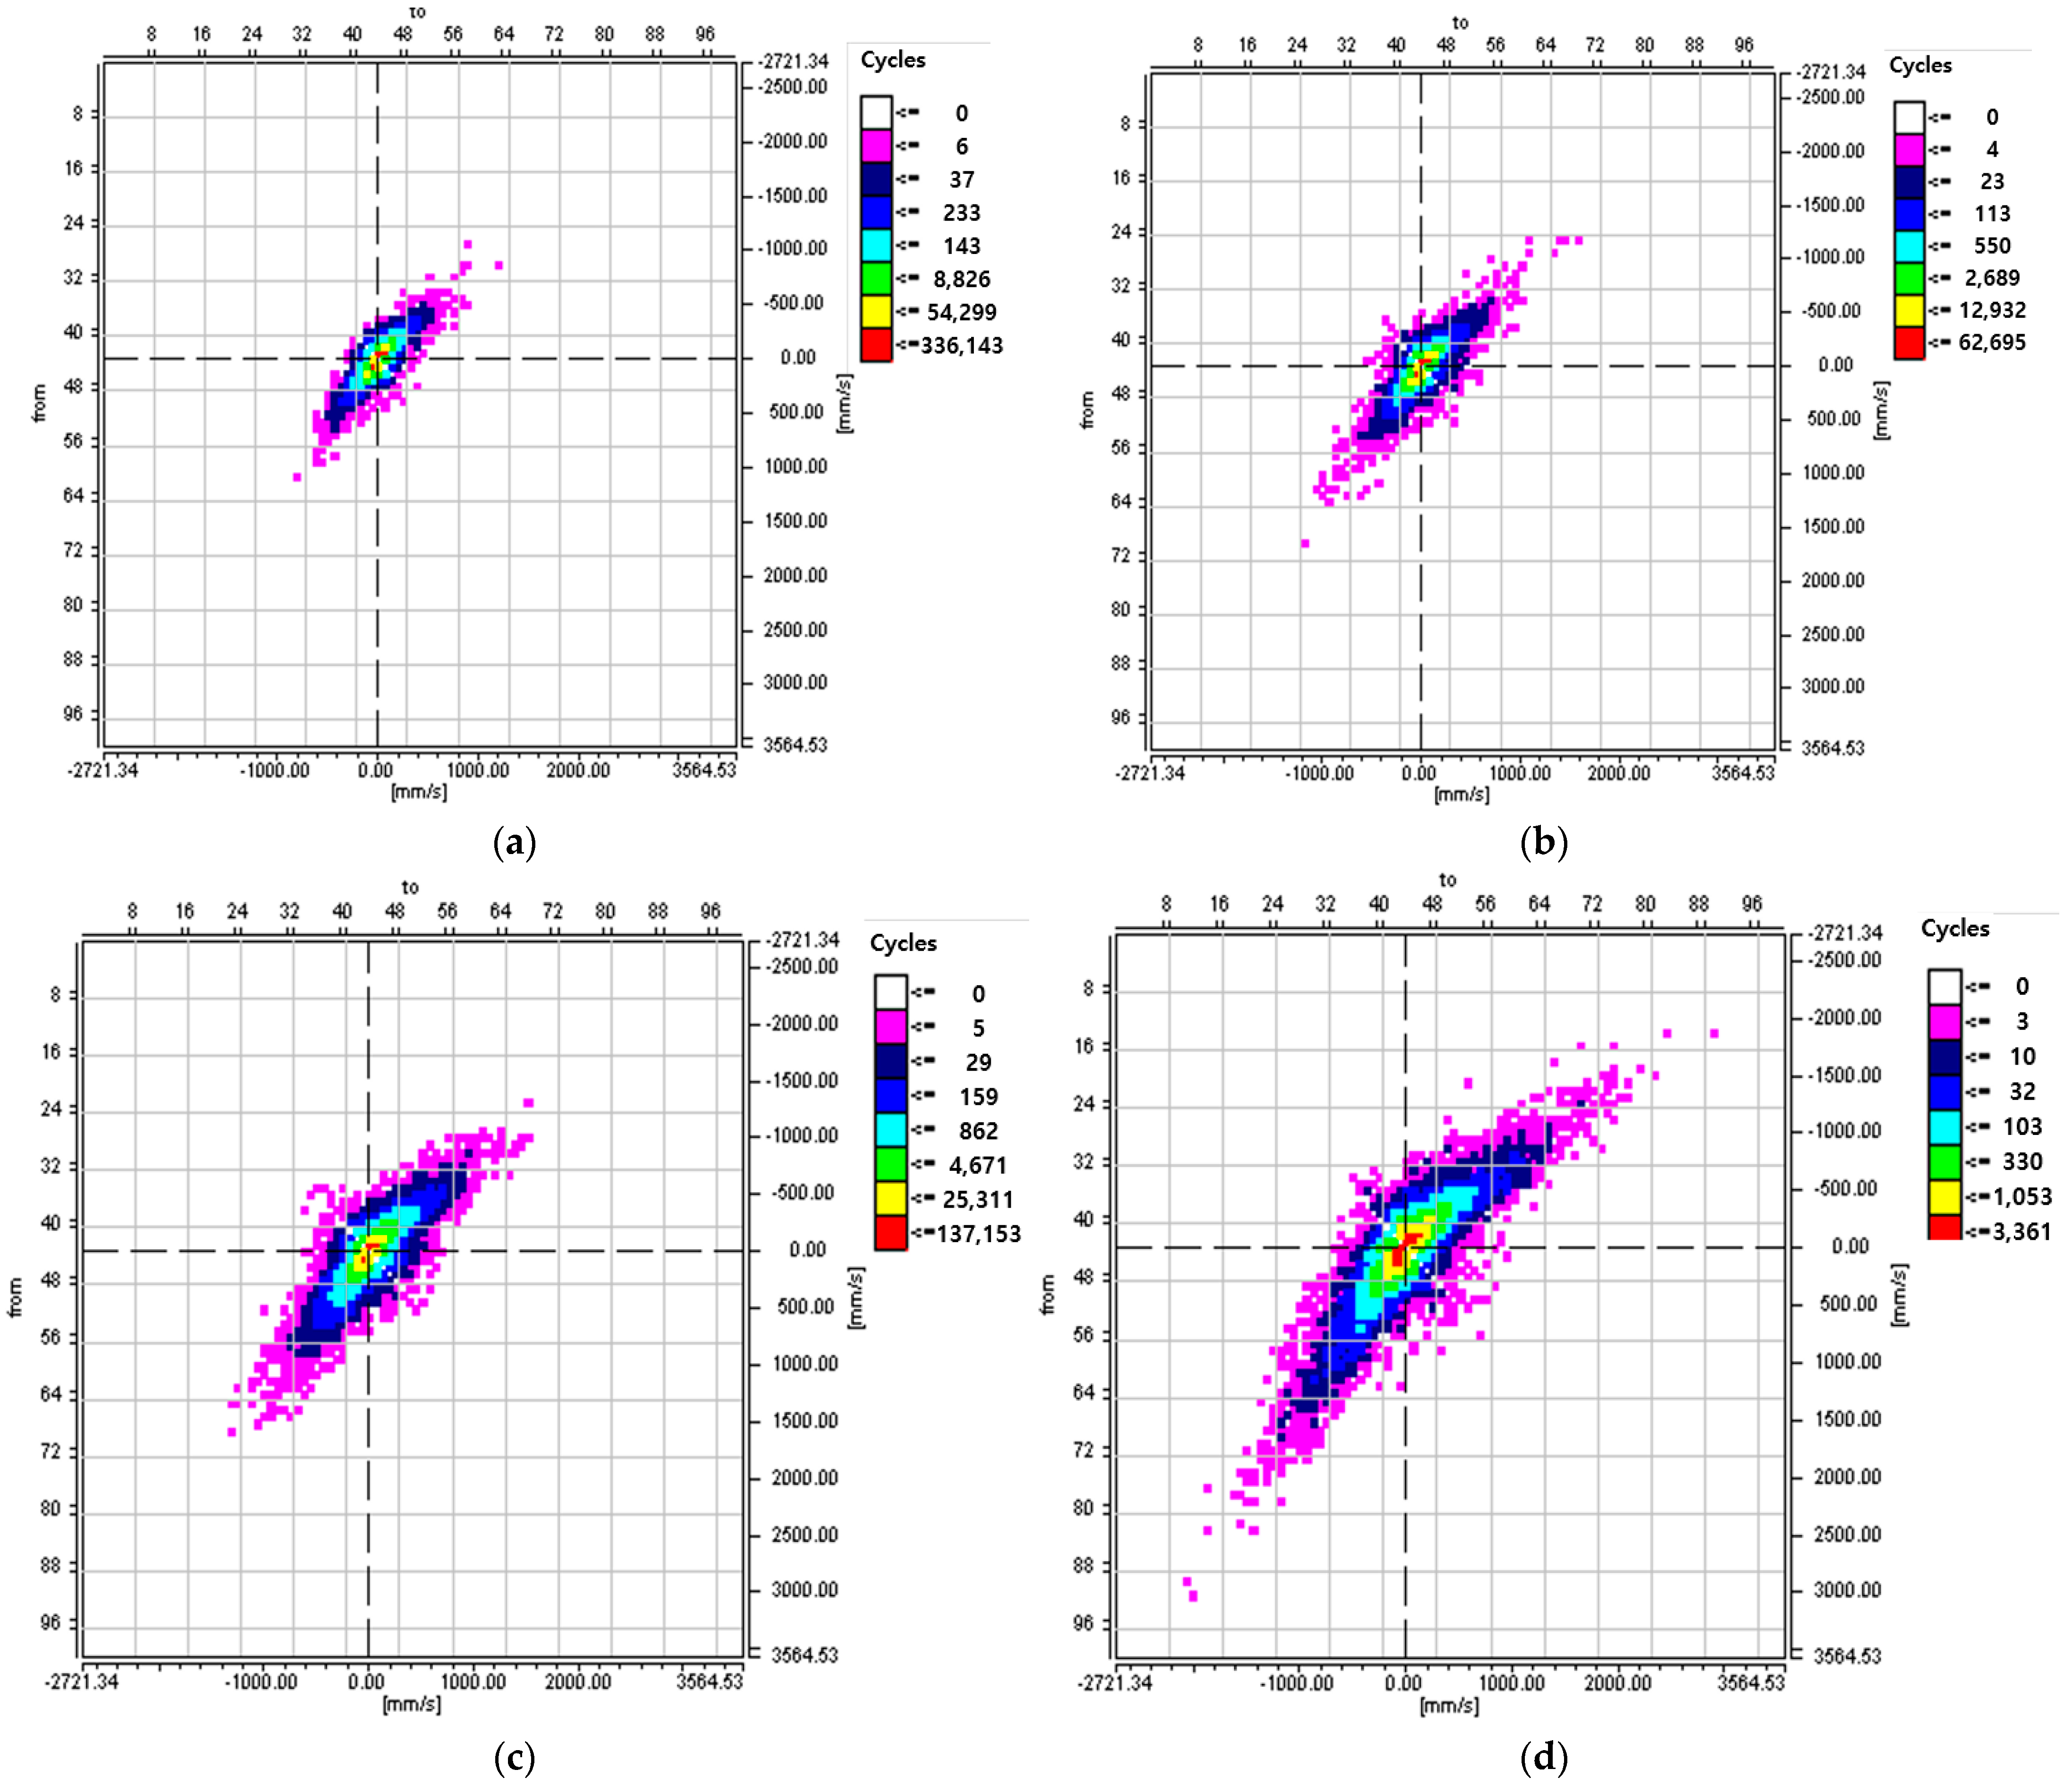
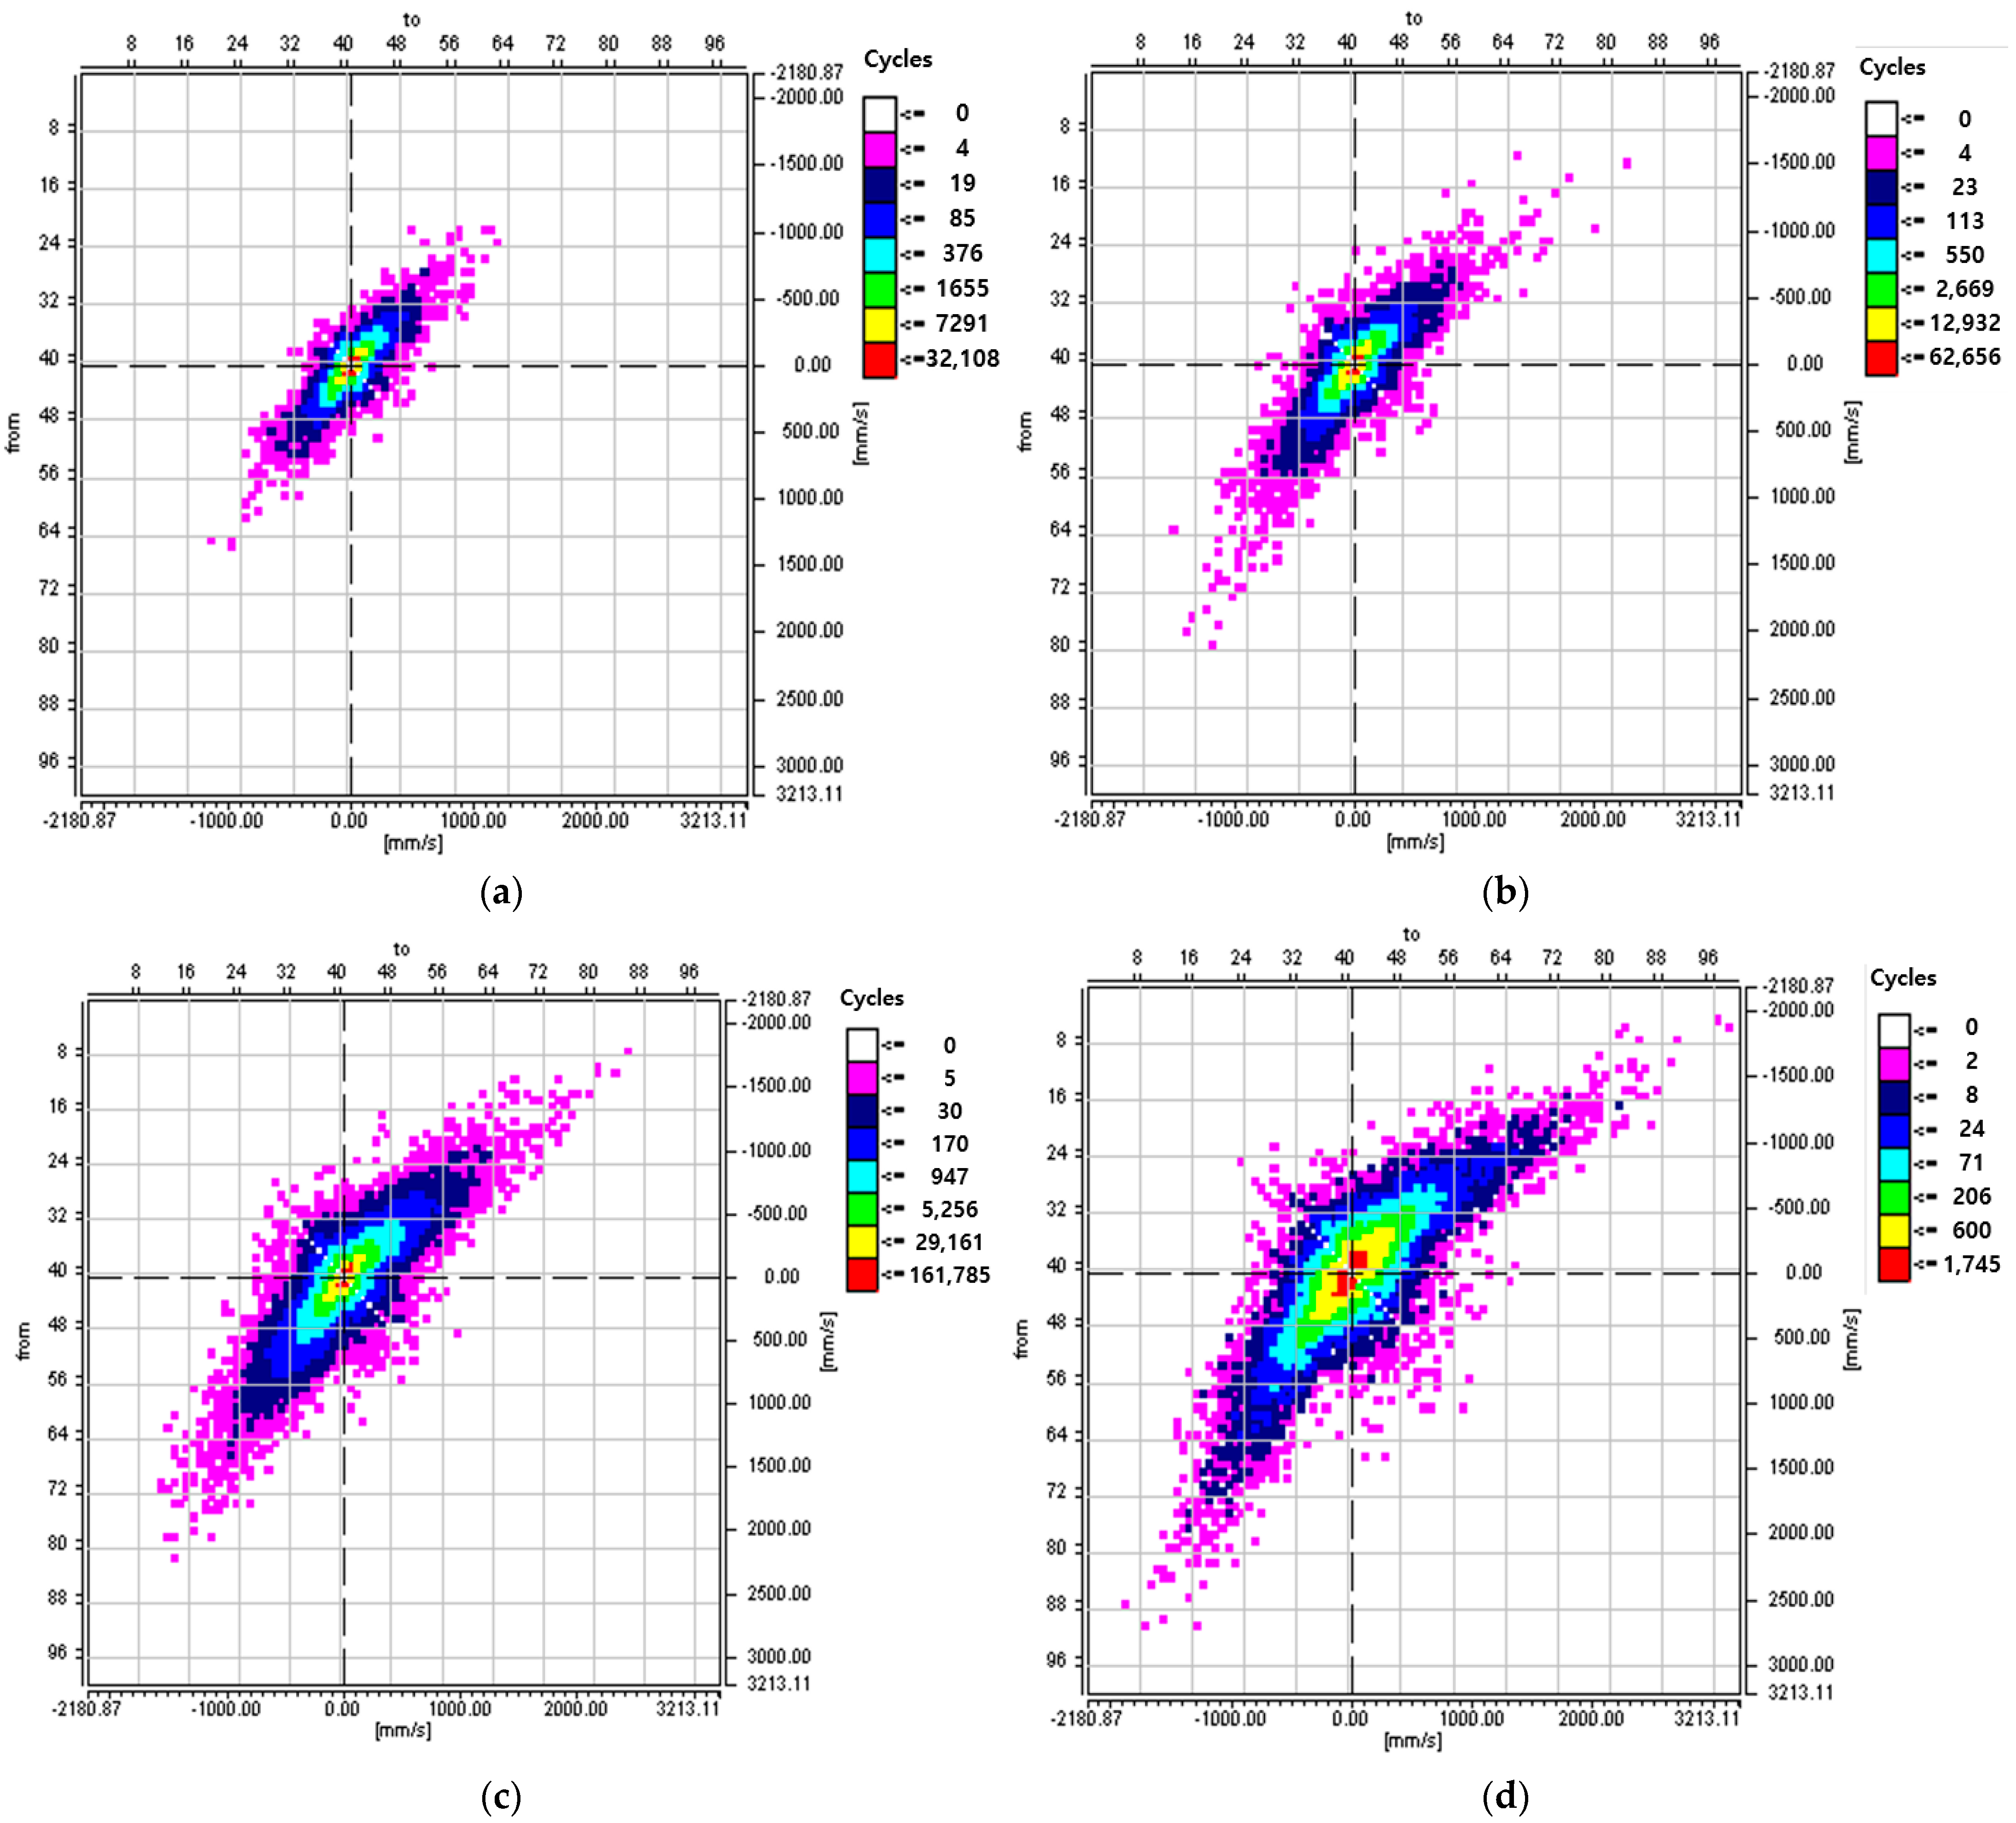
The rain flow matrix of the front damper for each driving road surface is displayed in Figure 8. The rain flow matrix represents the stress range and the number of occurrences of the cycle for each stress range. It can be seen that the speed band of the damper is widely distributed on the unpaved road and that it is distributed in the following order: (1) the unpaved road, (2) the city road, (3) the county road, and (4) the highway. The same trend can be seen in the rear wheel damper described in Figure 9.
Based on the above data analysis, pseudo damage was calculated by applying cycle counting using damper speed. It can be seen that unpaved driving conditions dominate the severity level, and the damper speed and displacement are critically affected by the pavement condition or roughness of the road.

4. Quarter Car Simulation

Based on the above data analysis, additional measurements were performed by configuring additional load and CDC system measuring equipment. The composition ratio for each road was performed similarly to the first implementation ratio and is summarized in Table 3.
A simulation test was performed using data obtained from RLDA on public roads. The verification mileage was conducted based on 60,000 km, and the load applied to the damper was measured in three axes: vertical, lateral, and longitudinal. However, due to the large drive signal capacity, limitations in current CAT equipment capacity, and lack of control channels, two axes were reproduced, excluding the lateral movement, which was measured to have the most minor effect in measurement, and the solenoid input current value controlled by the ECU when movement was applied to the damper was also reproduced in real-time synchronization by assigning a control channel. Kulkarni et al. developed a quarter car suspension model for dynamic evaluations, which is relevant to the setup and validation of simulation methods used in this study [21].
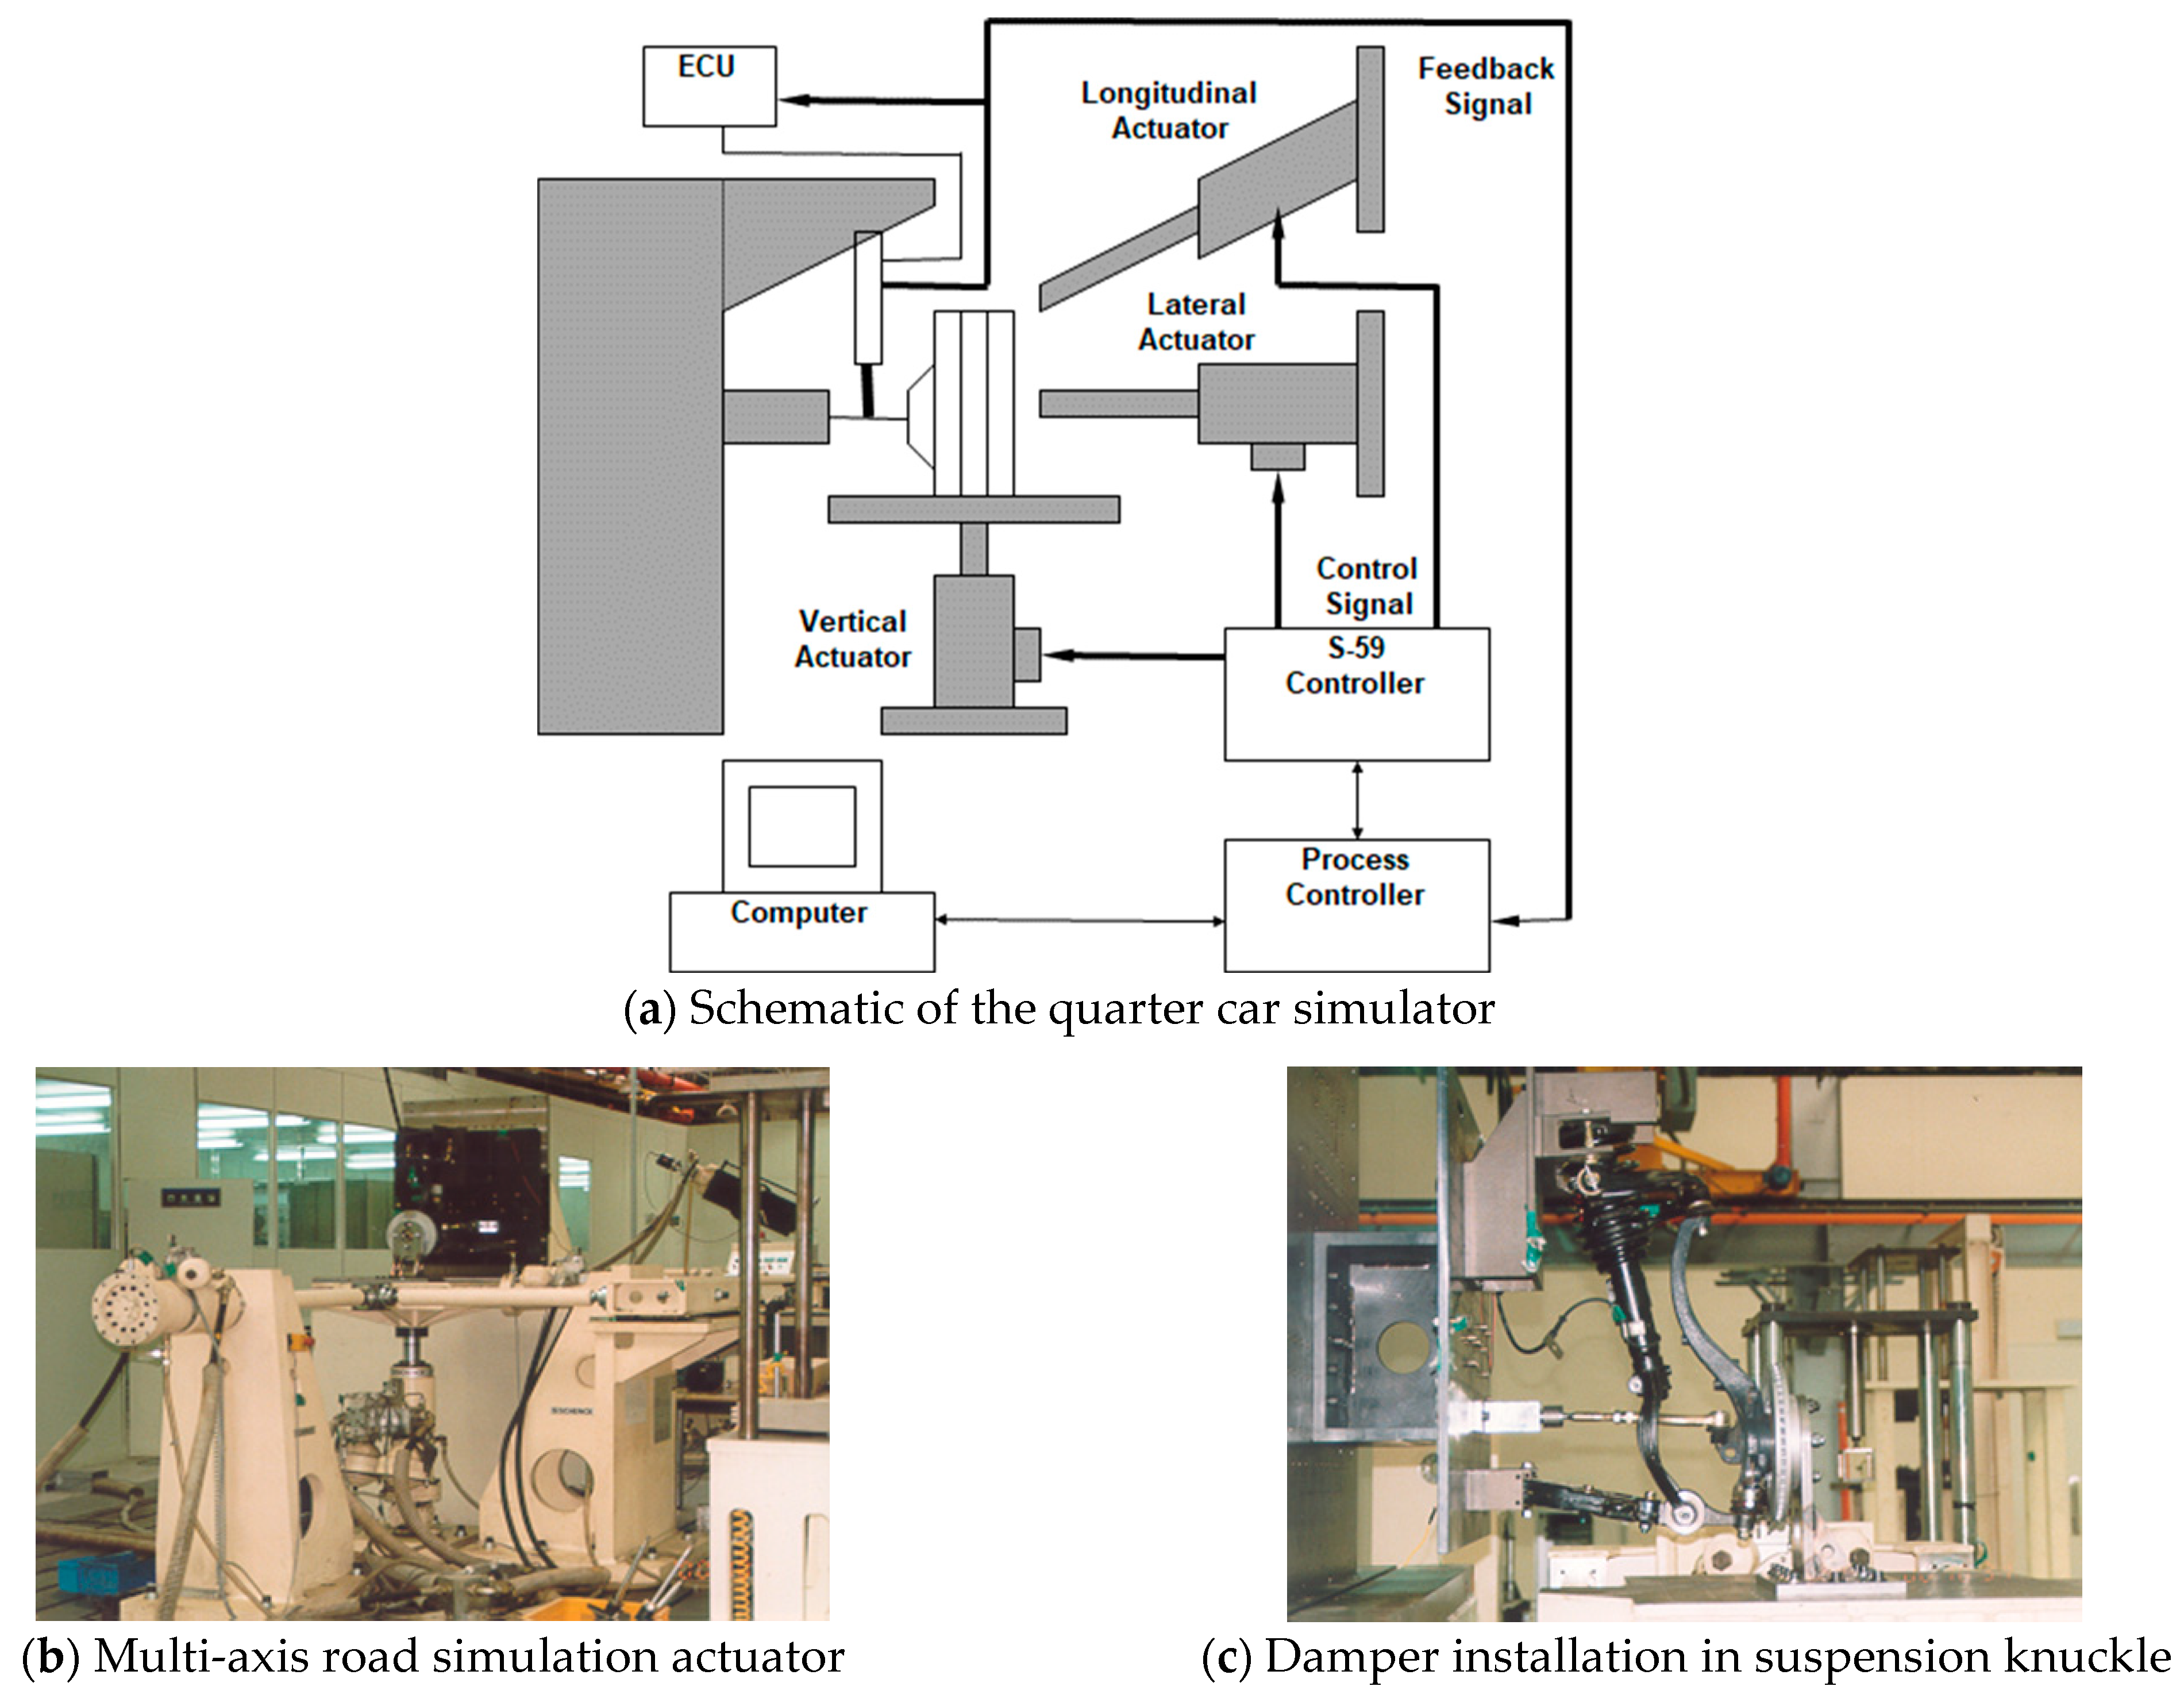
The testing machine for the simulation test was composed of a quarter car model to reproduce the damper’s vertical, lateral, and longitudinal direction movement. Figure 10 is the configuration diagram of the quarter car simulator. A simulation test was conducted on a general road using this tester.

4.1. Road Profile Generation

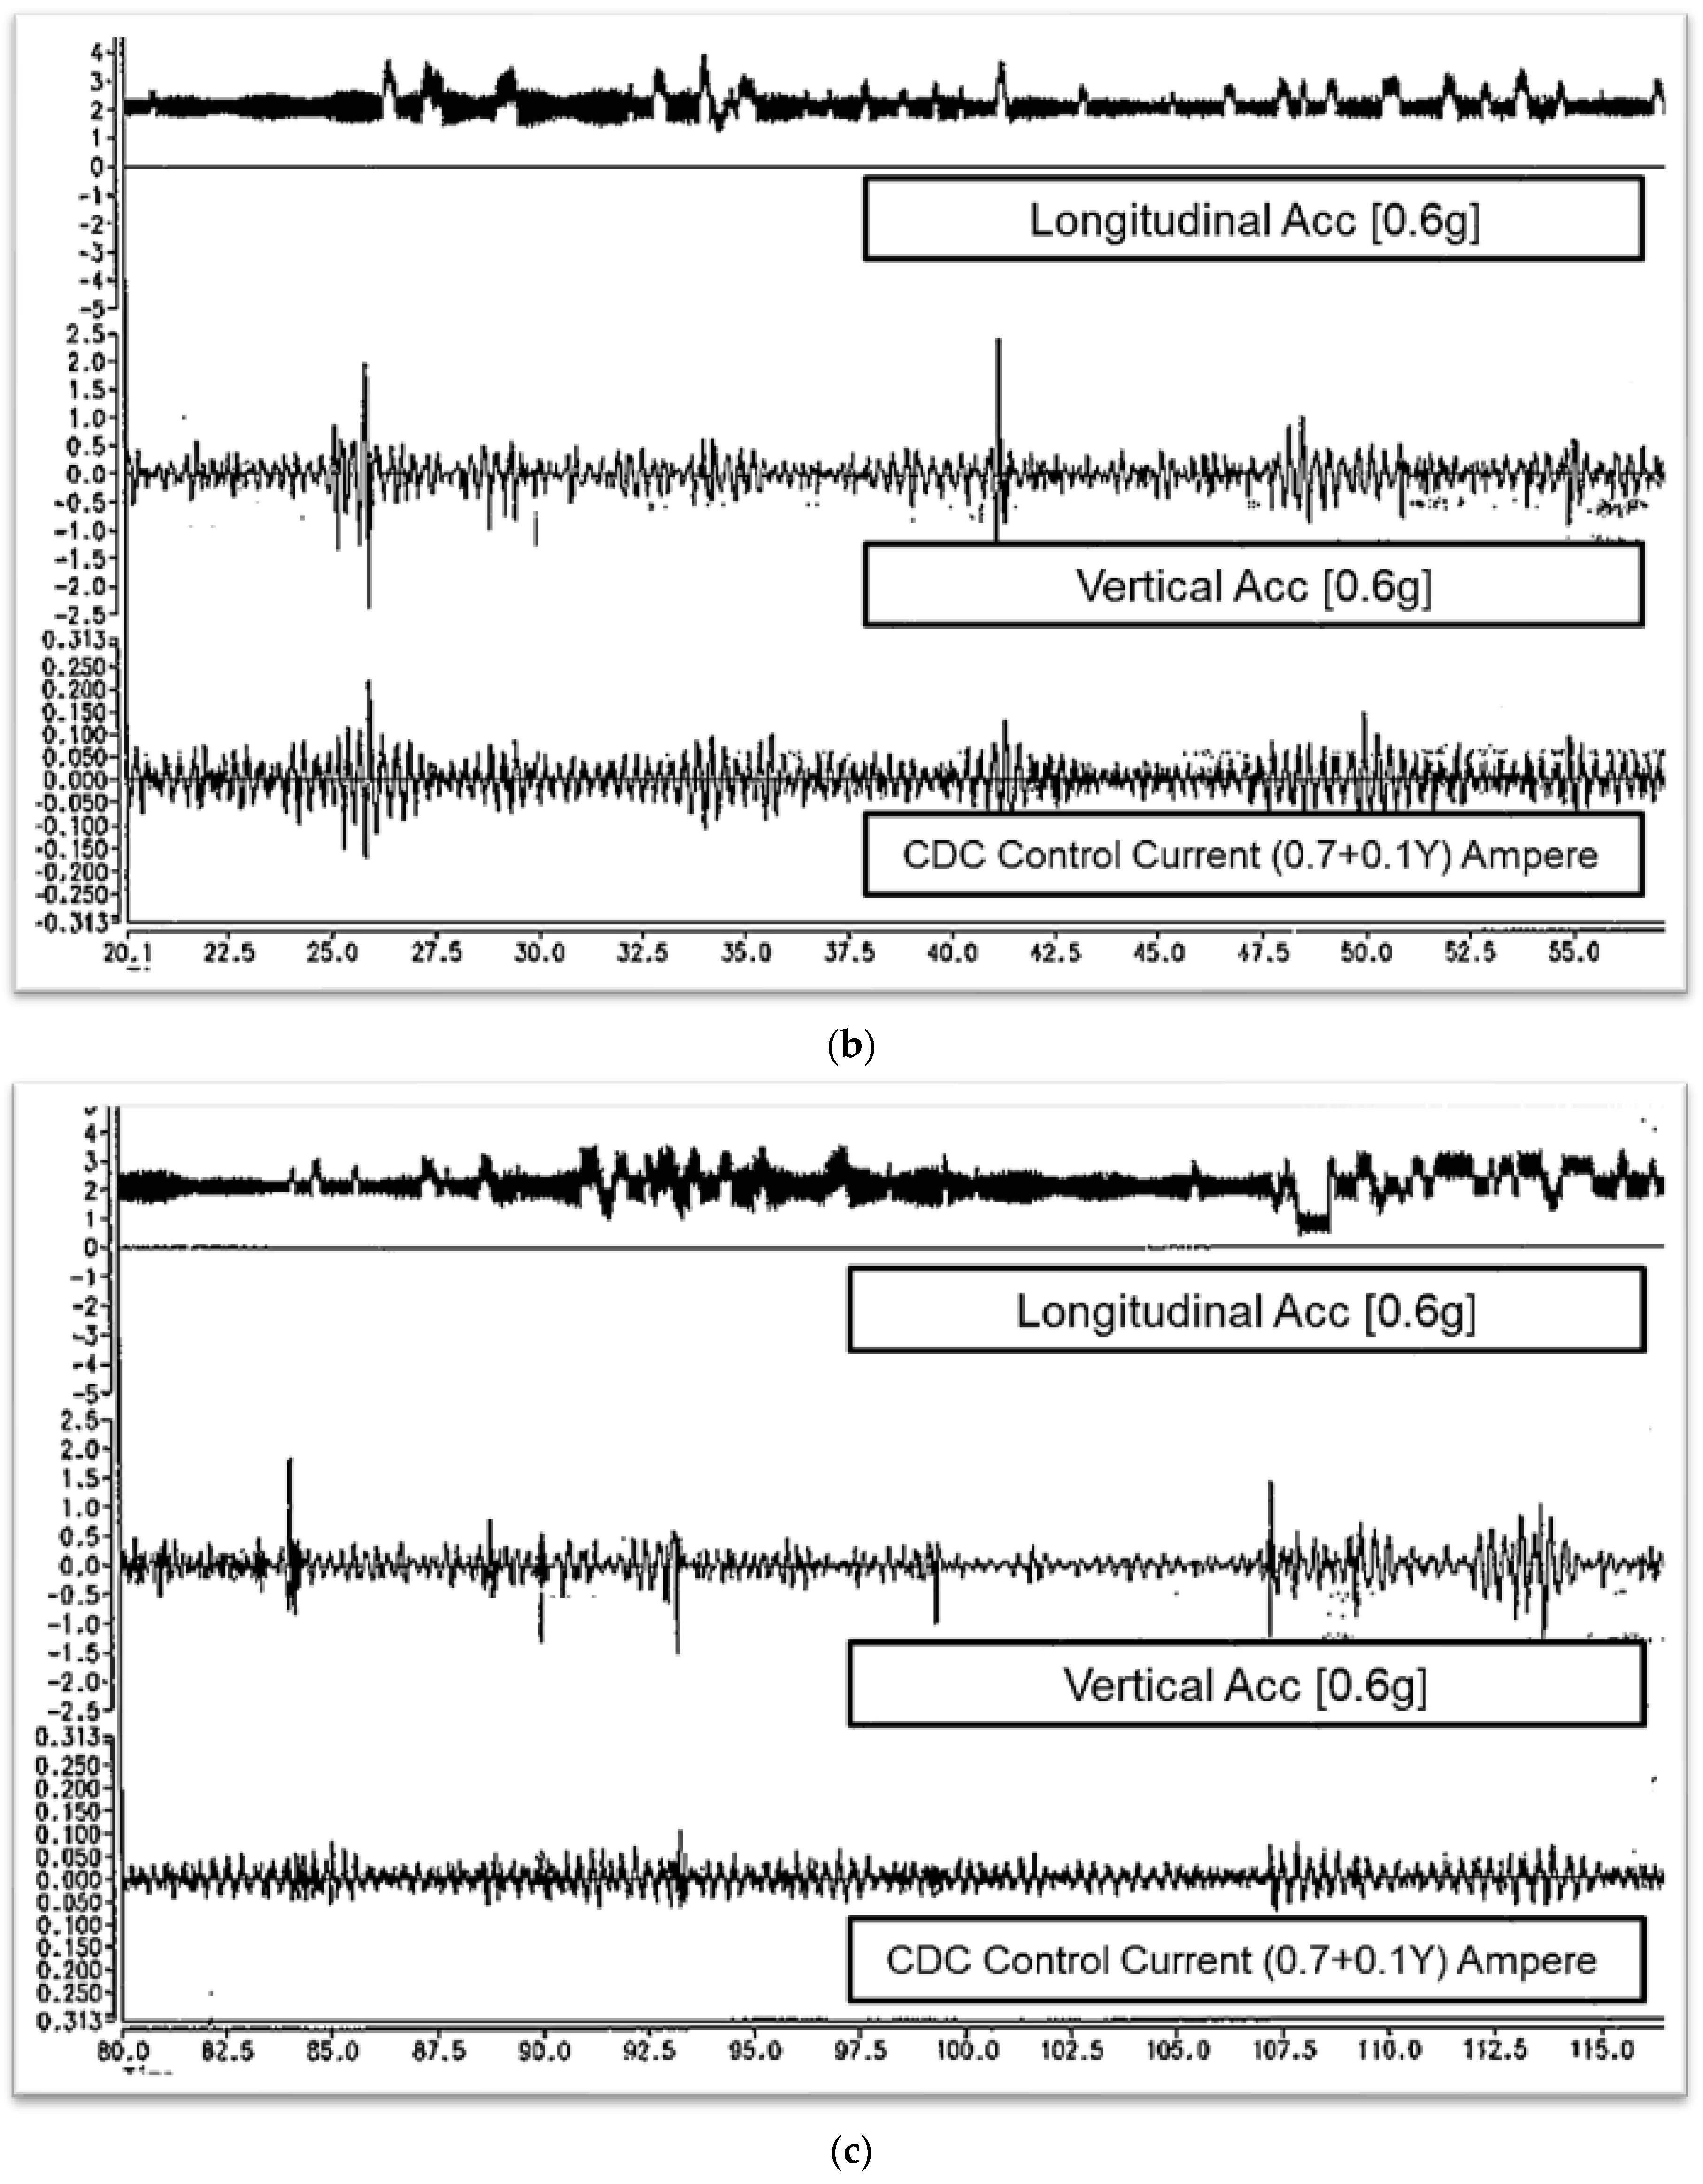
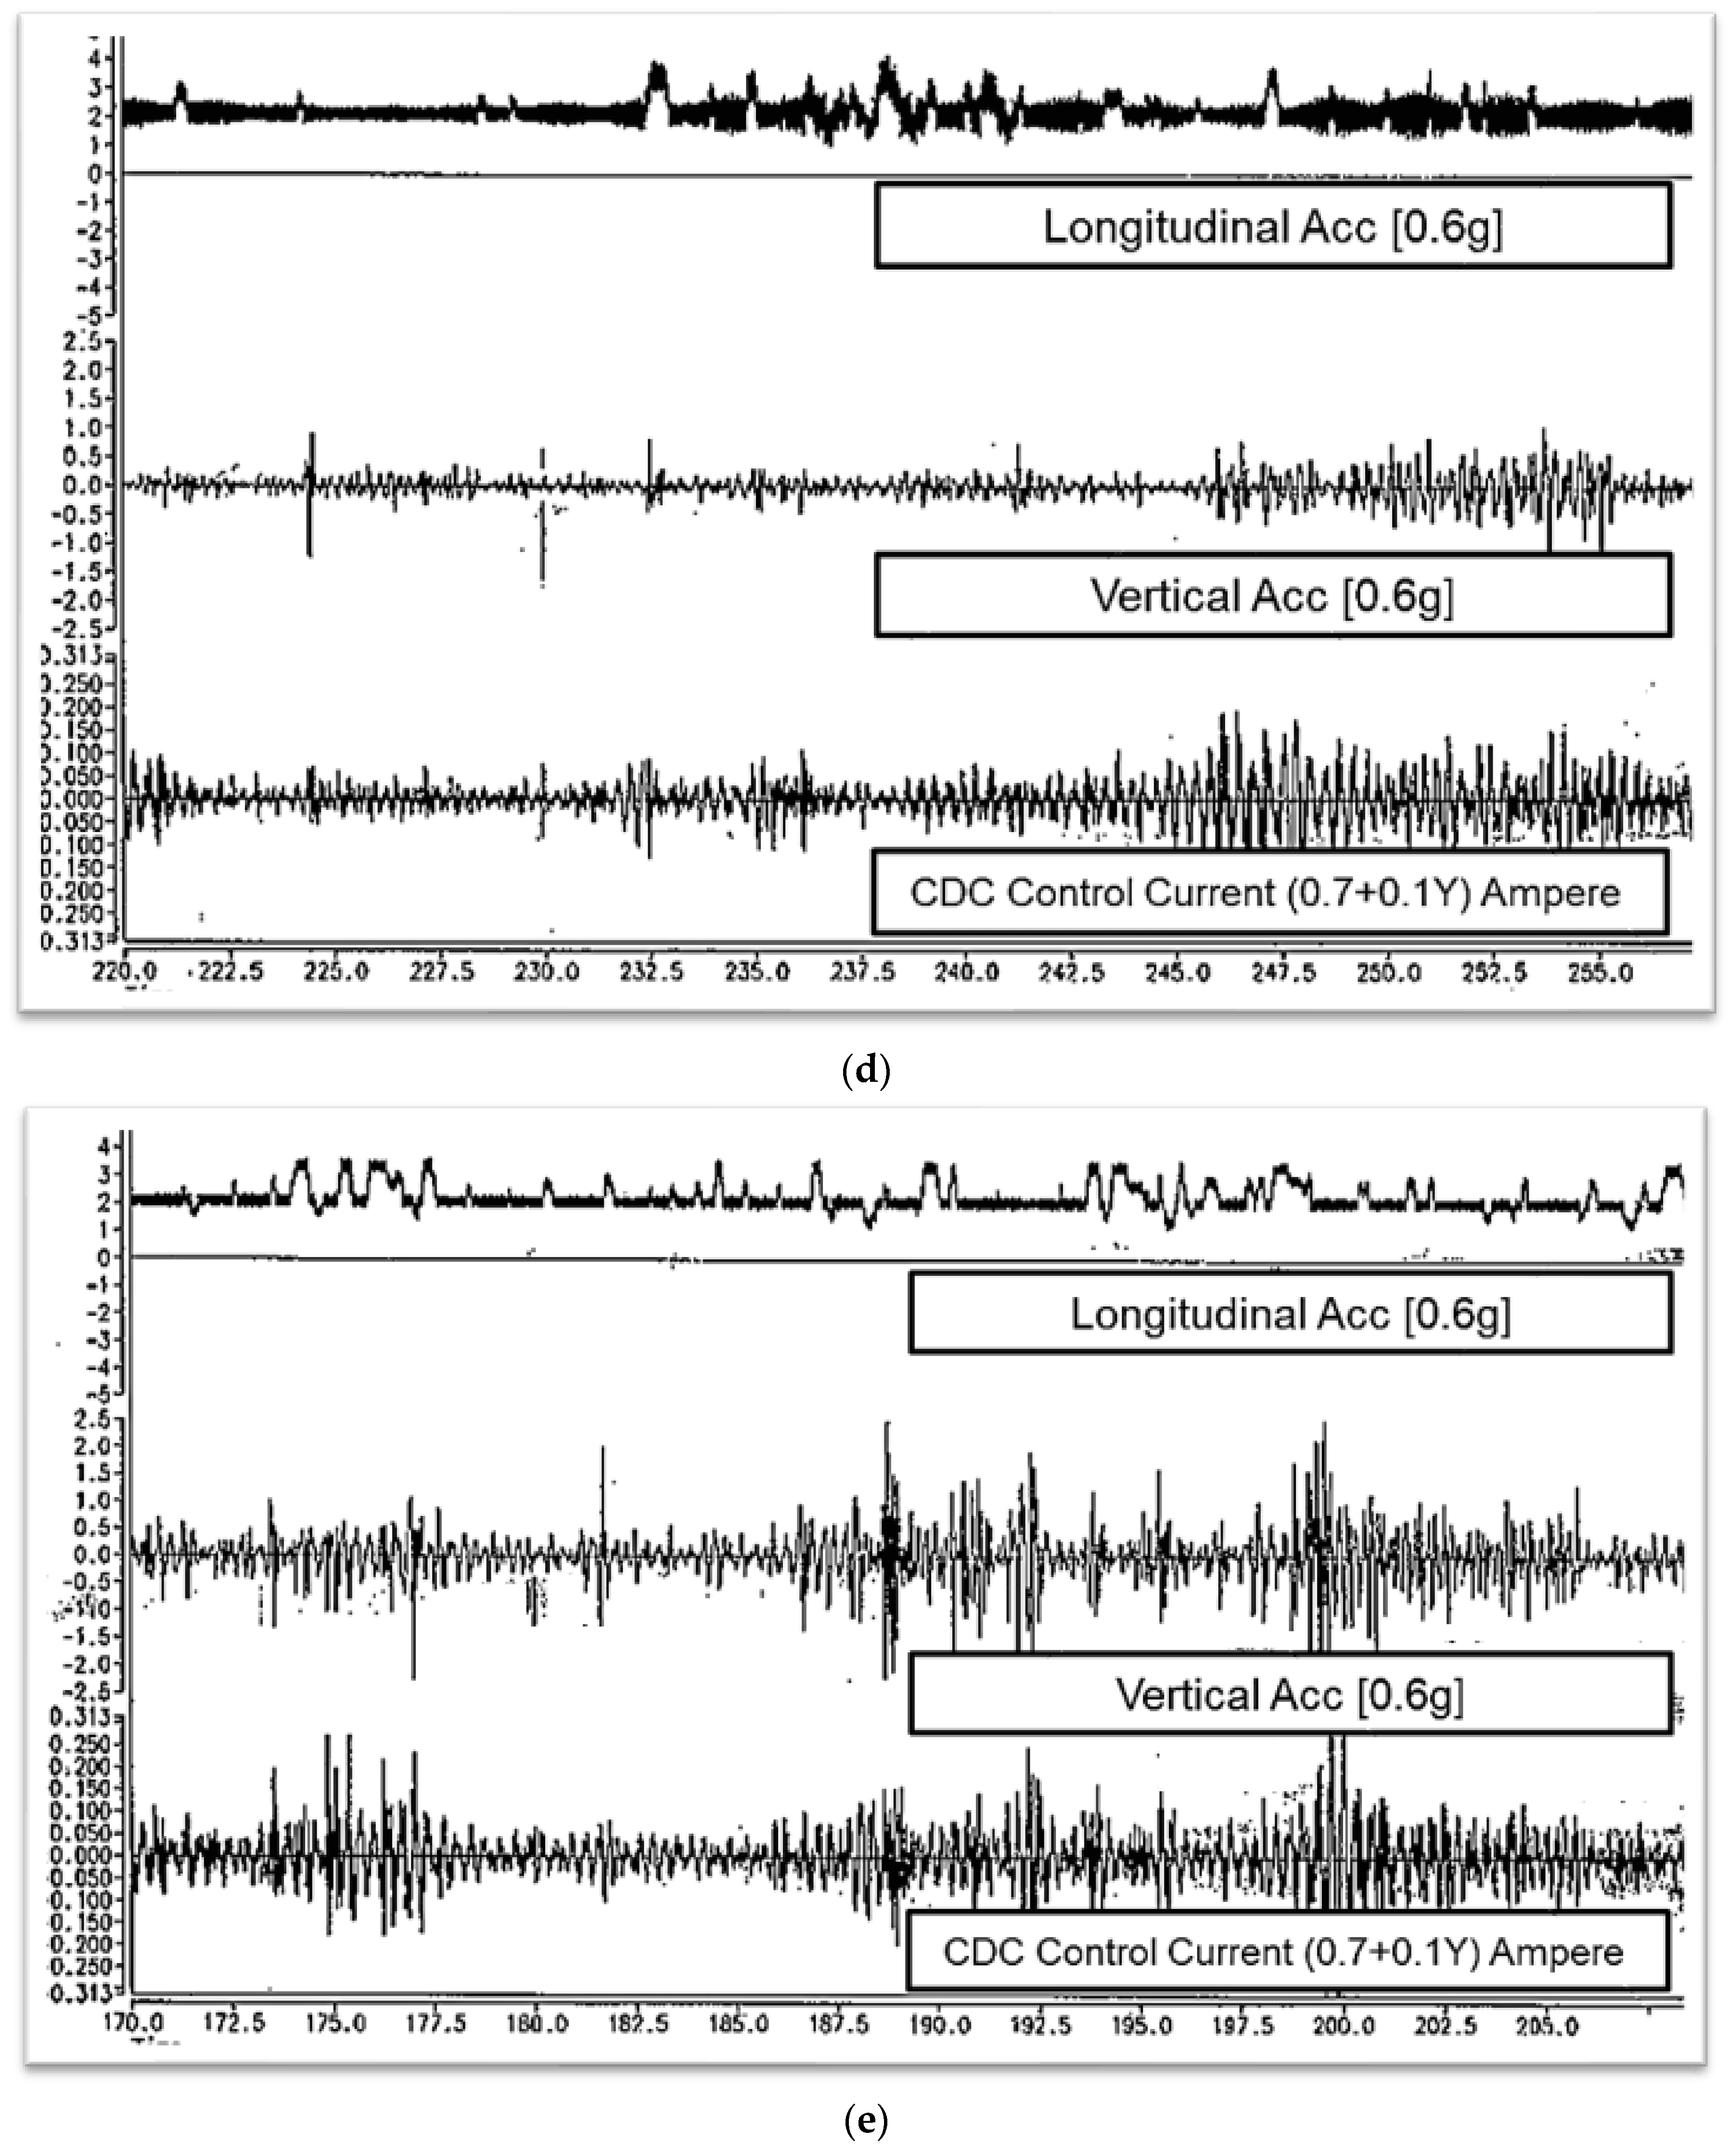
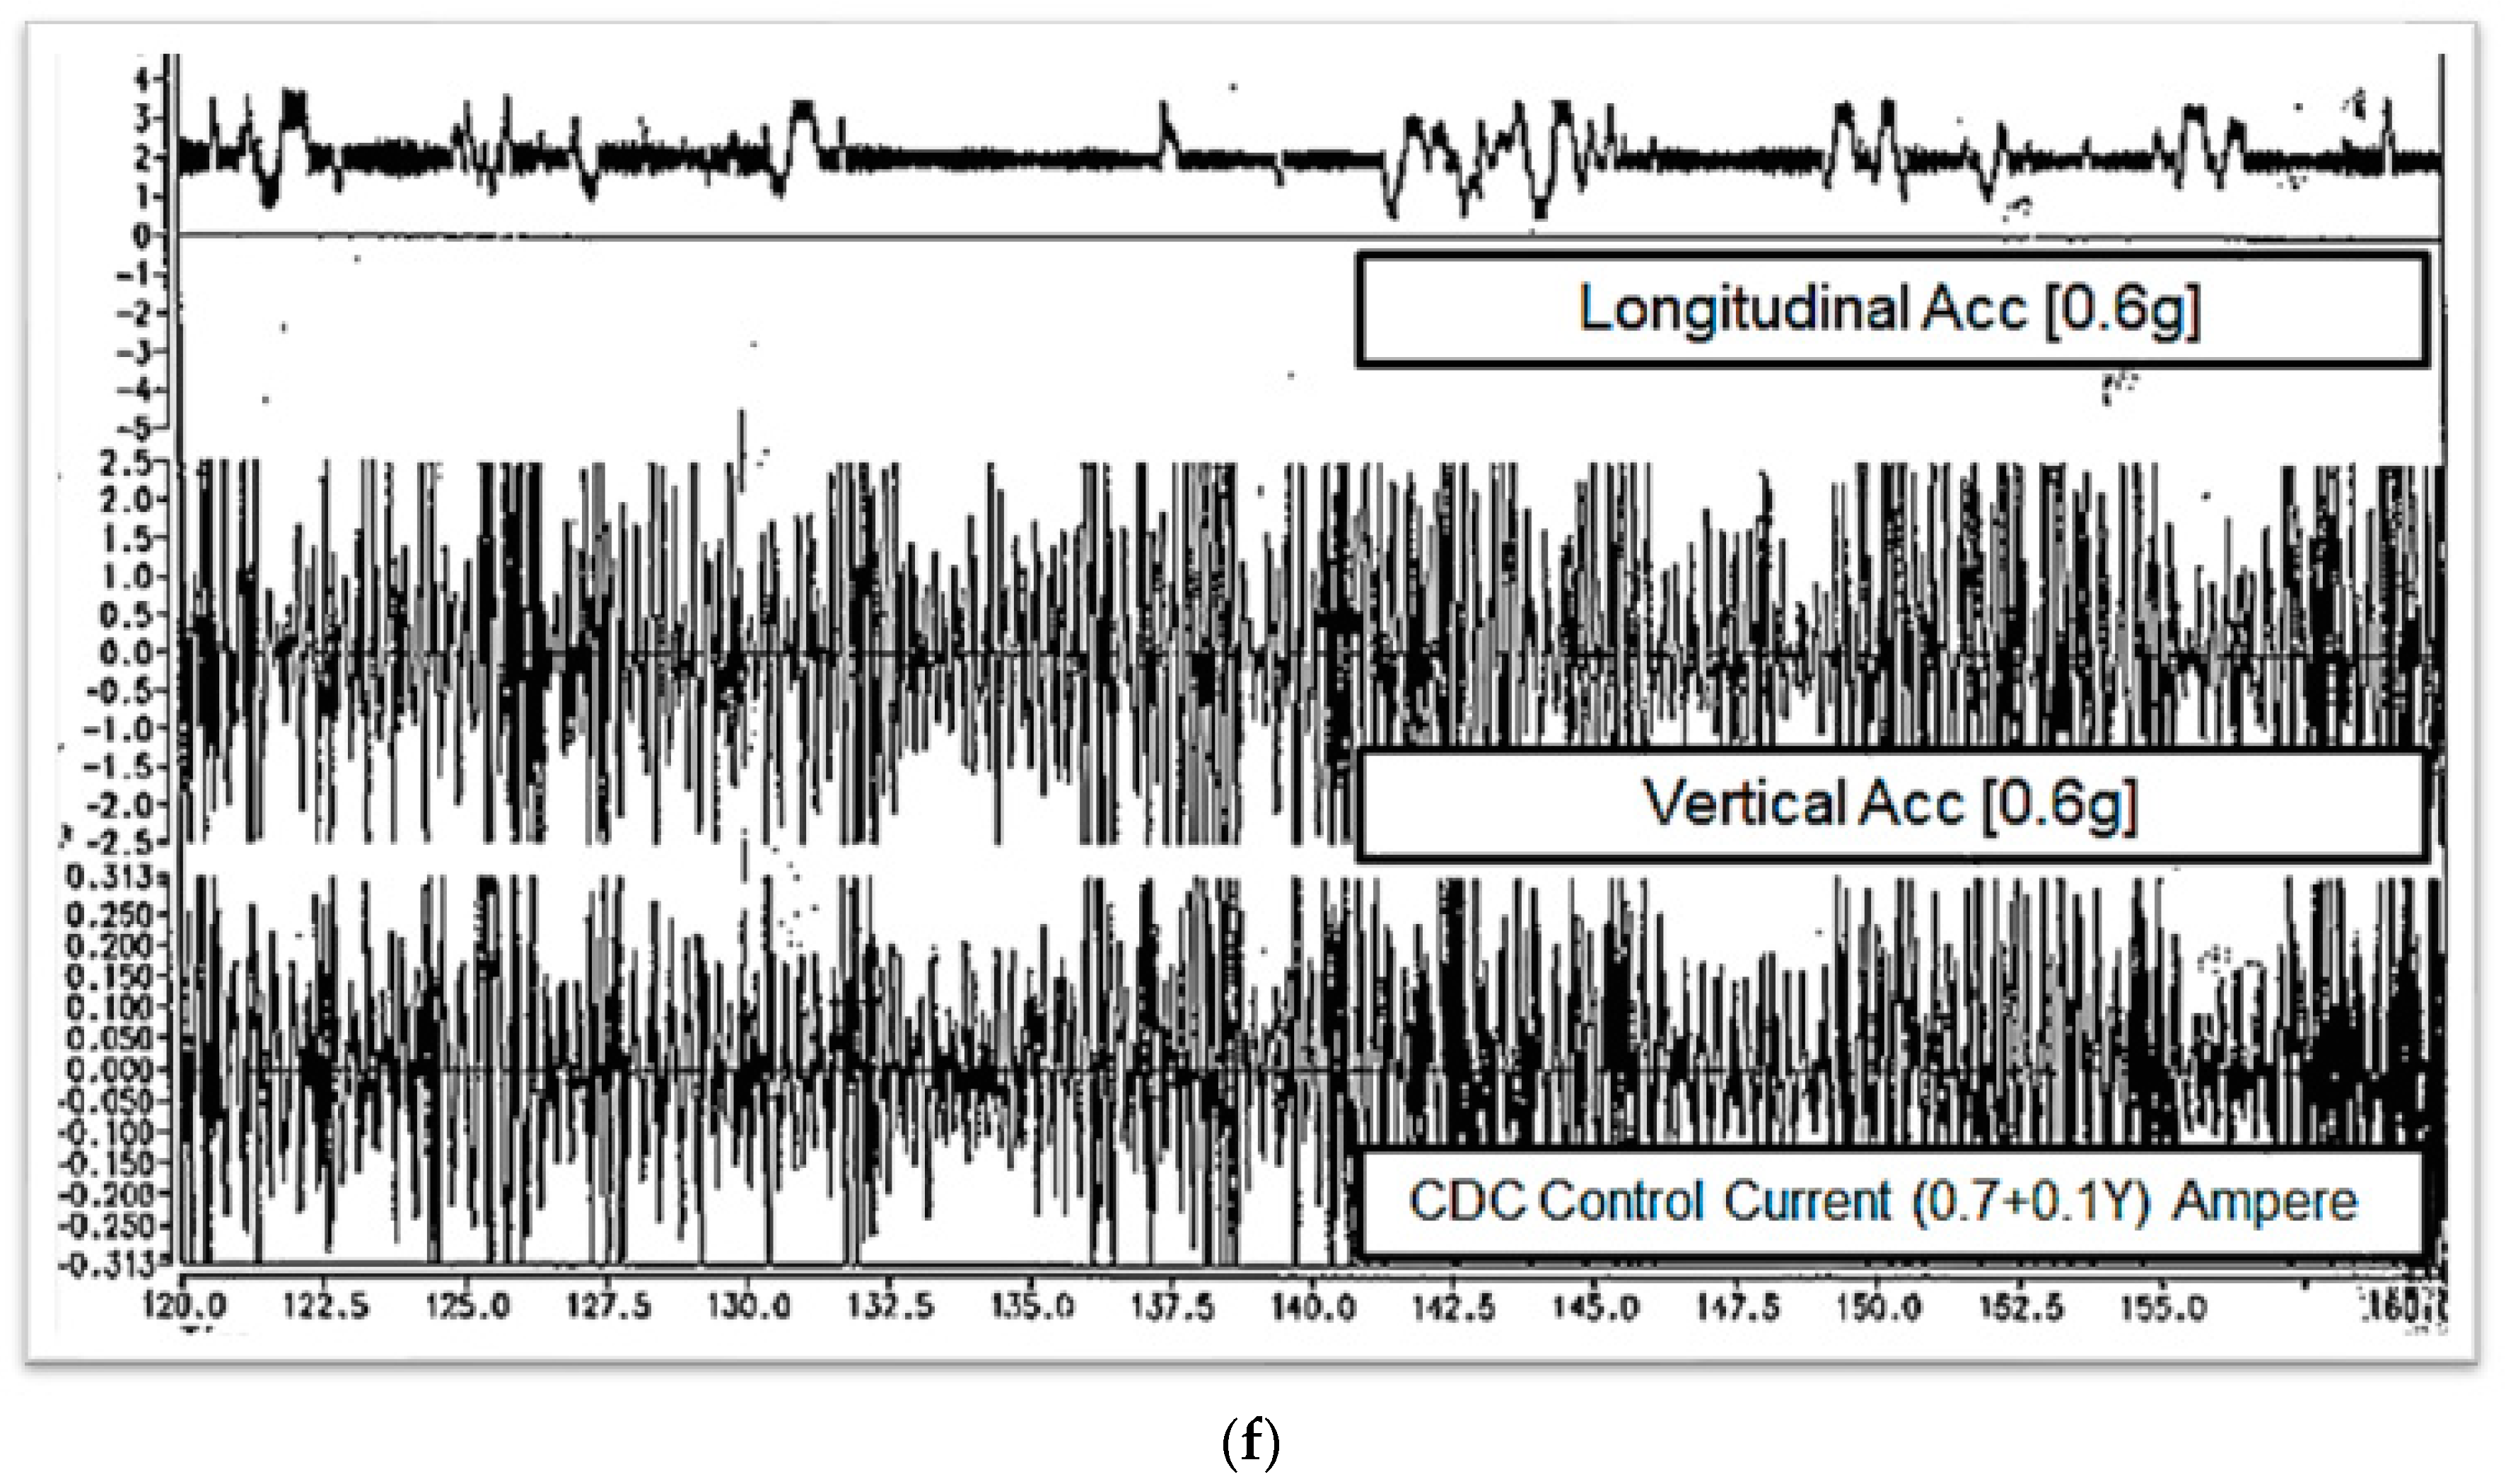
As described above, a Drive File was created using the configured system that reproduces the vertical direction, longitudinal direction, and the current applied from the ECU accordingly. This drive signal is the load and current signal measured on each road with a road configuration combined at a specific ratio, as shown in Table 2, which is the endurance test mode that is the purpose of this study. The drive signal created through the processes of RLDA, iteration, and editing is shown in Figure 11. This is about 165 MB per channel, a total of 500 MB, and corresponds to a driving distance of 500 km at an average speed of 71.4 km/h. In addition, only a portion corresponding to about 40 s of the signal that simultaneously represents the three vertical, longitudinal, and ECU current channels of each driving road is shown in Figure 11a–f. In Figure 11a, channel No. 1 is the signal in the longitudinal direction, which reproduces the condition input from the vehicle’s traveling direction. Also, channel No. 3 reproduces the vertical signal, channel No. 4 reproduces the ECU’s input current, and all three channels are synchronized, and general national roads, expressways, city roads, and unpaved roads are mixed. Figure 11b shows the driving signal of a general national road, and it can be seen that there is some signal input in the vertical and longitudinal directions, but the change in the ECU’s input current is not large. Also, Figure 11c shows the driving signal of a highway, and although the input waveform is not much different compared to that of a general national road, it can be seen that fast ECU control is performed due to high-speed driving. Figure 11d shows a general signal of a city road and a somewhat gradual change, but Figure 11e shows a subway construction section of a city road. A large input waveform is observed compared to the signal of Figure 11d. It can be seen that the longitudinal waveform is measured considerably larger on city roads than on general national roads or expressways. This implies that the longitudinal impact is more significant when driving on city roads than on national roads or expressways with gentle handling and a straight line tendency. Figure 11f, which shows the most considerable waveform change, is the drive signal of an unpaved road, and the vertical and longitudinal signals and the current the ECU applied show an extensive range of change. This means the harshest conditions. This waveform reproduction shows an error rate of 92%, which is about 3% lower than the initial target of 95% due to the limitations of the simulator’s speed and stroke.

4.2. Quarter Car Simulation Result

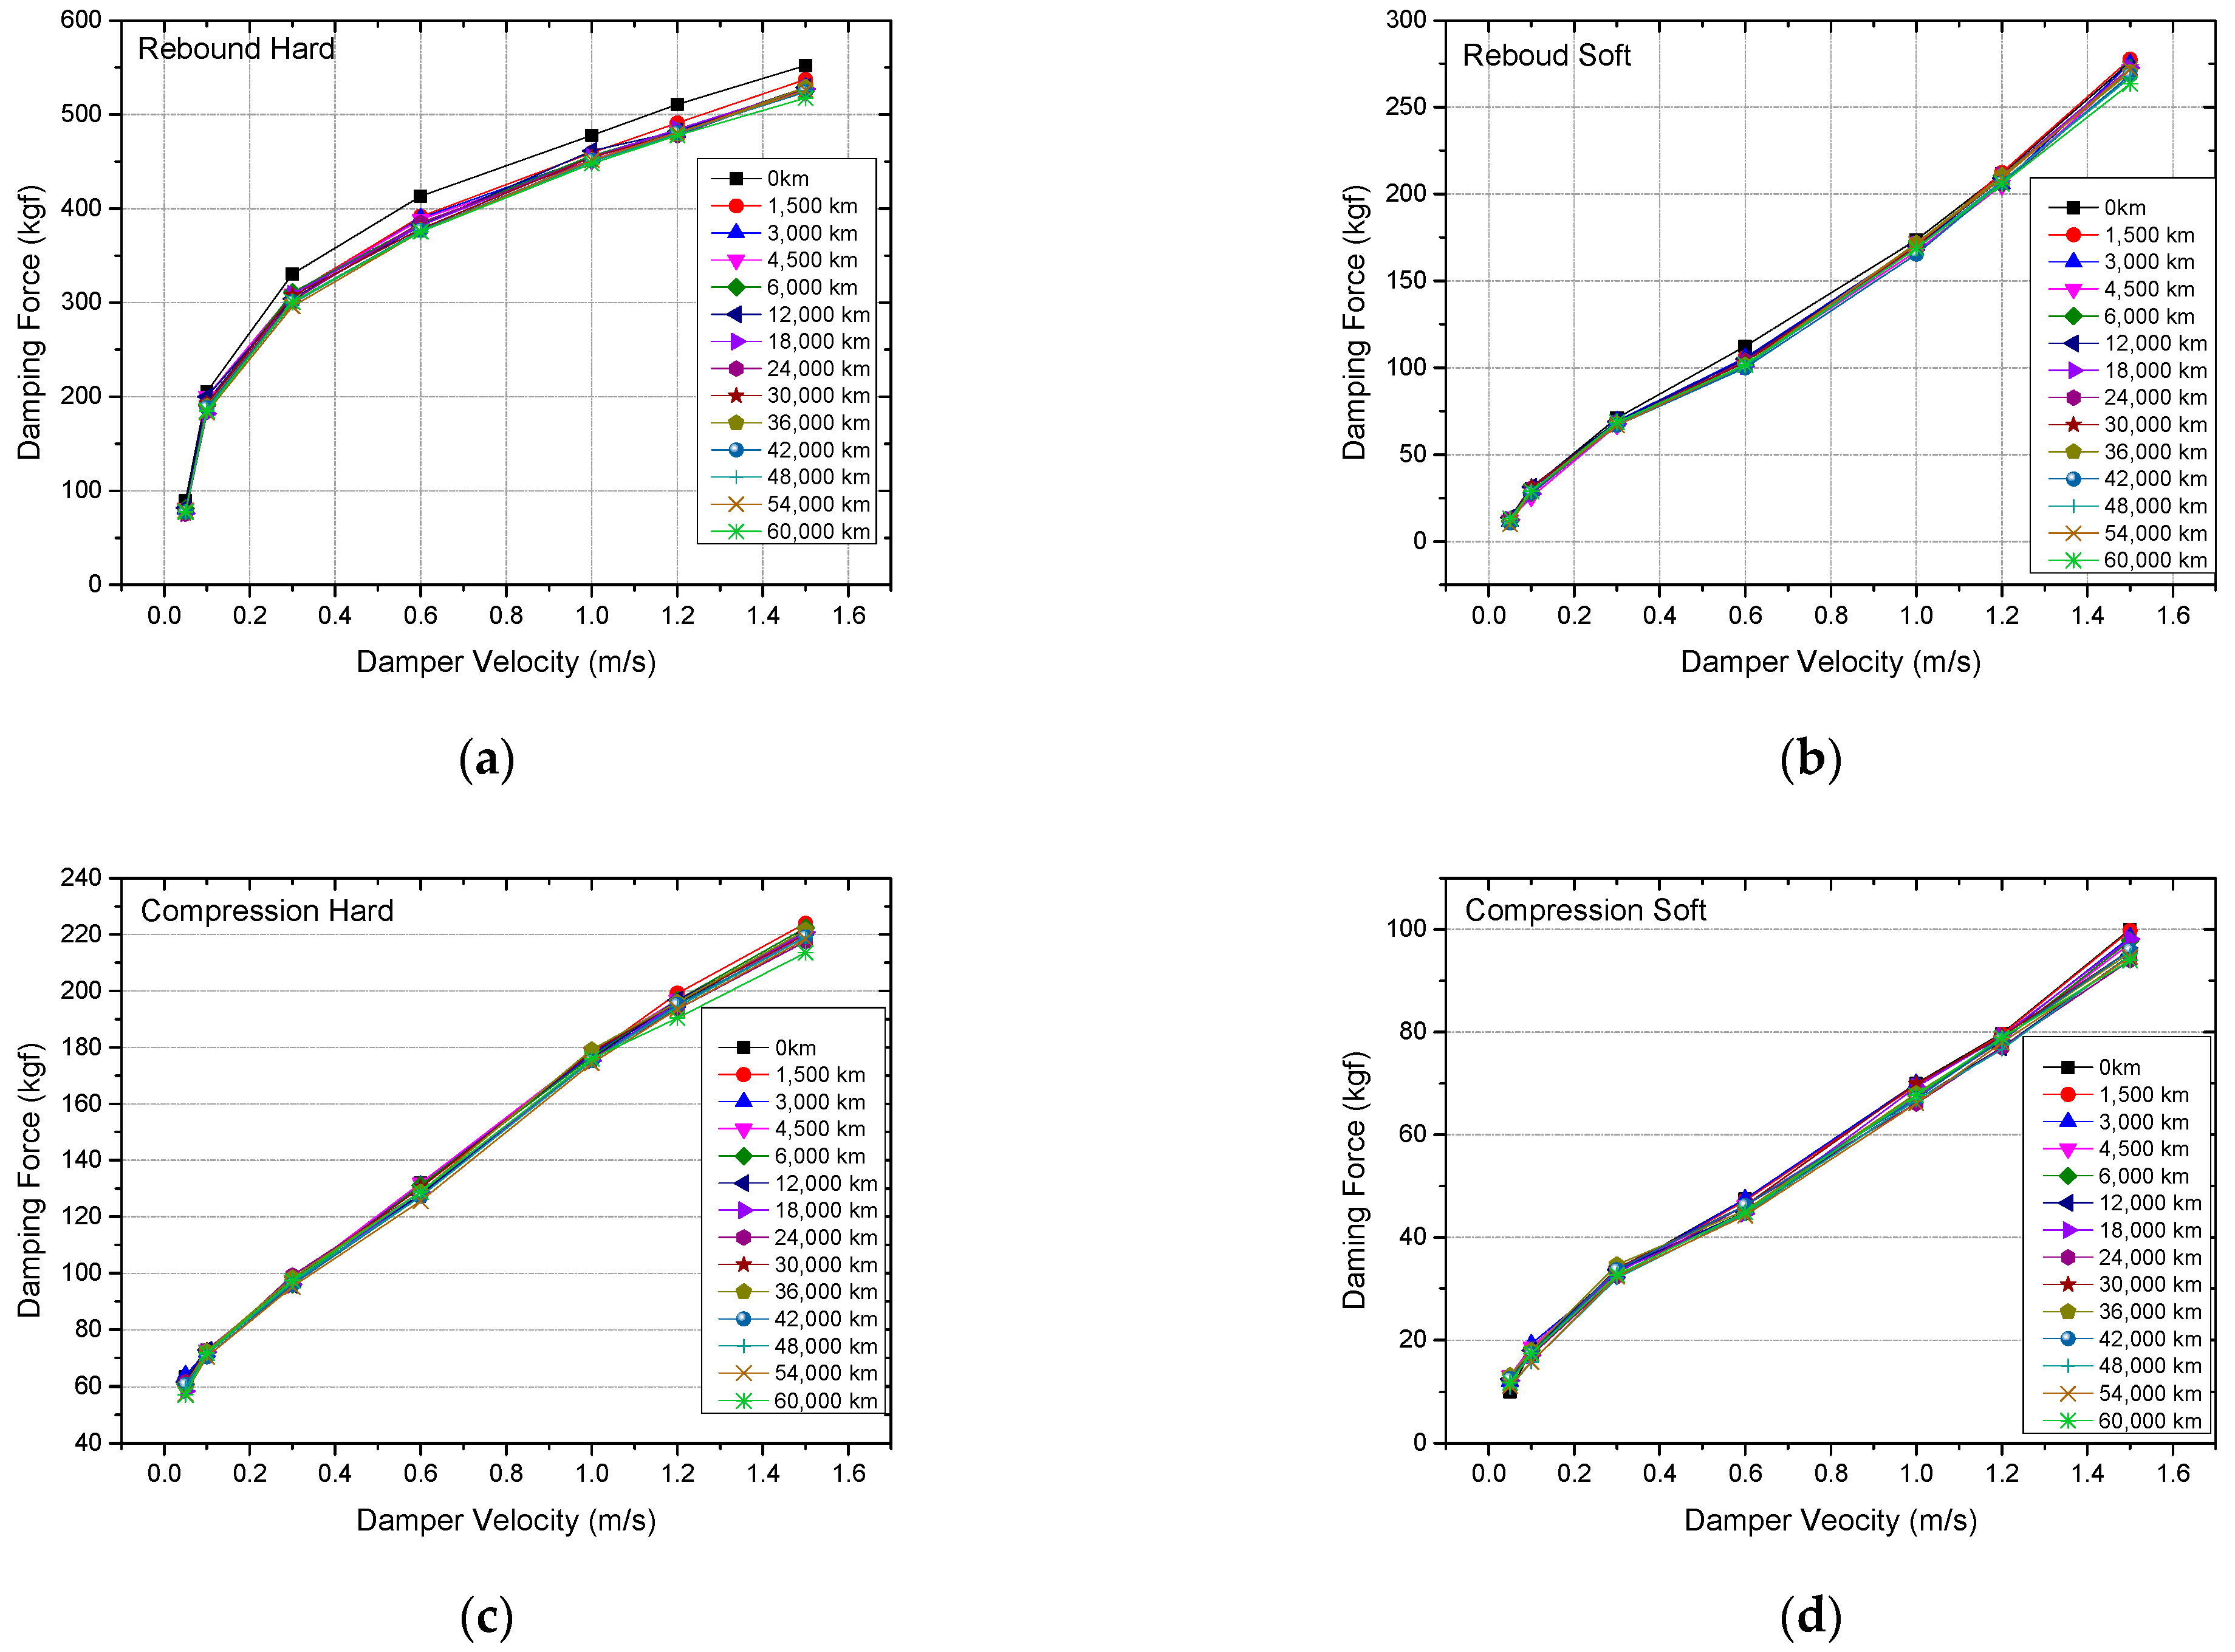
Using the configured 1/4 car simulator, the 60,000 km of driving was reproduced in the simulation mode described above. The damper’s damping force was measured every 1500 km for the first 6000 km and then every 6000 km after that to confirm the change. After 60,000 km, the rebound hard damping force decreased at an excitation speed of 0.3 m/s to approximately 32 kgf, a 9.7% decrease compared to the initial value. This value satisfies the target durability test spec’s judgment criterion: “The damping force change after the end of the test should be within 20%”. However, after 1500 km of driving in the initial stage of the test, a damping force decrease of 24 kgf, equivalent to 75% of the total damping force decrease, was measured. Therefore, it was analyzed that the overall damping force decrease occurred at the beginning of the driving, and the damping force decrease after that showed a considerably gradual trend. This initial damping force reduction phenomenon appears to be due to the oil leakage and cavitation effect inside the damper.
Oil leaks inevitably occur through the piston rod due to damper operation. When the durability of the oil seal deteriorates, cavitation usually occurs when the internal pressure of the damper momentarily drops below atmospheric pressure, causing air to be generated inside the oil, which increases the compressibility of the oil and reduces the pressure generation performance. Nitrogen gas pressure is generally used on the reservoir side, where the internal pressure of the damper is the lowest, to set it high compared to atmospheric pressure. However, as the number of damper operations increases, the gas component is absorbed into the oil, causing the reservoir reference pressure to drop to the same as the atmosphere pressure. Therefore, the possibility of cavitation inside the damper increases when a transient damper displacement occurs. When cavitation occurs, air is generated inside the oil, which increases the oil compressibility and is disadvantageous for damping force generation.
That is one of the potential failure modes from the FMEA results. In addition, the rebound soft damping force reduction was measured to be 5 kgf, a 7% decrease from the initial value, and the compression hard and soft damping forces showed almost no change as measured in the test results. The damping force reduction before and after the simulation test was mainly focused on the rebound hard damping force, which had a relatively large damping force, and the change in the compression damping force was insignificant. The damping force change by driving distance in the simulation test is shown in Table 4. The damping force change by excitation speed in each mode is shown in Figure 12.

5. Simplified Rig Test for Durability

In this chapter, we performed a damper damping force durability mode test to compare with the RLDA-based simulation results described in the previous chapter.
Generally, the damper performance test spec is performed by considering only the simple vertical motion, not the vehicle level, which considers the sprung mass and unsprung mass. The target durability test of the semi-active damper is determined by performing the up-and-down motion for a specific cycle, just like the durability test of the existing passive damper. Kuttner and Harnischmacher discuss endurance tests of electronic suspensions, which provide valuable context for understanding the durability evaluation of semi-active systems in this study [22]. At this time, the damper damping force mode is divided into three modes: Soft/Soft, Hard/Soft, and Soft/Hard Modes, and the durability performance for each mode is reflected. The electronically controlled damper damping force mode is implemented by supplying a constant current to the damper solenoid valve using the power source.

5.1. Test Setup and Method

For the endurance test, a tester as shown in Figure 13 was constructed using an existing actuator. In order to remove the heat generated from the damper during the test, a system capable of spraying air was installed, and the external temperature of the damper surface was maintained at 80 ± 10 °C. The input waveform was driven using an external drive controller computer, and a power source was installed to supply a specified current to the solenoid valve to supply a constant current.
Two types of durability tests were conducted on semi-active dampers. Among them, durability tests using the up-and-down vibration of the damper included the oil leakage durability test and the solenoid valve durability test. Among these two tests, the oil leakage durability test was excited under 4 Hz, representing a frequent occurrence frequency during actual road driving. Although the solenoid durability evaluation test was not conducted in this study, the 12.7 Hz excitation condition was set to evaluate the durability of the solenoid component. Therefore, only the oil leakage durability test was conducted to compare with the simulation test and to implement the items in the specification of the semi-active damper. The oil leakage of the damper is greatly affected by the oil seal friction between the oil seal and the piston rod of the damper. Therefore, the damper operating speed, the frequency of 4 Hz, and the stroke were set so that the damper speed was about 0.6 m/s, which is higher than the representative damping force performance evaluation speed of 0.3 m/s based on the actual road described above. The detailed rig test conditions are summarized in Table 5.

5.2. Rig Test Results

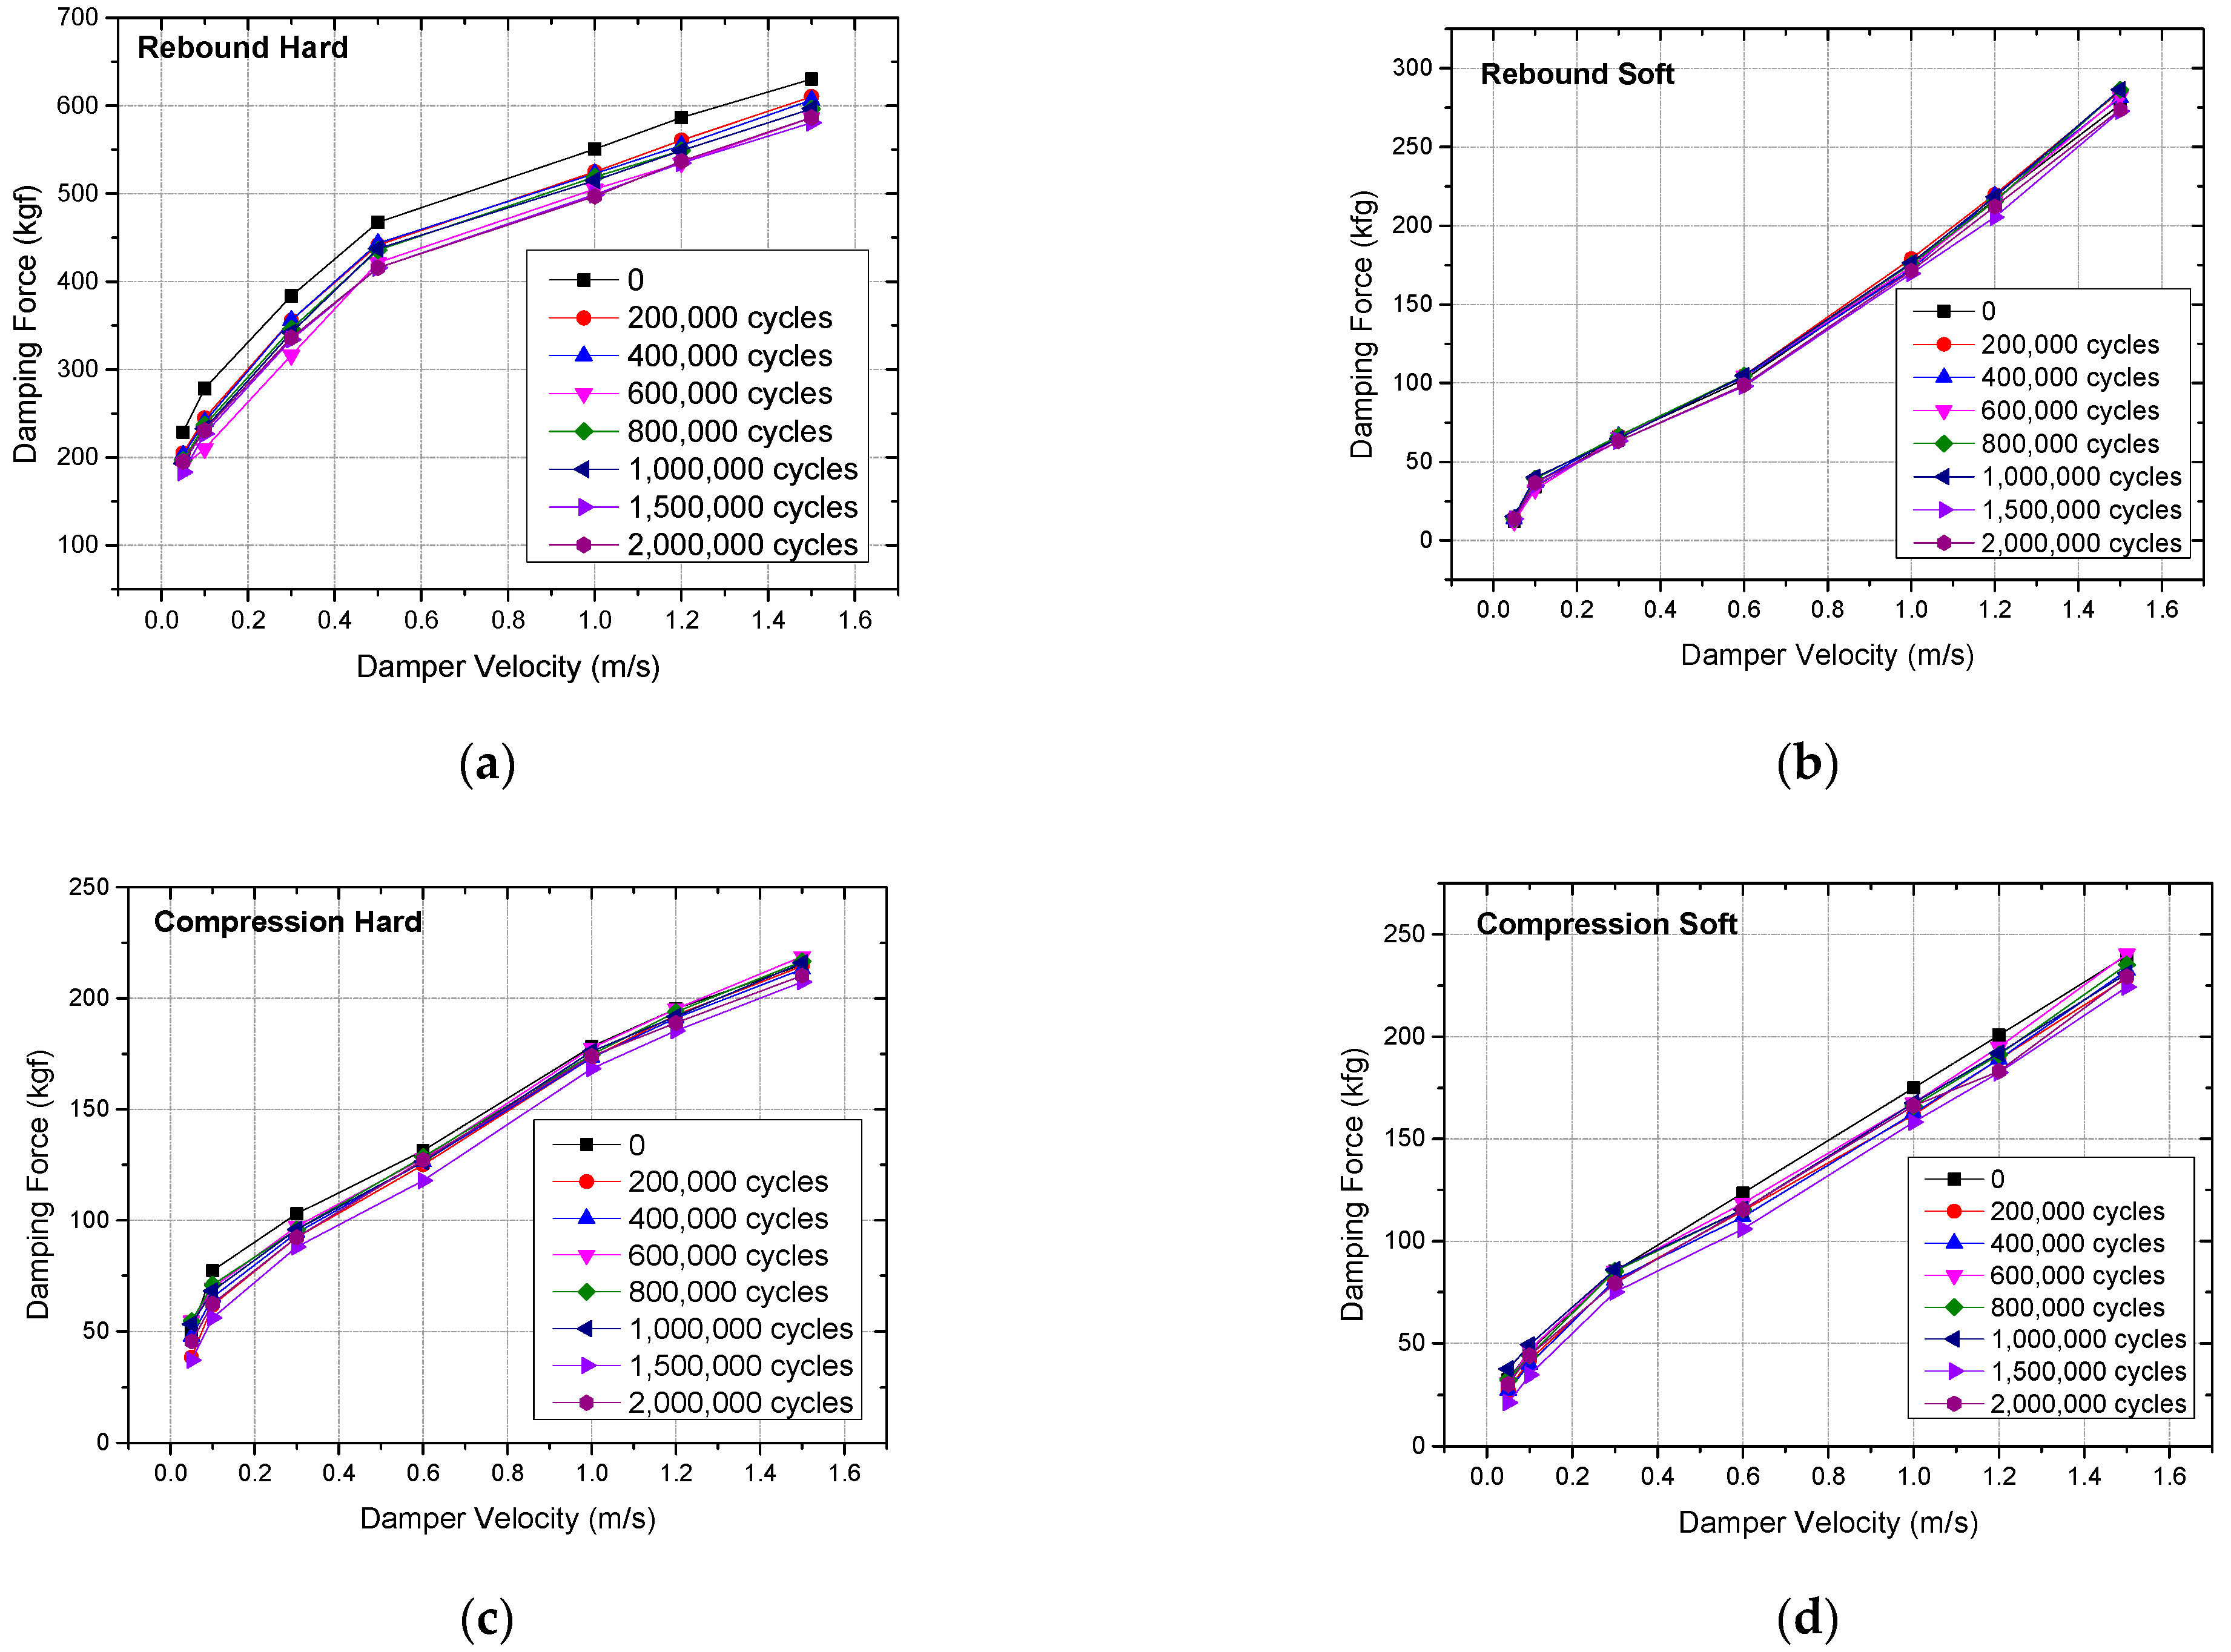
Based on the test device and method described above, the target durability test was performed on the semi-active damper, and the damping force change was measured every 200,000 cycles during one million cycles in Soft/Soft Mode. Measurements were also performed after 500,000 cycles in Hard/Soft Mode and 500,000 cycles in Soft/Hard Mode. After one million cycles in Soft/Soft Mode, both SMPL #1 and #2 showed a 10% decrease in damping force in rebound hard, and then after 500,000 cycles in Hard/Soft Mode and 500,000 cycles in Soft/Hard, the damping force decreased by 13% and 16%, respectively. The damping force change after the target durability test also showed a significant decrease in rebound hard damping force, just like the damping force after the simulation test, and it could be seen that there was no considerable decrease in rebound soft and compression damping forces. The results of the target durability test are shown in Table 6. The change in damping force according to the excitation speed in each mode is shown in Figure 14, respectively. The flow resistance of the oil generates the damping force of an electronically controlled damper, so the properties of the oil are essential, especially the dynamic viscosity characteristics. The dynamic viscosity is greatly affected by the characteristic of heat, and over time, the viscosity may decrease due to internal friction, contamination, and pressure. In addition, the piston rod of an electronically controlled damper may become contaminated with dust and foreign substances as it repeats tension and compression, and the oil may be deposited on the piston rod and evaporate, which may reduce the amount of oil and cause a decrease in the internal pressure of the damper. In this study, we attempted to confirm these changes according to driving conditions and operating cycles.
The results of the rig test and simulation are similar in the tendency of damping force reduction, but the difference is that there is an absolute load difference that comes from the rig test, simplifying the operating conditions in terms of the realization of the load conditions. The actual public load conditions are complex in connection with the change in the control command value. In order to simplify the electronic control damper durability spec, this study used the vehicle equivalent driving mileage and operating cycle information. Since the damper is a system that changes kinetic energy into heat energy, it is judged that additional damper temperature patterns should be considered when simplifying the specification.

6. Discussion

To ensure a comprehensive understanding of the performance degradation of the CDC damping force and the adequacy of the durability spec, we conducted a meticulous three-stage RLDA-based damper performance degradation verification:
  • We applied a 3000 km real vehicle road test to analyze the pseudo damage to the damper from a reliability engineering perspective, ensuring the practical relevance of our methods. Based on the real vehicle road test, the characteristics of each road surface were determined. An additional RLDA based on 500 km was performed for a simulation test to develop a simulation test mode, and 60,000 km of a driving simulation test was performed. The test results confirmed that the tensile damping force caused substantial performance degradation.
  • The currently set target durability was assessed to confirm a similar performance degradation pattern.
It was confirmed that the damping force was reduced by more than 10% after one million Soft/Soft tests and 500,000 Hard/Soft and Soft/Hard tests each. The main expected cause of the damping force reduction is that, unlike the compression stroke when generating tensile damping force, the piston rod inside the damper operates between the external environment and the oil chamber, so friction wear and oil exposure due to the damper stroke can cause oil leaks. It can be determined that this is due to changes in internal oil conditions such as cavitation. In addition, the performance deterioration evaluation for oil leaks over 3000 km of driving was calculated based on the damper stroke distance. Based on the rig damper stroke mileage, the front damper corresponds to 6.2 km, and the rear wheel corresponds to 8.1 km. When the damper durability specification is defined as two million operations under the conditions of 25 mm stroke and 4 Hz, it corresponds to 200 km based on the damper stroke mileage. When compared with the actual stroke, it can be converted to a target driving mileage of 160,500 km. If the same calculation is made for the rear damper, it can be calculated as 81,400 km.

7. Conclusions and Future Works

The durability test for a continuously variable damper is different from the existing durability test method for a passive damper, which has a constant damping force, in that the damping force is variable by the ECU’s current control so that the damping force is appropriate for the vehicle’s driving environment measured by various sensors. Therefore, there is a problem that the current input to the damper’s solenoid valve during the test must also be reproduced, making it quite difficult to reproduce it through simulation in a lab. However, the actual driving environment can be reproduced in a lab and the input power can also be reproduced. In that case, there are many advantages in terms of time and economy compared to conducting a durability test on an actual vehicle. Therefore, it is essential to conduct research that can replace an actual vehicle durability test with a lab simulation.
  • The process of verifying the performance of a semi-active damper can be performed through the following processes: RLDA → basic damage and the analysis of key conditions (damper displacement and speed) → the construction of a quarter car simulator and ECU current control system → rig durability. In this study, we developed a simulation mode with a 3000 km-based damper severity analysis and a drive signal corresponding to 500 km to analyze the damper damage and performance degradation.
  • The durability of the semi-active damper used as the SMPL in the simulation test and target durability test was measured to be 10% in the simulation test and 13~16% in the target durability test regarding performance degradation.
  • It was observed that the tension force generation mechanism is more disadvantageous in design for external input than for compressive force, and this is interpreted as a high possibility of a failure mode that can occur in the current damper structure. However, there is also a decrease in the performance of the internal variable valve. Since the rebound damping force additionally controls the vehicle behavior, it can significantly affect the ride comfort and steering stability of the vehicle. As the current CDC system is widely applied to passenger cars, it should be designed to minimize performance changes. Additional research on the appropriate damping force generation amount and appropriate internal pressure design based on the external load input are required. Also, an optimal design is necessary since the oil seal on the rod guide side shows a complementary relationship between friction and leakage.
  • In future research, it is essential to conduct a detailed simulation of damper operation changes based on load and environmental conditions to improve the verification of the performance deterioration of electronically controlled damper actuators. This simulation should consider various environmental factors during road driving, such as temperature, various road conditions, and humidity. Additionally, it is crucial to examine how the control algorithm affects performance. Therefore, developing a comprehensive damage index or model is recommended to predict potential damage to the damper actuator effectively.

Author Contributions

Conceptualization, J.L. (Jeongwoo Lee) and J.L. (Jaepoong Lee); methodology, J.L. (Jeongwoo Lee); software, J.L. (Jeongwoo Lee); validation, J.L. (Jeongwoo Lee) and J.L. (Jaepoong Lee); formal analysis, J.L. (Jeongwoo Lee); investigation, J.L. (Jaepoong Lee); resources, Jengwoo Lee; data curation, J.L. (Jeongwoo Lee); writing—original draft preparation, J.L. (Jeongwoo Lee); writing—J.L. (Jaepoong Lee) and J.L. (Jeongwoo Lee); visualization, J.L. (Jeongwoo Lee); supervision, J.L. (Jaepoong Lee); project administration, J.L. (Jaepoong Lee). All authors have read and agreed to the published version of the manuscript.

Funding

This research was funded by the Kyungpook National University Research Fund, 2024.

Institutional Review Board Statement

Not applicable.

Informed Consent Statement

Not applicable.

Data Availability Statement

The data presented in this study are available on request from the corresponding author. The data is related with a company privacy.

Acknowledgments

This work was supported by the Kyungpook National University Research Fund, 2024.

Conflicts of Interest

The authors declare no conflicts of interest.

Nomenclature

AccAcceleration
CATComputer Aided Testing
CDCContinuous Damping Control
ECUElectronic Control Unit
ECSElectronic-Controlled Suspension
FMEAFailure Mode Analysis
MPIPMulti-Parameter Index Preservation-Based Load Spectrum Editing Method
RLDARoad Load Data Acquisition
TCFDTime-Correlated Fatigue Damage

References

  1. Yang, Z.; Zhang, S.; Jia, J.; Fu, J.; Zhai, J. Research on Road Simulation Accelerated Durability Test Method for Front Swingarm. In Proceedings of the China SAE Congress 2018: Selected Papers; Springer: Singapore, 2020; pp. 83–97. [Google Scholar]
  2. Avhad, A.; Iqbal, S. Digital Road Load Data Acquisition Methodology for Automotive Durability Analysis; 0148-7191; SAE Technical Paper; SAE International: Warrendale, PA, USA, 2021. [Google Scholar]
  3. Kim, J.; Kim, M.; Joo, S.-G.; Heo, S.P.; Yoo, Y. Development of virtual road wheel input forces for belgian ground. SAE Int. J. Passeng. Cars-Mech. Syst. 2014, 7, 125–131. [Google Scholar] [CrossRef]
  4. Zheng, G.; Pan, H.; Chen, B.; Chen, W.; Wang, Q.; Jia, H.; Liu, X. Methods for editing random load spectra based on multi-parameter index preservation for accelerated durability testing. Proc. Inst. Mech. Eng. Part C J. Mech. Eng. Sci. 2022, 236, 7657–7673. [Google Scholar] [CrossRef]
  5. Yu, J.; Zheng, S.; Feng, J.; Zhao, L. New methodology for determination of load spectra for the vehicle accelerated durability testing associated with the time correlated fatigue damage analysis method. Int. J. Automot. Technol. 2017, 18, 547–560. [Google Scholar] [CrossRef]
  6. Zhou, Y.; Li, H. Accelerated durability evaluation of automotive components under multi-channel random loading. Proc. Inst. Mech. Eng. Part D J. Automob. Eng. 2024, 238, 1044–1056. [Google Scholar] [CrossRef]
  7. Yu, J.; Zhao, L.; Ma, J.; Zheng, S.; Yu, H. Load spectrum compilation for vehicle road simulation test by applying a new time domain threshold editing method. Proc. Inst. Mech. Eng. Part D J. Automob. Eng. 2024, 238, 277–290. [Google Scholar] [CrossRef]
  8. Lozia, Z. Application of Modelling and Simulation in Durability Tests of Vehicles and Their Components. Energies 2022, 15, 9398. [Google Scholar] [CrossRef]
  9. Meggiolaro, M.A.; de Castro, J.T.P. An improved multiaxial rainflow algorithm for non-proportional stress or strain histories–Part I: Enclosing surface methods. Int. J. Fatigue 2012, 42, 217–226. [Google Scholar] [CrossRef]
  10. Schudt, J.A.; Kodali, R.; Shah, M.; Babiak, G. Virtual Road Load Data Acquisition in Practice at General Motors; 0148-7191; SAE Technical Paper; SAE International: Warrendale, PA, USA, 2011. [Google Scholar]
  11. Gobbi, M.; Guarneri, P.; Mastinu, G.; Rocca, G. Test rig for characterization of automotive suspension systems. SAE Int. J. Passeng. Cars-Mech. Syst. 2008, 1, 568–576. [Google Scholar] [CrossRef]
  12. Halfpenny, A. Methods for accelerating dynamic durability tests. In Proceedings of the 9th International Conference on Recent Advances in Structural Dynamics, Southampton, UK, 17–19 July 2006; pp. 17–19. [Google Scholar]
  13. Karnopp, D. Active and semi-active vibration isolation. J. Vib. Acoust. 1995, 117, 177–185. [Google Scholar] [CrossRef]
  14. Soliman, A.; Kaldas, M. Semi-active suspension systems from research to mass-market—A review. J. Low Freq. Noise Vib. Act. Control 2021, 40, 1005–1023. [Google Scholar] [CrossRef]
  15. Savaresi, S.M.; Poussot-Vassal, C.; Spelta, C.; Sename, O.; Dugard, L. Semi-Active Suspension Control Design for Vehicles; Elsevier: Amsterdam, The Netherlands, 2010. [Google Scholar]
  16. Lu, Z.; Zhang, J.; Zhou, M.; Zhang, H.; Masri, S.F.; Du, J. Reliability assessment and electromagnetic controller for semi-active impact damper in structural vibration control. J. Vib. Control 2024. [Google Scholar] [CrossRef]
  17. Moaaz, A.O.; Ghazaly, N.M. Semi-active suspension system control using Skyhook and Groundhook controller. Int. J. Adv. Sci. Technol. 2019, 28, 424–433. [Google Scholar]
  18. Kim, W.; Lee, J.; Yoon, S.; Kim, D. Development of Mando’s New Continuously Controlled Semi-Active Suspension System; 0148-7191; SAE Technical Paper; SAE International: Warrendale, PA, USA, 2005. [Google Scholar]
  19. Poussot-Vassal, C.; Savaresi, S.M.; Spelta, C.; Sename, O.; Dugard, L. A methodology for optimal semi-active suspension systems performance evaluation. In Proceedings of the 49th IEEE Conference on Decision and Control (CDC), Atlanta, GA, USA, 15–17 December 2010; pp. 2892–2897. [Google Scholar]
  20. Pathare, Y.S.; Nimbalkar, S.R. Design and development of quarter car suspension test rig model and it’s simulation. Int. J. Innov. Res. Dev. 2014, 3, 157–170. [Google Scholar]
  21. Kulkarni, A.; Ranjha, S.A.; Kapoor, A. A quarter-car suspension model for dynamic evaluations of an in-wheel electric vehicle. Proc. Inst. Mech. Eng. Part D J. Automob. Eng. 2018, 232, 1139–1148. [Google Scholar] [CrossRef]
  22. Kuttner, T.; Harnischmacher, F. Endurance tests of electronic suspension for motorcycles–a system approach. In 6th International Munich Chassis Symposium 2015: Chassis. Tech Plus; Springer: Wiesbaden, Germany, 2015; pp. 405–420. [Google Scholar]
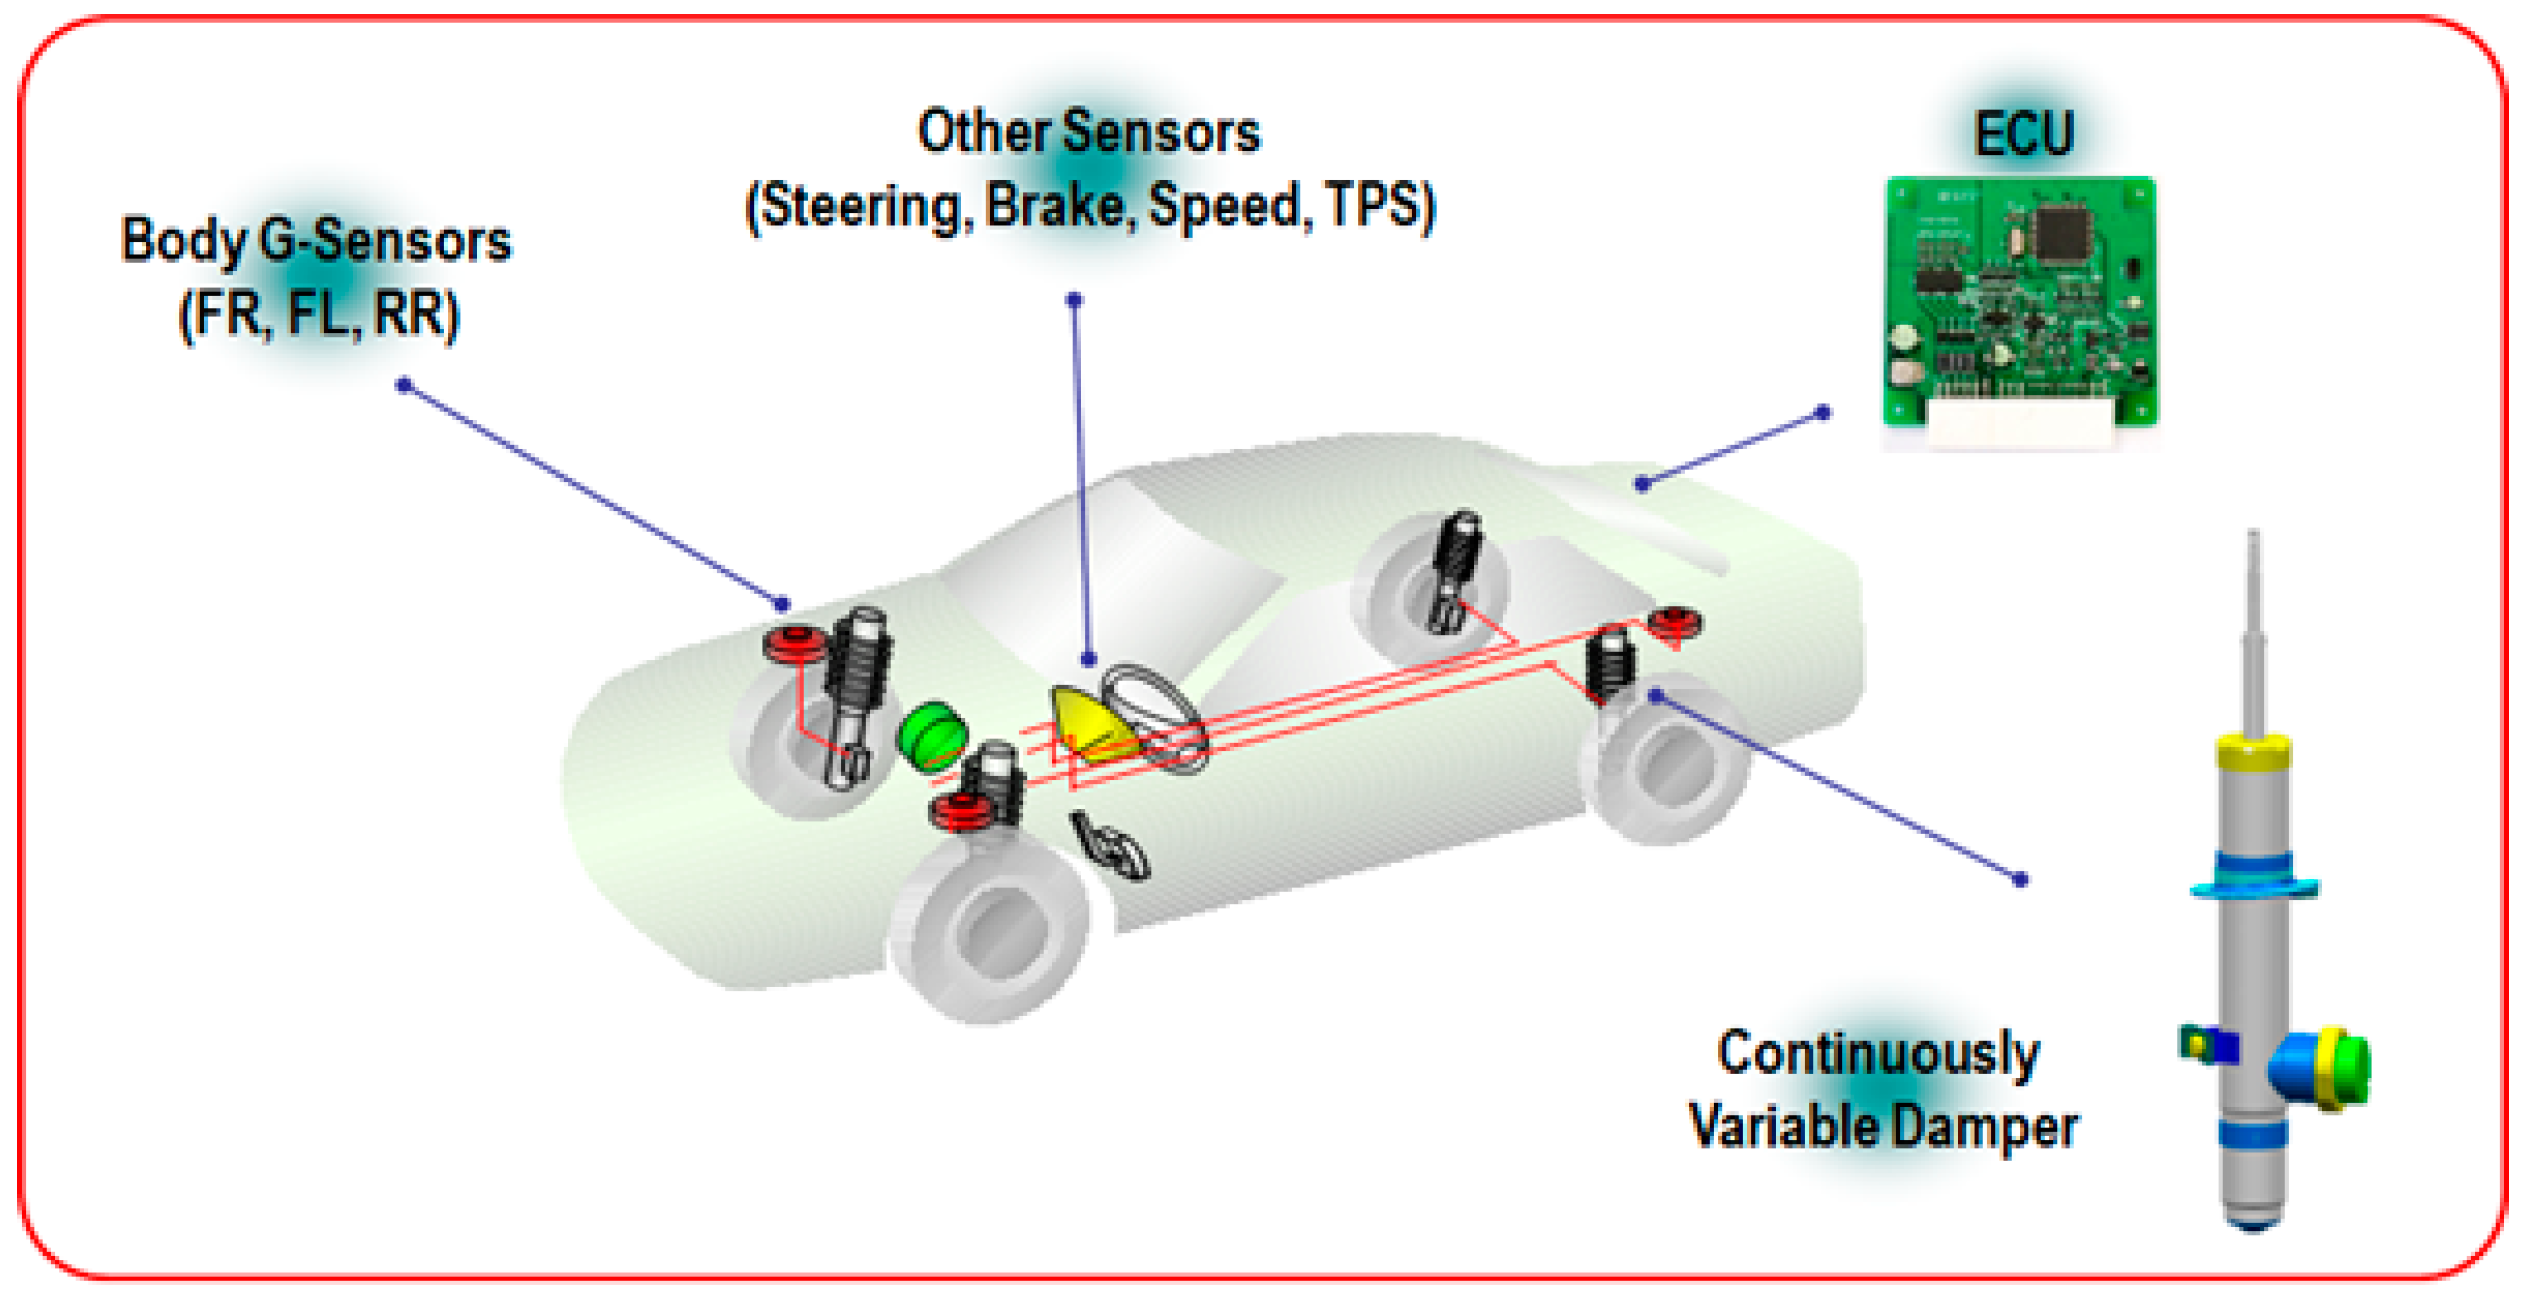
Figure 1. Continuous damping control system configuration.
Applsci 14 10093 g001
Figure 2. Brief CDC system control functions.
Applsci 14 10093 g002
Figure 3. Working principle of CDC system point of damping force variations.
Applsci 14 10093 g003
Figure 4. CDC damper’s internal hydraulic components and flow: (a) CDC damper’s assembly and flow; (b) fluid flow and control current; and (c) damper assembly (variable valve integration).
Applsci 14 10093 g004
Figure 5. CDC system’s damping force creation flow diagram (in detail).
Applsci 14 10093 g005
Figure 6. Data acquisition system for the motion detection of the damper.
Applsci 14 10093 g006
Figure 7. Equivalent amplitude of front and rear damper with respect to road conditions.
Applsci 14 10093 g007
Figure 8. Rain flow matrix of the damper velocity (front): (a) Highway; (b) Country road; (c) City road; (d) Unpaved road.
Applsci 14 10093 g008
Figure 9. Rain flow matrix of the damper velocity (rear): (a) Highway; (b) Country road; (c) City road; (d) Unpaved road.
Applsci 14 10093 g009
Figure 10. Quarter car simulator.
Applsci 14 10093 g010
Figure 11. RLDA: (a) combination of country/highway/city/unpaved; (b) country road; (c) highway; (d) city road (general case); (e) city road (construction area); (f) unpaved road.
Applsci 14 10093 g011aApplsci 14 10093 g011bApplsci 14 10093 g011cApplsci 14 10093 g011d
Figure 12. Damping force variation with respect to simulation mileage: (a) rebound hard; (b) rebound soft; (c) compression hard; (d) compression soft.
Applsci 14 10093 g012
Figure 13. Damper durability test facility.
Applsci 14 10093 g013
Figure 14. Damping force variation: (a) rebound hard; (b) rebound soft; (c) compression hard; (d) compression soft.
Applsci 14 10093 g014
Table 1. Acquisition facilities’ specifications.
FacilityManufacturerSpecification
Strain GaugeKYOWA, Tokyo, Japan120 Ω
AccelerometerDYTRAN 3016A, Chatsworth, CA, USA0.5 V/G
Height SensorDATRON, Milton Keynes, UK-
Amplifier
Recorder
M/M, Milano, Italia
TEAC, Tokyo, Japan
4-Channel
16-Channel
Table 2. Acquisition facilities’ specifications.
Road ClassificationRatio (%)
City road53.6
Country road28.6
Highway18.1
Unpaved road1.5
Table 3. RLDA for the simulation.
Road ClassificationRatio (%)Mileage (km)
City road51.1268
Country road25.5134
Highway21.1110.5
Unpaved road2.312
Table 4. Damping force variation at 0.3 m/s with respect to driving mileage.
Damping Force
/Driving Mileage
Rebound Damping Force
(kgf)
Compression Damping Force
(kgf)
HardSoftHardSoft
0330729633
1500 km306679733
3000 km305699734
4500 km308679633
6000 km310689633
12,000 km303709633
18,000 km309679833
24,000 km301689832
30,000 km305689734
36,000 km303679834
42,000 km298669532
48,000 km298689633
54,000 km299679432
60,000 km298679732
Table 5. Rig test conditions for the durability performance evaluation.
ItemsOil Leakage Test Condition
Damper outer cylinder temperature80 ± 10 °C (air cooling)
Damper stroke±25 mm
Damper speed4 Hz
Applied control currentSoft/Soft Mode: 0.8 A
Hard/Soft Mode: 0.3 A
Soft/Hard Mode: 1.3 A
Number of test cyclesSoft/Soft Mode: 1,000,000
Hard/Soft Mode: 500,000
Soft/Hard Mode: 500,000
Table 6. Damping force variation with respect to rig test cycles.
Damping Force
vs. Cycles
(#1, #2: Test Sample Number)
Rebound (kfg)Compression (kgf)
HardSoftHardSoft
#1#2#1#2#1#2#1#2
03833856668104803430
Soft/Soft200,000355-68-94-32-
400,000355-66-95-32-
600,000311-65-98-34-
800,000347-66-97-34-
1,000,000344345666596793431
Hard/Soft500,000333334646688673031
Soft/Hard500,000334324626592793030
Disclaimer/Publisher’s Note: The statements, opinions and data contained in all publications are solely those of the individual author(s) and contributor(s) and not of MDPI and/or the editor(s). MDPI and/or the editor(s) disclaim responsibility for any injury to people or property resulting from any ideas, methods, instructions or products referred to in the content.