Abstract
To investigate the microscopic pore evolution characteristics of Zhanjiang Formation structural clay during the disturbance process, unconfined compressive strength tests, scanning electron microscopy (SEM), and X-ray diffraction (XRD) were conducted on disturbed samples subjected to various disturbance conditions after vibrational disturbance. Based on the evolution characteristics of the microstructure, the microscopic pore characteristics of the disturbance damage of Zhanjiang Formation structural clay were examined. The results indicate the following. (1) The porosity in three-dimensional visualization images of the microstructure reconstructed by ArcGIS 10.1 increases with the disturbance degree, showing a linear growth trend. (2) The correlation analysis between macroscopic mechanics and microscopic pores shows that the unconfined compressive strength of Zhanjiang Formation structural clay is mainly affected by its porosity, with a significant linear negative correlation. Based on this, a reasonable regression model between the microscopic porosity and the unconfined compressive strength has been established. The model can rapidly estimate the unconfined compressive strength from porosity data, facilitating the assessment engineering properties of the soil. (3) The microscopic pore structure of Zhanjiang Formation structural clay exhibits prominent Menger fractal characteristics. The three-dimensional pore fractal dimension has a certain positive correlation with the disturbance degree, and can be utilized to characterize the pore structure and complexity, serving as a significant parameter for the quantitative evaluation of the pore structure characteristics of Zhanjiang Formation structural clay. Consequently, the complexity of the pore structure of the engineering soil can be evaluated by the pore fractal dimension. (4) The impact of disturbance on soil is primarily manifested in the structural changes in secondary clay minerals, transitioning from a relatively intact to a fully adjusted state. During this process, interparticle pores continuously increase, pore structure complexity increases, and interparticle cementation weakens, resulting in the continuous degradation of unconfined compressive strength. This study contributes to a deeper understanding of the disturbance damage characteristics of Zhanjiang Formation structured clays from a microscopic pore perspective, providing a theoretical basis for the engineering construction and operational maintenance in regions with Zhanjiang Formation structural clay.
1. Introduction
In recent years, Zhanjiang, China, has extensively developed infrastructure projects, leveraging its strategic position within the Northern Gulf City Cluster, the Guangdong–Hong Kong–Macao Greater Bay Area, the Hainan Free Trade Zone, and as a critical link for the Belt and Road initiative [1,2]. While these developments have spurred economic growth, they have also introduced significant engineering challenges. For instance, vibrations from construction activities have resulted in structural damage and hastened the degradation of geotechnical structures. Consequently, investigating the damage and deterioration of Zhanjiang Formation structural clay under disturbed conditions is of substantial practical importance for engineering projects.
The concept of “disturbance damage” was first introduced by Desai [3] and refers to the process where the adjustment and weakening of the soil’s microstructure is accompanied by the deterioration of its mechanical properties [4,5]. Consequently, the impairment of soil microstructural integrity and the associated deterioration of mechanical properties due to disturbance are collectively termed “disturbance damage”. The deformation of soil when disturbed is the cumulative result of changes in structural connections, particles, pore spaces, and other elements [6]. The characteristics and distribution of internal pores are the intrinsic causes and important manifestations of changes in soil microstructure [7], and they are a vital parameter in the quantitative analysis of microstructure. In engineering, they directly reflect the deformation of the soil [8] and therefore are considered deep-seated factors causing changes in the macroscopic mechanical properties of the soil [7]. Skvortsova et al. [9] believe that under the influence of the external environment, soil structure is complex and variable, and the geometric shape of pores can serve as an important indicator of the state of soil structure. Zhang Xianwei et al. [6,10] analyzed the microscopic pore characteristics of Zhanjiang clay and the controlling factors of pore development using scanning electron microscopy, mercury intrusion porosimetry, and nitrogen adsorption methods, establishing the interrelations and sensitivities between microstructure and physical indices as well as mechanical behavior. Based on grayscale computation of the soil’s three-dimensional porosity, they analyzed the patterns of microscopic pore changes during compression. They conducted mercury intrusion experiments on undisturbed and compressed soil samples to analyze the pore distribution, pore size, and pore structure characteristic parameters under different consolidation pressures, supplemented by SEM images for qualitative analysis of pore morphology, and interpreted and verified these findings from the perspective of fractal theory. Griffiths et al. [11] studied the pore size distribution of different types of clays at various stages of consolidation. Lapierre et al. [12] derived mathematical expressions for pore distribution and permeability coefficients of undisturbed and remolded soils under different consolidation pressures based on MIP tests. Garcia-Bengochea et al. [13] observed a bimodal pore structure in compacted silt clays through mercury intrusion tests. Tan Yunzhi et al. [14] used a mercury intrusion porosimeter to study the evolution of pore size distribution in red clay during compaction and found that large pores significantly reduced while small pores were essentially unaffected. The disturbance in clays is reflected in Material Constitutive modeling into which uncertainty quantification and machine learning algorithms have been incorporated [15,16].
The aforementioned studies indicate that pores are the intrinsic cause of soil deformation and the primary influencing factor on the physical and mechanical properties of soils. They also provide a methodological reference for the research on the microscopic pore characteristics of Zhanjiang Formation structural clay based on disturbance damage presented in this study. Due to the multiphase nature and heterogeneity of soil [17], employing fractal theory to quantitatively depict soil structure and develop a fractal model can significantly enhance our comprehension of processes occurring within the soil structure. Consequently, fractal theory has emerged as a prominent topic in examining the microstructure of soil porous media. Brakensiek et al. [18] successfully utilized fractal methods to characterize soil pores, while Anderson et al. [19] applied fractal theory to investigate soil pores distribution characteristics. Further research by Zhang Jiru et al. [20] revealed that microscopic pores in soft clay exhibit pronounced fractal characteristics during consolidation, and Xu Yong et al. [21] confirmed the fractal nature of pores in saturated soft clay. These studies collectively underscore that soil pores exhibit fractal features. Various fractal models have been proposed to describe soil microstructure, including the Korcak island model [22], the Sierpinski carpet model [23], and its subsequent enhancements [24]. These models typically represent soil microscopic pores as a two-dimensional distribution. However, in reality, the adjustment of soil pore structure occurs adaptively in a three-dimensional space, and the distribution of pores within this space can be regarded as a dispersed system where pores are randomly distributed throughout the internal space of the soil. Thus, selecting an appropriate fractal model to accurately represent the characteristics of soil microscopic pores remains a challenging endeavor. The Menger sponge model [25], derived from the two-dimensional Sierpinski carpet fractal model, offers a fractal concept uniquely suited for illustrating the three-dimensional spatial structure of soil’s porous system.
In summary, to investigate the microscopic pore characteristics and mechanisms of disturbance damage in Zhanjiang Formation structural clay, unconfined compressive strength tests, scanning electron microscopy (SEM), and X-ray diffraction (XRD) tests were conducted on undisturbed samples and those subjected to various disturbance conditions. Using Arc Geographic Information System (ArcGIS), the three-dimensional visualization images of SEM microstructure were reconstructed to quantitatively analyze the evolution pattern of microscopic pores. Furthermore, a correlation analysis was performed to explore the relationship between unconfined compressive strength and microscopic pore characteristics. Drawing on Menger sponge fractal theory and the pore parameters obtained from the three-dimensional visualization images of SEM microstructure, the relationship between the macroscopic mechanical properties of Zhanjiang Formation structural clay and its pore fractal characteristics was elucidated. This analysis sheds light on the mechanisms of microstructural disturbance damage. The findings of this research will contribute to the understanding of the intrinsic microscopic mechanisms underlying the macroscopic mechanical behavior of Zhanjiang Formation structural clay, and provide valuable references for the evaluation of unconfined compressive strength in geotechnical engineering.
2. Test Materials and Test Scheme
2.1. Test Materials
The soil samples were collected from the Baosteel Zhanjiang Steel Industrial Park, located on Donghai Island, Zhanjiang City, China. The extracted undisturbed soil samples were shaped into cylindrical columns with a diameter of 100 mm and a height of 200 mm. The undisturbed soil samples were placed in soil sampling boxes, wax-sealed, wrapped with sealing tape, and further protected with cling film. In accordance with the “Standard for Geotechnical Test Method” (GB/T5012-2019) of China [26], various basic physical properties of the undisturbed Zhanjiang Formation structural clay were measured through laboratory geotechnical tests, as detailed in Table 1.

Table 1.
Basic physical properties of Zhanjiang Formation structural clay [27].
2.2. Vibration Disturbance Test
Test soil samples were prepared using an electric frequency-modulated vibration table provided by Hebei Tengfei Test Instrument Co., Ltd., Shijiazhuang, China. Based on preliminary research by the project team, vertical vibrations were set to an amplitude of 0.6 mm. According to the “Standard for allowable vibration of building engineering” (GB/50868-2013) of China [28], when employing hammering and vibrating methods for pile driving and vibroflotation for foundation treatment, the allowable vibration frequency at the foundation site must not exceed 100 Hz. Since construction is often prolonged and construction vibration is continuous, to preliminarily explore the effects of different vibration frequencies and vibration durations on soil, three fixed vibration frequencies of 20 Hz, 35 Hz, and 50 Hz within the range of 0–100 Hz were set, along with four vibration durations of 30, 60, 90, and 120 min. A total of 12 sets of different working condition experiments were conducted, with 2 samples prepared for each set (including one backup sample). Soil samples were placed in a triaxial cell saturator affixed to the vibration table to undergo vibration, resulting in disturbance samples at various vibration frequencies and vibration durations.
2.3. Unconfined Compressive Strength Test
The instrument used in this test was a universal testing machine. The prepared disturbed soil samples were placed in the universal testing machine, and an unconfined compressive strength test was conducted at a loading rate of 1 mm/min. In the 12 experiment sets conducted, each set used one sample test value as the experimental result (if the sample test value showed an irregular pattern, the result from the backup sample was used instead). The unconfined compressive strength values listed in Table 2 correspond to the maximum deviatoric stress at the peak of the stress–strain curve. The test results are shown in Table 2.

Table 2.
Unconfined compressive strength of disturbed samples [27].
2.4. Scanning Electron Microscope (SEM) Test
This test utilized the KYKY-EM6200 [27] scanning electron microscope to conduct tests on both the undisturbed samples and samples under various disturbance conditions. The objective was to observe the particle morphology, arrangement patterns, porosity, and contact modes of soil particles, thereby providing a qualitative and quantitative description of the structural changes in the soil.
2.5. X-Ray Diffraction (XRD) Test
The experiment used an X’Pert PRO X-ray diffractometer. Based on the principles of X-ray diffraction and the layered structural characteristics of clay minerals, the interplanar spacing can be calculated using Bragg’s law based on the diffraction peak values. This allows for the identification of mineral types and the quantitative estimation of the percentage content of various clay minerals in the sample.
3. Correlation Analysis Between Macroscopic Mechanics and Microscopic Pore Characteristics
3.1. Analysis of Unconfined Compression Strength Test Results
Unconfined compressive strength tests were performed on the samples to determine the stress–strain relationships of Zhanjiang Formation structural clay at various disturbance degrees, as depicted in Figure 1. Figure 1 illustrates that the stress–strain curve for Zhanjiang Formation structural clay displays a strain-softening behavior, characterized by a peak. This peak corresponds to the maximum deviatoric stress, representing the unconfined compressive strength. The unconfined compressive strength of the undisturbed soil sample is 241.94 kPa. The peak and mechanical behavior suggest that the unconfined compressive strength of Zhanjiang Formation structural clay decreases with increased vibration duration and vibration frequency. This trend demonstrates that the peak strength and mechanical properties of the soil are influenced by alterations in vibration parameters. Notably, extended periods of vibration and elevated frequencies lead to a more significant reduction in the soil’s mechanical properties and a lower peak strength. Results of the unconfined compressive strength tests for disturbed samples are presented in Table 2.
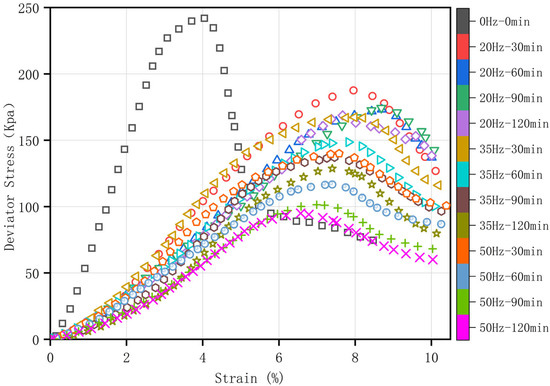
Figure 1.
Stress–strain relationship curves under different disturbance degrees.
The degree of alteration in soil properties resulting from external factors is termed the disturbance degree [29]. Disturbance degree () is quantified by the reduction in unconfined compressive strength [30], with the following formula:
In the formula, is the disturbance degree defined by the strength characteristics of the soil, is the unconfined compressive strength of the undisturbed soil, and is the unconfined compressive strength of the disturbed soil. The closer the value is to 1, the greater the disturbance degree of the soil sample.
The results of the unconfined compressive strength test were combined, and the disturbance degree () under various working conditions was calculated using Formula (1), as presented in Table 3.

Table 3.
Disturbance degree () [27].
3.2. Porosity Analysis of Three-Dimensional Images Based on SEM
This study utilizes the three-dimensional visualization methods and analysis modules of ArcGIS to process and analyze the SEM microstructural images of soil samples ( = 0.29), as shown in Figure 2. The reconstructed three-dimensional visualization images of the microstructure are displayed in Figure 3.
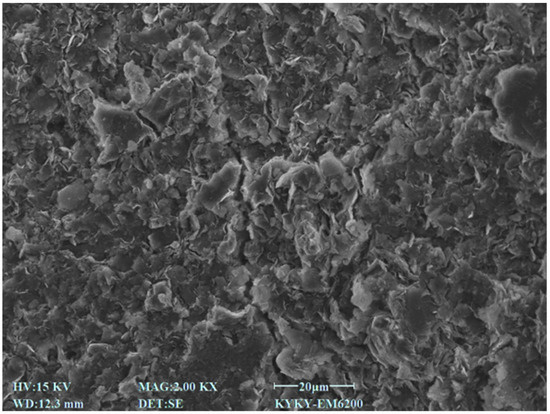
Figure 2.
SEM image of structural clay ( = 0.29).
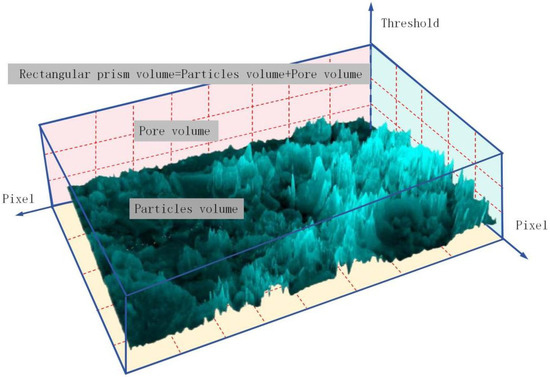
Figure 3.
Three-dimensional porosity calculation model of structural clay ( = 0.29).
Owing to the overlapping and adhesive characteristics of soil particles, the maximum set height for these particles was capped at 255. A height threshold range of 0–255 was established, where any value above 1 indicates the height of soil particles. In SEM images, particles closer to the light source exhibit higher pixel grayscale values, appearing brighter, whereas those further away appear darker. In three-dimensional space, it is possible to conceptualize a rectangular prism derived from a two-dimensional image by using the maximum grayscale value to define its height. Within this prism, each pixel is represented as a distinct volume, with its area forming the base and its grayscale value determining the height. The aggregate of these individual pixel volumes constitutes the total volume of the particles, while the unoccupied volume within the prism represents the total pore volume [31,32]. Utilizing this methodology, the volumes of both particles and pores are determined. The porosity results derived from the three-dimensional model are presented in Table 4.

Table 4.
Porosity values calculated based on the three-dimensional model.
Table 4 illustrates that disturbances lead to an increase in the number of pores and porosity in the sample. Specifically, at a relative disturbance degree () value of 0.22, porosity escalates by 0.78% to 66.94%. At an value of 0.61, the increase is more pronounced, with porosity rising by 13.35% to 79.51%. The data show a consistent trend of increasing porosity with elevated disturbance degree. Furthermore, based on Table 4, a linear regression analysis of as a function of porosity (m) reveals a strong correlation (), as shown in Figure 4. The derived linear relationship is as follows:
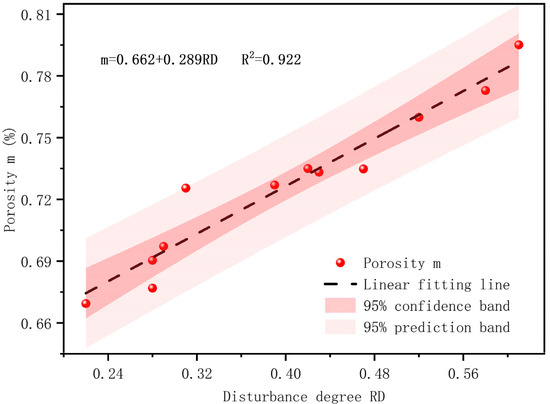
Figure 4.
Relationship between porosity and disturbance degree.
Figure 4 clearly shows that the porosity in the disturbed samples increases linearly as the disturbance degree intensifies. This trend can be attributed to the flocculated structure of the clay, characterized by larger pores that are highly sensitive to disturbances.
3.3. Correlation Analysis Between Unconfined Compressive Strength and Microscopic Porosity
To assess the strength and direction of the correlation between porosity and unconfined compressive strength, and to further validate the reliability of using porosity as an indicator for evaluating the engineering properties of soil, it is necessary to establish a direct univariate function prediction model between porosity and unconfined compressive strength. This will allow for a more accurate prediction of unconfined compressive strength and serve engineering applications. Therefore, an analysis of the correlation between microscopic porosity and unconfined compressive strength has been conducted.
In our work, the data analysis software SPSS 24.0 (Statistical Product and Service Solutions) was utilized to analyze the correlation between the unconfined compressive strength and the microscopic porosity of 12 soil samples under different disturbance degrees. The means and standard deviations presented in Table 5 are the results of the SPSS software analysis, which describe the statistical measures that characterize the distribution of the experimental data. During the correlation analysis with SPSS, the overall characteristics of all variables were mainly reflected through the mean values of various samples, indicating the central tendency of the experimental data. At the same time, comparisons were made between different groups or cross-groups. In comparative analysis, the differences in mean values between different groups quantified the degree of difference between them, thereby facilitating the analysis of correlations. From Table 5, there is a significant correlation between the unconfined compressive strength of the soil sample and its porosity, as indicated by a p-value less than 0.001 and a correlation coefficient of −0.963, demonstrating a strong negative linear correlation. Consequently, a linear regression analysis was conducted to assess the correlation relationship between microscopic porosity and unconfined compressive strength, using unconfined compressive strength as the dependent variable and porosity as the independent variable [33].

Table 5.
Correlation between porosity and unconfined compressive strength.
Through regression analysis, the following regression model was obtained.
The regression equation′s goodness of fit, with an of 0.927, indicates a well-fitted model. Comparison of the regression curve values with the experimental data, as illustrated in Figure 5, reveals that the test data closely align with the fitted values, suggesting a high correlation between the fitted values and test values, and suggesting that the regression model is relatively reliable. Therefore, in actual engineering practice, on-site sampling followed by SEM analysis can be performed. Subsequently, based on the regression model between the microscopic porosity and the unconfined compressive strength of soil, the unconfined compressive strength from porosity data can be rapidly estimated, facilitating the assessment engineering properties of the soil.
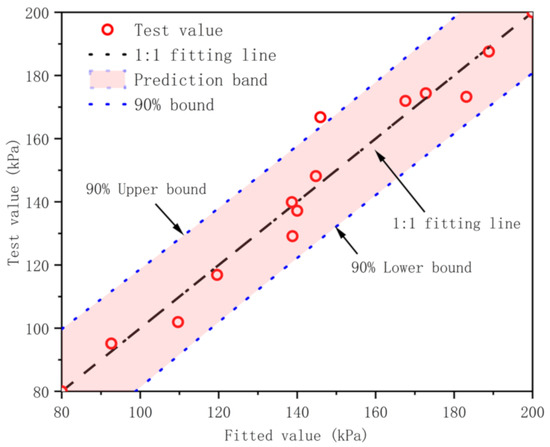
Figure 5.
Relationship between the fitted value and the test value of the unconfined compressive strength.
Correlation and regression analyses suggest that the unconfined compressive strength of Zhanjiang Formation structural clay is influenced by porosity, with higher porosity correlating with lower strength. This indicates that the unconfined compressive strength of soil is affected by its internal pore structure. Vibrational disturbances lead to an increase in pores within the sample, which enlarges the distance between soil particles, reduces the bonding force, and renders the soil more susceptible to damage. Consequently, the unconfined compressive strength of soil decreases continuously as the disturbance degree increases. In undisturbed samples with lower porosity, greater friction and stronger bonding force between soil particles result in a higher unconfined compressive strength. It is evident that variations in the unconfined compressive strength of soil originate from changes in its microscopic pore structure. Changes in the soil’s internal structure, induced by vibrational disturbances, lead to variations in its unconfined compressive strength. Therefore, the deformation of soil can be directly or indirectly reflected through the changes in the soil’s pores [34]. To further enhance the understanding of the disturbance damage process in Zhanjiang Formation structural clay, research can be conducted from the perspective of fractal theory based on microscopic porosity.
4. Fractal Study on Microscopic Pore Structure of Zhanjiang Formation Structural Clay
4.1. Menger Sponge Model
The Menger sponge model is derived from the two-dimensional Sierpiński carpet fractal model (Figure 6). The construction starts with a solid cube with an edge length of b, which is divided into n3 equal smaller cubes with an edge length of b/n. Then, according to a set pattern, a number of small cubes are removed, leaving behind n3 − a small cubes to form the first iteration (n = 1). For each of the n3 − a small cubes in the first iteration, the same process is applied: they are further divided into n3 smaller cubes with an edge length of b/n2. At this stage, there are (n3 − a)2 small cubes remaining, which form the second iteration (n = 2). Similarly, after the k-th iteration, the remaining small cubes have an edge length of b/nk and there are (n3 − a)k of them. This procedure is iterated to generate the Menger sponge model, as depicted in Figure 7.
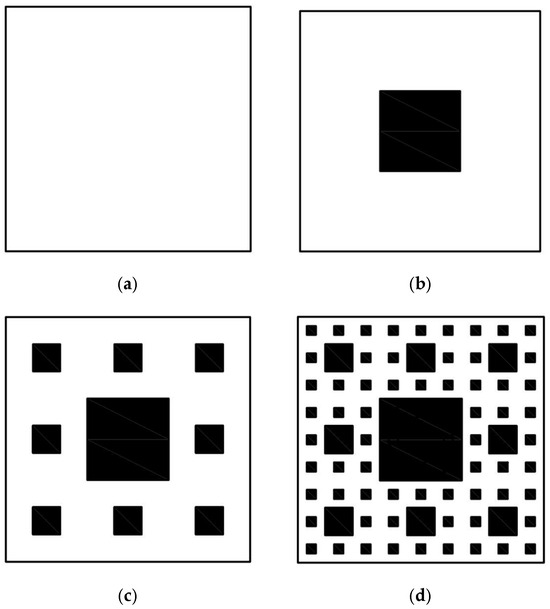
Figure 6.
Sierpiński carpet fractal model [35,36]: (a) n = 0; (b) n = 1; (c) n = 2; (d) n = 3.
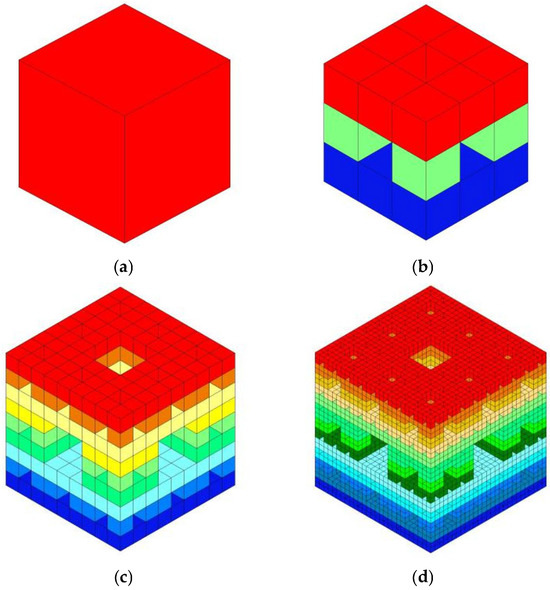
Figure 7.
Menger sponge mode: (a) n = 0; (b) n = 1; (c) n = 2; (d) n = 3.
In the Menger sponge model, let the edge length of the initial cube be b0 = 1, and its volume V0 = 1. At the first iteration, n = 1, b1 = 1/3, the cube is divided into nine squares on each face, which splits the cube into 27 smaller cubes, similar to a Rubik’s cube. The small cube at the center of the larger cube and the six adjacent small cubes connected to it are removed. The remaining volume of the 20 small cubes is V1 = 20 × (1/3)3 = 20/27. At the second iteration, n = 2, b2 = (1/3)2, and the remaining volume of the 400 small cubes is V2 = 202 × (1/3)6 = 400/729. At the n-th iteration, n = i, b = (1/3)i, the volume of the remaining 20i small cubes is Vi = 20i × [(1/3)i]3. The volume of the Menger sponge model is thus determined by this iterative process, which is given by Equation (4).
In conjunction with Hausdorff’s concept of “fractional dimension [37,38]”, when b approaches 0, the measure corresponding to the Hausdorff dimension tends towards a finite value, which is Equation (5).
where is the Hausdorff dimension.
By combining Equations (4) and (5), Equation (6) can be derived.
In the equation, C represents a constant, while D denotes the fractal dimension.
Therefore, the porosity corresponding to pores can be expressed as (7).
Let , then Equation (7) can be derived to yield Equation (8).
When , the porosity ; hence, . Therefore, Equation (9) is obtained.
When observed at the scale of bi, only particles with diameters greater than or equal to bi can be detected, and the volume should be the total volume minus the corresponding pore volume:
Substituting (9) into (10) yields Equation (11).
Equation (11) can be rephrased as Equation (12).
Taking the logarithm on both sides yields Equation (13).
In the formula, Vi(≥b) represents the total pore volume with pores greater than or equal to b, Va represents the total pore volume within the measurement range, b represents the observation scale (pore diameter), b0 represents the scale of the observation range, and D is the fractal dimension of the pore volume.
4.2. Menger Fractal Analysis of Microscopic Pore Structure in Zhanjiang Formation Structural Clay
Data on pore distribution were collected from the three-dimensional visualization images of the microstructure reconstructed with ArcGIS, based on SEM images. To facilitate comparison, study areas of soil samples (70 × 70 × 70 µm3) from both undisturbed and disturbed states were segmented into 13 pore size levels based on the range of measured pore diameters. The fractal dimension of the microscopic pore structure volume was calculated using Equation (13). The slope k of the linear fit, with as the abscissa and as the ordinate, was used to calculate the fractal dimension (D = 3 − K), as illustrated in Figure 8. The results of the calculations are presented in Table 6.
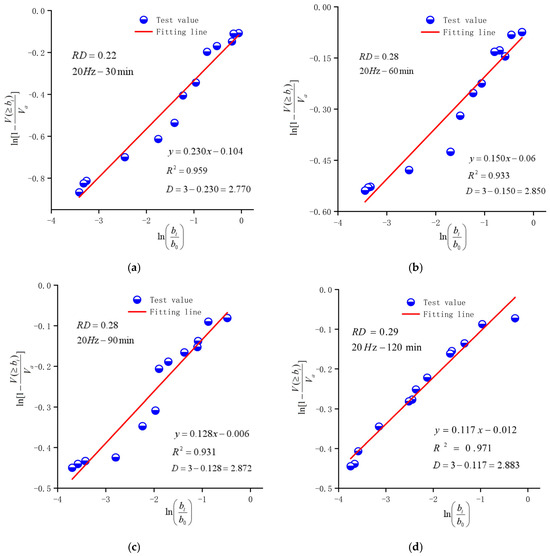
Figure 8.
Fractal dimension of volume distribution of microscopic pores at a vibration frequency of 20 Hz: (a) (20 Hz–30 min); (b) (20 Hz–60 min); (c) (20 Hz–90 min); (d) (20 Hz–120 min).

Table 6.
Calculation results of fractal dimension of volume distribution of microscopic pores under different working conditions.
Figure 8 indicates that the fractal dimensions of the pore structure volume range from 2.753 to 2.936, with R2 values consistently above 0.9. According to fractal theory, the fractal dimension derived from three-dimensional SEM images should lie between 2 and 3. Consequently, the results calculated and presented in Table 6, which are derived from Figure 8, comply with established fractal principles. This demonstrates that the microscopic pore structure of the Zhanjiang Formation structural clay, as reconstructed using ArcGIS under various disturbance conditions, exhibits pronounced Menger fractal characteristics. Generally, a larger pore fractal dimension indicates a more complex pore system and a more intricate spatial distribution of pores. The red line in Figure 9 represents the fitting trend line of the fractal dimension (D) as a function of the disturbance degree. Due to the significant abrupt change at the data point where D = 2.884, to better reflect the trend of change, this data point was used as a demarcation point for fitting two different types of functions. Figure 9 reveals a positive correlation between the pore fractal dimension and the disturbance degree; with increasing disturbance degree, the fractal dimension rises, suggesting a trend towards greater pore structure complexity. The pore fractal dimension is closely associated with both the pore structure and complexity of the Zhanjiang Formation structural clay, rendering it a crucial parameter for quantitatively evaluating the structural clay’s pore structure characteristics. Therefore, based on the three-dimensional Menger sponge model, the complexity of the pore structure of the engineering soil can be evaluated by the pore fractal dimension.
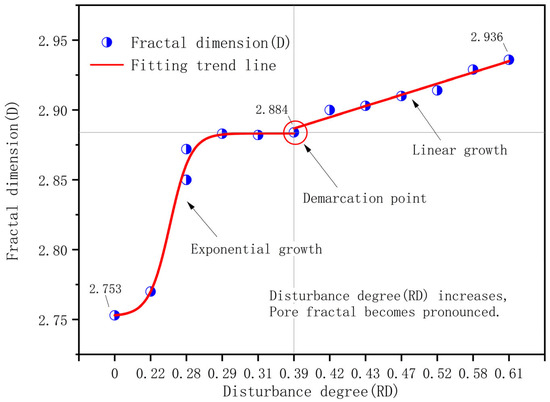
Figure 9.
Correlation between disturbance degree and fractal dimension.
5. Microscopic Damage Mechanism of Structural Clay
The engineering properties of soil are ultimately determined by its composition and structure. Therefore, the microscopic mechanisms of damage can be analyzed through the composition and microstructure of the soil.
5.1. Mineral Composition Influence
The mineral composition of the experimental soil was analyzed using X-ray diffraction. As shown in Figure 10, for Zhanjiang Formation structural clay, the primary minerals are mainly quartz and anorthite, accounting for 50.4% of the content. Since primary minerals are the products of the physical weathering of rocks, their main characteristics include relatively large particle size, stable or relatively stable physical and chemical properties, strong water resistance, and weathering resistance, with weak or relatively weak hydrophilicity. Secondary clay minerals are mainly kaolinite and illite, with a clay mineral content of 49.6%, which are the main components of clay particles and the primary factors affecting the engineering geological properties of the soil. Different clay minerals have different lattice structures, which in turn affect the properties of the soil differently [39]. It is evident that the influence of primary minerals on the engineering geological properties of the soil is much less than that of secondary clay minerals. Additionally, the presence of 1.75% organic matter affects the soil, giving it a gel-like appearance and increasing the porosity of the Zhanjiang Formation structural clay and the degree of cementation between soil particles, thereby altering the structure of the soil.
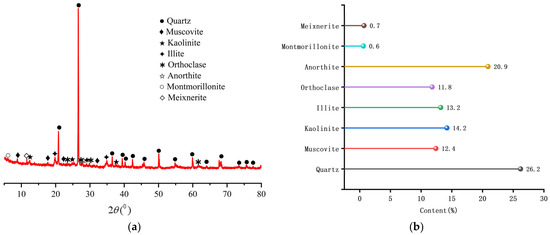
Figure 10.
X-ray mineral diffraction analysis of test soil: (a) spectrum; (b) content.
5.2. Microstructure Influence
Zhanjiang undisturbed clay comprises numerous aggregates of clay minerals, primarily consisting of scroll-like kaolinite and flaky illite. These aggregates often coexist with pyrite oolites, forming the fundamental structural units of Zhanjiang Formation structural clay [6], as depicted in Figure 11a. Moreover, being situated at the southernmost tip of mainland China and surrounded by the sea on three sides, the soil particles in this region adsorb a substantial amount of cations. This adsorption balances the surface negative charge, allowing the particles to approach each other, thereby reducing repulsion and enhancing attraction, as illustrated in Figure 11b. Consequently, the particles arrange themselves in angles, edge–face, or edge–edge overlaps, predominantly appearing in single or grouped flake forms, as shown in Figure 11c. The primary structural elements of this open-flocculated structure are suspended, characterized by fewer contact points, developed pores, and larger pore sizes, resulting in a very loose framework [40], hence being highly sensitive to vibrational disturbances. Due to the multiphase nature and heterogeneity of the soil, there is an automatic adjustment process that transitions from a relatively intact state to a fully adjusted state after disturbance, as depicted in Figure 11d. Throughout this process, soil particles undergo continuous rearrangement, leading to dynamic alterations in the pore structure, which becomes increasingly intricate over time.
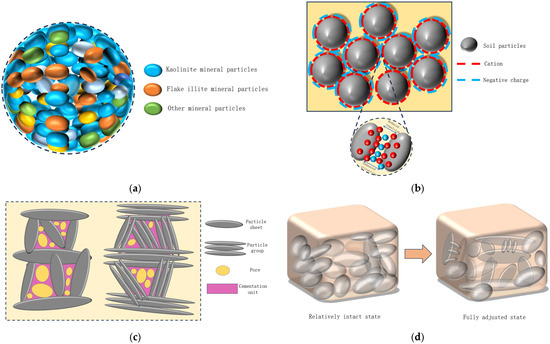
Figure 11.
Soil particle structure of Zhanjiang Formation structural clay: (a) fundamental structural units; (b) soil particle surface interactions; (c) flocculation structure; (d) adjustment of soil particle structure.
Comparative analysis of the SEM images (Figure 12) of the disturbed samples reveals that the pore structure of Zhanjiang Formation structural clay primarily consists of aggregate pores (predominantly microscopic pores) and interparticle pores (pores between soil particles), whereas the undisturbed soil is mainly composed of flocculated aggregates with a few aggregate pores and interparticle pores. Vibrational disturbances lead to the destruction of these aggregates, with aggregate pores gradually transforming into interparticle pores. The contact relationships between clay particle units gradually shift to a stable and sub-stable state of point–face, edge–face, and face–face embedding. Furthermore, as the disturbance degree continues to increase, granular debris particles begin to appear on the surface of the clay matrix. With the proliferation of these particles, the pore structure becomes increasingly complex, and the interparticle pores continue to enlarge. Simultaneously, the cementation bonds between particles progressively weaken, resulting in continuous structural damage and degradation of the unconfined compressive strength.
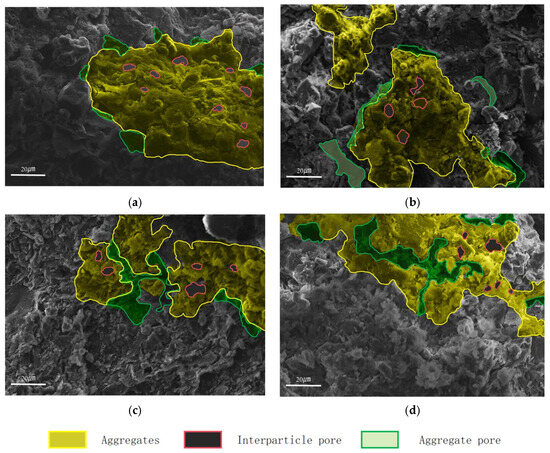
Figure 12.
SEM images of the sample before and after disturbance: (a) ; (b) ; (c) ; (d) .
6. Conclusions
In this study, unconfined compressive strength tests and scanning electron microscopy (SEM) tests were conducted on Zhanjiang Formation structural clay under various disturbance conditions, along with X-ray diffraction (XRD) analysis. Based on these investigations, the macroscopic mechanical properties and disturbance damage mechanisms were analyzed. The innovation of this paper is twofold: firstly, based on ArcGIS to reconstruct three-dimensional visual images of the microstructure to obtain the microscopic porosity of Zhanjiang Formation structural clay, we discussed the correlation between porosity and unconfined compressive strength and established a regression model between porosity and unconfined compressive strength. Secondly, the three-dimensional Menger sponge model was used to characterize the three-dimensional pore structure of Zhanjiang Formation structural clay with a complex porous system, and it was verified that the microscopic pore structure of Zhanjiang Formation structural clay demonstrates pronounced Menger fractal characteristics. The specific conclusions are as follows:
- The porosity of the reconstructed three-dimensional visualization images of the microstructure based on ArcGIS progressively increases with the disturbance degree. Additionally, the flocculated structure of undisturbed structural clay features larger pores and is somewhat sensitive to disturbance. As a result, porosity exhibits a linear increase corresponding to the escalating disturbance degree. The porosity exhibited an increase, whereas the unconfined compressive strength demonstrated a decrease. Notably, the rate of decrease in unconfined compressive strength was 7.657 times greater than the rate of increase in porosity. This indicates that the influence of vibration disturbance on the unconfined compressive strength of the soil is more pronounced than on its microscopic pore structure. Based on a combined correlation and regression analysis of macroscopic mechanical properties and microscopic porosity, a regression model that relates the microscopic porosity of Zhanjiang Formation structural clay to its unconfined compressive strength has been established. The findings reveal that the unconfined compressive strength of soil is significantly affected by its internal pore structure. Notably, there is a substantial negative linear relationship between the unconfined compressive strength and porosity of the soil. This suggests that porosity can act as a reliable microstructural indicator to predict the variability in the unconfined compressive strength of the soil following disturbance.
- The microscopic pore structure of Zhanjiang Formation structural clay demonstrates pronounced Menger fractal characteristics. There is a positive correlation between the fractal dimension of the pores and the disturbance degree. This fractal dimension effectively can characterize the pore structure and its complexity, thus representing an essential parameter for quantitatively assessing the pore structure characteristics of Zhanjiang Formation structural clay.
- The engineering properties of Zhanjiang Formation structural clay were influenced by both its mineral composition and microstructural alterations. Specifically, modifications in the structure of secondary clay minerals were the primary determinants of changes in the soil structure. After vibrational disturbances, the structure of the secondary clay minerals adjusts from a relatively intact state to a fully adjusted state, and the interparticle pores continue to enlarge, making the pore structure more complex. Concurrently, the cementation bonds between particles become progressively weaker, exacerbating structural damage. This process culminates in a steady degradation in the unconfined compressive strength.
Limitations of this study: Due to the inevitable nature of construction vibrations, the vibration frequencies set in this study are mainly based on the allowable ranges specified by the standard. While they are somewhat representative, they may not precisely reflect the vibrations encountered in real construction scenarios. To improve the relevance and applicability of the research findings to practical engineering situations, future studies should incorporate data derived from actual construction vibration monitoring.
Author Contributions
Writing—original draft, writing—review and editing, methodology, Y.X.; Writing—review and editing, supervision, B.T.; Data curation, S.L.; Software, J.X.; Writing—original draft, B.Z. All authors have read and agreed to the published version of the manuscript.
Funding
This research was funded by the Guangxi Natural Science Foundation, China (Grant No. 2024GXNSFAA010450).
Institutional Review Board Statement
Not applicable.
Informed Consent Statement
Not applicable.
Data Availability Statement
Data are contained within the article.
Conflicts of Interest
The authors declare that they have no known competing financial interests or personal relationships that could have appeared to influence the work reported in this paper.
References
- Tang, B.; Zhou, B.; Xie, L.; Yin, J.; Zhao, S.; Wang, Z. Strength Recovery Model of Clay during Thixotropy. Adv. Civ. Eng. 2021, 2021, 8825107. [Google Scholar] [CrossRef]
- Tang, B.; Zhou, B.; Xie, L.; Yin, J. Evaluation Method for Thixotropy of Clay Subjected to Unconfined Compressive Test. Front. Earth Sci. 2021, 9, 683454. [Google Scholar] [CrossRef]
- Desai, C.S. A consistent finite element technique for work softening behavior. In Proceedings of the International Conference on Computational Methods in Nonlinear Mechanics, Austin, TX, USA, 23–25 September 1974. [Google Scholar]
- Meng, F.Y. Effects of Construction-Induced Disturbance on Post-Construction Settlements of Shield Tunnel and Ground in Soft Clavey Strata. Ph.D. Dissertation, Zhejiang University, Hangzhou, China, 2019. [Google Scholar]
- Zhang, Z.C.; Deng, Y.L.; Zheng, F.L.; Wang, J.C. Analysis on Sudden Sinking Behaviors of Massive Open Caisson in Deep-thick Soft Clay Area. J. Undergr. Space Eng. 2020, 16, 933–943. [Google Scholar]
- Zhang, X.W.; Kong, L.W.; Guo, A.G.; Tuo, Y.F. Evolution of Microscopic Pore of Structured Clay Incompression Process Based on SEM and MIP Test. J. Rock Mech. Eng. 2012, 31, 406–412. [Google Scholar]
- Zhang, J.R.; Zhu, J.; Huang, L.; Huang, W.J. IPP Image Technique Used for Quantitative Analysis of Soil Microstructure. J. Wuhan Univ. Technol. 2008, 30, 80–83. [Google Scholar]
- Li, Q.; Bao, S.S. The Computation of the Porosity of Saturated Clay Based on the Gray Scale of Soft Microstructure Graph. J. Chongqing Norm. Univ. (Nat. Sci. Ed.) 2003, 20, 30–31. [Google Scholar]
- Skvortsova, E.B.; Utkaeva, V.F. Soi pore space arrangement as a geometric indicator of sol strucure. Eurasian Soil Sci. 2008, 41, 1198–1204. [Google Scholar] [CrossRef]
- Zhang, X.W.; Kong, L.W. Research on variability characteristics of micropore of Zhanjiang clay under ambient temperature and pressure, normal atmospheric. J. Sci. Sin. (Technol.) 2014, 44, 189–200. [Google Scholar]
- Griffiths, F.J.; Joshi, R.C. Changes in pore size distribution due to consolidation of clays. Geotechnique 1989, 39, 159–167. [Google Scholar] [CrossRef]
- Lapierre, C.; Leroueil, S.; Locat, J. Mercury intrusion and permeability of Louiseville clay. Can. Geotech. J. 1990, 27, 761–773. [Google Scholar] [CrossRef]
- Garcia-Bengochea, I.; Lovell, C.W.; Altschaeffl, A.G. Pore distribution and permeability of silty clays. J. Geotech. Eng. Div. 1979, 105, 839–856. [Google Scholar] [CrossRef]
- Tan, Y.Z.; Yu, B.; Liu, X.L.; Wan, Z.; Wang, H.X. Pore size evolution of compacted laterite under desiccation shrinkage process effects. J. Rock Soil Mech. 2015, 36, 369–375. [Google Scholar] [CrossRef]
- Savvides, A.A.; Papadrakakis, M. A computational study on the uncertainty quantification of failure of clays with a modified Cam-Clay yield criterion. SN Appl. Sci. 2021, 3, 659. [Google Scholar] [CrossRef]
- Savvides, A.A.; Papadopoulos, L. A neural network approach for the reliability analysis on failure of shallow foundations on cohesive soils. Int. J. Geo-Eng. 2024, 15, 15. [Google Scholar] [CrossRef]
- Wang, Q.; Chen, J.P.; Wang, M. A preliminary study on collapsibility of loess-like soil in changcun. Jilin Geol. 1991, 10, 51–56. [Google Scholar]
- Brakensiek, D.L.; Rawls, W.J.; Logsdon, S.D.; Edwards, W.M. Fractal description of micro-porosity. Soil Sci. Soc. Am. J. 1992, 56, 1721–1723. [Google Scholar] [CrossRef]
- Anderson, A.N.; Mcbratney, A.B.; Fitzpatrick, E.A. Soil mass, surface, and spectral fractaldimensions estimated from thin section photographs. Soil Sci. Soc. Am. J. 1996, 60, 962–969. [Google Scholar] [CrossRef]
- Zhang, J.R.; Zhu, J.; Huang, L.; Xia, Y.F. Evolution of micro pore structure of soft clay and its fractal features under consolidation. J. Hydraul. Eng. 2008, 39, 394–400. [Google Scholar]
- Xu, Y.; Zhang, J.C.; Li, W.P. Research on microstructure fractal features of the saturation soft soil. J. Rock Soil Mech. 2007, 28, 49–52. [Google Scholar]
- Kaye, B.H. A random walk through fractal dimensions. VCH Verlagsgesellschaft: Weinheim, Germany, 1989. [Google Scholar]
- Tao, G.L.; Zhang, J.R.; Huang, L.; Yuan, L. New approachs to solve the fractal dimensions of rocks and soils. J. Huazhong Univ. Sci. Technol. (Nat. Sci. Ed.) 2010, 38, 103–106. [Google Scholar] [CrossRef]
- Yu, B.M.; Li, J.H. Some fractal characters of porous media. Fractals 2001, 9, 365–372. [Google Scholar] [CrossRef]
- Tao, G.L.; Zhang, J.R.; Huang, L.; Yuan, L. Description of Pore Property of Porous Materials Using Fractal Theory. J. Build. Mater. 2010, 13, 678–681. [Google Scholar]
- Ministry of Water Resources of the People’s Republic of China. Standard for Geotechnical Testing Method: GB/T50123-2019; China Planning Press: Beijing, China, 2019. [Google Scholar]
- Zhang, B.H.; Liu, S.Y.; Xie, Y.H.; Tang, B.; Han, W.C. Study on the mechanical properties and microscopic mechanism of structural clay of Zhanjiang Formation under the action of vibration disturbance. Water Resour. Hydropower Eng. 2024. Available online: http://kns.cnki.net/kcms/detail/10.1746.TV.20240128.1432.002.html (accessed on 3 November 2024).
- China Machinery Industry Federation. Standard for Allowable Vibration of Building Engineering: GB/50868-2013; China Planning Press: Beijing, China, 2013. [Google Scholar]
- Zhang, T.W.; Xu, H.B.; Deng, Y.F. A study of the correlation between the damage variable and disturbance degree of structural soft clay. Rock Soil Mech. 2015, 36, 958–964. [Google Scholar]
- Hvorslev, M.J. Subsurface Exploration and Sampling of Soils for Civil Engineering Purposes; American Society of Civil Engineers: New York, NY, USA, 1949. [Google Scholar]
- Wang, B.J.; Shi, B.; Liu, Z.B.; Cai, Y. Fractal study on microstructure of clayey soil by GIS. J. Geotech. Eng. 2004, 26, 244–247. [Google Scholar]
- Wang, B.J.; Shi, B.; Cai, Y.; Tang, C.S. 3D visualization and porosity computation of clay soil SEM image by GIS. J. Rock Soil Mech. 2008, 29, 251–255. [Google Scholar]
- Zhang, Y.W.; Han, C.P. Mechanical Properties and Microstructure of Dispersed Soils under Different Freeze-thaw Cycles. J. For. Eng. 2024, 40, 204–211. [Google Scholar]
- Wang, Q.; Wang, J.P. Research on Fractal Geometry of Soil Porosity. J. Geotech. Eng. 2000, 22, 496–498. [Google Scholar]
- Tao, G.L. Fractal Approach on Pore Structure of Rock and Soil Porous Media and Its Applications. Ph.D. Dissertation, Wuhan University, Wuhan, China, 2010. [Google Scholar]
- Huang, L. Quantitative Analysis of Micro-porosity of Saturated Soft Clay and Its Fractal Description. Master’s Thesis, Wuhan University of Technology, Wuhan, China, 2007. [Google Scholar]
- Mcmullen, C. The Hausdorff dimension of general Sierpiński carpets. Nagoya Math. J. 1984, 96, 1–9. [Google Scholar] [CrossRef]
- Chen, S.M.; Long, L.H.; Zhu, L.H. Hausdorff Dimension and Box Dimensionof a Kind of 3-dimensional Self-affine Sierpinski Carpets. Nat. Sci. J. Hainan Univ. 2012, 30, 199–202+205. [Google Scholar] [CrossRef]
- Kong, L.W.; Lv, H.B.; Wang, R.; Shan, H.G. Engineering properties and micro-mechanism of structural marine soilin Zhanjiang sea area. J. Hydraul. Eng. 2002, 47, 82–88. [Google Scholar]
- Tang, B.; Xie, L.; Wang, W.; Zhou, B.H.; Gong, Y.X. Unconfined compressive strength and pore structure evolution law of structural clay after disturbance. Front. Earth Sci. 2022, 10, 932621. [Google Scholar] [CrossRef]
Disclaimer/Publisher’s Note: The statements, opinions and data contained in all publications are solely those of the individual author(s) and contributor(s) and not of MDPI and/or the editor(s). MDPI and/or the editor(s) disclaim responsibility for any injury to people or property resulting from any ideas, methods, instructions or products referred to in the content. |
© 2024 by the authors. Licensee MDPI, Basel, Switzerland. This article is an open access article distributed under the terms and conditions of the Creative Commons Attribution (CC BY) license (https://creativecommons.org/licenses/by/4.0/).