Article

Adaptive Robust Control for Pump-Controlled Pitch Systems Facing Wind Speed and System Parameter Variability

1
School of Mechanical Engineering, Yanshan University, Qinhuangdao 066004, China
2
Mechanical and Electrical Engineering, Xinjiang Institute of Engineering, Urumqi 830023, China
3
Sichuan Chuanrun Intelligent Fluid Technology Co., Ltd., Chengdu 610000, China
4
College of Mechanical and Aerospace Engineering, Jilin University, Changchun 130025, China
5
Shougang Jingtang United Iron & Steel Co., Ltd., Tangshan 063000, China
*
Author to whom correspondence should be addressed.
Appl. Sci. 2024, 14(22), 10218; https://doi.org/10.3390/app142210218
Submission received: 11 September 2024 / Revised: 30 October 2024 / Accepted: 30 October 2024 / Published: 7 November 2024

Abstract

:
This paper proposes an Adaptive Robust Control (ARC) strategy for pump-controlled pitch systems in large wind turbines to address challenges in control accuracy and energy efficiency. First, a mathematical model integrating pitch angle dynamics and hydraulic characteristics is established, with pitch angle, pitch angular velocity, and hydraulic cylinder thrust as state variables. Then, an ARC strategy is designed using the backstepping method and incorporating parameter adaptation to handle system nonlinearities and uncertainties. The controller parameters are optimized using Particle Swarm Optimization (PSO) under wind disturbance conditions, and comparative analyses are conducted with traditional PID control. The numerical simulation results show that both controllers achieve similar tracking performance under nominal conditions, with PID achieving a 0.08° maximum error and ARC showing a 0.1° maximum error. However, the ARC strategy demonstrates superior robustness under parameter variations, maintaining tracking errors below 0.15°, while the PID error increases to 1.5°. Physical test bench experiments further validate these findings, with ARC showing significantly better performance during cylinder retraction with 0.1° error compared to PID’s 0.7° error. The proposed control strategy effectively handles both the inherent nonlinearities of the pump-controlled system and external disturbances, providing a practical solution for precise pitch control in large wind turbines while maintaining energy efficiency through the pump-controlled approach.

1. Introduction

In large wind turbine systems, stable control of power output cannot be achieved solely by the generator. This necessitates the use of efficient variable pitch control technologies. Variable pitch systems are mainly divided into three types: electric motor-driven, hydraulic cylinder-driven, and hydraulic motor-driven [1]. Among these, hydraulic cylinder variable pitch systems using servo valves for control have become increasingly sophisticated through prolonged research and development. Liu et al. systematically analyzed the evolution and advantages of hydraulic pitch systems [2]. Petrovic et al. investigated the impact of pitch control on wind turbine load reduction [3]. However, traditional hydraulic systems suffer from significant overflow losses and poor pollution resistance, as documented by Du, H. et al. [4].
To address these challenges, servo pump control systems have emerged as a promising alternative. These systems operate by coaxially connecting a servo motor to a fixed-displacement pump, which directly drives a hydraulic cylinder [5,6]. This configuration offers several distinct advantages. Yan, Guishan et al. demonstrated that controlling the flow rate through servo motor speed adjustment significantly reduces energy losses compared to valve-controlled systems [7]. Liu, H. et al. quantified these efficiency improvements through comprehensive experimental studies [8]. Karpenko, M. conducted an analysis of energy losses in hydraulic systems using CFD methods, further validating these findings [9].
The closed-loop design of servo pump control systems brings additional benefits. Hagen, D. et al. compared a novel self-contained electro-hydraulic cylinder with traditional valve-controlled actuators, demonstrating through experiments that the former saves 62% energy in a typical work cycle and exhibits excellent energy recovery capabilities [10]. Hati, S. K. et al. designed a variable-displacement bi-directional pump-controlled electrohydraulic system, improving the system’s energy efficiency by directly controlling the pump with a variable-speed motor and achieving significant energy savings in simulations [11]. Skorek, G. investigated energy losses in hydrostatic drives with hydraulic cylinders and proposed methods to reduce energy losses in proportional control systems, thereby enhancing the overall energy efficiency of the system [12]. Qu, S. Y. and Fassbender, D. et al. developed a high-efficiency electrohydraulic actuator with energy regeneration capabilities, with the experimental results showing that the system’s energy efficiency can reach up to 84.7% and recover up to 81.8% of the actuator’s energy during the auxiliary phase [13]. Bury, P. et al. optimized motor control strategies to reduce energy losses and avoid the use of expensive variable-displacement pumps, further enhancing the system’s energy efficiency [14]. These studies collectively demonstrate that pump-controlled systems can achieve both energy efficiency and reliable operation simultaneously.
However, implementing servo pump control in wind turbine pitch systems faces several significant challenges. Helian et al. observed that pump-controlled systems exhibit pronounced nonlinearities in pump flow mapping and mechanical dynamics, which they addressed using an adaptive compensation approach [15]. Wang, T. and Song, J. C. pointed out that an electro-hydraulic servo system involves complex interactions between valves and pumps, with nonlinearities and clearances that can reduce control accuracy and system stability. They proposed a clearance compensation method using a Hopfield neural network to address these nonlinear issues, enhancing system stability and accuracy by adjusting neural network parameters [16]. Additionally, Wang, W. B. et al. introduced a low-complexity error-surface prescribed performance control (ESPPC) for electro-hydraulic systems, addressing uncertainties and nonlinearity without the need for backstepping or complex approximators. Their experimental results confirmed that ESPPC can improve tracking performance and maintain system stability under variable conditions [17]. Zhao, W. and Ebbesen, M. K. et al. conducted a simulation study on a single-motor-one-pump (1M1P) controlled hydraulic cylinder, achieving passive load-holding functionality and system pressure control, which demonstrated system stability and strong load-holding performance in four-quadrant operation—offering an effective solution for practical applications of servo pump control [18]. Mohmmed, J. H. et al. proposed an uncertain displacement-controlled system model for hydraulic actuators, utilizing PID and H∞ controllers to verify system robustness under uncertain conditions, thereby significantly enhancing its performance in displacement control and disturbance rejection [19]. Cecchin, L. et al. developed a nonlinear Model Predictive Control (MPC) for variable-speed variable-displacement pumps, demonstrating substantial improvements in efficiency and flow tracking, which is meaningful for both energy efficiency and dynamic response [20]. Nguyen, M. H. et al. designed an extended sliding mode observer-based output feedback control scheme to address model uncertainties and external disturbances in the motion tracking of electro-hydrostatic actuators (EHAs), with the experimental results confirming its superiority in various operational scenarios [21].
Additionally, wind power generation faces inherent uncertainties, which further intensify these challenges. Elbeji, Omessaad et al. investigated pitch angle control in wind turbine conversion systems under high wind speeds, highlighting that effective pitch control is crucial for protecting wind turbines from excessive winds [22]. Kim, D. and Lee, D. proposed a hierarchical fault-tolerant control using Model Predictive Control (MPC) to address pitch actuator faults, offering resilience against faults and maintaining system stability under adverse offshore conditions [23]. Kamada, Y. et al. developed a cyclic pitch control approach for Horizontal-Axis Wind Turbines (HAWTs) based on real-time inflow observation, which increased the power output and reduced fluctuations by adapting the pitch angles to local wind conditions [24]. Salem, M. E. M. et al. applied neural network fitting in pitch angle control of small wind turbines, achieving reliable power output control in high wind speeds through a MATLAB Simulink-supported control system [25]. Sierra-Garcia, J. E. and Santos, M. explored neural networks and reinforcement learning techniques for complex pitch control scenarios, particularly for offshore turbines exposed to unpredictable currents and waves, showing their effectiveness in adapting to variable wind and sea conditions [26]. Xu, J. R. and Liu, Y. M. proposed an individual pitch control strategy to mitigate voltage flicker caused by wind turbine power fluctuations, significantly stabilizing the turbine’s power output [27]. Teferra, D. M. et al. developed a fuzzy logic-based pitch angle control for permanent magnet synchronous generator wind energy systems, demonstrating enhanced performance over traditional PI control, especially in high-wind conditions [28]. Wang, X. et al. introduced a single-blade pitch control based on SVM load estimation and LIDAR measurements, thereby reducing fatigue loads on wind turbines, which is essential for large-scale, high-power turbines [29]. Liu and Nie analyzed a variable-speed control strategy for direct-drive wind turbines using a variable gain pitch identification algorithm, effectively managing the generator speed during gusts to improve power generation stability and reduce turbine load [30]. These research advancements highlight the importance of robust pitch control strategies in addressing uncertainties and harsh environmental conditions in wind power systems, ensuring optimal energy output and extending system lifespan. However, there is currently limited research on high-performance control of electro-hydraulic servo pump-controlled pitch systems for wind turbines in complex environments.
To address the gap in high-performance control for electro-hydraulic servo pump-controlled pitch systems in wind turbines, this paper proposes an Adaptive Robust Control (ARC) strategy tailored to pump-controlled pitch systems to overcome these limitations. The main contributions include the development of an integrated mathematical model that captures both pitch angle dynamics and hydraulic characteristics; the design of an ARC strategy capable of handling both system nonlinearity and wind speed uncertainties; the proposal of a systematic parameter adjustment method to ensure control accuracy and robustness; and validation of the method’s effectiveness through numerical simulations and physical experiments. These contributions provide practical solutions to improve the control performance of pump-controlled pitch systems in large wind turbines, contributing to increased power generation efficiency and reduced maintenance demands.

2. Pitch System Principles and Modeling

The operational principle of a variable pitch system in wind turbines is depicted in Figure 1. The servo motor is aligned coaxially with the hydraulic pump, while the hydraulic cylinder is linked directly to the variable pitch mechanism. By adjusting the servo motor’s speed, the hydraulic pump regulates the flow and generates sufficient pressure to drive the hydraulic cylinder. This pressure must exceed the external load applied to the hydraulic cylinder, accounting for any additional pressure losses along the pump–actuator line. This ensures that the hydraulic cylinder can reach the desired position and perform the necessary pitch adjustment.
As depicted in the diagram, the components are labeled as follows: (1) motor, (2) fixed-displacement pump, (3) relief valve, (4) pilot-operated check valve, (5) solenoid directional valve, (6) throttle valve, (7) check valve and throttling valve, (8) accumulator, and (9) single-rod hydraulic cylinder. During pitch adjustment, solenoid valves 5.1, 5.2, and 5.3 are activated, while 5.4 remains closed. Accumulator 8.2 compensates for the asymmetrical flow between the two chambers of the single-rod hydraulic cylinder. In emergency situations, solenoid valve 5.4 is activated, and valves 5.1 and 5.2 are deactivated, allowing accumulator 8.1 to power the hydraulic cylinder for emergency feathering.
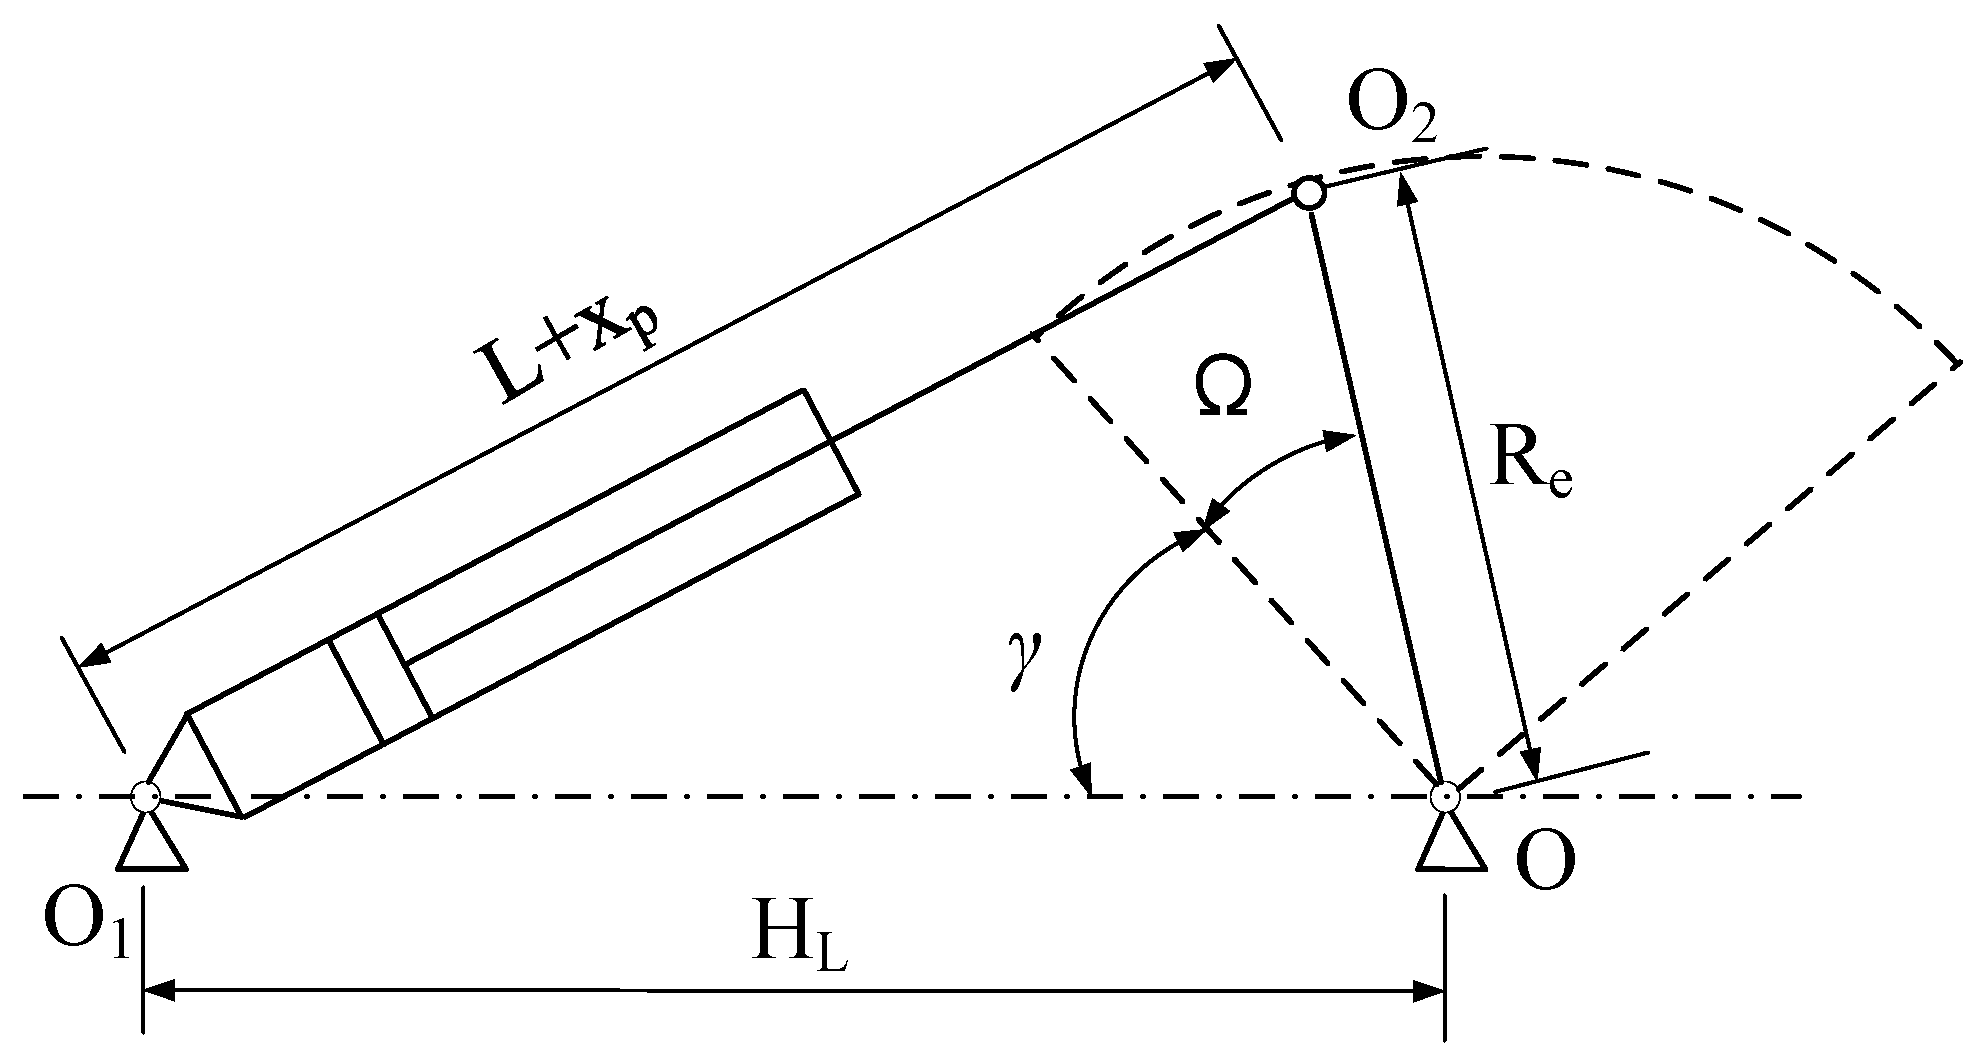
The hydraulic cylinder is connected to the hub via a hinge, with its piston linked to the blade base. Pitch variation is achieved by controlling the piston rod’s extension and retraction. A schematic of the variable pitch system mechanism is provided in Figure 2.
The minimum distance of the hydraulic cylinder, denoted as L, is 1500 mm. HL represents a fixed distance with a dimension of 1750 mm, and the rotational radius is 625 mm. The fixed angle γ is 56.633°. The paddle pitch angle Ω is adjusted according to the extension distance x p of the hydraulic cylinder.
The pitch angle is calculated as follows:
Ω = a r c c o s R e 2 + H L 2 L + x p 2 2 R e H L γ
The first-order derivative of Ω is
Ω ˙ = L + x p x ˙ p R e H L 1 R e 2 + H L 2 L + x p 2 2 R e H L 2
The second-order derivative of Ω is
Ω ¨ = L + x p x ¨ p + x ˙ p 2 R e H L 1 R e 2 + H L 2 L + x p 2 2 R e H L 2 4 L + x p 2 x ˙ p 2 R e 2 + H L 2 L + x p 2 R e 3 H L 3 4 R e 2 + H L 2 L + x p 2 2 R e 2 H L 2 3 2
In the variable pitch system, the servo motor speed serves as the input. Since the servo motor is coaxially connected to the dosing pump, its speed is equal to the dosing pump’s speed. Therefore, the dosing pump speed is also considered the system input. Several assumptions were made when modeling the system, such as liquid incompressibility, ignoring hose deformation, and eliminating pump pulsation effects.
The pump flow equation is as follows:
q 1 = D p ω p q 2 = D p ω p
where q 1 is the flow rate of the left chamber of the system, q 2 is the flow rate of the right chamber of the system, D p is the displacement for the pump, and ω p is the speed for the pump.
The dynamic equation for the pressure in the two chambers of the hydraulic cylinder is as follows:
P ˙ 1 = β e 1 V 01 + A 1 x p A 1 x ˙ p C t P L + Q 1
P ˙ 2 = β e 2 V 02 A 2 x p A 2 x ˙ p + C t P L Q 2
where P 1 and P 2 are the actuator two-chamber pressure; β e 1 and β e 2 denote the hydraulic oil modulus of elasticity of the actuator’s two chambers; V 01 and V 02 denote the initial moment volume in the hydraulic cylinder’s two chambers; A 1 and A 2 represent the effective piston area in the hydraulic cylinder’s two chambers; C t stands for the hydraulic cylinder leakage coefficient; Q 1 and Q 2 are the left and right cavities of the load flow rate. This paper takes β e 1 = β e 2 =   β e , Q 1 = Q 2 , and P L = P 1 P 2 .
The thrust of the piston is
F = A 1 P 1 A 2 P 2
and the following equation is derived:
F ˙ = A 1 P ˙ 1 A 2 P ˙ 2
This, in turn, gives the torque of the hydraulic cylinder acting on the paddle hub as
T = F   R e   s i n   α
The angle between the thrust force and the force arm is calculated using the following formula:
α = a r c c o s L + x p 2 + R e 2 H L 2 2 R e L + x p
Therefore, the derivative of the torque is as follows:
T ˙ = ( F R e s i n   α ) = ( F ˙ s i n   α + F c o s   α ) R e
Define the state variables of the system as x = x 1 , x 2 , x 3 T = Ω , Ω ˙ , T T ; define the time-varying parameters of the system as θ = θ 1 , θ 2 , θ 3 T = B , d , C t T , where B is the viscous damping coefficient, and d is the uncertain disturbance inside and outside the system, including the disturbance due to wind speed. The system nonlinear equation can be described as follows:
x ˙ 1 = x 2 J x ˙ 2 = x 3 θ 1 x 2 θ 2 x ˙ 3 = g 3 u f c θ 3 f u + f L
where J is the rotational inertia of the paddle; u is the input pump speed; and g 3 , f c , f u , a n d   f L are known functions and are defined as follows:
g 3 = A 1 V 1 + A 2 V 2 β e R e D p s i n   α
f c = A 1 2 V 1 + A 2 2 V 2 β e x ˙ p R e s i n   α
f u = A 1 V 1 + A 2 V 2 β e R e s i n   α P L
f L = ( A 1 P 1 A 2 P 2 ) R e c o s   α

3. Controller Design

To ensure that each order state follows the target values, the controller design is carried out using the backstepping method, which defines x 1 d , x 2 d , and x 3 d as the target values of the third-order state, and   e 1 , e 2 , a n d   e 3 as the errors of the third-order state. To address both internal and external disturbances, a parameter adaptation module is incorporated into the controller to estimate system parameters in real time and ensure system robustness. The controller structure is shown in Figure 3.
Step 1.
Define the error as follows:
e 1 = x 1 x 1 d
e 2 = e ˙ 1 + k 1 e 1 = x 2 x 2 d
where k 1 is the gain, and the following is derived:
x 2 d = x ˙ 1 d k 1 e 1
Design x 2 d such that x 1 tends to x 1 d , and define the Lyapunov function:
V 1 e 1 = 1 2 e 1 2
The derivative of V 1 e 1 is obtained by taking the derivative of Equation (17) and substituting the first equation of the system’s Equation of state (12):
V ˙ 1 e 1 = e 1 e ˙ 1 = e 1 x ˙ 1 x ˙ 1 d = e 1 x 2 x ˙ 1 d
For e 1 to converge to 0, we need V ˙ 1 e 1 to be negative definite so that V ˙ 1 e 1 = k 1 e 1 2 , and the following is derived:
x 2 x ˙ 1 d = k 1 e 1
x 2 = x ˙ 1 d k 1 e 1
Here, x 2 is x 2 d , then
x 2 d = x ˙ 1 d k 1 e 1
with the following derived:
V ˙ 1 e 1 = e 1 x 2 d + e 2 x ˙ 1 d = e 1 x ˙ 1 d k 1 e 1 + e 2 x ˙ 1 d = k 1 e 1 2 + e 1 e 2
To ensure that V ˙ 1 e 1 is negatively determined, it is necessary that e 2 tends to 0.
Step 2.
From the second equation of Equations (12) and (18), the following is derived:
J e ˙ 2 = J x ˙ 2 J x ˙ 2 d = x 3 θ 1 x 2 θ 2 J x ˙ 2 d
To ensure that e 2 tends to 0, define the Lyapunov function:
V 2 e 1 , e 2 = 1 2 k 1 2 e 1 2 + 1 2 J e 2 2
Then,
V ˙ 2 e 1 , e 2 = k 1 2 e 1 e ˙ 1 + J e 2 e ˙ 2
The following id derived from Equation (25):
V ˙ 2 e 1 , e 2 = k 1 2 e 1 e ˙ 1 + J e 2 e ˙ 2 = k 1 3 e 1 2 + k 1 2 e 1 e 2 + J e 2 e ˙ 2
The following is derived by bringing in Equation (26):
V ˙ 2 e 1 , e 2 = k 1 3 e 1 2 + k 1 2 e 1 e 2 + e 2 x 3 θ 1 x 2 θ 2 J x ˙ 2 d
By defining e 3 = x 3 x 3 d , θ ˜ = θ ˆ θ , where θ ˜ is the parameter error, and θ ˆ is the estimate of the parameter, Equation (30) can be written as follows:
V ˙ 2 e 1 , e 2 = k 1 3 e 1 2 + k 1 2 e 1 e 2 + e 2 e 3 + x 3 d θ 1 x 2 θ 2 J x ˙ 2 d
It is organized to obtain
V ˙ 2 e 1 , e 2 = k 1 3 e 1 2 + e 2 e 3 + x 3 d θ ˆ 1 x 2 θ ˆ 2 θ ˜ 1 x 2 θ ˜ 2 J x ˙ 2 d + k 1 2 e 1
By defining   x 3 d = J x ˙ 2 d + θ ˆ 1 x 2 + θ ˆ 2 k 2 e 2 , where k 2 is the gain factor, Equation (32) can be written as follows:
V ˙ 2 e 1 , e 2 = k 1 3 e 1 2 + e 2 e 3 + k 1 2 e 1 e 2 k 2 e 2 2 e 2 θ ˜ 1 x 2 θ ˜ 2
where k 1 3 e 1 2 + k 1 2 e 1 e 2 k 2 e 2 2 a is negative definite. If e 3 is 0 and the parameter error is 0, then V ˙ 2 e 1 , e 2 is negative definite, and, therefore, the next design goal is for e 3 to converge to 0.
Step 3.
To make e 3 converge to 0, define the Lyapunov function:
V 3 e 1 , e 2 , e 3 = V 2 e 1 , e 2 + 1 2 e 3 2
Then,
V ˙ 3 e 1 , e 2 , e 3 = V ˙ 2 e 1 , e 2 + e 3 e ˙ 3
Step 3:
Bring in e ˙ 3 , x ˙ 3 , and
V ˙ 3 e 1 , e 2 , e 3 = k 1 3 e 1 2 + e 2 e 3 + k 1 2 e 1 e 2 k 2 e 2 2 e 2 θ ˜ 1 x 2 θ ˜ 2 + e 3 g 3 u f c θ 3 f u + f L x ˙ 3 d
The equation is organized to obtain
V ˙ 3 e 1 , e 2 , e 3 = k 1 3 e 1 2 + e 2 e 3 + k 1 2 e 1 e 2 k 2 e 2 2 e 2 θ ˜ 1 x 2 θ ˜ 2 + e 3 g 3 u f c θ ˆ 3 f u + f L x ˙ 3 d + e 3 θ ˜ 3 f u
By defining g 3 u f c θ ˆ 3 f u + f L x ˙ 3 d = k 3 e 3 , where k 3 is the gain factor, the control rates are determined as follows:
u = 1 g 3 f c + θ ˆ 3 f u f L + x ˙ 3 d k 3 e 3
Equation (37) becomes
V ˙ 3 e 1 , e 2 , e 3 = k 1 3 e 1 2 + e 2 e 3 + k 1 2 e 1 e 2 k 2 e 2 2 e 2 θ ˜ 1 x 2 θ ˜ 2 k 3 e 3 2 + e 3 θ ˜ 3 f u
Equation (39) is negatively determined when the parameter error is 0. Therefore, the next goal is to make the parameter error 0.
Step 4.
Define
V 4 e 1 , e 2 , e 3 , θ ˜ = V 3 e 1 , e 2 , e 3 + 1 2 θ ˜ T Γ 1 θ ˜
Then,
V ˙ 4 e 1 , e 2 , e 3 , θ ˜ = k 1 3 e 1 2 + e 2 e 3 + k 1 2 e 1 e 2 k 2 e 2 2 e 2 θ ˜ 1 x 2 θ ˜ 2 k 3 e 3 2 + e 3 θ ˜ 3 f u + θ ˜ T Γ 1 θ ˆ ˙
By defining φ 2 T = x 2 , 1 , 0 , φ 3 T = 0 , 0 , f u , Equation (41) can be written as follows:
V ˙ 4 e 1 , e 2 , e 3 , θ ˜ = k 1 3 e 1 2 + e 2 e 3 + k 1 2 e 1 e 2 k 2 e 2 2 k 3 e 3 2 + θ ˜ T Γ 1 θ ˆ ˙ φ 2 e 2 φ 3 e 3
To ensure that V ˙ 4 e 1 , e 2 , e 3 , θ ˜ 0 , it can be shown that Γ 1 θ ˆ ˙ φ 2 e 2 φ 3 e 3 = 0 , the adaptive parameter estimation rate can be obtained as follows:
θ ˆ ˙ = Γ φ 2 e 2 + φ 3 e 3

4. Experimental Results and Analysis

4.1. Simulation Results and Analysis

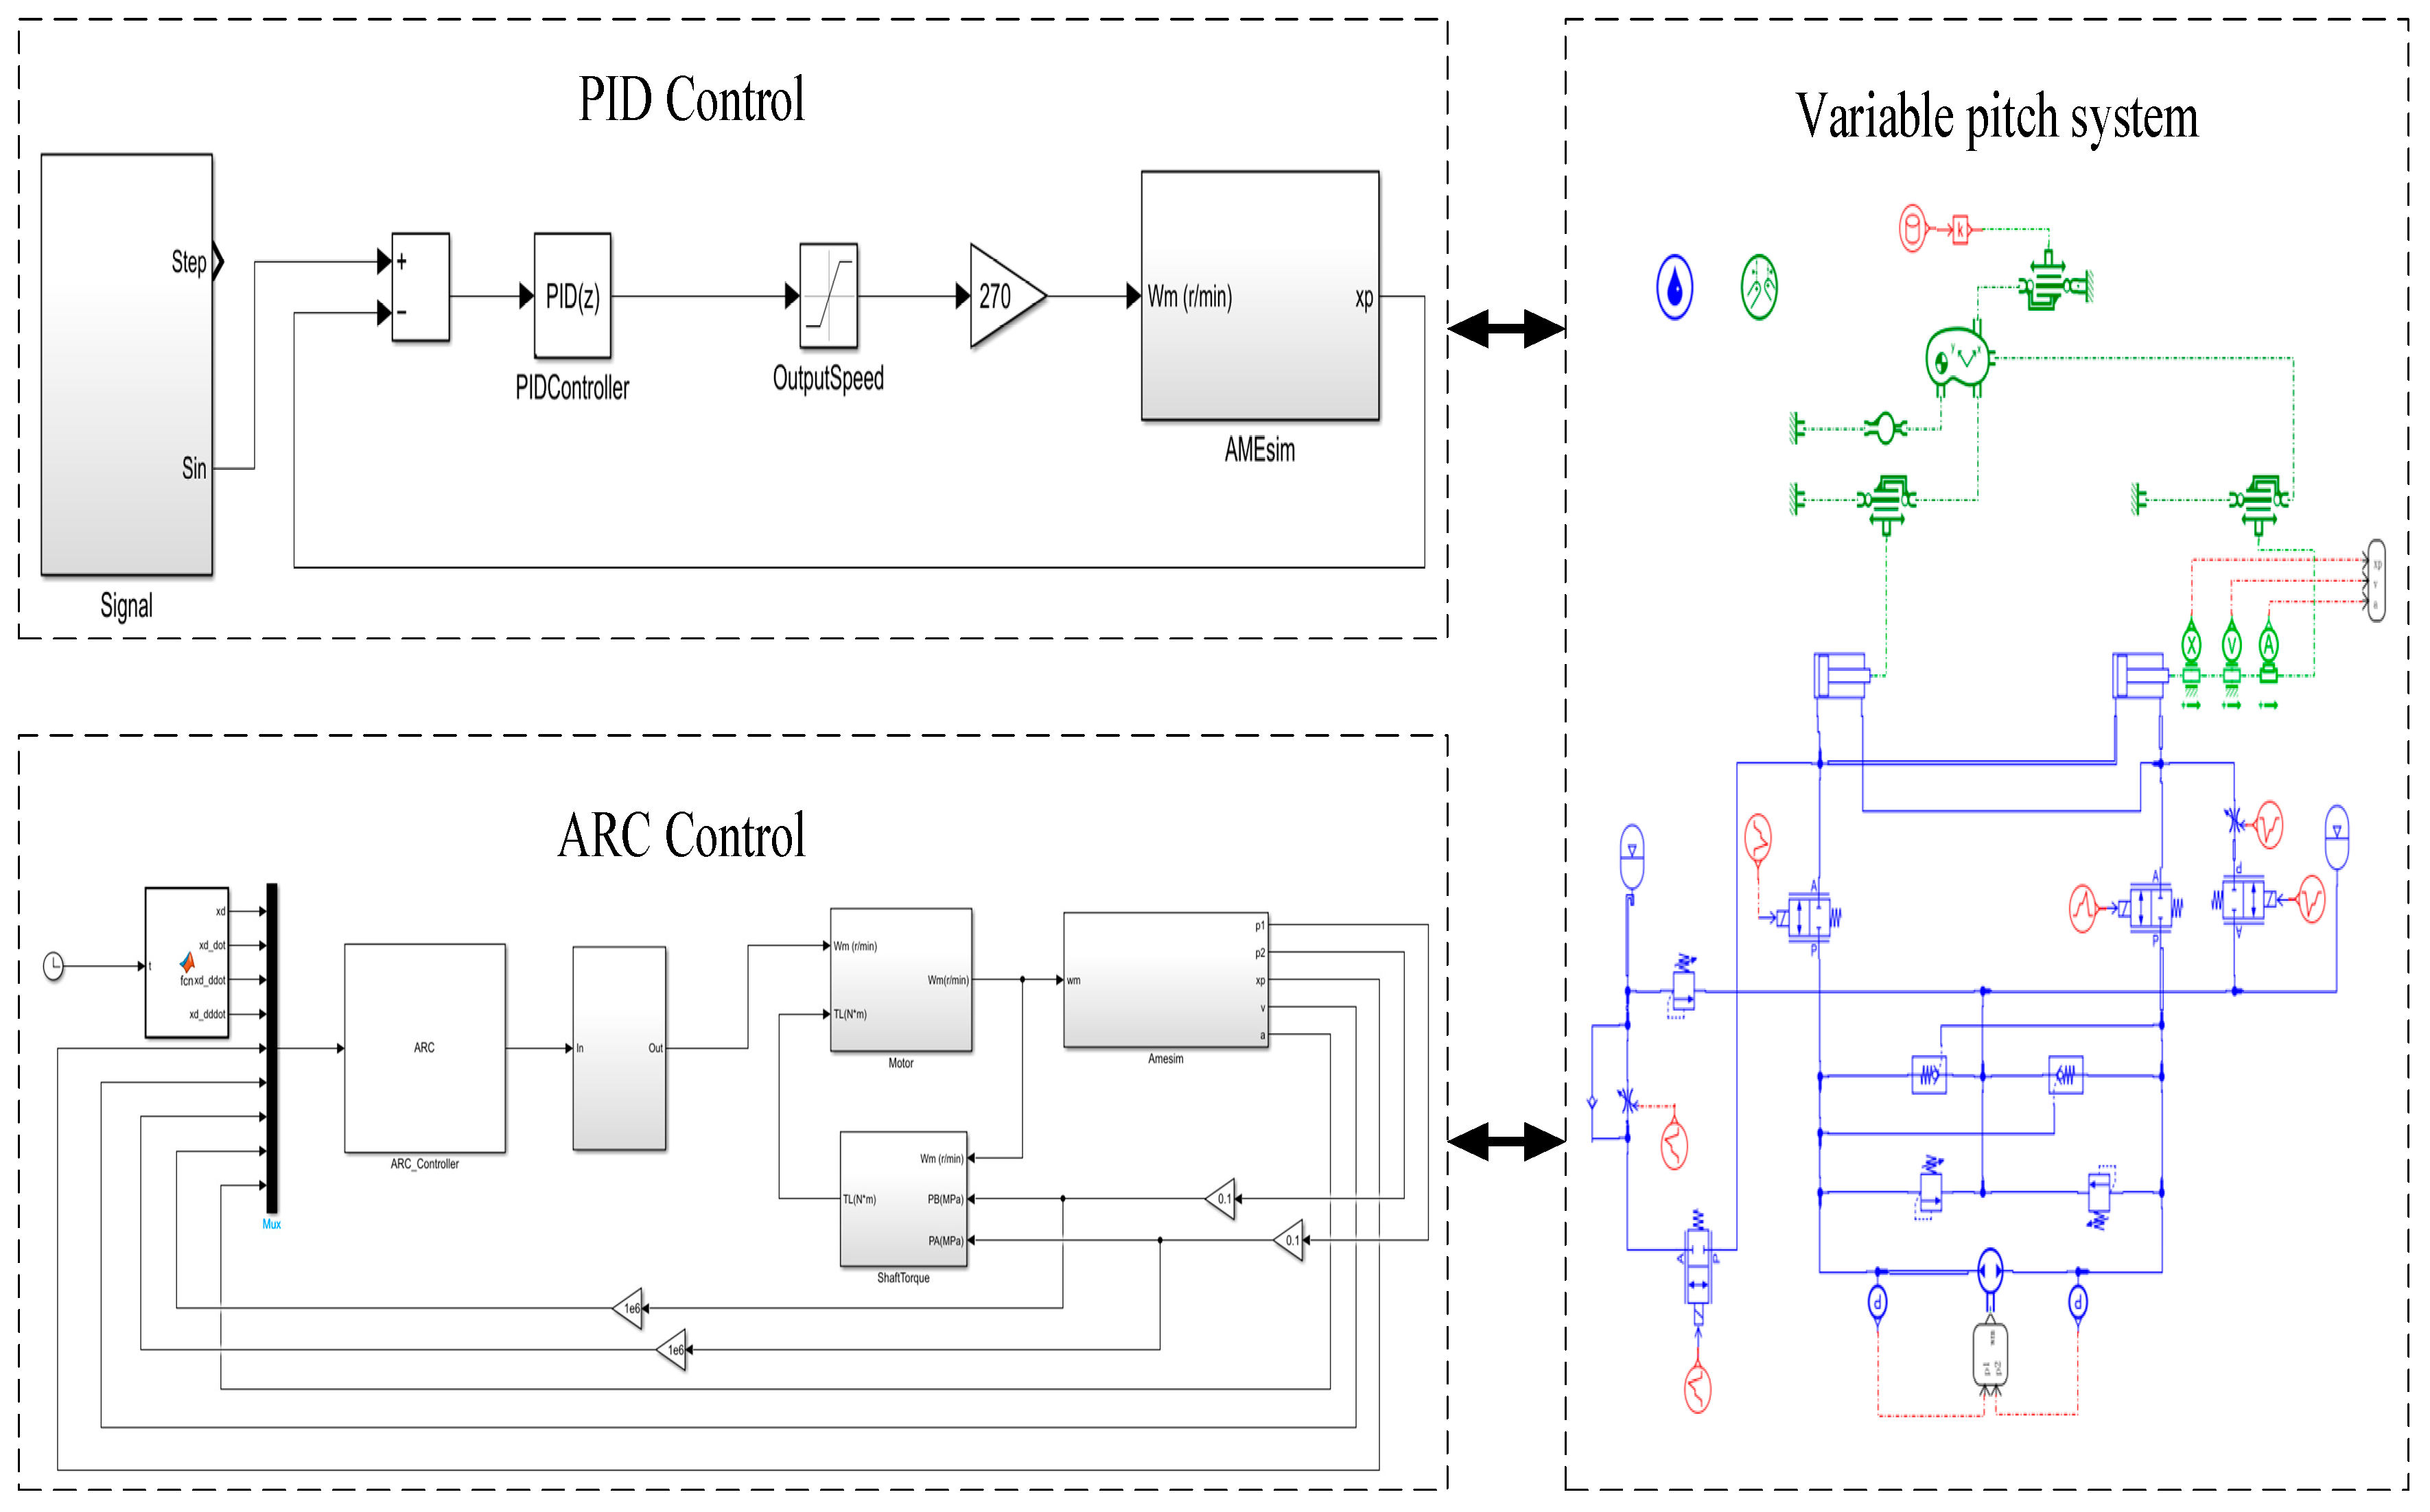
A simulation system is created through AMEsim (2020.1) and MATLAB (R2021a) to verify the effectiveness of the designed system. The structure of this simulation system is illustrated in Figure 4.
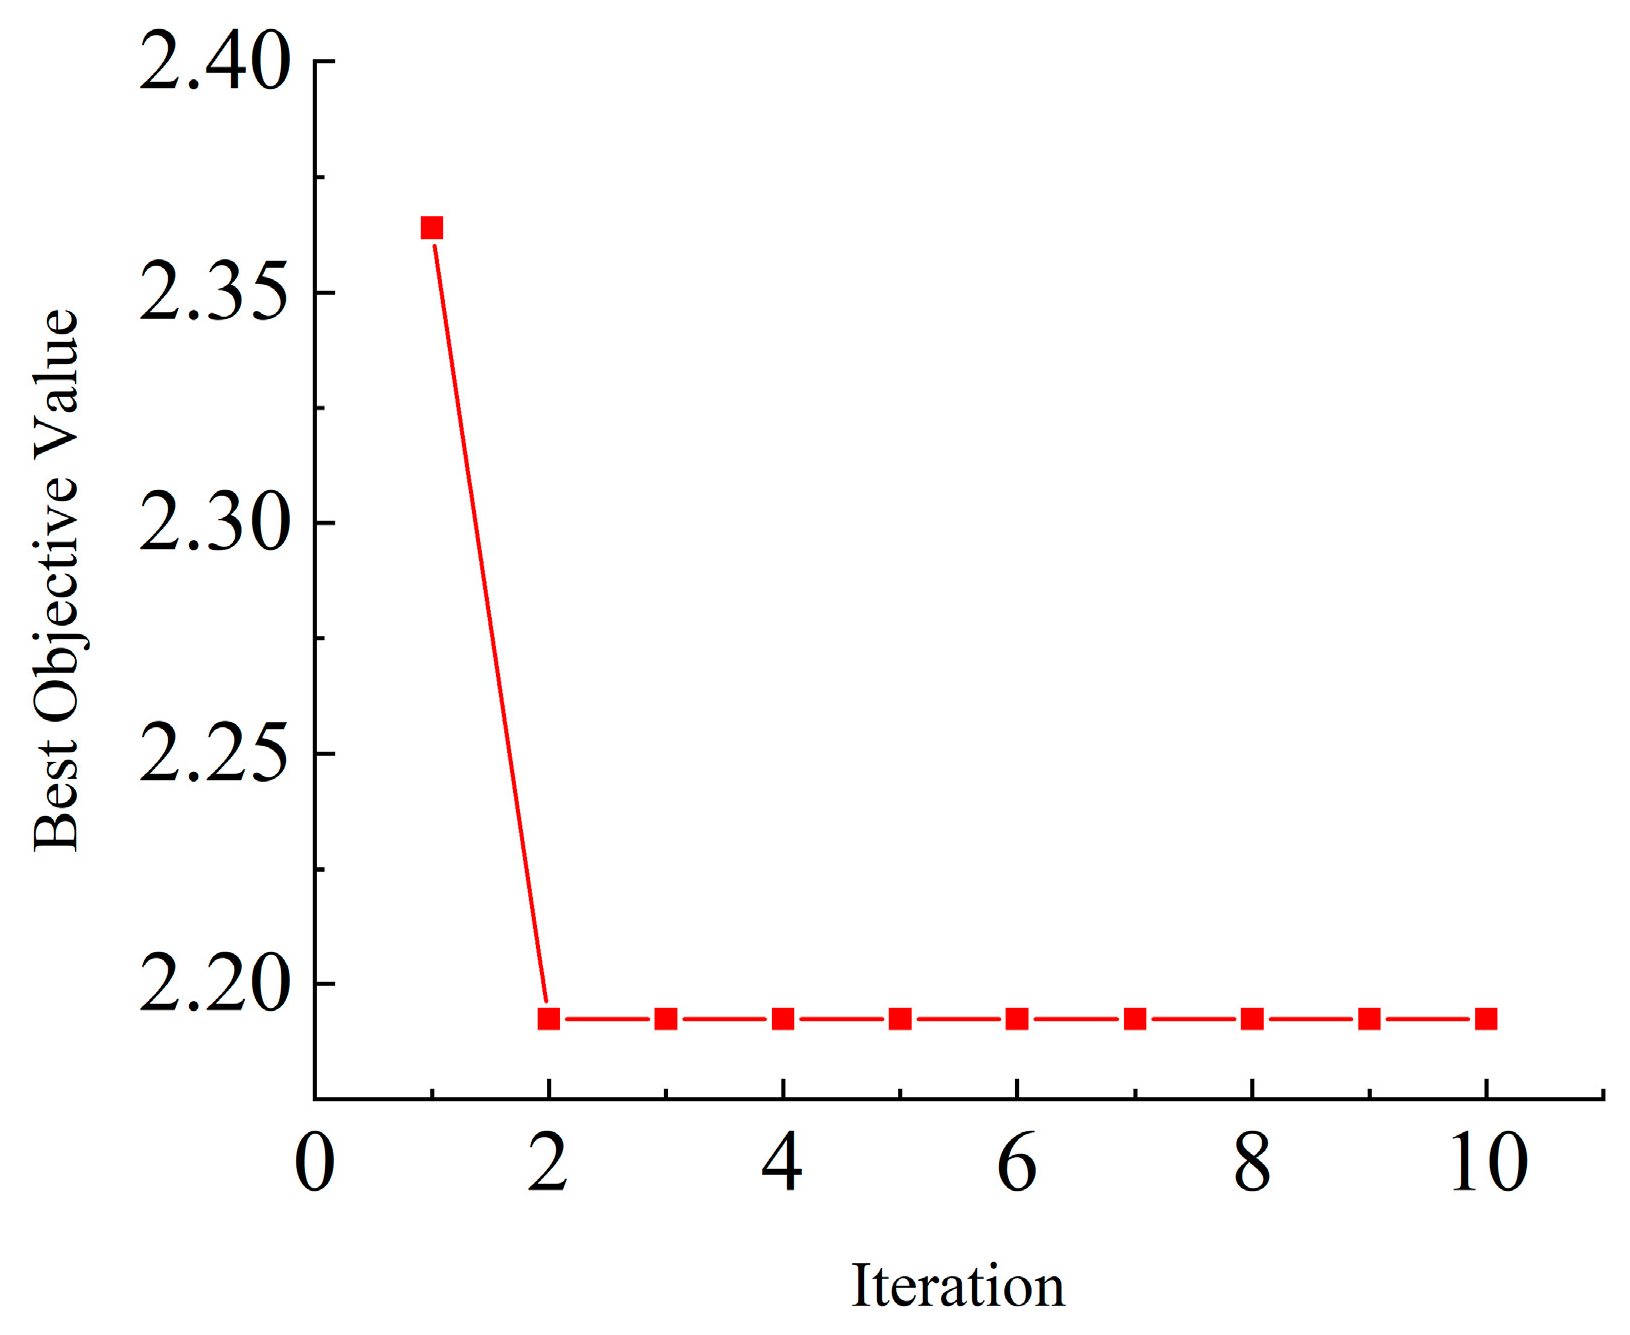
To ensure the optimization of the controller parameters, this paper combines empirical method and PSO algorithm for parameter tuning. First, the initial parameter ranges are determined through empirical testing, followed by optimization using MATLAB’s particle swarm function. The optimization objective is set as the sum of squared tracking errors under wind disturbance conditions, with 10 particles and a maximum of 10 iterations. The initial system parameters are set as follows: the viscous damping coefficient is 1 Nm/(rev/min), and the hydraulic cylinder leakage coefficient is 5e-12 m3/s/Pa. To enhance the adaptability of both the PID and ARC controllers, wind disturbance is incorporated during parameter tuning, with the disturbance data shown in Figure 5.

4.1.1. PID Controller Parameter Tuning

Based on empirical testing, the parameter ranges for the PID controller are set as follows: kp ∈ [6000, 7500], ki ∈ [0, 1000], and kd ∈ [0, 1000]. The sum of squared errors for the best parameters in each iteration of the PSO algorithm is shown in Figure 6.
The error converges from the second iteration and remains stable thereafter, with a minimum sum of squared errors of 2.19 obtained at a sampling interval of 0.01 s. The optimized parameters are as follows: kp = 7417.23, ki = 888.95, and kd = 1000. Other parameter combinations with near-minimum objective values and their corresponding cost functions are shown in Table 1.
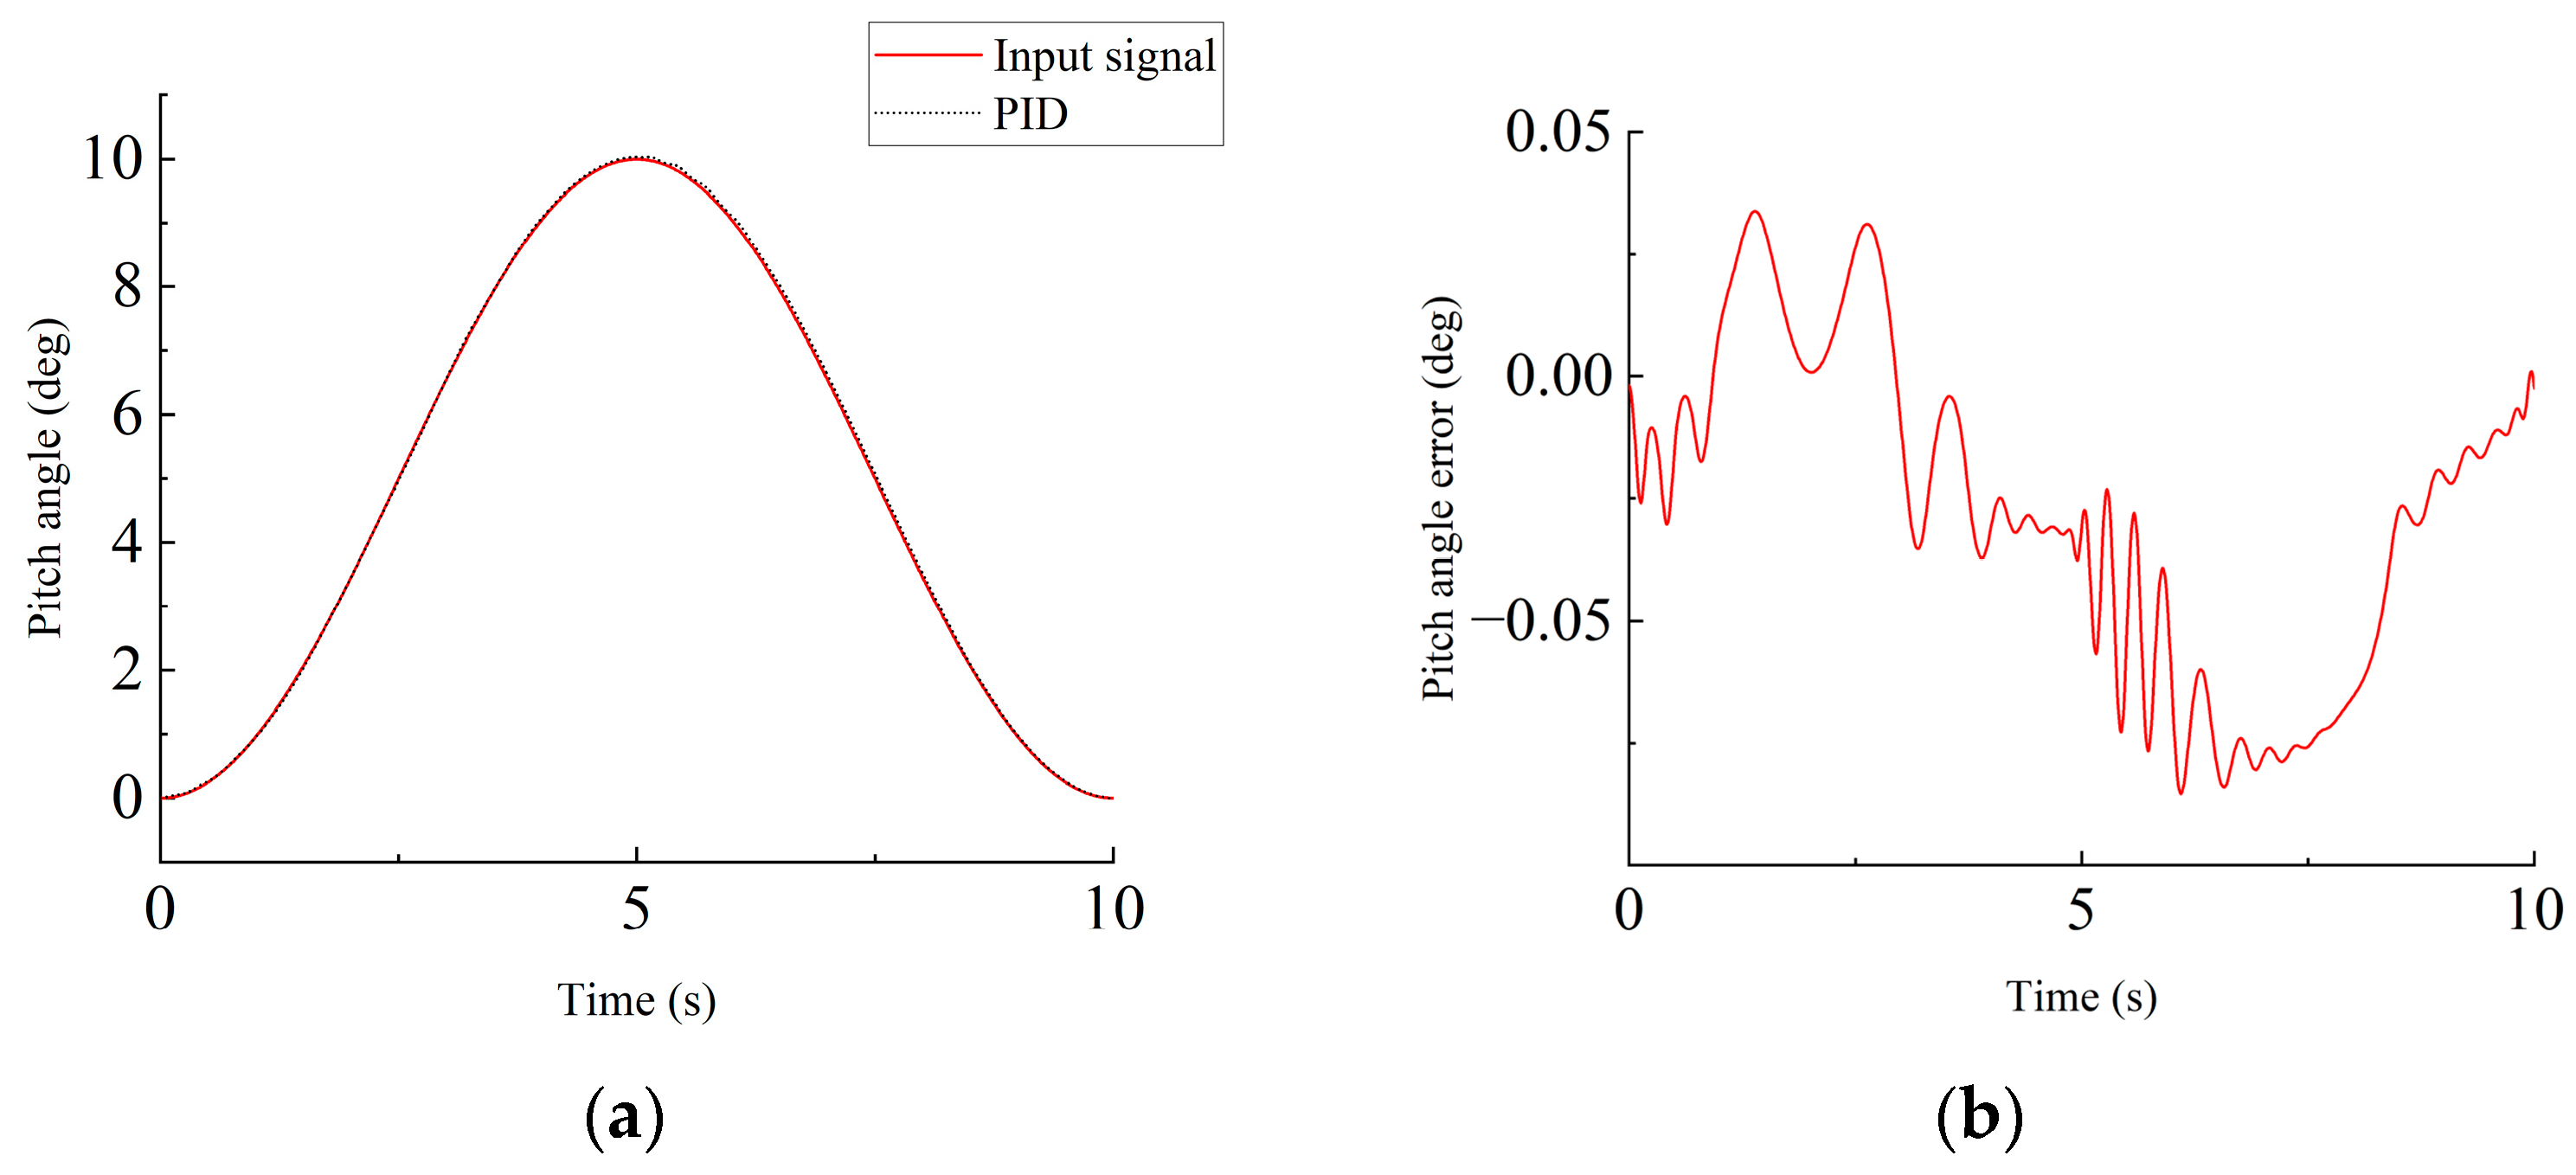
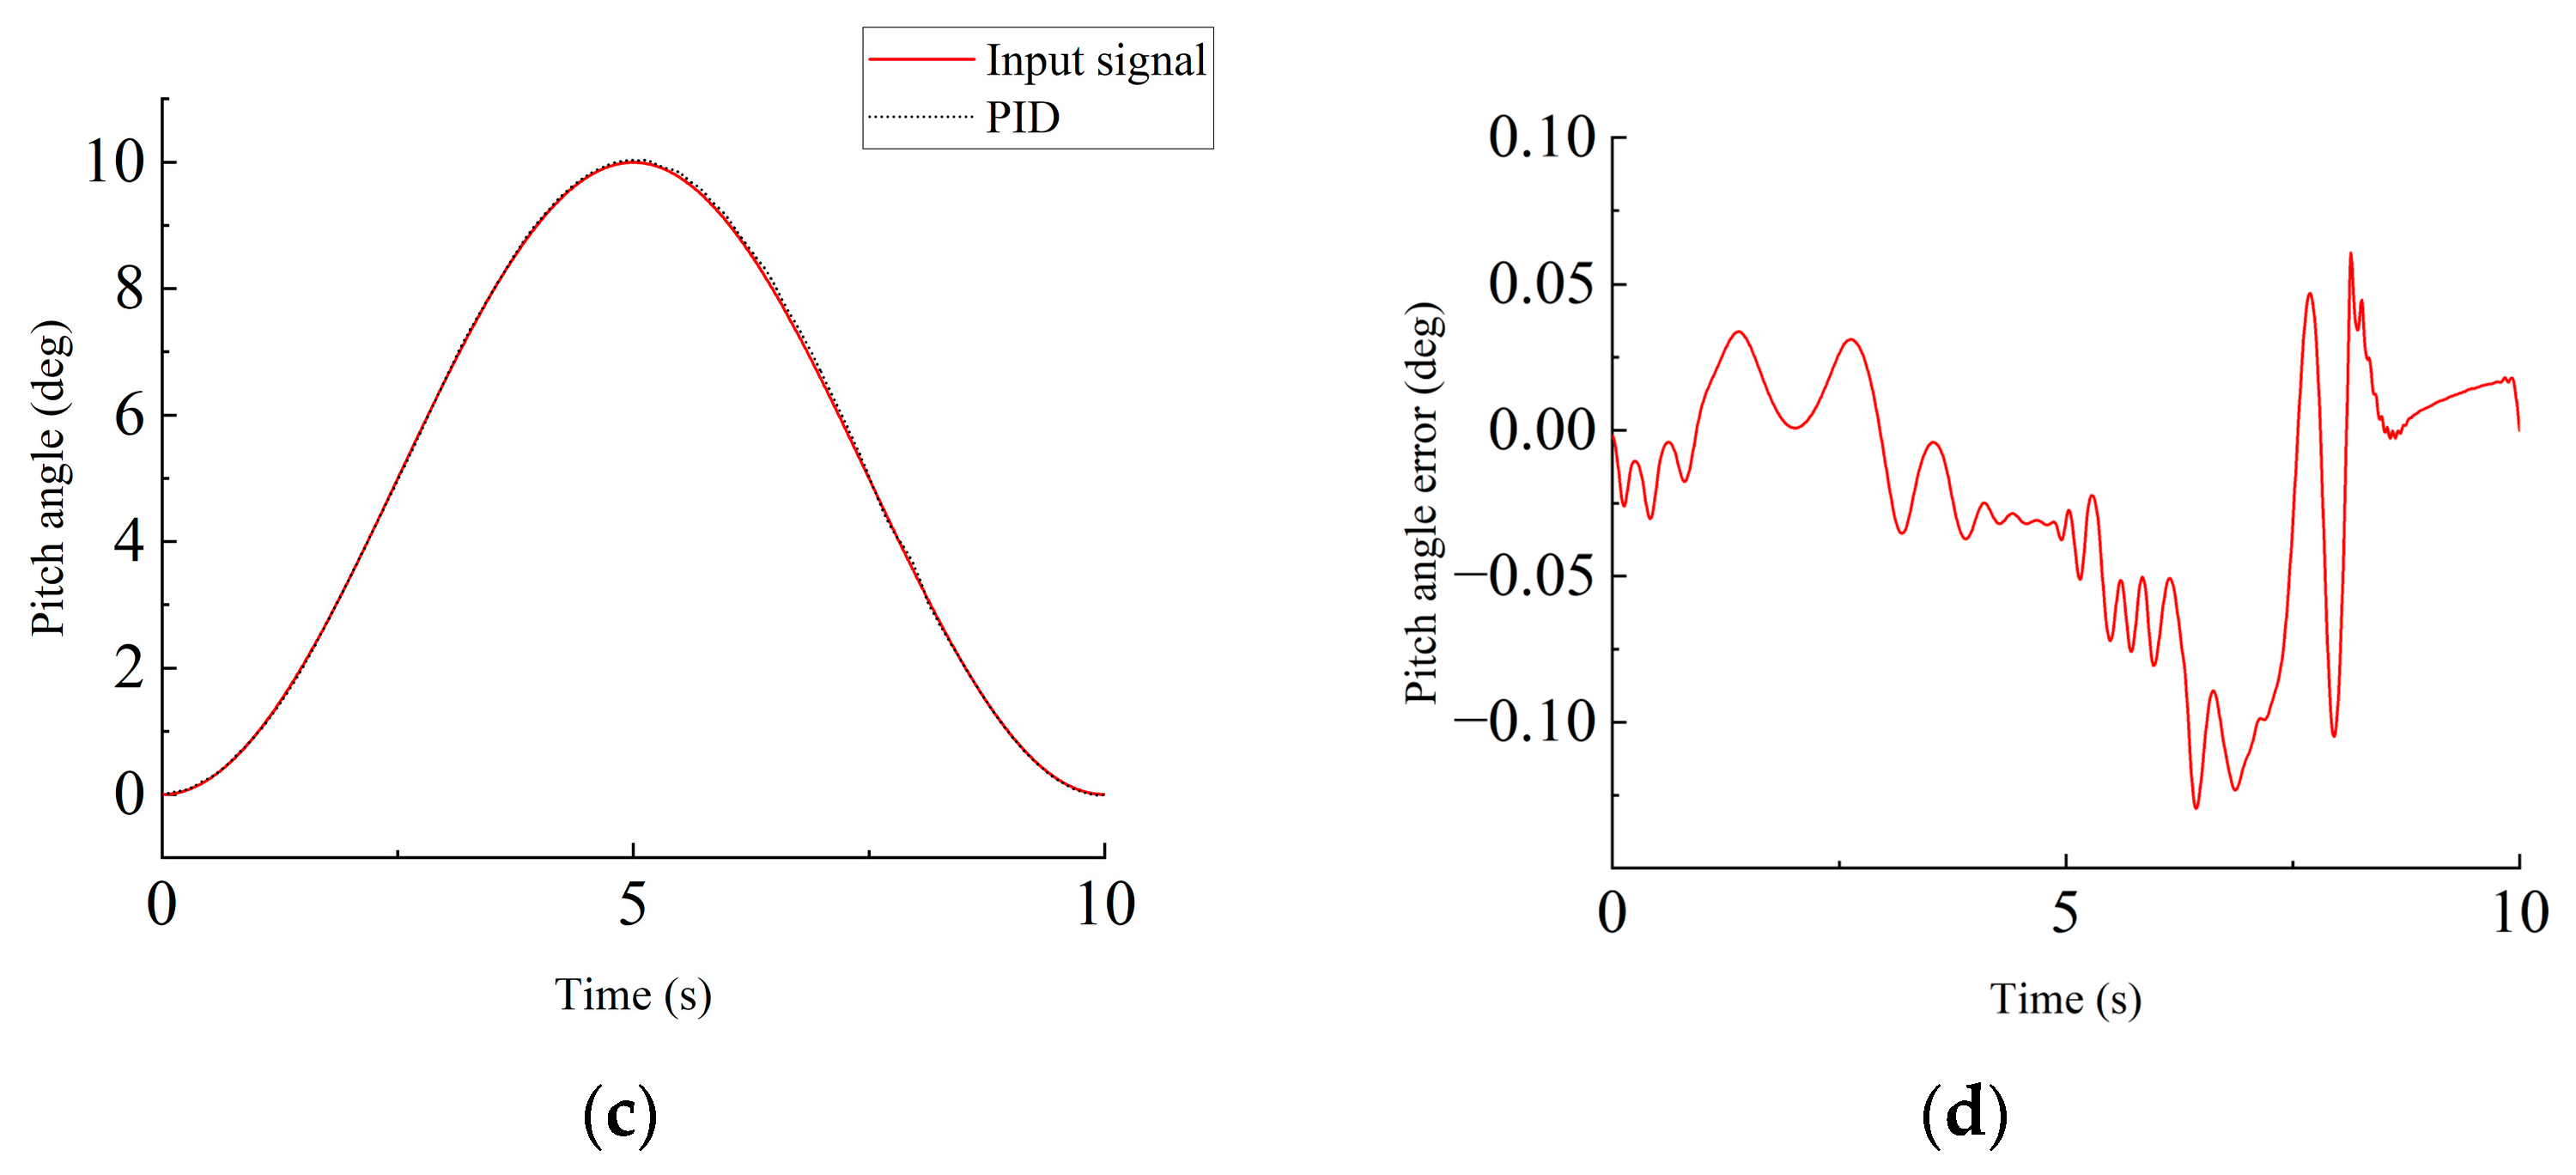
The performance comparison of the PID controller with optimal parameters under both disturbance-free and wind-disturbed conditions is illustrated in Figure 7.
The comparative results in Figure 7 illustrate the tracking performance of the PID controller with PSO-optimized parameters under different operating conditions. In the disturbance-free case (Figure 7a,b), the PID controller demonstrates tracking capability with a maximum error of 0.08°. When subjected to wind disturbance (Figure 7c,d), the tracking error increases to approximately 0.15° at around 6 s and maintains similar fluctuations thereafter. Since the PID parameters were optimized under this specific wind disturbance condition, the tracking performance is satisfactory. Moreover, this parameter combination also performs well in the disturbance-free scenario.

4.1.2. ARC Controller Parameter Tuning

Based on empirical adaptive law, the adaptive gain matrix is set as Γ = diag(10, 1, 10−13), and the parameter ranges for the ARC controller are defined as follows: k1 ∈ [80, 300], k2 ∈ [2000, 145,000], and k3 ∈ [10, 1000]. The sum of squared errors for the best parameters in each iteration of the PSO algorithm is shown in Figure 8.
The error converges from the fourth iteration and remains stable thereafter, with a minimum sum of squared errors of 2.28 obtained at a sampling interval of 0.01 s. The optimized parameters are as follows: k1 = 210.95, k2 = 141,776.61, and k3 = 881.57. Other parameter combinations with near-minimum objective values and their corresponding cost functions are shown in Table 2.
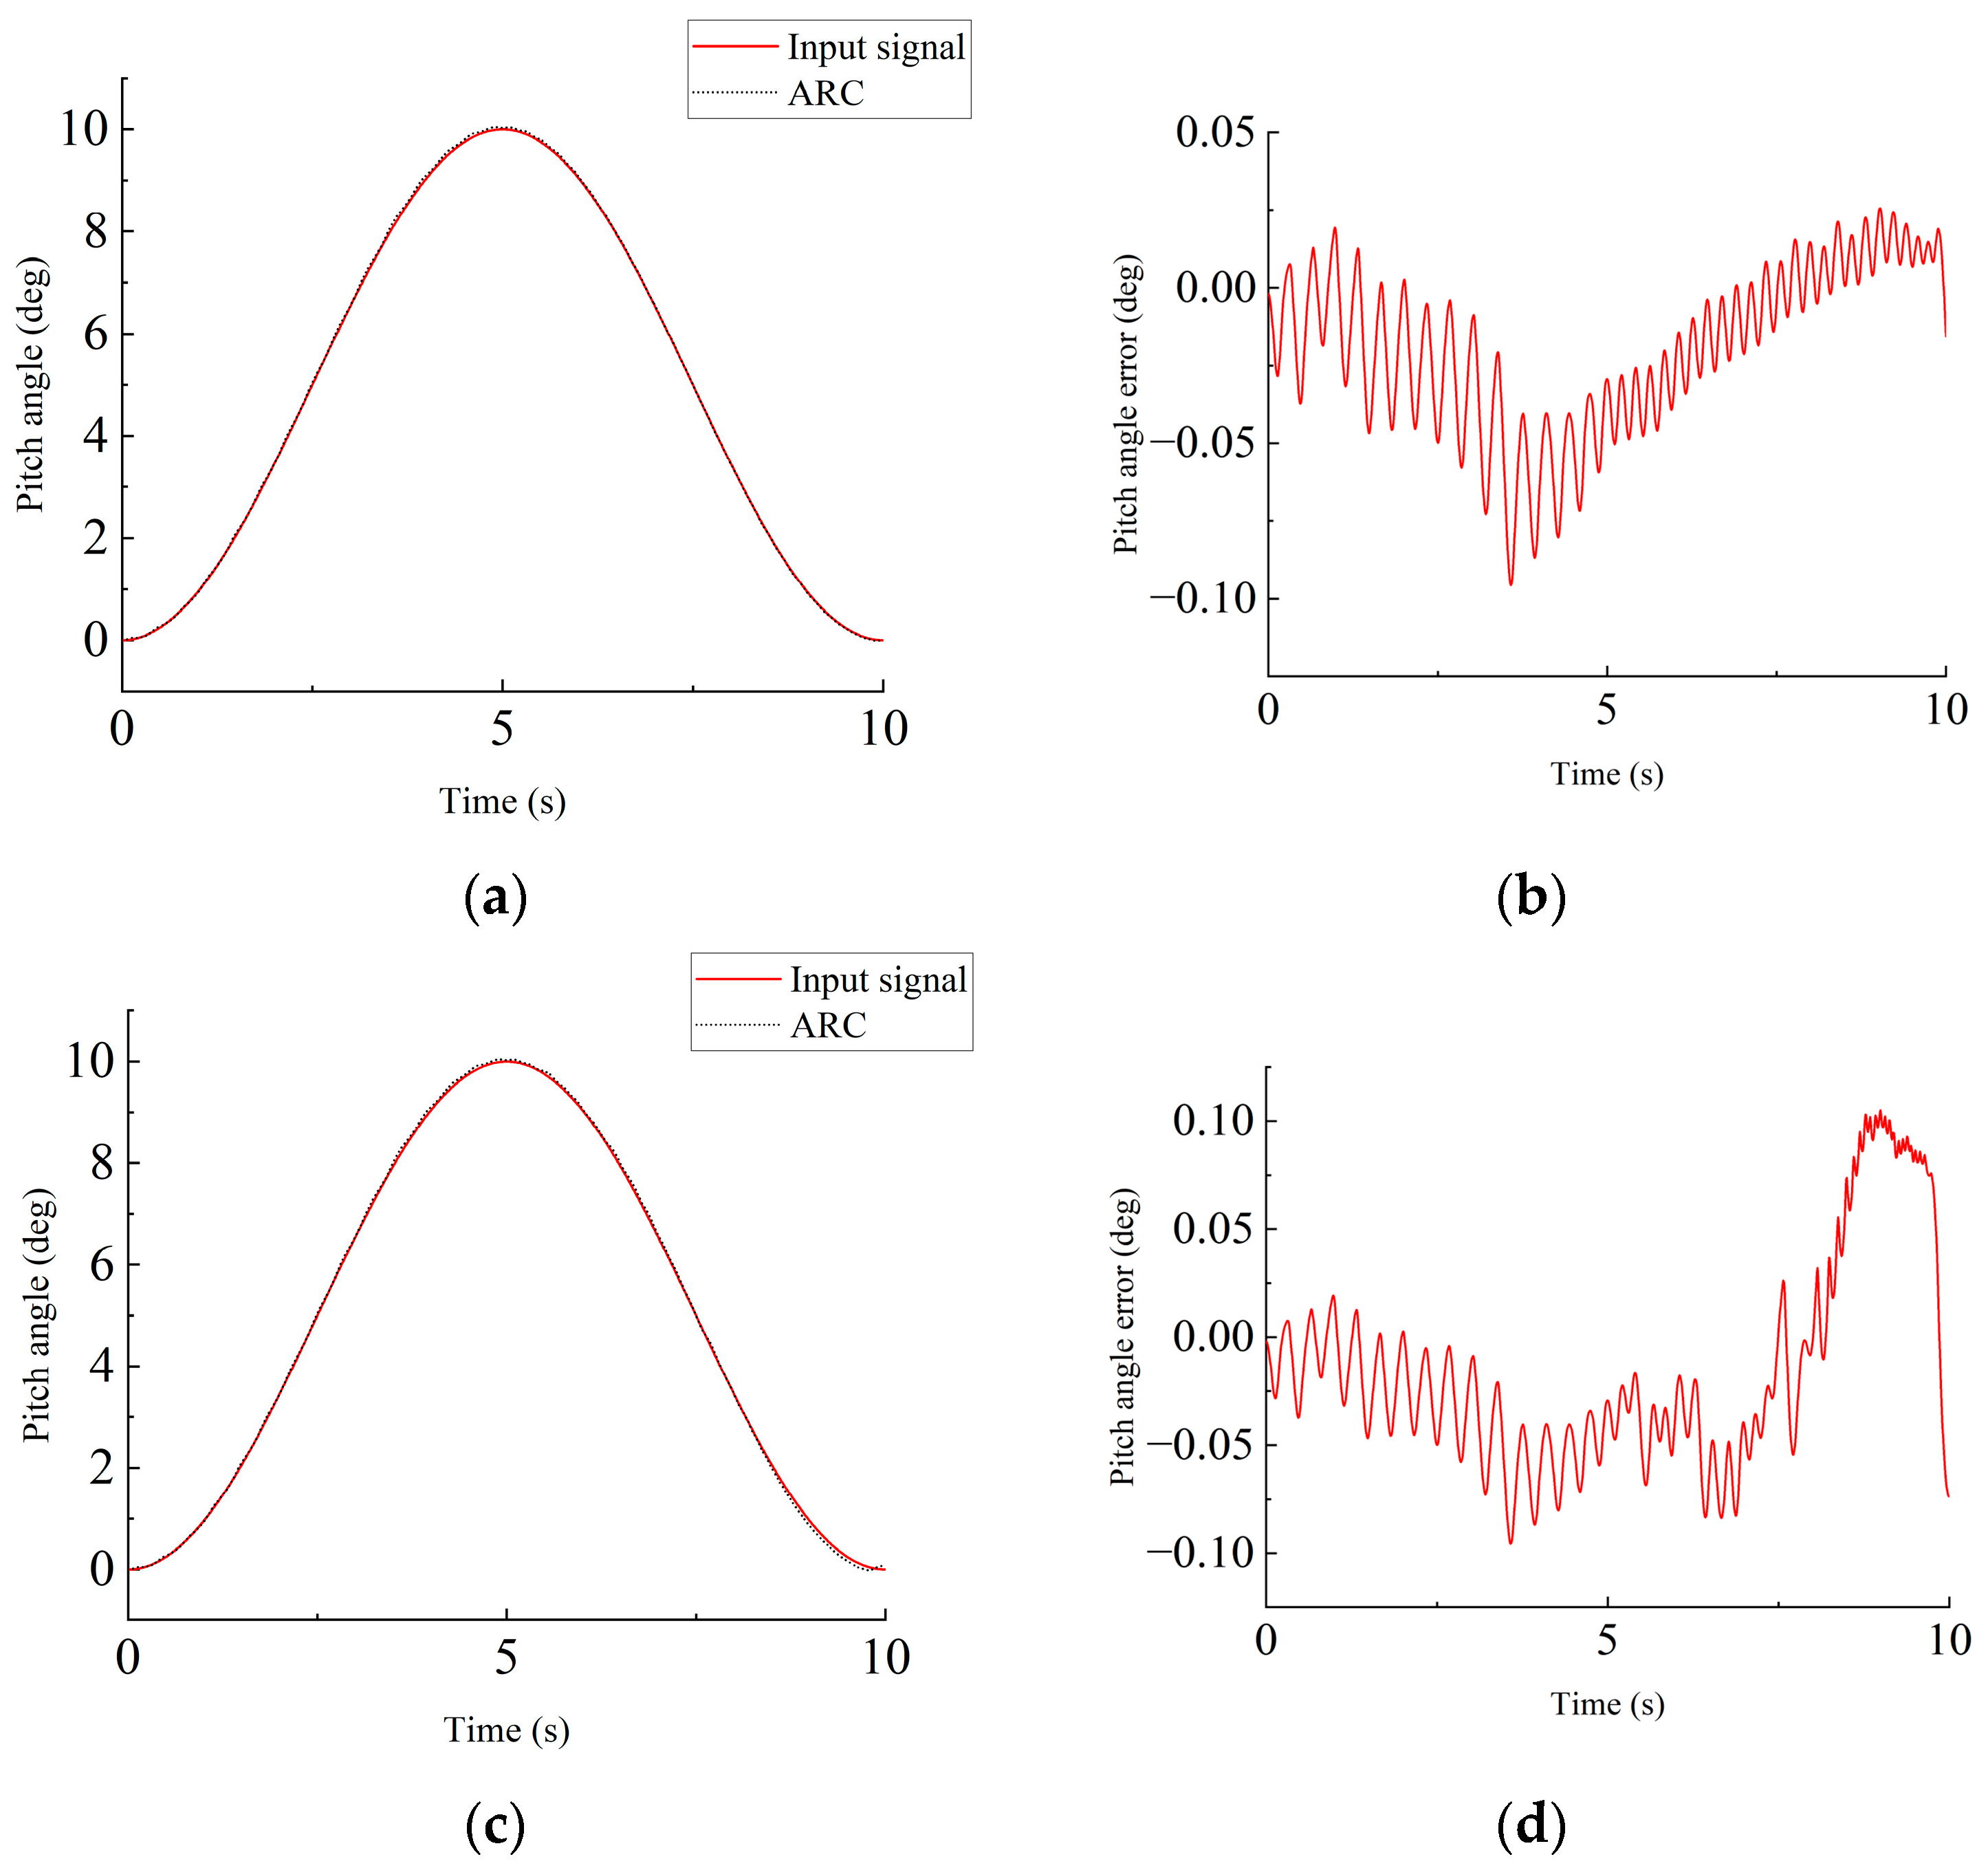
The performance comparison of the optimized ARC controller under conditions with and without wind disturbance is shown in Figure 9.
The comparative results in Figure 8 demonstrate the tracking performance of the ARC controller under different conditions. In the disturbance-free case (Figure 9a,b), the ARC controller achieves precise tracking with a maximum error of 0.1°, exhibiting excellent steady-state performance. When subjected to wind disturbance (Figure 9c,d), the maximum tracking error reaches approximately 0.12° at around 8 s due to the sudden onset of disturbance, and then decreases. This performance can be attributed to the adaptive mechanism of the ARC, which estimates and compensates for system uncertainties through real-time parameter adjustment. The adaptive law effectively handles both the inherent nonlinearities of the pump-controlled system and the external wind disturbances, demonstrating robust tracking capability under varying operating conditions.

4.1.3. Robustness Analysis

To evaluate robustness against system parameter variations, the viscous damping coefficient is increased to 5000 Nm/(rev/min) and the hydraulic cylinder leakage coefficient is set to 5 × 10⁻¹⁰ m3/s/Pa. The sinusoidal tracking performance comparison between the PID and ARC controllers under these perturbed conditions is shown in Figure 10.
The experimental results reveal that under parameter variations (where the viscous damping coefficient and hydraulic cylinder leakage coefficient are significantly altered), the ARC controller maintains its tracking performance with an error increment not exceeding 0.15°, whereas the PID controller’s tracking error increases by more than 1.5°. These results validate the enhanced parametric robustness of the ARC controller.

4.2. Bench Test

To further verify the control effect of PID and ARC, a physical test bed, as shown in Figure 11, was built for testing. The controller parameters are consistent with the software simulation parameters.
Table 3 shows the test stand hydraulic components that were selected.
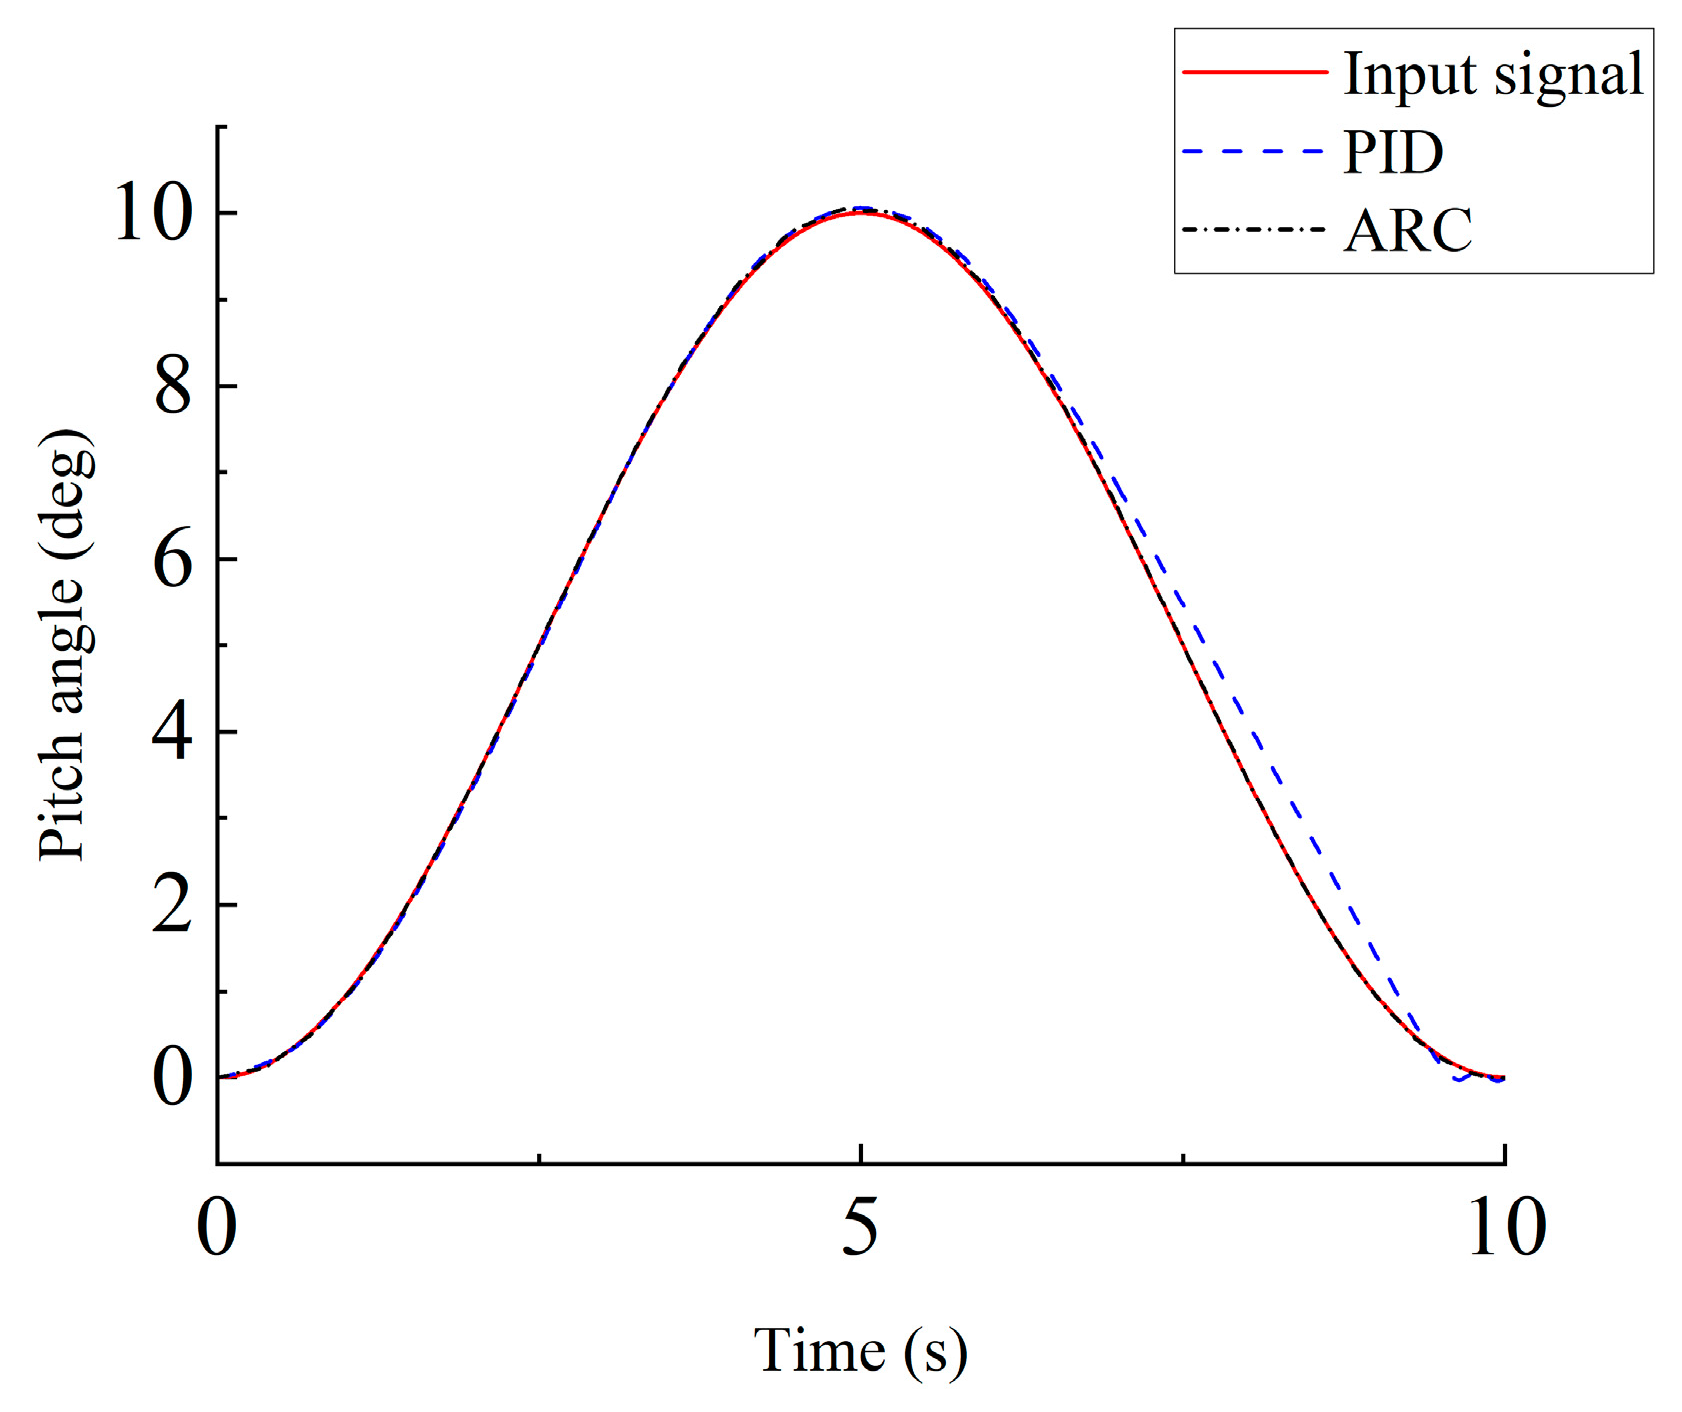
Based on the PSO-optimized parameters, the PID and ARC controllers were implemented on the physical test bed to control the hydraulic cylinder in sinusoidal motion. The pitch angle was calculated based on the displacement of the hydraulic cylinder. The comparative tracking performance is illustrated in Figure 12.
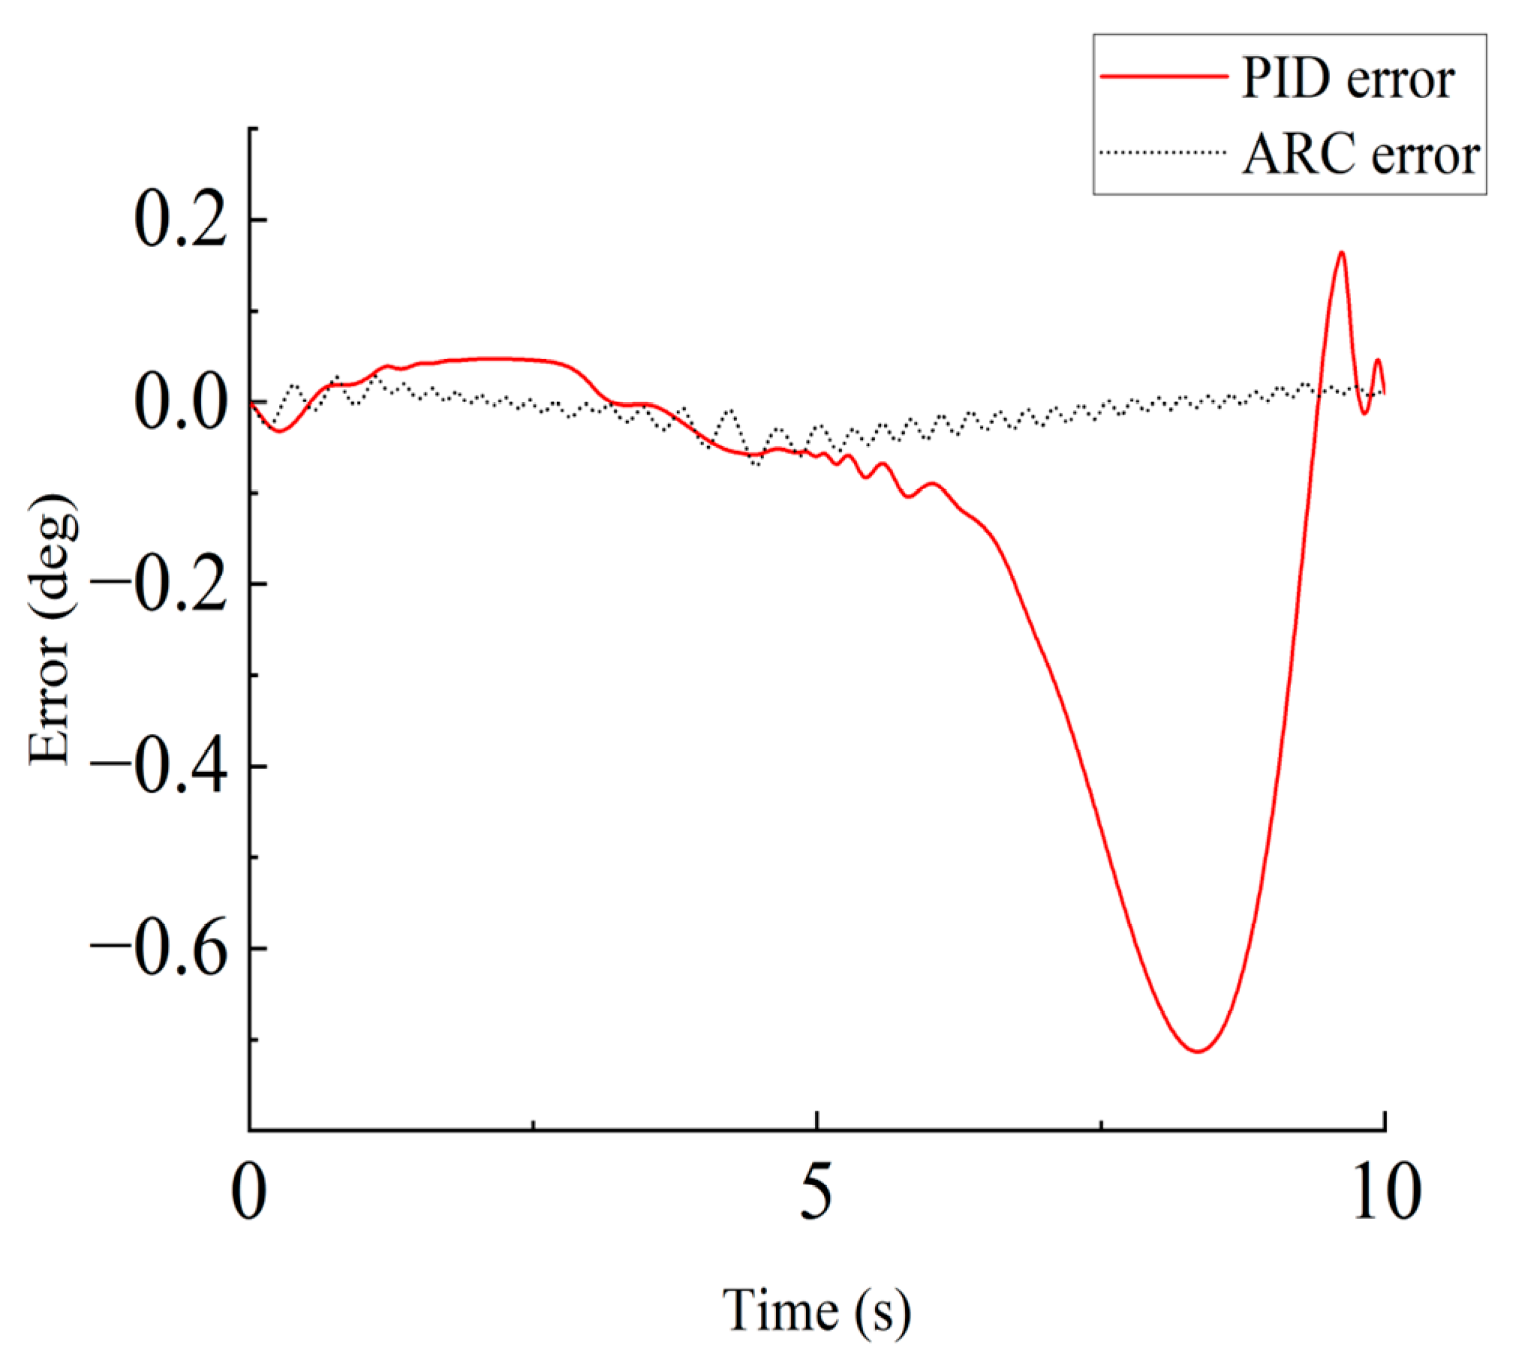
The experimental results demonstrate that both the PID and ARC controllers can track the reference pitch angle effectively under physical test conditions. However, during the hydraulic cylinder retraction process (5–10 s), the ARC controller exhibits notably superior tracking performance compared to the PID controller. The tracking errors of both controllers are shown in Figure 13.
The results indicate that the tracking error fluctuation range of the PID controller is approximately 0.7 degrees, while that of the ARC controller is about 0.1 degrees. This performance difference can be attributed to the asymmetric characteristics of the hydraulic cylinder, where the flow rates during extension and retraction are unequal. Since the PID parameters remain fixed while the ARC controller can adjust its response through parameter estimation via adaptive laws, the ARC controller demonstrates superior performance in handling both system nonlinearities and external disturbances.
Based on the simulation and physical test bench results, the proposed ARC strategy demonstrates significant advantages in the pitch control system. In the numerical simulations, both the PID and ARC parameters were initially determined through empirical methods and then optimized using a Particle Swarm Optimization algorithm to obtain optimal parameter combinations under wind speed disturbances. With only wind speed disturbance, PID and ARC showed comparable sinusoidal signal tracking performance, with PID slightly outperforming ARC. In the parameter perturbation tests, the ARC strategy exhibited better robustness—even with system parameter changes, the maximum tracking error increment remained around 0.15°, while PID’s tracking error was significantly larger, reaching approximately 1.5°, showing notably lower robustness than ARC. The physical test bench results corroborated the simulation findings—during hydraulic cylinder extension and retraction, the ARC controller’s tracking error fluctuation range (approximately 0.1°) was significantly better than that of the PID controller (approximately 0.7°), demonstrating the feasibility of this control strategy in practical engineering applications. Particularly in handling internal and external disturbances and nonlinear issues such as hydraulic cylinder asymmetric characteristics, the ARC controller showed clear performance advantages through its parameter adaptation mechanism. These experimental results not only validate the effectiveness of the proposed control strategy but also provide a practical solution for precise control of pitch systems in large wind turbines.

5. Conclusions

This paper proposes an ARC strategy for high-performance control of pump-controlled pitch systems in large wind turbines. Through theoretical analysis, numerical simulation, and physical experiments, the following main conclusions can be drawn:
(1)
The proposed mathematical model for pump-controlled pitch systems effectively integrates the angular dynamics of the pitch mechanism and hydraulic system characteristics. The model considers major nonlinear factors, system parameter uncertainties, and wind speed disturbance effects, providing a reliable theoretical foundation for controller design.
(2)
PSO was used to optimize both the PID and ARC parameters under wind speed disturbance conditions. With the obtained optimal parameter combinations, the PID and ARC controllers showed similar tracking performance for sinusoidal signals, with PID performing slightly better than ARC, indicating that PID control can outperform ARC under specific conditions.
(3)
The simulation results demonstrate that when system parameters change due to various factors, the ARC controller maintains a small tracking error below 0.15°, while the PID controller’s error exceeds 1.5°. The physical test bench results further confirm the practicality of this control strategy. During hydraulic cylinder reciprocating motion, especially in the retraction phase, the ARC controller shows excellent tracking performance with an error fluctuation range of approximately 0.1°, significantly outperforming the PID controller’s range of 0.7°. This indicates that the proposed control strategy can effectively handle nonlinear characteristics and uncertainties in actual systems.
This research offers valuable insights into energy-efficient design for wind turbine pitch systems. By adopting a pump-controlled solution combined with high-performance control strategies, system energy consumption can be reduced while maintaining control performance, which is significant for improving the overall efficiency of wind turbines. Future research will focus on developing control strategies that better address wind conditions and pitch system nonlinearities typically observed in wind turbine operation, while fully utilizing the energy-saving advantages of pump-controlled systems. Multi-objective optimization methods will be employed to further enhance the energy-saving effects while ensuring system stability and high performance.

Author Contributions

Conceptualization, T.Z. and B.Y.; methodology, B.Y. and G.C.; experiment, X.W. and Y.L.; software, X.W. and K.L.; investigation, K.L.; writing—original draft preparation, Y.L.; writing—review and editing, L.W.; analysis, L.W. and T.Z.; project administration, C.A.; funding acquisition, C.A. and G.C. All authors have read and agreed to the published version of the manuscript.

Funding

This research was funded by the National Natural Science Foundation of China (U22A20178), the Research Fund Project of Xinjiang Institute of Engineering (2024xgy142605), the Autonomous Region Colleges and Universities Research Program (XJEDU2024P087), the Natural Science Foundation of Xinjiang Uygur Autonomous Region (2022D01A244), and the Basic Research Funds for Universities of Xinjiang (XJEDU2023P138).

Institutional Review Board Statement

Not applicable.

Informed Consent Statement

Not applicable.

Data Availability Statement

The original contributions presented in the study are included in the article, further inquiries can be directed to the corresponding author.

Conflicts of Interest

Author Xuewei Wang was employed by the company Sichuan Chuanrun Intelligent Fluid Technology Co., Ltd. and author Lihui Wang was employed by the company Shougang Jingtang United Iron & Steel Co., Ltd. The remaining authors declare that the re-search was conducted in the absence of any commercial or financial relationships that could be construed as a potential conflict of interest.

References

  1. Chen, W.T.; Wang, X.Y.; Zhang, F.S.; Liu, H.W.; Lin, Y.G. Review of the application of hydraulic technology in wind turbine. Wind Energy 2020, 23, 1495–1522. [Google Scholar] [CrossRef]
  2. Liu, K.; Chen, W.; Chen, G.; Dai, D.; Ai, C.; Zhang, X.; Wang, X. Application and analysis of hydraulic wind power generation technology. Energy Strategy Rev. 2023, 48, 101117. [Google Scholar] [CrossRef]
  3. Petrovic, V.; Jelavic, M.; Baotic, M. MPC framework for constrained wind turbine individual pitch control. Wind Energy 2021, 24, 54–68. [Google Scholar] [CrossRef]
  4. Du, H.; Ding, K.Y.; Shi, J.J.; Feng, X.Y.; Guo, K.; Fang, J.H. High-gain observer-based pump/valve combined control for heavy vehicle electro-hydraulic servo steering system. Mechatronics 2022, 85, 15. [Google Scholar] [CrossRef]
  5. Helian, B.; Chen, Z.; Yao, B. Precision Motion Control of a Servomotor-Pump Direct-Drive Electrohydraulic System with a Nonlinear Pump Flow Mapping. IEEE Trans. Ind. Electron. 2020, 67, 8638–8648. [Google Scholar] [CrossRef]
  6. Shi, S.Y.; He, Z.L.; Zeng, D.B.; Huang, P.; Jin, G. Identification and Modeling of a Servo Pump-Controlled Hydraulic System. IEEE ASME Trans. Mechatron. 2024, 1–11. [Google Scholar] [CrossRef]
  7. Yan, G.; Jin, Z.; Zhang, T.; Zhang, C.; Ai, C.; Chen, G. Exploring the Essence of Servo Pump Control. Processes 2022, 10, 786. [Google Scholar] [CrossRef]
  8. Liu, H.; Zhang, X.G.; Quan, L.; Zhang, H.J. Research on energy consumption of injection molding machine driven by five different types of electro-hydraulic power units. J. Clean Prod. 2020, 242, 11. [Google Scholar] [CrossRef]
  9. Karpenko, M. Aircraft Hydraulic Drive Energy Losses and Operation Delay Associated with the Pipeline and Fitting Connections. Aviation 2024, 28, 1–8. [Google Scholar] [CrossRef]
  10. Hagen, D.; Padovani, D.; Choux, M. A Comparison Study of a Novel Self-Contained Electro-Hydraulic Cylinder versus a Conventional Valve-Controlled Actuator-Part 2: Energy Efficiency. Actuators 2019, 8, 78. [Google Scholar] [CrossRef]
  11. Hati, S.K.; Mandal, N.P.; Sanyal, D. Energy-saving design of variable-displacement bi-directional pump-controlled electrohydraulic system. Proc. Inst. Mech. Eng. Part I J. Syst. Control Eng. 2021, 235, 1218–1236. [Google Scholar] [CrossRef]
  12. Skorek, G. Study of Losses and Energy Efficiency of Hydrostatic Drives with Hydraulic Cylinder. Pol. Marit. Res. 2018, 25, 114–128. [Google Scholar] [CrossRef]
  13. Qu, S.Y.; Fassbender, D.; Vacca, A.; Busquets, E. A high-efficient solution for electro-hydraulic actuators with energy regeneration capability. Energy 2021, 216, 16. [Google Scholar] [CrossRef]
  14. Bury, P.; Stosiak, M.; Urbanowicz, K.; Kodura, A.; Kubrak, M.; Malesinska, A. A Case Study of Open- and Closed-Loop Control of Hydrostatic Transmission with Proportional Valve Start-Up Process. Energies 2022, 15, 1860. [Google Scholar] [CrossRef]
  15. Helian, B.B.; Chen, Z.; Yao, B.; Lyu, L.T.; Li, C. Accurate Motion Control of a Direct-Drive Hydraulic System With an Adaptive Nonlinear Pump Flow Compensation. IEEE ASME Trans. Mechatron. 2021, 26, 2593–2603. [Google Scholar] [CrossRef]
  16. Wang, T.; Song, J.C. Clearance Nonlinear Control Method of Electro-Hydraulic Servo System Based on Hopfield Neural Network. Machines 2024, 12, 329. [Google Scholar] [CrossRef]
  17. Wang, W.B.; Liu, S.; Zhao, D.X. Low-Complexity Error-Surface Prescribed Performance Control for Nonlinear Uncertain Single-Rod Electro-Hydraulic System. IEEE Trans. Control Syst. Technol. 2024, 8, 2402–2409. [Google Scholar] [CrossRef]
  18. Zhao, W.; Ebbesen, M.K.; Hansen, M.R.; Andersen, T.O. Enabling Passive Load-Holding Function and System Pressures Control in a One-Motor-One-Pump Motor-Controlled Hydraulic Cylinder: Simulation Study. Energies 2024, 17, 2484. [Google Scholar] [CrossRef]
  19. Mohmmed, J.H.; Hassan, A.K.; Ali, M.; Kokz, S.; Mosa, M.H.; Kareem, A.K.; Zainulabdeen, A.A.; Feng, Z. Design of uncertain displacement controlled velocity control system for hydraulic actuator. Heliyon 2024, 10, 15. [Google Scholar] [CrossRef]
  20. Cecchin, L.; Frey, J.; Gering, S.; Manderla, M.; Trachte, A.; Diehl, M. Nonlinear Model Predictive Control for Efficient Control of Variable Speed Variable Displacement Pumps. In Proceedings of the 3rd Modeling, Estimation and Control Conference (MECC), Lake Tahoe, NV, USA, 2–5 October 2023; pp. 331–336. [Google Scholar]
  21. Nguyen, M.H.; Ahn, K.K. Extended Sliding Mode Observer-Based Output Feedback Control for Motion Tracking of Electro-Hydrostatic Actuators. Mathematics 2023, 11, 4324. [Google Scholar] [CrossRef]
  22. Elbeji, O.; Hannachi, M.; Benhamed, M.; Sbita, L. Pitch Angle Control of a Wind Turbine Conversion System at High Wind Speed. In Proceedings of the 2020 17th International Multi-Conference on Systems, Signals & Devices (SSD), Monastir, Tunisia, 20–23 July 2020; pp. 819–823. [Google Scholar]
  23. Kim, D.; Lee, D. Hierarchical Fault-Tolerant Control using Model Predictive Control for Wind Turbine Pitch Actuator Faults. Energies 2019, 12, 3097. [Google Scholar] [CrossRef]
  24. Kamada, Y.; Maeda, T.; Takai, K.; Mizuno, S. Study on cyclic pitch control of HAWT by using instantaneous inflow observation. In Proceedings of the Conference on Science of Making Torque from Wind (TORQUE), Online, 28 September–2 October 2020. [Google Scholar]
  25. Salem, M.E.M.; El-Batsh, H.M.; El-Betar, A.A.; Attia, A.M.A. Application of Neural Network Fitting for Pitch Angle Control of Small Wind Turbines. In Proceedings of the 3rd IFAC Conference on Modelling, Identification and Control of Nonlinear Systems (MiCNON), Tokyo, Japan, 15–17 September 2021; pp. 185–190. [Google Scholar]
  26. Sierra-Garcia, J.E.; Santos, M. Neural networks and reinforcement learning in wind turbine control. Rev. Iberoam. Autom. Inform. Ind. 2021, 18, 327–335. [Google Scholar] [CrossRef]
  27. Xu, J.R.; Liu, Y.M. Voltage Flicker Mitigation Strategy Based on Individual Pitch Control of Wind Turbine. In Proceedings of the 13th International Conference on Measuring Technology and Mechatronics Automation (ICMTMA), Beihai, China, 16–17 January 2021; pp. 459–462. [Google Scholar]
  28. Teferra, D.M.; Ngoo, L.M.H.; Nyakoe, G.N. A Fuzzy Controlled Pitch Angle in a Permanent Magnet Synchronous Generator Type Wind Energy Conversion System. In Proceedings of the 21st IEEE Mediterranean Electrotechnical Conference (IEEE MELECON), Palermo, Italy, 14–16 June 2022; pp. 324–329. [Google Scholar]
  29. Wang, X.; Zhou, J.S.; Qin, B.; Luo, Y.B.; Hu, C.J.; Pang, J.M. Individual Pitch Control of Wind Turbines Based on SVM Load Estimation and LIDAR Measurement. IEEE Access 2021, 9, 143913–143921. [Google Scholar] [CrossRef]
  30. Liu, J.P.; Nie, G.H. Variable Speed Control Analysis of Direct-Drive Wind Turbines Incorporating the Variable Gain Pitch Knowledge Identification Algorithm. Mob. Inf. Syst. 2022, 2022, 12. [Google Scholar] [CrossRef]
Figure 1. Schematic diagram of a variable pitch system in wind turbines.
Applsci 14 10218 g001
Figure 2. Schematic of the variable pitch mechanism in a wind turbine system.
Applsci 14 10218 g002
Figure 3. Control block diagram of pump-controlled pitch system.
Applsci 14 10218 g003
Figure 4. The simulation system.
Applsci 14 10218 g004
Figure 5. The time-varying wind disturbance torque for parameter tuning.
Applsci 14 10218 g005
Figure 6. The convergence process of squared errors during PSO-based PID parameter optimization.
Applsci 14 10218 g006
Figure 7. Performance comparison of optimized PID controller: (a) tracking performance without wind disturbance; (b) tracking error without wind disturbance; (c) tracking performance with wind disturbance; and (d) tracking error with wind disturbance.
Applsci 14 10218 g007aApplsci 14 10218 g007b
Figure 8. The convergence process of squared errors during PSO-based ARC parameter optimization.
Applsci 14 10218 g008
Figure 9. Performance comparison of optimized ARC controller: (a) tracking performance without wind disturbance; (b) tracking error without wind disturbance; (c) tracking performance with wind disturbance; and (d) tracking error with wind disturbance.
Applsci 14 10218 g009
Figure 10. Robustness comparison under parameter variations: (a) ARC tracking performance; (b) ARC tracking error; (c) PID tracking performance; and (d) PID tracking error.
Applsci 14 10218 g010
Figure 11. Pitch control system’s physical test bed.
Applsci 14 10218 g011
Figure 12. Experimental comparison of pitch angle tracking performance between PID and ARC controllers.
Applsci 14 10218 g012
Figure 13. Comparison of pitch angle tracking errors between PID and ARC controllers during cylinder retraction.
Applsci 14 10218 g013
Table 1. Near-optimal PID parameter combinations and their cost functions.
kpkikdCost
7418.66943.71956.232.23
7282.47973.1910002.25
7388.91924.47972.032.25
7287.99908.0310002.26
7346.56880.2110002.27
7284.07906.9810002.28
7246.621000961.292.28
7270.37911.3010002.29
Table 2. Near-optimal ARC parameter combinations and their cost functions.
k1k2k3Cost
289.41144,353.04744.412.29
170.85141,003.76676.882.30
252.89140,169.72102.37
218.52144,235.1010002.43
141.46145,00010002.47
148.04143,786.98847.092.53
300143,518.4510002.53
300145,000102.55
Table 3. Key components and manufacturers of the pump-controlled pitch system.
Serial NumberComponent NameManufacturer
1Temperature SensorZhuhong (Wuxi, China)
2Pressure SensorZhuhong
3Relief ValveSUN (Houston, TX, USA)
4Two-Way Directional ValveSUN
5Throttle ValveSUN
6AccumulatorLiming (Zhoushan, China)
7Check ValveHuade (Beijing, China)
8Displacement SensorXiju (Wuhan, China)
Disclaimer/Publisher’s Note: The statements, opinions and data contained in all publications are solely those of the individual author(s) and contributor(s) and not of MDPI and/or the editor(s). MDPI and/or the editor(s) disclaim responsibility for any injury to people or property resulting from any ideas, methods, instructions or products referred to in the content.